 Jing Zhang
 Shujun Xie2
 Zhuanfang Zheng
 Lingling Yang
 Yan Li
95% of researchers rate our articles as excellent or good
Learn more about the work of our research integrity team to safeguard the quality of each article we publish.
Find out more
ORIGINAL RESEARCH article
Front. Psychiatry , 24 October 2022
Sec. Molecular Psychiatry
Volume 13 - 2022 | https://doi.org/10.3389/fpsyt.2022.1008124
This article is part of the Research Topic Objective Diagnostic and/or Prognostic Biomarkers in Major Depressive Disorder View all 5 articles
Background: Major depressive disorder (MDD) is a life-threatening, debilitating mental health condition. An important factor in the development of depression is endoplasmic reticulum stress (ERS). However, their roles in MDD have not yet been established. The goal of this study was to examine ERS and its underlying molecular mechanisms in MDD.
Methods: We used data from two microarray datasets (GSE98793 and GSE39653) and the GeneCards database to examine the reticulum stress-related differentially expressed genes (ERSR-DEGs) associated with MDD. Gene Ontology (GO), Kyoto Encyclopedia of Genes and Genomes (KEGG), Gene Set Enrichment Analysis (GSEA), and Gene Set Variation Analysis (GSVA) were used to further investigate the function and mechanism of ERS in MDD. Moreover, we constructed protein-protein interaction (PPI) networks to identify hub genes as well as the regulatory network of microRNAs (miRNAs), transcription factors (TFs), and potential drugs related to ERSR-DEGs. CIBERSORT was then used to evaluate the immune activity of MDD samples and conduct a correlation analysis between the hub genes and immune cells.
Results: In total, 37 ERSR-DEGs and five hub genes were identified (NCF1, MAPK14, CASP1, CYBA, and TNF). Functional enrichment analysis revealed that ERSR-DEGs were predominantly enriched in inflammation-and immunity-related pathways, such as tumor necrosis factor signaling, NF-κB signaling, and Toll-like receptor signaling pathways. Additionally, 179 miRNAs, 25 TFs, and 15 potential drugs were tested for their interactions with the ERSR-DEGs. CIBERSORT found high proportions of Tregs, monocytes, and macrophages M0 in the MDD samples. Among these, hub genes showed a significant correlation with immune cell infiltration in patients with MDD.
Conclusions: NCF1, MAPK14, CASP1, CYBA, and TNF are potential ERS-related biomarkers for the diagnosis of MDD. Our research has revealed a significant correlation between immune cells and ERS-related genes with MDD. Not only did our study contribute to a better understanding of the regulatory mechanisms of ERS in underlying MDD pathology, but it also established a paradigm for future studies on ERS.
Major depressive disorder (MDD) is a severe, recurrent, and life-threatening mental disorder with a high prevalence and low remission rate (1). According to epidemiological statistics from US adults, the lifetime prevalence of MDD is 20.6% and the 12-month prevalence is 10.4% (2). Depression seriously affects psychosocial functioning and is the primary cause of disability (3). MDD is a highly heterogeneous and multifactorial disease, making diagnosis and therapy more challenging (4). Even though various research has been undertaken to discover biomarkers for the diagnosis of MDD, most have not yet been applied in the clinical context due to insufficient specificity and efficacy (5–7). Although numerous antidepressants exist, only 30% of patients achieve complete remission, reflecting current therapies fail to address important biological processes involved in MDD pathology (8, 9). Therefore, discovering the biological basis of MDD progression and identifying novel diagnostic indicators and treatment targets for patients is crucial.
ERS, characterized by the accumulation of incompletely folded and unfolded proteins in the lumen, stimulates the unfolded protein response (UPR) (10). Numerous studies (11–13) have demonstrated that ERS is closely linked with the pathophysiology of depression. According to reports, the ERS signaling proteins GRP78, CHOP, and XBP1 are continuously activated in MDD patients (14). Moreover, a variety of pathological processes are associated with ERS, such as immunological responses, inflammatory responses, and oxidative stress (15–17), and these mechanisms also contribute to MDD (18–21). These studies demonstrate that ERS can alter the course of depression, either directly or indirectly, through its participation in some crucial biological processes. Of note, the potential of ERS as a target for novel antidepressants has been demonstrated in preclinical studies (13, 22). However, the molecular mechanisms by which ERS contributes to the pathogenesis of MDD remain unknown for the time being.
Consequently, this study aimed to investigate the association between ERS and the etiology and immunological infiltration of MDD, using an exhaustive bioinformatics approach. Two microarray datasets from patients with MDD were downloaded from the Gene Expression Omnibus (GEO) database, along with endoplasmic reticulum stress-related genes (ERGs) from the GeneCards Database. Next, reticulum stress-related differentially expressed genes (ERSR-DEGs) were screened. Based on these ERSR-DEGs, we conducted functional annotation, including Gene Ontology and Kyoto Encyclopedia of Genes and Genomes (KEGG) enrichment analyses. Statistically significant pathways related to MDD were determined by Gene Set Enrichment Analysis (GSEA) and Gene Set Variation Analysis (GSVA) for further validation. Furthermore, a protein-protein interaction network for ERSR-DEGs, as well as potential drugs and transcription factors to target ERSR-DEGs, was created. Five hub genes were identified from 37 ERSR-DEGs, and RNA binding proteins (RBPs) -hub gene networks were constructed. Using the CIBERSORT software, we also explored the correlation between hub genes and immune cell infiltration. Based on our understanding of ERS and its relation to immunological infiltrations, we may find promising biomarkers or therapeutic targets for MDD.
We retrieved two microarray datasets from the GEO database using the GEO query R package (https://www.ncbi.nlm.nih.gov/geo/) (23, 24). The first dataset, GSE98793 (25), contains 64 samples from patients with MDD and 64 samples from healthy individuals, derived from the GPL570 sequencing platform. The second dataset, GSE39653 (26), obtained from the GPL10558 sequencing platform, included 21 blood samples from patients with MDD and 24 blood samples from healthy individuals. Table 1 lists the details of the dataset.
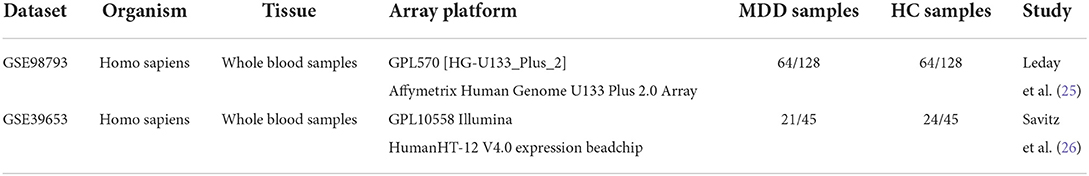
Table 1. The characteristics of the two microarray datasets.
The GEO datasets were quantile-normalized using the normalized between arrays function (27) from the “limma” R package (28) and visualized using a boxplot. Additionally, principal components analysis (PCA) was used to visualize the discrepancy between MDD and control groups using the “factoextra” R package (29). Differentially expressed genes (DEGs) were screened utilizing the “limma” program (P-value < 0.05 and |logFC| > 0).
The GeneCards (https://www.genecards.org/) database is a searchable, integrated resource for comprehensive, user-friendly, annotated, and predicted information (30). We retrieved ERGs with a relevance score >2 from GeneCards searched using the keyword “Endoplasmic Reticulum Stress.” We identified ERSR-DEGs by intersecting ERGs with DEGs in GSE98793 and GSE39653. The expression levels of ERSR-DEGs in the GSE98793 and GSE39653 datasets were visualized using the R package “heatmap”.
To obtain a better understanding of the ERSR-DEGs, GO annotation, and KEGG pathway enrichment analyses were performed. Bioconductor's “clusterProfiler” (31) and “pathview” (32) packages in the R software were utilized for GO enrichment, KEGG pathway analysis, and plotting. Benjamin-Hochberg (BH) adjustment was used to calculate the false discovery rate (FDR). A q-value of 0.05 was used as the cut-off criterion.
Gene set enrichment analysis (GSEA) is used to analyze the contribution of individual genes to phenotype by assessing the distribution of preset gene sets across gene lists sorted by phenotype correlation (33). GSVA is a non-parametric and unsupervised method for estimating the score of a pathway or signature based on transcriptome data (34). We used GSEA on the GSE98793 dataset to analyze global patterns of differential gene expression and to determine if there were gene expression features that were significantly enriched in either the MDD or normal groups. GSEA analyses were conducted using the reference gene sets “h.all.v7.2. symbols.gmt”, “c2.kegg.v7.4. symbols” and “c5.go.v7.4. symbols” in the MSigDB database (35). Using the same dataset, GSVA was employed to compare pathway enrichment in the MDD and control groups.
GeneMANIA (36) and STRING (37) are two wellknown web tools that provide a list of genes associated with a query gene based on diverse biological associations. An investigation of the association between genes can clarify the role of genes in biological processes. We analyzed the PPI network of ERSR-DEGs using GeneMANIA software and the STRING database, followed by visualization using Cytoscape (38). Meanwhile, utilizing the CytoHubba (39) plug-in and MCC algorithm, the top five hub genes were selected.
RNA-binding proteins are thought to be critical for gene regulation through the regulation of RNA stability and translation. In certain diseases, miRNAs and transcription factors interact with target genes to regulate gene expression (40). We identified RBPs that target hub genes using ENCORI (https://starbase.sysu.edu.cn/) (41). MiRNAs associated with ERSR-DEGs were identified using the ENCORI (41), TargetScan (42), and miRDB databases (43). Significant transcription factors (TFs) were identified using the JASPAR database (44).
DSigDB is a comprehensive database for identifying targeted drugs related to DEGs (45). The database has 22 527 gene sets and is an accessible way to access disease or drug functions through the Enrichr website (46). In this study, the prediction of protein-drug interactions or molecular drug identifications is a crucial component. DSigDB was used to search for drugs or chemicals that might interact with the ERSR-DEGs.
Based on the principle of linear support vector regression, CIBERSORT is used to deconvolve the expression matrices of immune cell subgroups (47). We applied CIBERSORT to assess the proportions of immune cell types in the MDD and healthy control groups. Spearman's correlation was used to analyze the relationship between hub genes and immune cells in patients with MDD.
The R software was used for all data processing and analyses (version 4.0.2). For the comparison of two sets of continuous variables, the Student's t-test was used to analyze the statistical significance of normally distributed variables, while the Mann-Whitney U test was used for variables that were not normally distributed. In this study, all statistical p-values were two-sided and p < 0.05 was considered statistically significant.
The workflow of this study is illustrated in Figure 1. After standardizing the datasets (Figure 2), we detected DEGs between the MDD and healthy control groups. In total, 2,427 and 2,097 DEGs were extracted from GSE98793 and GSE39653, respectively, according to the predefined criteria. In addition, the separation between the MDD and control samples was excellent in the PCA analysis of the GSE98793 and GSE39653 datasets (Figure 3). Among the DEGs depicted in the volcano plots, GSE98793 contained 1,472 upregulated genes and 955 downregulated genes, whereas GSE39653 contained 1,128 upregulated genes and 969 downregulated genes (Figures 4A,B). A total of 153 common differentially expressed genes (co-DEGs) were identified from the two datasets. In addition, 3,880 ERGs were collected from GeneCards using the specified criteria (Supplementary Table 3). The co-expressed ERSR-DEGs were integrated using a Venn diagram in R (Figure 4C). A total of 37 ERSR-DEGs were extracted, and the expression levels of these genes in GSE98793 and GSE39653 were further visualized using a heat map (Figures 4D,E).
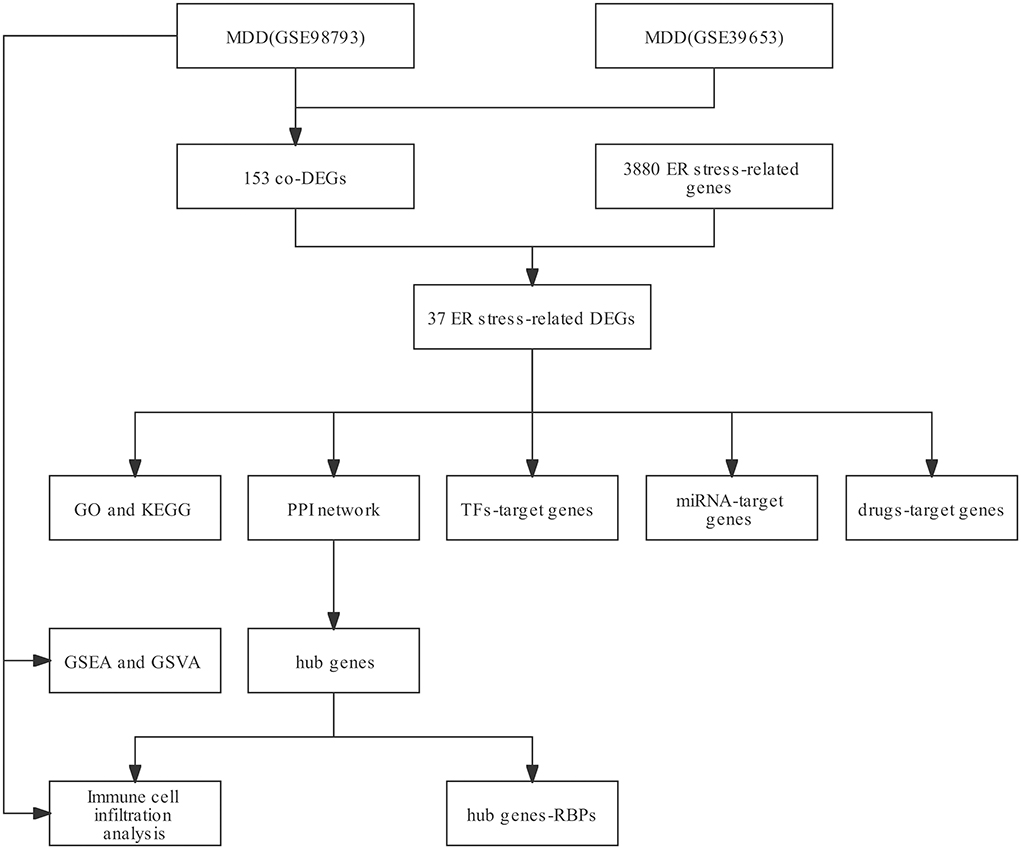
Figure 1. The workflow of this study.
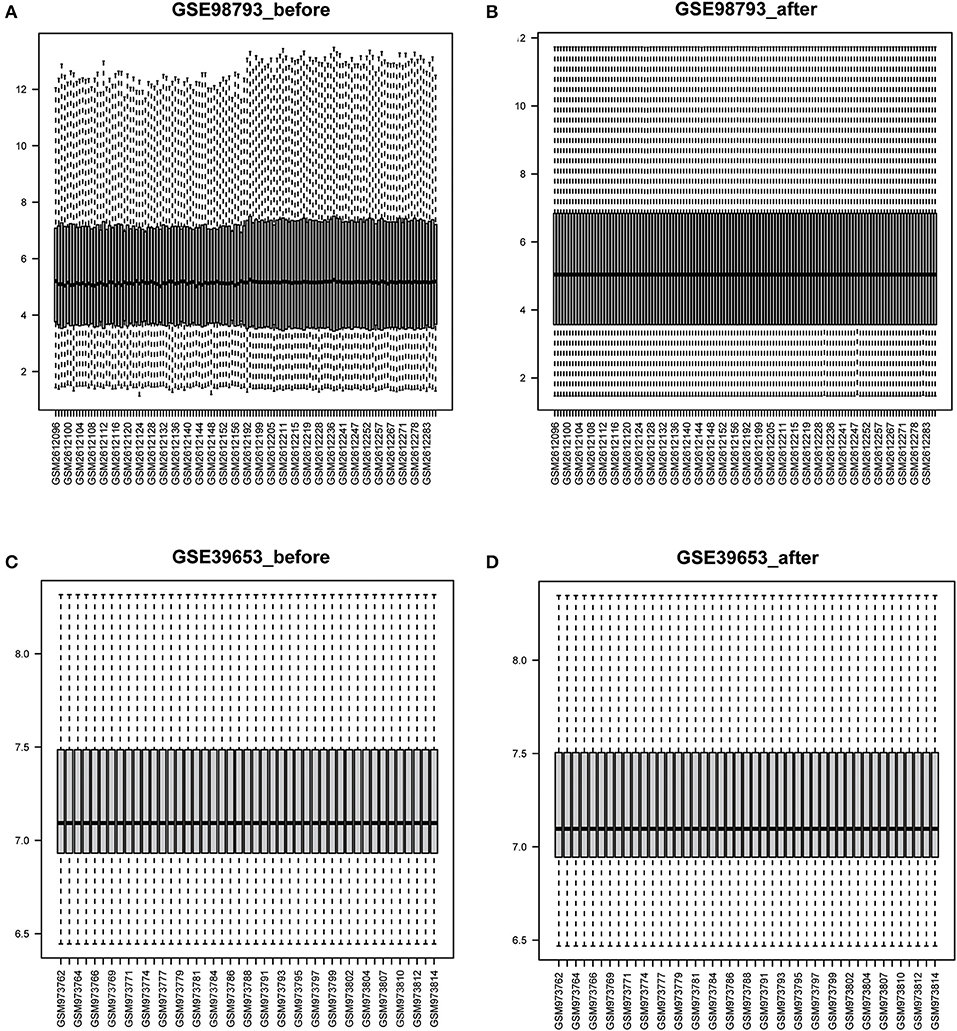
Figure 2. Boxplots of the gene expression data before and after normalization. (A) The boxplot of GSE98793 data before normalization. (B) The boxplot of GSE98793 data after normalization. (C) The boxplot of GSE39653 data before normalization. (D) The boxplot of GSE39653 data after normalization.

Figure 3. Principal component analysis (PCA). (A) PCA plot for GSE98793. (B) PCA plot for GSE39653.
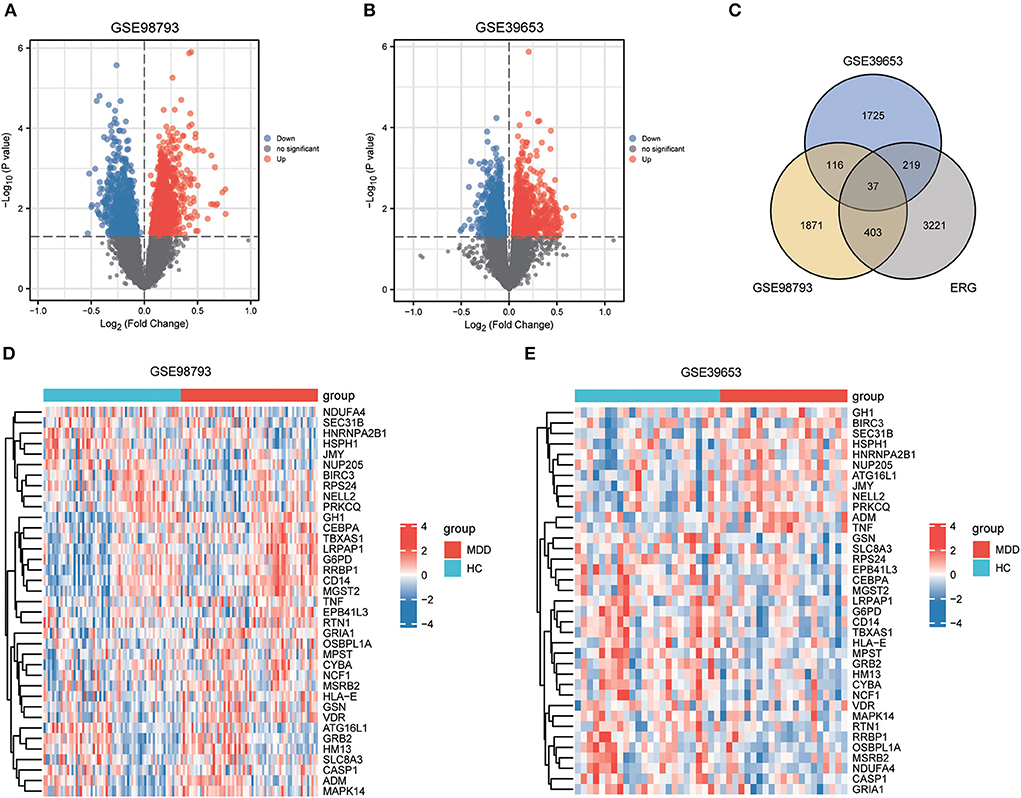
Figure 4. Endoplasmic reticulum stress-related gene (ERSR-DEGs) expressions. (A) Volcano plot of GSE98793. (B) Volcano plot of GSE39653. (C) Venn diagram for overlapping ERSR-DEGs based on 3 datasets. (D) Heatmap of ERSR-DEGs identified in GSE98793. (E) Heatmap of ERSR-DEGs identified in GSE39653.
To understand the functional properties of ERSR-DEGs, GO enrichment and KEGG pathway analyses were conducted (Figure 5; Table 2). The GO enrichment results showed that for BP, ERSR-DEGs were considerably enriched in response to the tumor necrosis factor, inflammatory response regulation, oxidoreductase activity regulation, etc. For CC, ERSR-DEGs were primarily abundant in the ER to Golgi transport vesicle membrane, NADPH oxidase complex, an integral component of the endoplasmic reticulum membrane, and rough endoplasmic reticulum. In MF, ERSR-DEGs were markedly enriched in superoxide-generating NADPH oxidase activity, oxidoreductase activity, and NADPH.
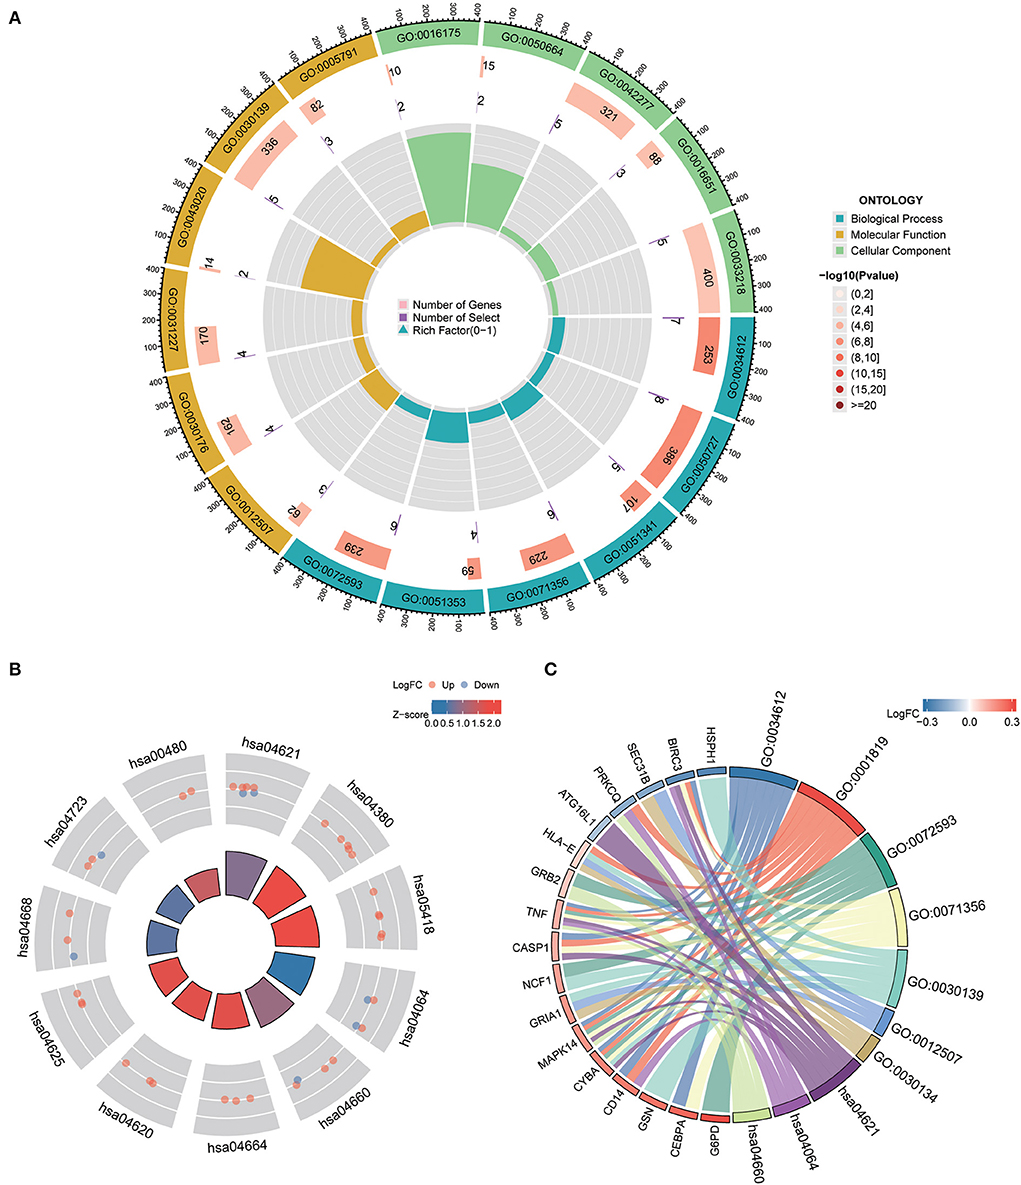
Figure 5. GO functional and KEGG pathway enrichment analysis of ERSR-DEGs. (A) GO enrichment analysis of ERSR-DEGs. (B) KEGG pathway analysis of ERSR-DEGs. Red nodes suggest upregulated genes, and blue nodes mean downregulated genes. Quadrilateral color indicates Z-score. Red indicates a positive Z-score (activated function), and blue indicates a negative Z-score (inhibited function). (C) The chord plot displays the relationship between ERSR-DEGs and GO and KEGG entries.
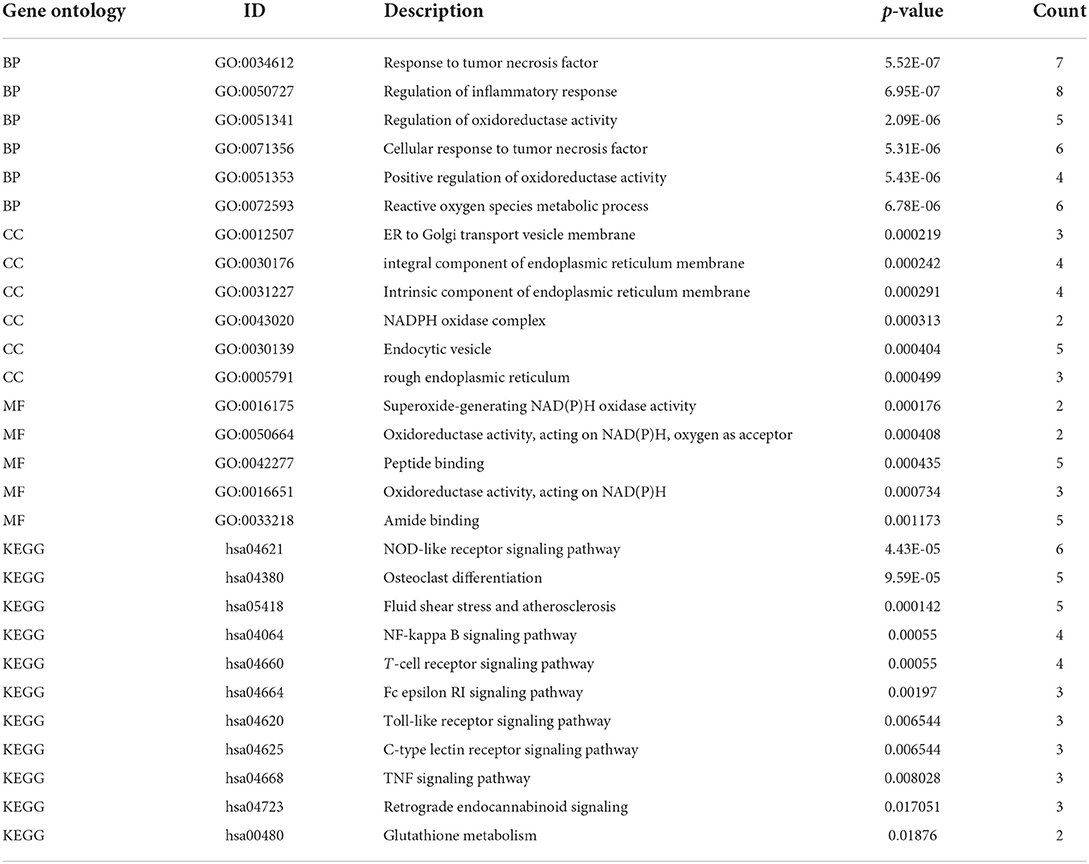
Table 2. The details of GO and KEGG terms for ERSR-DEGs with their corresponding p-values.
KEGG pathway enrichment analysis revealed that ERSR-DEGs were significantly enriched in immune-related pathways, including the NF-κB signaling pathway, osteoclast differentiation, NOD-like receptor (NLR) signaling pathway, Fc epsilon RI signaling circuit, Toll-like receptor (TLR) signaling pathway, and TNF signaling pathway.
NF-κB signaling and osteoclast differentiation, the two strongly enriched pathways, were visualized using the Pathview program based on KEGG pathways (Figure 6).
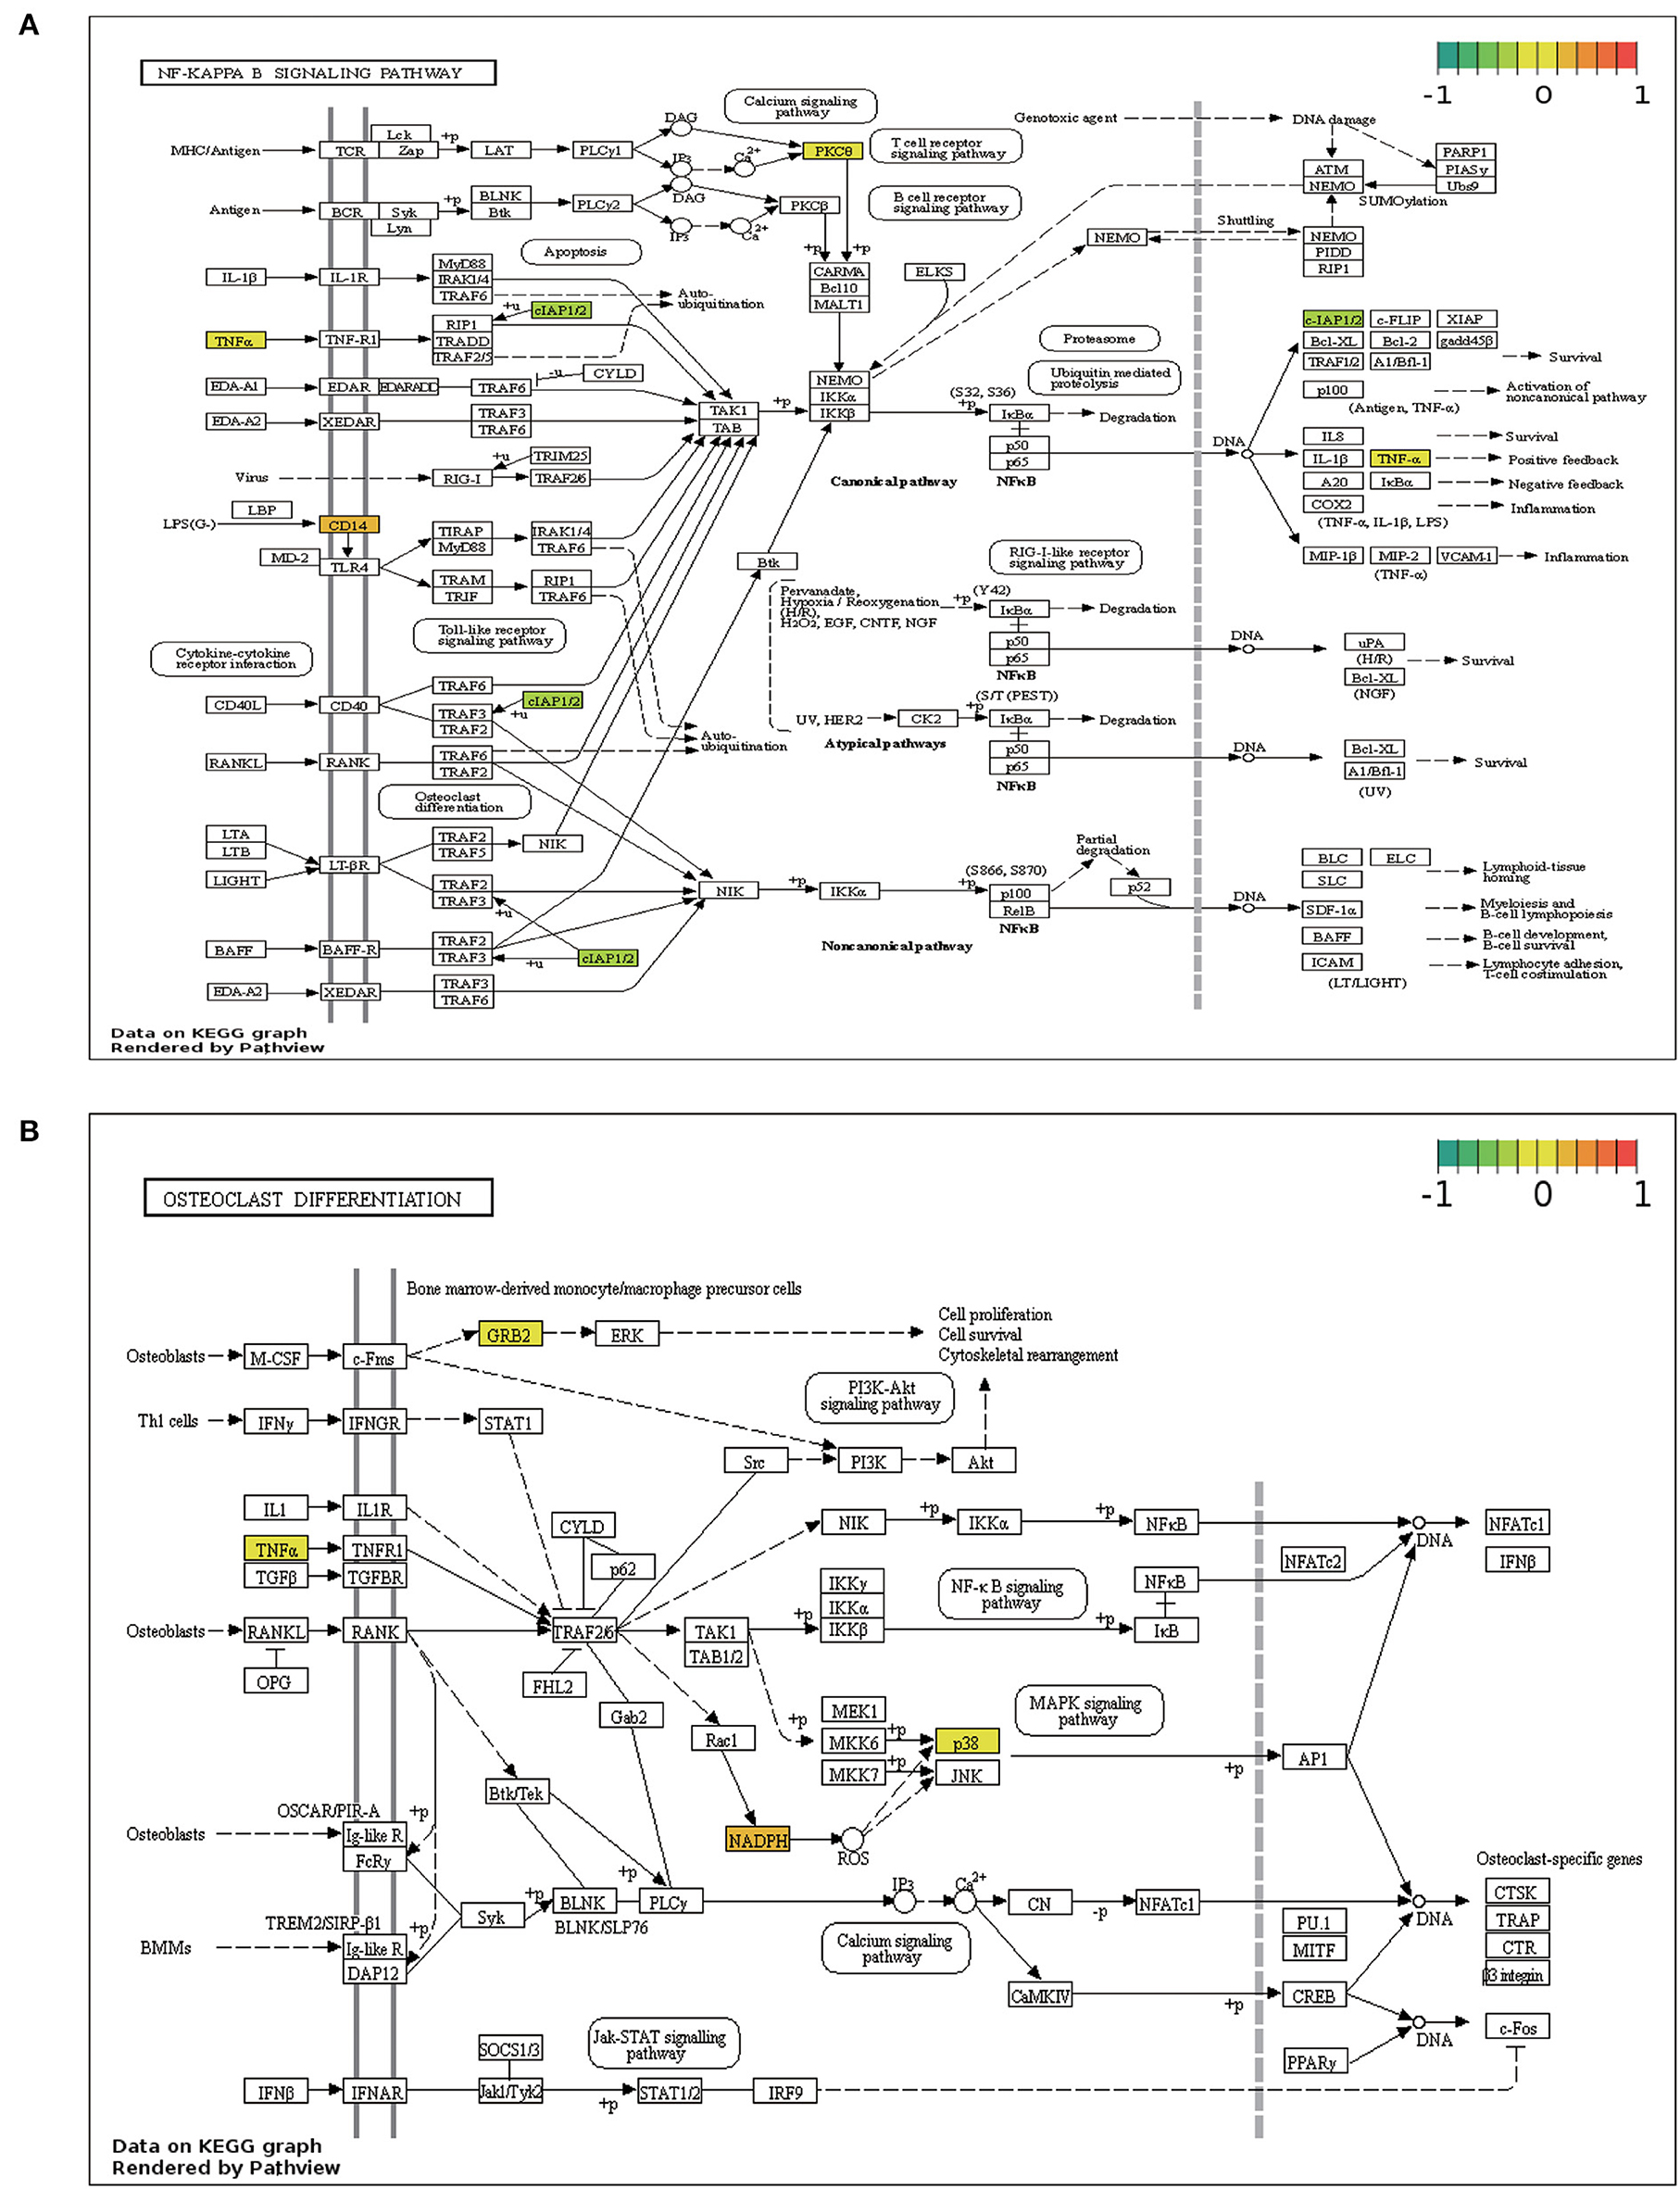
Figure 6. Pathview map. (A) NF-κB signaling pathway. (B) Osteoclast differentiation signaling pathway.
GSEA analysis was conducted to further study the probable biological pathways and processes between the function of differential genes in MDD and healthy controls (HC), and ERS (Supplementary Table 1). The MDD group was considerably enriched in biological processes associated with ERS (Figure 7A). We discovered that the GSE98793 dataset was predominantly involved in specific granules, vesicle lumen, specific granule membrane, ran methylation, and ribosome biogenesis processes (Figures 7B,C). In addition, the highly enriched pathways in the hallmark gene sets were the IL6-JAK-STAT3 signaling pathway, the reactive oxygen species (ROS) pathway, notch signaling, E2F targets, MYC targets V2, MYC targets v1, and epithelial-mesenchymal transition (EMT) (Figures 7D,E). Among Reactome and KEGG pathways, the most enriched pathways converge on ErbB2 activate PTK6 signaling, interferon-alpha/beta (IFN-α/β) signaling, and lysosomes (Figures 7F,G).
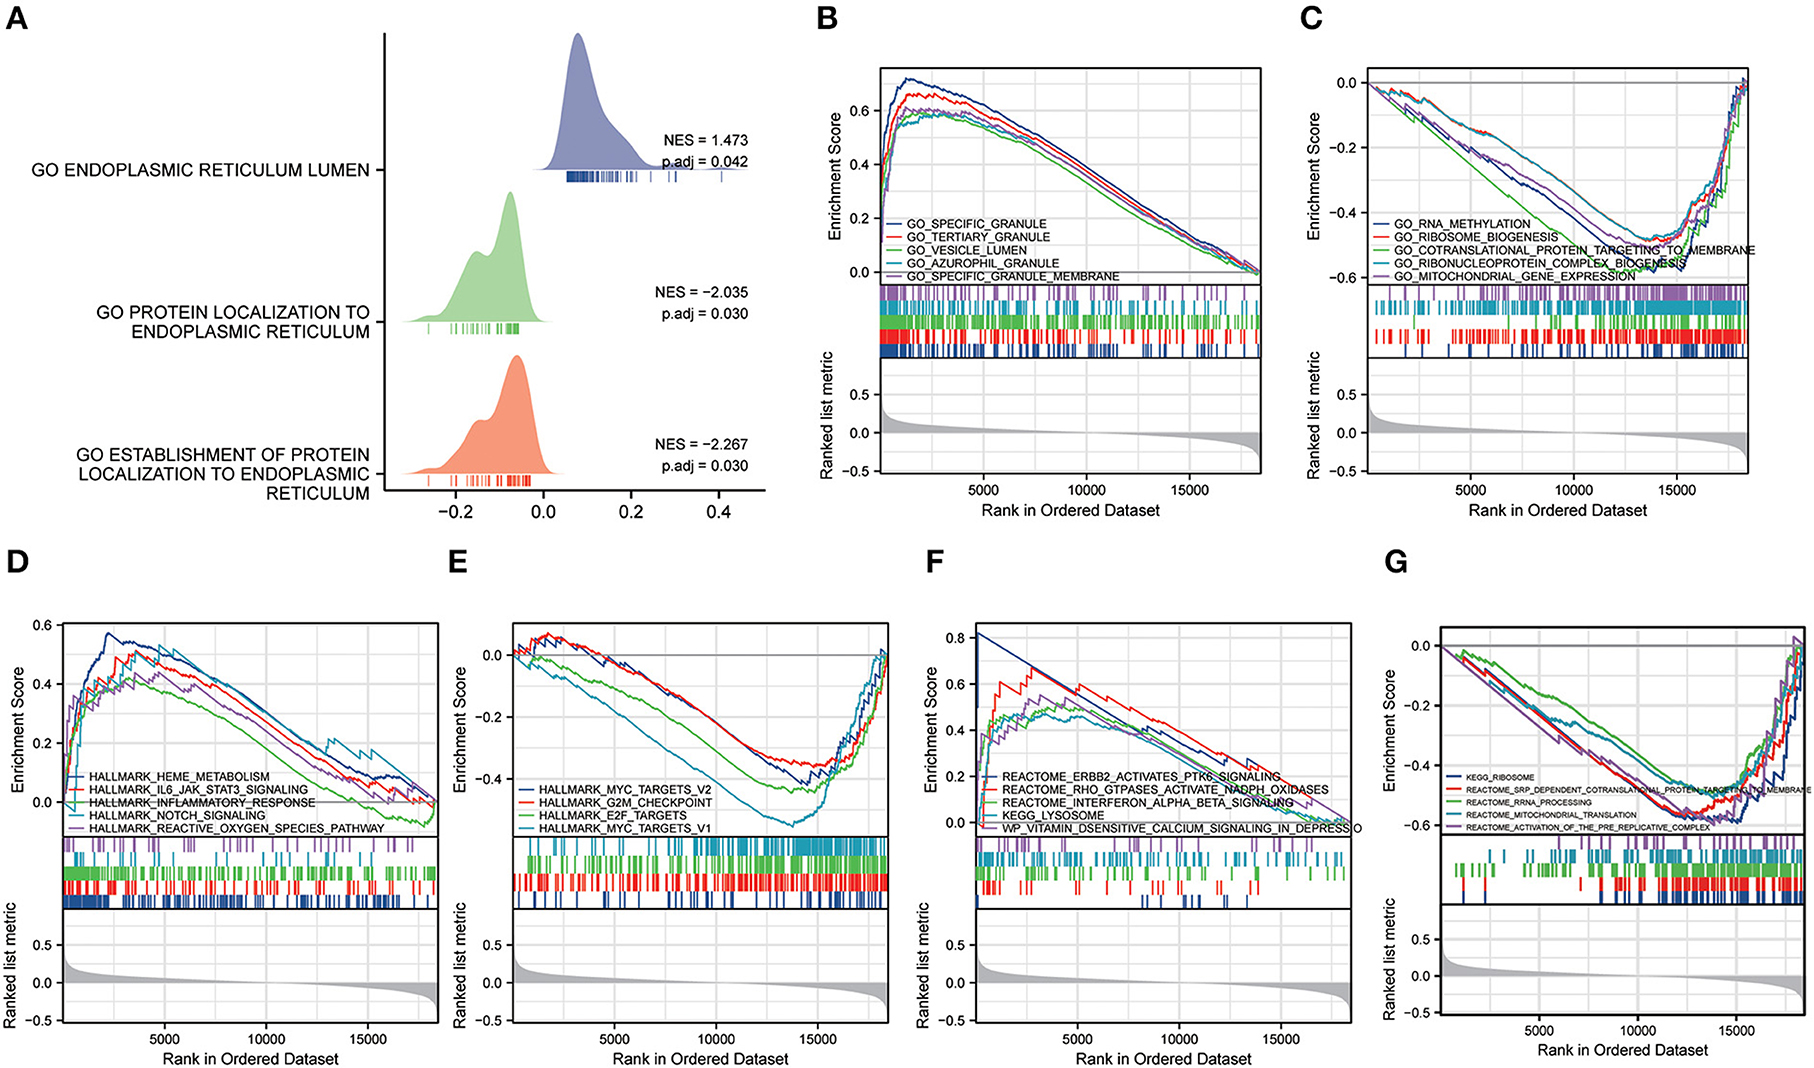
Figure 7. Gene set enrichment analysis (GSEA). (A) The ridgeline plot of the GSEA illustrates the biological processes associated with endoplasmic reticulum stress in MDD. (B,C) The results of GSEA (GO terms). (D,E) The results of GSEA (Hallmark pathways). (F,G) The results of GSEA (KEGG pathways).
We conducted GSVA analyses of the hallmark pathways, KEGG, and GO, to further investigate the biological roles of the MDD genes (Supplementary Table 2). GO analysis revealed that the MDD group genes were considerably abundant in the BP, encompassing the cell cycle, RNA polymerase III transcription, immune system development, protein maturation, and cell population proliferation regulation (Figure 8A). MDD was enriched in the following KEGG pathways: Fas signaling pathway, caspase cascade, G1 and S phases, programmed cell death, and CD40 pathway map (Figure 8B). In the hallmark gene sets, the pathways with the highest enrichment were the epithelial-mesenchymal transition (EMT), reactive oxygen species (ROS) pathway, and mTORC1 signaling (Figure 8C). According to these data, immune, inflammatory, oxidative, and apoptotic pathways, as well as biological processes related to ERS, are significantly linked to major depressive disorders.
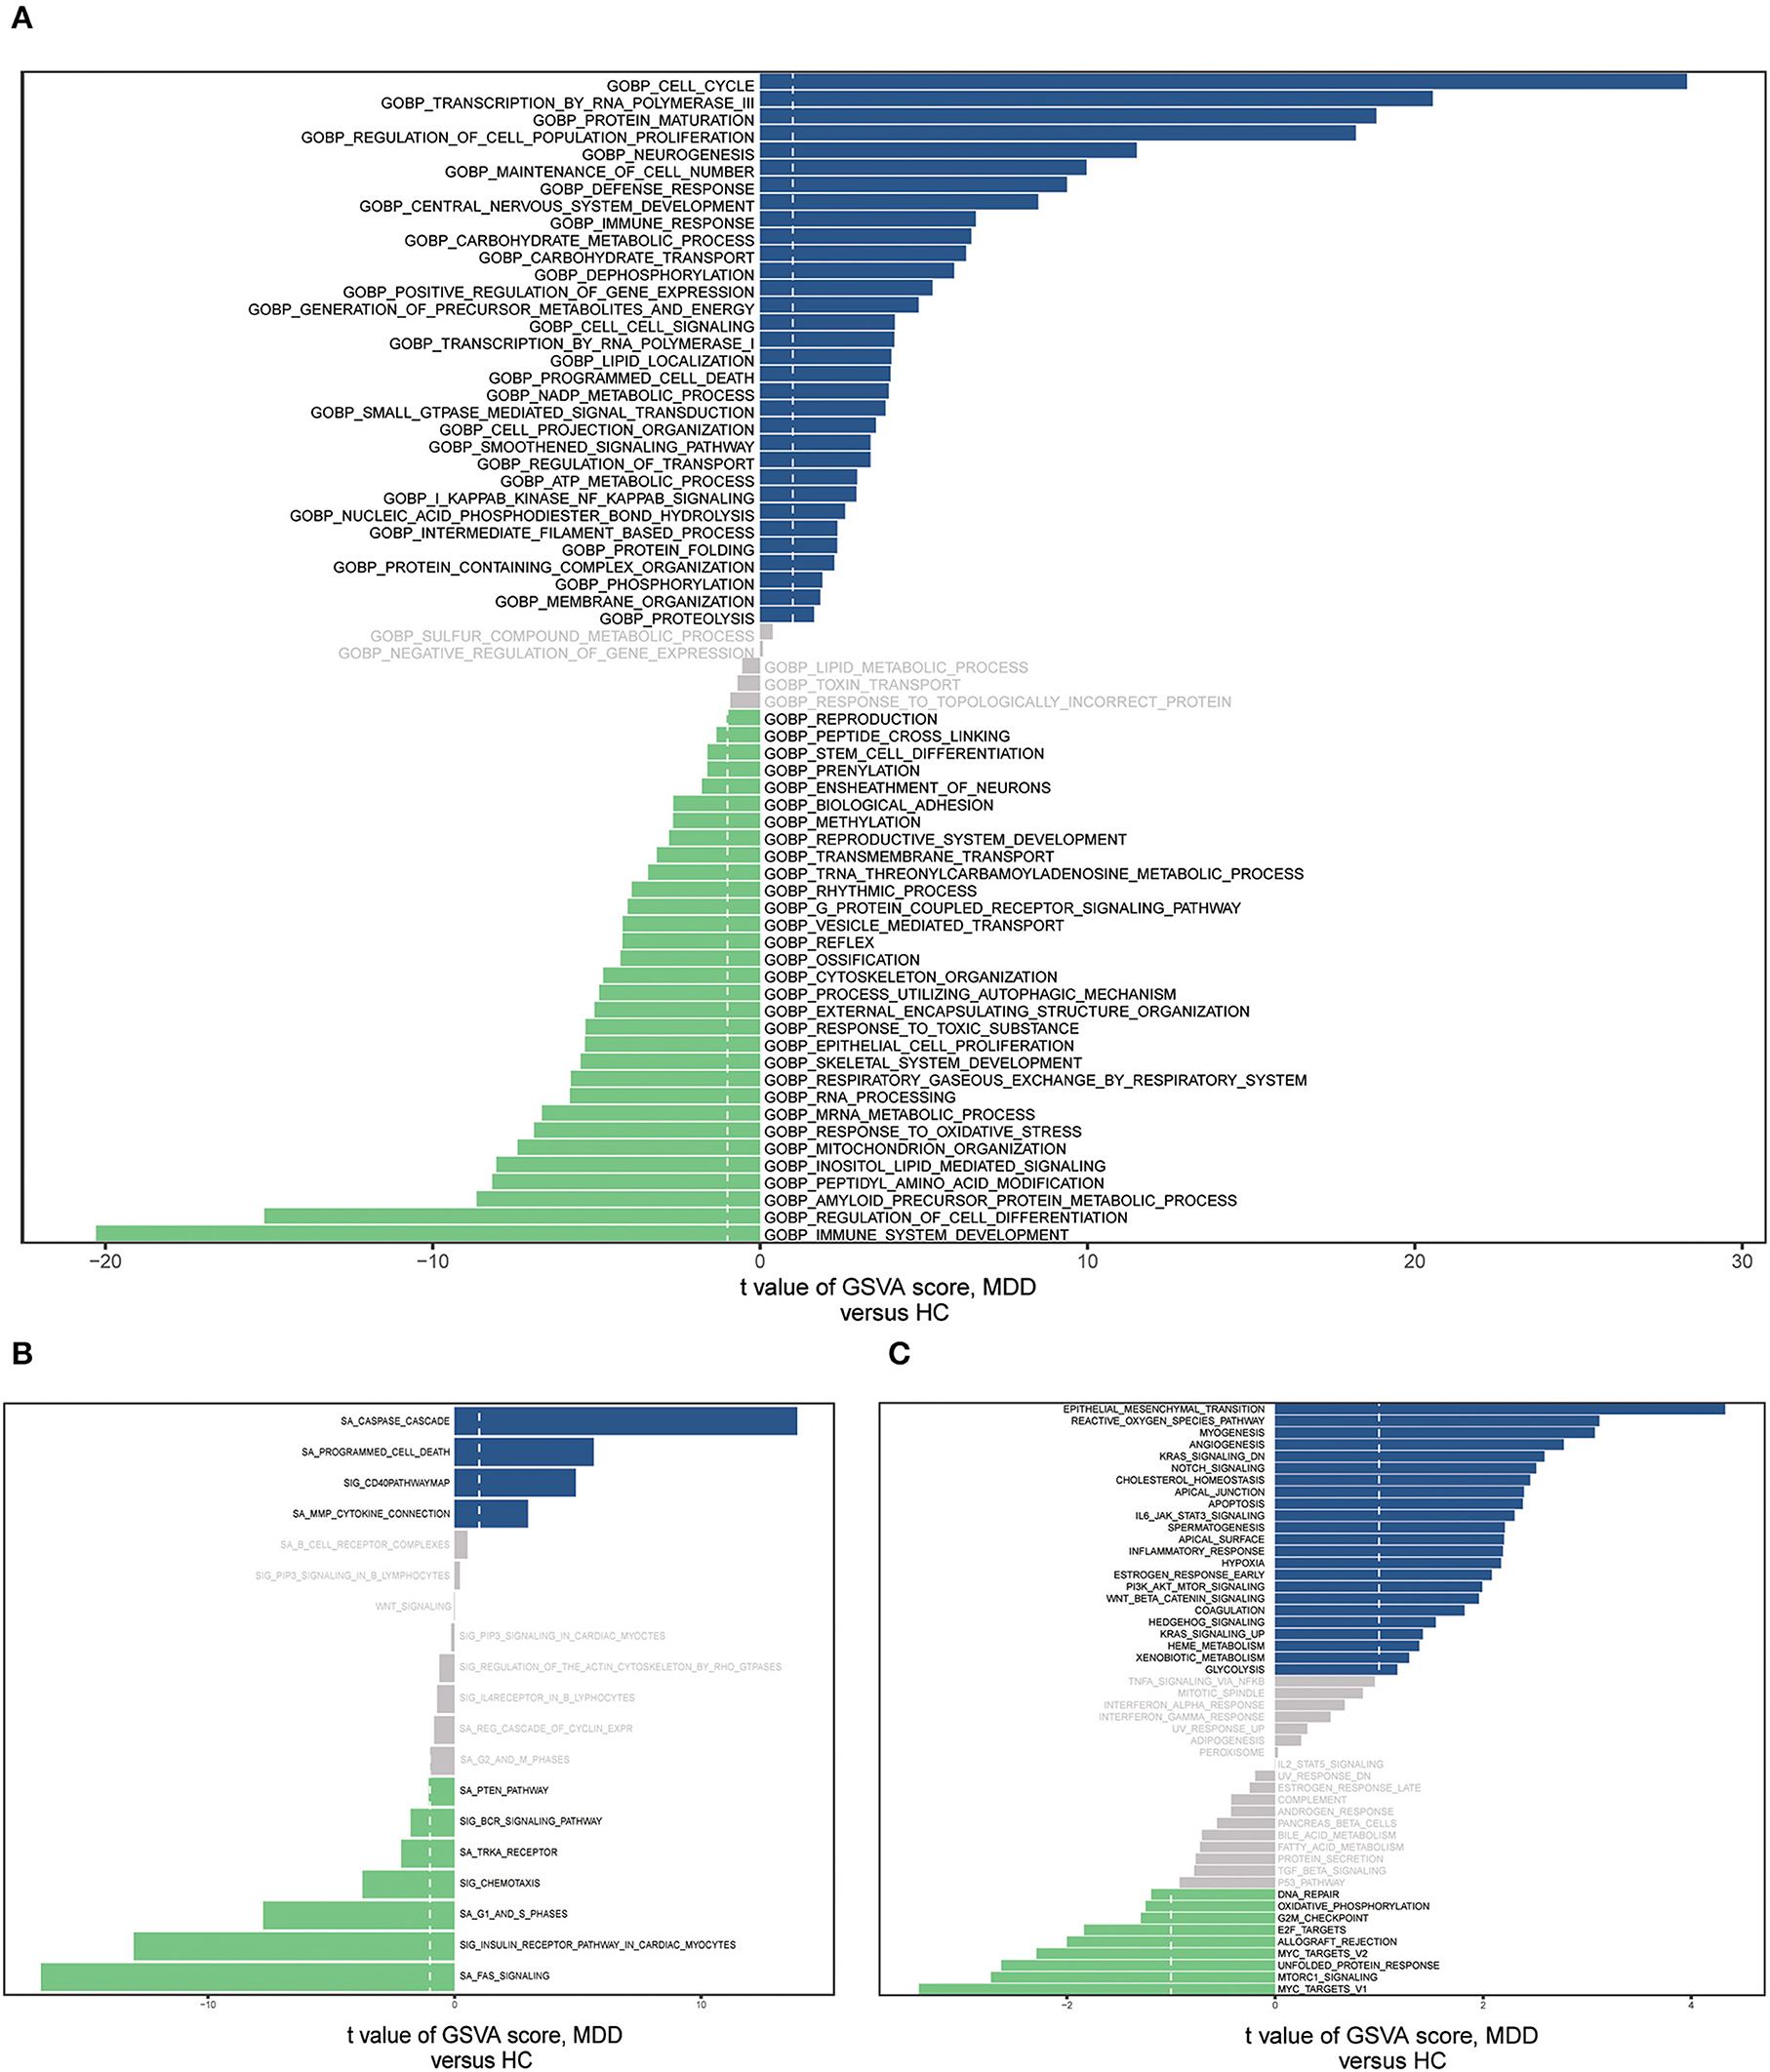
Figure 8. The gene set variation analysis (GSVA) for two groups based on the GSE98793 database. (A) Bar graph depicting “GO” pathway scores computed by the GSVA. (B) Bar plot of “KEGG” pathway score calculated by GSVA. (C) Bar plot of “Hallmark” pathway score calculated by GSVA.
An analysis of GeneMANIA gene interaction networks was conducted to further investigate 37 ERSR-DEG interactions (Figure 9A). A protein-protein interaction (PPI) network of ERSR-DEGs was created using the Cytoscape program and STRING database (Figure 9B). The MCC approach using the Cytohubba plug-in selected NCF1, MAPK14, CASP1, CYBA, and TNF as the top five hub genes (Figure 9C).
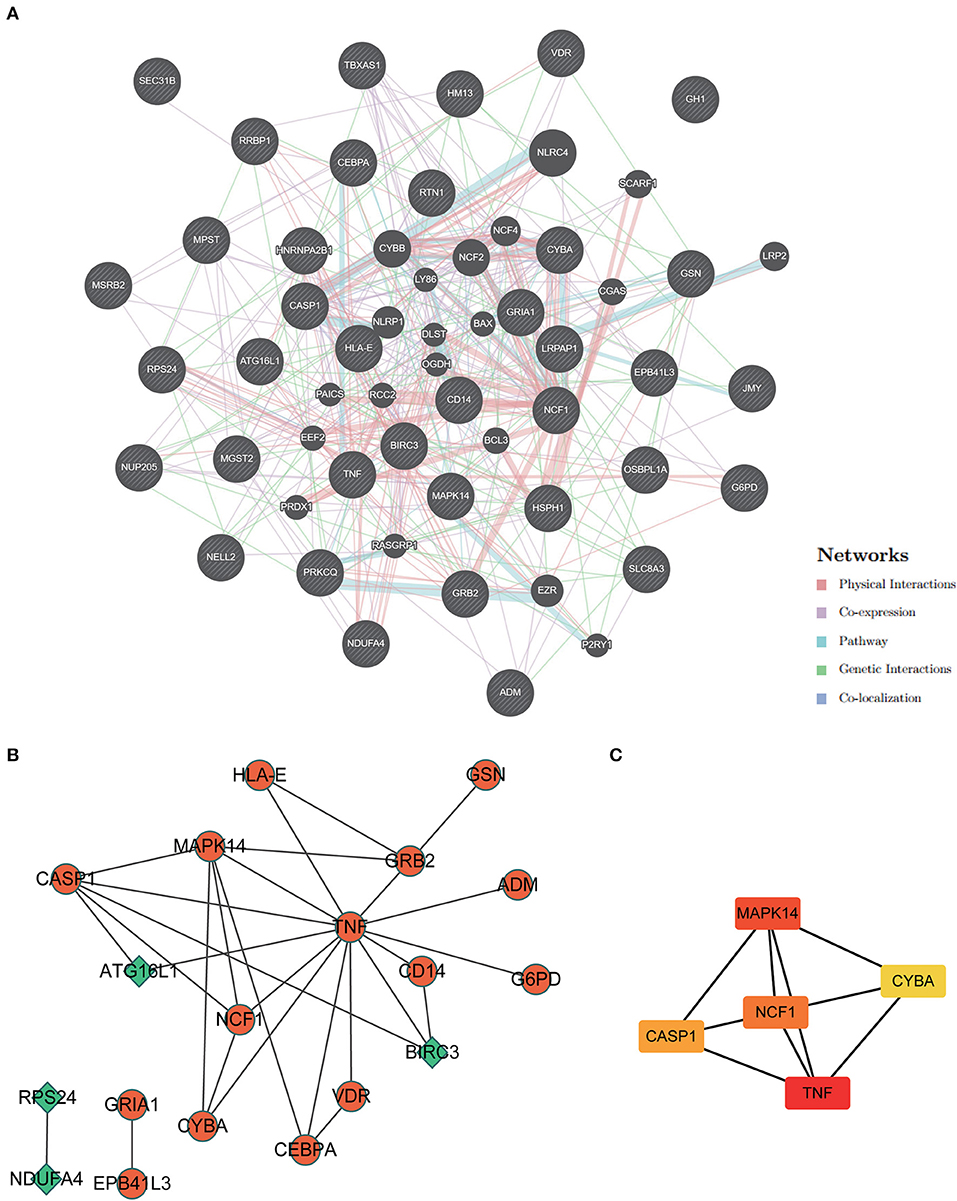
Figure 9. Protein-protein interaction (PPI) network analysis and hub gene screening. (A) The Gene interaction network of ERSR-DEGs was constructed and visualized using geneMANIA. (B) PPI network of ERSR-DEGs was constructed using STRING and visualized in Cytoscape. Green or orange are gene expressions down or upregulated, respectively. (C) Top 5 hub genes screened by MCC of cytohubba. The deeper the color, the higher the MCC score.
A total of 116 RBPs that bound to five hub genes were predicted using the ENCORE database (Figure 10A). To better investigate the molecular mechanisms of the 37 ERSR-DEGs in MDD, we constructed the ERSR-DEGs-TF, ERSR-DEGs-miRNA, and ERSR-DEG-Drugs regulatory networks. A regulatory network of the mRNA-TF-target gene was established, involving 22 mRNAs and 25 TFs (Figure 10B). The mRNA–miRNA interaction network contained 31 mRNAs and 179 miRNAs (Figure 10C).
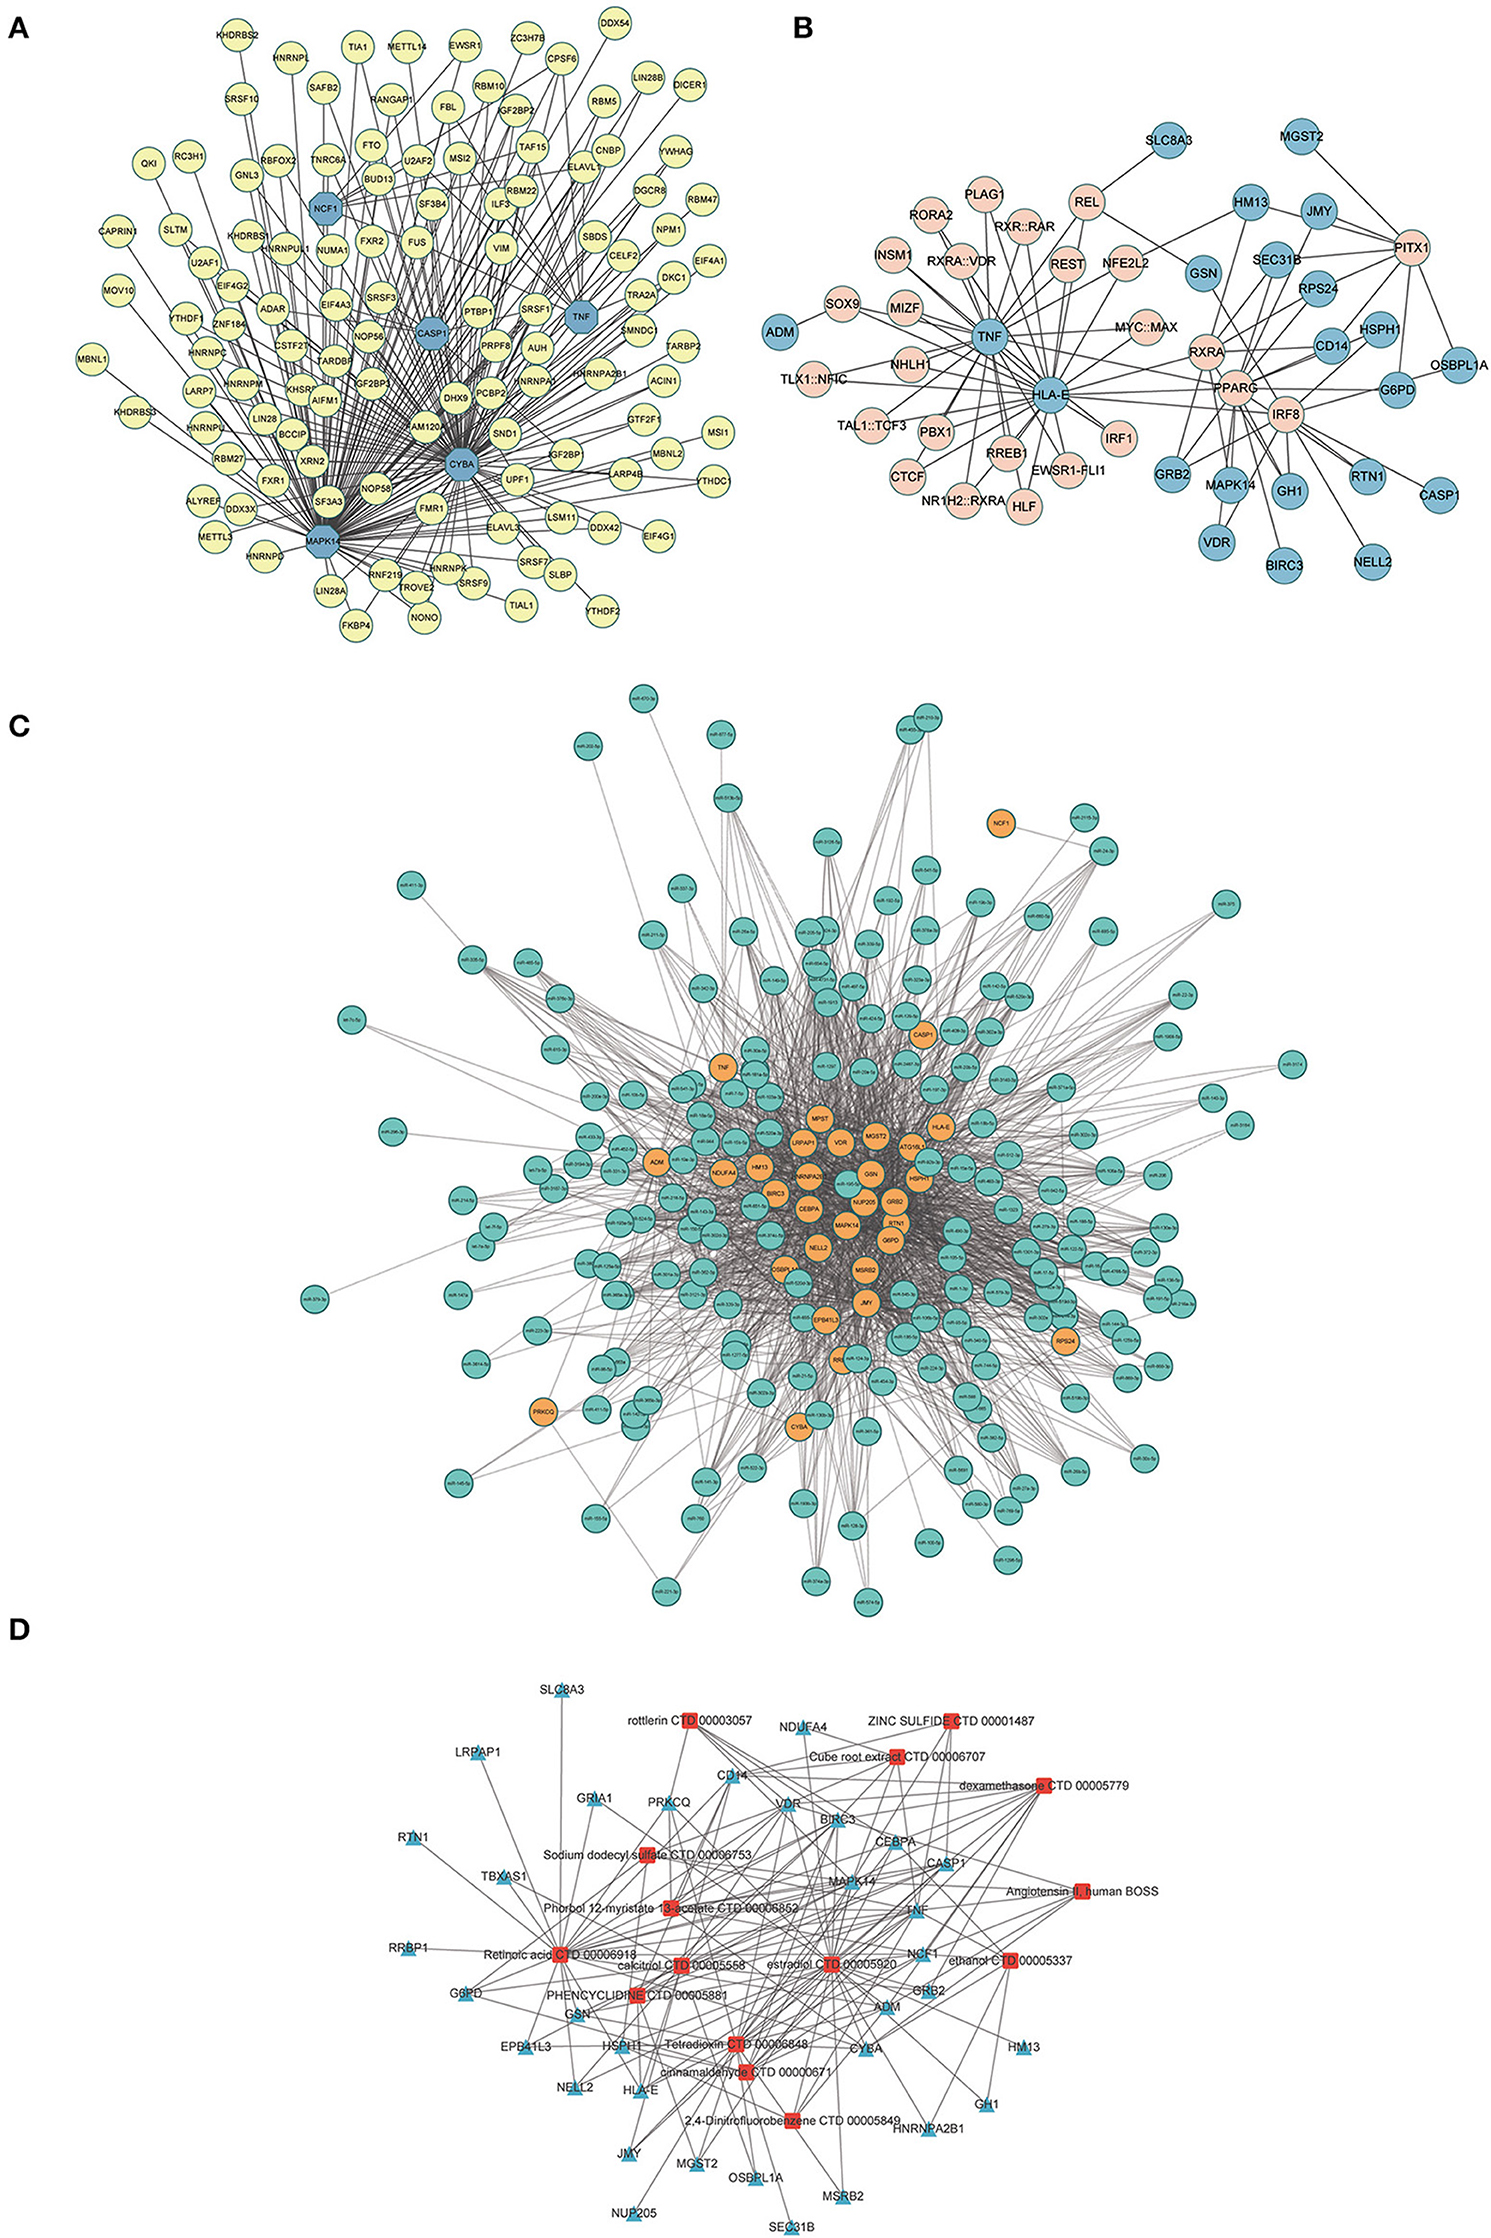
Figure 10. Interaction network analysis of endoplasmic reticulum stress-related differentially expressed genes (ERSR-DEGs). (A) In the RBPs-hub genes regulatory network, where the highlighted blue circle nodes represent the hub genes, and the yellow nodes represent RBPs. (B) In the TF-gene regulatory network of ERSR-DEGs, the highlighted blue circle nodes represent ERSR-DEGs, and pink nodes represent TF genes. (C) In the miRNA -gene regulatory network of ERSR-DEGs, the highlighted orange circle nodes represent the ERSR-DEGs, and the green nodes represent miRNA genes. (D) In the Drug-gene interaction network of ERSR-DEGs, where the highlighted blue squares represent the ERSR-DEGs, and the red squares represent the related drugs.
Using DSigDB to predict drugs target the 37 ERSR-DEGs, 15 potential drugs or compounds for MDD were identified, including cinnamaldehyde, dexamethasone, estradiol, phencyclidine, sodium dodecyl sulfate, rottlerin, retinoic acid, calcitriol, phorbol 12-myristate 13-acetate, angiotensin II, tetra dioxin, cube root extract, zinc sulfide, 2,4-Dinitrofluorobenzene, ethanol (Figure 10D).
Using the “CIBERSORT” algorithm, the difference in immune infiltration between the MDD and HC samples of GSE98793 was estimated. The percentages of 22 specific immune cells are depicted in a bar graph using various colors for each sample (Figure 11A). Immune cell infiltration investigations demonstrated that regulatory T cells (Tregs), monocytes, and Macrophages M0 were higher in the MDD group, whereas resting T cell CD4 memory and T cell gamma delta levels were lower (Figure 11B). A scatter plot illustrates the relationship between hub gene expression and immune cell infiltration. As shown in Figure 12, correlation analysis revealed a positive correlation between CASP1 and neutrophils (R = 0.42, P = 5.9e-07). A positive correlation was observed between CYBA and monocyte levels (R = 0.41, P = 1.8e-06). MAPK14 was positively correlated with neutrophils (R = 0.58, P = 4.6e-13) and negatively correlated with resting mast cells (R = −0.46, P = 4.8e-08). A negative correlation was observed between NCF1 and CD4 memory resting T cells (R = −0.44, P = 1.8e-07).
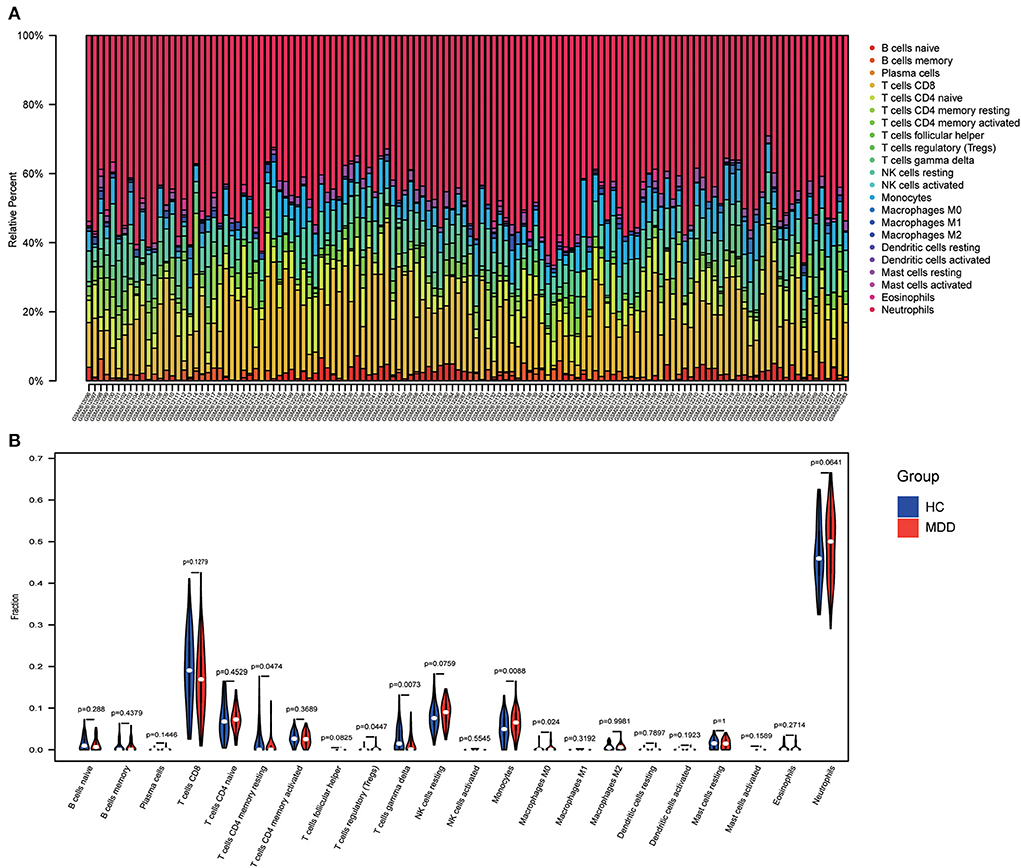
Figure 11. Immune infiltration analysis. (A) A bar chart showing the proportions of 22 different types of immunocytes in the GSE98793 dataset. (B) The violin plot shows the difference in immune infiltration between healthy control (HC) and MDD samples.
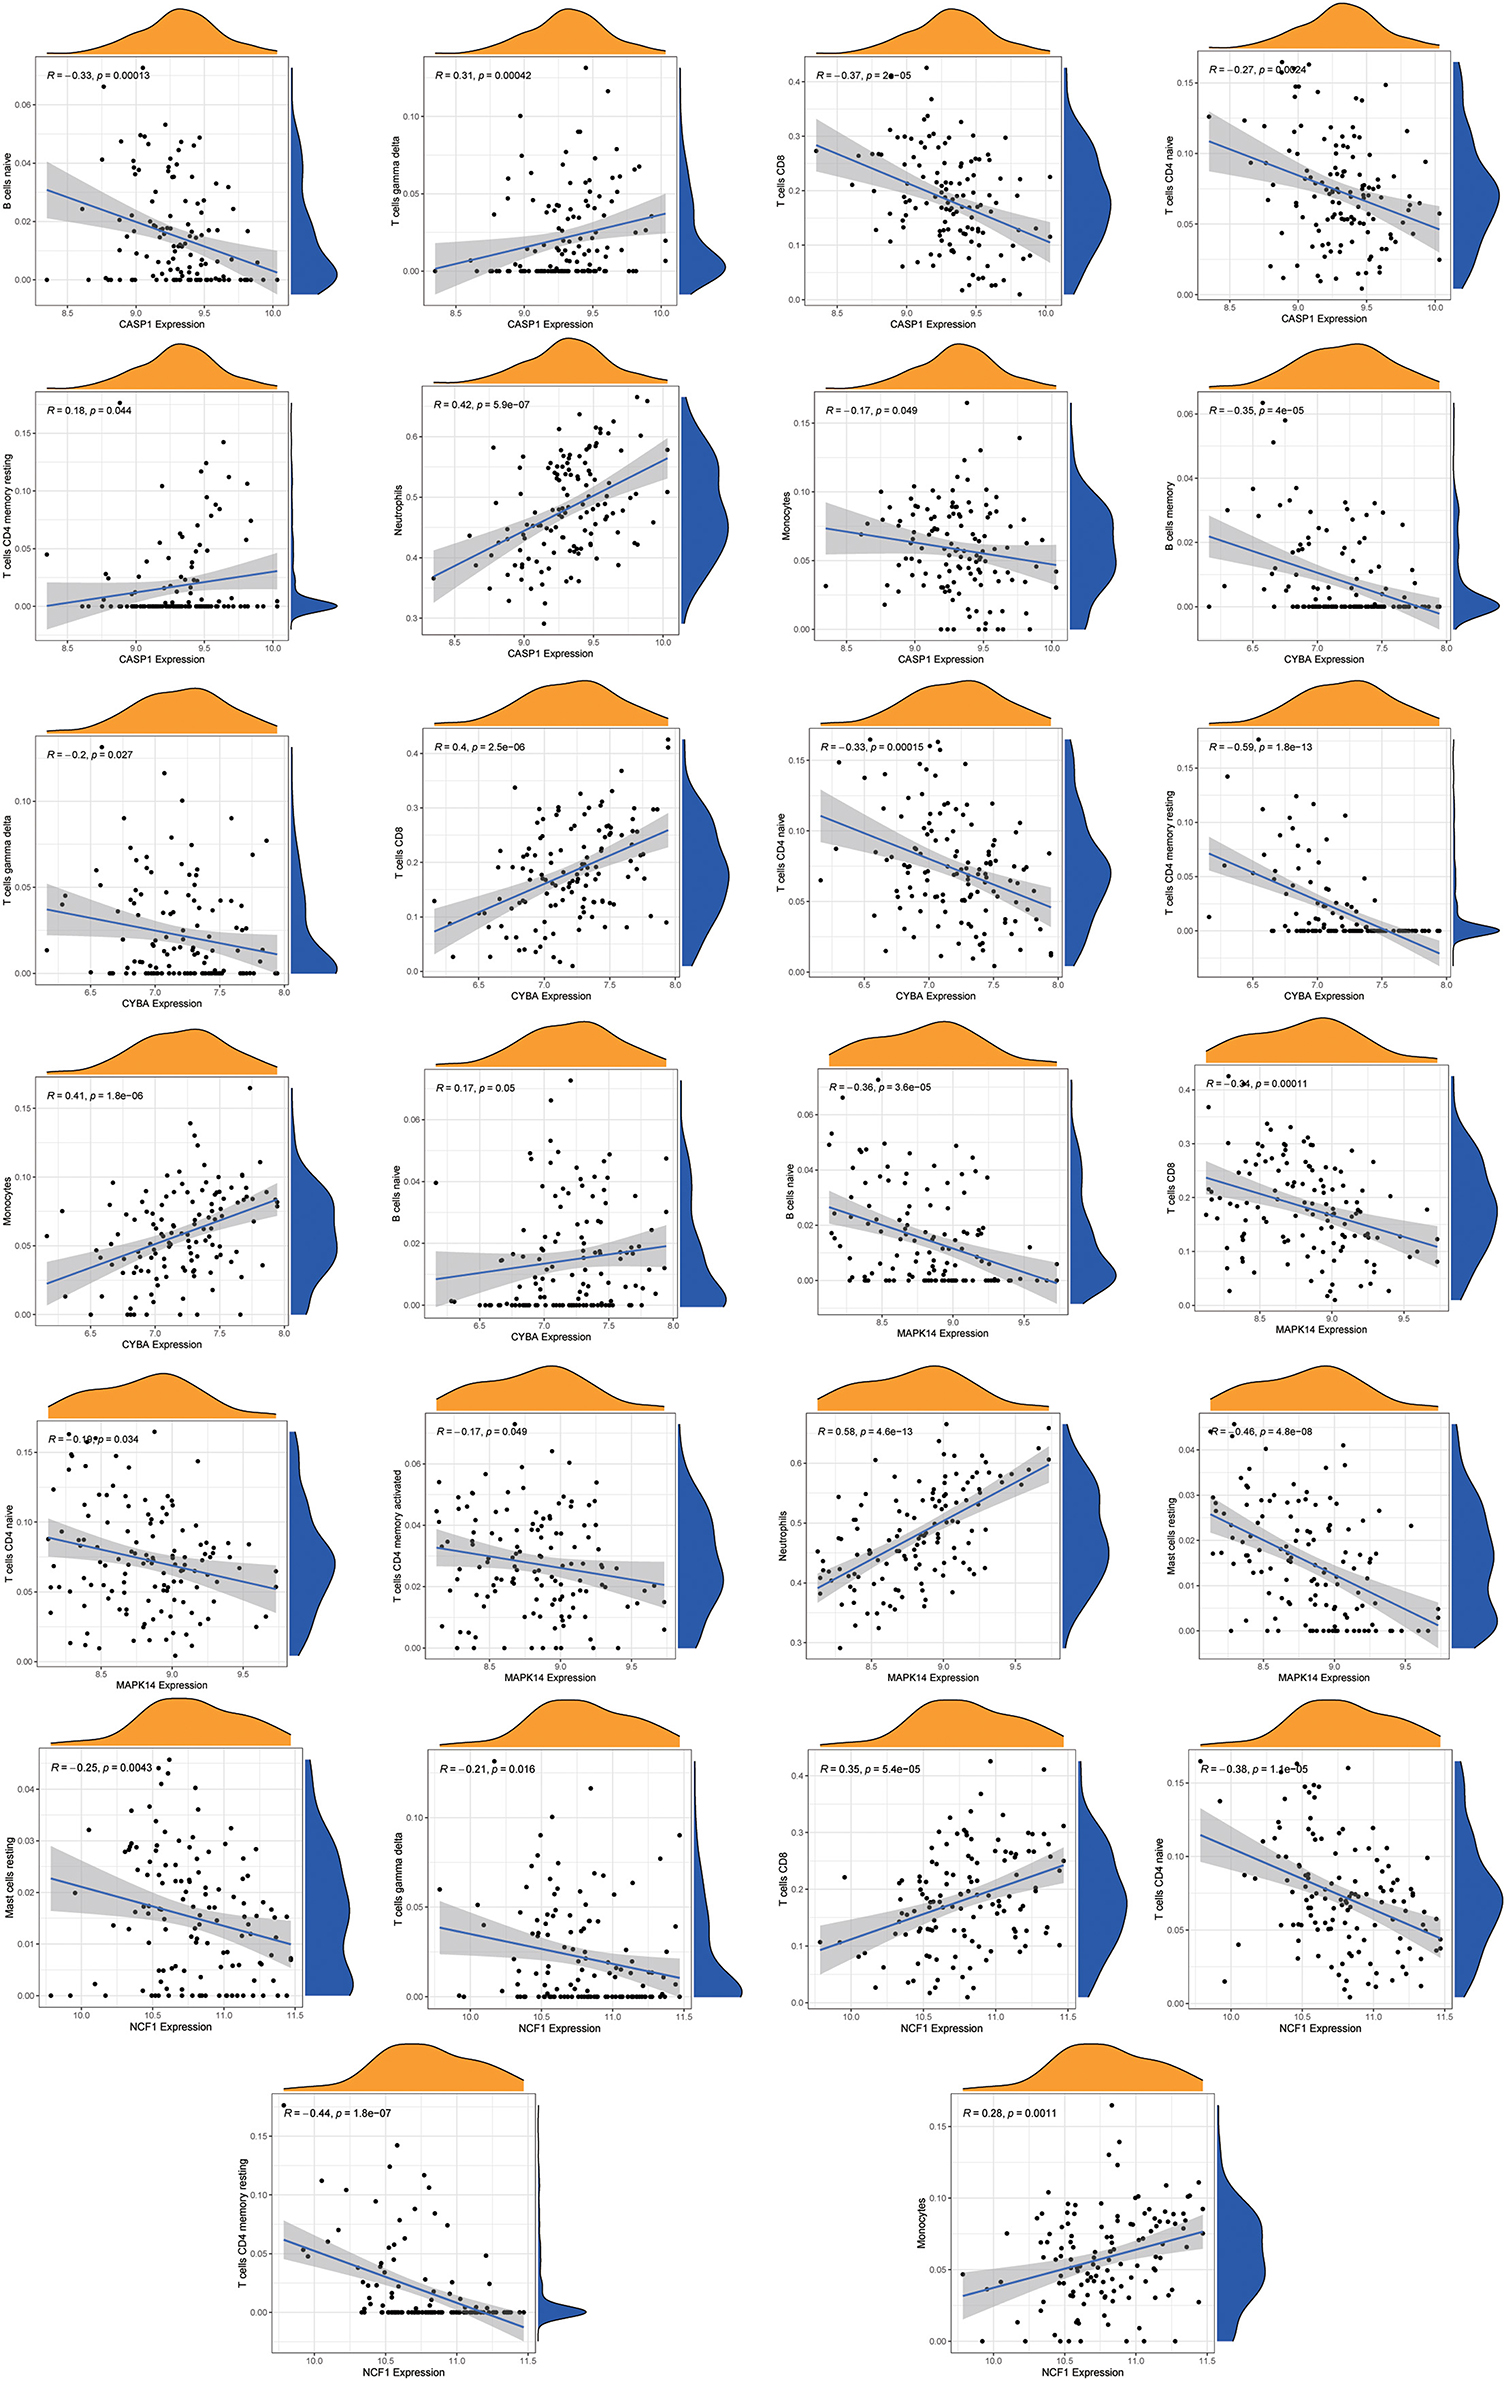
Figure 12. Correlation analysis of immune cell infiltration and the hub genes. The vertical axis represents the Hub genes expression level, and the horizontal axis represents infiltrated immunocytes expression level.
MDD is among the most prevalent and debilitating mental disorders and has high mortality and morbidity rates (1, 2). Depression affects millions of people worldwide, placing a burden on families and communities (3). Owing to its high heterogeneity and complex pathophysiology, the identification and diagnosis of MDD remains a global problem with enormous dimensions (48). Despite extensive research efforts, MDD is yet to be definitively diagnosed using specific and sensitive biomarkers. Therefore, innovative biomarkers are required for the accurate diagnosis and treatment of MDD. Prior clinical and experimental research has demonstrated that endoplasmic reticulum stress contributes to the pathogenesis of depression (11, 13). However, little research has investigated ERS-related biomarkers of MDD and the relationship of ERS-related genes with immune infiltration in MDD. In this work, for the first time, the biological significance of ERS-related genes and their association with immune infiltration in MDD were explored in depth, and prospective biomarkers were identified.
In this study, MDD-related and ERS-related genes were identified using the GEO and GeneCards databases, respectively. After the analysis, 37 ERSR-DEGs were identified. To further understand the role of ERSR-DEGs in MDD, several functional enrichment analyses were conducted. BP analyses of the GO annotation revealed that ERSR-DEGs are involved in tumor necrosis factor response, oxidoreductase regulation, and inflammation. Among the MF annotations, NADPH oxidase activity was the most significant GO term. Consistent with our data, previous research has confirmed that NADPH oxidase (NOX) plays a critical role in promoting and maintaining depressive behavior (49). NOX is a key factor linking oxidative stress and ESR-induced apoptosis (50). KEGG analysis showed that ERSR-DEGs were mainly involved in various inflammatory signaling pathways, including the NF-κB, NLR, TLR, and TNF signaling pathways, which have collectively been confirmed as essential mechanisms in the development of MDD (51–53). In addition, GSEA and GSVA analyses revealed that most genes in the MDD group were associated with inflammation and oxidative stress-related pathways, including the IL6-JAK-STAT3 signaling pathway and the reactive oxygen species (ROS) pathway. A growing body of evidence suggests that ERS triggers inflammatory signaling pathways by interacting with UPR components and cytokine-regulating transcription factors such as TLRs, NLRs, NF-κB, and TNF-α (52, 54, 55). Among these, TLRs, which are key players in modulating inflammation and host immunity, have been shown to provide a link between depression and UPR (52). According to these findings, the interactions between ERS, inflammation, and oxidative stress may contribute to the pathogenesis of depression.
Interestingly, we found that ERSR-DEGs were highly enriched in the osteoclast differentiation pathway. A similar study found that osteoclast differentiation was significantly upregulated in bipolar disorder type II (BDII) (56). Studies have found that ERS-related PERK and CREBH pathways play crucial roles in osteoclast differentiation and function (57–59). MDD has been identified as a risk factor for low bone mineral density in previous studies (60, 61). The association between ERS and MDD as well as osteoclast differentiation has been studied separately, but their interrelationships remain unknown.
Five hub genes were identified by PPI network analysis of ERSR-DEGs: NCF1, MAPK14, CASP1, CYBA, and TNF. Recent research has revealed that the CASP1-mediated signaling pathway links environmental stress to depression-like behaviors by controlling the membrane integrity of glutamate receptors (62). CASP1 activation is a crucial choke point for inducing NLRP3 inflammasome activation in the inflammatory cascade (63). ERS has been reported to induce NLRP3 inflammasome activation in different cell types, and the interaction between ERS, NLRP3 inflammasome, and inflammation promotes the development of depression (64, 65). TNF-α has been implicated in the pathophysiology of depressive disorders and the mechanism of antidepressant treatment (51). Previous studies have shown that TNF-α can selectively activate one or more ERS pathways, triggering inflammatory or apoptotic responses (55, 66). MAPK14 (P38α) is one of the major isoforms of p38 MAPK and is activated by numerous stress conditions, including ERS and inflammatory cytokines (67). Recent research has indicated that p38 MAPK is a critical modulator of stress-induced depression-like and drug-seeking behaviors, and selective p38 MAPK deletion in serotonergic neurons promotes stress resilience (68).
For the first time, we discovered that NCF1 and CYBA might be key target genes that explain the role of ERS in the pathogenesis of depression. NCF1 (p47phox) and CYBA (p22phox) are both essential components of the NADPH oxidase system (69, 70). Pieces of evidence supported the view that NADPH oxidase plays a pivotal role in developing and maintaining depression (49, 71). Yi et al. discovered that p47phox phosphorylation is a key regulator of the signaling cascade that governs the induction of long-term depression (LTD) and synapse weakening (72). Similarly, it has been reported that heterozygous deletion of p47phox can alleviate depressed behaviors (49). It is well known that NADPH oxidase is a major source of reactive oxygen species (ROS). The NADPH oxidase subunits NOX4 and NOX2, both of which rely on p22phox, have been shown to contribute to ROS generation in response to ERS. p22phox-dependent NADPH oxidases are important mediators of ERS driving the UPR (73). Furthermore, NOX2, NOX4, and p22phox are essential signaling components in ERS-induced apoptosis (50, 73). Although there is no direct evidence of CYBA involvement in MDD, it seems likely that CYBA is acting through NADPH oxidase and ERS. Recent research has revealed that NCF1 and NOX2 complex-derived ROS are critical regulators of the immune and inflammatory pathways (70). Oxidative stress and proinflammatory signaling have been identified as contributing factors to MDD (74). Consequently, it can be speculated that ERS may contribute to depression via a variety of mechanisms.
Accumulating evidence has demonstrated the significance of an abnormal inflammatory response in the development of MDD (18, 75). As previously reported, the proportions of Tregs, monocytes, and M0 macrophages in patients with MDD were significantly higher than those in controls, which is consistent with our findings (76–78). In addition, we discovered that ERS-related hub genes, such as CASP1 and MAPK14, were positively associated with immune cells, specifically neutrophils. CYBA was positively associated with resting monocytes, whereas NCF1 was negatively associated with resting CD4 + memory T cells. In different cell types, MAPK14 (P38α) is considered a critical regulator of inflammation. Certain subsets of cytokines and chemokines are tightly regulated by p38 signaling in astrocytes (79). CASP1 is known to exert pro-inflammatory effects, which can regulate IL-1β's maturation (80). Ncf1 (p47phox) is essential for direct suppression of CD4+ effector T cells (Teffs) by regulatory T cells (Treg) (81). CYBA (p22phox) has been identified as a novel regulator of monocytes (Mos) and dendritic cells (DCs) differentiation (82). Our findings provide additional evidence that immunity contributes to MDD development. It also verifies our hypothesis that ER stress can modulate the immunological microenvironment of MDD to influence the disease's course.
According to the DSigDB database, we identified fifteen small molecule medications targeting ERSR-DEGs that may be effective in treating MDD, including cinnamaldehyde, estradiol, and ketamine. Trans-Cinnamaldehyde (TCA) has been reported to have significant antidepressant-like effects (83). And supplementation with cinnamaldehyde can induce autophagy and minimize ER stress (84). Estradiol has been identified in previous clinical investigations as a potential treatment or prophylactic for perimenopausal depression (85) and postpartum depression (86). As revealed in a systematic review, estradiol may play a role in depression by regulating the expression of genes that are associated with 5HT neurotransmissions, such as TPH-2, MAO-A and-B, SERT, and 5-HT1A (87). Estradiol, an ERS modulator, has been shown to prevent chondrocyte apoptosis caused by ERS (88). Ketamine is a phencyclidine derivative, which has been approved for treatment-resistant depression (89). Moreover, a recent animal study has shown that ketamine-induced neurotoxicity is associated with an ER stress-dependent apoptotic pathway (90). It has been shown in previous studies that ERS is a potential target for antidepressant therapies (13, 22). The results of our study demonstrate once again that MDD can be treated by targeting genes related to the endoplasmic reticulum.
Our study had a few limitations. First, our research is based on the analysis of data, and further experiments are required to verify our findings. Second, an integrated analysis of both blood samples and brain tissue is required to identify MDD dysfunctions comprehensively, which was not carried out in the current study due to the difficulty in obtaining normal human brain tissue samples. Third, not all patients demonstrate significant ERS due to the heterogeneity of depression. Future research must include subgroup analysis based on the clinical and pathological characteristics of depressed patients. Fourth, the sample size of our study was relatively small, which may have affected our analysis of gene expression in MDD. Although microarray-based bioinformatics analysis can be useful for identifying potential biomarkers of MDD, additional research is necessary to establish the biological significance of ERS.
Depression affects many people and imposes an enormous economic burden. Therefore, more effort is required to improve its diagnosis and treatment. The heterogeneity, stigma, and lack of effective treatments for depression are significant difficulties. The development of non-invasive validated objective markers not only aids psychiatrists in developing personalized diagnostic and therapeutic strategies for patients with MDD, but also contributes to a more complete understanding of the pathophysiology of depression. Our study was the first to examine comprehensively the biological significance of ERS-related biomarkers and their association with immune infiltrations in MDD. NCF1, MAPK14, CASP1, CYBA, and TNF were identified as MDD biomarkers related to ERS. A putative connection between ERS and the immune system may also play a role in the development of MDD. In addition, regulatory networks upstream and downstream of ERS as well as novel perspective ERS-targeting drugs that may postpone the onset of MDD were investigated. We believe these findings can aid in the development of early diagnostic tools, preventative strategies, and pharmaceutical treatments for MDD.
Publicly available datasets were analyzed in this study. The names of the repository/repositories and accession number(s) can be found in the article/Supplementary material.
JZ conceived and designed this study. SX, YC, XZ, and ZZ collected the data and aided in data analysis. SX, YC, and JZ provided significant suggestions on the methodology. JZ conducted data management and bioinformatics analysis and drafted the manuscript. LY and YL edited and revised the manuscript. All authors read and approved the final manuscript.
Our sincere thanks go out to Dr. Huimei Wang, a statistician, who provided us with excellent technical assistance throughout the research project. Additionally, we would like to thank Editage for the English editing.
The authors declare that the research was conducted in the absence of any commercial or financial relationships that could be construed as a potential conflict of interest.
All claims expressed in this article are solely those of the authors and do not necessarily represent those of their affiliated organizations, or those of the publisher, the editors and the reviewers. Any product that may be evaluated in this article, or claim that may be made by its manufacturer, is not guaranteed or endorsed by the publisher.
The Supplementary Material for this article can be found online at: https://www.frontiersin.org/articles/10.3389/fpsyt.2022.1008124/full#supplementary-material
2. Hasin DS, Sarvet AL, Meyers JL, Saha TD, Ruan WJ, Stohl M, et al. Epidemiology of adult DSM-5 major depressive disorder and its specifiers in the United States. JAMA Psychiatr. (2018) 75:336–46. doi: 10.1001/jamapsychiatry.2017.4602
3. Friedrich MJ. Depression is the leading cause of disability around the world. Jama. (2017) 317:1517. doi: 10.1001/jama.2017.3826
4. Goldberg D. The heterogeneity of “major depression”. World Psychiatr. (2011) 10:226–8. doi: 10.1002/j.2051-5545.2011.tb00061.x
5. Young JJ, Silber T, Bruno D, Galatzer-Levy IR, Pomara N, Marmar CR. Is there progress? an overview of selecting biomarker candidates for major depressive disorder. Front Psychiatr. (2016) 7:72. doi: 10.3389/fpsyt.2016.00072
6. Gadad BS, Jha MK, Czysz A, Furman JL, Mayes TL, Emslie MP, et al. Peripheral biomarkers of major depression and antidepressant treatment response: current knowledge and future outlooks. J Affect Disord. (2018) 233:3–14. doi: 10.1016/j.jad.2017.07.001
7. Nobis A, Zalewski D, Waszkiewicz N. Peripheral markers of depression. J Clin Med. (2020) 9:12. doi: 10.3390/jcm9123793
8. Rush AJ, Trivedi MH, Wisniewski SR, Nierenberg AA, Stewart JW, Warden D, et al. Acute and longer-term outcomes in depressed outpatients requiring one or several treatment steps: a STAR*D report. Am J Psychiatry. (2006) 163:1905–17. doi: 10.1176/ajp.2006.163.11.1905
9. Blackburn TP. Depressive disorders: treatment failures and poor prognosis over the last 50 years. Pharmacol Res Perspect. (2019) 7:e00472. doi: 10.1002/prp2.472
10. Oakes SA, Papa FR. The role of endoplasmic reticulum stress in human pathology. Annu Rev Pathol. (2015) 10:173–94. doi: 10.1146/annurev-pathol-012513-104649
11. Mao J, Hu Y, Ruan L, Ji Y, Lou Z. Role of endoplasmic reticulum stress in depression (Review). Mol Med Rep. (2019) 20:4774–80. doi: 10.3892/mmr.2019.10789
12. Kowalczyk M, Kowalczyk E, Kwiatkowski P, Łopusiewicz Ł, Talarowska M, Sienkiewicz M. Cellular response to unfolded proteins in depression. Life (Basel). (2021) 11:12. doi: 10.3390/life11121376
13. Józwiak-Bebenista M, Sokołowska P, Siatkowska M, Panek CA, Komorowski P, Kowalczyk E, et al. The importance of endoplasmic reticulum stress as a novel antidepressant drug target and its potential impact on CNS disorders. Pharmaceutics. (2022) 14:486. doi: 10.3390/pharmaceutics14040846
14. Nevell L, Zhang K, Aiello AE, Koenen K, Galea S, Soliven R, et al. Elevated systemic expression of ER stress related genes is associated with stress-related mental disorders in the Detroit Neighborhood Health Study. Psychoneuroendocrinology. (2014) 43:62–70. doi: 10.1016/j.psyneuen.2014.01.013
15. So JS. Roles of endoplasmic reticulum stress in immune responses. Mol Cells. (2018) 41:705–16. doi: 10.14348/molcells.2018.0241
16. Grootjans J, Kaser A, Kaufman RJ, Blumberg RS. The unfolded protein response in immunity and inflammation. Nat Rev Immunol. (2016) 16:469–84. doi: 10.1038/nri.2016.62
17. Malhotra JD, Kaufman RJ. Endoplasmic reticulum stress and oxidative stress: a vicious cycle or a double-edged sword? Antioxid Redox Signal. (2007) 9:2277–93. doi: 10.1089/ars.2007.1782
18. Drevets WC, Wittenberg GM, Bullmore ET, Manji HK. Immune targets for therapeutic development in depression: toward precision medicine. Nat Rev Drug Discov. (2022) 21:224–44. doi: 10.1038/s41573-021-00368-1
19. Lindqvist D, Dhabhar FS, James SJ, Hough CM, Jain FA, Bersani FS, et al. Oxidative stress, inflammation and treatment response in major depression. Psychoneuroendocrinology. (2017) 76:197–205. doi: 10.1016/j.psyneuen.2016.11.031
20. Ciobanu LG, Sachdev PS, Trollor JN, Reppermund S, Thalamuthu A, Mather KA, et al. Co-expression network analysis of peripheral blood transcriptome identifies dysregulated protein processing in endoplasmic reticulum and immune response in recurrent MDD in older adults. J Psychiatr Res. (2018) 107:19–27. doi: 10.1016/j.jpsychires.2018.09.017
21. Gold PW, Licinio J, Pavlatou MG. Pathological parainflammation and endoplasmic reticulum stress in depression: potential translational targets through the CNS insulin, klotho and PPAR-γ systems. Mol Psychiatry. (2013) 18:154–65. doi: 10.1038/mp.2012.167
22. Yang L, Zheng L, Wan Y, Chen Z, Li P, Wang Y. Metoprolol, N-Acetylcysteine, and escitalopram prevents chronic unpredictable mild stress-induced depression by inhibition of endoplasmic reticulum stress. Front Psychiatry. (2018) 9:696. doi: 10.3389/fpsyt.2018.00696
23. Barrett T, Troup DB, Wilhite SE, Ledoux P, Rudnev D, Evangelista C, et al. NCBI GEO: mining tens of millions of expression profiles–database and tools update. Nucleic Acids Res. (2007) 35:D760–5. doi: 10.1093/nar/gkl887
24. Davis S, Meltzer PS. GEOquery: a bridge between the gene expression omnibus (GEO) and bioconductor. Bioinformatics. (2007) 23:1846–7. doi: 10.1093/bioinformatics/btm254
25. Leday GGR, Vértes PE, Richardson S, Greene JR, Regan T, Khan S, et al. Replicable and coupled changes in innate and adaptive immune gene expression in two case-control studies of blood microarrays in major depressive disorder. Biol Psychiatry. (2018) 83:70–80. doi: 10.1016/j.biopsych.2017.01.021
26. Savitz J, Frank MB, Victor T, Bebak M, Marino JH, Bellgowan PS, et al. Inflammation and neurological disease-related genes are differentially expressed in depressed patients with mood disorders and correlate with morphometric and functional imaging abnormalities. Brain Behav Immun. (2013) 31:161–71. doi: 10.1016/j.bbi.2012.10.007
27. Bolstad BM, Irizarry RA, Astrand M, Speed TP. A comparison of normalization methods for high density oligonucleotide array data based on variance and bias. Bioinformatics. (2003) 19:185–93. doi: 10.1093/bioinformatics/19.2.185
28. Ritchie ME, Phipson B, Wu D, Hu Y, Law CW, Shi W, et al. limma powers differential expression analyses for RNA-sequencing and microarray studies. Nucleic Acids Res. (2015) 43:e47. doi: 10.1093/nar/gkv007
29. Ringnér M. What is principal component analysis? Nat Biotechnol. (2008) 26:303–4. doi: 10.1038/nbt0308-303
30. Safran M, Dalah I, Alexander J, Rosen N, Iny Stein T, Shmoish M, et al. GeneCards Version 3: the human gene integrator. Database (Oxford). (2010) 2010:baq020. doi: 10.1093/database/baq020
31. Yu G, Wang LG, Han Y, He QY. clusterProfiler: an R package for comparing biological themes among gene clusters. Omics. (2012) 16:284–7. doi: 10.1089/omi.2011.0118
32. Luo W, Pant G, Bhavnasi YK, Blanchard SG Jr, Brouwer C. Pathview Web: user friendly pathway visualization and data integration. Nucleic Acids Res. (2017) 45:W501–w8. doi: 10.1093/nar/gkx372
33. Subramanian A, Tamayo P, Mootha VK, Mukherjee S, Ebert BL, Gillette MA, et al. Gene set enrichment analysis: a knowledge-based approach for interpreting genome-wide expression profiles. Proc Natl Acad Sci U S A. (2005) 102:15545–50. doi: 10.1073/pnas.0506580102
34. Hänzelmann S, Castelo R, Guinney J. GSVA: gene set variation analysis for microarray and RNA-seq data. BMC Bioinformatics. (2013) 14:7. doi: 10.1186/1471-2105-14-7
35. Liberzon A, Birger C, Thorvaldsdóttir H, Ghandi M, Mesirov JP, Tamayo P. The molecular signatures database (MSigDB) hallmark gene set collection. Cell Syst. (2015) 1:417–25. doi: 10.1016/j.cels.2015.12.004
36. Franz M, Rodriguez H, Lopes C, Zuberi K, Montojo J, Bader GD, et al. GeneMANIA update (2018). Nucleic Acids Res. (2018) 46(W1):W60–w4. doi: 10.1093/nar/gky311
37. Szklarczyk D, Gable AL, Lyon D, Junge A, Wyder S, Huerta-Cepas J, et al. STRING v11: protein-protein association networks with increased coverage, supporting functional discovery in genome-wide experimental datasets. Nucleic Acids Res. (2019) 47:D607–d13. doi: 10.1093/nar/gky1131
38. Shannon P, Markiel A, Ozier O, Baliga NS, Wang JT, Ramage D, et al. Cytoscape: a software environment for integrated models of biomolecular interaction networks. Genome Res. (2003) 13:2498–504. doi: 10.1101/gr.1239303
39. Chin CH, Chen SH, Wu HH, Ho CW, Ko MT, Lin CY. cytoHubba: identifying hub objects and sub-networks from complex interactome. BMC Syst Biol. (2014) 8:S11. doi: 10.1186/1752-0509-8-S4-S11
40. Soifer HS, Rossi JJ, Saetrom P. MicroRNAs in disease and potential therapeutic applications. Mol Ther. (2007) 15:2070–9. doi: 10.1038/sj.mt.6300311
41. Li JH, Liu S, Zhou H, Qu LH, Yang JH. starBase v2.0: decoding miRNA-ceRNA, miRNA-ncRNA and protein-RNA interaction networks from large-scale CLIP-Seq data. Nucleic Acids Res. (2014) 42:D92–7. doi: 10.1093/nar/gkt1248
42. Agarwal V, Bell GW, Nam JW, Bartel DP. Predicting effective microRNA target sites in mammalian mRNAs. Elife. (2015) 4:5. doi: 10.7554/eLife.05005
43. Chen Y, Wang X. miRDB: an online database for prediction of functional microRNA targets. Nucleic Acids Res. (2020) 48:D127–d31. doi: 10.1093/nar/gkz757
44. Castro-Mondragon JA, Riudavets-Puig R, Rauluseviciute I, Lemma RB, Turchi L, Blanc-Mathieu R, et al. JASPAR 2022: the 9th release of the open-access database of transcription factor binding profiles. Nucleic Acids Res. (2022) 50:D165–d73. doi: 10.1093/nar/gkab1113
45. Yoo M, Shin J, Kim J, Ryall KA, Lee K, Lee S, et al. DSigDB: drug signatures database for gene set analysis. Bioinformatics. (2015) 31:3069–71. doi: 10.1093/bioinformatics/btv313
46. Kuleshov MV, Jones MR, Rouillard AD, Fernandez NF, Duan Q, Wang Z, et al. Enrichr: a comprehensive gene set enrichment analysis web server 2016 update. Nucleic Acids Res. (2016) 44:W90–7. doi: 10.1093/nar/gkw377
47. Newman AM, Steen CB, Liu CL, Gentles AJ, Chaudhuri AA, Scherer F, et al. Determining cell type abundance and expression from bulk tissues with digital cytometry. Nat Biotechnol. (2019) 37:773–82. doi: 10.1038/s41587-019-0114-2
48. Chekroud AM, Gueorguieva R, Krumholz HM, Trivedi MH, Krystal JH, McCarthy G. Reevaluating the efficacy and predictability of antidepressant treatments: a symptom clustering approach. JAMA Psychiatry. (2017) 74:370–8. doi: 10.1001/jamapsychiatry.2017.0025
49. Seo JS, Park JY, Choi J, Kim TK, Shin JH, Lee JK, et al. NADPH oxidase mediates depressive behavior induced by chronic stress in mice. J Neurosci. (2012) 32:9690–9. doi: 10.1523/JNEUROSCI.0794-12.2012
50. Li G, Scull C, Ozcan L, Tabas I. NADPH oxidase links endoplasmic reticulum stress, oxidative stress, and PKR activation to induce apoptosis. J Cell Biol. (2010) 191:1113–25. doi: 10.1083/jcb.201006121
51. Ma K, Zhang H, Baloch Z. Pathogenetic and therapeutic applications of tumor necrosis factor-α (TNF-α) in major depressive disorder: a systematic review. Int J Mol Sci. (2016) 17:733. doi: 10.3390/ijms17050733
52. Ii Timberlake M, Dwivedi Y. Linking unfolded protein response to inflammation and depression: potential pathologic and therapeutic implications. Mol Psychiatry. (2019) 24:987–94. doi: 10.1038/s41380-018-0241-z
53. Beurel E, Toups M, Nemeroff CB. The bidirectional relationship of depression and inflammation: double trouble. Neuron. (2020) 107:234–56. doi: 10.1016/j.neuron.2020.06.002
54. Keestra-Gounder AM, Byndloss MX, Seyffert N, Young BM, Chávez-Arroyo A, Tsai AY, et al. NOD1 and NOD2 signaling links ER stress with inflammation. Nature. (2016) 532:394–7. doi: 10.1038/nature17631
55. Hu P, Han Z, Couvillon AD, Kaufman RJ, Exton JH. Autocrine tumor necrosis factor alpha links endoplasmic reticulum stress to the membrane death receptor pathway through IRE1alpha-mediated NF-kappaB activation and down-regulation of TRAF2 expression. Mol Cell Biol. (2006) 26:3071–84. doi: 10.1128/MCB.26.8.3071-3084.2006
56. Dmitrzak-Weglarz M, Szczepankiewicz A, Rybakowski J, Kapelski P, Bilska K, Skibinska M, et al. Transcriptomic profiling as biological markers of depression - a pilot study in unipolar and bipolar women. World J Biol Psychiatry. (2021) 22:744–56. doi: 10.1080/15622975.2021.1907715
57. Guo J, Ren R, Sun K, He J, Shao J. PERK signaling pathway in bone metabolism: friend or foe? Cell Prolif. (2021) 54:e13011. doi: 10.1111/cpr.13011
58. Guo J, Ren R, Sun K, Yao X, Lin J, Wang G, et al. PERK controls bone homeostasis through the regulation of osteoclast differentiation and function. Cell Death Dis. (2020) 11:847. doi: 10.1038/s41419-020-03046-z
59. Kim JH, Kim K, Kim I, Seong S, Nam KI, Kim KK, et al. Endoplasmic reticulum-bound transcription factor CREBH stimulates RANKL-Induced osteoclastogenesis. J Immunol. (2018) 200:1661–70. doi: 10.4049/jimmunol.1701036
60. Yirmiya R, Bab I. Major depression is a risk factor for low bone mineral density: a meta-analysis. Biol Psychiatry. (2009) 66:423–32. doi: 10.1016/j.biopsych.2009.03.016
61. Williams LJ, Pasco JA, Jacka FN, Henry MJ, Dodd S, Berk M. Depression and bone metabolism: a review. Psychother Psychosom. (2009) 78:16–25. doi: 10.1159/000162297
62. Li MX, Zheng HL, Luo Y, He JG, Wang W, Han J, et al. Gene deficiency and pharmacological inhibition of caspase-1 confers resilience to chronic social defeat stress via regulating the stability of surface AMPARs. Mol Psychiatr. (2018) 23:556–68. doi: 10.1038/mp.2017.76
63. Swanson KV, Deng M, Ting JP. The NLRP3 inflammasome: molecular activation and regulation to therapeutics. Nat Rev Immunol. (2019) 19:477–89. doi: 10.1038/s41577-019-0165-0
64. Li W, Cao T, Luo C, Cai J, Zhou X, Xiao X, et al. Crosstalk between ER stress, NLRP3 inflammasome, and inflammation. Appl Microbiol Biotechnol. (2020) 104:6129–40. doi: 10.1007/s00253-020-10614-y
65. Zhou Y, Tong Z, Jiang S, Zheng W, Zhao J, Zhou X. The roles of endoplasmic reticulum in NLRP3 inflammasome activation. Cells. (2020) 9:1219. doi: 10.3390/cells9051219
66. Yap J, Chen X, Delmotte P, Sieck GC. TNFα selectively activates the IRE1α/XBP1 endoplasmic reticulum stress pathway in human airway smooth muscle cells. Am J Physiol Lung Cell Mol Physiol. (2020) 318:L483–l93. doi: 10.1152/ajplung.00212.2019
67. Han J, Wu J, Silke J. An overview of mammalian p38 mitogen-activated protein kinases, central regulators of cell stress and receptor signaling. F1000Res. (2020) 9:1. doi: 10.12688/f1000research.22092.1
68. Bruchas MR, Schindler AG, Shankar H, Messinger DI, Miyatake M, Land BB, et al. Selective p38α MAPK deletion in serotonergic neurons produces stress resilience in models of depression and addiction. Neuron. (2011) 71:498–511. doi: 10.1016/j.neuron.2011.06.011
69. Tarazona-Santos E, Machado M, Magalhães WC, Chen R, Lyon F, Burdett L, et al. Evolutionary dynamics of the human NADPH oxidase genes CYBB, CYBA, NCF2, and NCF4: functional implications. Mol Biol Evol. (2013) 30:2157–67. doi: 10.1093/molbev/mst119
70. Holmdahl R, Sareila O, Olsson LM, Bäckdahl L, Wing K. Ncf1 polymorphism reveals oxidative regulation of autoimmune chronic inflammation. Immunol Rev. (2016) 269:228–47. doi: 10.1111/imr.12378
71. Ibi M, Liu J, Arakawa N, Kitaoka S, Kawaji A, Matsuda KI, et al. Depressive-Like Behaviors Are Regulated by NOX1/NADPH Oxidase by Redox Modification of NMDA Receptor 1. J Neurosci. (2017) 37:4200–12. doi: 10.1523/JNEUROSCI.2988-16.2017
72. Yi JH, Kim DH, Piers TM, Kim SC, Whitcomb DJ, Regan P, et al. Postsynaptic p47phox regulates long-term depression in the hippocampus. Cell Discov. (2018) 4:44. doi: 10.1038/s41421-018-0046-x
73. Petry A, Zhang Z, Trautz B, Rieß F, Görlach A. Cross talk between p22phox and ATF4 in the endothelial unfolded protein response. Antioxid Redox Signal. (2019) 30:40–55. doi: 10.1089/ars.2017.7481
74. Bhatt S, Nagappa AN, Patil CR. Role of oxidative stress in depression. Drug Discov Today. (2020) 25:1270–6. doi: 10.1016/j.drudis.2020.05.001
75. Miller AH, Maletic V, Raison CL. Inflammation and its discontents: the role of cytokines in the pathophysiology of major depression. Biol Psychiatry. (2009) 65:732–41. doi: 10.1016/j.biopsych.2008.11.029
76. Alvarez-Mon MA, Gomez-Lahoz AM, Orozco A, Lahera G, Sosa-Reina MD, Diaz D, et al. Blunted expansion of regulatory t lymphocytes is associated with increased bacterial translocation in patients with major depressive disorder. Front Psychiatry. (2020) 11:591962. doi: 10.3389/fpsyt.2020.591962
77. Maes M, Van der Planken M, Stevens WJ, Peeters D, DeClerck LS, Bridts CH, et al. Leukocytosis, monocytosis and neutrophilia: hallmarks of severe depression. J Psychiatr Res. (1992) 26:125–34. doi: 10.1016/0022-3956(92)90004-8
78. Cosma NC, Üsekes B, Otto LR, Gerike S, Heuser I, Regen F, et al. M1/M2 polarization in major depressive disorder: disentangling state from trait effects in an individualized cell-culture-based approach. Brain Behav Immun. (2021) 94:185–95. doi: 10.1016/j.bbi.2021.02.009
79. Lo U, Selvaraj V, Plane JM, Chechneva OV, Otsu K, Deng W. p38α (MAPK14) critically regulates the immunological response and the production of specific cytokines and chemokines in astrocytes. Sci Rep. (2014) 4:7405. doi: 10.1038/srep07405
80. Alcocer-Gómez E, de Miguel M, Casas-Barquero N, Núñez-Vasco J, Sánchez-Alcazar JA, Fernández-Rodríguez A, et al. NLRP3 inflammasome is activated in mononuclear blood cells from patients with major depressive disorder. Brain Behav Immun. (2014) 36:111–7. doi: 10.1016/j.bbi.2013.10.017
81. Efimova O, Szankasi P, Kelley TW. Ncf1 (p47phox) is essential for direct regulatory T cell mediated suppression of CD4+ effector T cells. PLoS One. (2011) 6:e16013. doi: 10.1371/journal.pone.0016013
82. Marzaioli V, Hurtado-Nedelec M, Pintard C, Tlili A, Marie JC, Monteiro RC, et al. NOX5 and p22phox are 2 novel regulators of human monocytic differentiation into dendritic cells. Blood. (2017) 130:1734–45. doi: 10.1182/blood-2016-10-746347
83. Wang M, Yan S, Zhou Y, Xie P. trans-Cinnamaldehyde reverses depressive-like behaviors in chronic unpredictable mild stress rats by inhibiting NF-κB/NLRP3 inflammasome pathway. Evid Based Complement Alternat Med. (2020) 2020:4572185. doi: 10.1155/2020/4572185
84. Neto JGO, Boechat SK, Romão JS, Pazos-Moura CC, Oliveira KJ. Treatment with cinnamaldehyde reduces the visceral adiposity and regulates lipid metabolism, autophagy and endoplasmic reticulum stress in the liver of a rat model of early obesity. J Nutr Biochem. (2020) 77:108321. doi: 10.1016/j.jnutbio.2019.108321
85. Albert K, Ledet T, Taylor W, Newhouse P. Estradiol administration differentially affects the response to experimental psychosocial stress in post-menopausal women with or without a history of major depression. J Affect Disord. (2020) 261:204–10. doi: 10.1016/j.jad.2019.09.074
86. Moses-Kolko EL, Berga SL, Kalro B, Sit DK, Wisner KL. Transdermal estradiol for postpartum depression: a promising treatment option. Clin Obstet Gynecol. (2009) 52:516–29. doi: 10.1097/GRF.0b013e3181b5a395
87. Hernández-Hernández OT, Martínez-Mota L, Herrera-Pérez JJ, Jiménez-Rubio G. Role of estradiol in the expression of genes involved in serotonin neurotransmission: implications for female depression. Curr Neuropharmacol. (2019) 17:459–71. doi: 10.2174/1570159X16666180628165107
88. Dreier R, Ising T, Ramroth M, Rellmann Y. Estradiol inhibits ER stress-induced apoptosis in chondrocytes and contributes to a reduced osteoarthritic cartilage degeneration in female mice. Front Cell Dev Biol. (2022) 10:913118. doi: 10.3389/fcell.2022.913118
89. McIntyre RS, Rosenblat JD, Nemeroff CB, Sanacora G, Murrough JW, Berk M, et al. Synthesizing the evidence for ketamine and esketamine in treatment-resistant depression: an international expert opinion on the available evidence and implementation. Am J Psychiatry. (2021) 178:383–99. doi: 10.1176/appi.ajp.2020.20081251
Keywords: endoplasmic reticulum stress-related differentially expressed genes (ERSR-DEGs), bioinformatics analysis, major depressive disorder (MDD), endoplasmic reticulum stress (ERS), immune infiltration
Citation: Zhang J, Xie S, Chen Y, Zhou X, Zheng Z, Yang L and Li Y (2022) Comprehensive analysis of endoplasmic reticulum stress and immune infiltration in major depressive disorder. Front. Psychiatry 13:1008124. doi: 10.3389/fpsyt.2022.1008124
Received: 31 July 2022; Accepted: 10 October 2022;
Published: 24 October 2022.
Edited by:
Zhifang Deng, Huazhong University of Science and Technology, ChinaReviewed by:
Kaori Suyama, Tokai University, JapanCopyright © 2022 Zhang, Xie, Chen, Zhou, Zheng, Yang and Li. This is an open-access article distributed under the terms of the Creative Commons Attribution License (CC BY). The use, distribution or reproduction in other forums is permitted, provided the original author(s) and the copyright owner(s) are credited and that the original publication in this journal is cited, in accordance with accepted academic practice. No use, distribution or reproduction is permitted which does not comply with these terms.
*Correspondence: Yan Li, amFuZWxpeWFuMjAxOEAxNjMuY29t
Disclaimer: All claims expressed in this article are solely those of the authors and do not necessarily represent those of their affiliated organizations, or those of the publisher, the editors and the reviewers. Any product that may be evaluated in this article or claim that may be made by its manufacturer is not guaranteed or endorsed by the publisher.
Research integrity at Frontiers
Learn more about the work of our research integrity team to safeguard the quality of each article we publish.