 Youfang Chen1†
 Feng Zhou
 Weicheng Lu
 Weian Zeng
 Jingdun Xie
95% of researchers rate our articles as excellent or good
Learn more about the work of our research integrity team to safeguard the quality of each article we publish.
Find out more
ORIGINAL RESEARCH article
Front. Psychiatry , 21 October 2022
Sec. Molecular Psychiatry
Volume 13 - 2022 | https://doi.org/10.3389/fpsyt.2022.1004945
This article is part of the Research Topic Objective Diagnostic and/or Prognostic Biomarkers in Major Depressive Disorder View all 5 articles
Background: Major depressive disorder (MDD) is a heterogeneous and prevalent mental disorder associated with increased morbidity, disability, and mortality. However, its underlying mechanisms remain unclear.
Materials and methods: All analyses were conducted based on integrated samples from the GEO database. Differential expression analysis, unsupervised consensus clustering analysis, enrichment analysis, and regulation network analysis were performed.
Results: Mitogen-activated protein kinase (MAPK) signaling pathway was identified as an associated pathway in the development of MDD. From transcriptional signatures, we classified the MDD patients into two subgroups using unsupervised clustering and revealed 13 differential expression genes between subgroups, which indicates the probably relative complications. We further illustrated potential molecular mechanisms of MDD, including dysregulation in the neurotrophin signaling pathway, peptidyl-serine phosphorylation, and endocrine resistance. Moreover, we identified hub genes, including MAPK8, TP53, and HRAS in the maintenance of MDD. Furthermore, we demonstrated that the axis of miRNAs-TFs-HRAS/TP53/MAPK8 may play a critical role in MDD.
Conclusion: Taken together, we demonstrated an overview of MAPK-related key genes in MDD, determined two molecular subtypes, and identified the key genes and core network that may contribute to the procession of MDD.
Major depressive disorder (MDD) is an increasingly multifactorial and devastating mental disorder that affects estimating 4.4% population of the world (1). It is usually prevalent throughout the lifespan and causes diverse somatic symptoms (2, 3). Recent work has demonstrated that MDD is associated with many other diseases, such as Alzheimer’s disease (4), Parkinson’s disease (5), and carcinoma (6). However, despite great advances in exploring the pathogenesis of MDD, the underlying mechanism remains largely elusive (7). Due to the lack of objective diagnostic tests, it is still hard to identify MDD patients and evaluate the status of MDD as early as possible (8). What’s worse, about one-third of patients treated with antidepressants do not reach symptomatic remission (9, 10). Although some candidate genes in MDD, like SLC6A4, have been identified, the procession is still unclear because of the genetic variants and environmental exposures (11). Hence, there is an urgent need to characterize specific and practical molecular signatures for accurate diagnosis and individualized treatment of MDD.
In the past few decades, many interpretations have been proposed to explore MDD (12, 13). It was noted that MDD is closely related to diverse brain region (14, 15), circadian genes (16), neuregulin signaling (17), insulin resistance (18), testosterone deficiency (19), neuroinflammation (20), and other metabolic pathways (21, 22). However, whether these pathways can be applied to identify MDD patients and evaluate their different statuses has not been fully elucidated.
In our study, we aimed to identify new significant and practical diagnoses and phased markers. We first identified a potential relative pathway by enrichment analyses based on the Differential Expression Genes (DEGs) from the GEO database.1 We next collected the most associated genes from GeneCards.2 Unsupervised consensus clustering further classified different subtypes of MDD patients. DEGs between subtypes were further identified. Enrichment analyses for the DEGs, including Gene Ontology (GO) function and Kyoto Encyclopedia of Genes and Genomes (KEGG) pathway analyses were performed. Furthermore, we recognized the hub genes and verified them by arrays expression from brain tissue. Finally, the protein-protein interaction (PPI) network and miRNAs-TFs-hub genes networks were constructed.
The datasets used in this research were downloaded from the GEO. The workflow of our study was shown in Figure 1. We selected two datasets: GSE98793 and GSE76826, including microarray RNA expression profiles and clinical data. The GSE98793 dataset includes 128 MDD patients and 64 healthy controls. The GSE76826 dataset includes 20 MDD patients and 12 healthy controls. But from GSE76826, we only chose the 12 healthy controls and 10 patients who were not in remission states [The depressive state was measured using the Structured Interview Guide for the Hamilton Depression (SIGH-D) rating scale; a remission state was defined as a stage in which a participant did not meet the diagnosis of a MINI major depressive episode for a period of 2 consecutive months and had a SIGH-D score of less than 8]. According to the annotation information on the GPL570 and GPL17077, the probes were respectively converted into corresponding gene symbols, and we next intersected common genes between two cohort data. According to the shared genes, two datasets were merged and normalized to remove the batch effect between arrays by the “SVA” R package (23). After screening, we finally gained 6,989 genes in a new dataset with 138 MDD patients and 76 healthy controls for analyses (Supplementary Table 1).
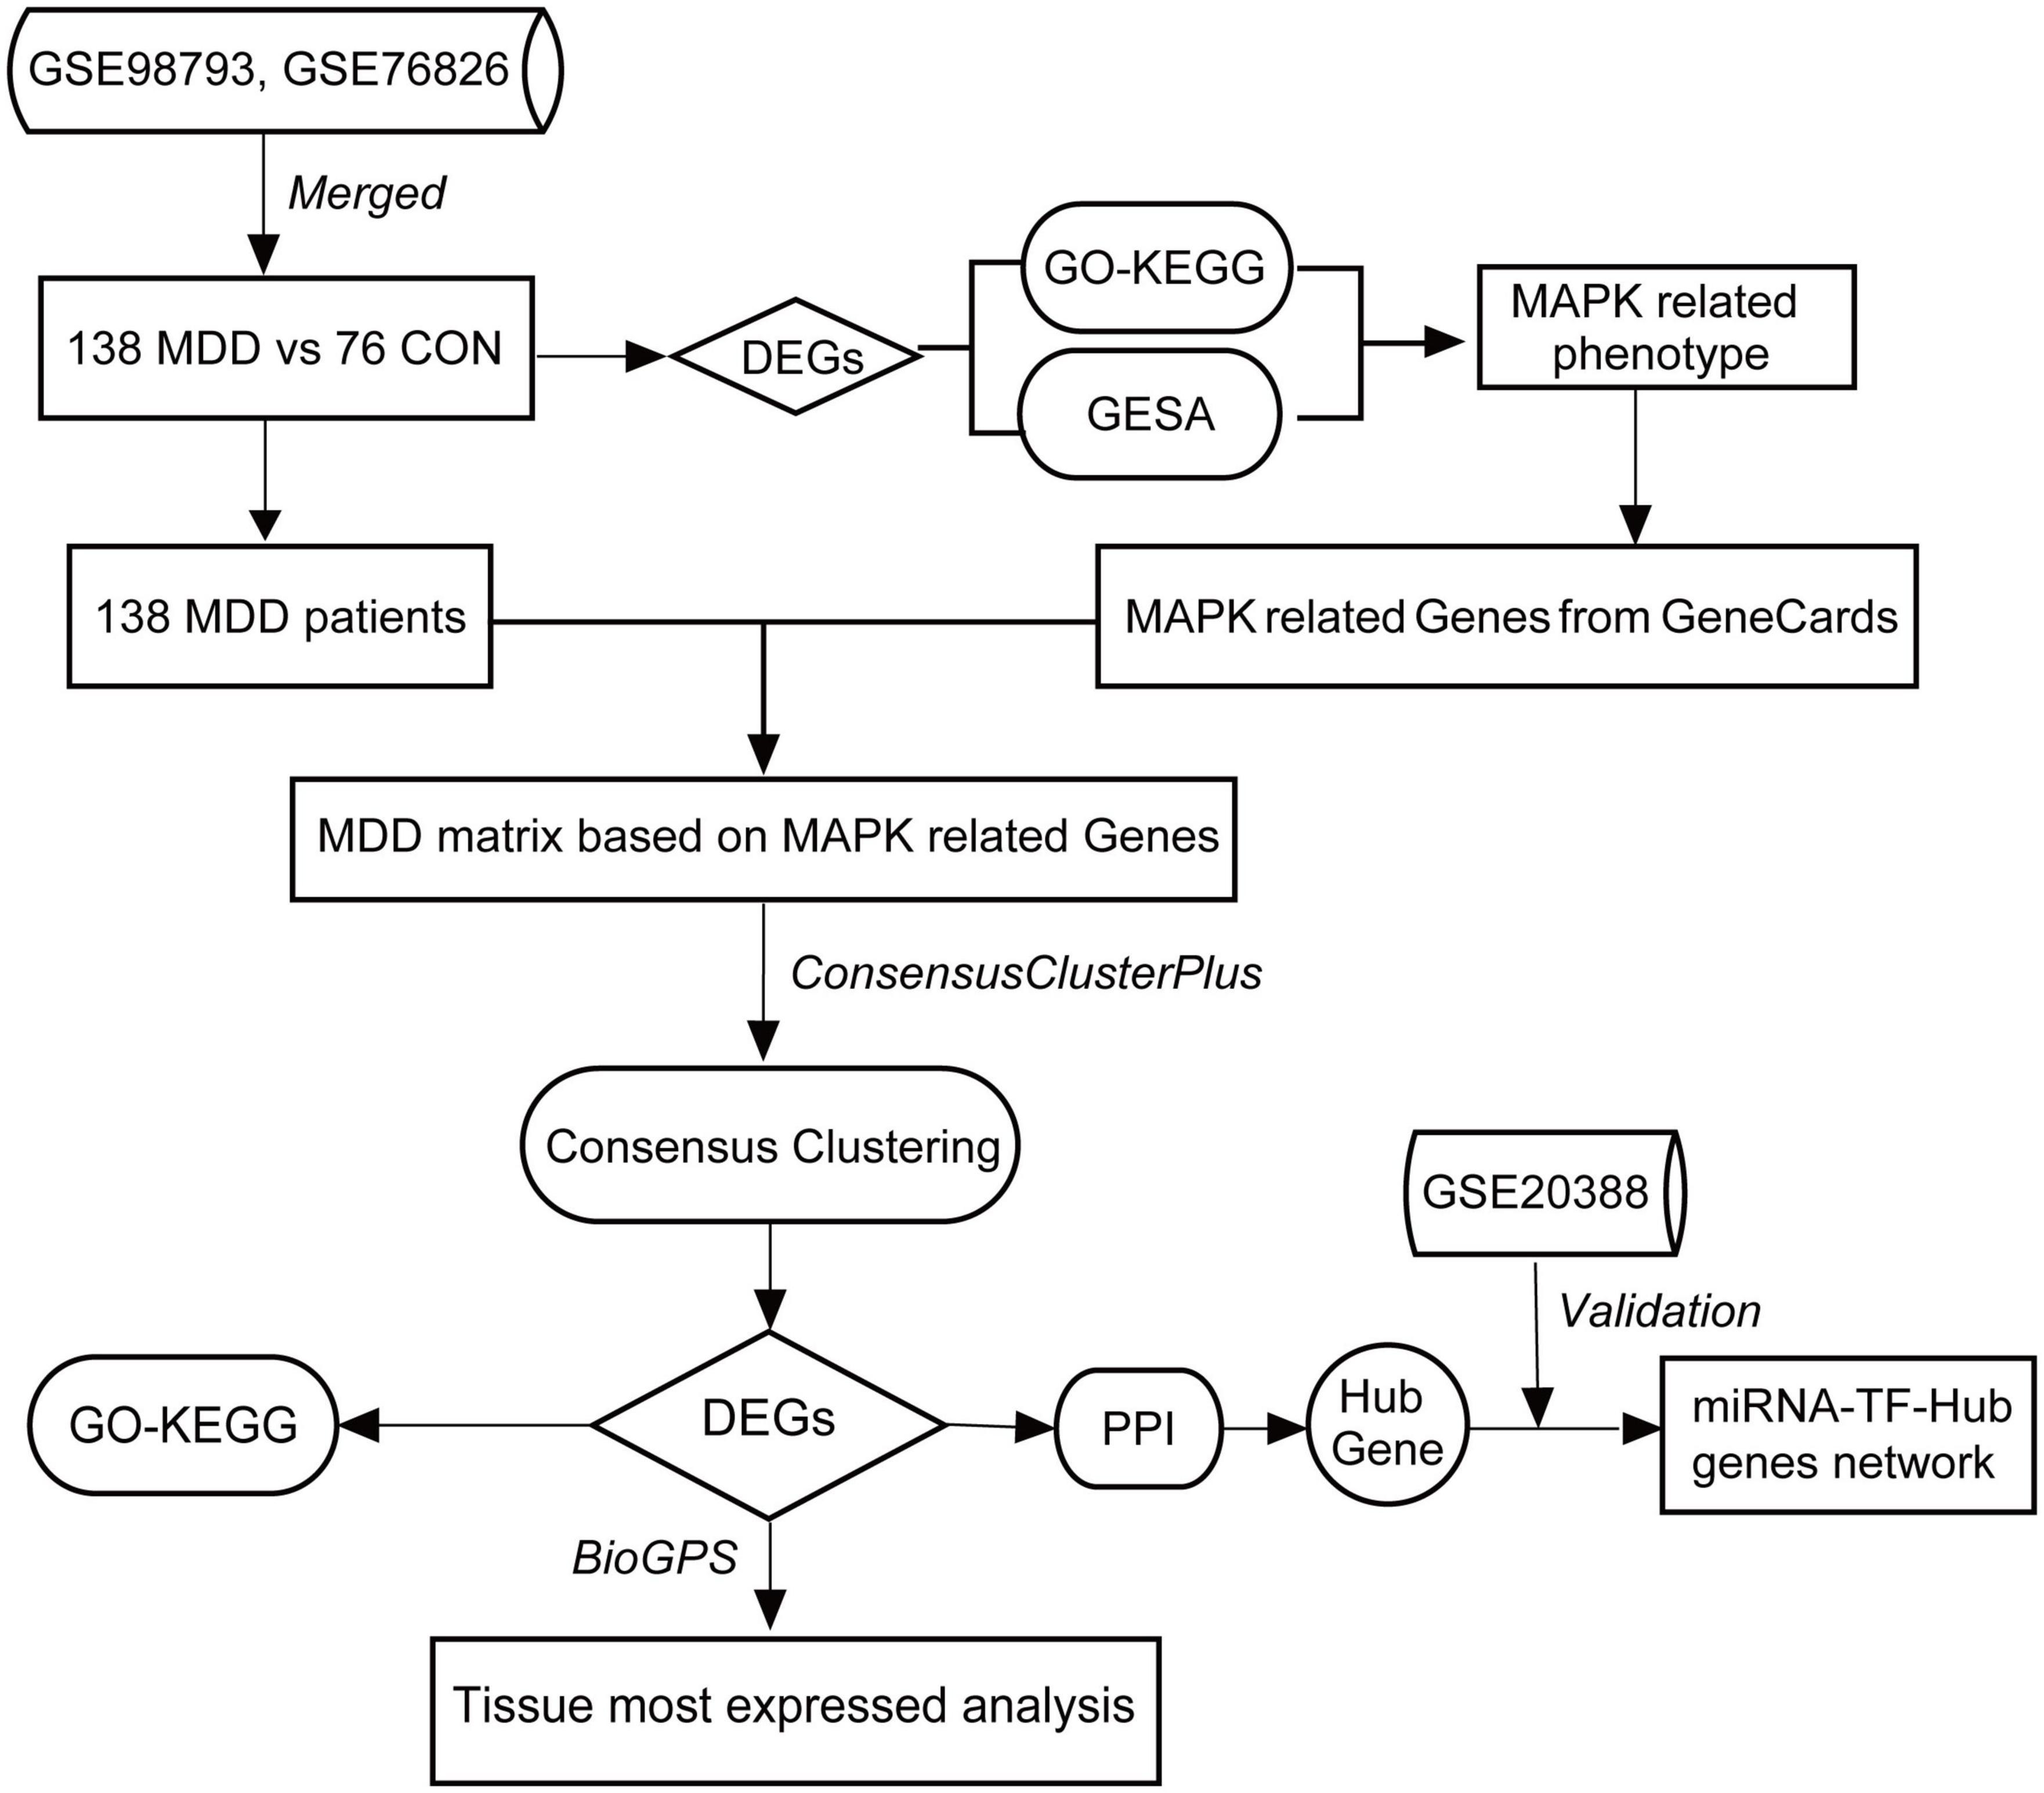
Figure 1. Flowchart of this study.
LIMMA package, meaning linear models for microarray data, was applied to distinguish DEGs between MDD patients and healthy controls in the integrated microarray expression matrix. Benjjammini-Hochberg’s method was used to control the false discovery rate (FDR). P-value < 0.05 and |log2 (fold change)| (|logFC|) > 0.3 were accepted as indicative of significant differences. Heatmap and volcano plots were constructed by the R packages “pheatmap” and “ggplot2.”
To further explore the potentially related pathway in MDD, we applied the “clusterProfiler” R package to perform gene set enrichment analysis (GSEA) (24). GO enrichment and KEGG pathway analyses. The “ggplot2” package visualized the results.
Based on the related mitogen-activated protein kinase (MAPK) pathway, we used the online resource Genecards to filter out the genes that may function in the MAPK pathway. The criteria for selection were listed as follows: category = “protein-coding,” score cut-off > 16. With the potential molecules in the MAPK pathway, we finally got a new correlative expression matrix through intersecting procession on the previously integrated matrix.
Major depressive disorder patients samples were selected for further analyses. The R package “ConsensusClusterPlus” (24) (V1.54.0; parameters: reps = 50, pItem = 0.8, pFeature = 1, distance = “pearson”) was used for unsupervised consensus analysis. The consistent matrix (CM) plots, cumulative distribution function (CDF) index plot, Delta area plot, and tracking plot were constructed to determine our preferred K value. It was considered the best optimal when the CDF index was up to the approximate maximum. Based on the previous MAPK-related genes expression matrix, we validated the classification by principal components analysis (PCA) using the “clusterProfiler” R package.
The Limma in R was again used to identify the DEGs between clusters. P-value < 0.05 and | log FC| > 0.5 were considered statistically significant. The volcano plot of DEGs was present using the “ggplot2” R package, and the heatmap of DEGs was shown using the “pheatmap” R package.
To identify the most related tissues in different clusters of MDD patients, we used the online database BioGPS3 to search for the distribution of the DEGs. The most related tissues should be the top three expressed tissues for each gene, which can be identified as having a certain degree of specificity: (1) the most related tissues-expression level was more than the median, and (2) the fourth related tissue expression was less than one-third as high as the third level.
In our study, functional enrichment analyses of DEGs containing GO terms and KEGG pathways were performed by “clusterProfiler” R package. Results with P-value < 0.05 were indicated as significant. The results of enrichment were further visualized by “ggplot2,” “ggnewscale,” and “enrichplot” packages in R.
We applied STRING4 online tool to predict DEGs’ protein-protein interaction (PPI) network. A combined score ≥ 0.4 of PPI pairs was considered significant. The network of PPI was then sent to Cytoscape software (Version: 3.7.1) for visualization and subsequent analyses. Cytohubba application in Cytoscape was employed to identify the top 6 hub genes ranked by the MCC method (25). Moreover, the degree of each protein node was assessed by MCODE application in Cytoscape (26). Default criteria in MCODE plug-in were set as follows: Degree Cutoff = 2, Node Score Cutoff = 0.2, K-Core = 2, and Max. Depth = 100. We finally identified one module with 13 key genes, and their connection relation was visualized as a Sankey diagram plot by the “ggalluvial” R package.
To validate the expression of hub genes identified, we obtained another microarray dataset from GEO, GSE20388, an expression profile of a genetic animal model of depression. Eighteen samples from Flinders Depression Sensitive (FSL) cohort and 22 control samples from Flinders Depression Resistant (FRL) cohort were selected. All these samples were located in the Frontal Cortex. GEO2R, a functional tool in GEO,5 was used to verify the differential expression of hub genes. P-value of <0.05 was accepted as the significant threshold.
To further illustrate the potential regulation network for the hub genes, we first applied three TF databases, including the ChEA3 online database,6 hTFtarget online database,7 and KnockTF online database8 to predict the transcription factors. A transcription factor would be included in the network only when it was indicated in more than two databases. We then intersected the TFs of the three hub genes and further predicted the upstream miRNAs for these common transcription factors using the ENCORI database (27). MiRNAs confirmed in the miRanda and TargetScan databases were selected. Finally, the network of miRNA-TF-hub genes was demonstrated using the Cytoscape software (Version: 3.7.1).
From the GEO database, we obtained expression profiles from GSE98793 and GSE76826. With the preprocessing of the data mentioned above, we finally got a brand-new integrated microarray expression matrix with 6,989 genes and 214 samples (138 MDD patients and 76 healthy controls). Boxplot analysis indicated the effect of our data cleaning (Figures 2A,B).
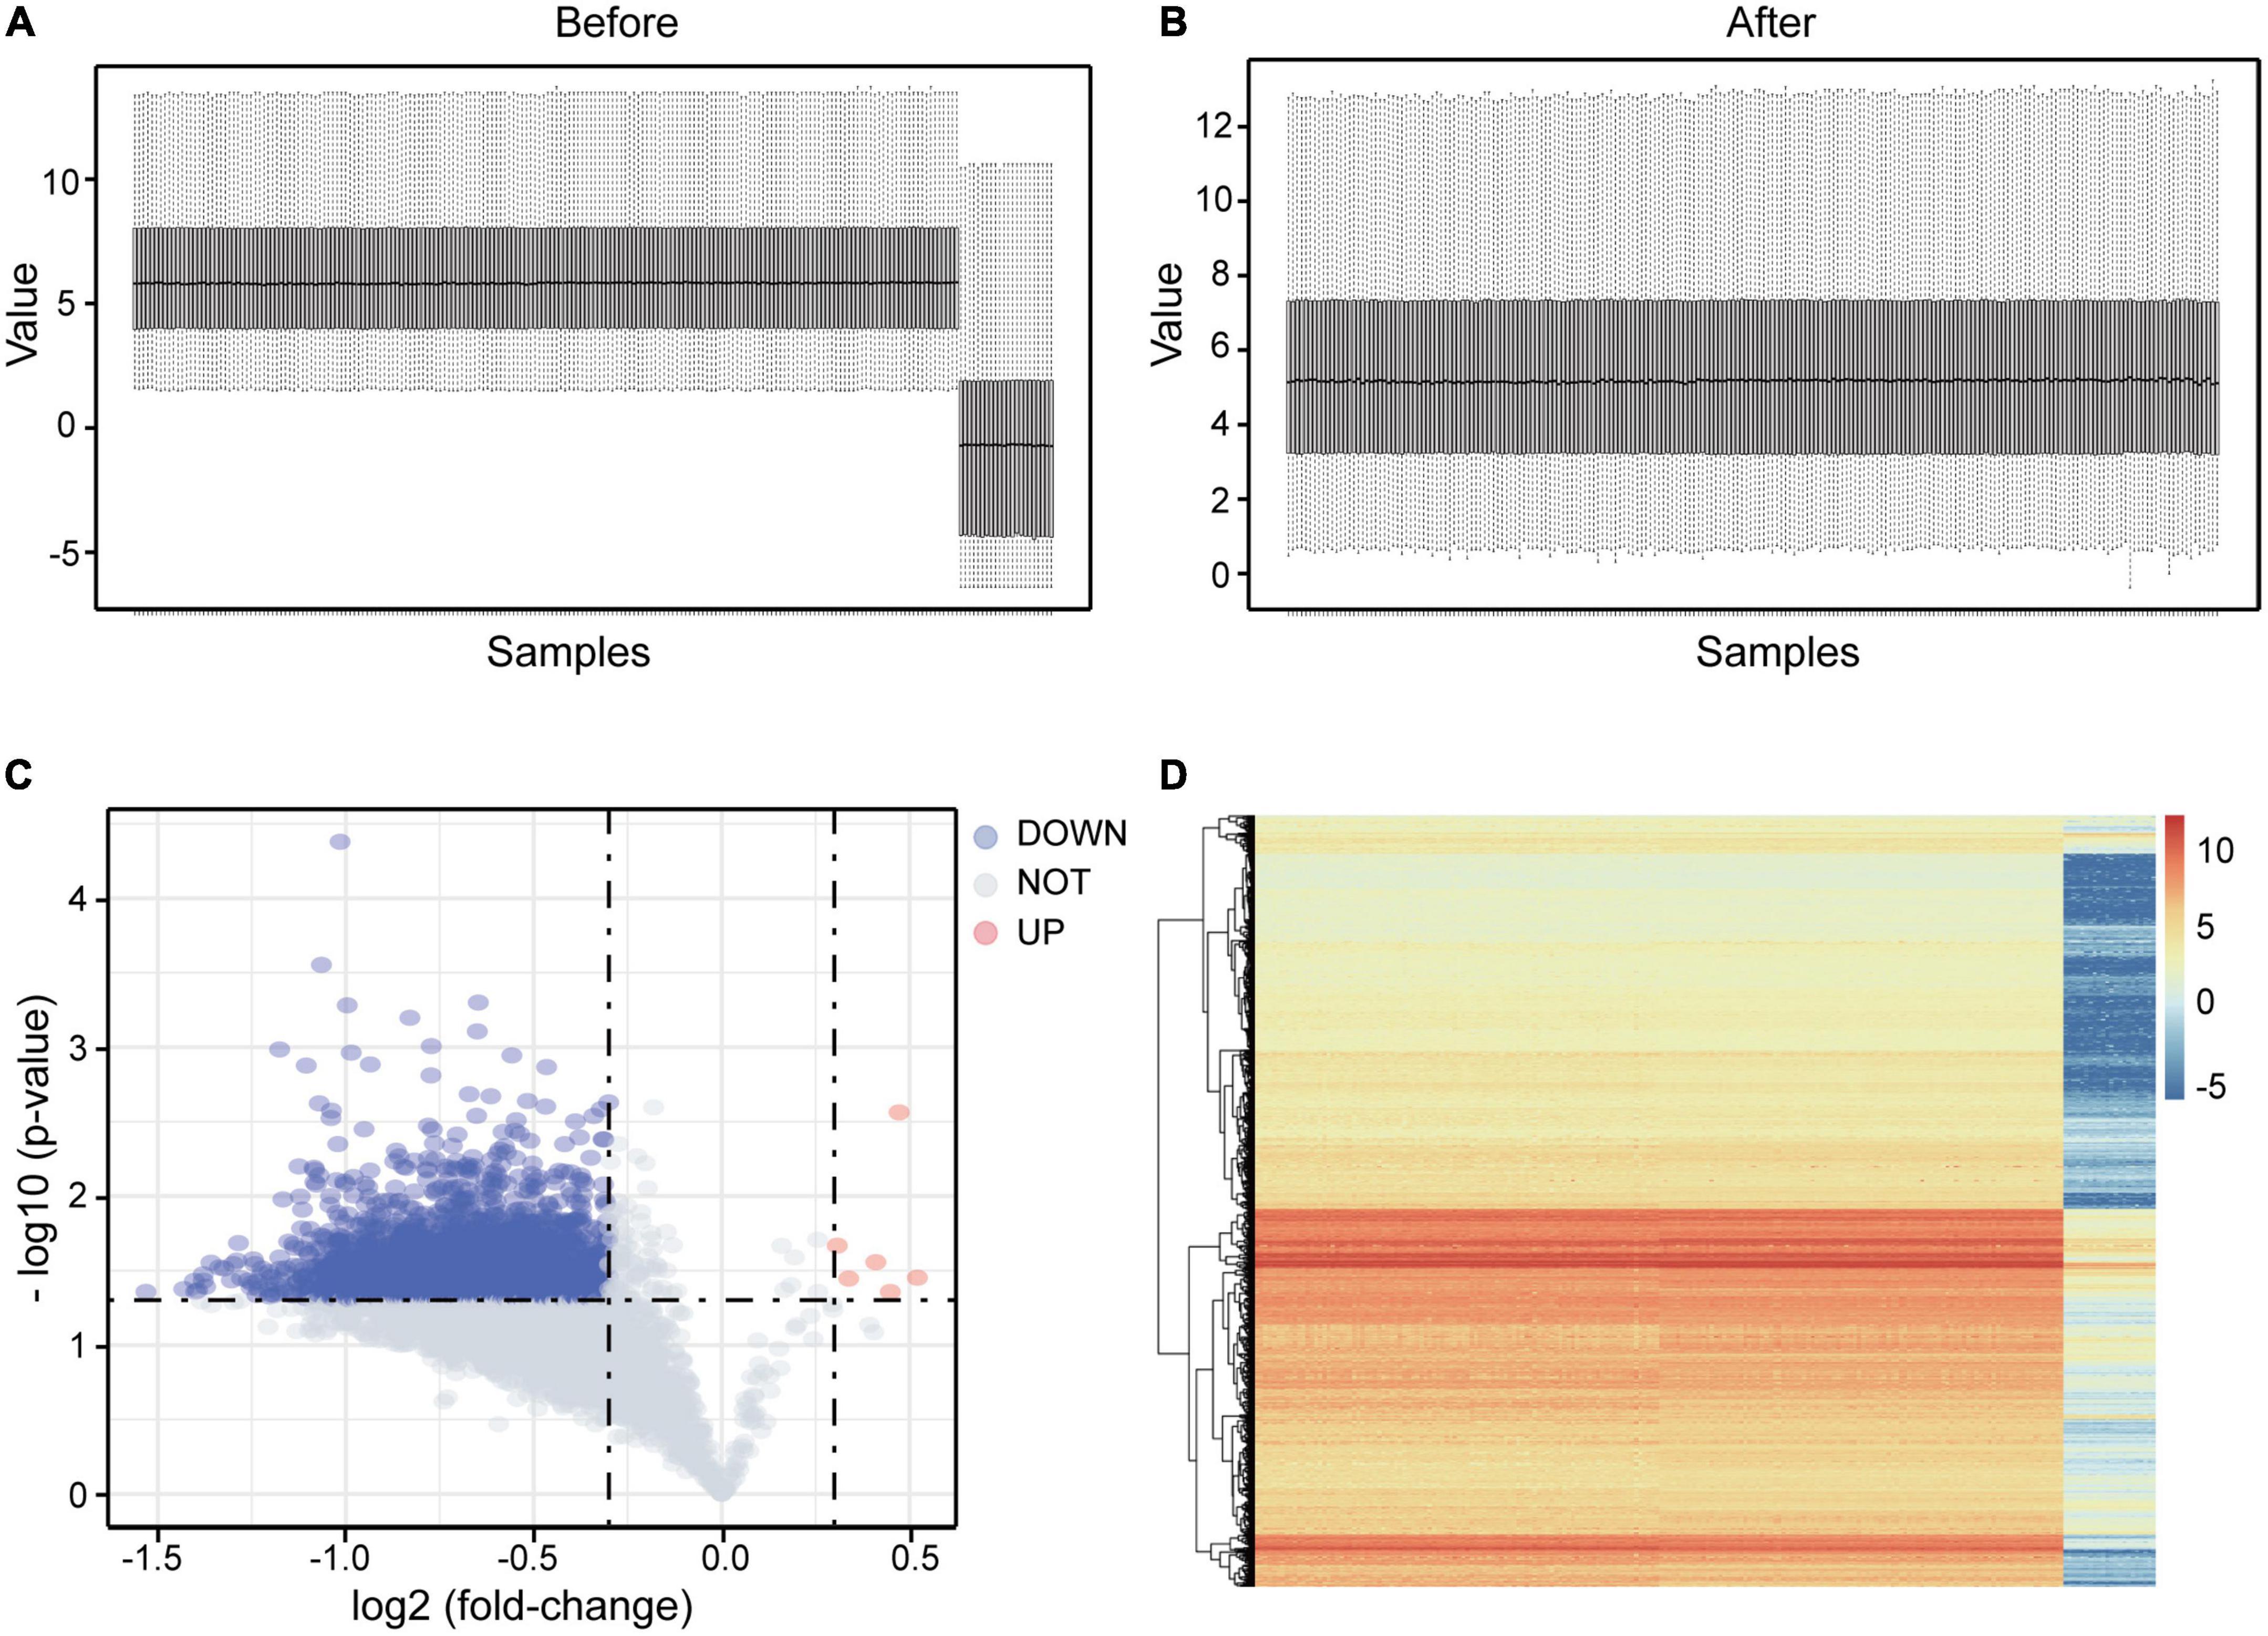
Figure 2. DEGs screening in integrated microarray of GSE98793 and GSE76826. (A) The boxplot showed an obvious batch effect before the data merged. (B) The boxplot showed the pleasant effect of data cleaning. (C) Volcano plot of the integrated exprSet. Data points in red represent up-regulated, and blue represent down-regulated genes. (D) Heatmap of DEGs identified in integrated microarray. Legend on the top right indicates the change of the genes.
Based on the limma package and previously set thresholds, a total of 3,122 DEGs for further enrichment were identified, including 3,116 down-regulated and 6 up-regulated DEGs. The volcano plot of DEGs was presented in Figure 2C, and the heatmap plot was shown in Figure 2D.
Gene set enrichment analysis was first performed to explore the most associated pathway. As Figure 3A shown, “ion channel activity,” “passive transmembrane transporter activity,” and “epidermis cell development” were the top GO terms enriched, while there was only MAPK signaling pathway enriched in Figure 3B. Further GO analysis also demonstrated that DEGs were mainly attributed to neuron regulation and different ion channel activities such as “axon development,” “passive transmembrane transporter activity,” “protein serine/threonine kinase activity,” and “gated channel activity” (Figures 3C,D; Supplementary Table 2). The pathway enrichment analysis indicated that the DEGs were enriched in the pathways such as “MAPK signaling pathway,” “Axon guidance,” “Focal adhesion,” and “Human papillomavirus infection” (Figures 3E,F; Supplementary Table 3). Considering all these results, we regarded the “MAPK pathway” as the most significantly enriched pathway in MDD.
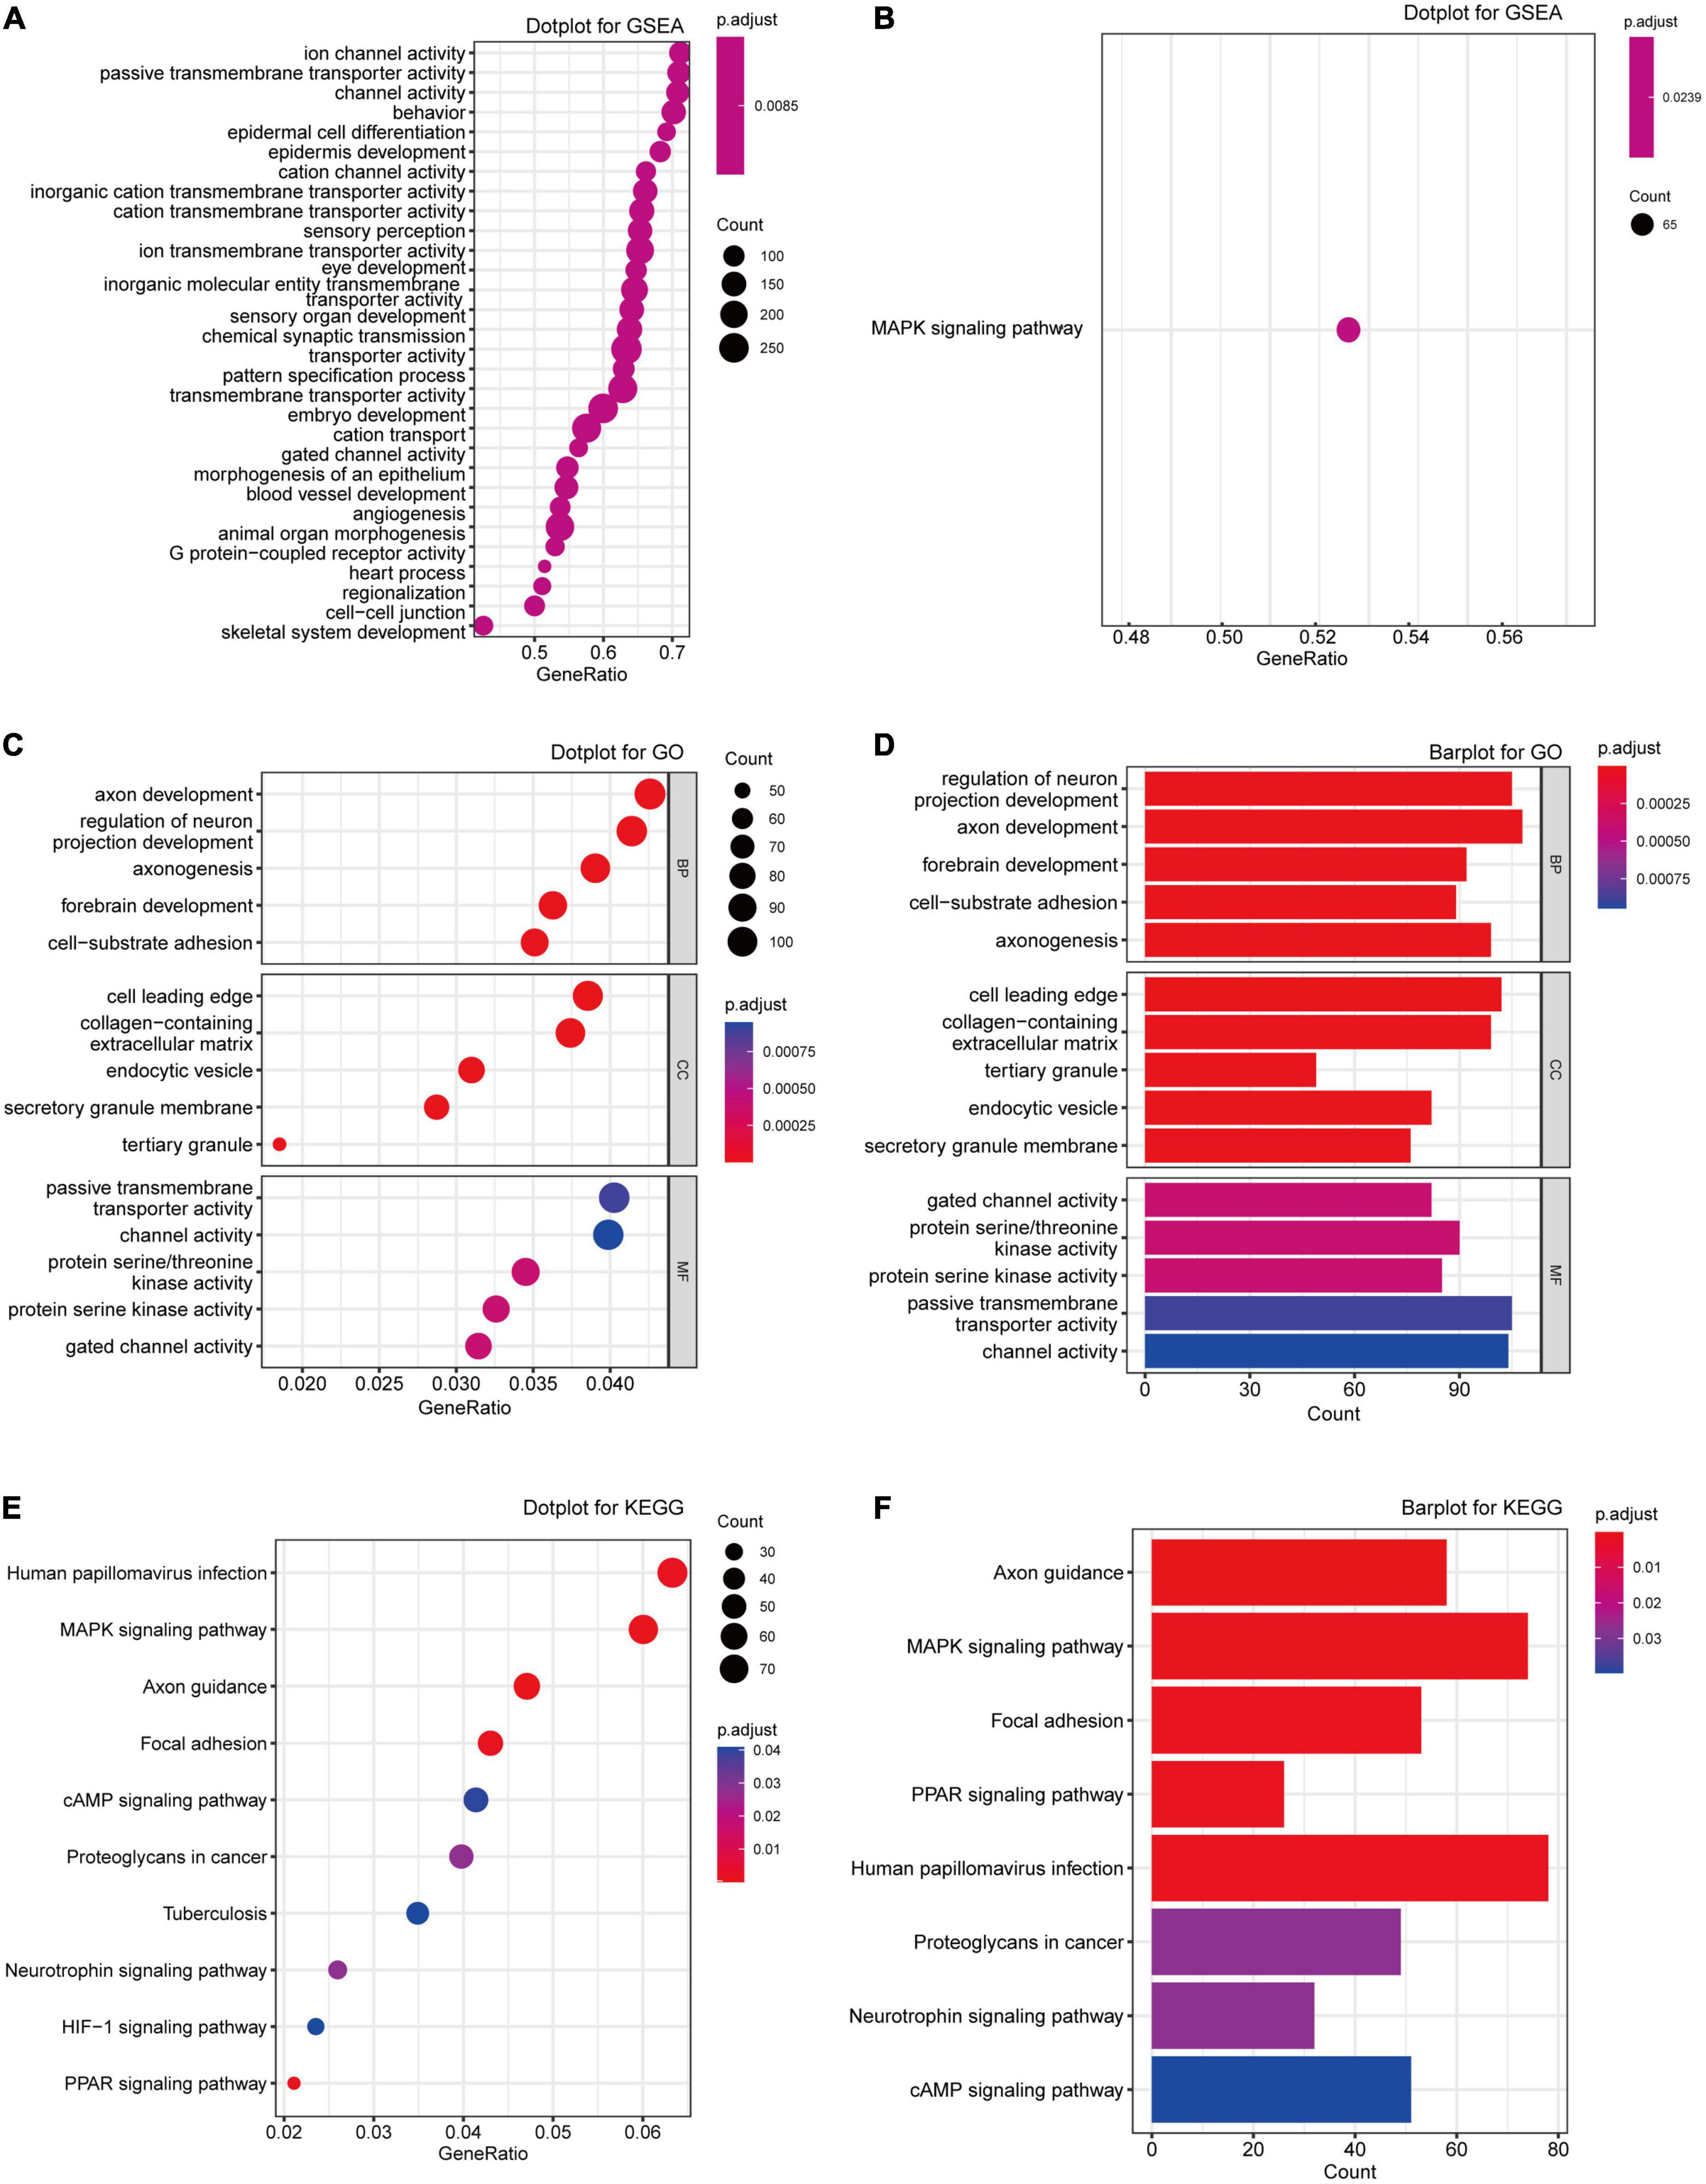
Figure 3. Enrichment analyses of the DEGs from exprset-merged. (A,B) GSEA analysis of the DEGs from exprset-merged. (C,D) GO enrichment analyses of the DEGs. (E,F) KEGG pathway enrichment analysis of the DEGs.
Based on the MAPK signaling pathway, we searched associated genes in GeneCards. With the score cut-off > 16, we identified 30 genes for analysis (Supplementary Table 4). We then removed healthy control samples from the previous matrix. Subsequently, we conducted intersecting procession on a newly integrated matrix and obtained a MAPK-associated gene expression profile with 19 rows and 138 columns (Supplementary Table 5).
To better characterize the MAPK-associated gene expression of 138 MDD samples, we applied the consensus clustering method to classify the patients. From the outcomes, the CM plot showed the maximum consistency at k = 2 (Figures 4A–C). When K = 2, the consensus CDF curve (Figure 4D), the Delta area plot (Figure 4E), tracking plot (Figure 4F) and item consensus plot (Supplementary Figure 1) consistently displayed the cluster stability. Thus, two subgroups named cluster 1 (64 MDD patients) and cluster 2 (74 MDD patients) were identified. Principal component analysis (PCA) also validated the differences between subgroups (Supplementary Figure 2).
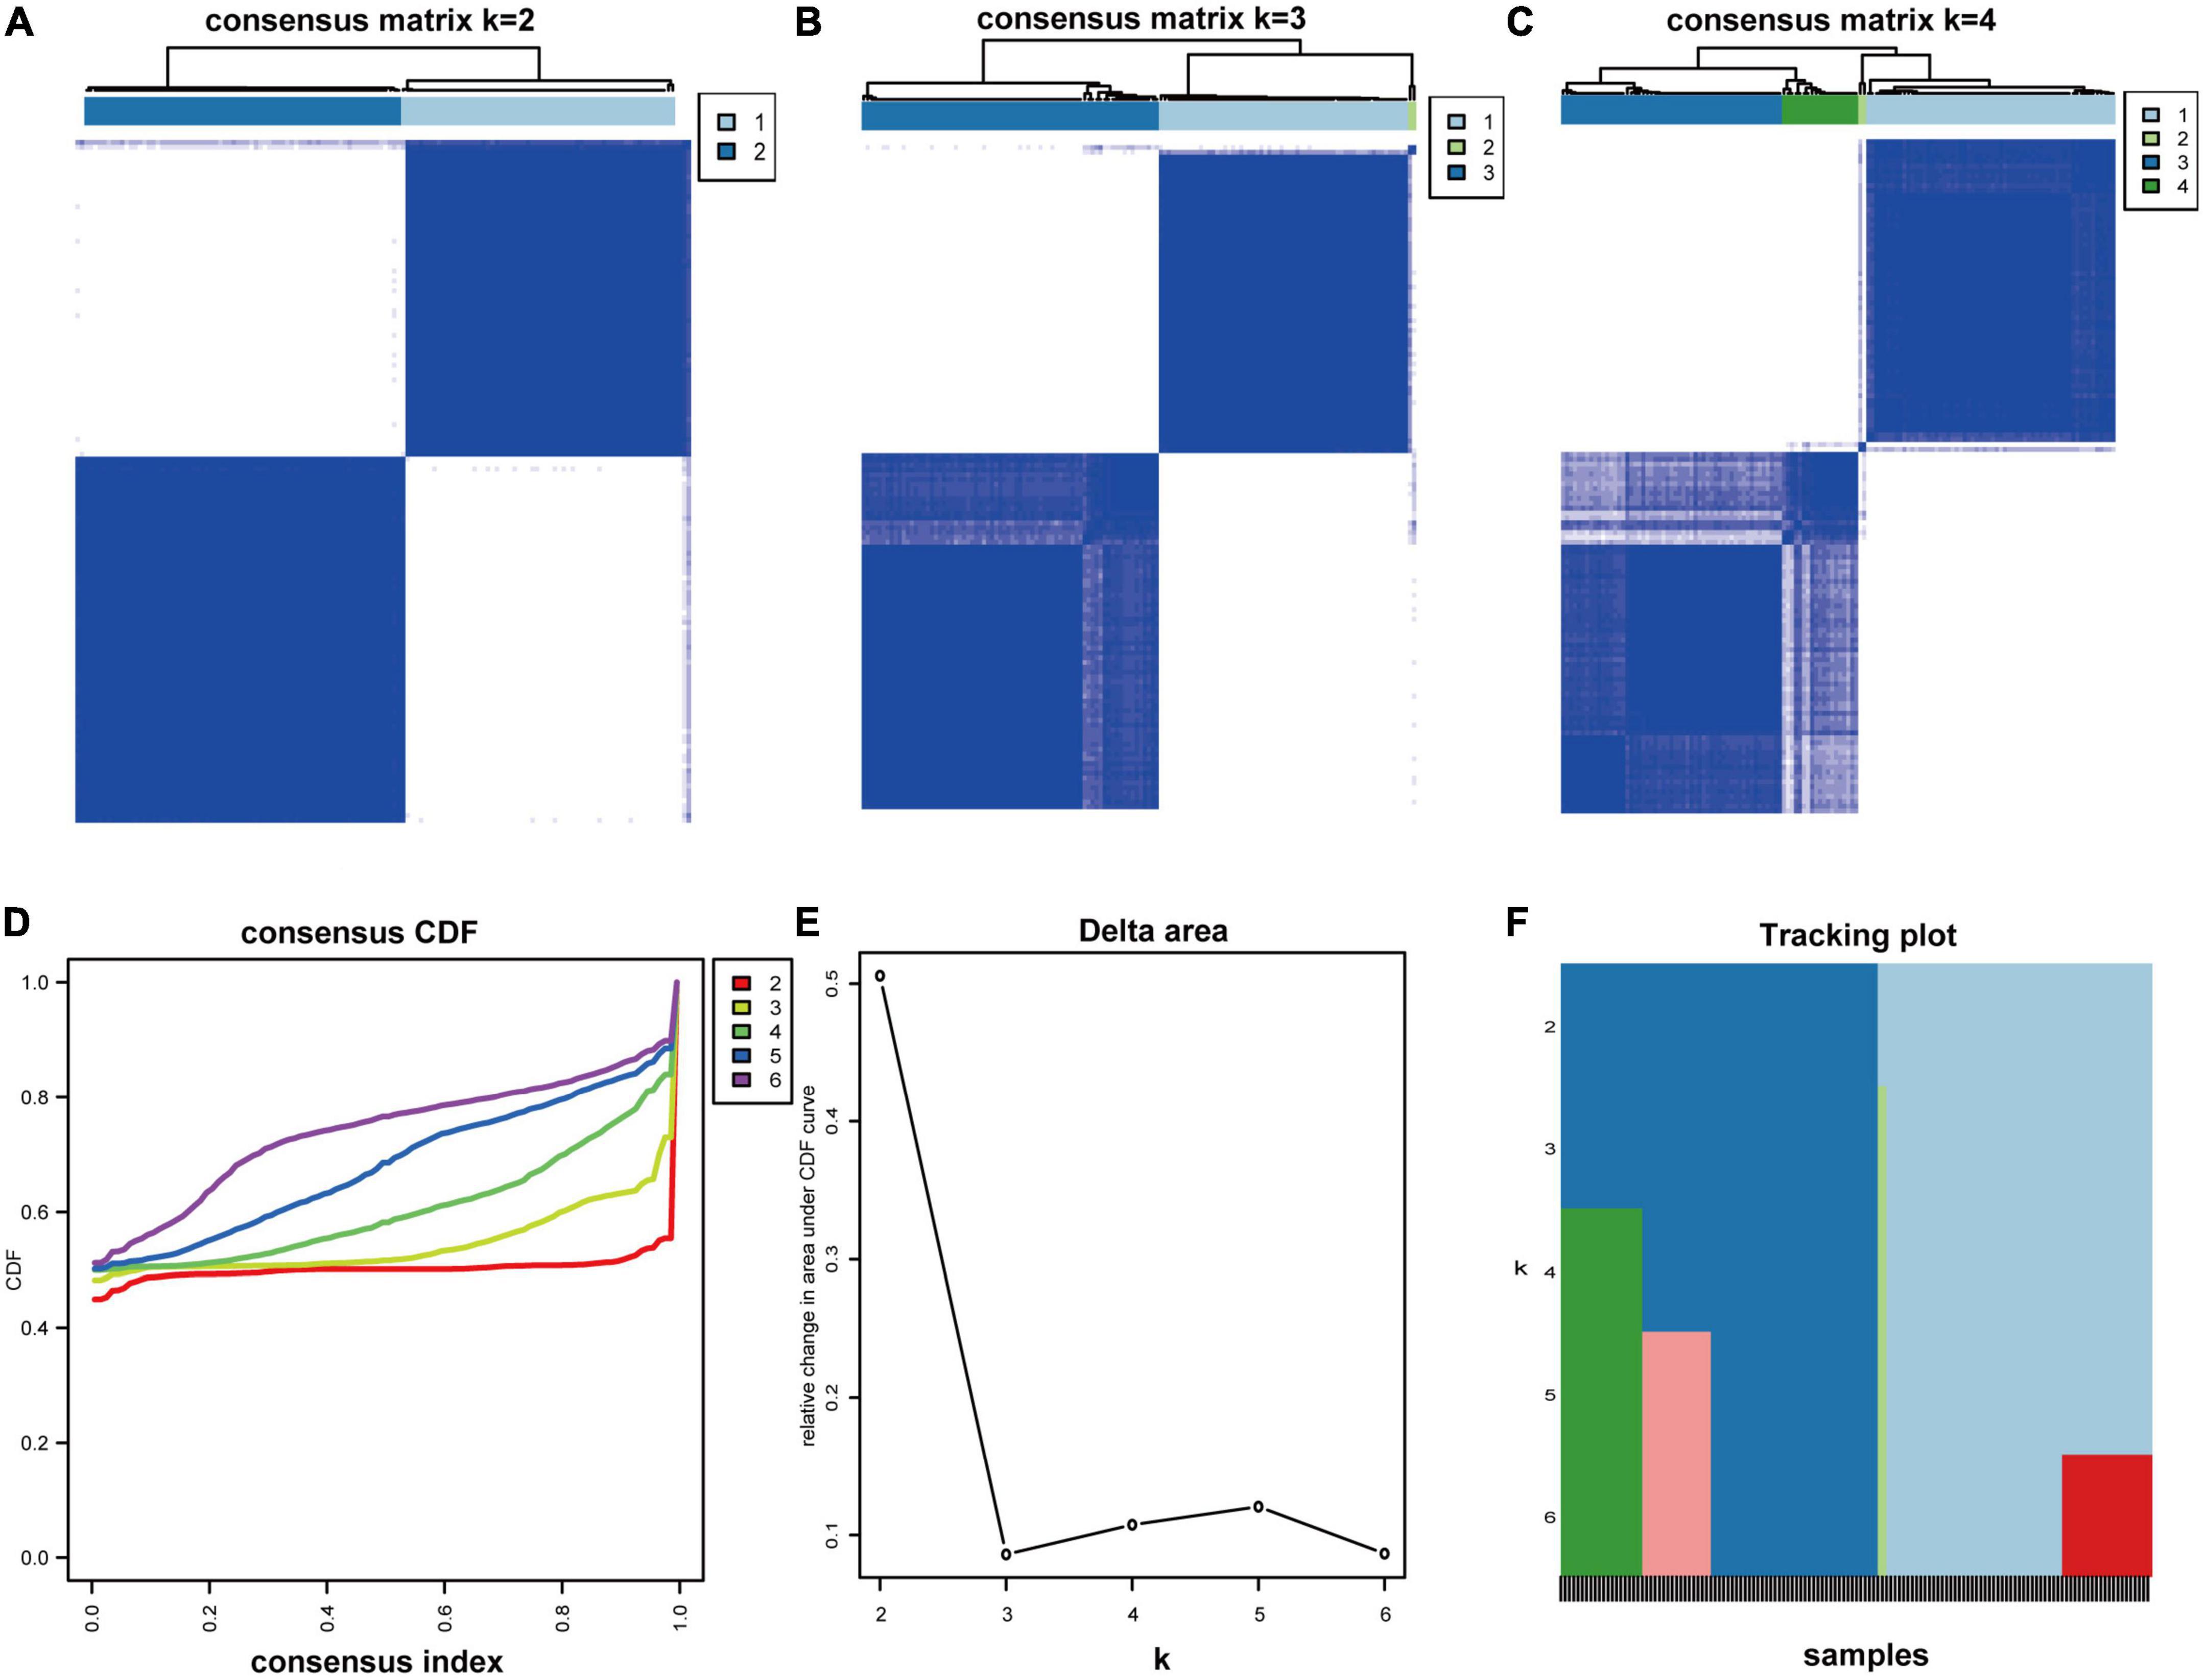
Figure 4. Consensus clustering analysis. (A–C) Consensus matrix for k = 2 to k = 4. (D) The CDF value of the consensus index. (E) Relative change in area under CDF curve for k = 2–6. (F) The tracking plot for k = 2 to k = 6.
Limma R package was then used to identify the DEGs. Statistical significance was defined as P-value < 0.05 and | logFC| > 0.5. Thirteen DEGs were finally determined to be significant, including 13 down-regulated genes but no up-regulated genes. The DEGs were further visualized by a volcano plot (Figure 5A) and a heatmap plot (Figure 5B).
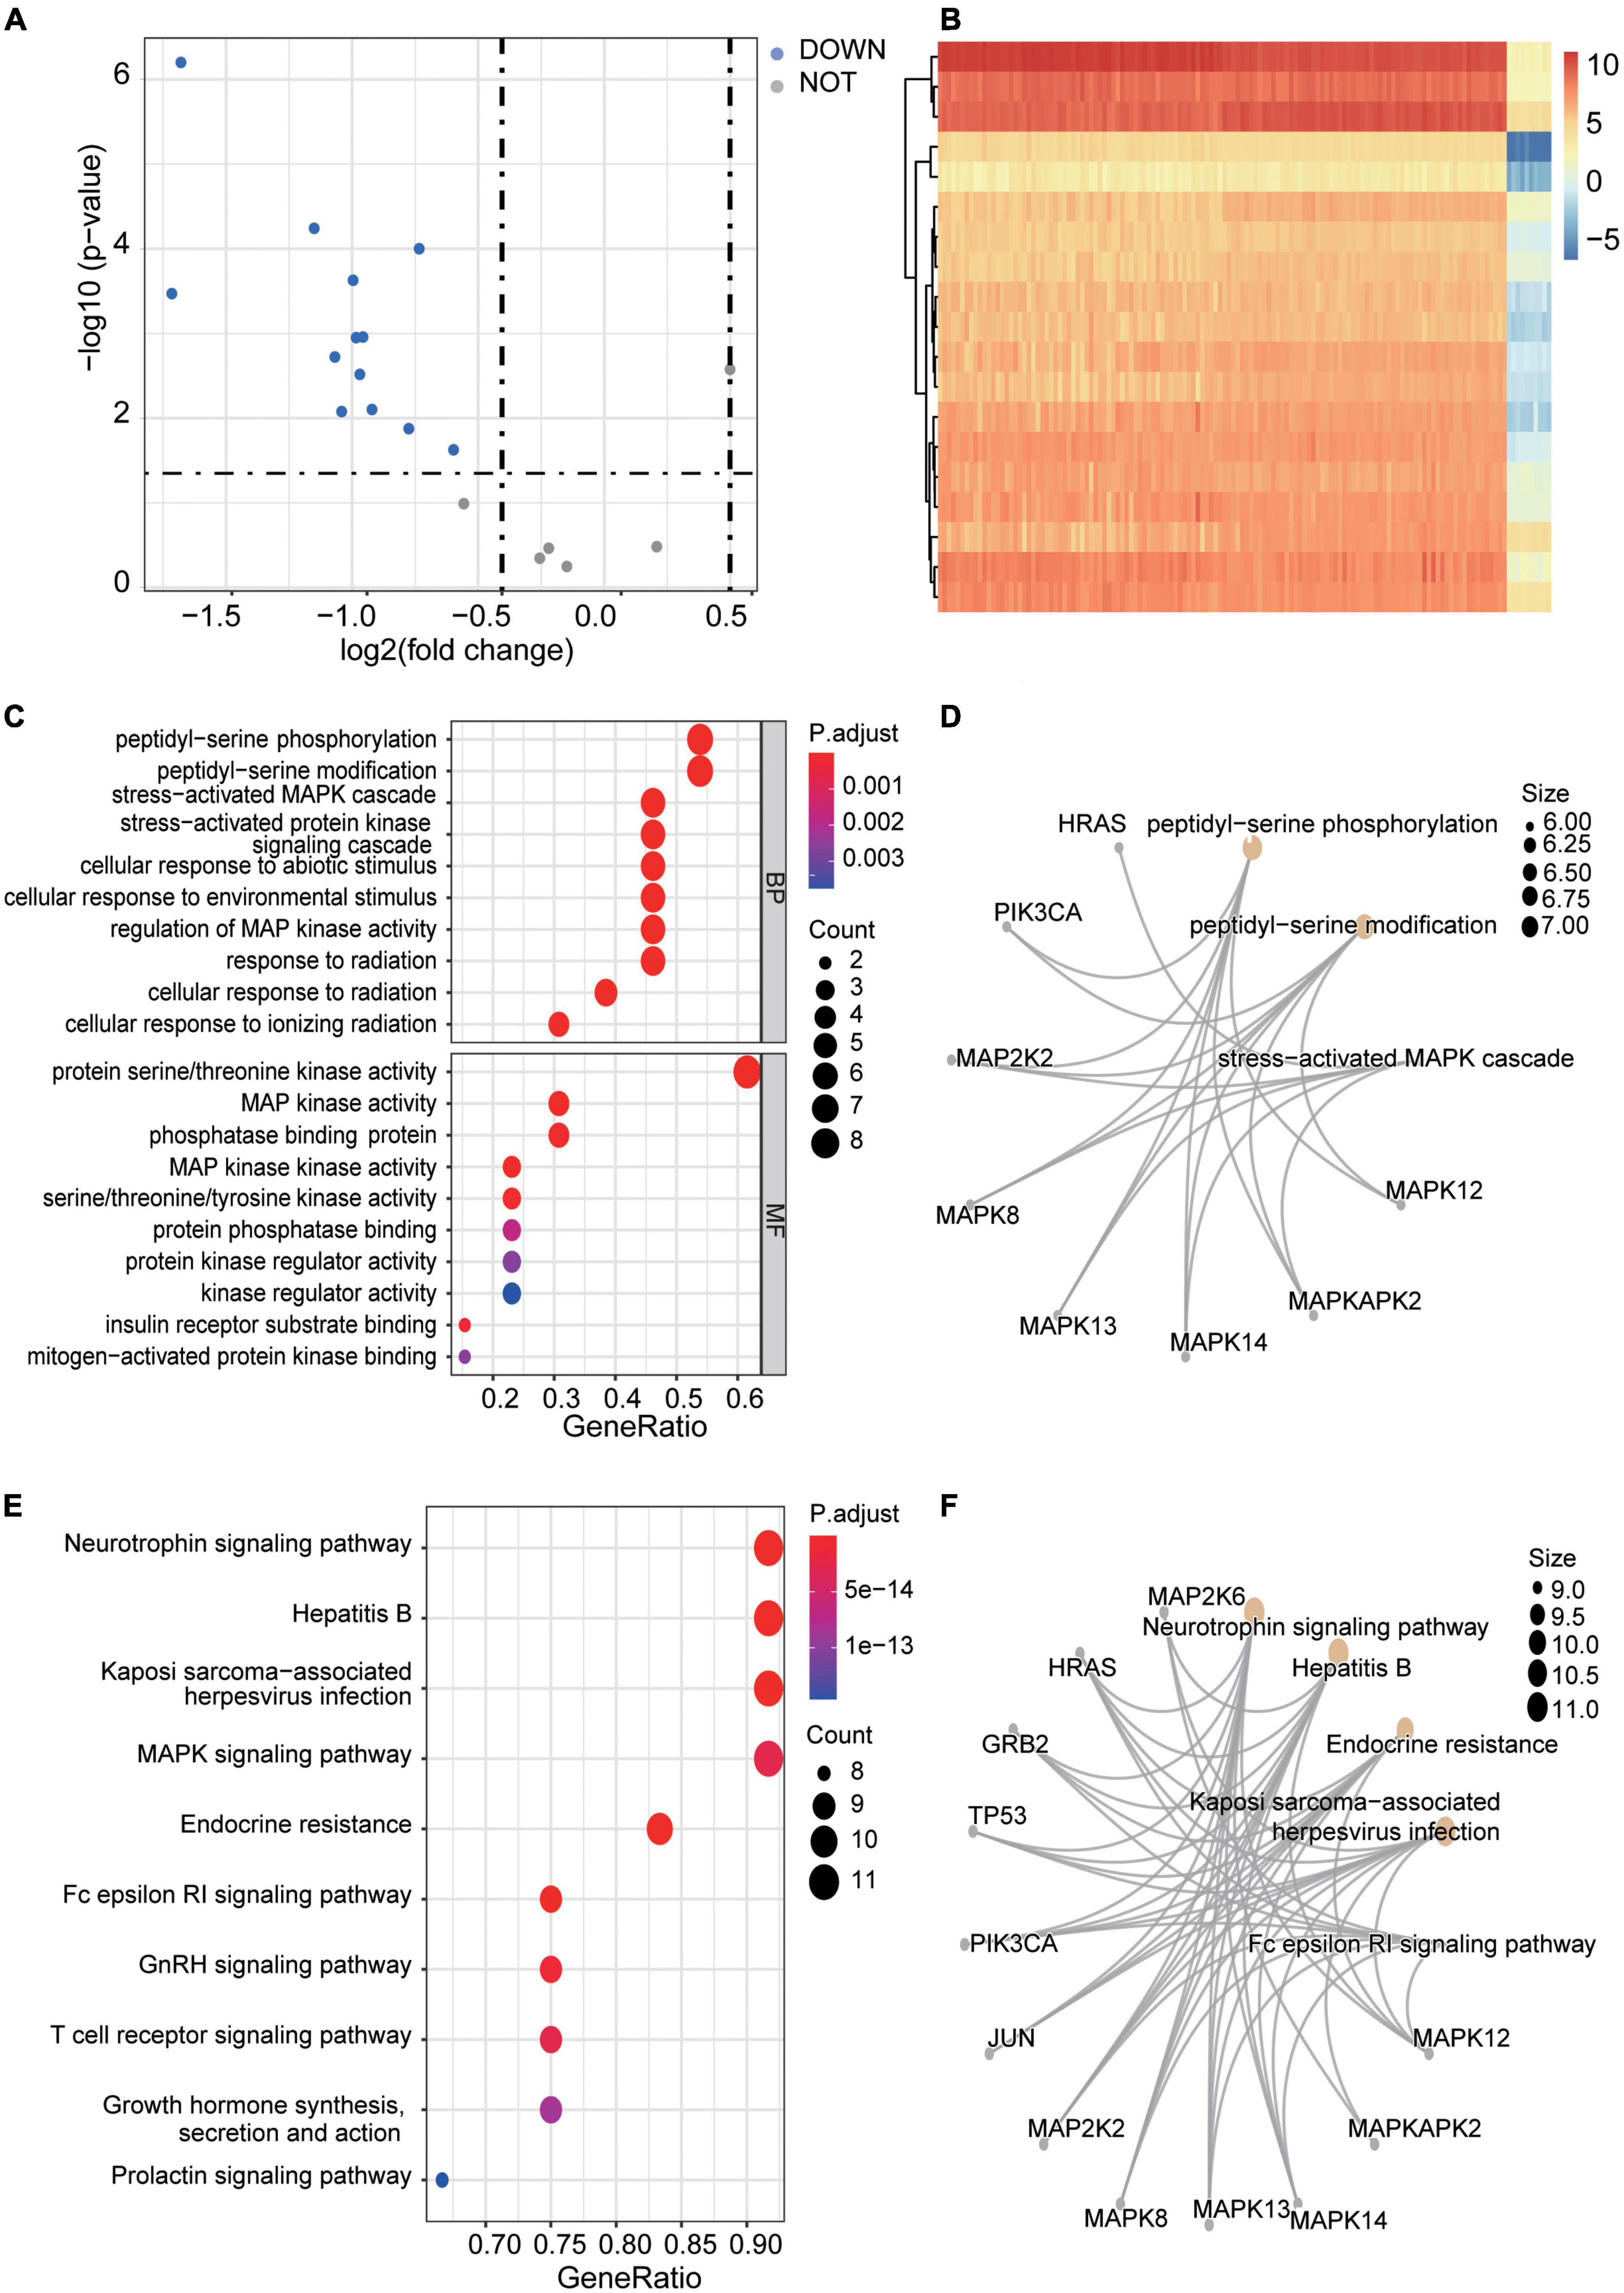
Figure 5. DEGs identification in subtypes and enrichment analyses. (A) A Volcano plot of the DEGs of exprSet after clustering. The blue nodes represent down-regulated DEGs. The dark nodes indicate Stable-genes. There is no up-regulated gene. (B) A heatmap of all DEGs of exprSet. Each column represents one sample, and each row represents one gene. The color changes from blue to red represents the changes from downregulation to upregulation for the expression. (C,D) The visualization of the results of GO enrichment analyses. (E,F) The visualization of the results of the KEGG pathway enrichment analysis.
To better know what symptoms the DEGs between different clusters may cause, we searched our DEGs in BioGPS. The most highly tissue-related expression system was the Immune system (46.2%, 6/13), while the circulatory system ranked second (38.5%, 5/13). Besides, neurological system (23.1%, 3/13) and respiratory system (23.1%, 3/13), endocrine system (15.3%, 2/13) and reproductive system (15.3%, 2/13) had similar levels of enrichment (Table 1).
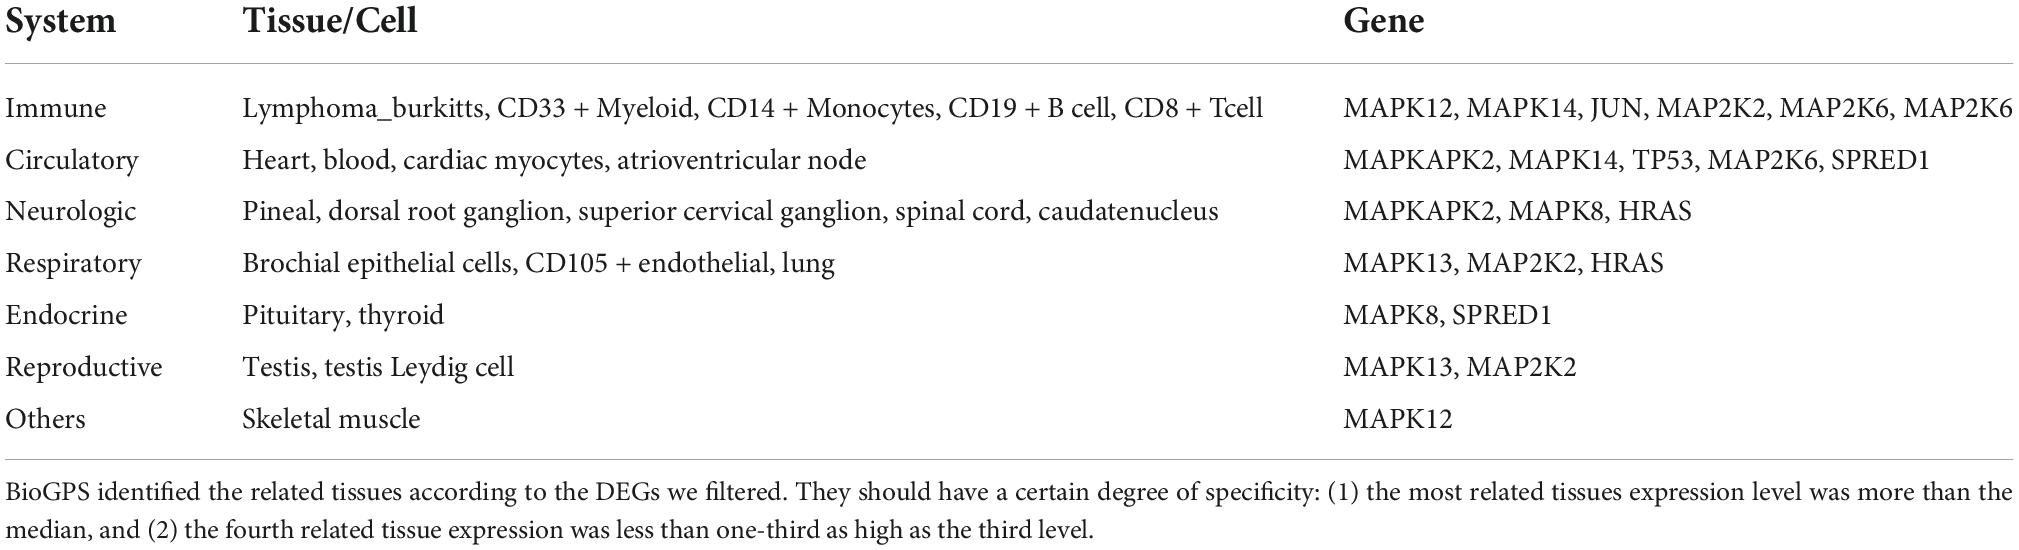
Table 1. The most related tissues identified by BioGPS.
Functional enrichment analyses of 13 DEGs were conducted. Results showed that DEGs were mainly enriched in “peptidyl-serine phosphorylation,” “peptidyl-serine modification,” “stress-activated MAPK cascade,” “stress-activated protein kinase signaling cascade,” “cellular response to abiotic stimulus,” and “protein serine/threonine kinase activity” (Figures 5C,D). P < 0.05 and enriched genes count > 5 were further set as screening criteria, the top 6 GO terms were additionally present in Supplementary Table 6. Meanwhile, 13 DEGs were also found enriched in some pathways like “Neurotrophin signaling pathway,” “Hepatitis B infection,” “MAPK signaling pathway,” “Endocrine resistance,” and “Fc epsilon RI signaling pathway” et al. (Figures 5E,F). Further, the top 6 enriched KEGG pathways with enriched genes count > 8 were further screened and shown in Supplementary Table 7.
From the STRING database (see text footnote 4), we identified a PPI network consisting of 13 nodes meaning DEGs and 52 edges to display their relationship. PPI network was further imported into Cytoscape for visualization (Figure 6A) and subsequent analysis. Cytohubba application in Cytoscape was applied to identify the top 6 hub genes by the MCC method (Figure 6B). TP53, MAPK12, MAPK14, JUN, MAPK8, and HRAS were screened with the highest connectivity. Then, we further identified a notably significant cluster of 11 genes, including GRB2, HRAS, JUN, MAP2K2, MAP2K6, MAPK12, MAPK13, MAPK14, MAPK8, MAPKAPK2, and TP53. The result of the module was presented as a Sankey diagram plot (Figure 6C).
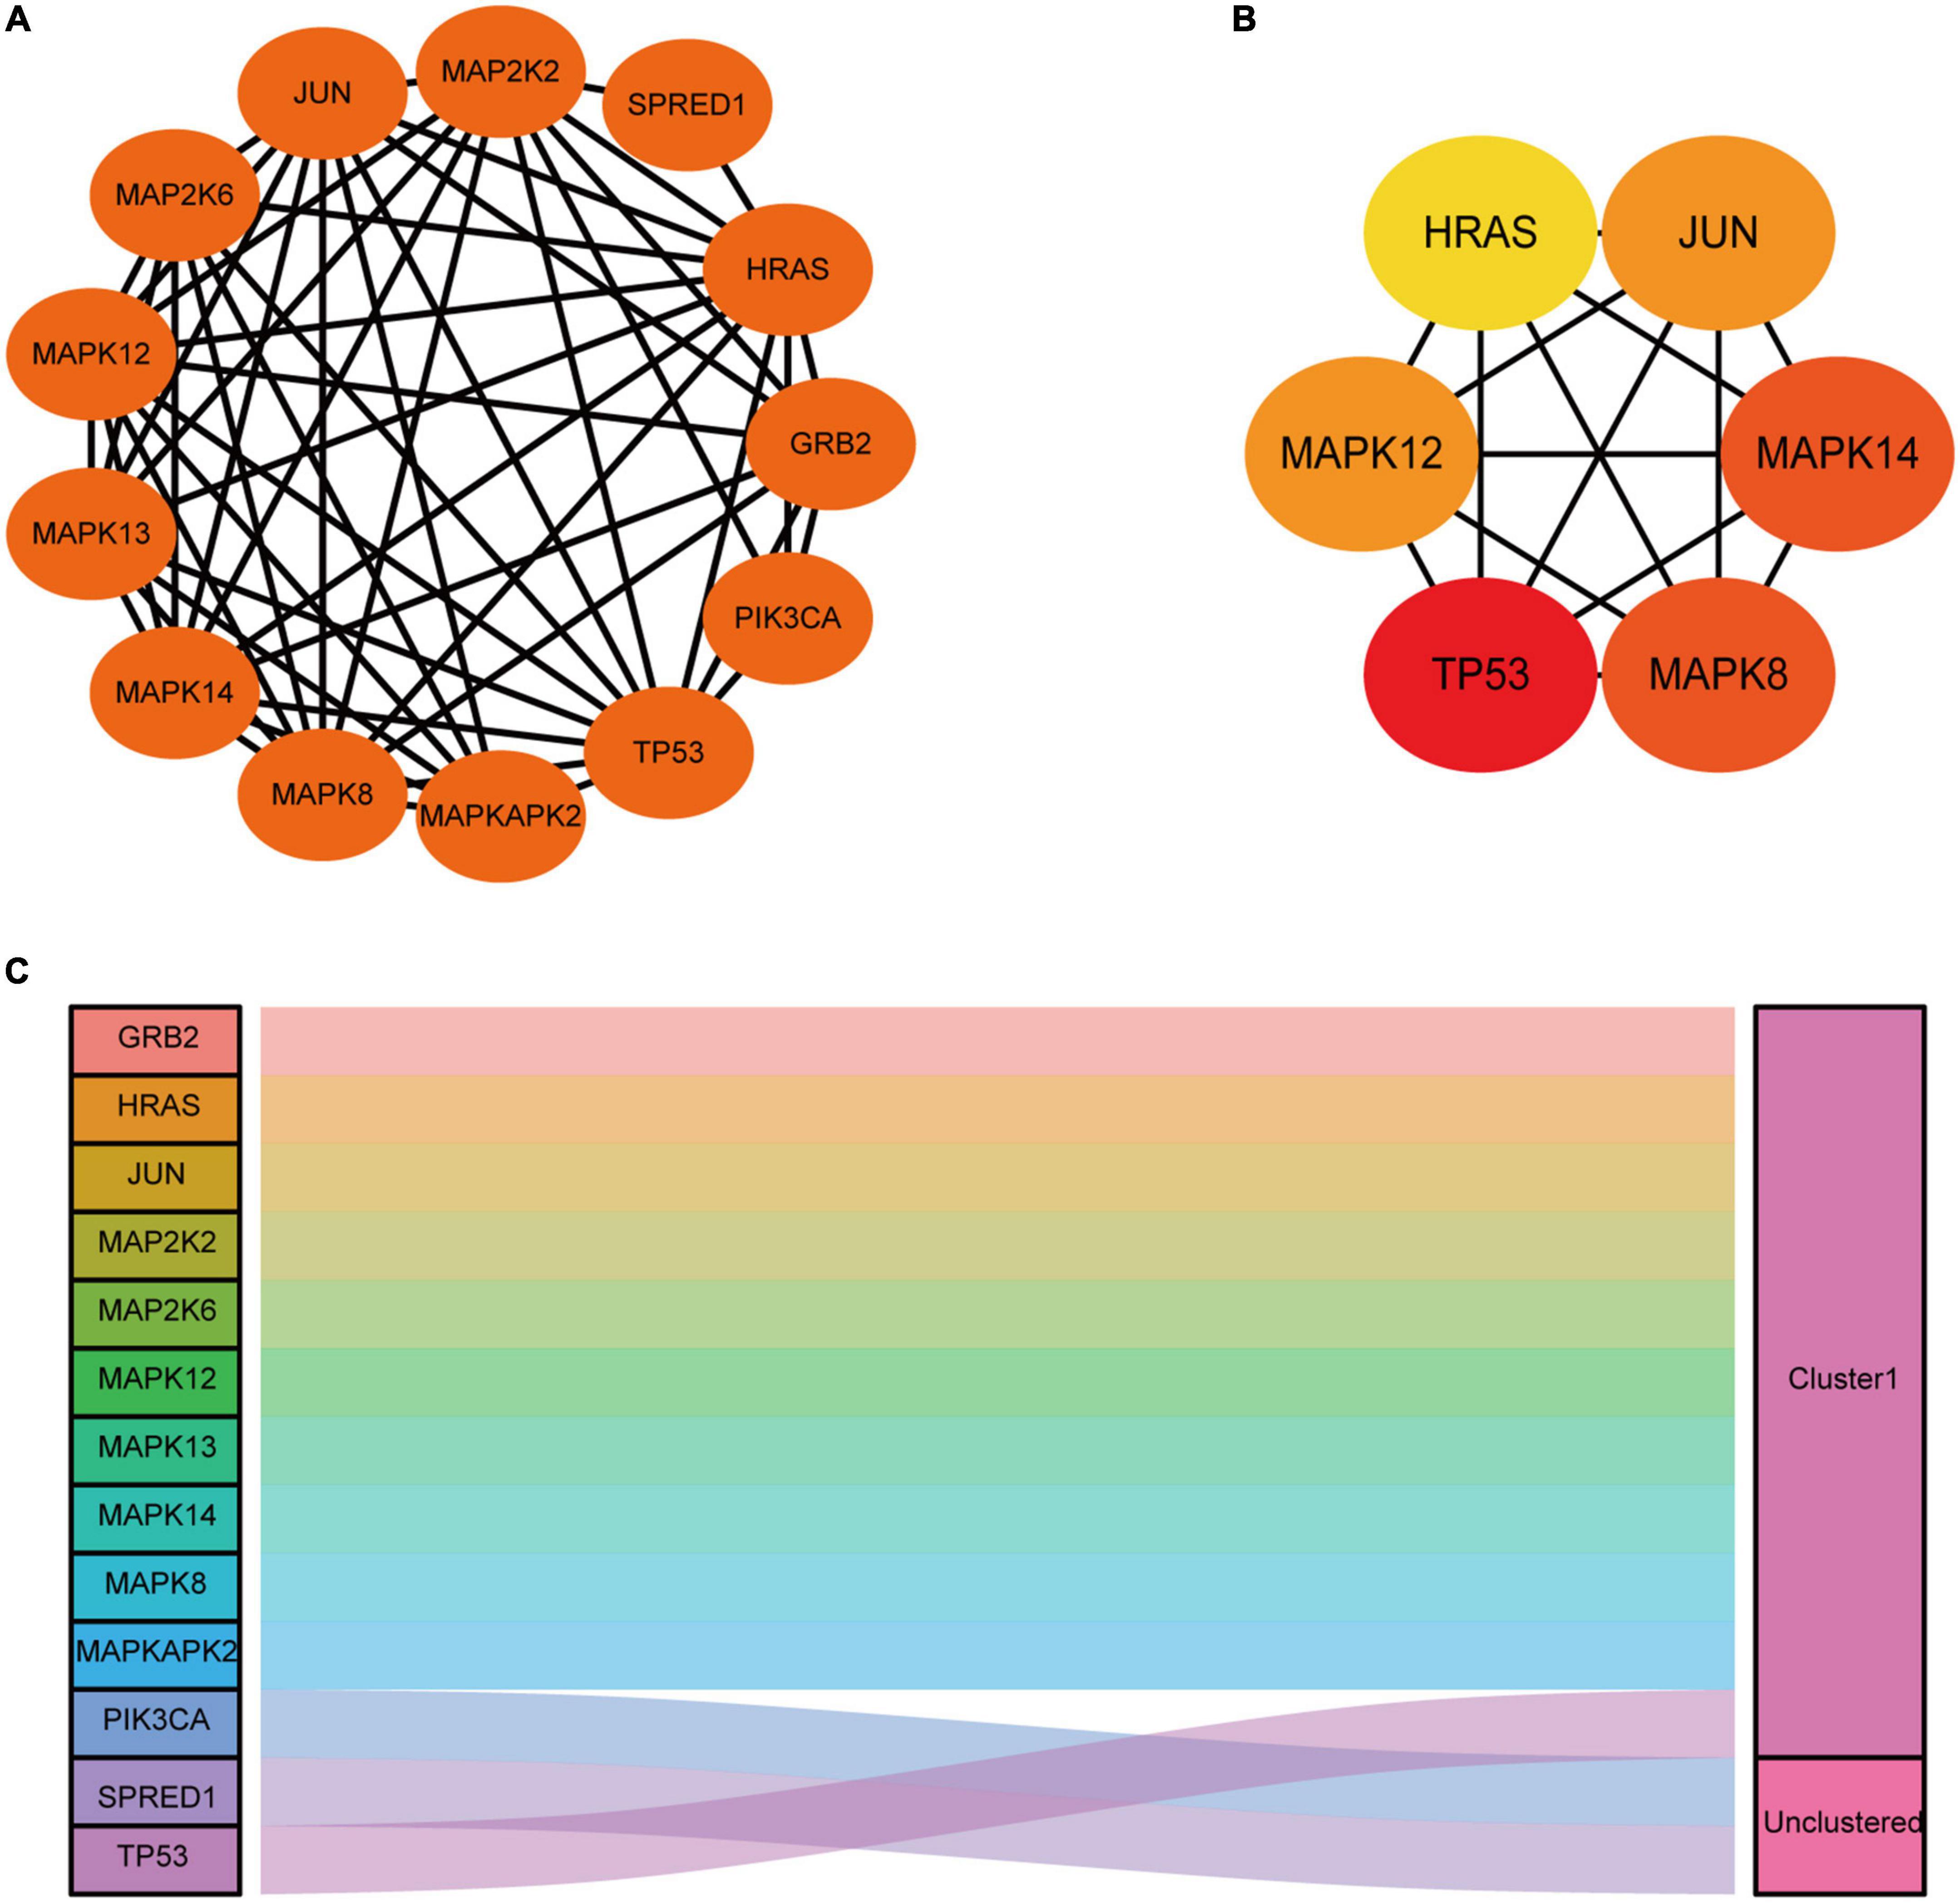
Figure 6. Construction of functional networks and identification of candidate genes and module analysis. (A) Functional protein-protein interaction (PPI) network analysis of the 13 differentially expressed genes (DEGs). (B) Subnetwork of top six hub genes from the PPI network. Node color reflects the degree of connectivity (Red color represents a higher degree, and yellow color represents a lower degree). (C) One module was identified by ggalluvial in R and was visualized by ggplot.
We verified the expression of hub genes using the GSE20388 dataset derived from the depression animal brain tissue. We found that 4 out of the 6 hub genes show the same significant differential expression. But only 3 hub genes exhibited the same expression trend, including TP53, MAPK8, and HRAS (Table 2). Therefore, we chose TP53, MAPK8, and HRAS for the following analyses.
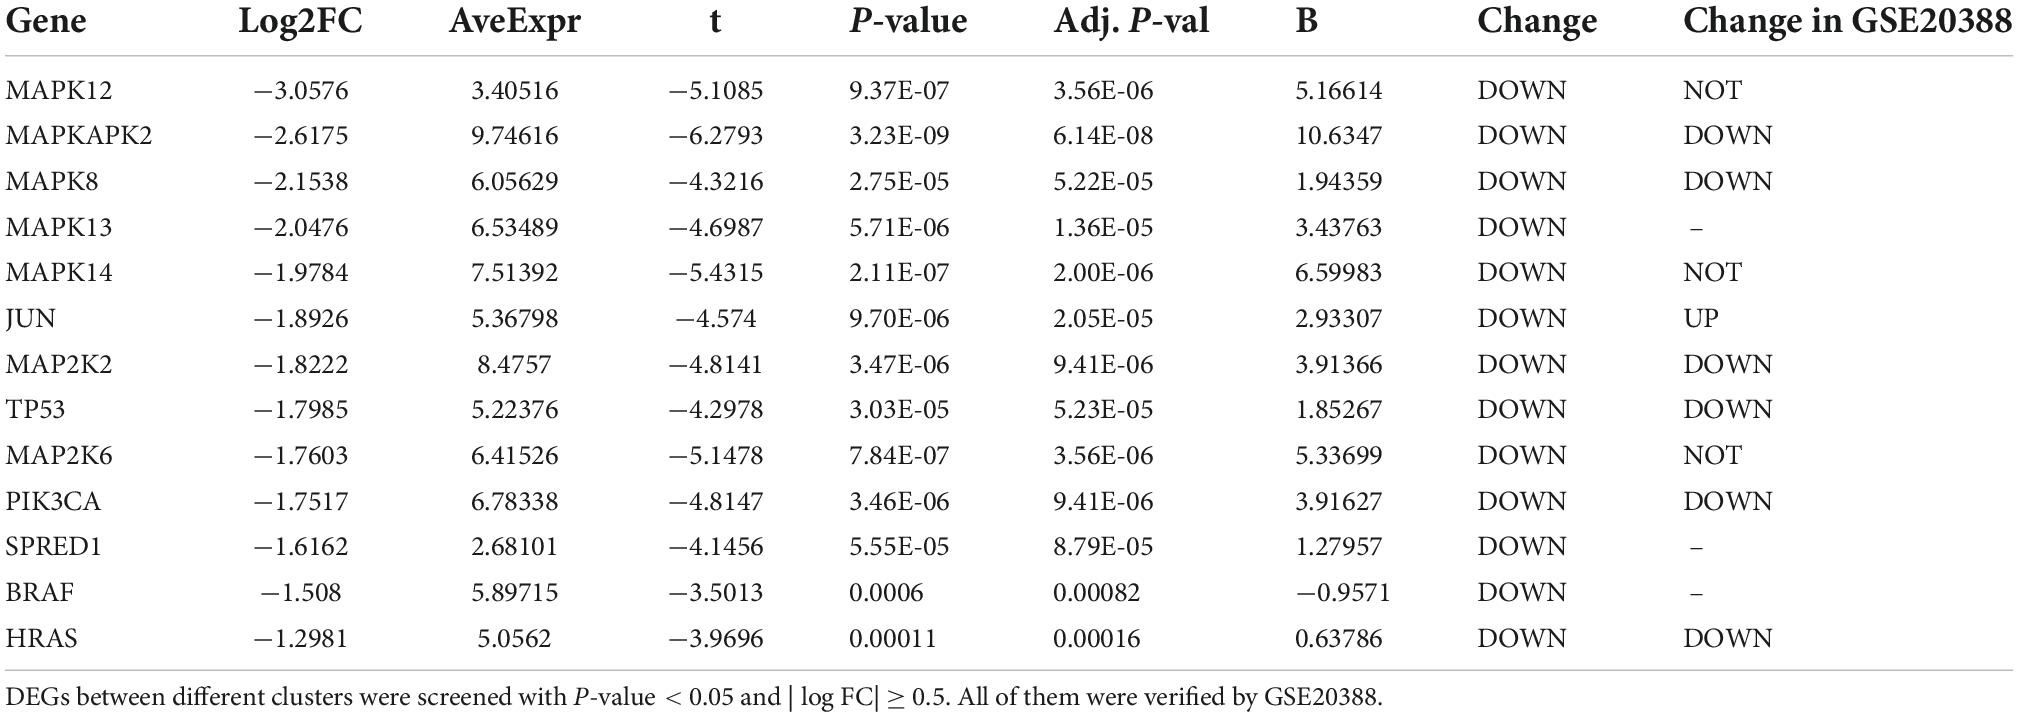
Table 2. DEGs identification from different clusters of MDD.
Based on three TF databases, we predicted different TFs and took the results’ intersection for the above hub genes, respectively. Forty-eight TFs for HRAS, 37 TFs for MAPK8, and 85 TFs for TP53 were identified (Figures 7A–C). By taking a further intersection, 9 co-TFs including GATA2, FLI1, CREB1, JUND, E2F1, ESR1, TRAP4, SP1, and GABPA were selected (Figure 7D). Based on the ENCORI database, multiple upstream miRNAs for co-TFs were further screened. The Cytoscape software demonstrated the regulation network of miRNAs-TFs-hub genes (Figure 7E). Taken together, we supposed that the axis of miRNAs-TFs-HRAS/TP53/MAPK8 may play a potentially important role in MDD.
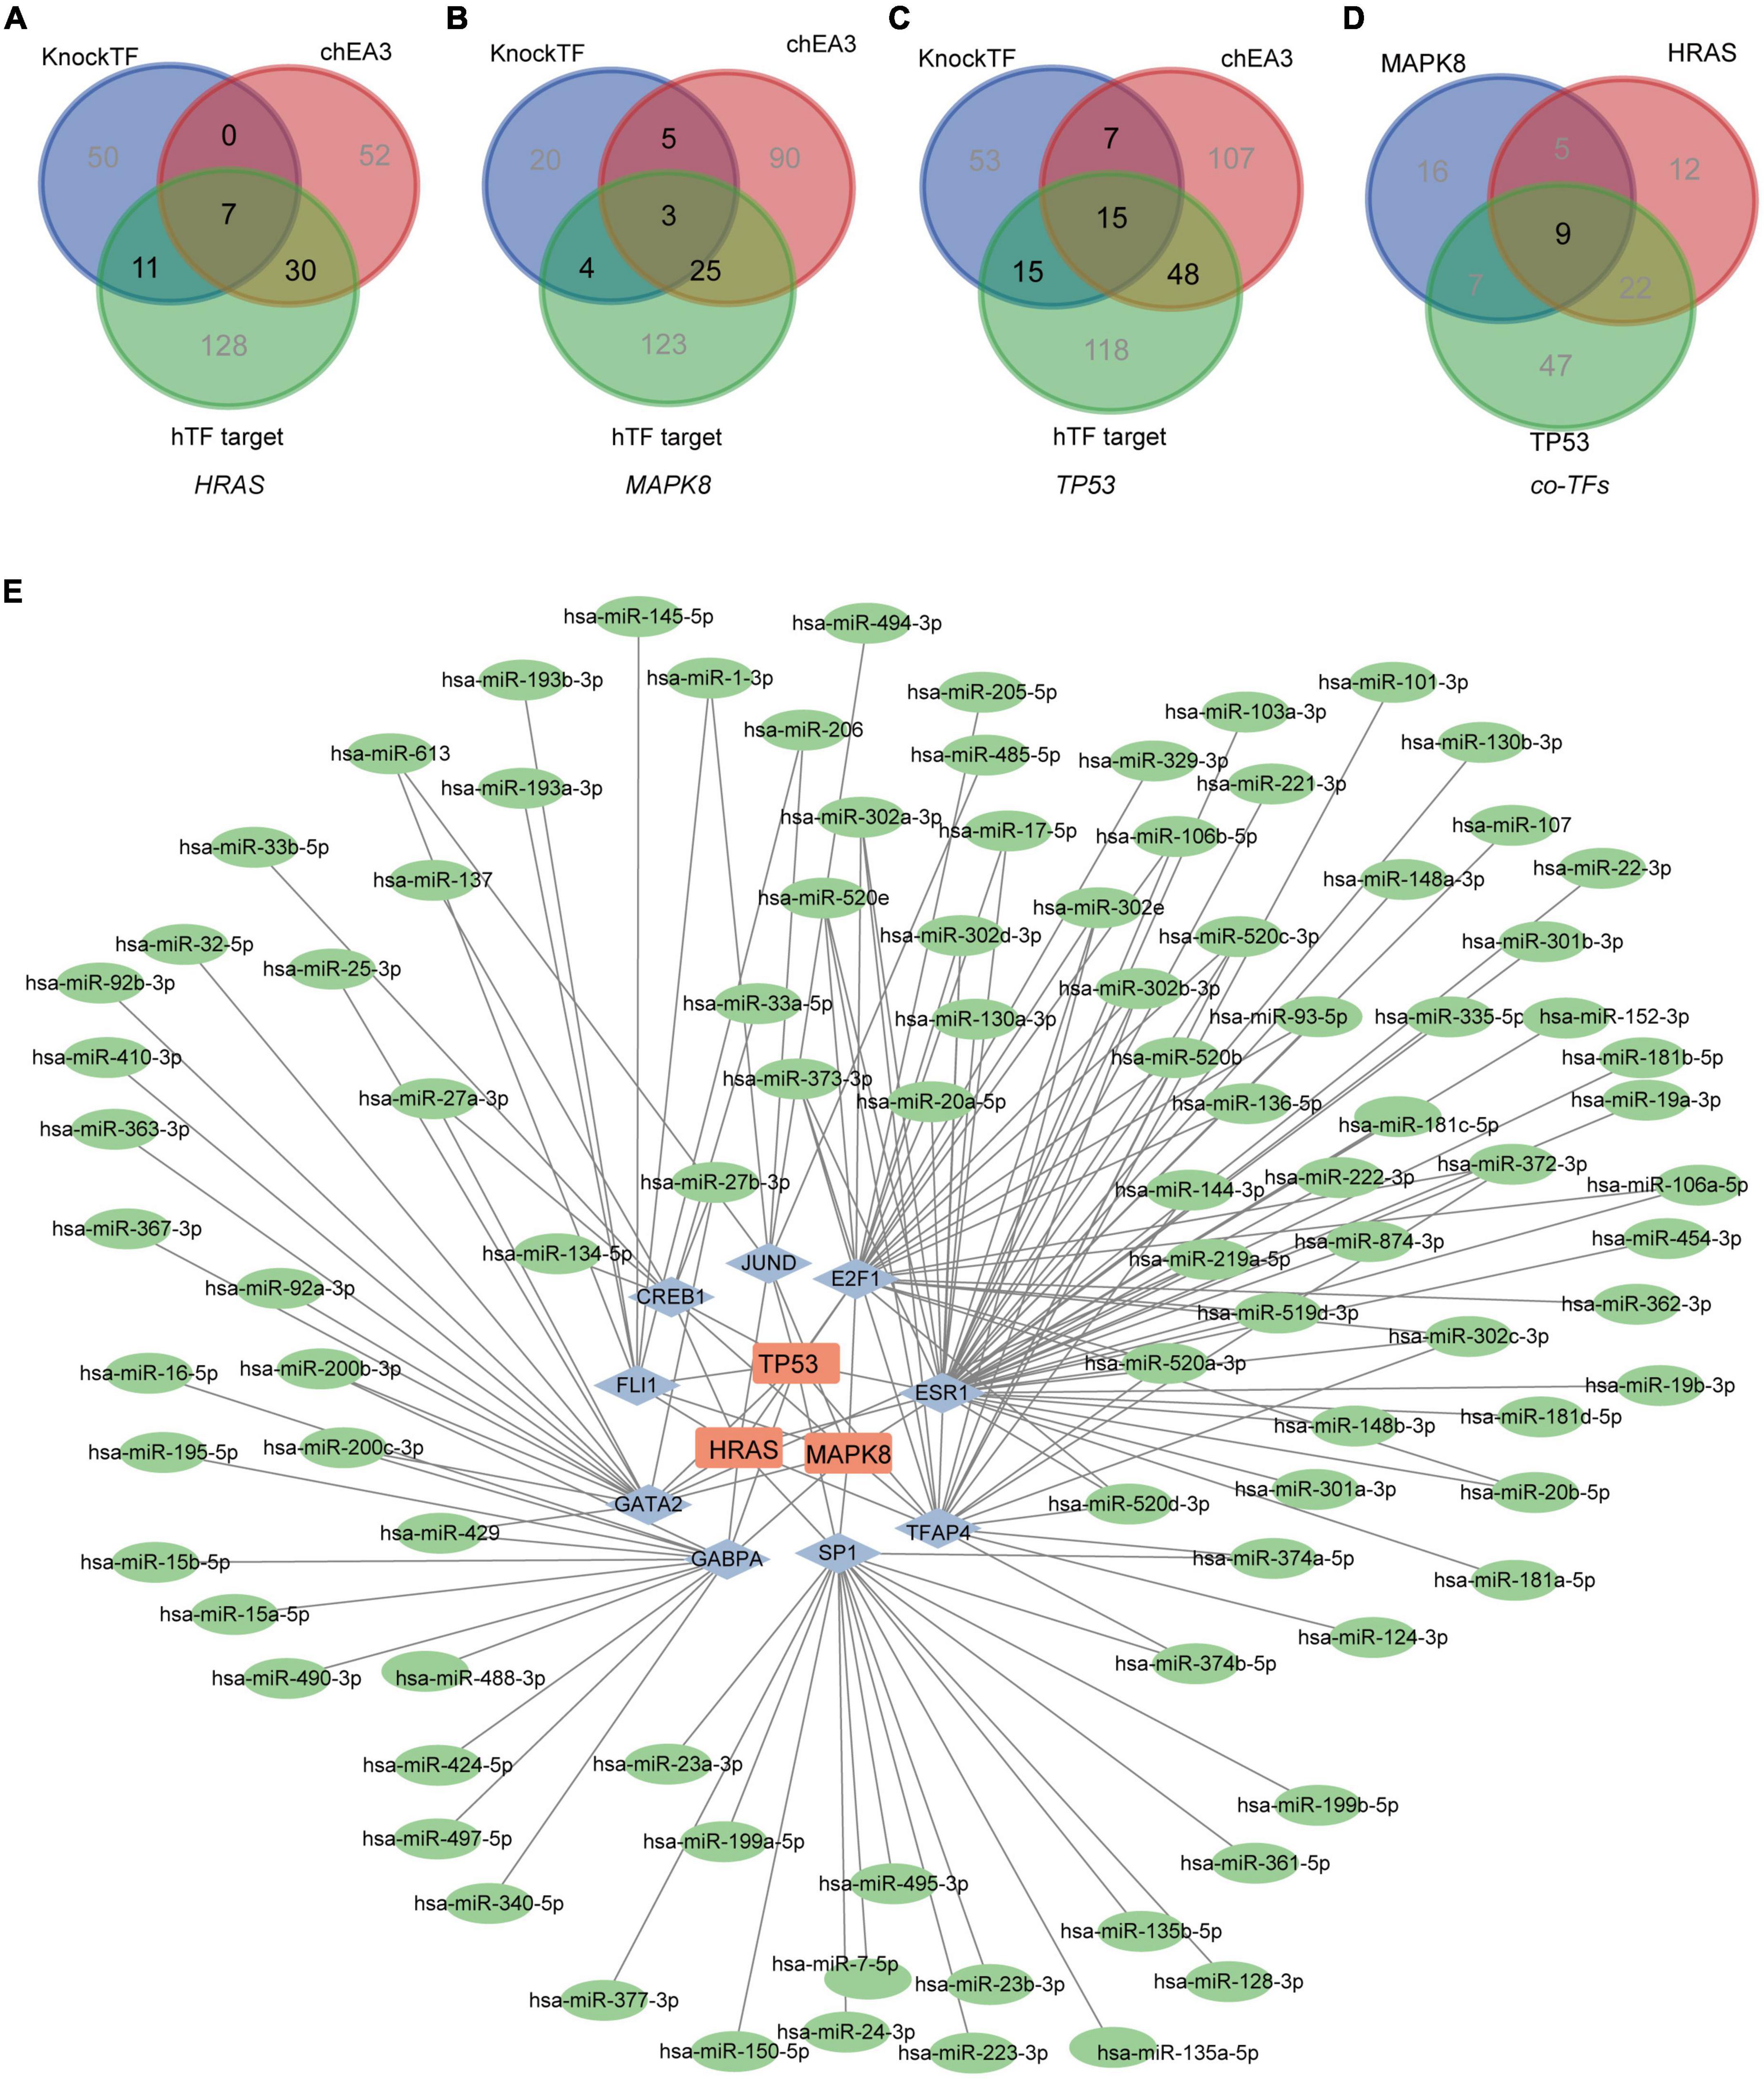
Figure 7. Network of miRNAs-TFs-hub genes. (A–C) The predicted TFs for hub genes based on the KnockTF, chEA3, and hTFtarget databases, respectively. (D) The common TFs for HRAS, MAPK8 and TP53. (E) The miRNAs-TFs-hub genes regulation network in MDD. (The Square nodes represent the hub genes, and diamond nodes represent the TFs. The circle nodes represent the miRNAs.)
Major depressive disorder is a debilitating disorder closely associated with AD and other diseases. Most recent studies have revealed pathways and biomarkers attributable to it. Nevertheless, the exact mechanisms of MDD remain widely unclear. In our study, we identified 3,116 down-regulated and 6 up-regulated genes between MDD patients and healthy controls. By enrichment analysis, we demonstrated that the MAPK signaling pathway, passive transmembrane transporter activity and ion channel activity might play an essential role in the development of MDD. The terms of passive transmembrane transporter activity and ion channel activity can regulate energy metabolism, thus modulating various clinical symptoms. And the MAPK pathway has also been reported to be correlated with MDD (28). However, it still lacks more detailed studies of the correlation.
Based on the 30 MAPK-associated genes from Genecards, we performed unsupervised consensus clustering on the MAPK-related genes expression matrix. Two subgroups named cluster 1 (64 MDD patients) and cluster 2 (74 MDD patients) were identified. We then screened 13 down-regulated genes between different clusters. The DEGs were mainly distributed in tissues of the circulatory system, immune system, and neurologic system, consistent with the fact that MDD patients usually harbor coronary artery disease (29). In our study, the most typical tissues were cardiomyocytes, lymphoma Burkitt, CD33+ myeloid, pineal, and Dorsal Root Ganglion, which might imply the probable reasons for clinical manifestations in MDD, such as repeated infection, circadian rhythm disorder and feeling pain (30, 31).
MF analysis in GO annotation for DEGs demonstrated that 13 down-regulated genes were significantly enriched in protein serine/threonine kinase activity. And the kinase-associated pathway was also validated by KEGG analysis. Meanwhile, the pathway of MAPK cascade, stress-activated protein kinase signaling cascade and cellular response to abiotic stimulus were also identified. As previously described, the results confirmed that MDD is closely associated with stress and external stimulation (32). Additionally, the correlation among the DEGs was visualized by the PPI network. And a module constructed by MCODE was demonstrated. Besides, 3 hub genes including MAPK8, TP53, and HRAS were further identified and verified.
MAPK8 is a typical member of the MAP kinase family. It was confirmed that the MAPK pathway is probably closely associated with MDD. TP53, also known as the cancer suppressor gene, is closely correlated with transcriptional activation, DNA binding and oligomerization domains. It has been implicated that TP53 can induce cell cycle arrest, senescence, and changes in metabolism (33), especially when responding to complicated cellular stresses. TP53 mutation is also an independent risk factor for immune escape (34). Though some reports noted that the mechanisms involved in cell survival and death regulation based on TP53 might be interested in the pathophysiology of MDD (35), there is no more indication about TP53 and MDD. To some extent, we inspired a new light on the association between the traditional molecule and MDD. HRAS, a gene belonging to the Ras oncogene family, was also identified in our study. Evidence has suggested that HRAS is closely associated with Beta-Adrenergic signaling, which controls cell migration and TP53-dependent cell survival (36). It has also been revealed that the mutation of HRAS is closely associated with TP53 in the immune signature (37, 38). All these DEGs were supposed to participate in different metabolism pathways like phosphorylation, which has been reported as an essential alteration in MDD (39, 40). Accordingly, we can early discriminate MDD through the expression of hub genes, preventing further exacerbation of the disease. And perhaps our results contribute to explaining why MDD patients are clinically prone to tumors and other immune system-related diseases.
We also constructed miRNAs-TFs-hub genes regulation network in MDD. The common transcription factors were GATA2, FLI1, CREB1, JUND, E2F1, ESR1, TRAP4, SP1, and GABPA. It has been reported that GATA2, CREB1, and E2F1 were crucial in the maintenance of MDD (41–43). And ESR1, an estrogen receptor, was also found to be important in depression (44). Meanwhile, the role of SP1 in MDD has also been identified (45). Although studies about the other TFs in MDD are limited, they are still potential targets for MDD that worth exploring in the future. Besides, some research has reported that miRNA may act as potential biomarkers for psychiatric and neurodegenerative disorders (46, 47). For example, the miR-29 family, miR-34a-5p, and miR-132-3p were discussed as common dysregulated circulating miRNA in CNS disorders (48). And from Zheng K’s work, miR-135a-5p was demonstrated to be a synaptic-related regulator (49). Our constructing network also demonstrated potential regulation miRNAs, including the hsa-miR-134-5p, hsa-miR-27b-3p, hsa-miR-373-3p, and hsa-520a-3p, et al.
There are still several issues to be addressed. First, there were shortcomings in our integrated expression matrix, for the platforms were different (GPL570 for GSE98793 and GSE17077 for GSE76826). The batch effect cannot be eliminated entirely though using the “SVA” R package. Second, both GSE98793 and GSE76826 lack sufficient clinical information, causing the absence of more clinical analyses. Furthermore, the expressions of the hub genes and their roles in MDD need to be further explored and assessed in vivo and in vitro.
Briefly, we demonstrated an overview of MAPK-related key genes in MDD. Two distinct molecular subtypes of MDD were identified, which exhibit differential expression of GRB2, HRAS, JUN, MAP2K2, MAP2K6, MAPK12, MAPK13, MAPK14, MAPK8, MAPKAPK2, and TP53. The DEGs indicated a significant correlation between MDD and clinical somatic symptoms like infection, circadian rhythm disorder and feeling pain. A new module consisting of GRB2, HRAS, JUN, MAP2K2, MAP2K6, MAPK12, MAPK13, MAPK14, MAPK8, MAPKAPK2, and TP53 was further identified, better illustrating the potential regulation of MDD. Moreover, we distinguished TP53, MAPK8 and HRAS as hub genes and demonstrated an axis of miRNAs-TFs-HRAS/TP53/MAPK8. These findings highlight the role of the MAPK pathway in MDD and provide insights into diagnosis and therapy in the future.
Publicly available datasets were analyzed in this study. This data can be found here: NCBI: GSE98793, GSE76826, and GSE20388.
JX and XW designed the study. YC, FZ, and WL collated the data, carried out data analyses, and produced the initial draft of the manuscript. WZ helped perform the analysis with constructive discussions. All authors have read and approved the final submitted manuscript.
This study was supported by the Guangdong Natural Science Foundation for Distinguished Young Scholars (2019B151502010), National Natural Science Foundation of China (81870878), and Foundation for Basic and Applied Basic Research of Guangdong Province of China (2019A1515110677).
The authors declare that the research was conducted in the absence of any commercial or financial relationships that could be construed as a potential conflict of interest.
All claims expressed in this article are solely those of the authors and do not necessarily represent those of their affiliated organizations, or those of the publisher, the editors and the reviewers. Any product that may be evaluated in this article, or claim that may be made by its manufacturer, is not guaranteed or endorsed by the publisher.
The Supplementary Material for this article can be found online at: https://www.frontiersin.org/articles/10.3389/fpsyt.2022.1004945/full#supplementary-material
Supplementary Figure 1 | Item consensus plot displayed the cluster stability at k = 2. (A–C) Item consensus plot showed that when k = 2, the cluster reached its stability.
Supplementary Figure 2 | PCA visualization showed a significant difference between subgroups.
1. Otte C, Gold SM, Penninx BW, Pariante CM, Etkin A, Fava M, et al. Major depressive disorder. Nat Rev Dis Primers. (2016) 2:16065. doi: 10.1038/nrdp.2016.65
2. Kessler RC, Angermeyer M, Anthony JC, De Graaf R, Demyttenaere K, Gasquet I, et al. Lifetime prevalence and age-of-onset distributions of mental disorders in the world health organization’s world mental health survey initiative. World Psychiatry. (2007) 6:168–76.
3. Bekhuis E, Boschloo L, Rosmalen JGM, Schoevers RA. Differential associations of specific depressive and anxiety disorders with somatic symptoms. J Psychosom Res. (2015) 78:116–22. doi: 10.1016/j.jpsychores.2014.11.007
4. Schneider B, Prvulovic D, Oertel-Knöchel V, Knöchel C, Reinke B, Grexa M, et al. Biomarkers for major depression and its delineation from neurodegenerative disorders. Prog Neurobiol. (2011) 95:703–17. doi: 10.1016/j.pneurobio.2011.08.001
5. Inoue T, Kitagawa M, Tanaka T, Nakagawa S, Koyama T. Depression and major depressive disorder in patients with Parkinson’s disease. Mov Disord. (2010) 25:44–9. doi: 10.1002/mds.22921
6. Verhoeven JE, Révész D, Epel ES, Lin J, Wolkowitz OM, Penninx BWJH. Major depressive disorder and accelerated cellular aging: results from a large psychiatric cohort study. Mol Psychiatry. (2014) 19:895–901. doi: 10.1038/mp.2013.151
7. Krishnan V, Nestler EJ. The molecular neurobiology of depression. Nature. (2008) 455:894–902. doi: 10.1038/nature07455
8. Rhee TG, Mohamed S, Rosenheck RA. Stages of major depressive disorder and behavioral multi-morbidities: findings from nationally representative epidemiologic study. J Affect Disord. (2021) 278:443–52. doi: 10.1016/j.jad.2020.09.081
9. Hamon M, Blier P. Monoamine neurocircuitry in depression and strategies for new treatments. Prog Neuropsychopharmacol Biol Psychiatry. (2013) 45:54–63. doi: 10.1016/j.pnpbp.2013.04.009
10. Malhi GS, Das P, Mannie Z, Irwin L. Treatment-resistant depression: problematic illness or a problem in our approach? Br J Psychiatry. (2019) 214:1–3. doi: 10.1192/bjp.2018.246
11. Kupfer DJ, Frank E, Phillips ML. Major depressive disorder: new clinical, neurobiological, and treatment perspectives. Lancet. (2012) 379:1045–55. doi: 10.1016/S0140-6736(11)60602-8
12. Opel N, Redlich R, Grotegerd D, Dohm K, Zaremba D, Meinert S, et al. Prefrontal brain responsiveness to negative stimuli distinguishes familial risk for major depression from acute disorder. J Psychiatry Neurosci. (2017) 42:343–52. doi: 10.1503/jpn.160198
13. Rappeneau V, Wilmes L, Touma C. Molecular correlates of mitochondrial dysfunctions in major depression: evidence from clinical and rodent studies. Mol Cell Neurosci. (2020) 109:103555. doi: 10.1016/j.mcn.2020.103555
14. Li J, Seidlitz J, Suckling J, Fan F, Ji G-J, Meng Y, et al. Cortical structural differences in major depressive disorder correlate with cell type-specific transcriptional signatures. Nat Commun. (2021) 12:1647. doi: 10.1038/s41467-021-21943-5
15. Yuan N, Tang K, Da X, Gan H, He L, Li X, et al. Integrating clinical and genomic analyses of hippocampal-prefrontal circuit disorder in depression. Front Genet. (2020) 11:565749. doi: 10.3389/fgene.2020.565749
16. Wang X-L, Yuan K, Zhang W, Li S-X, Gao GF, Lu L. Regulation of circadian genes by the mapk pathway: implications for rapid antidepressant action. Neurosci Bull. (2020) 36:66–76. doi: 10.1007/s12264-019-00358-9
17. Umschweif G, Medrihan L, Guillén-Samander A, Wang W, Sagi Y, Greengard P. Identification of neurensin-2 as a novel modulator of emotional behavior. Mol Psychiatry. (2021) 26:2872–85. doi: 10.1038/s41380-021-01058-5
18. Mansur RB, Delgado-Peraza F, Subramaniapillai M, Lee Y, Iacobucci M, Nasri F, et al. Exploring brain insulin resistance in adults with bipolar depression using extracellular vesicles of neuronal origin. J Psychiatr Res. (2021) 133:82–92. doi: 10.1016/j.jpsychires.2020.12.007
19. Peng R, Li Y. Associations between tenascin-c and testosterone deficiency in men with major depressive disorder: a cross-sectional retrospective study. J Inflamm Res. (2021) 14:897–905. doi: 10.2147/JIR.S298270
20. Bakunina N, Pariante CM, Zunszain PA. Immune mechanisms linked to depression via oxidative stress and neuroprogression. Immunology. (2015) 144:365–73. doi: 10.1111/imm.12443
21. Thesing CS, Lok A, Milaneschi Y, Assies J, Bockting CLH, Figueroa CA, et al. Fatty acids and recurrence of major depressive disorder: combined analysis of two dutch clinical cohorts. Acta Psychiatr Scand. (2020) 141:362–73. doi: 10.1111/acps.13136
22. Zheng P, Fang Z, Xu X-J, Liu M-L, Du X, Zhang X, et al. Metabolite signature for diagnosing major depressive disorder in peripheral blood mononuclear cells. J Affect Disord. (2016) 195:75–81. doi: 10.1016/j.jad.2016.02.008
23. Leek JT, Johnson WE, Parker HS, Jaffe AE, Storey JD. The sva package for removing batch effects and other unwanted variation in high-throughput experiments. Bioinformatics. (2012) 28:882–3. doi: 10.1093/bioinformatics/bts034
24. Wilkerson MD, Hayes DN. Consensusclusterplus: a class discovery tool with confidence assessments and item tracking. Bioinformatics. (2010) 26:1572–3. doi: 10.1093/bioinformatics/btq170
25. Chin C-H, Chen S-H, Wu H-H, Ho C-W, Ko M-T, Lin C-Y. Cytohubba: identifying hub objects and sub-networks from complex interactome. BMC Syst Biol. (2014) 8:S11. doi: 10.1186/1752-0509-8-S4-S11
26. Bader GD, Hogue CWV. An automated method for finding molecular complexes in large protein interaction networks. BMC Bioinformatics. (2003) 4:2. doi: 10.1186/1471-2105-4-2
27. Li J-H, Liu S, Zhou H, Qu L-H, Yang J-H. Starbase V2.0: decoding miRNA-ceRNA, miRNA-ncRNA and protein-RNA interaction networks from large-scale clip-seq data. Nucleic Acids Res. (2014) 42:D92–7. doi: 10.1093/nar/gkt1248
28. Quinlan MA, Robson MJ, Ye R, Rose KL, Schey KL, Blakely RD. Quantitative proteomic analysis of serotonin transporter interactome: network impact of the SERT Ala56 coding variant. Front Mol Neurosci. (2020) 13:89. doi: 10.3389/fnmol.2020.00089
29. Kendler KS, Gardner CO, Fiske A, Gatz M. Major depression and coronary artery disease in the swedish twin registry: phenotypic, genetic, and environmental sources of comorbidity. Arch Gen Psychiatry. (2009) 66:857–63. doi: 10.1001/archgenpsychiatry.2009.94
30. Li L, Zou Y, Liu B, Yang R, Yang J, Sun M, et al. Contribution of the P2x4 receptor in rat hippocampus to the comorbidity of chronic pain and depression. ACS Chem Neurosci. (2020) 11:4387–97. doi: 10.1021/acschemneuro.0c00623
31. Ohayon MM, Schatzberg AF. Chronic pain and major depressive disorder in the general population. J Psychiatr Res. (2010) 44:454–61. doi: 10.1016/j.jpsychires.2009.10.013
32. Albert KM, Newhouse PA. Estrogen, stress, and depression: cognitive and biological interactions. Annu Rev Clin Psychol. (2019) 15:399–423. doi: 10.1146/annurev-clinpsy-050718-095557
33. Mantovani F, Collavin L, Del Sal G. Mutant P53 as a guardian of the cancer cell. Cell Death Differ. (2019) 26:199–212. doi: 10.1038/s41418-018-0246-9
34. Jiang Z, Liu Z, Li M, Chen C, Wang X. Immunogenomics analysis reveals that TP53 mutations inhibit tumor immunity in gastric cancer. Transl Oncol. (2018) 11:1171–87. doi: 10.1016/j.tranon.2018.07.012
35. Mahmood S, Evinová A, Škereòová M, Ondrejka I, Lehotskı J. Association of EGF, IGFBP-3 and TP53 gene polymorphisms with major depressive disorder in slovak population. Cent Eur J Public Health. (2016) 24:223–30. doi: 10.21101/cejph.a4301
36. Claes S. Glucocorticoid receptor polymorphisms in major depression. Ann N Y Acad Sci. (2009) 1179:216–28. doi: 10.1111/j.1749-6632.2009.05012.x
37. Lyu H, Li M, Jiang Z, Liu Z, Wang X. Correlate the mutation and the mutation with immune signatures in head and neck squamous cell cancer. Comput Struct Biotechnol J. (2019) 17:1020–30. doi: 10.1016/j.csbj.2019.07.009
38. Santra T, Herrero A, Rodriguez J, von Kriegsheim A, Iglesias-Martinez LF, Schwarzl T, et al. An integrated global analysis of compartmentalized HRAS signaling. Cell Rep. (2019) 26:3100–15.e7. doi: 10.1016/j.celrep.2019.02.038
39. Simic I, Maric NP, Mitic M, Soldatovic I, Pavlovic Z, Mihaljevic M, et al. Phosphorylation of leukocyte glucocorticoid receptor in patients with current episode of major depressive disorder. Prog Neuropsychopharmacol Biol Psychiatry. (2013) 40:281–5. doi: 10.1016/j.pnpbp.2012.10.021
40. Zhang Z, Zhang P, Qi G-J, Jiao F-J, Wang Q-Z, Yan J-G, et al. CDK5-mediated phosphorylation of Sirt2 contributes to depressive-like behavior induced by social defeat stress. Biochim Biophys Acta Mol Basis Dis. (2018) 1864:533–41. doi: 10.1016/j.bbadis.2017.11.012
41. Wang W, Li W, Wu Y, Tian X, Duan H, Li S, et al. Genome-wide DNA methylation and gene expression analyses in monozygotic twins identify potential biomarkers of depression. Transl Psychiatry. (2021) 11:416. doi: 10.1038/s41398-021-01536-y
42. Juhasz G, Dunham JS, McKie S, Thomas E, Downey D, Chase D, et al. The CREB1-BDNF-NTRK2 pathway in depression: multiple gene-cognition-environment interactions. Biol Psychiatry. (2011) 69:762–71. doi: 10.1016/j.biopsych.2010.11.019
43. McGrory CL, Ryan KM, Kolshus E, McLoughlin DM. Peripheral blood E2F1 mRNA in depression and following electroconvulsive therapy. Prog Neuropsychopharmacol Biol Psychiatry. (2019) 89:380–5. doi: 10.1016/j.pnpbp.2018.10.011
44. Ryan J, Ancelin M-L. Polymorphisms of estrogen receptors and risk of depression: therapeutic implications. Drugs. (2012) 72:1725–38. doi: 10.2165/11635960-000000000-00000
45. Chen Y-C, Hsu P-Y, Su M-C, Chen T-W, Hsiao C-C, Chin C-H, et al. MicroRNA sequencing analysis in obstructive sleep Apnea and depression: anti-oxidant and MAOA-inhibiting effects of miR-15b-5p and miR-92b-3p through targeting PTGS1-Nf-κb-Sp1 signaling. Antioxidants. (2021) 10:1854. doi: 10.3390/antiox10111854
46. Lopez JP, Fiori LM, Cruceanu C, Lin R, Labonte B, Cates HM, et al. MicroRNAs 146a/B-5 and 425-3p and 24-3p Are markers of antidepressant response and regulate MAPK/WNT-system genes. Nat Commun. (2017) 8:15497. doi: 10.1038/ncomms15497
47. Zhou L, Zhu Y, Chen W, Tang Y. Emerging role of microRNAs in major depressive disorder and its implication on diagnosis and therapeutic response. J Affect Disord. (2021) 286:80–6. doi: 10.1016/j.jad.2021.02.063
48. van den Berg MMJ, Krauskopf J, Ramaekers JG, Kleinjans JCS, Prickaerts J, Briedé JJ. Circulating microRNAs as potential biomarkers for psychiatric and neurodegenerative disorders. Prog Neurobiol. (2020) 185:101732. doi: 10.1016/j.pneurobio.2019.101732
Keywords: major depressive disorder, MAPK pathway, molecular subtypes, hub genes, regulation network
Citation: Chen Y, Zhou F, Lu W, Zeng W, Wang X and Xie J (2022) Identification of potential Mitogen-Activated Protein Kinase-related key genes and regulation networks in molecular subtypes of major depressive disorder. Front. Psychiatry 13:1004945. doi: 10.3389/fpsyt.2022.1004945
Received: 27 July 2022; Accepted: 07 October 2022;
Published: 21 October 2022.
Edited by:
Shen He, Shanghai Jiao Tong University, ChinaReviewed by:
Chuanjun Zhuo, Tianjin Anding Hospital, ChinaCopyright © 2022 Chen, Zhou, Lu, Zeng, Wang and Xie. This is an open-access article distributed under the terms of the Creative Commons Attribution License (CC BY). The use, distribution or reproduction in other forums is permitted, provided the original author(s) and the copyright owner(s) are credited and that the original publication in this journal is cited, in accordance with accepted academic practice. No use, distribution or reproduction is permitted which does not comply with these terms.
*Correspondence: Jingdun Xie, eGllamQ2QG1haWwuc3lzdS5lZHUuY24=; Xudong Wang, d2FuZ3hkQHN5c3VjYy5vcmcuY24=
†These authors have contributed equally to this work
Disclaimer: All claims expressed in this article are solely those of the authors and do not necessarily represent those of their affiliated organizations, or those of the publisher, the editors and the reviewers. Any product that may be evaluated in this article or claim that may be made by its manufacturer is not guaranteed or endorsed by the publisher.
Research integrity at Frontiers
Learn more about the work of our research integrity team to safeguard the quality of each article we publish.