 Brian A. Zaboski
 Elisa F. Stern
 Patrick D. Skosnik
 Christopher Pittenger
94% of researchers rate our articles as excellent or good
Learn more about the work of our research integrity team to safeguard the quality of each article we publish.
Find out more
MINI REVIEW article
Front. Psychiatry, 02 August 2021
Sec. Neuroimaging
Volume 12 - 2021 | https://doi.org/10.3389/fpsyt.2021.703398
This article is part of the Research TopicObsessive-Compulsive Disorder (OCD) Across the Lifespan: Current Diagnostic Challenges and the Search for Personalized Treatment View all 26 articles
Electroencephalography (EEG) measures the brain's electrical activity with high temporal resolution. In comparison to neuroimaging modalities such as MRI or PET, EEG is relatively cheap, non-invasive, portable, and simple to administer, making it an attractive tool for clinical deployment. Despite this, studies utilizing EEG to investigate obsessive-compulsive disorder (OCD) are relatively sparse. This contrasts with a robust literature using other brain imaging methodologies. The present review examines studies that have used EEG to examine predictors and correlates of response in OCD and draws tentative conclusions that may guide much needed future work. Key findings include a limited literature base; few studies have attempted to predict clinical change from EEG signals, and they are confounded by the effects of both pharmacotherapy and psychotherapy. The most robust literature, consisting of several studies, has examined event-related potentials, including the P300, which several studies have reported to be abnormal at baseline in OCD and to normalize with treatment; but even here the literature is quite heterogeneous, and more work is needed. With more robust research, we suggest that the relatively low cost and convenience of EEG, especially in comparison to fMRI and PET, make it well-suited to the development of feasible personalized treatment algorithms.
Obsessive-compulsive disorder (OCD) is defined by clinically significant obsessions and/or compulsions. Obsessions are unwanted, intrusive thoughts that cause distress and are unrealistic or excessive. Compulsions are repetitive behaviors that neutralize anxiety or distress caused by obsessions (1). Estimates of lifetime prevalence range from 1 to 4% of adults; the attendant disability is substantial (2–5). Unfortunately, precision medicine—establishing who may benefit most from existing treatments—remains a distant goal. Efforts in this direction have begun to incorporate neuroscientific methodologies, including electroencephalography (EEG). The present review seeks to summarize the limited body of literature focused on the EEG correlates and predictors of treatment response in OCD.
Diagnosis and assessment of OCD depend on clinical interviews and rating scales that quantify symptoms and identify functional impairments (6), such as the Yale-Brown Obsessive-Compulsive Scale (YBOCS) (7). It would be useful to complement, validate, and refine this descriptive clinical nosology with objective biomarkers (8). As such, the search for biological correlates has been a major thrust of research since the 1980s. Toward this end, early PET and fMRI studies identified hypermetabolism in cortico-striatal-thalamo-cortical circuitry, particularly in the orbito-frontal cortex, anterior cingulate cortex, and caudate nucleus (9). Large structural neuroimaging studies have described various abnormalities in OCD patients, including increased globus pallidus volume, reduced cortical thickness in the inferior parietal cortex, and lower surface area of the transverse temporal cortex (10). However, small effect sizes of these functional and anatomical abnormalities prevent clinically actionable practices, and even if more robust findings were identified, these imaging and analytic methodologies are impractical in most clinical settings.
First-line treatment for OCD [e.g., (11)] includes exposure-based cognitive-behavioral therapy (CBT), an intervention that assists clients to approach fear-inducing stimuli and build new neural connections that inhibit fear (6, 12). If after receiving CBT for a reasonable duration (12–16 sessions) a patient does not experience adequate symptom alleviation, therapy can be augmented or replaced by a pharmacological intervention, typically a selective serotonin reuptake inhibitor (SSRI) (11). Meta-analyses demonstrate benefits with large effect sizes for both treatment modalities (13, 14).
Many individuals with OCD do not respond to existing treatments, so numerous studies over the past decade have sought to characterize the neural changes that predict or accompany symptom improvement during treatment. Importantly, treatment predictors and correlates may be distinct. Correlation indicates that two variables—like a measure of brain function and a measure of symptom improvement—are associated; these relationships can be established retrospectively and do not satisfy claims of causation. In contrast, prediction suggests that a variable, such as a pre-treatment measure of brain activity, can anticipate the subsequent value of another, such as treatment response. The study designs and statistical analyses required to develop predictive claims are distinct from those required to establish correlation (15, 16).
Positron emission tomography (PET) imaging of brain perfusion and metabolic activity has been used to examine treatment correlates since the 1990s. One meta-analysis compiled 14 studies that treated patients with pharmacotherapy (SSRI or clomipramine) or CBT and measured cerebral blood flow or glucose metabolism (17). Across these studies, metabolic activity in the caudate, orbitofrontal cortex, and thalamus declined by the end of treatment, though average effect sizes were small. Recent studies using fMRI have built upon this research, filling important gaps in the literature by employing predictive frameworks. For example, in a randomized treatment trial, researchers found that baseline activation in the right temporal lobes and rostral anterior cingulate cortex during cognitive control, and in ventromedial prefrontal, orbitofrontal, lateral prefrontal cortex, and amygdala during reward processing, were associated with better CBT response (18).
By contrast to the substantial PET and fMRI literature, few studies have used electroencephalography (EEG) to characterize OCD treatment predictors and correlates. This is unfortunate, as EEG has both practical and scientific strengths. EEG is cheaper and easier to acquire than PET and fMRI and is therefore more easily deployed in clinical practice. EEG non-invasively measures electric fields generated by neural activity using scalp electrodes with high temporal resolution (19). As such, EEG is sensitive to neural synchronization and periodicity at time-scales commensurate with real-world perceptual and cognitive processing. These oscillatory signals can be quantified in different frequency bands, typically labeled by increasing frequency: delta (0.5–3 Hz), theta (4–7 Hz), alpha (8–12 Hz), beta (13–29 Hz), and gamma (30–100 Hz). EEG's temporal resolution is excellent, measured in milliseconds—compared to seconds in fMRI studies (20, 21). Despite its poor spatial resolution relative to fMRI and PET—especially for structures deep in the brain—aberrant EEG patterns have contributed to an understanding of numerous neuropsychiatric disorders, including panic disorder, post-traumatic stress disorder, autism, and anxiety disorders (22). In OCD, a recent systematic review described frontal asymmetries in alpha and theta bands, increased error related negativity, and perturbed REM sleep (23).
We provide a brief narrative review of the small EEG literature applied to the study of predictors and correlates of OCD treatment outcomes. Articles were located through PubMed, ProQuest, and Google Scholar and spanned all years. Included studies were treatment studies that included EEG predictors and/or correlates for OCD symptomatology. Developmentally focused studies including pediatric populations were excluded. As more work is needed in this area, we conclude with future research directions. If robust EEG predictors of treatment response can be identified, this approach may make it a valuable tool for biomarker-guided treatment selection and a move toward a precision medicine approach in the treatment of OCD.
OCD is characterized by excessive doubt, worry, and intolerance of uncertainty (24), which are reflected by abnormalities in error monitoring and response inhibition (25). When subjects make an error, correlates are observed in a fronto-central event-related potential (ERP), a time-locked pattern of brain activity (26). One ERP component that may differentiate symptom severity and treatment response in OCD is error-related negativity (ERN).
ERNs are observed following behavioral errors or failures of response inhibition, typically during go/no go or flanker tasks (27). The ERN is a negative ERP component that peaks 80–150 ms after the beginning of an erroneous response (28). The CRN is the corresponding response, typically of lower amplitude, after a correct response (29). These can emerge regardless of whether the participant is consciously aware of their error, suggesting that they are capturing subconscious or preconscious processes.
Riesel et al. (30) examined the ERN and CRN using the common Flanker Task (31). In this task, participants are shown stimuli with patterns that are congruent (a row of arrows pointing in the same direction), incongruent (a row of arrows, all but one pointing in the same direction), or neutral (one arrow presented). Participants must then rapidly indicate which they see. Incongruent trials are more difficult and often lead to errors. Pre-treatment, participants with OCD showed larger amplitudes in the ERN and CRN compared to healthy controls. These larger amplitudes persisted following psychotherapy despite symptom improvement. The researchers concluded that ERN abnormalities may represent an OCD-associated trait rather than a state-dependent correlate of symptomatology.
In a double-blinded study with 41 OCD patients, Carmi et al. (32) randomly assigned patients to high-frequency (20-hz), low-frequency (1-hz), or sham deep transcranial magnetic stimulation. The researchers examined the theta band at the Cz electrode during a Stroop task and found treatment-related reductions in ERN following treatment. Replication is needed, but this suggests that flanker and Stroop error-related activity differ, and that the latter may change with treatment.
Another relevant ERP component is the P300: a positive voltage waveform observed ~300 ms after a low-probability (oddball) target or novel stimulus. It is a correlate of attention allocation and working memory while one is processing new or salient information [reviewed in (33, 34)]. The P300 is thought to arise from a widely distributed brain network including the bilateral medial frontal gyrus, the supramarginal gyri, the anterior cingulate cortex, and the orbitofrontal cortex (35, 36). These regions overlap with those associated with OCD pathophysiology (37, 38).
The P300 is commonly elicited using an auditory oddball paradigm (39). In this task, repetitive sounds are infrequently interrupted by a variant sound to which the participant must respond. Studies employing this paradigm before and after OCD treatment have found that P300 amplitude and frequency differ at baseline in patients relative to controls, but that only the amplitude may show changes post treatment. At baseline subjects with untreated OCD showed reduced P300 amplitudes and longer latencies relative to healthy controls (40). Given that EEG signals are elicited from summated neural activity, a lower P300 amplitude coupled with a longer latency (response delay) may indicate that while neurons are still firing, they are less synchronized in OCD patients. Following SSRI treatment, P300 normalized, but latency did not change. Higher P300 amplitudes were correlated with reductions in the YBOCS. The dissociation of P300 amplitude and latency suggests that they reflect distinct processes. Similar results have been reported 1-year post psychotherapy and pharmacology trial: Post-treatment assessment showed increased P300 amplitude, closer to that seen in controls (41). This increase strongly correlated with reductions on the YBOCS, with no change in P300 latency.
These reports contrast with several studies that have not found reduced baseline P300 in OCD (42, 43). Indeed, in one treatment study, individuals with OCD had increased P300 amplitude at baseline compared to healthy controls (35). Following semi-standardized psychotherapy and psychopharmacological treatment (sertraline; 50–150 mg), P300 amplitude in the oddball paradigm declined. No changes in latency were observed. P300 amplitude at baseline in OCD may vary depending on technical factors or on the specific population studied but normalize with treatment. Thus, more work is needed to characterize the relationship of the P300 to OCD treatment response.
EEG power in specific frequency bands may be useful as a correlate of treatment response. A single study by Figee et al. (44) reported EEG oscillations after symptom provocation were strongly associated with therapeutic deep brain stimulation (DBS). In this study, 16 participants with OCD underwent nucleus accumbens-frontal network targeted DBS and showed stable clinical improvements for at least 1 year (44). DBS attenuated an increase in low-frequency activity seen after presentation of symptom-provoking stimuli. These EEG findings were complemented by a simultaneous fMRI analysis, highlighting the strength of a multi-modal imaging approach. Such multimodal investigations, combining EEG with fMRI, or other forms of imaging, are sparse in the OCD literature.
The literature examining EEG correlates and predictors of OCD treatment outcome has predominantly focused on ERPs or individual oscillations (45). However, EEG signals comprise complex nonlinear interactions across space, time, and frequency bands; examining individual waveforms or locations misses much of this complexity. Newer analytic techniques that consider these nonlinear dynamics have recently been developed and applied in studies of schizophrenia, psychosis, Alzheimer's, seizure, and more recently, OCD (46, 47).
One complexity measure is approximate entropy (ApEn). ApEn is the quantification of how unpredictable a pattern of fluctuations is in a time series (48, 49). A high ApEn value indicates a more random system; a low value indicates a system with more predictable patterns. In one study, Altuglu et al. recruited 57 OCD patients with average YBOCS scores in their mid-20s, half of whom were treatment-resistant and half of whom were treatment-responsive. Treatment resistance was defined stringently (failure to improve on the YBOCS after an adequate trial of SSRIs and CBT). ApEn was examined across frequency bands in treatment-resistant and treatment-responsive patients. The authors found that ApEn complexity values extracted from the beta band specifically discriminated best between groups: There was lower complexity in the treatment-resistant group across the whole brain. There was a statistically significant inverse correlation (r = −0.21 to r = −0.33) between beta band complexity and YBOCS scores across frontal, parietal, and occipital channels.
Another study examined whether complexity of EEG-arousal regulation at rest could predict treatment response (50). Participants underwent a 15-min resting-state EEG and were then randomized to 3–6 months of psychotherapy, pharmacology, or a combination. A repeat EEG session was conducted following treatment. When comparing treatment responders to non-responders, responders had less complex neural patterns at baseline and spent significantly less time at the highest CNS arousal stage. This finding was particularly pronounced in those who had undergone the combination intervention.
A notable limitation of EEG has been the difficulty of identifying where in the brain the measured oscillatory signals arise. Although all EEG outputs are measured at the scalp in two dimensions, they are generated in the underlying three-dimensional brain. It is difficult to determine where in the brain the observed electrophysiological activity originates (51). EEG's poor spatial resolution is attributable to several factors, including head and/or scalp modeling errors, as well as EEG noise that can limit source localization calculation accuracy (52). Recently, a mathematical strategy to address this limitation has emerged: Low-Resolution Brain Electromagnetic Tomography (LORETA); see (53, 54). LORETA uses signals measured at surface electrodes to infer the distribution of current source density through the full brain volume (55). Importantly, LORETA has relatively low spatial resolution—typically, the brain is segmented into 2,394 voxels. This contrasts to the higher resolution—tens of thousands of voxels—of modern MRI imaging. Thus, LORETA's source localization is not as reliable a model of regional brain activity as fMRI, and its use has been controversial in some fields. Nevertheless, LORETA has recently been applied to several DSM-5 diagnostic categories, including OCD.
Using resting-state EEG, Krause et al. (56) used LORETA in a prospective design to characterize treatment response in OCD patients undergoing 10 weeks of concurrent psychotherapy and pharmacotherapy. Participants were categorized as treatment responders or non-responders based on reported YBOCS symptom reduction. At baseline, responders had significantly lower power in the beta 1 (12.5–18 Hz), beta 2 (18.5–21.0 Hz), and beta 3 (21.5–30.0 Hz) bands, as well as reduced activity in alpha 2 (10.5–12.0 Hz), localized to the anterior cingulate cortex. At follow-up, when compared to baseline, responders showed lower resting-state activity in beta 1 and 3 bands, as well as the alpha 2 band localized in the orbito-frontal cortex. The opposite pattern was seen in non-responders, reinforcing this association. In another study examining resting-state EEG before and after pharmacological treatment, lower pre-treatment activity in the beta band within the rostral anterior cingulate and medial frontal gyrus was associated with greater therapeutic response (2). Together, these studies suggest that beta power in the anterior cingulate is a candidate predictor of treatment response in OCD. However, the literature is sparse, and more work is needed.
We provided a brief narrative summary of studies examining EEG in relation to treatment outcome in OCD. The included studies are summarized in Table 1.
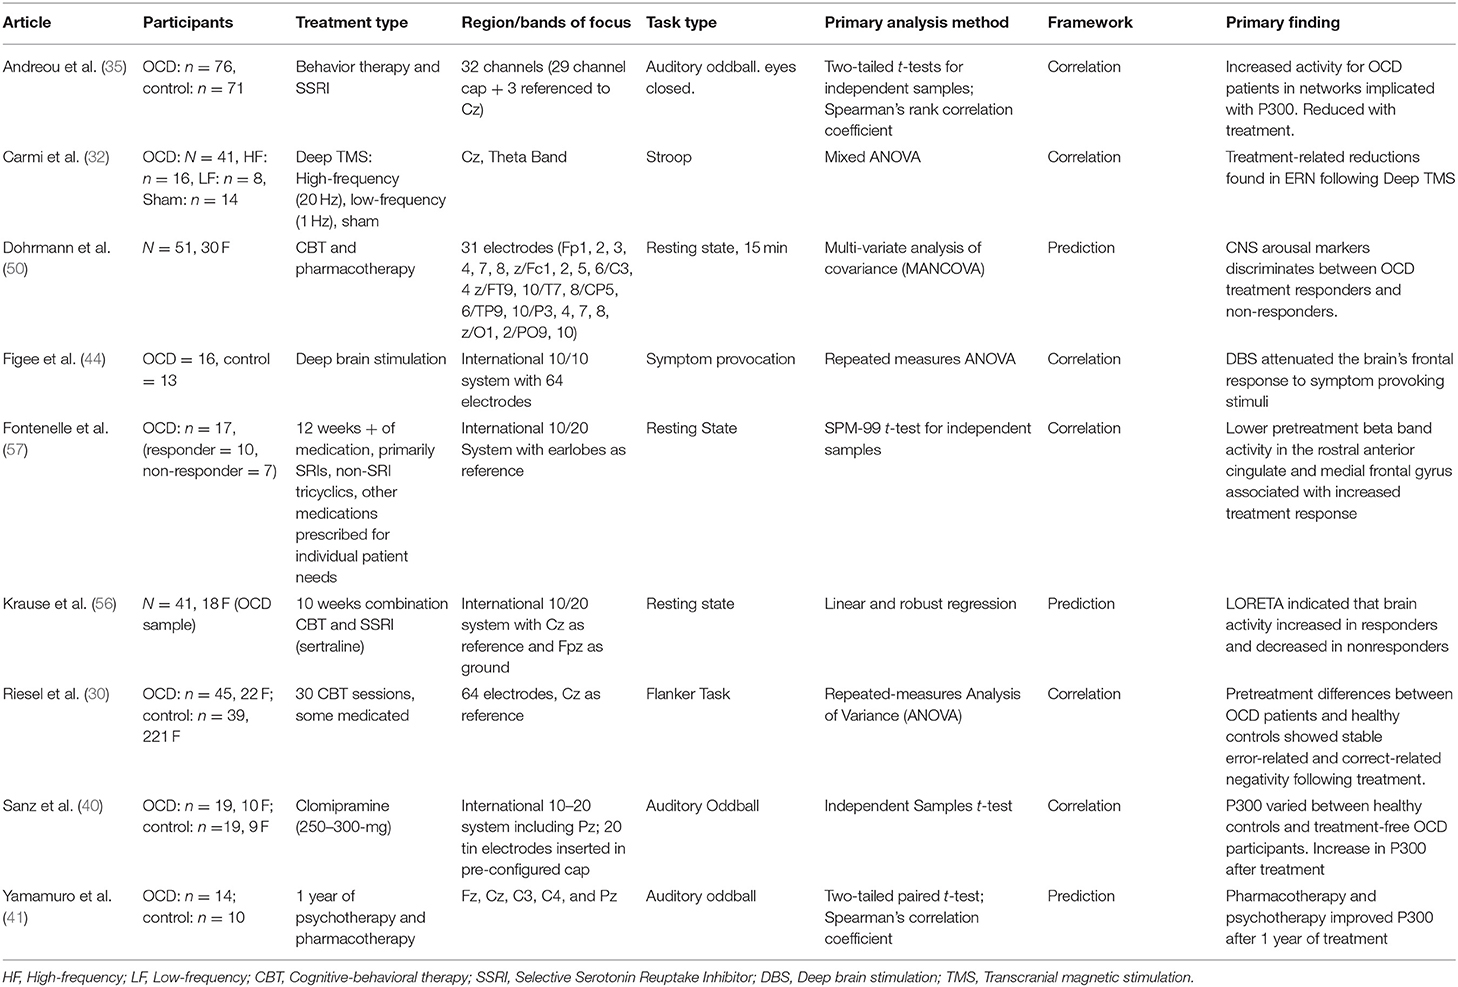
Table 1. Study summary.
The most striking conclusion from this brief review is how limited this literature is. Given the convenience and cost of EEG relative to MRI or PET imaging—and the consequent feasibility of deploying EEG measures at scale in clinical settings—such investigations merit closer attention.
An asymmetry uncovered by this review was between studies employing predictive vs. correlational methods. Few studies have attempted to truly predict behavior from EEG features (41, 50, 56), instead reporting descriptive associations between EEG features and clinical change. While this problem is not unique to the EEG literature (15), it is imperative for researchers to distinguish between studies that make causal or predictive claims vs. those that report correlations with symptom change. Larger, prospectively designed and cross validated studies are critical to better conceptualize the relationships between EEG measurements and OCD-related outcome variables (16).
Despite the thinness of this literature, there are clearly several avenues for future research. Notably, ERPs remain underexplored. The directionality, uniformity, and magnitude of change following treatment interventions remains unclear for the P300 and ERN/CRN. These discrepancies may be attributable to small sample sizes or differences in participant characteristics (e.g., severity, medication status, treatment type). For example, Yamamuro et al. (41), in a small sample (N = 14), found lower P300 amplitude at Cz and C4 at baseline in OCD; but this has not been consistently corroborated by other studies. Sanz et al. (40) also found lower P300 amplitude at baseline but found this at the Pz, not the Cz, and C4. Both studies found a statistically significant decrease in the P300 following pharmacotherapy and/or psychotherapy. This suggests that change in the P300 may be associated with symptom improvement with treatment, but research is needed to clarify these effects.
Another important variable in these studies is treatment type. Although most studies in this review combined pharmacotherapy and psychotherapy, their individual impact on brain function and their differential benefit to certain subsets of patients remains unknown. Sanz et al. (40) emphasize the role of the serotonergic system's influence on OCD pathophysiology, and by implication on EEG abnormalities associated with the condition, but their data cannot directly establish this. No studies to date have used EEG to examine the effects of CBT in unmedicated OCD or to systematically compared CBT to pharmacotherapy. Recent fMRI literature suggests that functional connectivity between large-scale brain networks changes following CBT (58); it will be fruitful to use EEG measures, which probe different aspects of brain network organization than fMRI, to address similar questions in homogenous patient samples.
Recent advances in EEG data processing are allowing for more complex and efficient analyses and better source localization. For example, Dohrmann et al. (50) used arousal regulation and CNS wakefulness stages to predict OCD treatment response. Fontenelle et al. (57) localized lower beta band activity in OCD to the rostral anterior cingulate and medial frontal gyrus, while Krause et al. (56) found differential beta band effects in treatment responders compared to nonresponders. These analytic approaches have the potential to provide a clearer picture of brain correlates of treatment reponse in OCD at the level of regions, networks, and frequency patterns.
PET and fMRI have several advantages, including their ability to identify areas of interest with high spatial resolution (9). Although EEG has lower spatial resolution, it measures qualitatively different characteristics of brain function, including oscillatory organization, and has a temporal resolution measured in milliseconds (20). Further, EEG may have more practical potential for widespread clinical deployment. As such, identifying actionable associations with treatment outcome is critical. Recent advances, such as techniques for band-specific source localization will only increase the potential of EEG analyses in the coming years. Overall, the literature examining associations between EEG measures of brain organization and OCD treatment outcomes is sparse, and more research is needed.
BZ: responsible for half of the manuscript writing, the manuscript conceptualization, organization, and synthesis of EEG literature with OCD treatment. Expert on CBT for OCD. ES: responsible for literature review, other half of manuscript writing, and managing editorial process. PS: expert consultant on EEG research and methods, provided conceptual, organizational suggestions for the paper, and provided editorial suggestions on technical aspects of EEG. CP: provided primary editorial suggestions on entire paper, served as expert consultant on neurobiology, and psychiatric treatment of OCD. All authors contributed to the article and approved the submitted version.
This work was funded in part by the State of Connecticut, Department of Mental Health and Addiction Services, but this publication does not express the views of the Department of Mental Health and Addiction Services or the State of Connecticut.
The views and opinions expressed are those of the authors.
The authors declare that the research was conducted in the absence of any commercial or financial relationships that could be construed as a potential conflict of interest.
All claims expressed in this article are solely those of the authors and do not necessarily represent those of their affiliated organizations, or those of the publisher, the editors and the reviewers. Any product that may be evaluated in this article, or claim that may be made by its manufacturer, is not guaranteed or endorsed by the publisher.
1. American Psychiatric Association. Diagnostic and Statistical Manual of Mental Disorders, 5th Edn (2013).
2. Fontenelle LF, Mendlowicz MV, Versiani M. The descriptive epidemiology of obsessive-compulsive disorder. Prog Neurpsychopharmacol Biol Psychiatry. (2006) 30:327–37. doi: 10.1016/j.pnpbp.2005.11.001
3. Karno M, Golding JM, Sorenson SB, Burnam MA. The epidemiology of obsessive-compulsive disorder in five US communities. Arch Gen Psychiatry. (1988) 45:1094–9. doi: 10.1001/archpsyc.1988.01800360042006
4. Kessler RC, Petukhova M, Sampson NA, Zaslavsky AM, Wittchen H-U. Twelve-month and lifetime prevalence and lifetime morbid risk of anxiety and mood disorders in the United States. Int J Methods Psychiatr Res. (2012) 21:169–84. doi: 10.1002/mpr.1359
5. Ruscio AM, Stein DJ, Chiu WT, Kessler RC. The epidemiology of obsessive-compulsive disorder in the National Comorbidity Survey Replication. Mol Psychiatry. (2010) 15:53–63. doi: 10.1038/mp.2008.94
6. Abramowitz JS, Deacon BJ, Whiteside SP. Exposure Therapy for Anxiety: Principles and Practice. New York, NY: Guilford Publications (2019).
7. Goodman WK, Price LH, Rasmussen SA, Mazure C, Fleischmann RL, Hill CL, et al. The Yale-Brown obsessive compulsive scale: I. Development, use, and reliability. Arch Gen Psychiatry. (1989) 46:1006–11. doi: 10.1037/t57982-000
9. Brennan B, Rauch S. Functional neuroimaging studies in obsessive-compulsive disorder: overview and synthesis. In: Pittenger C, editor. Obsessive-Compulsive Disorder: Phenomenology, Pathophysiology and Treatment. New York, NY: Oxford University Press (2017). p. 213–30.
10. Boedhoe PS, Schmaal L, Abe Y, Alonso P, Ameis SH, Anticevic A, et al. Cortical abnormalities associated with pediatric and adult obsessive-compulsive disorder: Findings from the ENIGMA Obsessive-Compulsive Disorder Working Group. Am J Psychiatry. (2018) 175:453–62. doi: 10.1176/appi.ajp.2017.17050485
11. Koran LM, Hanna GL, Hollander E, Nestadt G, Simpson HB. Practice guideline for the treatment of patients with obsessive-compulsive disorder. Am J Psychiatry. (2007) 164:5–53. Available online at: https://psychiatryonline.org/pb/assets/raw/sitewide/practice_guidelines/guidelines/ocd.pdf
12. Craske MG, Treanor M, Conway CC, Zbozinek T, Vervliet B. Maximizing exposure therapy: an inhibitory learning approach. Behav Res Ther. (2014) 58:10–23. doi: 10.1016/j.brat.2014.04.006
13. Öst L-G, Havnen A, Hansen B, Kvale G. Cognitive behavioral treatments of obsessive-compulsive disorder. A systematic review and meta-analysis of studies published 1993-2014. Clin Psychol Rev. (2015) 40:156–69. doi: 10.1016/j.cpr.2015.06.003
14. Soomro GM, Altman DG, Rajagopal S, Browne MO. Selective serotonin re-uptake inhibitors (SSRIs) versus placebo for obsessive compulsive disorder (OCD). Cochrane Database Syst Rev. (2008) 2008:CD001765. doi: 10.1002/14651858.CD001765.pub3
15. Rosenberg MD, Casey BJ, Holmes AJ. Prediction complements explanation in understanding the developing brain. Nat Commun. (2018) 9:589. doi: 10.1038/s41467-018-02887-9
16. Scheinost D, Noble S, Horien C, Greene AS, Lake EM, Salehi M, et al. Ten simple rules for predictive modeling of individual differences in neuroimaging. Neuroimage. (2019) 193:35–45. doi: 10.1016/j.neuroimage.2019.02.057
17. Van der Straten AL, Denys D, Van Wingen GA. Impact of treatment on resting cerebral blood flow and metabolism in obsessive compulsive disorder: a meta-analysis. Sci Rep. (2017) 7:1–8. doi: 10.1038/s41598-017-17593-7
18. Norman LJ, Mannella KA, Yang H, Angstadt M, Abelson JL, Himle JA, et al. Treatment-specific associations between brain activation and symptom reduction in OCD following CBT: a randomized fMRI trial. Am J Psychiatry. (2021) 178:39–47. doi: 10.1176/appi.ajp.2020.19080886
19. Biasiucci A, Franceschiello B, Murray MM. Electroencephalography. Curr Biol. (2019) 29:R80–R5. doi: 10.1016/j.cub.2018.11.052
20. Abreu R, Leal A, Figueiredo P. EEG-informed fMRI: a review of data analysis methods. Front Hum Neurosci. (2018) 12:29. doi: 10.3389/fnhum.2018.00029
21. Feinberg DA, Yacoub E. The rapid development of high speed, resolution and precision in fMRI. Neuroimage. (2012) 62:720–5. doi: 10.1016/j.neuroimage.2012.01.049
22. Newson JJ, Thiagarajan TC. EEG frequency bands in psychiatric disorders: a review of resting state studies. Front Hum Neurosci. (2019) 12:521. doi: 10.3389/fnhum.2018.00521
23. Perera MPN, Bailey NW, Herring SE, Fitzgerald PB. Electrophysiology of obsessive compulsive disorder: a systematic review of the electroencephalographic literature. J Anxiety Disord. (2019) 62:1–14. doi: 10.1016/j.janxdis.2018.11.001
24. Jacoby RJ, Abramowitz JS. Intolerance of uncertainty in OCD. In: Pittenger C, editor. Obsessive-Compulsive Disorder: Phenomenology, Pathophysiology, Treatment (New York, NY: Oxford University Press) (2017). p. 171–7.
25. Berlin GS, Lee H-J. Response inhibition and error-monitoring processes in individuals with obsessive-compulsive disorder. J Obsessive Compuls Relat Disord. (2018) 16:21–7. doi: 10.1016/j.jocrd.2017.11.001
26. Riesel A. The erring brain: Error-related negativity as an endophenotype for OCD-A review and meta-analysis. Psychophysiology. (2019) 56:22. doi: 10.1111/psyp.13348
27. Nawani H, Narayanaswamy JC, Basavaraju S, Bose A, Mahavir Agarwal S, Venkatasubramanian G, et al. Enhanced error related negativity amplitude in medication-naïve, comorbidity-free obsessive compulsive disorder. Psychiatry Res. (2018) 262:373–7. doi: 10.1016/j.psychres.2017.09.010
28. Gehring WJ, Goss B, Coles MG, Meyer DE, Donchin E. A neural system for error detection and compensation. Psychol Sci. (1993) 4:385–90. doi: 10.1111/j.1467-9280.1993.tb00586.x
29. Taylor JB, Visser TA, Fueggle SN, Bellgrove MA, Fox AM. The error-related negativity (ERN) is an electrophysiological marker of motor impulsiveness on the Barratt Impulsiveness Scale (BIS-11) during adolescence. Dev Cogn Neurosci. (2018) 30:77–86. doi: 10.1016/j.dcn.2018.01.003
30. Riesel A, Endrass T, Auerbach LA, Kathmann N. Overactive performance monitoring as an endophenotype for obsessive-compulsive disorder: evidence from a treatment study. Am J Psychiatry. (2015) 172:665–73. doi: 10.1176/appi.ajp.2014.14070886
31. Eriksen BA, Eriksen CW. Effects of noise letters upon the identification of a target letter in a nonsearch task. Percept Psychophys. (1974) 16:143–9. doi: 10.3758/BF03203267
32. Carmi L, Alyagon U, Barnea-Ygael N, Zohar J, Dar R, Zangen A. Clinical and electrophysiological outcomes of deep TMS over the medial prefrontal and anterior cingulate cortices in OCD patients. Brain Stimul. (2018) 11:158–65. doi: 10.1016/j.brs.2017.09.004
33. Polich J. Updating P300: an integrative theory of P3a and P3b. Clin Neurophysiol. (2007) 118:2128–48. doi: 10.1016/j.clinph.2007.04.019
34. Polich J, Criado JR. Neuropsychology and neuropharmacology of P3a and P3b. Int J Psychophysiol. (2006) 60:172–85. doi: 10.1016/j.ijpsycho.2005.12.012
35. Andreou C, Leicht G, Popescu V, Pogarell O, Mavrogiorgou P, Rujescu D, et al. P300 in obsessive-compulsive disorder: source localization and the effects of treatment. J Psychiatr Res. (2013) 47:1975–83. doi: 10.1016/j.jpsychires.2013.09.003
36. Wong M, Woody EZ, Schmidt LA, Ameringen MV, Soreni N, Szechtman H. Frontal EEG alpha activity and obsessive-compulsive behaviors in non-clinical young adults: a pilot study. Front Psychol. (2015) 6:1480. doi: 10.3389/fpsyg.2015.01480
37. Brázdil M, Dobsík M, Mikl M, Hlustík P, Daniel P, Pazourková M, et al. Combined event-related fMRI and intracerebral ERP study of an auditory oddball task. Neuroimage. (2005) 26:285–93. doi: 10.1016/j.neuroimage.2005.01.051
38. Picton TW. The P300 wave of the human event-related potential. J Clin Neurophysiol. (1992) 9:456–79. doi: 10.1097/00004691-199210000-00002
39. Sur S, Sinha VK. Event-related potential: an overview. Ind Psychiatry J. (2009) 18:70–3. doi: 10.4103/0972-6748.57865
40. Sanz M, Molina V, Martin-Loeches M, Calcedo A, Rubia FJ. Auditory P300 event related potential and serotonin reuptake inhibitor treatment in obsessive-compulsive disorder patients. Psychiatry Res. (2001) 101:75–81. doi: 10.1016/S0165-1781(00)00250-X
41. Yamamuro K, Okada K, Kishimoto N, Ota T, Iida J, Kishimoto T. A longitudinal, event-related potential pilot study of adult obsessive-compulsive disorder with 1-year follow-up. Neuropsychiatr Dis Treat. (2016) 12:2463–71. doi: 10.2147/NDT.S117100
42. Gohle D, Juckel G, Mavrogiorgou P, Pogarell O, Mulert C, Rujescu D, et al. Electrophysiological evidence for cortical abnormalities in obsessive-compulsive disorder - a replication study using auditory event-related P300 subcomponents. J Psychiatry Res. (2008) 42:297–303. doi: 10.1016/j.jpsychires.2007.01.003
43. Morault PM, Bourgeois M, Laville J, Bensch C, Paty J. Psychophysiological and clinical value of event-related potentials in obsessive-compulsive disorder. Biol Psychiatry. (1997) 42:46–56. doi: 10.1016/S0006-3223(96)00228-4
44. Figee M, Luigjes J, Smolders R, Valencia-Alfonso CE, Van Wingen G, De Kwaasteniet B, et al. Deep brain stimulation restores frontostriatal network activity in obsessive-compulsive disorder. Nat Neurosci. (2013) 16:386–7. doi: 10.1038/nn.3344
45. Altuglu TB, Metin B, Tülay EE, Tan O, Sayar GH, Taş C, et al. Prediction of treatment resistance in obsessive compulsive disorder patients based on EEG complexity as a biomarker. Clin Neurophysiol. (2020) 131:716–24. doi: 10.1016/j.clinph.2019.11.063
46. Ibáñez-Molina AJ, Iglesias-Parro S, Soriano MF, Aznarte JI. Multiscale Lempel-Ziv complexity for EEG measures. Clin Neurophysiol. (2015) 126:541–8. doi: 10.1016/j.clinph.2014.07.012
47. Veiga H, Deslandes A, Cagy M, Fiszman A, Piedade RAM, Ribeiro P. Neurocortical electrical activity tomography in chronic schizophrenics. Arquivos Neuropsiquiatr. (2003) 61:712–7. doi: 10.1590/S0004-282X2003000500002
48. Pincus SM. Approximate entropy as a measure of system complexity. Proc Natl Acad Sci U S A. (1991) 88:2297–301. doi: 10.1073/pnas.88.6.2297
49. Srinivasan V, Eswaran C, Sriraam N. Approximate entropy-based epileptic EEG detection using artificial neural networks. IEEE Trans Inf Technol Biomed. (2007) 11:288–95. doi: 10.1109/TITB.2006.884369
50. Dohrmann AL, Stengler K, Jahn I, Olbrich S. EEG-arousal regulation as predictor of treatment response in patients suffering from obsessive compulsive disorder. Clin Neurophysiol. (2017) 128:1906–14. doi: 10.1016/j.clinph.2017.07.406
51. Michel CM, Brunet D. EEG source imaging: a practical review of the analysis steps. Front Neurol. (2019) 10:325. doi: 10.3389/fneur.2019.00325
52. Grech R, Cassar T, Muscat J, Camilleri KP, Fabri SG, Zervakis M, et al. Review on solving the inverse problem in EEG source analysis. J Neuroeng Rehabil. (2008) 5:25. doi: 10.1186/1743-0003-5-25
53. Dattola S, Morabito FC, Mammone N, La Foresta F. Findings about LORETA applied to high-density EEG-A review. Electronics. (2020) 9:660. doi: 10.3390/electronics9040660
54. Pascual-Marqui RD, Michel CM, Lehmann D. Low resolution electromagnetic tomography: a new method for localizing electrical activity in the brain. Int J Psychophysiol. (1994) 18:49–65. doi: 10.1016/0167-8760(84)90014-X
55. Sherlin LH. Diagnosing and treating brain function through the use of low resolution brain electromagnetic tomography (LORETA). In: Budzynski TH, Budzynski HK, Evans JR, Abarbanel A, editors. Introduction to Quantitative EEG and Neurofeedback: Advanced Theory and Applications, 2nd Edn. Oxford, UK: Academic Press (2009). p. 83–102.
56. Krause D, Folkerts M, Karch S, Keeser D, Chrobok AI, Zaudig M, et al. Prediction of treatment outcome in patients with obsessive-compulsive disorder with low-resolution brain electromagnetic tomography: a prospective EEG study. Front Psychol. (2016) 6:1993. doi: 10.3389/fpsyg.2015.01993
57. Fontenelle LF, Mendlowicz MV, Ribeiro P, Piedade RA, Versiani M. Low-resolution electromagnetic tomography and treatment response in obsessive-compulsive disorder. Int J Neuropsychopharmacol. (2006) 9:89–94. doi: 10.1017/S1461145705005584
Keywords: electroencaphlography, EEG, obsessive-compulsive disorder, biomarker, brain imaging correlates, predictors
Citation: Zaboski BA, Stern EF, Skosnik PD and Pittenger C (2021) Electroencephalographic Correlates and Predictors of Treatment Outcome in OCD: A Brief Narrative Review. Front. Psychiatry 12:703398. doi: 10.3389/fpsyt.2021.703398
Received: 30 April 2021; Accepted: 21 June 2021;
Published: 02 August 2021.
Edited by:
Janardhan Y. C. Reddy, National Institute of Mental Health and Neurosciences (NIMHANS), IndiaReviewed by:
Ganesan Venkatasubramanian, National Institute of Mental Health and Neurosciences (NIMHANS), IndiaCopyright © 2021 Zaboski, Stern, Skosnik and Pittenger. This is an open-access article distributed under the terms of the Creative Commons Attribution License (CC BY). The use, distribution or reproduction in other forums is permitted, provided the original author(s) and the copyright owner(s) are credited and that the original publication in this journal is cited, in accordance with accepted academic practice. No use, distribution or reproduction is permitted which does not comply with these terms.
*Correspondence: Brian A. Zaboski, YnJpYW4uemFib3NraUB5YWxlLmVkdQ==
Disclaimer: All claims expressed in this article are solely those of the authors and do not necessarily represent those of their affiliated organizations, or those of the publisher, the editors and the reviewers. Any product that may be evaluated in this article or claim that may be made by its manufacturer is not guaranteed or endorsed by the publisher.
Research integrity at Frontiers
Learn more about the work of our research integrity team to safeguard the quality of each article we publish.