 Mahan Malihi1,2
 Jenny Nguyen
 Robyn E. Cardy
 Azadeh Kushki
94% of researchers rate our articles as excellent or good
Learn more about the work of our research integrity team to safeguard the quality of each article we publish.
Find out more
BRIEF RESEARCH REPORT article
Front. Psychiatry , 04 August 2020
Sec. Child and Adolescent Psychiatry
Volume 11 - 2020 | https://doi.org/10.3389/fpsyt.2020.00669
Virtual reality (VR) offers children with autism spectrum disorder (ASD) an inexpensive and motivating medium to learn and practice skills in a personalized, controlled, and safe setting; however, outcomes of VR interventions can vary widely. In particular, there is a need to understand the predictors of VR experience in children with ASD to inform the design of these interventions. To address this gap, a sample of children with ASD (n=35, mean age: 13.0 ± 2.6 years; 10 female) participated in a pilot study involving an immersive VR experience delivered through a head-mounted display. A data-driven approach was used to discover predictors of VR safety and sense of presence among a range of demographic and phenotypic user characteristics. Our results suggest that IQ may be a key predictor of VR sense of presence and that anxiety may modify the association between IQ and sense of presence. In particular, in low-anxiety participants, IQ was linearly related to experienced spatial presence and engagement, whereas, in high-anxiety participants, this association followed a quadratic form. The results of this pilot study, when replicated in larger samples, will inform the design of future studies on VR interventions for children with ASD.
Autism spectrum disorder (ASD) is a complex neurodevelopmental disorder defined by differences in social communication and the presence of restricted and/or repetitive behaviors (1). ASD is a highly heterogeneous condition with large variability in etiology (2, 3), neurobiology (4, 5), and phenotypic presentation (6). ASD is also associated with several co-occurring conditions such as anxiety, attention-deficit/hyperactivity disorder (ADHD), obsessive-compulsive disorder, epilepsy, and intellectual disability. Variability in the presence and severity of these co-occurring conditions further adds to the heterogeneity of ASD and intervention outcomes.
Timely and appropriate interventions and supports can improve long-term health and societal outcomes for many children with ASD (7, 8); however, most available evidence-based interventions are costly and resource-intensive (e.g., up to 40 h/wk of 1-on-1 therapy). The heterogeneity of ASD necessitates significant personalization of interventions, which further challenge treatment development. Technology-based interventions, if used appropriately, hold significant promise to reduce these barriers. One such technology is virtual reality (VR): computer-generated, interactive environments that simulate the real world by presenting the user with three-dimensional imagery. VR provides an inexpensive way to learn and repeatedly practice skills in a personalized, controlled, and safe setting (9, 10), and can improve ecological validity of interventions and generalizability of learned skills (11, 12). Feasibility studies have demonstrated the potential of VR for skills training across several domains including job interview training (13), vocational training (14), social cognition skills training (15–19), driving simulation (20, 21), and anxiety reduction (22). Despite this promise, the outcomes of VR interventions are highly variable. Moreover, VR use by children may be associated with physical, social, and psychological risks (23) including low therapeutic value, cybersickness, and increased screen time which may lead to social isolation, lack of physical activity, and obesity (24–26). Many VR systems now use head-mounted displays (HMDs), a mode of delivery of VR experiences that relies on glasses-like displays covering the user’s eyes to provide a three-dimensional view of a scene. While HMDs can enhance the sense of presence and immersiveness of VR experiences, their use has been associated with side effects, including cybersickness, a physical condition characterized by eye strain, headache, dizziness, and nausea. There is a significant gap in understanding these risks and predictors of optimal user experiences, especially given the highly diverse needs of children with ASD. This paucity of knowledge is a critical barrier to the implementation of VR for interventions in ASD, and identifying subgroups who may respond to VR in a similar manner will be a necessary precursor to investigations on clinical effectiveness. To address this gap, the present pilot study examined predictors of VR experience (sense of presence and safety) in children with ASD.
VR experience can be quantified through various measures including the sense of presence in the virtual environment (27), the degree of engagement with presented content (28–30), and the perceived ecological validity (31). In the general population, these dimensions of VR experience have been associated with anxiety (32), gender (33), and age (34) among other factors. However, the extent to which these predictors may impact VR experience in children with ASD is not well-understood. It also remains unclear whether additional variables such as ASD symptoms severity, IQ, and attention difficulties may also affect VR responses in children with ASD.
Two factors challenge our study of VR predictors in children with ASD. First, ASD is a multi-faceted condition with differences in several symptom domains that may impact VR experiences. These differences translate into a large number of candidate predictors of VR and limit the statistical power of traditional regression analyses. Second, the large variability across the autism spectrum can result in complex and nonlinear patterns of association between user characteristics and VR experiences. This necessitates the use of analytical tools beyond traditional linear regression methods that allow for the characterization of complex patterns.
To address the above challenges, the present paper proposes a machine-learning-based approach to discovering predictors of VR sense of presence and safety for children with ASD. Machine learning algorithms are powerful tools for discovering patterns of association among sets of variables directly from the data, often without prior assumptions on what these associations may be. When trained on appropriate datasets, these algorithms can capture highly complex and non-linear patterns in high dimensions. These algorithms also allow for effective variable selection, even with modest sample sizes. As such, these approaches hold significant potential as analytical tools for characterizing the heterogeneity in samples of children with ASD (35).
The dataset used in this study has been described in our previous work (36). The set contains data from a sample of 35 children and youth (mean age: 13.0 ± 2.6 years; 10 female) with ASD. The inclusion criteria were a clinical diagnosis of ASD, 8–18 years of age, full-scale and verbal IQ greater than 70, and normal or corrected-to-normal hearing and vision. Exclusion criteria were the use of beta-blockers as these affect autonomic responses, and contraindications for use of VR (history of migraines, seizures, vestibular conditions, hypertension, cardiovascular and circulatory diseases, history of difficulty differentiating between reality and fiction, and predisposition to motion sickness).
Participants were recruited through mail outs and study flyers. Figure 1 shows the recruitment and screening process. Of the 58 individuals who were interested in the study, 35 were enrolled.
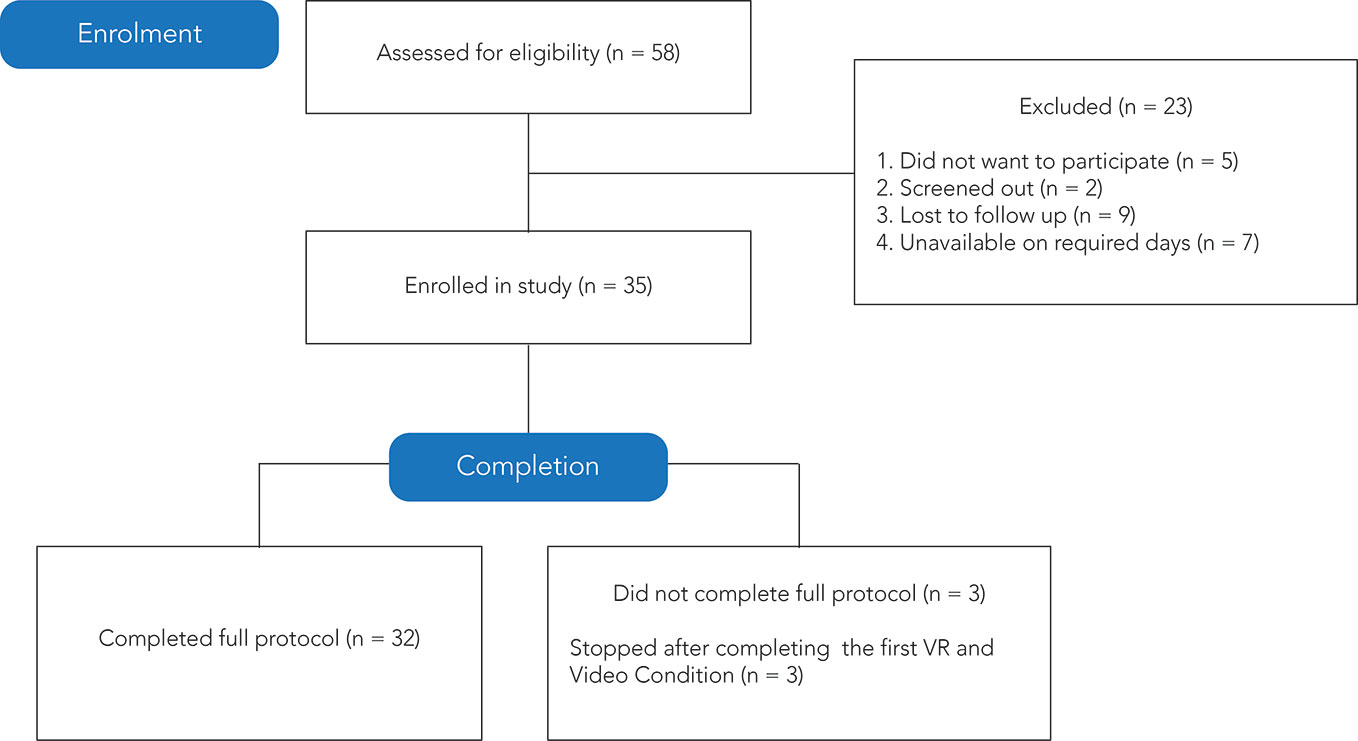
Figure 1 CONSORT (Consolidated Standards of Reporting Trials) (37) chart of recruitment, enrollment, and retention of participants.
The research ethics board at the Holland Bloorview Kids Rehabilitation Hospital and the University of Toronto approved the study. Participants who were deemed to have the capacity for consent provided written consent. Others provided assent and their legal guardians provided written consent.
Participants had a clinical diagnosis of ASD, confirmed by the gold-standard instruments: Autism Diagnostic Observation Schedule (ADOS) (38) and the Autism Diagnostic Interview-revised (ADI-R) (39). IQ was measured using the Wechsler Abbreviated Scale of Intelligence (WASI), second edition (40). ASD symptomatology was measured by the Social Communication Questionnaire (SCQ) (41, 42), a 40-item parent-report questionnaire probing ASD-like behaviors. ADHD symptoms were quantified using the attention problems subscale of the Child Behaviour Checklist (CBCL) (43), a parent report questionnaire of behavioral and emotional challenges in children. Baseline anxiety symptom severity was measured using the Screen for Child Anxiety Related Emotional Disorders (SCARED) (44), a 41-item parent report of anxiety symptoms in children.
The VR safety dimensions considered in this study included symptoms of cybersickness and anxiety. Cybersickness symptoms were quantified using the negative effects subscale of the Independent Television Commission—Sense of Presence Inventory (ITC-SoPI) (45), a 39-question self-report that measures four dimensions of user experience on a five-point Likert scale: spatial presence, engagement, ecological validity/naturalness, and negative effects. The ITC-SoPI has substantial psychometric evidence and has been used in previous studies examining the experience of VR in adults (9, 46) and adolescents (47, 48) with ASD. Items on the negative effects subscale probe symptoms related to dizziness, eyestrain, headache, nausea, and tiredness. Anxiety symptoms were quantified using the State-Trait Anxiety Inventory (STAI) (49, 50), which is a 20-question self-report questionnaire. We used the difference between STAI score at baseline and that after VR exposure as our measure of anxiety.
We quantified users’ sense of presence of the VR experience using three subscales of the ITC-SoPI questionnaire (spatial presence, engagement, and naturalness). The participants were also asked if they prefer the VR condition to the video condition (VR preference; yes/no/neutral).
Participation in this study entailed a single 2–3 h study visit to a research laboratory. The protocol consisted of a VR condition using an HMD (Oculus Rift, 2160 by 1200 resolution) and a monitor-displayed 360° video control condition (ViewSonic VP2468, 1920 by 1080 resolution). The HMD’s integrated audio system and Sony on-ear headphones provided audio for the VR and control conditions, respectively. Both conditions depicted the same 5-min scenario developed by Shaftesbury Films (shaftesbury.ca, 4096 by 2048 resolution, 29.97 frames per second) and in partnership with families and clinicians who had extensive experience with the challenges faced by children with ASD on school buses. The scenario placed the user seated inside a stationary school bus, with a driver and other children on the bus. During the scenario, seven children entered the bus and engaged in verbal interactions among each other. Several sensory and social triggers were presented, including street noise (e.g., sirens, construction equipment), and social stimuli (e.g., children entering the bus, children exhibiting behavioral issues, the driver reprimanding the children).
During the study visit, participants were seated in front of a computer monitor that displayed the stimuli and the study questionnaires (Supplementary Figure 2) and familiarized with the study protocol using a visual storyboard. Participants were instructed to explore the scenario by moving their head (VR) or a computer mouse (control). Following an initial baseline task, VR and control conditions were each repeated twice (presentation order of VR or control first was randomized) and separated by a subsequent baseline task in which participants watched 5-min clips from the Blue Planet series on a computer monitor (Supplementary Figure 1). The self-report questionnaires were administered throughout the study protocol as follows: the STAI following the initial baseline; STAI following each initial VR and control condition; and the ITC-SoPI following each final VR and control condition (Supplementary Figure 1).
Analyses were conducted in Python 3.7.3 using Scikit-learn toolbox (51) and JMP® (Version 13.2.1. SAS Institute Inc., Cary, NC, 1989-2019). The significance level for type I error in all tests was set to α = 0.05.
A feature vector with 14 user characteristics that affect VR experiences was associated with each participant (Supplementary Table 1). These features were age, sex, IQ (full-scale, verbal, and non-verbal), previous experience with VR (yes or no), SCQ total score, ADHD problems score from CBCL, and SCARED scores (subscales and total score). For the SCARED, subscale scores for panic disorder, generalized anxiety disorder, social phobia, and separation anxiety disorder were binarized based on clinical cut-offs.
The objective of this study was to identify top predictors of measures of safety (cybersickness, anxiety) and sense of presence (spatial presence, engagement, naturalness, preference) from user characteristics listed in Supplementary Table 1. Data-driven regression methods were used to identify predictors of continuous measures (spatial presence, engagement, naturalness) whereas classification was used to determine predictors of user preference (yes/no/neutral). Note that these are different than traditional linear regression analyses. In particular, four data-driven methods were used for both regression and classification. These included regularized linear regression using the elastic net method (52). Regularization can reduce model variability (53) and provides a built-in capacity for variable selection. To this end, we used the magnitude of regression coefficients to compute the importance of each predictor variable in the model (53). Elastic net was used with four combinations of parameters, with α=0 corresponding to traditional linear regression. We also used two ensemble methods namely, AdaBoost (54) and random forests (55) regression. These methods are shown to offer robustness to outliers (56) and enhanced performance compared to other regressors in a wide range of applications (57). They also provide outputs and feature weights that are readily interpretable (52, 55). The importance of each feature in these models was quantified as the permutation accuracy importance (55, 58). Finally, we used a multi-layer perceptron (MLP) as artificial neural networks provide flexibility to capture high complexity in the data (52). When used with a large number of features and layers, these models are difficult to interpret as the estimated parameters of the model, known as weights, are not directly convertible to a meaningful measure of relevance. However, given our simple design, the MLP can be used effectively for feature selection (59). To determine the importance of each feature, the dependent resampled input method was used (60).
Parameters of each model were determined based on a grid search in a leave-one-out cross-validation scheme (61). For the random forest, the criterion was based on the Gini coefficient, and 10 (maximum depth 5) and 25 (maximum depth 5) estimators were used for regression and classification, respectively. For AdaBoost, the weak learners were 20 and 50 decision trees with depths of 3 and 1 for regression and classification, respectively. For the MLP, a two-layer network with three neurons was used. The activation functions were tanh, linear, and Gaussian for regression (one from each) and relu for classification. For each feature, its overall importance on a given model was derived by averaging its importance in that model over all rounds of cross-validation. Significant features were determined using the elbow of the feature importance plot.
The machine learning approaches used here do not directly provide traditional regression statistics (e.g., R2, p value for the association of outcomes and predictors). Instead, the performance of these methods is commonly evaluated by examining the statistics for the association between true outcomes and those predicted by the regressor, with the null hypothesis of no association (regression coefficient is equal to zero; prediction are not better than chance). To mitigate the risk of over-fitting, leave-one-out cross-validation was used to evaluate the performance of each model. In this approach, data from all but one user were used to train the model, and the testing was performed on the remaining user data. The process was repeated for each participant, and performance was averaged over all folds of cross-validation.
Classification performance was quantified using precision and balanced accuracy. The latter is the percentage of correctly identified samples, where each sample is weighted according to the inverse prevalence of its true class to take into account class imbalance. To compute an aggregate measure for the three-class problem, the measures were averaged for each pair of classes. To evaluate if classification accuracy was greater than chance, the permutation test was used by training the classifier on 100 sets generated by randomizing the data labels (62).
Three of 35 participants did not complete the full study protocol. Reasons for dropout were seemingly related to the bus scenario (participant had prior negative experiences with school buses, participant was agitated by the whistling sounds in the scenario). As experience measurements of non-completers were incomplete, we were unable to include their data in the sense of presence and safety analyses. Participants’ demographic and phenotypic characteristics are shown below in Table 1 [see also (36)]. Seventy-four percent of participants preferred the HMD-VR to the video condition.
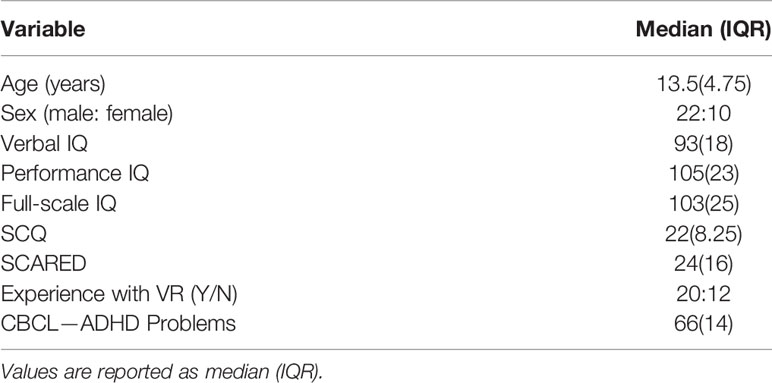
Table 1 Participant Information.
The statistics for the regression line characterizing the association between true values of the sense of presence measures and those predicted by each of the data-driven methods are reported in Table 2. For spatial presence, better than chance performance (significant associations between true outcomes and predictions) was achieved by the neural network (R2 = 0.4, β=0.42 ± 0.12, p=0.01), random forest (R2 = 0.4, β=0.35 ± 0.1, p<0.001), and AdaBoost (R2 = 0.4, β=0.37 ± 0.1, p<0.001). For engagement, better than chance performance was achieved by the neural network (R2 = 0.5, β=0.39 ± 0.1, p=0.03) and random forest (R2 = 0.2, β=0.32 ± 0.1, p=0.02). None of the models were able to predict negative effects or STAI difference.
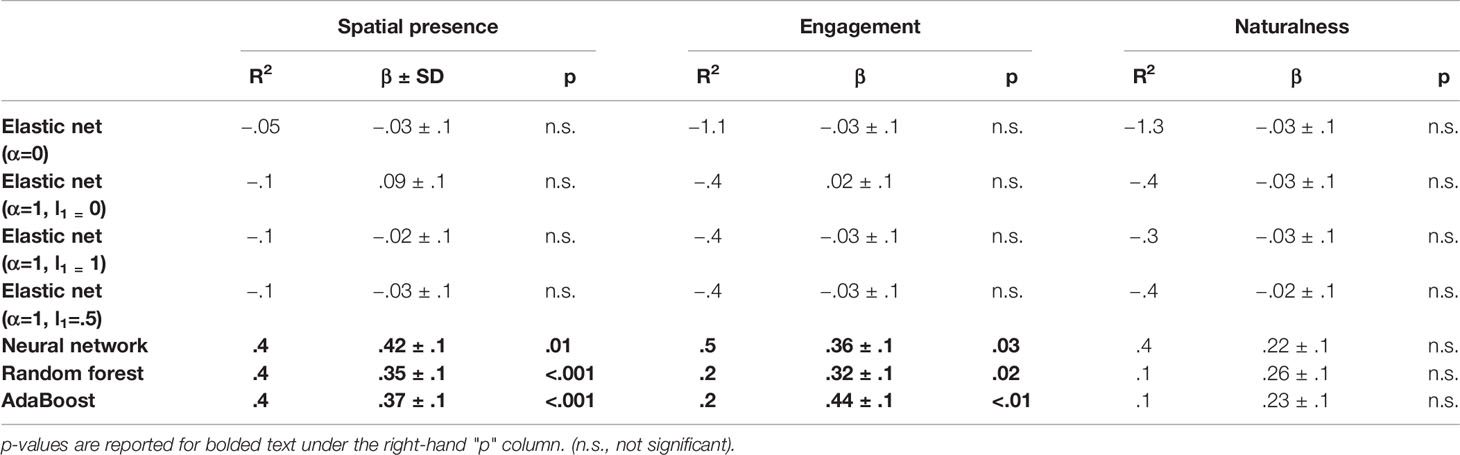
Table 2 Regression results for sense of presence.
For the classification problem, VR preference was predicted with better than chance accuracy by the random forest (permutation test; p=0.03). None of the other classifiers provided greater than chance accuracy (Supplementary Table 2; p=0.03).
For each regressor, the importance of user characteristics was computed as described in Analyses. The elbow in the scores plot occurred after the top two or three features for each regressor (Supplementary Figure 3). IQ consistently ranked as a top predictor of the sense of presence outcomes in all models except in one, followed by the SCARED scores.
Figure 2 revealed two subgroups stratified by SCARED score: the first group, characterized by below-threshold score on the SCARED (n=16; SCARED<25), showed a linear association between IQ and spatial presence/engagement (spatial presence: R2 = 0.56, β=−0.07 ± 0.01, p=0.008; engagement: R2 = 0.50, β=−0.05 ± 0.01, p=0.002). For the second subgroup (n=15; SCARED≥25), the association between IQ and spatial presence/engagement, followed a quadratic function (spatial presence: R2 = 0.49, β1=−0.019 ± 0.012, β2=−0.003 ± 0.000, p=0.02; engagement: R2 = 0.55, β1=−0.012 ± 0.011, β2=−0.003 ± 0.000, p=0.007). Detailed statistical results are presented in Supplementary Table 3.
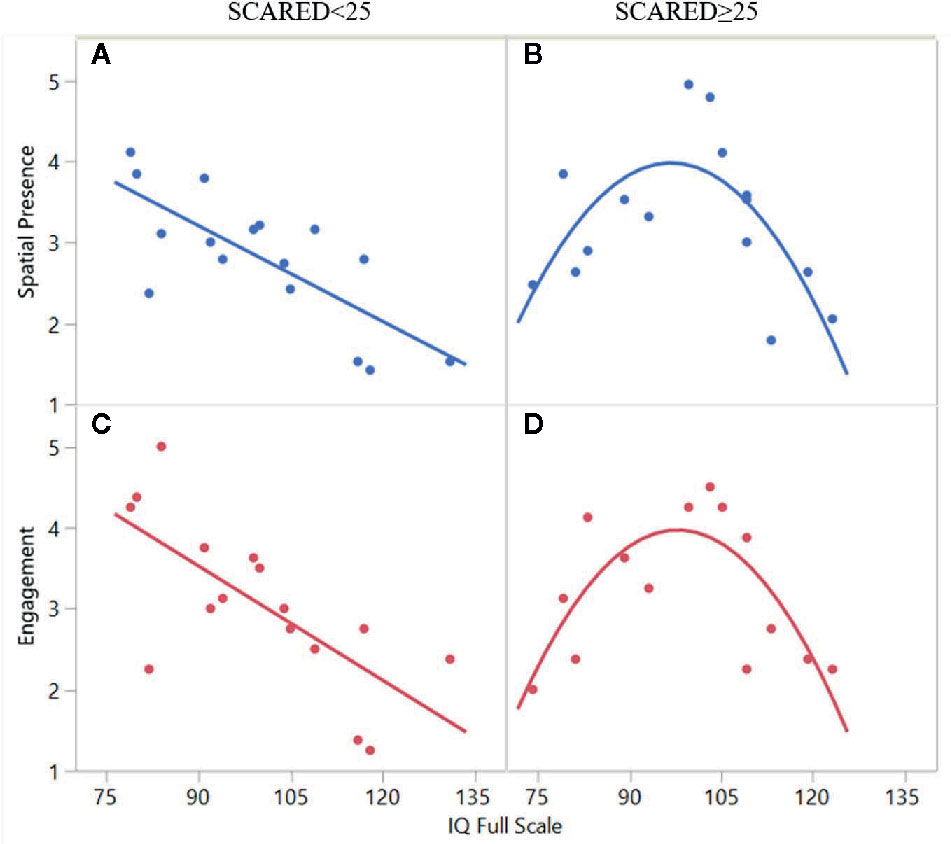
Figure 2 The association between full-scale IQ and spatial presence/engagement in two subgroups of participants: panels A and C depict a linear association for participants without anxiety (SCARED>25) and panels B and D depict a quadratic function for participants with anxiety (SCARED>25).
In this pilot study, we used data-driven approaches to discover predictors of VR safety and sense of presence for children with ASD. These approaches have the potential to address the complexity that arises from the large variability in the characteristics of children with ASD. They are also particularly useful for generating hypotheses regarding key predictors among a large number of demographic and phenotypic characteristics that may impact the VR experience. In particular, we examined four models for predicting user-reported ratings of sense of presence (spatial presence, naturalness, engagement) and safety (cybersickness, anxiety). These included elastic nets, random forests, AdaBoost, and neural networks. The neural network, random forest, and AdaBoost performed provided the best predictions of experience outcomes, suggesting a non-linear association between predictors and sense of presence outcomes.
The most accurately predicted target across all models was spatial presence, followed by engagement. Both of these variables are important dimensions of VR experiences that have been associated with response to VR interventions (63). Sense of presence is a “psychological state in which virtual objects are experienced as actual objects in either sensory or nonsensory ways” (64). This key aspect of VR experience has shown to predict responses to VR interventions by facilitating knowledge acquisition and transferability to real environments (65). Engagement reflects attention to the virtual stimuli and has been associated with enhanced intervention effectiveness (66). IQ (full-scale, verbal, performance) and anxiety traits (measured by the SCARED) were identified as key predictors of spatial presence and engagement across different estimators. One estimator (random forest) also identified attention (as measured by the CBCL) as a predictor of spatial presence. Only one other study has considered the role of IQ in VR, suggesting that IQ is not a predictor of willingness to use HMDs (46). The results of our study highlight the role of IQ as an important consideration in VR use. Future studies are needed to replicate and further examine this issue.
The association of anxiety with spatial presence was not surprising as previous studies in other populations have reported an increased sense of presence with heightened state anxiety (67). One explanation for this association may be increased vigilance during states of anxiety. Interestingly, our data-driven approach suggested that anxiety may modify the association between IQ and sense of presence. In particular, we identified two types of associations between spatial presence/engagement and IQ, depending on whether or not a participant had clinically significant anxiety based on the SCARED. For the group of participants without anxiety, spatial presence/engagement were negatively associated with IQ in a linear fashion. This negative linear association may be related to the enhanced ability of participants with higher IQ scores to differentiate between the real and virtual worlds. Our results suggest that anxiety may change the association between presence/engagement and IQ from a linear to a quadratic function, suggesting that the presence of anxiety in participants with lower IQs may decrease the sense of presence. In the high-anxiety group, those with IQ scores in the average range (85–115) reported the highest experience of spatial presence/engagement.
None of the methods used in this study were able to successfully predict cybersickness or anxiety experienced during the VR emersion. User experiences of VR are thought to be impacted by both user characteristics as well as factors extrinsic to the user such as system characteristics, task characteristics, and media content (67). As this study only considered the user characteristics, it may be possible that these negative effects can be better predicted by external factors such the degree and type of motion in the VR experience or the duration of exposure (68, 69). Future studies are needed to further investigate the role of these factors.
Another unexpected finding in this study was that, in contrast to other studies of the general population, our methods did not identify age and sex as significant predictors of cybersickness. This may be related to our narrow age range (70–72) or sex differences in ASD.
The findings of this pilot study must be interpreted in the context of several limitations. First, our modest sample size may have resulted in overfitting of our complex machine learning models. Second, given our recruitment strategy, individuals with previous negative VR experiences may not have self-identified to partake in the study. This may have resulted in sampling bias and overly optimistic outcomes. Third, we were unable to obtain outcome measures for participants who did not complete the study and our conclusions are limited to the completer sample. Future studies with an intent-to-treat design are needed to further examine the safety and tolerability in non-completers. Fourth, our study only included participants without intellectual disability. Future studies are needed to examine VR safety and tolerability in a more diverse sample. Fifth, this study only considered a limited set of user characteristics. Future studies are needed to examine the impact of other characteristics, such as sensory differences, on VR experiences. Lastly, the VR content tested in the study was limited to only one, short scenario. Long-term exposure to different types of VR content (e.g., high motion) may be associated with other predictors of safety and sense of presence. Consequently, the interaction of user characteristics and VR content features was not considered; future studies with multiple scenarios may be able to elucidate these effects. In the context of long-term exposure, other measures of safety, such as dependency, decrease in physical activity, and sleep difficulties should be considered.
To our knowledge, this pilot, hypothesis-generating study is the first to examine predictors of VR safety and sense of presence in children with ASD. Through a data-driven approach, we identified IQ and anxiety to important variables for consideration in future studies of VR usability in this population.
We examined the effect of user characteristics on sense of presence and safety of VR for children with ASD. Given the heterogeneity in ASD, we employed a data-driven approach based on machine learning. Our results suggest that IQ and anxiety may affect VR usability in this sample.
The datasets generated for this study will not be made publicly to available because public disclosure of data was not included in the ethics approval and participant informed consent.
This study involving human participants was reviewed and approved by Holland Bloorview Kids Rehabilitation Hospital. Written informed consent to participate in this study was provided by participants who were deemed to have the capacity for consent, others provided assent and their legal guardians provided written informed consent.
MM led the data analysis, interpretation of results, and drafted the manuscript. JN contributed to conceptualization of the protocol, data collection, data analysis, and drafting of the manuscript. RC contributed to the interpretation of results and drafting of the manuscript. SE and CP conceptualized and designed the study and contributed to interpretation of the results and drafting of the manuscript. AK conceptualized and designed the study, and contributed to data analyses, interpretation of the results, and drafting of the manuscript.
The study was funded by the Natural Sciences and Engineering Research Council of Canada (NSERC) and Ontario Centres of Excellence (OCE) grant number 26308. Shaftesbury, a media company developing VR experiences for children, including those with ASD, contributed to NSERC/OCE funding. MM was funded by the Holland Bloorview Foundation Graduate Student Scholarship.
This study was partially funded by Shaftesbury, who may benefit financially from commercialization of virtual reality experiences for children with ASD. AK serves on the Board of Advisors for Shaftesbury Technology.
The remaining authors declare that the research was conducted in the absence of any commercial or financial relationships that could be construed as a potential conflict of interest.
The authors would like to thank participants and their families for contributing to this research by volunteering their time. The authors would also like to thank Holland Bloorview Foundation for their financial support.
The Supplementary Material for this article can be found online at: https://www.frontiersin.org/articles/10.3389/fpsyt.2020.00669/full#supplementary-material
1. American Psychiatric Association. Diagnostic and statistical manual of mental disorders (DSM-5®). Arlington, VA: American Psychiatric Pub (2013).
2. de la Torre-Ubieta L, Won H, Stein JL, Geschwind DH. Advancing the understanding of autism disease mechanisms through genetics. Nat Med (2016) 22(4):345–61. doi: 10.1038/nm.4071
3. Vorstman JA, Parr JR, Moreno-De-Luca D, Anney RJ, Nurnberger JI Jr., Hallmayer JF. Autism genetics: opportunities and challenges for clinical translation. Nat Rev Genet (2017) 18(6):362. doi: 10.1038/nrg.2017.4
4. Ellegood J, Anagnostou E, Babineau B, Crawley J, Lin L, Genestine M, et al. Clustering autism: using neuroanatomical differences in 26 mouse models to gain insight into the heterogeneity. Mol Psychiatry (2015) 20(1):118–25. doi: 10.1038/mp.2014.98
5. Wang J-B, Zheng L-J, Cao Q-J, Wang Y-F, Sun L, Zang Y-F, et al. Inconsistency in abnormal brain activity across cohorts of ADHD-200 in children with attention deficit hyperactivity disorder. Front Neurosci (2017) 11:320. doi: 10.3389/fnins.2017.00320
6. Bragdon LB, Coles ME. Examining heterogeneity of obsessive-compulsive disorder: Evidence for subgroups based on motivations. J Anxiety Disord (2017) 45:64–71. doi: 10.1016/j.janxdis.2016.12.002
7. Magiati I, Tay XW, Howlin P. Cognitive, language, social and behavioural outcomes in adults with autism spectrum disorders: A systematic review of longitudinal follow-up studies in adulthood. Clin Psychol Rev (2014) 34(1):73–86. doi: 10.1016/j.cpr.2013.11.002
8. Steinhausen H, Mohr Jensen C, Lauritsen M. A systematic review and meta-analysis of the long-term overall outcome of autism spectrum disorders in adolescence and adulthood. Acta Psychiatr Scand (2016) 133(6):445–52. doi: 10.1111/acps.12559
9. Newbutt N, Sung C, Kuo HJ, Leahy MJ. The acceptance, challenges, and future applications of wearable technology and virtual reality to support people with autism spectrum disorders. In: Recent Advances in Technologies for Inclusive Well-Being. Cham, Switzerland: Springer (2017). p. 221–41.
10. Parsons S, Cobb S. State-of-the-art of virtual reality technologies for children on the autism spectrum. Eur J Spec Needs Educ (2011) 26(3):355–66. doi: 10.1080/08856257.2011.593831
11. Moore D, Cheng Y, McGrath P, Powell NJ. Collaborative virtual environment technology for people with autism. Focus Autism Dev Disabil (2005) 20(4):231–43. doi: 10.1177/10883576050200040501
12. Parsons S, Mitchell P, Leonard A. Do adolescents with autistic spectrum disorders adhere to social conventions in virtual environments? Autism (2005) 9(1):95–117. doi: 10.1177/1362361305049032
13. Smith MJ, Ginger EJ, Wright K, Wright MA, Taylor JL, Humm LB, et al. Virtual reality job interview training in adults with autism spectrum disorder. J Autism Dev Disord (2014) 44(10):2450–63. doi: 10.1007/s10803-014-2113-y
14. Bozgeyikli L, Bozgeyikli E, Clevenger M, Raij A, Alqasemi R, Sundarrao S, et al. VR4VR: vocational rehabilitation of individuals with disabilities in immersive virtual reality environments. In: Proceedings of the 8th ACM International Conference on PErvasive Technologies Related to Assistive Environments Corfu, Greece (2015) 1–4.
15. Bian D, Wade JW, Zhang L, Bekele E, Swanson A, Crittendon JA, et al. A novel virtual reality driving environment for autism intervention. Berlin, Heidelberg: Springer (2013). p. 474–83.
16. Didehbani N, Allen T, Kandalaft M, Krawczyk D, Chapman S. Virtual reality social cognition training for children with high functioning autism. Comput Hum Behav (2016) 62:703–11. doi: 10.1016/j.chb.2016.04.033
17. Kandalaft MR, Didehbani N, Krawczyk DC, Allen TT, Chapman SB. Virtual reality social cognition training for young adults with high-functioning autism. J Autism Dev Disord (2013) 43(1):34–44. doi: 10.1007/s10803-012-1544-6
18. Ke F, Im T. Virtual-reality-based social interaction training for children with high-functioning autism. J Educ Res (2013) 106(6):441–61. doi: 10.1080/00220671.2013.832999
19. Lorenzo G, Lledó A, Pomares J, Roig R. Design and application of an immersive virtual reality system to enhance emotional skills for children with autism spectrum disorders. Comput Educ (2016) 98:192–205. doi: 10.1016/j.compedu.2016.03.018
20. Cox DJ, Brown T, Ross V, Moncrief M, Schmitt R, Gaffney G, et al. Can youth with autism spectrum disorder use virtual reality driving simulation training to evaluate and improve driving performance? An exploratory study. J Autism Dev Disord (2017) 47(8):2544–55. doi: 10.1007/s10803-017-3164-7
21. Zhang L, Wade J, Bian D, Fan J, Swanson A, Weitlauf A, et al. Cognitive load measurement in a virtual reality-based driving system for autism intervention. IEEE Trans Affect Comput (2017) 8(2):176–89. doi: 10.1109/TAFFC.2016.2582490
22. Maskey M, Lowry J, Rodgers J, McConachie H, Parr JR. Reducing specific phobia/fear in young people with autism spectrum disorders (ASDs) through a virtual reality environment intervention. PLoS One (2014) 9(7):e100374. doi: 10.1371/journal.pone.0100374
23. Bradley R, Newbutt N. Autism and virtual reality head-mounted displays: A state of the art systematic review. J Technol (2018) 12(3):101–13. doi: 10.1108/JET-01-2018-0004
24. Healy S, Haegele JA, Grenier M, Garcia JM. Physical Activity, Screen-Time Behavior, and Obesity Among 13-Year Olds in Ireland with and without Autism Spectrum Disorder. J Autism Dev Disord (2017) 47(1):49–57. doi: 10.1007/s10803-016-2920-4
25. LeBlanc AG, Katzmarzyk PT, Barreira TV, Broyles ST, Chaput J-P, Church TS, et al. Correlates of Total Sedentary Time and Screen Time in 9–11 Year-Old Children around the World: The International Study of Childhood Obesity, Lifestyle and the Environment. PLoS One (2015) 10(6):e0129622. doi: 10.1371/journal.pone.0129622
26. Must A, Phillips S, Curtin C, Bandini LG. Barriers to physical activity in children with autism spectrum disorders: relationship to physical activity and screen time. J Phys Act Health (2015) 12(4):529–34. doi: 10.1123/jpah.2013-0271
27. Fox J, Christy KR, Vang MH. 11 The Experience of Presence in Persuasive Virtual Environments. In: Riva G, Waterworth J, Murray D, editors. Interacting with Presence. Berlin, Boston: De Gruyter (2014). p. 164–78. Available from: https://www.degruyter.com/view/book/9783110409697/10.2478/9783110409697.11.xml.
28. Boucenna S, Narzisi A, Tilmont E, Muratori F, Pioggia G, Cohen D, et al. Interactive technologies for autistic children: A review. Cognit Comput (2014) 6(4):722–40. doi: 10.1007/s12559-014-9276-x
29. Mikropoulos TA, Natsis A. Educational virtual environments: A ten-year review of empirical research (1999–2009). Comput Educ (2011) 56(3):769–80. doi: 10.1016/j.compedu.2010.10.020
30. Witmer BG, Jerome CJ, Singer MJ. The factor structure of the presence questionnaire. Presence Teleoperators Virtual Environ (2005) 14(3):298–312. doi: 10.1162/105474605323384654
31. Georgescu AL, Kuzmanovic B, Roth D, Bente G, Vogeley K. The use of virtual characters to assess and train non-verbal communication in high-functioning autism. Front Hum Neurosci (2014) 8:807. doi: 10.3389/fnhum.2014.00807
32. Riches S, Elghany S, Garety P, Rus-Calafell M, Valmaggia L. Factors affecting sense of presence in a virtual reality social environment: A qualitative study. Cyberpsychol Behav Soc Netw (2019) 22(4):288–92. doi: 10.1089/cyber.2018.0128
33. Felnhofer A, Kothgassner OD, Hauk N, Beutl L, Hlavacs H, Kryspin-Exner I. Physical and social presence in collaborative virtual environments: Exploring age and gender differences with respect to empathy. Comput Hum Behav (2014) 31:272–9. doi: 10.1016/j.chb.2013.10.045
34. Siriaraya P, Siang Ang C. Age differences in the perception of social presence in the use of 3D virtual world for social interactionq. Interact Comput (2012) 24(4):280–91. doi: 10.1016/j.intcom.2012.03.003
35. Lombardo MV, Lai M-C, Baron-Cohen S. Big data approaches to decomposing heterogeneity across the autism spectrum. Mol Psychiatry (2019) 24(10):1435–50. doi: 10.1038/s41380-018-0321-0
36. Malihi M, Nguyen J, Cardy RE, Eldon S, Petta C, Kushki A. Short report: Evaluating the safety and usability of head-mounted virtual reality compared to monitor-displayed video for children with autism spectrum disorder (ASD). Autism (2020) 1–6. doi: 10.1177/1362361320934214
37. Moher D, Schulz KF, Altman D. The CONSORT statement: revised recommendations for improving the quality of reports of parallel-group randomized trials. JAMA (2001) 285:1987–91.
38. Lord C, Risi S, Lambrecht L, Cook EH, Leventhal BL, DiLavore PC, et al. The Autism Diagnostic Observation Schedule—Generic: A standard measure of social and communication deficits associated with the spectrum of autism. J Autism Dev Disord (2000) 30(3):205–23. doi: 10.1037/t17256-000
39. Lord C, Rutter M, Le Couteur A. Autism Diagnostic Interview-Revised: a revised version of a diagnostic interview for caregivers of individuals with possible pervasive developmental disorders. J Autism Dev Disord (1994) 24(5):659–85. doi: 10.1007/BF02172145
40. Wechsler D. Wechsler Abbreviated Scale of Intelligence Second Edition (WASI-II). San Antonio. TX: Pearson (2011).
41. Berument SK, Rutter M, Lord C, Pickles A, Bailey A. Autism screening questionnaire: diagnostic validity. Br J Psychiatry (1999) 175(5):444–51. doi: 10.1192/bjp.175.5.444
42. Rutter M, Bailey A, Lord C. The Social Communication Questionnaire. Los Angeles, CA: Western Psychological Services (2003).
43. Achenbach TM. The Child Behavior Checklist and related instruments. Lawrence Erlbaum Associates Publishers (1999).
44. Birmaher B, Khetarpal S, Brent D, Cully M, Balach L, Kaufman J, et al. The screen for child anxiety related emotional disorders (SCARED): Scale construction and psychometric characteristics. J Am Acad Child Adolesc Psychiatry (1997) 36(4):545–53. doi: 10.1097/00004583-199704000-00018
45. Lessiter J, Freeman J, Keogh E, Davidoff J. A cross-media presence questionnaire: The ITC-Sense of Presence Inventory. Presence Teleoperators Virtual Environ (2001) 10(3):282–97. doi: 10.1162/105474601300343612
46. Newbutt N, Sung C, Kuo H-J, Leahy MJ, Lin C-C, Tong B. Brief report: A pilot study of the use of a virtual reality headset in autism populations. J Autism Dev Disord (2016) 46(9):3166–76. doi: 10.1007/s10803-016-2830-5
47. Wallace S, Parsons S, Bailey A. Self-reported sense of presence and responses to social stimuli by adolescents with autism spectrum disorder in a collaborative virtual reality environment. J Intellect Dev Disabil (2017) 42(2):131–41. doi: 10.3109/13668250.2016.1234032
48. Wallace S, Parsons S, Westbury A, White K, White K, Bailey A. Sense of presence and atypical social judgments in immersive virtual environments: Responses of adolescents with Autism Spectrum Disorders. Autism (2010) 14(3):199–213. doi: 10.1177/1362361310363283
49. Chlan L, Savik K, Weinert C. Development of a shortened state anxiety scale from the Spielberger State-Trait Anxiety Inventory (STAI) for patients receiving mechanical ventilatory support. J Nurs Meas (2003) 11(3):283–93. doi: 10.1891/jnum.11.3.283.61269
50. Tluczek A, Henriques JB, Brown RL. Support for the reliability and validity of a six-item state anxiety scale derived from the State-Trait Anxiety Inventory. J Nurs Meas (2009) 17(1):19. doi: 10.1891/1061-3749.17.1.19
51. Pedregosa F, Varoquaux G, Gramfort A, Michel V, Thirion B, Grisel O, et al. Scikit-learn: Machine learning in Python. J Mach Learn Res (2011) 12:2825–30.
52. Hastie T, Tibshirani R, Friedman J. The elements of statistical learning: data mining, inference, and prediction. Springer Science & Business Media (2009).
53. Zou H, Hastie T. Regularization and variable selection via the elastic net. J R Stat Soc Ser B Stat Methodol (2005) 67(2):301–20. doi: 10.1111/j.1467-9868.2005.00503.x
54. Freund Y, Schapire RE. A desicion-theoretic generalization of on-line learning and an application to boosting. Berlin, Heidelberg: Springer (1995) p. 23–37.
56. Härdle WK, Simar L. Computationally Intensive Techniques. In: Härdle WK, Simar L, editors. Applied Multivariate Statistical Analysis. Berlin, Heidelberg: Springer (2015). p. 501–54. doi: 10.1007/978-3-662-45171-7_20
57. Fernández-Delgado M, Cernadas E, Barro S, Amorim D. Do we need hundreds of classifiers to solve real world classification problems? J Mach Learn Res (2014) 15(1):3133–81.
58. Strobl C, Boulesteix A-L, Zeileis A, Hothorn T. Bias in random forest variable importance measures: Illustrations, sources and a solution. BMC Bioinf (2007) 8(1):25. doi: 10.1186/1471-2105-8-25
59. Ledesma S, Cerda G, Avina G, Hernández D, Torres M. Feature selection using artificial neural networks. Berlin, Heidelberg: Springer (2008) p. 351–9.
60. Saltelli A. Making best use of model evaluations to compute sensitivity indices. Comput Phys Commun (2002) 145(2):280–97. doi: 10.1016/S0010-4655(02)00280-1
61. Hsu C-W, Chang C-C, Lin C-J. A practical guide to support vector classification. Department of Computer Science, National Taiwan University (2003). Technical Report.
62. Golland P, Liang F, Mukherjee S, Panchenko D. Permutation tests for classification. Berlin, Heidelberg: Springer (2005). p. 501–15.
63. Fox J, Bailenson J, Binney J. Virtual experiences, physical behaviors: The effect of presence on imitation of an eating avatar. Presence Teleoperators Virtual Environ (2009) 18(4):294–303. doi: 10.1162/pres.18.4.294
64. Lee KM. Presence, explicated. Commun Theory (2004) 14(1):27–50. doi: 10.1111/j.1468-2885.2004.tb00302.x
65. Riva G, Mantovani F, Gaggioli A. Presence and rehabilitation: toward second-generation virtual reality applications in neuropsychology. J Neuroeng Rehabil (2004) 1(1):9. doi: 10.1186/1743-0003-1-9
66. Price M, Mehta N, Tone EB, Anderson PL. Does engagement with exposure yield better outcomes? Components of presence as a predictor of treatment response for virtual reality exposure therapy for social phobia. J Anxiety Disord (2011) 25(6):763–70. doi: 10.1016/j.janxdis.2011.03.004
67. Bouchard S, St-Jacques J, Robillard G, Renaud P. Anxiety increases the feeling of presence in virtual reality. Presence Teleoperators Virtual Environ (2008) 17(4):376–91. doi: 10.1162/pres.17.4.376
68. Arcioni B, Palmisano S, Apthorp D, Kim J. Postural stability predicts the likelihood of cybersickness in active HMD-based virtual reality. Displays (2019) 58:3–11. doi: 10.1016/j.displa.2018.07.001
69. Ash A, Palmisano S, Kim J. Vection in depth during consistent and inconsistent multisensory stimulation. Perception (2011) 40(2):155–74. doi: 10.1068/p6837
70. Arns LL, Cerney MM. The relationship between age and incidence of cybersickness among immersive environment users. Bonn, Germany: IEEE (2005) p. 267–8.
71. Jaeger BK, Mourant RR. Comparison of simulator sickness using static and dynamic walking simulators. Los Angeles, CA: In SAGE Publications Sage CA (2001). p. 1896–900.
Keywords: autism spectrum disorder, virtual reality, technology-aided intervention, usability study, sense of presence, oculus, data-driven, machine learning
Citation: Malihi M, Nguyen J, Cardy RE, Eldon S, Petta C and Kushki A (2020) Data-Driven Discovery of Predictors of Virtual Reality Safety and Sense of Presence for Children With Autism Spectrum Disorder: A Pilot Study. Front. Psychiatry 11:669. doi: 10.3389/fpsyt.2020.00669
Received: 14 August 2019; Accepted: 26 June 2020;
Published: 04 August 2020.
Edited by:
Jean Marc Guile, University of Picardie Jules Verne, FranceReviewed by:
Joseph Gonzalez-Heydrich, Harvard Medical School, United StatesCopyright © 2020 Malihi, Nguyen, Cardy, Eldon, Petta and Kushki. This is an open-access article distributed under the terms of the Creative Commons Attribution License (CC BY). The use, distribution or reproduction in other forums is permitted, provided the original author(s) and the copyright owner(s) are credited and that the original publication in this journal is cited, in accordance with accepted academic practice. No use, distribution or reproduction is permitted which does not comply with these terms.
*Correspondence: Azadeh Kushki, YWt1c2hraUBob2xsYW5kYmxvb3J2aWV3LmNh
Disclaimer: All claims expressed in this article are solely those of the authors and do not necessarily represent those of their affiliated organizations, or those of the publisher, the editors and the reviewers. Any product that may be evaluated in this article or claim that may be made by its manufacturer is not guaranteed or endorsed by the publisher.
Research integrity at Frontiers
Learn more about the work of our research integrity team to safeguard the quality of each article we publish.