 Helena P. G. Joaquim1,2,3*†
 Alana C. Costa1,2†
 Leda L. Talib1,2Frederik Dethloff3
 Mauricio H. Serpa2,4
 Marcus V. Zanetti4,5
 Martinus van de Bilt1,2
 Christoph W. Turck3
- 1Laboratory of Neuroscience LIM-27, Department and Institute of Psychiatry, University of Sao Paulo Medical School, Sao Paulo, Brazil
- 2Instituto Nacional de Biomarcadores em Neuropsiquiatria (INBioN), Conselho Nacional de Desenvolvimento Científico e Tecnológico, Sao Paulo, Brazil
- 3Department of Translational Research in Psychiatry, Max Planck Institute of Psychiatry, Munich, Germany
- 4Laboratory of Psychiatric Neuroimaging LIM-21, Department and Institute of Psychiatry, University of Sao Paulo Medical School, Sao Paulo, Brazil
- 5Hospital Sírio-Libanês, São Paulo, Brazil
Introduction: The first symptoms of psychosis are frequently shared amongst several neuropsychiatry disorders, which makes the differentiation by clinical diagnosis challenging. Early recognition of symptoms is important in the management of psychosis. Therefore, the implementation of molecular biomarkers will be crucial for transforming the currently used diagnostic and therapeutic approach, improving insights into the underlying biological processes and clinical management.
Objectives: To define a set of metabolites that supports diagnosis or prognosis of schizophrenia (SCZ) and bipolar disorder (BD) at first onset psychosis.
Methods: Plasma samples from 55 drug-naïve patients, 28 SCZ and 27 BD, and 42 healthy controls (HC). All participants underwent a seminaturalistic treatment regimen, clinically evaluated on a weekly basis until achieving clinical remission. All clinical or sociodemographic aspects considered for this study were equivalent between the groups at first-onset psychosis time point. The plasma samples were analyzed by untargeted liquid chromatography-tandem mass spectrometry (LC-MS/MS) using reversed-phase and hydrophilic interaction chromatography. The acquired molecular features were analyzed with MetaboAnalyst.
Results: We identified two patient groups with different metabolite profiles. Both groups are composed of SCZ and BD patients. We found differences between these two groups regarding general symptoms of PANSS score after remission (p = 0.008), and the improvement of general symptoms (delta of the score at remission minus the baseline) (−0.50 vs. −0.33, p = 0.019).
Conclusion: Our results suggest that plasma metabolite profiles cluster clinical remission phenotypes based on PANSS general psychopathology scores.
Introduction
The molecular pathogenesis of psychosis is not fully understood. First symptoms are common amongst neuropsychiatric disorders which makes clinical diagnosis challenging (1).
Naturalistic follow-up studies have found highly divergent outcomes in first-episode psychosis (FEP) (2–4). Schizophrenia (SCZ) and bipolar disorder (BD) share genetic contributions (5) and clinical symptoms, including psychosis and affective dysregulation (6), and cognitive impairment (7–9). The challenge for the clinician is to distinguish different FEP in order to make the best choices for individual patients. This requires sensitive and specific biomarkers. In fact, a combination of multiple biomarkers may better reflect etiology and provide improved insights into the underlying biological processes (10, 11).
Several recent studies have used metabolomics in an attempt to identify biomarkers for SCZ and BD (12–15). Increased serum (16–18) and plasma (19–21) fatty acid levels have been reported in patients with SCZ compared to healthy controls (HC). Reduced phosphatidylcholine (19, 22, 23) and phosphatidylethanolamine levels (24) were found in SCZ patients. However, Cai et al. (19) reported increased lysophosphatidylcholine levels in patients with SCZ. Recently, in a targeted study, our group reported that plasma phosphatidylcholine (PC aa C26:0, PC aa C38:4, PC aa C34:3) and acylcarnitine (C16-OH) levels may be useful for differentiating SCZ and BD patients (13).
In the current study, we have compared plasma metabolite profiles from SCZ and BD patients and HC to define a set of metabolites that may aid in their differentiation. The untargeted search for metabolites can provide us with a broader and more comprehensive view of the metabolome related to the psychiatric disorders studied and complement the results previously obtained.
Materials and Methods
Subjects
The open-label-study was conducted at the Institute of Psychiatry, University of Sao Paulo Medical School, Brazil. The sample comprised of 55 drug-naïve patients (28 SCZ and 27 BD) and 42 healthy controls. All participants were <60 years old and middle-income, community-dwelling subjects from the hospital neighborhood area. All subjects provided written informed consent prior to inclusion in the study. The study was approved by the Local Ethics Committee of the University of Sao Paulo (CAPPesq N° 943.883) and performed in accordance with the Helsinki declaration. The SCZ diagnosis was established according to the Diagnostic and Statistical Manual of Mental Disorders (DSM-IV) (25) and SCID-I/P-Structured Clinical Interview Disorders Axis I for DSM–IV 2.0 was used to confirm the diagnosis (26). Psychopathology was assessed using the Positive and Negative Symptoms Scale (PANSS) (27), including the positive and negative subscales and general psychopathology. The Hamilton Depression Rating Scale (HAM-D) (28) and Young's Mania Rating Scale (YMRS) (29) assessed depressive and manic symptoms for BD patients. Subjects with other psychiatric or neurological disorders were excluded.
Subsequently, all patients underwent a seminaturalistic antipsychotic treatment based on the recommendations of the International Psychopharmacology Algorithm Project (IPAP; www.ipap.org). Treatment regimen was strictly defined and the dosage was determined by the clinicians as in their usual practice. For the first trial, either haloperidol or risperidone were chosen. Following the IPAP SCZ algorithm, whenever no clinical remission was achieved after 4 to 6 weeks using the highest dosage tolerated by the patient according to clinician judgment, the first medication was changed to olanzapine.
FEP subjects were then clinically evaluated weekly by a psychiatrist using the PANSS until achieving clinical remission. The remission criteria used were proposed by Andreasen et al. (30), with the exception of the length of time. The subjects should present no more than mild symptom severity (PANSS score <4) in the core items: delusions, mannerisms/posturing, conceptual disorganization, hallucinatory behavior, social withdrawal, lack of spontaneity, blunted affect, and unusual thought content. Once the remission criteria were fulfilled, FEP subjects were evaluated every week until completing a month of remission.
The sociodemographic characteristics of the patients and controls are summarized in Table 1. All outcome variables were controlled for years of education and gender.
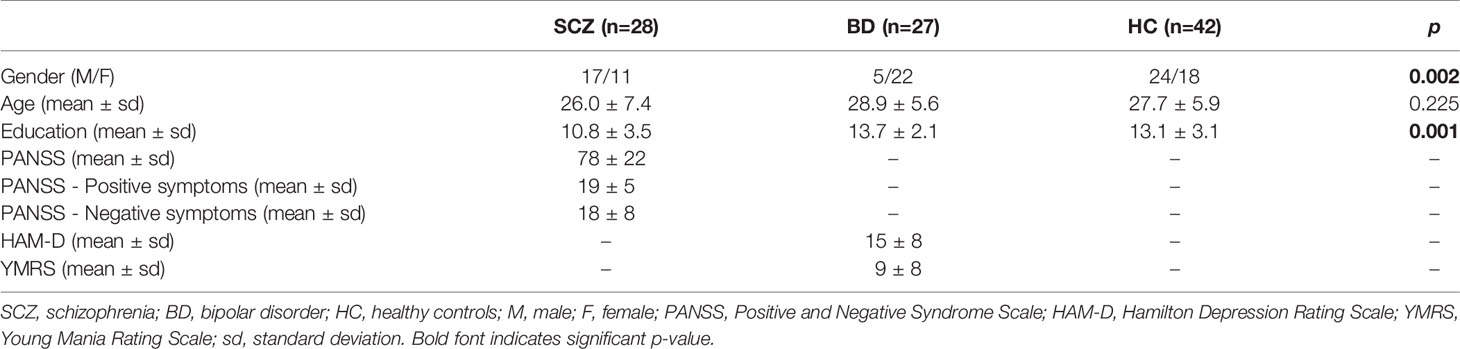
Table 1 Socio-demographic characteristics of patients and controls.
Sample Collection and Preparation
Blood samples were collected in EDTA-coated tubes (Vacuntainer, Becton Dickinson; Franklin Lakes, NJ, USA) after 8-h fasting. Samples were centrifuged at 20°C and 1,800 g for 15 min. One hundred microliter of blood plasma samples were incubated with 400-µl cold methanol for 2 h at 4°C and centrifuged at 16,000 g for 10 min at 4°C. The supernatant was transferred to a new tube and dried by vacuum concentration. The samples were stored at −80°C until further processing.
Metabolomics Analysis
Reversed phase analysis: Sample extracts were reconstituted in 100 µl of methanol and centrifuged for 4 min at 10,000 rpm and analyzed using an Agilent Technologies 1100 HPLC system (Agilent Technologies; Santa Clara, CA, USA) coupled to a Bruker Impact II TOF MS system (Bruker Corporation; Billerica, MA, USA) controlled by Bruker Hystar 3.2 Software. Eluent A was H2O with 0.1% formic acid and eluent B acetonitrile with 0.1% formic acid. The gradient was run with a flow rate of 500 µl*min-1 over a Phenomenex Kinetex C18 3 × 100 mm column, 2.6-µm particle size, 100 Å pore size (Phenomenex Inc., Torrance, CA, USA), and a Phenomenex Kinetex C18 guard column, both heated to 40°C in the LC oven. Samples were kept at 6°C in the sample rack until injection of 5 µl into the injection loop of the HPLC. Samples were eluted isocratically for 2 min with 5% of eluent B followed by a 25-min gradient to 95%, 95% for 5 min followed by 6-min equilibration at 5% of eluent B.
Mass Spectrometry
Samples were introduced splitless into the ESI source. Compounds were ionized with an end plate offset of −500 V, a capillary voltage of 4,500 V in positive mode. The nebulizer gas N2 flow was 11 Lmin-1, 3.5 bar pressure heated to 220°C. Bruker Compass 1.9 acquired the profile data with a spectra rate of 1 Hz (full scan) and a mass range from 30 to 1,300 m/z. MS/MS data were generated of the five most intense ions selected for fragmentation within a mass range of ±1–3 Da, 20–25 eV collision energy and 5-Hz spectra rate. The mass accuracy was adjusted by internal calibration using sodium format clusters in ESI+ and ESI- modes with Bruker DataAnalysis 4.4 software after calibration with Proteowizard (http://proteowizard.sourceforge.net).
For detect instrumental variations, a quality control (QC) samples was analyzed, consisting of a pool of all samples (SCZ, BD, and HC), prepared by mixing 5 µl of each sample. QC sample preparation was performed equally as for the other samples. The QC samples were injected three times at the beginning of the batch analyses, at every five injections, and once at the end of the batch.
Data Processing and Statistical Analyses
Comparison of patients' and controls' socio-demographic characteristics was performed with Chi-square test for categorical variables and ANOVA for quantitative variables using SPSS (Statistical Package for Social Sciences, for Windows, v. 14, Chicago, IL). Significance level was p < 0.05.
For data preprocessing we used MZmine 2 (31) with the Automated Data Analysis Pipeline (ADAP) deconvolution algorithm and the CAMERA (32) pseudo-spectra annotation. Only features with at least two isotopes were kept for further analysis. Aligned data was exported as .csv file for further processing and normalized to the average sample intensity. To track instrument performance we used QC samples that were manually evaluated.
The data including retention time, the m/z ratio and the peak intensities of each feature in each sample was loaded into Metaboanalyst (https://www.metaboanalyst.ca). For the analysis, the intensity values were normalized by sum and Pareto scale (33). Multivariate exploratory analyzes were performed using Principal Components Analysis (PCA) and Partial Least Square Discriminant Analysis (PLS-DA). The PCA is applied to check outliers, trend of clusters and even choice of the most relevant set of variables for the construction of the model. Specifically, PLS-DA is often used in metabolomics studies because it provides discriminatory characterization considering all variables in two or more supervised groups (34). The differential features obtained from PLS-DA plot were further evaluated by Variable Importance in Projection (VIP) and Student's t-test (95% of confidence) followed by signal-to-noise ratio (S/N) verification. Variables with VIP score ≥ 1 and p-value ≤ 0.005 for the t-test were considered for the classification. From the analysis with PCA we observed that the existing separation corresponded to the intensity of the severity of the symptoms. Therefore, we use this label to obtain the PLS-DA.
Results
Using an untargeted metabolomics approach, we were able to detect 2,444 metabolite features and 607 (0.5%) missing values. In order to track any instrument variation, we ran several blank and QC samples as part of the sequence. QC samples did not show any retention time shifts and only mild variations in intensity. Only features with intensities that were twice as high as the blank mean value in at least 75% of all samples were kept. This resulted in the removal of 31 features.
No significant metabolite profiles that differentiate patients with SCZ, BD and HC were identified (Q2=−0.153 and R2=0.943) (Supplementary Figures 1A, B). Removing the control group also did not result in stratification of the SCZ and BD patient groups (Q2 = 0.251 and R2 = 0.915) (Supplementary Figures 2A, B).
However, we observed different group stratification, with both Groups A and B composed of SCZ and BD patients and no differences with regard to socio-demographic and clinical data (Figures 1A, B). The designation of groups A and B was arbitrary and based on metabolite profile only. Interestingly, these two groups showed differences in PANSS general score (p=0.008) and also delta (remission minus baseline) (−0.50 vs. −0.33, p=0.019) after symptom remission (Table 2).
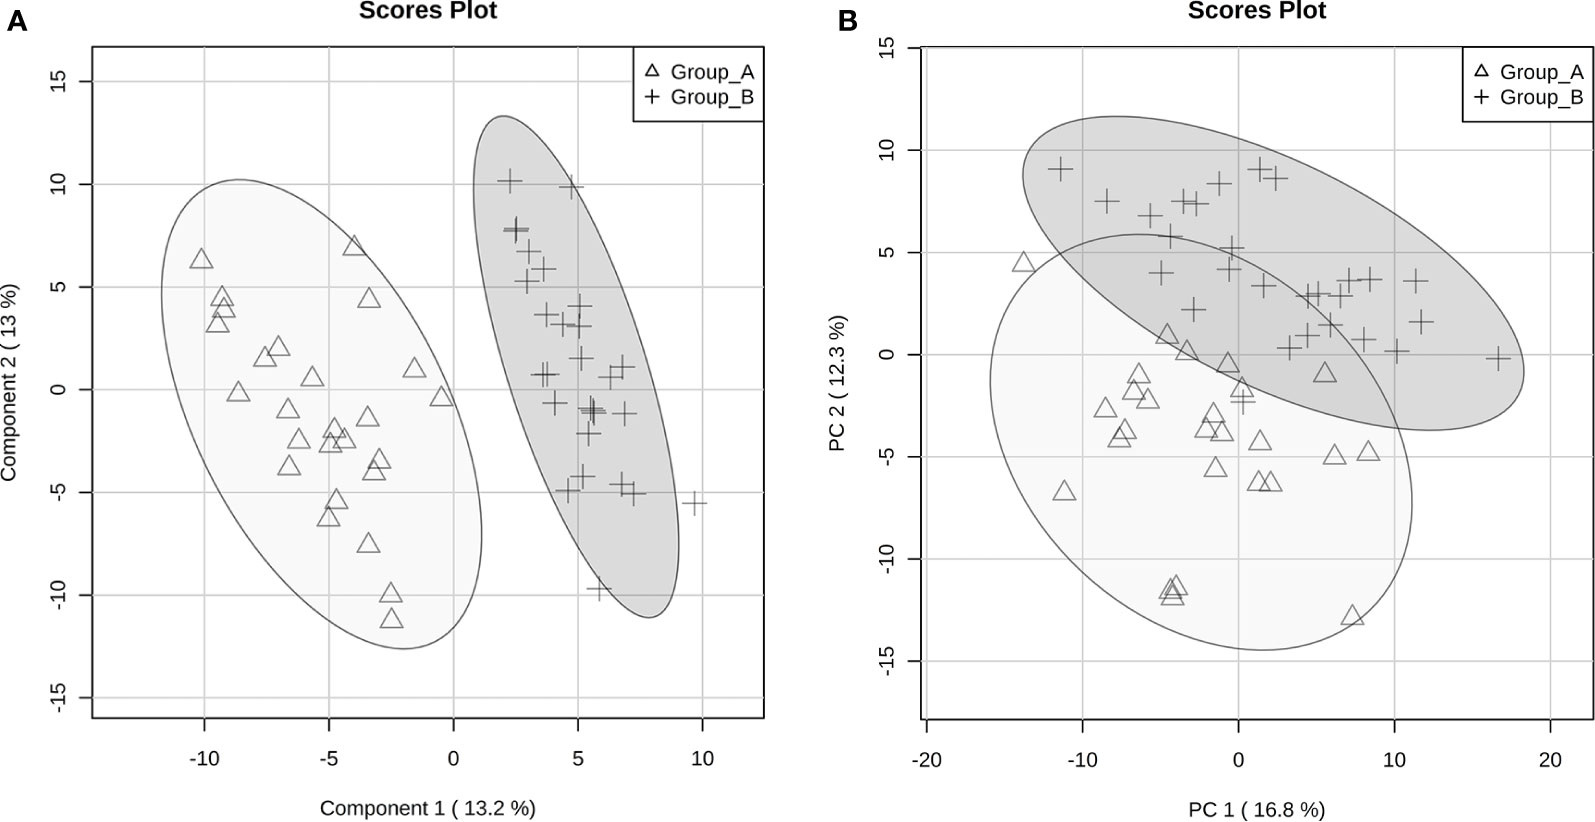
Figure 1 Principal Components Analysis (PCA) (A) and Partial Least Square Discriminant Analysis (PLS-DA) (B) score plots of discriminant metabolites between groups A and B according to the severity of clinical symptoms.
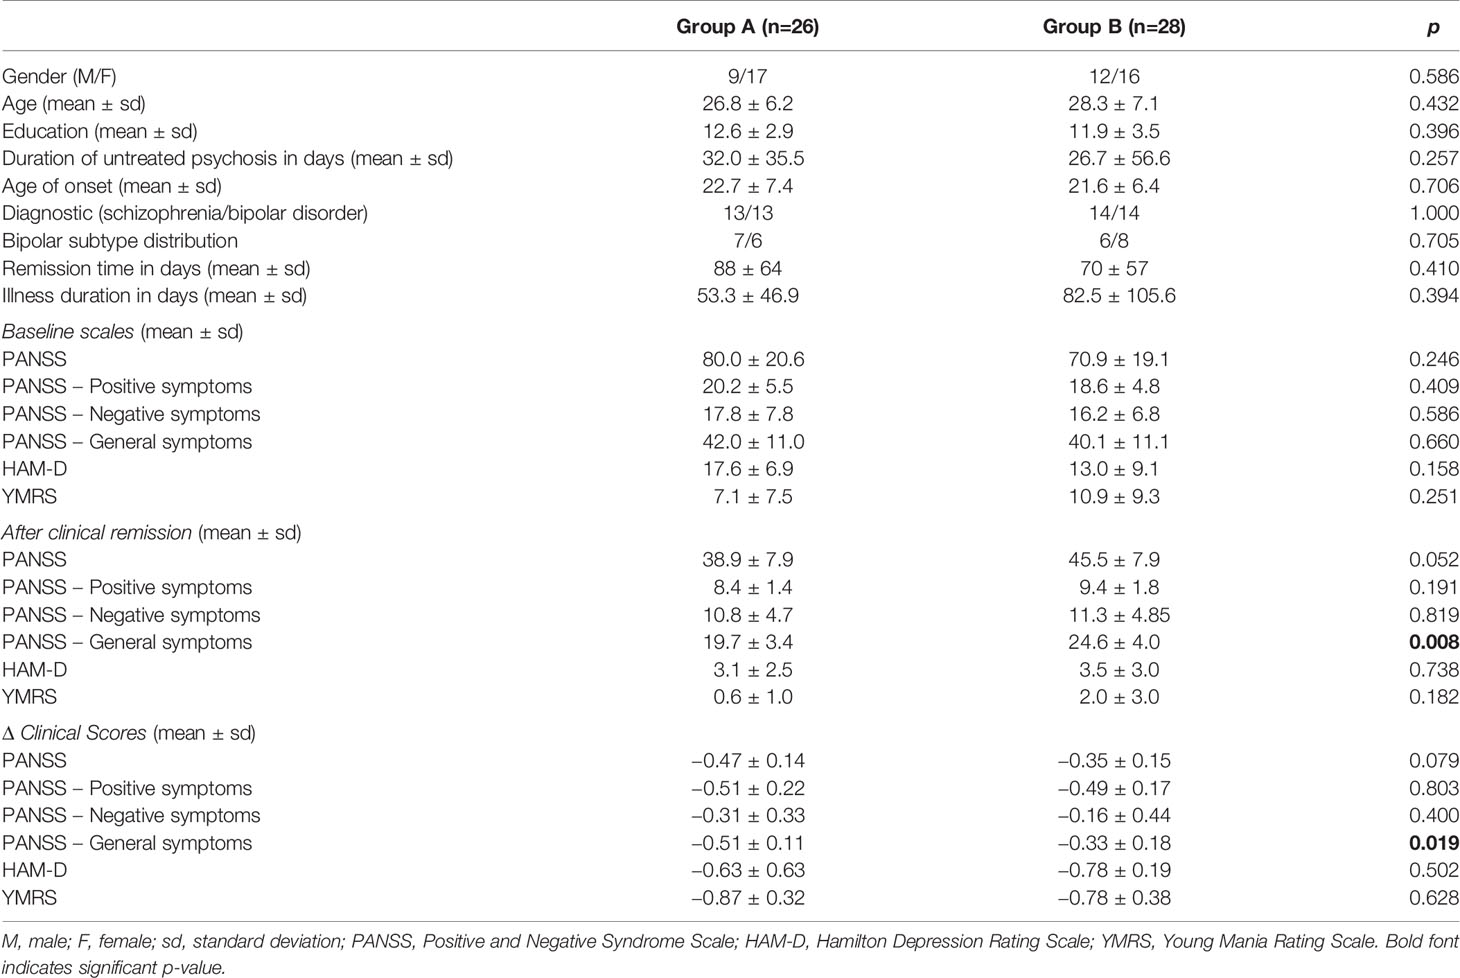
Table 2 Socio-demographic characteristics and clinical assessment of patients and controls according to the severity of clinical symptoms.
The 220 statistically differential features between the groups (and with no significant differences between experimental and theoretical masses) were determined and classified by multivariate analysis. PCA and PLS-DA were built excluding QC samples from data treatment. The variation in the PCA scores plot was 0.168 for PC1 and 0.123 for PC2. The PLS-DA model was validated with 86.7% predictability (Q2 = 0.867 and R2 = 0.973). After determination of differential features by PLS-DA based on group separation, we loaded VIP scores analysis (Figure 2), Student's t-test and S/N (signal/noise) verification. We were able to verify that 255 features were upregulated in Group A, while only 14 features presented increased levels in Group B considering a fold-change threshold ≥ 2.
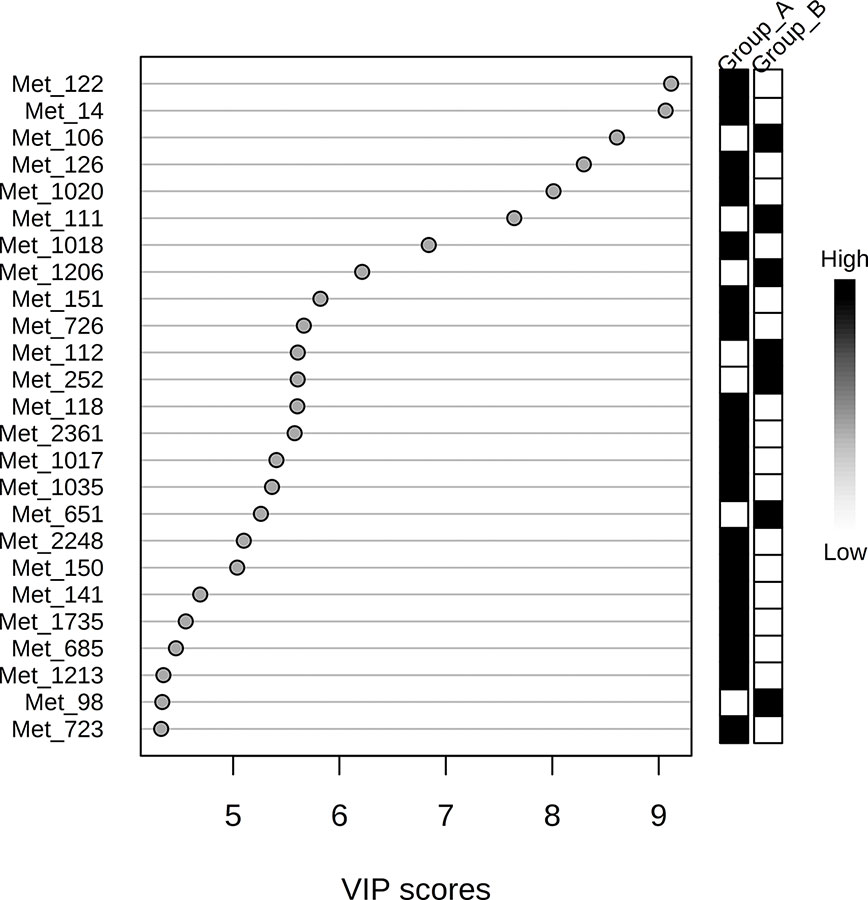
Figure 2 Variable Importance in Projection (VIP) score visualization for 25 differential features for groups A and B.
Discussion
Given the complexity and heterogeneity of psychiatric disorders, a combination of multiple biomarkers may better reflect etiology and improve insights into the underlying biological processes (10, 11). Here we used LC-MS-based metabolite profiling to gain a deeper understanding of global variation in psychosis, and to detect potential markers that facilitate its diagnosis and/or outcome. We were unable to identify outcome biomarkers in first episode psychosis. However, we found two diagnostic-mixed groups based on the acquired metabolite profiles. All clinical and socio-demographic aspects considered for this study were equivalent between the groups at the first episode time point. Interestingly, after clinical remission, we found greater improvement in General Psychopathology PANSS scores in group A.
The General Psychopathology Scale complements the positive-negative assessment in PANSS as it is a set of nonspecific symptoms representing the severity of distinct positive and negative manifestations. It provides a separate but parallel measure of disease severity, serving as a control measure for interpreting syndromic scores (27). It is a parameter that considers positive manifestations (i.e., anger and increased noncommunicative movements) and negative manifestations (for example, dull facial expression, poor eye contact, and lack of emotional relationship) in a collective and complementary way. The score on this subscale has already been positively correlated with psychosis and other serious disorders in patients' first-degree relatives. Several studies have proposed that some of the 30 items are the most predictive. For instance Lefort-Besnard et al. (35) showed a subset of eleven items as the most predictive for disease severity based, of which nine were part of the General Psychopathology Scale: emotional withdrawal, anxiety, guilt feelings, unusual thought content, lack of judgement and insight, and disturbance of volition. Therefore, the metabolite profile depicted in Group A might represent a predictor of better outcome, independently of the diagnosis.
The cluster-based analysis has been widely used to identify patient subgroups that explain clinical differences (36). Clusters based on neurocognition have been extensively explored (8, 37–40). It seems consistent that SCZ and BD patients tend to show similar patterns of neuropsychological impairments compared to controls (41, 42). Although the symptoms are more evident in SCZ than in BD, studies suggest that these effects lack diagnostic specificity (8, 39, 43–45). Recently, Chan et al. (46) performed a cluster analysis based on premorbid adjustment trajectories. All clusters had SCZ and BD, corroborating that clinical differentiation is not specific.
Our data reveal a different metabolite profile of patients who will progress to more severe psychotic symptoms which can already be seen in plasma before the clinical outcome, and thereby can assist in treatment. Unfortunately we were unable to identify the relevant metabolites with unambiguous certainty. Using exploratory approaches, we performed a putative identification of some metabolites and found that several of them are part of the same class of metabolites already described by our group as altered in psychoses including carnitines and phosphatidylcholines (13).
The fact that distinct clinical phenotypes are due to biological differences legitimates the search for biomarkers (47, 48). Since metabolite levels are sensitive to subtle perturbations during disease, metabolomics provides a powerful approach to assess these changes on the molecular level (49). The metabolomics approach has been documented in several reports on biomarkers for psychiatric disorders, including BD, depression, and SCZ (50–52).
A recent systematic literature review of SCZ metabolite biomarkers pointed to at least 63 studies using metabolomics (14). A systematic review performed by Li et al. (53) identified 10 molecules as potential biomarkers of psychosis. Our group has reported a set of 4 metabolites that differentiate SCZ and BD patients in first onset psychosis (13). Wang et al. (12) found a set of six metabolites that differentiate SCZ patients from HC. Compared to SCZ, mood disorders have been less investigated using metabolomics. A meta-analysis involving data from eight studies identified a 20-biomarker panel that differentiates BD from SCZ and depression patients (54). Our results reveal a metabolite profile in the very first psychosis episode that may assist general psychopathology prognosis and monitoring treatment response.
The main limitations of our study are the small sample size for the diagnostic groups and the missing clinical scales for some subjects. Therefore, the results need to be replicated in an independent and larger sample cohort. The basic biochemical data (complete blood count, liver enzymes, serum vitamin B12, HIV serology, and kidney and thyroid function) was considered as inclusion or exclusion criteria, but not correlated with the metabolomics findings.
Data Availability Statement
The datasets generated for this study are available on request to the corresponding authors.
Ethics Statement
The studies involving human participants were reviewed and approved by Local Ethics Committee of the University of Sao Paulo. The patients/participants provided their written informed consent to participate in this study.
Author Contributions
CT and HJ designed the study. HJ, AC, and LT performed literature searches, wrote the first draft of the manuscript, and undertook the statistical analysis. FD performed the metabolomics analyses. MS, MZ, and MB were responsible for the clinical assessment. All authors contributed to and approved the final manuscript.
Funding
This study was supported by the Fundação de Amparo à Pesquisa do Estado de São Paulo - FAPESP (Grants No. 2014/20913-3 and 2013/103509), Instituto Nacional de Biomarcadores em Neuropsiquiatria (INBioN - Grant No. 2014/50873-3) and the Max Planck Society. The Laboratory of Neuroscience receives financial support from Associação Beneficente Alzira Denise Hertzog da Silva (ABADHS).
Conflict of Interest
The authors declare that the research was conducted in the absence of any commercial or financial relationships that could be construed as a potential conflict of interest.
Acknowledgments
The authors appreciate the contributions of clinicians for recruitment and discussions on translation and Neuroscience Lab for sample management.
Supplementary Material
The Supplementary Material for this article can be found online at: https://www.frontiersin.org/articles/10.3389/fpsyt.2020.00496/full#supplementary-material
Supplementary Figure 1 | PCA (A) and PLS-DA (B) scores plot of SCZ (gray), BD (light gray) and HC (white) samples.
Supplementary Figure 2 | PCA (A) and PLS-DA (B) scores plot of SCZ (gray) and BD (light gray) samples.
References
1. Cunyan L, Huai T, Xiudeng Y, Xianghui Z, Yong L, Yamei, et al. Assessment of a combination of Serum Proteins as potential biomarkers to clinically predict Schizophrenia. Int J Med Sci (2018) 15:900–6. doi: 10.7150/ijms.24346
2. Morgan C, Lappin J, Heslin M, Donoghue K, Lomas B, Reininghaus U, et al. Reappraising the long-term course and outcome of psychotic disorders: the AESOP-10 study. Psychol Med (2014) 44:2713–26. doi: 10.1017/S0033291714000282
3. Lally J, Ajnakina O, Stubbs B, Cullinane M, Murphy KC, Gaughran F, et al. Remission and recovery from first-episode psychosis in adults: systematic review and meta-analysis of long-term outcome studies. Br J Psych (2017) 211:350–8. doi: 10.1192/bjp.bp.117.201475
4. Suvisaari J, Mantere O, Keinänen J, Mäntylä T, Rikandi E, Lindgren M, et al. Is it possible to predict the future in first-episode psychosis? Front Psychiatry (2018) 9:580. doi: 10.3389/fpsyt.2018.00580
5. Lichtenstein P, Yip BH, Björk C, Pawitan Y, Cannon TD, Sullivan PF, et al. Common genetic determinants of schizophrenia and bipolar disorder in Swedish families: a population-based study. Lancet (2009) 373:234–9. doi: 10.1016/S0140-6736(09)60072-6
6. American Psychiatric Association. Diagnostic and Statistical Manual of Mental Disorders. 5th ed. (Washington DC: American Psychiatric Association) (2013).
7. Burdick KE, Ketter TA, Goldberg JF, Calabrese JR. Assessing cognitive function in bipolar disorder: challenges and recommendations for clinical trial design. J Clin Psych (2015) 76:342–50. doi: 10.4088/JCP.14cs09399
8. Bora E, Pantelis C. Meta-analysis of Cognitive Impairment in First-Episode Bipolar Disorder: Comparison with First-Episode Schizophrenia and healthy controls. Schizophr Bull (2015) 41:1095–104. doi: 10.1093/schbul/sbu198
9. Holthausen EA, Wiersma D, Sitskoorn MM, Hijman R, Dingemans PM, Schene AH, et al. Schizophrenic patients without neuropsychological deficits: subgroup, disease severity or cognitive compensation? Psych Res (2002) 112:1–11. doi: 10.1016/S0165-1781(02)00184-1
10. Glenn AL. Neuroendocrine markers of psychopathy. In: Ritsner MS, editor. The handbook of neuropsychiatric biomarkers, endophenotypes and genes. Vol 3: Metabolic and peripheral biomarkers. (New York: Springer) (2009). p. 59–71.
11. Boksa P. A way forward for research on biomarkers for psychiatric disorders. J Psych Neurosci (2013) 38:75–7. doi: 10.1503/jpn.130018
12. Wang D, Cheng SL, Fei Q, Gu H, Raftery D, Cao B, et al. Metabolic profiling identifies phospholipids as potential serum biomarkers for schizophrenia. Psych Res (2019) 272:18–29. doi: 10.1016/j.psychres.2018.12.008
13. Costa AC, Joaquim HPG, Talib LL, Serpa MH, Zanetti MV, Gattaz WF. Plasma metabolites in first episode psychoses. Schizophr Res (2018) S0920-9964:30661–3. doi: 10.1016/j.schres.2018.11.010
14. Davison J, O'Gorman A, Brennan L, Cotter DR. A systematic review of metabolite biomarkers of schizophrenia. Schizophr Res (2017) 195:32–50. doi: 10.1016/j.schres.2017.09.021
15. Ribeiro HC, Klassen A, Pedrini M, Carvalho MS, Rizzo LB, Noto MN, et al. A preliminar study of bipolar disorder type I by mass spectrometry-based serum lipidomics. Psych Res (2017) 258:268–73. doi: 10.1016/j.psychres.2017.08.039
16. Fukushima T, Iizuka H, Yokota A, Suzuki T, Ohno C, Kono Y, et al. Quantitative analyses of schizophrenia-associated metabolites in serum: serum D-lactate levels are negatively correlated with gamma-glutamylcysteine in medicated schizophrenia patients. PloS One (2014) 8:101652. doi: 10.1371/journal.pone.0101652
17. Al-Awam K, Haußleiter IS, Dudley E, Donev R, Brüne M, Juckel G, et al. Multiplatform metabolome and proteome profiling identifies serum metabolite and protein signatures as prospective biomarkers for schizophrenia. J Neural Transm (Vienna) (2015) 122:111–22. doi: 10.1007/s00702-014-1224-0
18. Xuan J, Pan G, Qiu Y, Yang L, Su M, Liu Y, et al. Metabolomic profiling to identify potential serum biomarkers for schizophrenia and risperidone action. J Prot Res (2011) 10:5433–43. doi: 10.1021/pr2006796
19. Cai HL, Li HD, Yan XZ, Sun B, Zhang Q, Yan M, et al. Metabolomic analysis of biochemical changes in the plasma and urine of first-episode neuroleptic-naïve schizophrenia patients after treatment with risperidone. J Prot Res (2012) 11:4338–50. doi: 10.1021/pr300459d
20. Yang J, Chen T, Sun L, Zhao Z, Qi X, Zhou K, et al. Potential metabolite markers of schizophrenia. Mol Psychiatry (2013) 18:67–78. doi: 10.1038/mp.2011.131
21. Koike S, Bundo M, Iwamoto K, Suga M, Kuwabara H, Ohashi Y, et al. A snapshot of plasma metabolites in first-episode schizophrenia: a capillary electrophoresis time-of-flight mass spectrometry study. Transl Psych (2014) 4:379. doi: 10.1038/tp.2014.19
22. He Y, Yu Z, Giegling I, Xie L, Hartmann AM, Prehn C, et al. Schizophrenia shows a unique metabolomics signature in plasma. Transl Psych (2012) 2:149. doi: 10.1038/tp.2012.76
23. McEvoy J, Baillie RA, Zhu H, Buckley P, Keshavan MS, Nasrallah HA, et al. Lipidomics reveals early metabolic changes in subjects with schizophrenia: effects of atypical antipsychotics. PloS One (2013) 8:68717. doi: 10.1371/journal.pone.0068717
24. Kaddurah-Daouk R, McEvoy J, Baillie RA, Lee D, Yao JK, Doraiswamy PM, et al. Metabolomic mapping of atypical antipsychotic effects in schizophrenia. Mol Psych (2007) 12:934–45. doi: 10.1038/sj.mp.4002000
25. American Psychiatry Association. Diagnostic and Statistical Manual of Mental Disorders. 4th ed. Arlington, VA: American Psychiatry Association (2000). Text rev.
26. First MB, Spitzer RL, Gibbon M, Williams JBW. Structured clinical interview for DSM-IV-TR Axis I Disorders. Research version. Non-patient edition SCID-I/NP New York: Biometrics Research. New York (2002).
27. Kay SR, Fiszbein A, Opler LA. The positive and negative syndrome scale for schizophrenia. Schizophr Bull (1987) 13:261–76. doi: 10.1093/schbul/13.2.261
28. Hamilton M. A rating scale for depression. J Neurol Neurosurg Psych (1960) 23:56–62. doi: 10.1136/jnnp.23.1.56
29. Young RC, Biggs JT, Ziegler VE, Meyer DA. A rating scale for mania: reliability, validity and sensitivity. Br J Psych (1978) 133:429–35. doi: 10.1192/bjp.133.5.429
30. Andreasen NC, Carpenter WT, Kane JM, Lasser RA, Marder SR, Weinberger DR. Remission in Schizophrenia: Proposed Criteria and Rationale for Consensus. Am J Psych (2005) 162:441–9. doi: 10.1176/appi.ajp.162.3.441
31. Pluskal T, Castillo S, Villar-Briones A, Oresic M. MZmine 2: modular framework for processing, visualizing, and analyzing mass spectrometry-based molecular profile data. BMC Bioinform (2010) 11:395. doi: 10.1186/1471-2105-11-395
32. Kuhl C, Tautenhahn R, Böttcher C, Larson TR, Neumann S. CAMERA: an integrated strategy for compound spectra extraction and annotation of liquid chromatography/mass spectrometry data sets. Anal Chem (2012) 84:283–9. doi: 10.1021/ac202450g
33. Van den Berg RA, Hoefsloot HC, Westerhuis JA, Smilde AK, van der Werf MJ. Centering, scaling, and transformations: improving the biological information content of metabolomics data. BMC Genomics (2006) 7:142. doi: 10.1186/1471-2164-7-142
34. Fonville JM, Maher AD, Coen M, Holmes E, Lindon JC, Nicholson JK. Evaluation of full-resolution J-resolved 1H NMR projections of biofluids for metabonomics information retrieval and biomarker identification. Anal Chem (2010) 82:1811–21. doi: 10.1021/ac902443k
35. Lefort-Besnard J, Varoquaux G, Derntl B, Gruber O, Aleman A, Jardri R, et al. Patterns of schizophrenia symptoms: hidden structure in the PANSS questionnaire. Transl Psychiatry (2018) 8:237. doi: 10.1038/s41398-018-0294-4
36. Boulesteix AL. Strimmer K. Partial least squares: a versatile tool for the analysis of high-dimensional genomic data. Brief Bioinform (2006) 8:32–44. doi: 10.1093/bib/bbl016
37. Van Rheenen TE, Lewandowski KE, Tan EJ, Ospina LH, Ongur D, Neill E, et al. Characterizing cognitive heterogeneity on the schizophrenia-bipolar disorder spectrum. Psychol Med (2017) 47:1848–64. doi: 10.1017/S0033291717000307
38. Reser MP, Allott KA, Killackey E, Farhall J, Cotton SM. Exploring cognitive heterogeneity in first-episode psychosis: What cluster analysis can reveal. Psych Res (2015) 229:819–27. doi: 10.1016/j.psychres.2015.07.084
39. Hill SK, Reilly JL, Keefe RS, Gold JM, Bishop JR, Gershon ES, et al. Neuropsychological impairments in schizophrenia and psychotic bipolar disorder: findings from the Bipolar-Schizophrenia Network on Intermediate Phenotypes (B-SNIP) study. Am J Psych (2013) 170:1275–84. doi: 10.1176/appi.ajp.2013.12101298
40. Lee HA, Kim JS, Lee YJ, Heo NH, Shim SH, Kwon YJ. Differences in Psychopathology between Offspring of Parents with Bipolar I Disorder and Those with Bipolar II Disorder: A Cross-Sectional Study. Psych Invest (2018) 15:1135–43. doi: 10.30773/pi.2018.10.22.1
41. Schretlen DJ, Peña J, Aretouli E, Orue I, Cascella NG, Pearlson GD, et al. Confirmatory factor analysis reveals a latent cognitive structure common to bipolar disorder, schizophrenia, and normal controls. Bip Disord (2013) 15:422–33. doi: 10.1111/bdi.12075
42. Harvey PD, Strassnig MT. Cognition and disability in schizophrenia: cognition-related skills deficits and decision-making challenges add to morbidity. World Psychiatry (2019) 18:165–7. doi: 10.1002/wps.20647
43. Bora E, Yücel M, Pantelis C. Theory of mind impairment: a distinct trait-marker for schizophrenia spectrum disorders and bipolar disorder? Acta Psych Scand (2009) 120:253–64. doi: 10.1111/j.1600-0447.2009.01414.x
44. Tamminga CA, Pearlson G, Keshavan M, Sweeney J, Clementz B, Thaker G. Bipolar and schizophrenia network for intermediate phenotypes: outcomes across the psychosis continuum. Schizophr Bull (2014) 40:131–7. doi: 10.1093/schbul/sbt179
45. Van Rheenen TE, Bryce S, Tan EJ, Neill E, Gurvich C, Louise S, et al. Does cognitive performance map to categorical diagnoses of schizophrenia, schizoaffective disorder and bipolar disorder? A discriminant functions analysis. J Affect Disord (2016) 192:109–15. doi: 10.1016/j.jad.2015.12.022
46. Chan CC, Shanahan M, Ospina LH, Larsen EM, Burdick KE. Premorbid adjustment trajectories in schizophrenia and bipolar disorder: A transdiagnostic cluster analysis. Psych Res (2019) 272:655–62. doi: 10.1016/j.psychres.2018.12.169
47. Livny A, Reichenberg A, Fruchter E, Yoffe R, Goldberg S, Fenchel D, et al. A Population-Based Longitudinal Study of Symptoms and Signs Before the Onset of Psychosis. Am J Psychiatry (2018) 175:351–8. doi: 10.1176/appi.ajp.2017.16121384
48. Clementz BA. on behalf of the B-SNIP principal investigators. Challenges Facing the Identification of Neurobiologically Distinct Psychosis Subtypes: Response to Neuhaus. Am J Psych (2016) 173:838–9. doi: 10.1176/appi.ajp.2016.15121596r
49. Gu H, Gowda GA, Raftery D. Metabolic profiling: are we enroute to better diagnostic tests for cancer? Future Oncol (2012) 8:1207–10. doi: 10.2217/fon.12.113
50. Liu X, Zheng P, Zhao X, Zhang Y, Hu C, Li J, et al. Discovery and validation of plasma biomarkers for major depressive disorder classification based on liquid chromatography-mass spectrometry. J Prot Res (2015) 14:2322–30. doi: 10.1021/acs.jproteome.5b00144
51. Sethi S, Brietzke E. Omics-based biomarkers: Application of metabolomics in neuropsychiatric disorders. Int J Neuropsychopharmacol (2015) 19:96. doi: 10.1093/ijnp/pyv096
52. Sethi S, Hayashi MA, Sussulini A, Tasic L, Brietzke E. Analytical approaches for lipidomics and its potential applications in neuropsychiatric disorders. World J Biol Psychiatry (2017) 18:506–20. doi: 10.3109/15622975.2015.1117656
53. Li C, Wang A, Wang J, Ramamurthy J, Zhang E, Guadagno E, et al. Metabolomics in patients with psychosis: a systematic review. Am J Med Genet B Neuropsychiatr Genet (2018) 177:580–8. doi: 10.1002/ajmg.b.32662
Keywords: metabolomics, biomarkers, psychosis, schizophrenia, bipolar disorder
Citation: Joaquim HPG, Costa AC, Talib LL, Dethloff F, Serpa MH, Zanetti MV, van de Bilt M and Turck CW (2020) Plasma Metabolite Profiles in First Episode Psychosis: Exploring Symptoms Heterogeneity/Severity in Schizophrenia and Bipolar Disorder Cohorts. Front. Psychiatry 11:496. doi: 10.3389/fpsyt.2020.00496
Received: 07 February 2020; Accepted: 15 May 2020;
Published: 05 June 2020.
Edited by:
Petter Andreas Ringen, University of Oslo, NorwayReviewed by:
Yngve Thomas Bliksrud, Oslo University Hospital, NorwayYannis Trakadis, McGill University, Canada
Copyright © 2020 Joaquim, Costa, Talib, Dethloff, Serpa, Zanetti, van de Bilt and Turck. This is an open-access article distributed under the terms of the Creative Commons Attribution License (CC BY). The use, distribution or reproduction in other forums is permitted, provided the original author(s) and the copyright owner(s) are credited and that the original publication in this journal is cited, in accordance with accepted academic practice. No use, distribution or reproduction is permitted which does not comply with these terms.
*Correspondence: Helena P. G. Joaquim, aGVsZW5hZ2lyb3VkQHVzcC5icg==
†These authors have contributed equally to this work