 Kirsten R. Panton
 Johanna C. Badcock
 J. Edwin Dickinson
 David R. Badcock
- 1Human Vision Laboratory, School of Psychological Science, University of Western Australia, Perth, WA, Australia
- 2Division of Psychiatry, Faculty of Health and Medical Sciences, Centre for Clinical Research in Neuropsychiatry, University of Western Australia, Perth, WA, Australia
- 3Cooperative Research Centre - Mental Health, Carlton, VIC, Australia
Perceptual organization (PO) difficulties have repeatedly been reported in people with schizophrenia, and in healthy individuals with high levels of schizotypy traits, who are at increased risk for schizophrenia. In particular, poor performance on the Embedded Figures Test (EFT) has been interpreted as an atypically strong preference for global over local processing, even though these processes cannot be clearly disambiguated on this test. Here we use two separate versions of the Radial Frequency Search Task (RFST), a new index of PO abilities, to selectively investigate global and local processing of shape information in trait schizotypy. Schizotypy traits were assessed using the Wisconsin Schizotypy Scales-Brief. Individuals selected for high and low levels of positive schizotypy [assessed with the Wisconsin Schizotypy Scales-Brief Perceptual Aberration (PAb) scale] completed the EFT, along with the Global RFST and the Local RFST, all of which require participants to find a target shape amongst distractor elements. The High PAb group (n = 83) were less efficient (i.e., reactions times slowed more as the set size increased) than the Low PAb group (n = 146) on the Global RFST (significant group differences for Target Absent conditions only), but not the Local RFST. High and Low PAb groups also differed on other schizotypy traits, so the specificity of the results to positive schizotypy cannot be assured. Unexpectedly, no group differences were observed on the EFT; however, there was a small, but significant, positive correlation between RFST search efficiency and EFT performance, indicating that they shared some common processes. Overall, the pattern of results suggests that global (but not local) processing difficulties may be contributing to the poorer perceptual organization observed in groups with high levels of schizotypy traits. In addition, the confinement of this result to the Target Absent condition suggests that the underlying mechanism involves differences in decisional processes on the RFST between high and low schizotypy groups. The RFST shows promise as a useful tool for measuring specific perceptual organization abilities in non-clinical, and potentially clinical, samples.
Introduction
Recently there has been a renewal of interest in problems with perceptual organization (PO) experienced by people with, or at increased risk (e.g., schizotypy), for schizophrenia (1–4). PO involves a variety of processes that aid in structuring visual information into coherent patterns, such as contours, groups and objects (5, 6). It has been suggested that these impairments may be specific to psychosis (3, 4, 7, 8). The debated developmental exception to this proposal is the atypical processing abilities reported in individuals with autistic-like traits (9–13).
It has been proposed that PO deficits in schizophrenia are most consistently present when the stimuli used are spatially separated, such as in commonly used contour integration paradigms [eg., the Jittered Orientation Visual Integration task; (14–19)]. There is research to suggest that this impairment may already be present in first-episode patients (15), and tends to worsen as the illness progresses (19). Such findings are consistent with the view that schizophrenia is a neurodevelopmental illness (20–22) whose origins arise long before the onset of psychotic symptoms; though, fewer studies have examined PO in healthy “at-risk” groups.
The Embedded Figures Test (EFT), a traditional, though somewhat different, measure of PO, has revealed a common impairment in schizophrenia and high-risk groups (2), including people with high levels of trait schizotypy who are known to be at increased risk for psychosis (23). The EFT assesses the ability to find a closed-contour shape hidden amongst a more complex array (24). However, the EFT suffers from a number of weaknesses. In particular, the specific processes driving impaired performance are unclear. For example, poor performance in individuals with positive schizotypal traits (e.g., unusual perceptual experiences) has been interpreted as a global (i.e., whole stimulus), rather than local (i.e., detail), processing preference (25)—though these stimuli are not able to unambiguously distinguish between global and local processes (9–12). Despite the ambiguity regarding the underlying processes of the EFT, de-Wit and Wagemans (1 highlighted how important traditional PO tasks such as the EFT are to better understand individual differences in local and global processing, which has been suggested to be representative of individual differences in higher order cognitive processing styles.
In order to overcome the limitations of the EFT, Almeida et al. (9) developed a new measure of one aspect of perceptual organization: the Radial Frequency Search Task (RFST). It uses stimuli known as radial frequency (RF) patterns, which are closed-contour shapes created by deforming a circle, by sinusoidally varying its radius as a function of polar angle [(26); Figure 1]. For this task, individuals are required to identify a target shape [here always a triangle (RF3) with smoothed edges; Figure 1], which is present on 50% of trials, amongst a varied number of distractors. Typically, as the number of distractors present increases (set size = target plus distractors), the time taken to find the target increases. The rate of change in reaction time with increasing set size is referred to as the slope of performance, and is used as an indicator of search efficiency. Target Present and Target Absent conditions are also best analyzed separately (9, 27), as they tend to exhibit systematically different response distributions, suggesting that they represent different underlying processes (28). Target Present search conditions are self-terminating (i.e., the participant stops searching when they have found the target), whereas the Target Absent conditions are a serial search task (i.e., the participant searches through the elements until they establish that the target is absent, which optimally requires all elements to be examined).
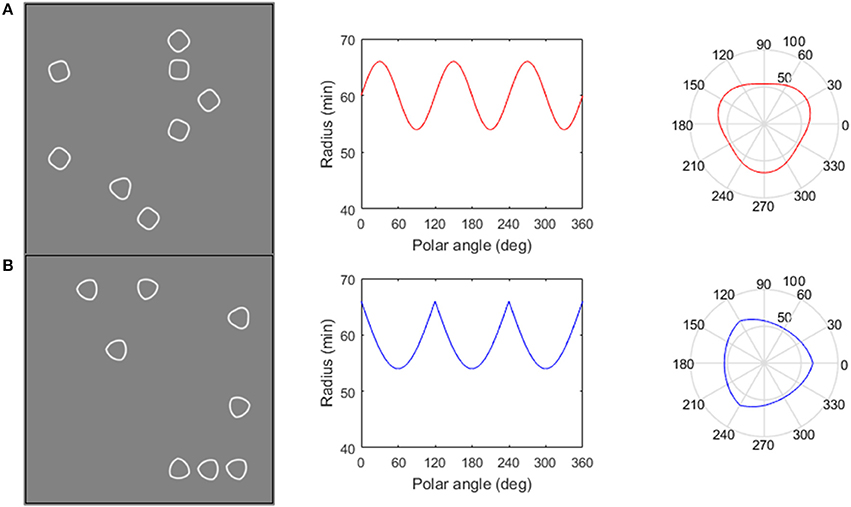
Figure 1. The Global (A) and Local (B) RFST. Global RFST, (A), column 1: participants must find an RF3 (soft-edged triangle) target amongst RF4 (smooth-cornered squares) distractors, known to be globally processed (47). Local RFST (B), column 1: target and distractors are matched on global descriptors (both RF3s), and are only distinguishable by local differences in curvature or orientation. Column 2 describes how the radii change with variations in polar angle. (A) Displays a conventional RF pattern with 3 cycles of modulation (denoted RF3), whereas (B) represents a negatively rectified sinusoid. This negative rectification creates curvature discontinuities which manifest as sharp as opposed to smooth corners (see column 3); however, both patterns contain the same number of points of maximum curvature.
One advantage of RF patterns is that they allow global and local processes to be clearly separated (11, 28–31). Behavioral studies, for example, have shown that RF patterns with fewer than 10 cycles of deformation (such as RF3 and RF4 stimuli) involve global processing, whilst RF stimuli with more than 10 cycles of deformation engage processes that detect local contour deviations without globally integrating that contour information (28–31). Additionally, imaging and electrophysiological studies implicate area V4 for intermediate shape processing, including globally-processed RF patterns (30, 32). In contrast, prior research, such as that based on the EFT, assumes that global and local processing abilities exist on a continuum. As such, a global processing advantage implies a local processing difficulty (and vice versa), and the two processes cannot be clearly separated (33). In RF pattern research, “local” refers to a local pattern feature (e.g., the orientation difference between a local part of the target contour and a circular contour), and global refers to a property of the contour as a whole, which with these repetitive patterns equates to the angle separating points of maximum curvature (11). Previous studies with the RFST have shown that healthy individuals with high levels of autism-related traits exhibit an advantage on both a Global RFST and a Local RFST (11), signifying not just a local processing advantage, but an overall superiority in this aspect of PO in this group. However, investigations of PO with the RFST in trait schizotypy have not yet been conducted.
The aim of the current study was to examine PO abilities associated with trait schizotypy. Drawing on prior research, we chose to target positive schizotypy traits, specifically high and low scores on the short form of the Perceptual Aberrations (PAb) scale (34). In particular, two previous studies examined PO in high and low positive schizotypy using the EFT, but yielded mixed results, hence conclusions regarding global and local processes remain unclear (25, 35). Furthermore, current explanations of positive schizotypy suggest that the unusual perceptual experiences involved arise from early visual processing difficulties (36). We examined PO ability with two versions of the RFST which specifically target global and local processing, and the EFT. Russell-Smith et al. (25) argued for a global (over local) processing advantage in positive schizotypes, therefore, we predicted that individuals with High PAb, compared to Low PAb, scores would exhibit superior search efficiency (shallower search slopes) and faster reaction times (smaller intercepts) on the Global RFST, but not the Local RFST. Drawing on prior literature, we expected reaction times to be longer for the Local RFST, compared to the Global RFST (28), indicating that the former is the more difficult task. We also predicted that the High PAb group would exhibit slower reaction times on the EFT than the Low PAb group (25). To determine the potential specificity of any findings to positive traits, the association with negative and disorganized traits was also explored.
Methods
Participants
Screening and Recruitment
Two thousand six hundred and ninety-three undergraduate students from the University of Western Australia accepted an invitation to complete the Perceptual Aberration (PAb; see Table S1 for further details) and Social Anhedonia scales from the Wisconsin Schizotypy Scales-Brief (37) and the Cognitive Disorganization scale from the short-form Oxford-Liverpool Inventory of Feelings and Experiences (38). Questions were interspersed with items from the Infrequency Scale (39) to identify inconsistent or careless responding. Individuals falling in the 90th percentile (“high” scoring, PAb score ≥ 3) and below the 50th percentile (“low” scoring, PAb score = 0) on the PAb scale were randomly sampled and invited for further testing (outlined below).
Clinical Assessment and Exclusions
The Psychosis Screen (40) provided a brief screen for the presence of psychosis. If 2 (out of 6) items were endorsed, the Diagnostic Interview for Psychosis (41) was used as a more detailed assessment. On clinical interview, participants were excluded if: they self-reported a past or current diagnosis and/or treatment for a psychotic illness (n = 2), screened positive for the presence of psychotic illness (n = 1), brain injury/disorder (n = 3), or substance abuse (n = 5) on individual interview. Additional exclusion criteria included poor visual acuity (lower than 20/32, n = 0) or poor fluency in English (n = 0).
Participant Characteristics
Ninety-two participants met the inclusion criteria and were recruited in the High PAb group and 170 participants were recruited in the Low PAb group. The sample was predominantly female (68%), young adults (Mage = 19.39, SDage = 2.75, 17–31 years).
Psychometric Measures
Schizotypal Traits
The Wisconsin Schizotypy Scales-Brief (34) and short-form Oxford-Liverpool Inventory of Feelings and Experiences1 (38) self-report scales provide valid and reliable assessments of schizotypy traits (37, 42, 43). Positive (Perceptual Aberration (PAb) and Magical Ideation) and Negative (Social Anhedonia and Physical Anhedonia) schizotypy were measured using the Wisconsin Schizotypy Scales-Brief (15-items per scale), and Disorganized schizotypy was measured with the 11-item Cognitive Disorganization scale of the short-form Oxford-Liverpool Inventory of Feelings and Experiences.
Autism-Related Traits
The Autism-Spectrum Quotient (AQ) was used to measure autistic-like traits in the general population [higher scores = more autistic-like behavior; (44)]. AQ scores were included as a potential confound, given that individuals with high AQ traits (total scores ≥ 23) tend to have improved performance on the RFST (9–12).
Stimuli and Procedure
Radial Frequency Search Task (RFST)
The RFST is a computerized visual search task that measures a participant's ability to as quickly and accurately as possible, find a target amongst distractors. The target and distractors were Radial Frequency (RF) patterns (26), which are created by the sinusoidal modulation of the radius of a circle as the function of the polar angle (see Equation 12 By altering parameters of this equation we were able to create shapes with flat sides resembling triangles (RF3s that served as the target shape in both the Global RFST and Local RFST) and squares (RF4s that served as Global RFST distractors)3. Furthermore, rectifying the RF stimuli creates discontinuities in orientation (Equation 22), giving the appearance of sharp-cornered triangles (RRF3s, used as Local RFST distractors, since only the corner curvature varies). The number of shapes on the screen (set size) was 1, 2, 4, and 8. The rate of increase in reaction time as set size increased provided a measure of search efficiency, our primary measure of performance on this task.
Global RFST
The Global RFST involved finding an RF3 (triangle-shape) amongst an array of RF4's (square-shaped), which differ in their global properties (e.g., polar angle between adjacent corners, see column three, Figure 1) and are both known to be globally processed (31, 45–47).
Local RFST
The Local RFST involved finding an RF3 amongst rectified RF3 stimuli. For the Local RFST the RF stimuli were matched in global properties (3 corners separated by 120°) and are only distinguishable by local differences in curvature or orientation [see Figure 1B; (28, 48)].
RFST Stimuli
The base radius of the RF patterns was set at 1° [as in (9)] and the luminance profiles were all Gaussian in cross section (σ = 4′ visual angle). Both patterns in the display (RF3 vs. RF4 or RF3 vs. RRF3) had the same total luminous energy. Weber contrast of 1 was used. The center to center separation of the RF patterns was approximately 3°. The RF's were dispersed on a 7 × 7 grid, creating 49 possible positions for the RF's to appear, which were randomly assigned on each trial. To prevent the patterns from strongly grouping into columns and rows, the patterns were displaced by a random amount (with the range of ±12 arcmin), vertically and horizontally from the grid position.
The stimuli for the RFST were created in MatLab 7.0.4 (Mathworks, Natick, MA, USA), and were presented using a PC (Pentium 4, 3 GHz) driving a Sony Trinitron G520 monitor (100 Hz refresh rate, 1024 × 768 pixels resolution) through the frame buffer of a Cambridge Research Systems (CRS) ViSaGe (CRS, Kent, UK) visual stimulus generator. The background luminance was set to 45 cd/m2 and maximum luminance to 90 cd/m2, which was calibrated using an Optical OP 200-E photometer (head model number 265). The viewing distance was sustained by the use of a chin rest 65.5 cm from the screen (creating pixels subtending 2′ visual angle). The left and right buttons on a CRS CB6 button box were used to make responses.
RFST Procedure
A single-interval forced choice reaction time paradigm was used, such that the participant was required to indicate the presence of the target shape via a left (present) or right (absent) button press. The set sizes were randomly interleaved, with the target shape appearing in the display 50% of the time (i.e., half Target Present, half Target Absent). There were 10 practice trials administered for both versions of the RFST to familiarize participants with the task. There were 120 trials per block, with a total of 90 trials per set size (3 blocks × 30 trials p/set size). The blocks of the Global and Local RFST's were interleaved to control for possible practice effects, with the starting block randomized between participants. Reaction time was recorded to 100 μs resolution. Auditory feedback was provided through two different tones, to indicate correct or incorrect responses.
The Embedded Figures Test (EFT)
The EFT (24) measures the time (in seconds) taken for an individual to find a simple shape hidden inside a more complex pattern, with a maximum search time of 180 s. The primary measure of performance is the mean response time across the 12 trials (as has been used previously; 9, 25, 24), with the number of completed items (i.e., completed within 180 s) providing a secondary measure of performance.
Additional Tests
Differences in visual acuity, handedness and general cognitive ability can independently influence perceptual organization performance (16, 49, 50), so were included as potential covariates. Visual acuity was assessed using a LogMAR acuity chart (51), where lower scores correspond to poorer visual acuity. Handedness was assessed online using a 10-item version of the Edinburgh Handedness Inventory (http://zhanglab.wikidot.com/handedness), which gives participants a score ranging from −1 (pure left handed) to +1 (pure right handed). A tablet-based version of the digit symbol coding test from the Brief Assessment of Cognition in Schizophrenia (NeuroCog Trials, 2014) provided a brief but reliable estimate of general cognitive ability (52), with participant scores reflecting the number of items completed correctly in 90 s.
Procedure
The PAb, Social Anhedonia, Cognitive Disorganization, and AQ scales were voluntarily completed in supervised groups in an initial screening session, following a normal laboratory class. Individuals meeting the inclusion criteria on the PAb scale were invited to take part in further testing (total testing time ~2.5 h). The AQ, all four Wisconsin Schizotypy Scales-Brief subscales and the Cognitive Disorganization subscale were re-administered for test-retest reliability purposes. Only selected High and Low PAb participants completed the EFT4. For both the RFST and EFT, participants were able to freely move their eyes over the stimuli. Another series of tests followed the RFST, which were part of related experiments (to be reported separately). This research was approved by the Human Research Ethics Committee at the University of Western Australia, and all participants provided informed, written consent. All participation was voluntary and no financial incentives were offered.
Data Analysis
First a data quality check was conducted. Test-retest reliability for the schizotypy scales was as follows: PAb = 0.73; Social Anhedonia = 0.73, Cognitive Disorganization = 0.84 and AQ = 0.77, indicating good or acceptable reliability for all scales. Screening scores were used for group allocations reported below. Next, individuals who scored 3 or more on the Infrequency Scale were excluded from the final sample (nhighPAb = 2, nlowPAb = 2). Outliers (> ± 3 SD) were detected on the digit symbol coding (nlowPAb = 3) and age (nlowPAb = 6, nhighPAb = 1), and were removed prior to analysis.
EFT reaction time scores were skewed, hence the logarithm of the reaction time's (recorded in seconds) was taken for the EFT. The anti-log of this data is reported in the Results section below. For the RFST, only correct responses were included, and the lower limit of accuracy was set at 75%. All participants met this criterion for the Global RFST, however, a subset of individuals performed below this criterion on the Local RFST, and were subsequently removed from these analyses (nhighPAb = 9, nlowPAb = 24). There were no differences in accuracy between the High/Low PAb groups (Present and Absent) (see Supplementary Materials for further details, Figure S1).
Next, the median5 of the reaction time's for each set size was obtained, and fit with a linear function, [see (9–11)] using Equation (3):
The slope of the function represents the rate of increase in reaction time as set size increases and therefore provides a measure of search efficiency. Slope was used as the primary indicator of task performance, with steeper search slopes representing reduced search efficiency. The intercept provided a secondary outcome measure, and is argued to represent non-search processes, related to signal transmission speed. R2–a goodness of fit statistic—on average indicated a good fit for the linear functions (equation 3), for both the Global (Target Present = 0.88, Target Absent = 0.92) and Local (Target Present = 0.94, Target Absent = 0.99) RFST's. Present and Absent data were analyzed separately, as noted above (9, 27, 28). In addition, since the Global and Local RFST's are targeting independent processes, they were treated as such in the analyses.
Independent samples t-tests were used to explore group differences in slope and intercepts. Effects sizes are represented by Cohen's d for the independent samples t-tests. Effect sizes are considered small when d = 0.20 or approaches that value, medium when d = 0.50 or approaching that value, and large when approaching d = 0.80 (53). It is expected that the effect sizes will be small-medium, given that medium effect sizes have been found in other PO tasks with clinical samples (2, 18). Analyses were completed in IBM SPSS Statistics Version 22 and GraphPad Prism Version 76.
Results
Descriptive Statistics
Independent samples t-tests (two-tailed) showed that High and Low PAb groups were not significantly different in age, digit symbol coding, handedness or visual acuity. However, compared to the Low PAb groups, the High PAb groups had significantly higher AQ scores and higher levels on all schizotypy traits, except Physical Anhedonia (see Table 1). Inspection of the effect sizes (Table 1) and score distributions (Figure S2) for all traits showed that the largest group difference occurred on the PAb scale (as expected), with considerable group overlap on the remaining traits. In addition, the average scores for the High and Low PAb groups for the other schizotypy and AQ traits were within the mid-range of scores (i.e., not below the 50th percentile or above the 90th percentile; see column 2 and 4 in Figure S2).
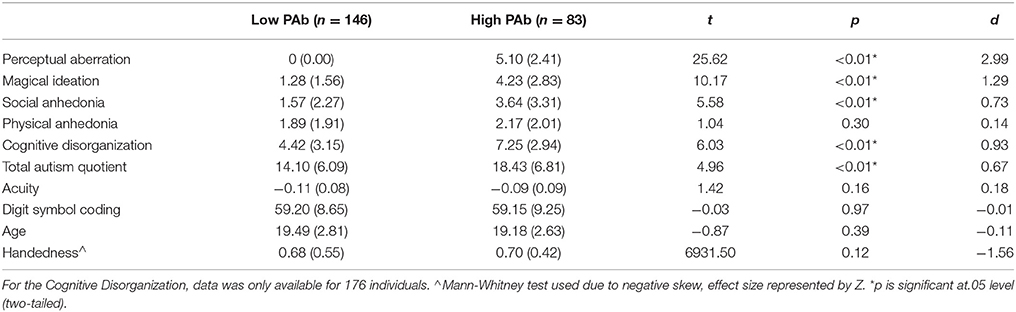
Table 1. Participant characteristics (Mean and SD) in high and low Perceptual Aberration groups.
To determine whether covariates should be used in the analyses reported below, correlations were calculated between measures of acuity, handedness, digit symbol coding, and AQ scores, and all measures of PO, i.e., slopes and intercepts on both the Global and Local RFST (for Target Present and Target Absent conditions), and EFT average reaction time scores. Correlations larger than 0.3 were used to identify potential covariates [eg., (54); see Table S2]. No correlations met this criterion. Most traits were weakly and non-significantly correlated with the PO measures, and therefore were not used as covariates. Given prior literature on the association of AQ and PO, the distribution of AQ scores in schizotypy groups was examined. The percentage of High AQ's (≥23) in the High PAb (30.12%) group was higher than the Low PAb (9.59%), presenting difficulty in teasing out the effect of AQ (Figure S3). However, when repeating the analyses after removing these High AQ individuals, the pattern of results remained the same.
RFST Performance
Global RFST
Target Present
Search slopes tended to be higher for the High PAb group compared to the Low PAb group on the Global Target Present RFST, with a small effect size (Table 2); however, the difference between groups was not statistically significant (Figure 2). No significant difference in processing speed (intercepts) between the High and Low PAb groups was found (small effect size, see Table 2).
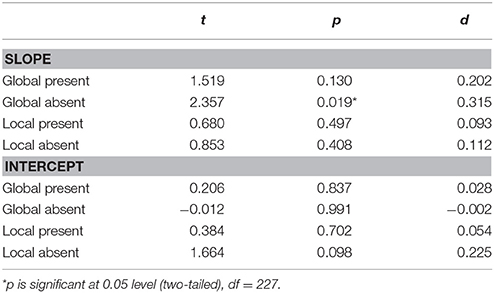
Table 2. Independent samples t-tests comparing High and Low PAb groups on the slopes and intercepts for the linear fits to RFST data.
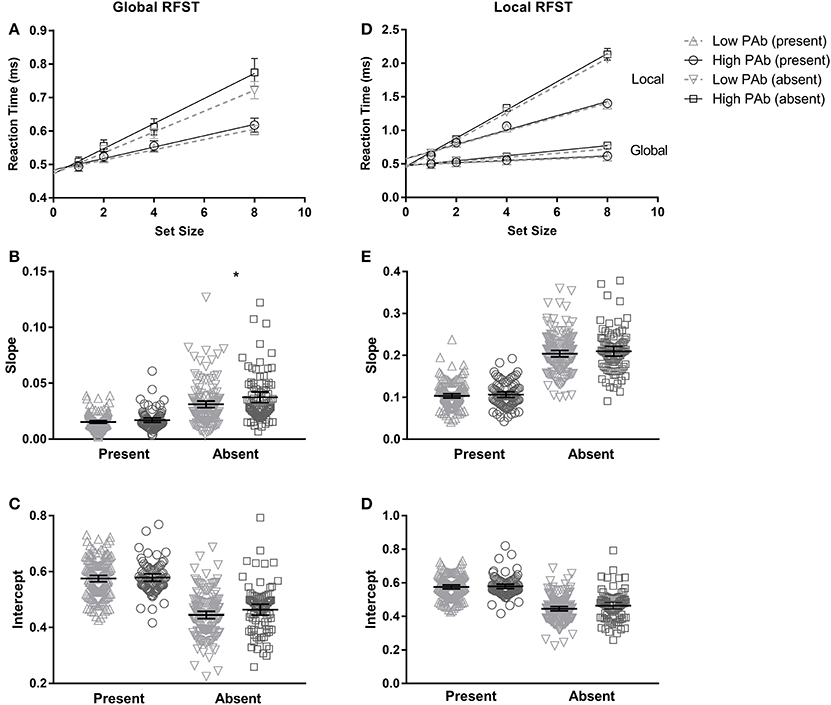
Figure 2. Mean search slopes and intercepts for the High and Low PAb groups for the Global (left panels) and Local (right panels) RFSTs, derived by fitting a linear function when reaction time is plotted against set size (see A,D). Due to differences in task difficulty between Global and Local, the data are presented on different axes. (D) Highlights the difference in task difficulty between Global and Local RFST's, when they are shown on the same axes. Individual slopes (B,E) and intercepts (C,F) are represented in the bottom panels. The High PAb group exhibited significantly steeper search slopes for the Global Absent RFST only (*p is significant at the 0.05 level, two-tailed).
Target Absent
Significantly steeper search slopes were found on the Global Target Absent RFST, that is, the High PAb group exhibited reduced search efficiency (Figure 2), with a medium effect size7. This outcome follows the same pattern of results as the Target Present condition although it was not a significant effect in that case.
Local RFST
Target Present
There were no significant differences between High and Low PAb groups on the slopes or intercepts for the Local RFST, and all effect sizes were small.
Target Absent
There were also no differences between the High and Low PAb groups on Local Target Absent search efficiency, however, the High PAb group exhibited larger intercepts (albeit this was not statistically significant), with small effect sizes (see Table 2 and Figure 2).
EFT Performance
No significant group differences were found on either EFT reaction time scores, t(136) = 0.240, p = 0.811, d = 0.04 (High PAb: M = 30.490, SD = 1.627, n = 49; Low PAb: M = 29.803, SD = 1.748, n = 89), or the number of completed items, U = 2046.000, Z = −0.654, p = 0.513 (High PAb: M = 11.102, SD = 1.085; Low PAb: M = 11.225, SD = 0.899). However, a modest significant, positive correlation was observed between EFT reaction time and search efficiency on both the Global (r = 0.217, p = 0.018, n = 118) and Local RFST (r = 0.310, p = 0.001, n = 118), when using Target Present slopes as the measure of performance. In contrast, correlations between the EFT reaction time and Global (r = 0.071, p = 0.443, n = 118) or Local (r = 0.180, p = 0.051, n = 118) Target Absent slopes were non-significant.
Discussion
This study aimed to explore PO differences in people with High and Low positive (PAb) schizotypal traits using both newer (RFST) and traditional (EFT) measures of aspects of PO. The RFST is similar to the EFT in terms of its visual search properties. However, the RFST offers the significant advantage of allowing us to test whether the PO difficulties observed in high schizotypes may be specifically attributed to differences in global or local processes; in particular, to differences in search efficiency (i.e., rate of change in reaction time as set size increased) or processing speed (including other non-search processes). Contrary to predictions, we found that global processing was significantly poorer (rather than enhanced) in the High PAb group relative to the Low PAb group. Specifically, the results showed lower search efficiency on the Global RFST in those with High PAb scores, compared to those with Low PAb scores. This difference in global processing had a moderate effect size, but was evident only in the Target Absent condition and not the Target Present condition—which suggests that the underlying mechanism involves differences in decisional processes on the RFST. These findings cannot be attributed to a speed-accuracy trade-off, given that there were no group differences in the proportion of correct responses. In addition, group differences in global processing could not be explained as a result of generalized deficits related to age, digit symbol coding scores, handedness or visual acuity, since High and Low PAb groups did not differ on these variables. Similarly, it is unlikely that group differences in AQ can explain the decreased efficiency in global processing observed, since higher AQ scores have previously been associated with better rather than worse performance on the RFST (11). Furthermore, when high AQ scorers were removed from both high and low schizotypy groups, the key results remained unchanged. Importantly, however, the specificity of the difficulty in global processing to positive schizotypy alone cannot be assured, since the High PAb group also had high scores on other schizotypal traits. Indeed, prior research shows that schizotypal traits are typically positively correlated (55); hence attempting to isolate a single trait would select a very atypical group not representative of most people with high schizotypy scores.
A notable observation for the remainder of the results is the lack of significant group differences in PO. First, the prediction of a global processing advantage in high schizotypes, as posited by Russell-Smith et al. (25), in terms of speed of processing was not confirmed. High and Low PAb groups did not exhibit any differences in intercept values—indicating that signal transmission speed was similar. Indeed previous evidence indicates that speed of processing is largely intact in high positive schizotypy—which may confer some protection to the onset of schizophrenia [see also (56, 57)]. Second, and significantly, no group differences were observed in local processing abilities on the RFST, in either Target Absent or Target Present conditions; though search efficiency was lower overall on the Local compared to the Global RFST (Figure 2D), suggesting the Local RFST was more difficult, as expected (28, 48). Together with the results outlined above, these findings suggest that high schizotypy is associated with (a) a specific though mild difficulty in global but not local processing, (b) involves poorer search efficiency rather than slower processing speed, (c) cannot be explained as a task difficulty effect, and (d) may arise from altered decision processes when organizing perceptual information into shapes and objects.
Lastly, no significant differences between High and Low PAb groups were found on the EFT task. The unexpected outcome on the EFT appears to be due to close to ceiling accuracy levels in both High and Low PAb groups, which suggests that the EFT is not sufficiently sensitive to differences in PO abilities in this sample. In contrast, the RFST was able to reveal group differences in global processing, that would have previously been missed with the EFT. Indeed, the significant correlation observed between the EFT and RFST [as also found in Almeida et al. 9] suggests the tasks share some common variance, but are not identical. It's important to note that the conceptualisation of local and global is slightly different in the EFT and RFST. The EFT assesses an individuals' ability to disembed local features from a global stimulus, whereas the RFST aimed to isolate the local and global elements. The terms “local” and “global” have taken on a number of different meanings in the literature (33), however, the RFST is one of the few tasks that has attempted to separate local and global components.
The subtle difficulties in global processing captured by the RFST in high-trait schizotypy are consistent with continuum models of psychosis, in demonstrating that anomalies in PO are not limited to schizophrenia but are also observed in healthy individuals at increased risk for psychotic illness (2). However, longitudinal studies tracking global and local processing during development are still needed to determine whether poorer global search efficiency presages the onset of psychotic disorder and conversely, whether intact search efficiency serves as a protective factor. Current models of psychosis risk clearly advocate for a combination of risk factors leading to the development of clinically diagnosable schizophrenia (58–60); though they have not typically included modern measures of PO and lack detail on the precise mechanisms involved. It has previously been suggested that perceptual organization difficulties may, at the phemenological level, translate to individuals having a more fragmented view of the world (61), indicating that intact perceptual organization may protect against the development of a potentially disorganized or anomalous world view (1). The benefit of the current tasks to assess PO lies in providing insight into which specific components of PO may be deficient, setting young people on a trajectory toward more anomalous perceptual experiences and increased risk for psychosis.
A better understanding of global and local processing in schizotypy, i.e., the specific behavioral and neural mechanisms involved, may also provide new avenues for examining well-documented impairments in perceptual organization in schizophrenia (3, 62). For example, the RFST (unlike the EFT) can be easily modified to test the influence of specific stimulus characteristics, such as spatial frequency, which has been argued to be particularly relevant to visual processing deficits in schizophrenia (63, 64) and schizotypy (65). Indeed, further work is needed to determine if poor performance on the RFST is a reliable marker of risk for psychosis and is also observed in patients with schizophrenia. Further work may also consider measuring eye movements [e.g., (66)] as an adjunct measure of global and local processing differences in high and low schizotypy samples. Despite many advantages, alternative tools for assessing PO, such as the Jittered Orientation Visual Integration task, often prove challenging for patients with schizophrenia, with tolerability ratings ranging from low to moderate (67). The RFST offers a quick (~10 min) and easy alternative (~96% average correct responses) that may be refined for use as a screening tool in patients [e.g., (68)].
Limitations
A number of limitations should be noted. Firstly, this study was restricted to a university student sample, which despite having its advantages, limits the generalizability of these results due to the selective nature of university entrance. Secondly, gender differences in PO should be an important consideration for future research, in light of previous studies which have found that males tend to be faster at RT based tasks (69), and have varied PO difficulties in schizophrenia (70). Thirdly, the interaction between Age, PO, and schizotypy traits was not explored due to the restricted age range of participants. Lastly, in the current study, the small, and often non-significant correlations between negative and disorganized schizotypy traits and RFST measures, suggest that these other schizotypy traits have little to no impact on global (or local) processing; though such conclusions need to be tentative. As a whole, the interaction between schizotypy traits and underlying cognitive-perceptual mechanisms is not well understood [e.g., (71)], and should continue to be a focus for future work.
In conclusion, there has been concerted interest in developing reliable and valid tasks for assessing perceptual dysfunction in people with, and at increased risk for, schizophrenia (18, 72). The varieties of RFST available, pave the way for additional, flexible measures of PO that could be used in both clinical and high-risk samples. The RFST is a sensitive assessment tool, and may be particularly useful in helping to better understand the development of visual processing dysfunction prior to illness onset, even when PO processes are relatively preserved (36, 45).
Author Contributions
KP, JB, JD, and DB contributed to the development of the study design. JD and DB created the stimuli and programs for collecting data. KP collected and analyzed the data and produced the manuscript, in partial fulfillment of her Ph.D. JB, JD, and DB provided feedback on the manuscript KP, JB, JD, and DB gave final approval and agreed to be accountable for all aspects of the work.
Funding
DB was supported by funding from the National Health and Medical Research Council (APP1081874) and Australian Research Council (DP110104553, DP160104211). JB receives salary support from the Cooperative Research Centre — Mental Health, Carlton, Victoria.
Conflict of Interest Statement
The authors declare that the research was conducted in the absence of any commercial or financial relationships that could be construed as a potential conflict of interest.
Acknowledgments
We would like to thank NeuroCog Trials for providing access to the Brief Assessment of Cognition iPad app, to assess digit symbol coding performance. A subset of this data was presented at Experimental Psychology Conference 2016 and Asia Pacific Conference on Vision in 2016, and the abstract was subsequently published in i-Perception (2).
Supplementary Material
The Supplementary Material for this article can be found online at: https://www.frontiersin.org/articles/10.3389/fpsyt.2018.00285/full#supplementary-material
Abbreviations
EFT, Embedded Figures Test; RFST, Radial Frequency Search Task; PAb, Perceptual Aberration; PO, Perceptual Organization; RF, Radial Frequency; AQ, Autism Quotient.
Footnotes
1. ^These data was only available for a subset of individuals (n = 176).
2. ^Equation 1. R(θ) = R0(1+Asin(ωθ+ φ)), where ϑ is the angle made with the x-axis, R0 is the mean radius of the modulated circle, ω is the frequency of modulated cycles in 3600 (ω = 3 or 4, denoted RF3 and RF4 respectively) and φ is the angular phase of the shape. Equation 2: The equation for the negatively rectified stimuli [see Local RFST below; (48)] is: .
3. ^A recent study found that the targets and distractors of both the Global and Local RFST's were equally salient (28).
4. ^Three individuals from the Low PAb group had recently completed the EFT as part of another study, in order to avoid repeat testing—which invalidates responses—scores for these individuals were obtained (with consent), from the earlier study. Data for 4 individuals was missing.
5. ^The median was chosen over the mean as there was no single transformation that could normalize the data in all conditions.
6. ^The analyses were repeated when removing 9 outliers on slope and 3 outliers on intercept values (Mean ≥ 3 SD), however, the outcome did not change.
7. ^Following a suggestion from a reviewer, a post-hoc exploratory analysis was conducted to determine the impact of age on search efficiency. Groups were broken down as follows: 17–19 (High PAb: 67.5%, Low PAb: 70.5%), 20-24 (High PAb: 25.3%, Low PAb: 21.9%), 25–31 (High PAb: 7.2%, Low PAb: 7.5%). An interaction of Age × PAb group was found, such that High PAb group showed significantly steeper search slopes compared to the Low PAb for the Youngest (17–19) group only. However, given the small proportion of the sample in the older age groups, it is difficult to interpret the overall effect of age on search efficiency.
References
1. de-Wit L, Wagemans J. Individual Differences in Local and Global Perceptual Organization. Oxford: Oxford University Press (2015).
2. Panton KR, Badcock DR, Badcock JC. A metaanalysis of perceptual organization in schizophrenia, schizotypy, and other high-risk groups based on variants of the Embedded Figures Task. Front Psychol. (2016) 7:237. doi: 10.3389/fpsyg.2016.00237
3. Silverstein SM. Visual perception disturbances in schizophrenia: a unified model. In: Li M, Spaulding WD, editors. The Neuropsychopathology of Schizophrenia. Switzerland: Springer (2016). p. 77–132.
4. Silverstein SM, Keane BP. Perceptual organization impairment in schizophrenia and associated brain mechanisms: review of research from 2005 to 2010. Schizophr Bull. (2011) 37:690–9. doi: 10.1093/schbul/sbr052
6. Wagemans JJH, Elder JH, Kubovy M, Palmer SE, Peterson MA, Singh M et al. A century of gestalt psychology in visual perception: I. perceptual grouping and figure–ground organization. Psychol Bull. (2012) 138:1172–217. doi: 10.1037/a0029333
7. Carter O, Bennett D, Nash T, Arnold S, Brown L, Cai RY et al. Sensory integration deficits support a dimensional view of psychosis and are not limited to schizophrenia. Transl Psychiatry (2017) 7:e1118. doi: 10.1038/tp.2017.69
8. Uhlhaas PJ, Silverstein SM. Perceptual organization in schizophrenia spectrum disorders: empirical research and theoretical implications. Psychol Bull. (2005) 131:618–32. doi: 10.1037/0033-2909.131.4.618
9. Almeida RA, Dickinson JE, Maybery M, Badcock JC, Badcock DR. A new step towards understanding Embedded Figures Test performance in the autism spectrum: the radial frequency search task. Neuropsychologia (2010) 48:374–81. doi: 10.1016/j.neuropsychologia.2009.09.024
10. Almeida RA, Dickinson JE, Maybery M, Badcock JC, Badcock DR. Visual search performance in the autism spectrum II: the radial frequency search task with additional segmentation cues. Neuropsychologia (2010) 48:4117–24. doi: 10.1016/j.neuropsychologia.2010.10.009
11. Almeida RA, Dickinson JE, Maybery MT, Badcock JC, Badcock DR. Visual search targeting either local or global perceptual processes differs as a function of autistic-like traits in the typically developing population. J Autism Dev Disord. (2013) 42:1272–86. doi: 10.1007/s10803-012-1669-7
12. Almeida RA, Dickinson JE, Maybery MT, Badcock JC, Badcock DR. Enhanced global integration of closed contours in individuals with high levels of autistic-like traits. Vision Res. (2014) 103:109–15. doi: 10.1016/j.visres.2014.08.015
13. Dakin S, Frith U. Vagaries of visual perception in autism. Neuron (2005) 48:497–507. doi: 10.1016/j.neuron.2005.10.018
14. Butler PD, Abeles IY, Silverstein SM, Dias EC, Weiskopf NG, Calderone DC et al. An event-related potential examination of contour integration deficits in schizophrenia. Front Psychol. (2013) 4:132. doi: 10.3389/fpsyg.2013.00132
15. Feigenson KA, Keane BP, Roché MW, Silverstein SM. Contour integration impairment in schizophrenia and first episode psychosis: State or trait? Schizophr Res. (2014) 159:515–20. doi: 10.1016/j.schres.2014.09.028
16. Keane BP, Kastner S, Paterno D, Silverstein SM. Is 20/20 vision good enough? Visual acuity differences within the normal range predict contour element detection and integration. Psychon Bull Rev. (2014) 22:121–7. doi: 10.3758/s13423-014-0647-9
17. Silverstein SM, Harms MP, Carter CS, Gold JM, Keane BP, MacDonald AIII et al. Cortical contributions to impaired contour integration in schizophrenia. Neuropsychologia (2015) 75:469–80. doi: 10.1016/j.neuropsychologia.2015.07.003
18. Silverstein SM, Keane BP, Barch DM, Carter CS, Gold JM, Kovács I et al. Optimization and validation of a visual integration test for schizophrenia research. Schizophr Bull. (2012) 38:125–34. doi: 10.1093/schbul/sbr141
19. Keane BP, Paterno D, Kastner S, Silverstein SM. Visual integration dysfunction in schizophrenia arises by the first psychotic episode and worsens with illness duration. J Abnorm Psychol. (2016) 125:543–9. doi: 10.1037/abn0000157
20. Gooding DC, Iacono WG. Schizophrenia through the lens of a developmental psychopathology perspective. In: Cicchetti D, Cohen DJ, editors. Manual of Developmental Psychopathology, Vol. 2. Risk, Disorder, and Adaptation. New York, NY: Wiley (1995).
21. Jablensky A, McNeil TF, Morgan VA. Barbara Fish and a short history of the neurodevelopmental hypothesis of schizophrenia. Schizophr Bull. (2017) 43:1158–63. doi: 10.1093/schbul/sbx094
22. Weinberger DR. Implications of normal brain development for the pathogenesis of schizophrenia. Arch Gen Psychiatry (1987) 44:660–9. doi: 10.1001/archpsyc.1987.01800190080012
23. Debbané M, Eliez S, Badoud D, Conus P, Flückiger R, Schultze-Lutter F. Developing psychosis and its risk states through the lens of schizotypy. Schizophr Bull. (2015) 41, S396–407. doi: 10.1093/schbul/sbu176
24. Witkin HA, Oltman PK, Raskin E, Karp SS. A Manual for the Embedded Figures Test. Palo Alto, CA: Consulting Psychologists Press (1971).
25. Russell-Smith S, Maybery MT, Bayliss D. Are the autism and positive schizotypy spectra diametrically opposed in local versus global processing? J Autism Dev Disord. (2010) 40:968–77. doi: 10.1007/s10803-010-0945-7
26. Wilkinson F, Wilson HR, Habak C. Detection and recognition of radial frequency patterns. Vision Res. (1998) 38:3555–68. doi: 10.1016/S0042-6989(98)00039-X
27. Wolfe JM. Guided search 2.0 a revised model of visual search. Psychon Bull Rev. (1994) 1:202–38. doi: 10.3758/BF03200774
28. Dickinson JE, Haley K, Bowden VK, Badcock DR. Visual search reveals a critical component to shape. J Vis. (2018) 18:2. doi: 10.1167/18.2.2
29. Bell J, Badcock DR. Narrow-band radial frequency shape channels revealed by sub-threshold summation. Vision Res. (2009) 49:843–50. doi: 10.1016/j.visres.2009.03.001
30. Bowden VK, Dickinson JE, Fox AM, Badcock DR. Global shape processing: a behavioral and electrophysiological analysis of both contour and texture processing. J Vis. (2015) 15:18. doi: 10.1167/15.13.18
31. Dickinson JE, Bell J, Badcock DR. Near their thresholds for detection, shapes are discriminated by the angular separation of their corners. PLoS ONE (2013) 8:e66015. doi: 10.1371/journal.pone.0066015
32. Wilkinson F, James TW, Wilson HR, Gati JS, Menon RS, Goodale MA. An fMRI study of the selective activation of human extrastriate form vision areas by radial and concentric gratings. Curr Biol. (2000) 10:1455–8. doi: 10.1016/S0960-9822(00)00800-9
33. Milne L, Szczerbinski M. Global and local perceptual style, field-independence, and central coherence: an attempt at concept validation. Adv Cogn Psychol. (2009) 5:1–26. doi: 10.2478/v10053-008-0062-8
34. Winterstein BP, Silvia PJ, Kwapil TR, Kaufman JC, Reiter-Palmon R, Wigert B. Brief assessment of schizotypy: Developing short forms of the Wisconsin Schizotypy Scales. Pers Individ Dif. (2011) 51:920–4. doi: 10.1016/j.paid.2011.07.027
35. Schuldberg D, London A. Psychological differentiation and schizotypal traits: negative results with the Group Embedded Figures Test. Percept Mot Skills (1989) 68:1219–26. doi: 10.2466/pms.1989.68.3c.1219
36. Ettinger U, Mohr C, Gooding DC, Cohen AS, Rapp A, Haenschel C et al. Cognition and brain function in schizotypy: a selective review. Schizophr Bull. (2015) 41, S417–26. doi: 10.1093/schbul/sbu190
37. Gross GM, Silvia PJ, Barrantes-Vidal N, Kwapil TR. The dimensional structure of short forms of the Wisonsin Schizotypy Scales. Schizophr Res. (2015) 166:80–5. doi: 10.1016/j.schres.2015.05.016
38. Mason O, Linney Y, Claridge G. Short scales for measuring. Schizophr Res. (2005) 78:293–96. doi: 10.1016/j.schres.2005.06.020
39. Chapman LJ, Chapman JP. Infrequency Scale. Unpublished Test. Greensboro, NC: Department of Psychology, University of North Carolina at Greensboro (1983).
40. Jablensky A, McGrath J, Herman H, Castle D, Gureje O, Evans M. Psychotic disorders in urban areas: an overview of the study on low prevalence disorders. Aust N Z J Psychiatry (2000) 34:221–36. doi: 10.1080/j.1440-1614.2000.00728.x
41. Castle D, Jablensky A, McGrath J, Carr V, Morgan V, Waterreus A et al. The diagnostic interview for psychoses (DIP): development, reliability and applications. Psychol Med. (2006) 36:69–80. doi: 10.1017/S0033291705005969
42. Fonseca-Pedrero E, Ortuño-Sierra J, Mason OJ, Muñiz J. The oxford–liverpool inventory of feelings and experiences short version: further validation. Pers Individ Dif. (2015) 86:338–43. doi: 10.1016/j.paid.2015.06.041
43. Fonseca-Pedrero E, Palno M, Ortuño-Sierra J, Lemos-Giráldez S, Muñiz J. Dimensionality of the Wisconsin Schizotypy scales-brief forms in college students. Sci World J. (2013) 2013:1–8. doi: 10.1155/2013/625247
44. Baron-Cohen S, Wheelwright S, Skinner R, Martin J, Clubley E. The autism-spectrum quotient (AQ): evidence from asperger syndrome/high-functioning autism, males and females, scientists and mathematicians. J Autism Dev Disord. (2001) 31:5–17. doi: 10.1023/A:1005653411471
45. Cribb SJ, Badcock JC, Maybery MT, Badcock DR. Dissociation of local and global contributions to detection of shape with age. J Exp Psychol. (2016) 42:1761–9. doi: 10.1037/xhp0000257
46. Dickinson JE, McGinty J, Webster KE, Badcock DR. Further evidence that local cues to shape in RF patterns are integrated globally. J Vis. (2012) 12:1–17. doi: 10.1167/12.12.16
47. Loffler G, Wilson HR, Wilkinson F. Local and global contributions to shape discrimination. Vision Res. (2003) 43:519–30. doi: 10.1016/S0042-6989(02)00686-7
48. Dickinson JE, Cribb SJ, Riddell HR, Badcock DR. Tolerance for local and global differences in the integration of shape information. J Vis. (2015) 15:1–24. doi: 10.1167/15.3.21
49. Powell JL, Kemp GJ, García-Finaña M. Association between language and spatial laterality and cognitive ability: an fMRI study. Neuroimage (2012) 59:1818–29. doi: 10.1016/j.neuroimage.2011.08.040
50. Sheppard LD, Vernon PA. Intelligence and speed of information-processing: a review of 50 years of research. Pers Individ Dif. (2008) 44:535–51. doi: 10.1016/j.paid.2007.09.015
51. Oduntan OA, Mashige KP, Raliavhegwa-Makhado M. A comparison of two methods of logMAR visual acuity data scoring for statistical analysis. South Afr Optomet. (2009) 63:155–63. doi: 10.4102/aveh.v68i3.162
52. Atkins AS, Davis VG, Tseng T, Vaughan A, Harvey PB, Narasimhan M et al. Validation of the Tablet-based Brief Assessment of Cognition (BAC App) for Schizophrenia (2014). Available online at: http://www.neurocogtrials.com/
53. Cohen J. Statistical Power Analysis for the Behavioral Sciences. New York, NY: Academic Press (1977).
54. Crawford JR, Garthwaite PH, Ryan K. Comparing a single case to a control sample: testing for neuropsychological deficits and dissociations in the presence of covariates. Cortex (2011) 47:1166–78. doi: 10.1016/j.cortex.2011.02.017
55. Gross GM, Silvia PJ, Barrantes-Vidal N, Kwapil TR. Psychometric properties and validity of short forms of the Wisconsin Schizotypy Scales in two large samples. Schizophr Res. (2012) 134:267–72. doi: 10.1016/j.schres.2011.11.032
56. Badcock JC, Clark ML, Pedruzzi RA, Morgan VA, Jablensky A. Intact speed of processing in a community-based sample of adults with high schizotypy: a marker of reduced psychosis risk? Psychiatry Res. (2015) 228:531–7. doi: 10.1016/j.psychres.2015.06.003
57. Chun CA, Minor KS, Cohen AS. Neurocognition in psychometrically defined college schizotypy samples: we are not measuring the “right stuff”. J Internat Neuropsychol Soc. (2013) 19:324–37. doi: 10.1017/S135561771200152X
58. de Leede-Smith S, Roodenrys S, Horsley L, Matrini S, Mison E, Barkus E. Neurological soft signs: Effects of trait schizotypy, psychological distress and auditory hallucination predisposition. Schizophr Res Cogn. (2017) 7:1–7. doi: 10.1016/j.scog.2016.11.001
59. Fusar-Poli P, Bonoldi I, Yung AR, Borgwardt S, Kempton MJ, Valmaggia L et al. Predicting psychosis: meta-analysis of transition outcomes in individuals at high clinical risk. Arch Gen Psychiatry (2012) 69:220–9. doi: 10.1001/archgenpsychiatry.2011.1472
60. Murray RM, Bhavsar V, Tripoli G, Howes O. 30 years on: how the neurodevelopmental hypothesis of schizophrenia morphed into the developmental risk factor model of psychosis. Schizophr Bull. (2017) 43:1190–6. doi: 10.1093/schbul/sbx121
61. Uhlhaas PJ, Mishara AL. Perceptual anomolies in schizophrenia: integrating phenomology and cognitive neuroscience. Schizophr Bull. (2007) 33:142156. doi: 10.1093/schbul/sbl047
62. Phillips W, Clark A, Silverstein SM. On the functions, mechanisms, and malfunctions of intracortical contextual modulation. Neurosci Biobehav Rev. (2015) 52:1–20. doi: 10.1016/j.neubiorev.2015.02.010
63. Butler PD, Javitt DC. Early-stage visual processing deficits in schizophrenia. Curr Opin Psychiatry (2005) 18:151–7. doi: 10.1097/00001504-200503000-00008
64. Laycock R, Crewther SG, Crewther DP. A role for the ‘magnocellular advantage’ in visual impairments in neurodevelopmental and psychiatric disorders. Neurosci Biobehav Rev. (2007) 31:363–76. doi: 10.1016/j.neubiorev.2006.10.003
65. Cappe C, Herzog MH, Herzig DA, Brand A, Mohr C. Cognitive disorganisation in schizotypy is associated with deterioration in visual backward masking. Psychiatry Res. (2012) 200:652–9. doi: 10.1016/j.psychres.2012.07.001
66. Levy DL, Sereno AB, Gooding DC, O'Driscoll GA. Eye tracking dysfunction in schizophrenia: characterization and pathophysiology. In: Swerdlow N, Editor. Behavioral Neurobiology of Schizophrenia and Its Treatment. Berlin: Springer (2010). p. 311–47.
67. Strauss ME, McLouth CJ, Barch DM, Carter CS, Gold JM, Luck SJ et al. Temporal stability and moderating effects of age and sex on CNTRaCS task performance. Schizophr Bull. (2013) 40:835–44. doi: 10.1093/schbul/sbt089
68. Karageorgiou E, Schulz SC, Gollub RL, Andreasen NC, Ho BC, Lauriello J et al. Neuropsychological testing and structural magnetic resonance imaging as diagnostic biomarkers early in the course of schizophrenia and related psychoses. Neuroinformatics (2011) 9:321–33. doi: 10.1007/s12021-010-9094-6
69. Roivainen E. Gender differences in processing speed: a review of recent research. Learn Individ Differ. (2011) 21:145–9. doi: 10.1016/j.lindif.2010.11.021
70. Joseph J, Bae G, Silverstein SM. Sex, symptom, and premorbid social functioning associated with perceptual organization dysfunction in schizophrenia. Front Psychol. (2013) 4:547. doi: 10.3389/fpsyg.2013.00547
71. Debbané M, Badoud D, Balanzin D, Eliez S. Broadly defined risk mental states during adolescence: disorganization mediates positive schizotypal expression. Schizophr Res. (2013) 147:153–6. doi: 10.1016/j.schres.2013.03.012
Keywords: schizotypy, perceptual organization, global processing, local processing, schizophrenia
Citation: Panton KR, Badcock JC, Dickinson JE and Badcock DR (2018) Poorer Search Efficiency in Healthy Young Adults With High Schizotypal Personality Traits. Front. Psychiatry 9:285. doi: 10.3389/fpsyt.2018.00285
Received: 27 March 2018; Accepted: 12 June 2018;
Published: 12 July 2018.
Edited by:
Roumen Kirov, Institute of Neurobiology (BAS), BulgariaReviewed by:
Diane Carol Gooding, University of Wisconsin-Madison, United StatesPrabitha Urwyler, ARTORG Zentrum für Biomedizinische Technikforschung, Universität Bern, Switzerland
Copyright © 2018 Panton, Badcock, Dickinson and Badcock. This is an open-access article distributed under the terms of the Creative Commons Attribution License (CC BY). The use, distribution or reproduction in other forums is permitted, provided the original author(s) and the copyright owner(s) are credited and that the original publication in this journal is cited, in accordance with accepted academic practice. No use, distribution or reproduction is permitted which does not comply with these terms.
*Correspondence: Kirsten R. Panton, a2lyc3Rlbi5wYW50b25AcmVzZWFyY2gudXdhLmVkdS5hdQ==