 Michael Abimbola Ogbe
 Malanta Sabiu Abdullahi2
 Yibing Ding
- 1School of Economics, Jilin University, Changchun, China
- 2Department of Economics, Yobe State University, Damaturu, Nigeria
This study investigates the spatial effects of armed conflict on Sub-Saharan Africa’s (SSA) economic growth, focusing on Central Africa, East Africa, and West Africa. Utilizing Spatial Durblin Model (SDM), the analysis reveals significant spatial effects of armed conflict intensity, indicating that conflict in neighboring countries influences conflict levels within a focal country. The study finds a weak or inconclusive relationship between GDP per capita (GDPpc) and conflict intensity, with East Africa showing a significant negative association, suggesting that higher economic prosperity in neighboring countries may mitigate conflict. Conversely, higher corruption levels in Central and West Africa are positively associated with increased conflict intensity, highlighting corruption’s destabilizing influence. Spatial lag SDM results suggest potential benefits of regional economic cooperation in reducing conflict intensity. Moreover, significant positive spatial autocorrelation underscores the interconnected nature of conflict within SSA, with West Africa exhibiting more pronounced spatial spillover effect. Findings from Spatial Autoregressive (SAR) models confirm the weak association between GDPpc and conflict intensity but emphasize the consistent positive association between corruption and conflict intensity. Additionally, the Spatial Error Model (SEM) reaffirms corruption’s detrimental impact on governance and stability. Additionally, the hypothesis of a significant difference in the effect of armed conflict across different SSA subregions is supported, with Central Africa experiencing the strongest negative impact on economic growth, followed by East and West Africa. The study highlights substantial regional heterogeneity in the economic consequences of armed conflict, emphasizing the need for regionally tailored policy interventions to address conflict-related economic disruptions in SSA.
1 Introduction
Over the past century, the world has witnessed a significant decline in armed conflict and a rise in economic prosperity. However, this progress has not been evenly distributed, with many regions, particularly in Sub-Saharan Africa (SSA), continuing to struggle with recurring conflicts and sluggish economic growth. This study focuses on three sub-regions within SSA to investigate the economic impact of armed conflict and its geographical spillover effects. The economic consequences of armed conflict in SSA have been profound, affecting various aspects of economic growth and development. Studies have shown that armed conflict is a significant obstacle to economic progress in the region, leading to declines in GDP growth, increased poverty rates, and reduced investment levels (Addy et al., 2021; Le et al., 2022; Dunne, 2012). According to the World Bank, countries experiencing conflict face an average reduction in GDP growth of 2.2 percentage points per year, compared to non-conflict-affected countries. Moreover, armed conflict exacerbates existing development challenges in SSA, including inadequate infrastructure, limited access to basic services, and high levels of inequality (Okunlola and Okafor, 2022; Fang et al., 2020). Conflict-affected countries often experience disruptions in agricultural production, trade, and investment, leading to food insecurity, job losses, and heightened vulnerability to economic shocks (Winne and Peersman, 2021). The World Bank estimates that armed conflict costs SSA approximately 30% in GDP growth (World Bank, 2024).
According to data from the Uppsala Conflict Data Program (UCDP), SSA has consistently accounted for a significant proportion of global armed conflicts over the past few decades. In 2020 alone, SSA was home to several active armed conflicts, including those in countries such as Nigeria, South Sudan, the Democratic Republic of the Congo (DRC), and Somalia (Figures 1–3). These conflicts vary in intensity and scope, ranging from large-scale civil wars to localized violence and insurgencies.1The Armed Conflict Location and Event Data (ACLED) provides further detail, indicating that from 1989 to 2022, Central Africa which is challenged by armed conflict, political instability and humanitarian crises endured 42,481 conflict-related deaths, East Africa marked by civil wars, ethnic tensions and territorial disputes saw 1,305,734 deaths, and West Africa which is challenged by insurgency, terrorism and inter-communal violence faced 142,156 deaths. The conflict in Nigeria, driven by the Boko Haram insurgency, has been particularly severe, with over half of West Africa’s conflict-related deaths occurring there. Similarly, Ethiopia’s ongoing Tigray conflict and the 1994 Rwandan genocide highlight the extreme human costs associated with such violence. This instability has exacerbated violence and lawlessness across border in regions like the Western Sahel and Lake Chad Basin, where fundamentalist groups have extended their reach. Furthermore, tensions between states have escalated in the Great Lakes Region, particularly evident is the ongoing conflict between Democratic Republic of Congo (DRC) and Rwanda, which has intensified violence in eastern DRC. Ethiopia has encountered significant challenges, including a fragile armistice between the administration and the TPLF, amid other conflict rooted in regional and ethnic identities. These examples stand as a poignant reminder of the multifaceted fronts of armed conflict and its spillover tendency in the region.
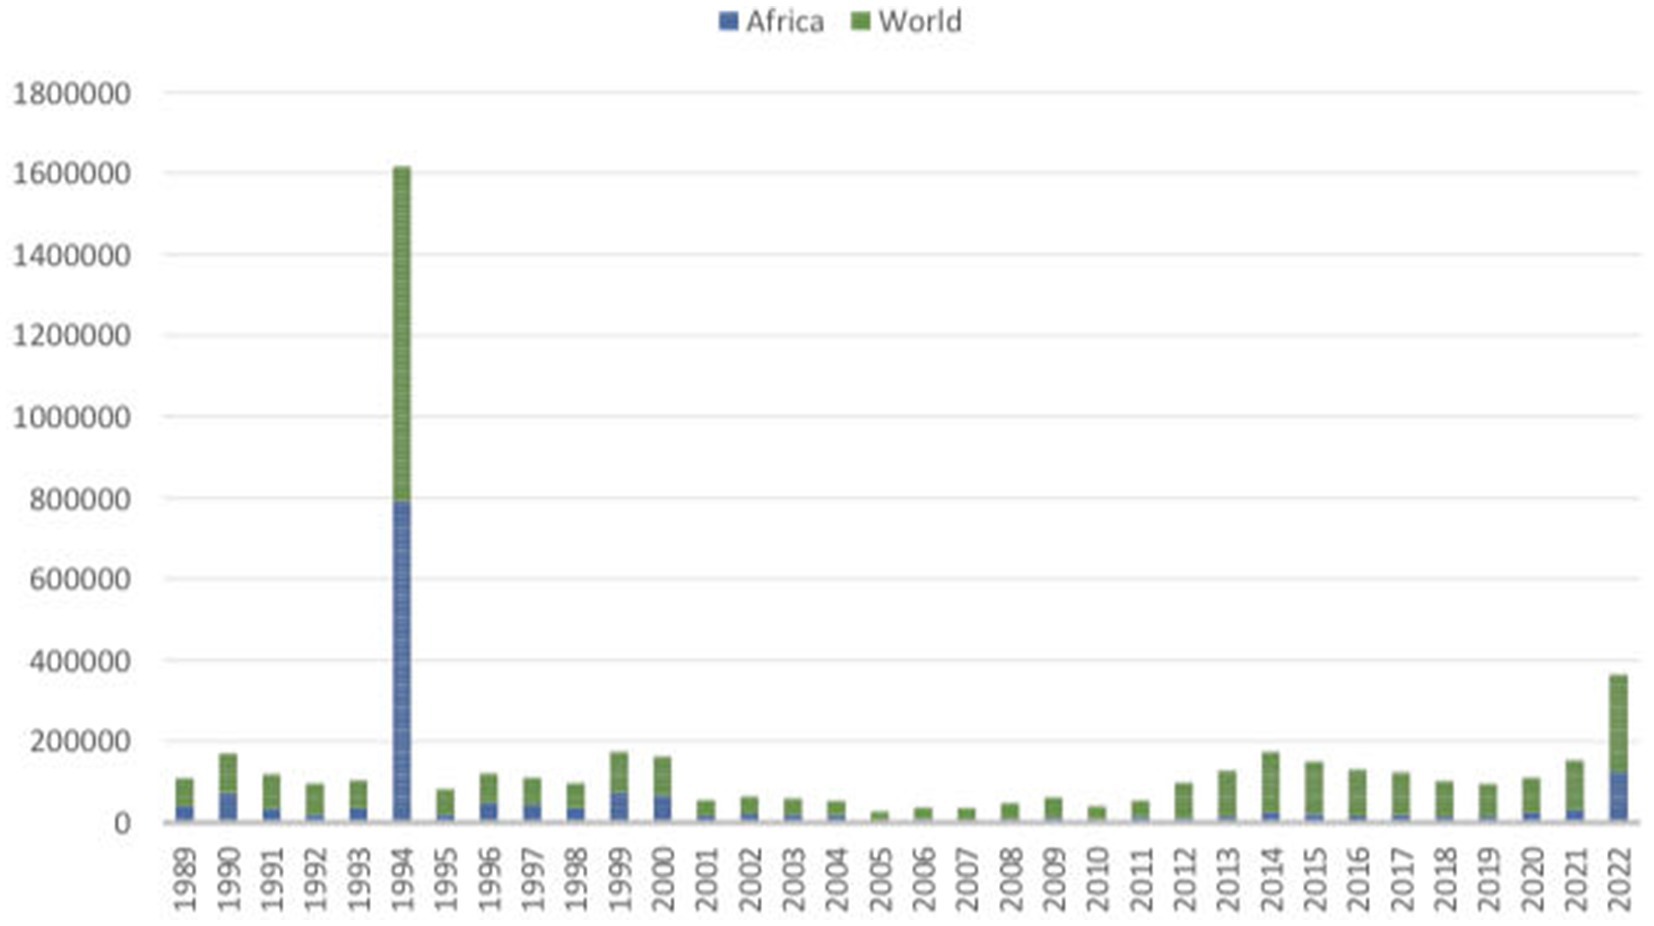
Figure 1. Total Conflict-Related Deaths. Source: UPPSLA Georeferenced Event Data (GED) 2023.
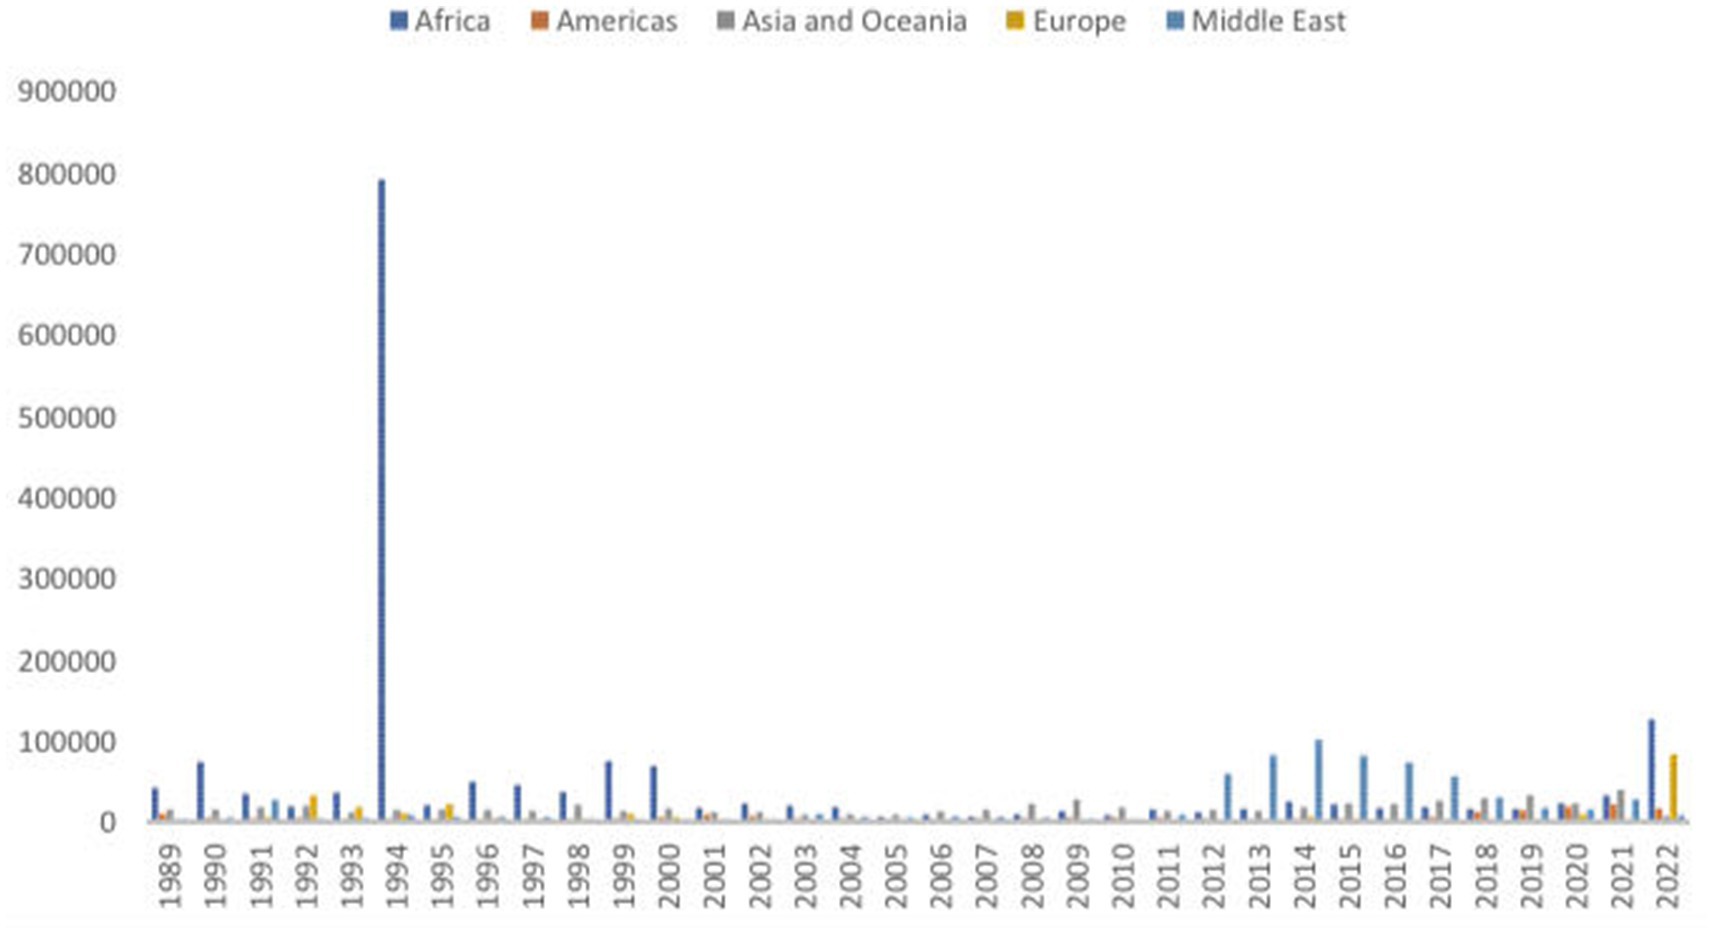
Figure 2. Total Conflict Related Death. Source: UPPSLA Georeferenced Event Data (GED) 2023.
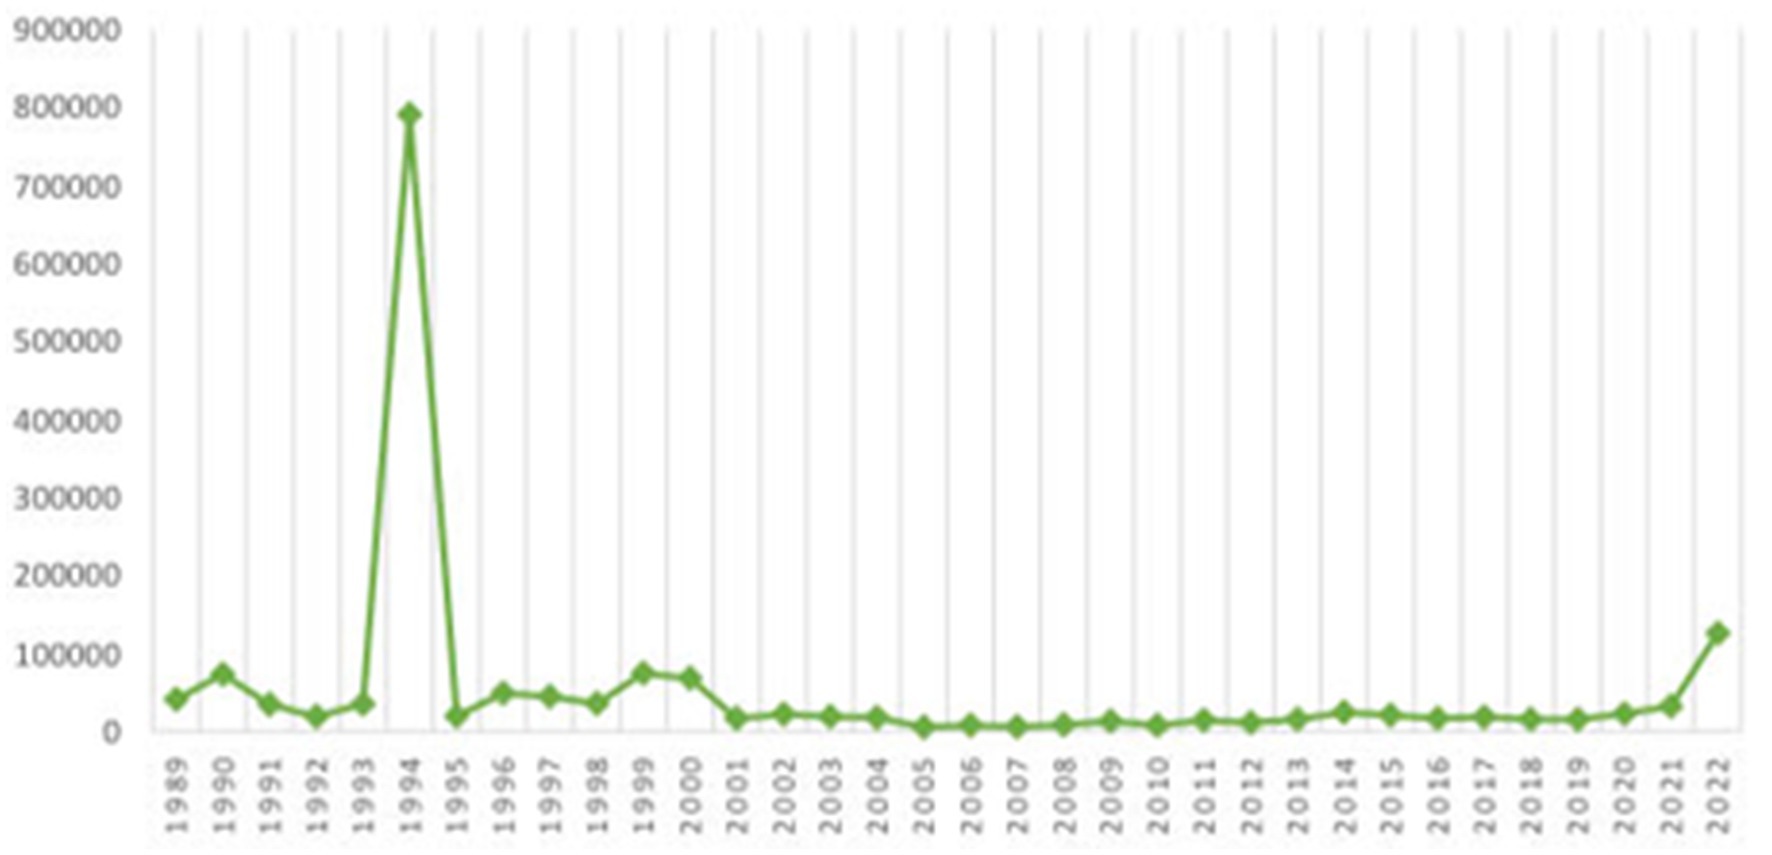
Figure 3. Estimated Number of Deaths in Conflicts in SSA. Source: Armed Conflict Location and Event Data ACLED (2023).
These examples prompt us to ask: are countries with certain characteristics better equipped to resist the spread of violence from neighboring territories into their own? The study argues that when we consider the interaction between spatial heterogeneity and dependence, the risk of conflict contagion from neighboring areas may decrease in regions with specific mitigating factors. A model of civil war contagion supports this conditional hypothesis, showing that these characteristics influence the likelihood of a country being affected by a civil conflict occurring in adjacent territories. This context leads us to two critical research questions: How does armed conflict impact economic growth differently across the various subregions of Sub-Saharan Africa? and What are the geographic spillover effects of armed conflict on neighboring subregions within Sub-Saharan Africa? These questions aim to explore the diverse effects of conflict across different regions and examine how certain regional factors may influence the transmission of conflict-related economic disruptions across borders. By investigating these aspects, we can better understand the complex dynamics of conflict in Sub-Saharan Africa and identify potential strategies for mitigating its adverse effects.
Recent studies have documented how violence in one region can spill over into neighboring areas, amplifying instability and socio-economic disruptions (Raga et al., 2023; Carmignani and Kler, 2016a,b). This phenomenon, where conflict in one area exacerbates tensions or sparks new conflict in adjacent regions, is a critical concern for SSA. Spatial econometrics underscores the significance of geographical proximity in shaping conflict dynamics, emphasizing spillover effects. These can manifest through refugee flows, cross-border movement of combatants, and ideological contagion, amplifying conflict across borders (Bertinelli et al., 2022; Rother et al., 2016; Fearon and Laitin, 2003). This study investigates this phenomenon using a spatial analysis framework. By examining the spatial dependence between armed conflict occurrences in SSA, we can gain a deeper understanding of how conflict transmission occurs across borders. Furthermore, we investigate the impact of these conflict spillovers on economic growth in the region. Existing literature highlights the detrimental effects of conflict on economic growth (Fang et al., 2020). This study builds upon this knowledge by exploring how the spatial nature of conflict transmission might exacerbate economic decline in SSA and how the impact of armed conflict on economic growth differs across the three regions.
This study is designed to achieve the following objectives. First the study assesses the Variation in Economic Impact. To achieve this, we evaluate how the economic impact of armed conflict differs across the sub-regions of SSA. By examining Central Africa, East Africa, and West Africa, we aim to identify regional disparities in the economic consequences of conflict. Second, we investigate Geographic Spillover Effects. To achieve this, we analyze the extent and significance of geographic spillover of armed conflict among SSA sub-regions. This involves studying how conflict in one region affects neighboring areas and contributes to broader regional instability. Third, the study utilizes Spatial Analysis Techniques. We apply spatial econometric methods to understand the patterns and mechanisms of conflict transmission. By employing these techniques, we seek to uncover how conflicts spread geographically and their subsequent impact on economic development. Finally, the study aims to contribute to Policy and Development Strategies in order to provide insights that can inform policy and development strategies aimed at mitigating the adverse effects of armed conflict. Our findings will contribute to efforts to enhance regional stability and promote sustainable development in SSA.
In addressing these objectives, this study will build upon existing research by integrating spatial analysis with economic impact assessments. The subsequent sections will detail our literature review, methodology, findings, and their implications for policy and future research offering a comprehensive analysis of conflict spillover and its economic implications. Through our investigation, we hope to advance understanding in conflict studies, shed light on the complex dynamics of conflict spillover and contribute to efforts aimed at promoting peace, stability, and sustainable development in SSA.
2 Literature review
2.1 The impact of armed conflict on economic growth
There are three main streams of empirical literature on the economic implications of armed conflict namely; the comparative analysis, the accounting framework of measuring the cost of conflict and the regression modeling structure. In the first, studies make a comparative analysis between warring states and non-conflict state; with the non-conflict state as an index (Stewart et al., 2001; Abadie and Gardeazabal, 2003). The next stream uses accounting framework to estimate the implication of war by taking reduced taxes and military expenditure into consideration (Collier et al., 2003; Fitzgerald et al., 2001) and the last stream which can be linked to much of the various conclusions in previous studies is grounded on a regression modeling approach; (Gyimah-Brempong and Corley, 2005; Cerra and Sexena, 2008; Ganegodage and Rambaldi, 2013).
Theoretical literature on the effects of armed conflict on growth also offers two different versions; the first highlight a positive effect while the other signifies a negative effect. By employing the Keynesian economic theory for instance, (Benoit, 1978) suggest that spending on armed conflict and increasing wartime production can be used for expanding fiscal policy. Fiscal prudent military spending stimulate the economy and generates positive externalities by proliferating aggregate demand. Other studies employ the unified growth model (Murdoch and Sandler, 2002). Using experience from WWII (Tilly, 1975; Dunne et al., 2005; Blattman and Miguel, 2010) show that in the long-run wars can creates positive externalities like technological development through sophisticated military training and creates a skillful workforce that paves way for strong institutions and thus contribute to rapid development.
The opposing view maintains that rather than stimulating economic growth, wars actually crowds out investment in other sectors of the economy (Landau, 1996). Ongoing conflicts also hamper investment in human development which many developing nations urgently need for improved economic performance (Ganegodage and Rambaldi, 2013; Sefa and Siew, 2018).
Using theoretical and empirical analysis and using armed conflict data from SSA for three decades, (Collier and Hoeffler, 2002) found that apart from political and cultural diversity; high unemployment, low income, primary commodity dependence and lagged economic growth are determining factors responsible for the initiation and duration of wars. Similar to Collier and Hoeffler (2002) and Murdoch and Sandler (2002) investigates the impact of war on income growth by examining intensity and incidence of war. They conclude that despite the incidence of war having a negative impact on growth and levels of per capita income, the consequences are short-term. By investigating the impact of civil war on income growth, (Artadi and Sala-i-Martin, 2003) concludes that conflict reduces the average growth rate of GDP in SSA by 0.5% in the periods following independence.
Armed conflict in SSA has had enduring ramifications on economic growth, presenting a formidable challenge to the region’s development trajectory. Recent empirical evidence, exemplified by Fang et al. (2020), underscores the significant economic toll inflicted by conflicts in SSA. The paper reveals that countries embroiled in intense conflicts experience a staggering average annual growth reduction of approximately 2.5 percentage points. Moreover, the detrimental effects of armed conflicts on economic growth accumulate over time, leading to a decline in per capita GDP. This decline is compounded by strains on public finances, as conflicts strain government budgets, diminish revenue streams, and divert resources away from essential developmental endeavors. The existing literature highlights the diverse impacts of armed conflict across different regions, even within the same geographical area. For instance, the study conducted by Newiak et al. (2013) revealed that armed conflict exerts varying degrees of influence on per capita GDP growth in SSA countries, with annual reductions ranging from 1.3 to 3 percentage points on average. Importantly, the magnitude of this impact was found to be contingent upon the level of institutional quality within each country. However, despite this valuable insight into the overall impact of conflict on economic progress in SSA, there remains a notable research gap regarding the effects of conflict within specific subregions of SSA. While previous studies have shed light on the broad implications of conflict, they often overlook the heterogeneity that exists within SSA, both in terms of geographical regions and institutional contexts. Therefore, there is a need for further investigation into how armed conflict uniquely affects economic dynamics within the distinct subregions of SSA, namely Central Africa, East Africa, and West Africa. Based on the existing literature and the identified research gap, the following hypothesis is formulated as follows.
H1: The impact of armed conflict on economic growth varies significantly across the subregions of SSA.
2.2 Geographical spillover of armed conflict in SSA regions
Turning to the geographical spillover of armed conflict, this phenomenon emerges as a significant concern in SSA. Research indicates that the spillover effect of conflicts is particularly pronounced and enduring in SSA compared to other regions (Carmignani and Kler, 2016a,b). The world has witnessed various instances of spatial dynamics of conflict spillover. Several studies highlight the phenomenon of conflict spilling over from one country to another in SSA. Examples like the Rwandan Civil War triggering the First Congo War and the Sierra Leone War involving cross-border rebel support illustrate this interconnectedness (Opongo, 2022). However, a key research gap exists in quantifying the regional differences in spillover strength. While local (Fiandrino et al., 2023) and global instances exist (Ward and Gleditsch, 2002), the literature suggests SSA might be particularly vulnerable due to factors like resource-rich mountainous regions prone to territorial disputes (Braithwaite, 2005) and strong transnational ethnic linkages created by colonial borders (Carmignani and Chowdhury, 2012). Carmignani and Kler (2016a,b) examined the geographical spillover of armed conflict in SSA. They found that the conflict spillover effect is stronger for civil wars than for interstate wars.
Recent research has highlighted the interconnectedness of armed conflicts across SSA regions. For example, a study by Oestman (2021) found evidence of conflict contagion, where conflicts in one country can escalate and spread to neighboring countries due to shared borders, ethnic ties, or refugee movements. The study emphasizes the importance of considering spatial proximity and cross-border dynamics in conflict analysis and resolution. Furthermore, the prevalence of transnational armed groups and illicit trafficking networks exacerbates the spatial spread of conflict in SSA. Research by Bearzotti et al. (2015) illustrates how armed groups, such as Boko Haram and al-Shabaab, operate across multiple countries, exploiting porous borders and weak governance structures to sustain their activities. These transnational dynamics contribute to the diffusion of conflict and pose challenges to regional stability and security. Specifically, Dunne and Tian (2019) suggest that neighboring countries experiencing armed conflict significantly elevate the probability of civil war onset in adjacent regions by at least 1%. This heightened risk underscores the interconnected nature of conflicts in SSA, where violence in one area can precipitate and exacerbate tensions in neighboring territories. This geographical clustering of conflicts creates a ripple effect, amplifying the risk of violence across SSA regions. Similarly, scholarly investigations by Tian (2020), Boly and Kéré (2022), and Welander (2022) have underscored the significance of spatial dependence in understanding conflict dynamics. These studies argue that the occurrence and intensity of conflict in a particular region are closely linked to the level of conflict in neighboring areas. This spatial interdependence suggests that armed conflicts in SSA do not occur in isolation but rather exhibit patterns of diffusion and contagion, with violence spilling over from one locale to another.
The mechanisms through which conflict spreads across borders in SSA are multifaceted and varied. Refugee flows, as highlighted by Cederman and Pengl (2019), play a significant role in propagating conflict, as displaced populations fleeing violence often seek refuge in neighboring countries, thereby carrying the seeds of instability with them. Similarly, the cross-border movement of combatants, as identified by Walter (2009), can facilitate the spread of conflict, as armed groups exploit porous borders to conduct military operations and seek sanctuary in neighboring territories. For instance, as witnessed in the case of Boko Haram in Nigeria moving freely across the Lake Chad axis and other porous borders, terrorizing Nigeria, Niger, Chad, and Cameroon (Tar and Ahmed, 2022.). Additionally, ideological contagion, as theorized by Fearon and Laitin (2003), can contribute to the diffusion of conflict, with radical ideologies and grievances crossing national boundaries and inciting violence in adjacent regions.
Existing research offers valuable insights but leaves crucial gaps, particularly in quantifying regional differences in spillover strength and disentangling the relative influence of internal versus external factors. Addressing these gaps through empirical studies and considering the dynamic interplay of spatial and temporal dimensions will be key to advancing our understanding of conflict in SSA. Hence, it becomes imperative to evaluate the sensitivity of findings concerning changes in spatial dimension measurement. Therefore, we hypothesize:
H1: There is a significant geographic spillover of armed conflict across different subregions within SSA.
There are still significant gaps in the vast body of research on armed conflict and economic growth in SSA. One key empirical gap is the failure to segregate SSA into specific regions like Central Africa, East Africa, and West Africa. Most studies have tended to analyze SSA as a single entity, overlooking the distinct dynamics and characteristics of each sub-region. By failing to disaggregate the data, researchers may miss important distinctions that could provide deeper insights into the causes, patterns, and consequences of conflicts within each region. Moreover, to the best of our knowledge, none of the current studies have employed spatial panel regression analysis to measure the geographical spillover effects of conflicts across SSA. Instead, conventional panel analysis has been predominantly used. Spatial regression analysis allows researchers to explore how conflicts in one area may affect neighboring regions through various channels such as refugee flows, arms trafficking, and economic disruptions. By incorporating spatial dependencies into the analysis, researchers can better understand the interconnected nature of conflicts and their implications for regional stability and security. Thus, a critical empirical gap in the existing literature is the absence of studies that both segregate SSA into its constituent regions and employ spatial regression analysis to examine the geographical spillover effects of conflicts. Addressing this gap could provide a more comprehensive understanding of the dynamics driving conflicts in SSA and inform more effective policy responses to promote peace and stability in the region.
3 Methodology
3.1 Data and variables
This study delves into the dynamics of armed conflict within SSA by segmenting the region into three distinct areas: Central Africa, East Africa, and West Africa. Central Africa comprises six countries,2 East Africa encompasses twelve,3 and West Africa includes thirteen.4 The data utilized in this analysis were meticulously sourced from reputable institutions renowned for their reliability and accuracy (refer to Table 1). The dataset spans a considerable time frame, covering 34 years from 1989 to 2022. This extensive temporal scope allows for a comprehensive examination of armed conflict trends and patterns across the SSA regions over a significant period. By incorporating data from multiple sources, this study aims to ensure the robustness and validity of its findings.
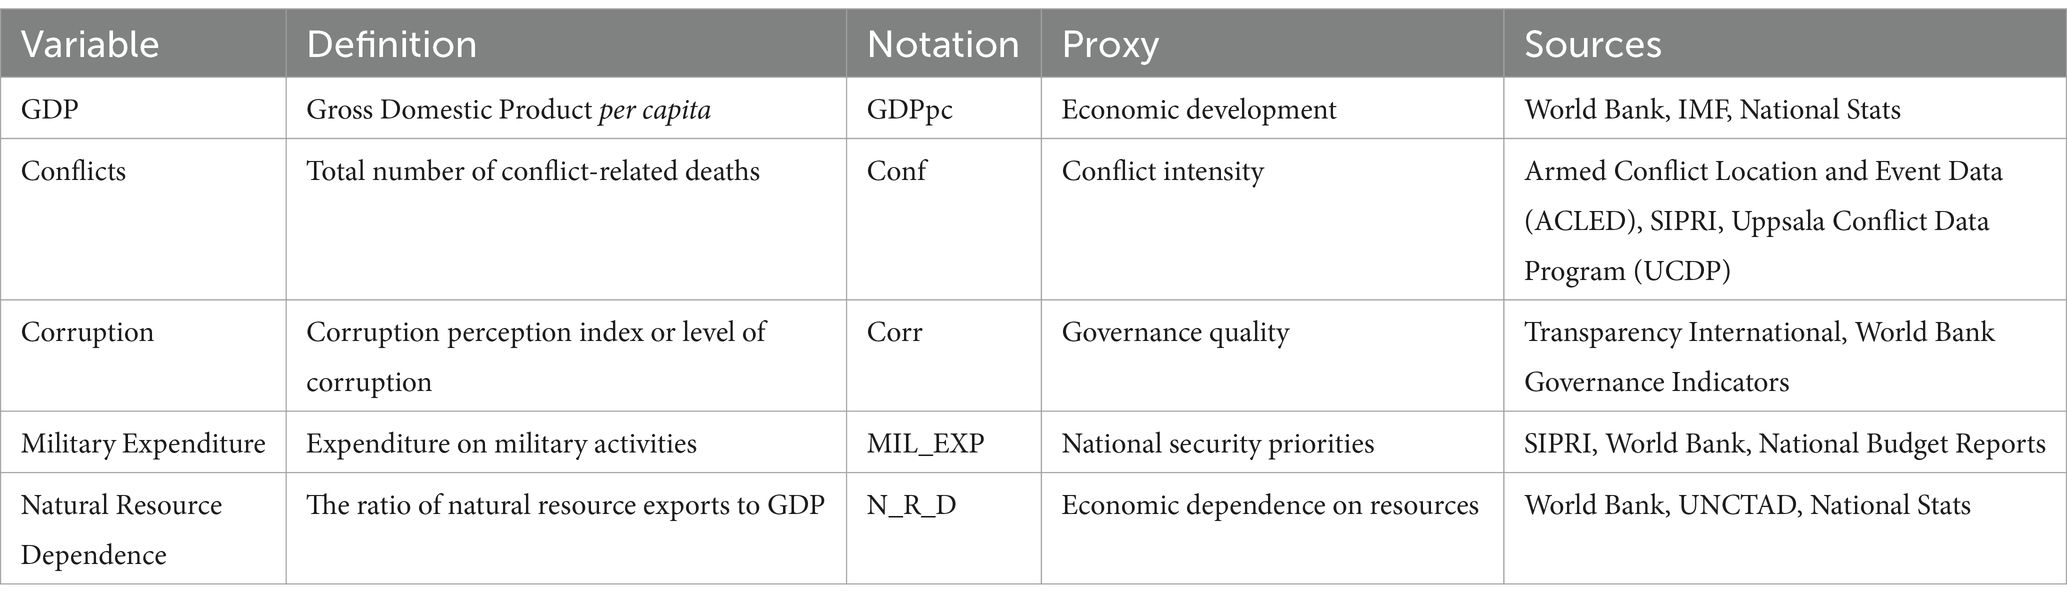
Table 1. Variables definition.
The selection of variables for analysis is crucial in unraveling the complex dynamics of armed conflict and economic growth. The key variables considered in this study are; the Gross Domestic Product per Capita which serves as a measure of economic development within each SSA region. Higher GDP per capita (GDPpc) values typically indicate greater economic prosperity and stability, which can influence the propensity for armed conflict (Ghazalian and Hammoud, 2021; Vestby et al., 2021; Humphreys, 2003). The total number of conflict-related deaths is utilized as a proxy for conflict intensity within each region. Using the total number of conflict-related deaths as a proxy for conflict intensity offers several advantages. Firstly, it provides a straightforward and easily quantifiable measure of the severity of armed conflict within a region. This simplicity facilitates comparability across different conflicts and regions, allowing for meaningful analysis of trends over time and across geographical areas. Additionally, using conflict-related deaths as a proxy for conflict intensity captures the human cost of armed conflict, highlighting the devastating impact on individuals, communities, and societies. Studies such as Elfversson and Höglund (2021) and Cederman and Pengl (2019) have utilized this measure to analyze trends in armed conflict, assess the urbanization of conflict, and explore the consequences of global conflict dynamics. Corruption perception or the level of corruption within a region is considered a crucial determinant of governance quality (Rontos et al., 2013). Higher levels of corruption can exacerbate social inequalities, exacerbate grievances, and potentially fuel armed conflict (Le Billon, 2003). Military expenditure represents the resources allocated by governments towards defense and security initiatives. High levels of military spending may indicate a focus on militarization and security concerns, which can either mitigate or escalate armed conflict risks (Khalid et al., 2020). The ratio of natural resource exports to GDP serves as a proxy for economic dependence on natural resources within each region. It is argued that regions heavily reliant on natural resource exports may experience heightened vulnerabilities to resource-related conflicts and economic instability (Cuvelier et al., 2014). Table 1 presents a clearer picture of these variables.
3.2 Empirical methodology
For this study, two variant econometric models were employed to address different aspects of armed conflict within each region of SSA. The spatial panel econometrics model was utilized to investigate the geographic spillover of armed conflict within each region. Spatial panel econometrics allows for the analysis of spatial dependencies and interactions among neighboring regions over time. By employing this model, the study aimed to understand how armed conflicts in one area may influence neighboring regions within the same SSA region. The analysis considered factors such as conflict intensity, geographical proximity, and shared borders to elucidate the spatial dynamics of armed conflict spread. In contrast, conventional panel analysis was employed to estimate the impact of armed conflict on economic growth within each SSA region. This model focused on assessing the relationship between armed conflict and economic indicators, particularly gross domestic product (GDP) growth. Through spatial panel econometrics, the geographic spread and spatial interactions of armed conflict were explored, while conventional panel analysis shed light on the economic consequences of such conflicts within each region. This dual approach allowed for a nuanced examination of the complex relationship in armed conflict and regional dynamics in SSA.
The empirical methodology employed in this study draws from previous research on spatial econometrics and conflict studies, particularly focusing on the spillover consequences of armed conflict in SSA. Scholars such as Gleditsch and Ward (2001), Salehyan and Gleditsch (2006), and Braithwaite (2010) have utilized spatial econometric techniques to investigate the spatial spread of conflicts across neighboring regions or countries. For instance, (Salehyan and Gleditsch, 2006) utilized a spatial lag model to examine the spatial diffusion of civil wars in Africa, considering the influence of neighboring countries on conflict onset. Similarly, Ward and Gleditsch (2002), Gleditsch (2007), and Braithwaite (2010) explored the spatial nature of conflicts, particularly focusing on spatial interactions among dependent variables.
3.3 Model specification
Based on previous studies, such as (Fang et al., 2020; Agu et al., 2023; Emeka et al., 2024) who have extensively investigated the impact of armed conflict on economic growth, this study adopts a slightly modified version of these models (Equation 1) to estimate the impact of armed conflict on economic growth.
where the subscripts denote the countries and time periods, respectively. is the logarithm of the variables which allows for a linear interpretation of percentage changes in the variables. represents the natural logarithm of GDP per capita. denotes the total number of conflict-related deaths, serving as a proxy for conflict intensity. signifies the natural logarithm of corruption levels within the region. represents military expenditure as a percentage of GDP. stands for natural resource dependence, measured as the ratio of natural resource exports to GDP. Ε captures unobserved factors that may influence GDPpc but are not explicitly included in the model.
Similarly, to investigate the geographic spillover armed conflict, a modified version (De Groot, 2010) is employed with a similar spatial specification of Karimi et al. (2022), Wang et al. (2021), and Ragoubi and El Harbi (2018) to estimate the geographic spillover of armed conflict in SSA. To ensure robustness and validity, the analysis utilizes three families of spatial econometric techniques; the Spatial Durbin Model (SDM), Spatial Autoregressive model (SAR), and Spatial Error Model (SEM). These models are chosen due to their ability to account for spatial interdependence among observations, acknowledging that neighboring regions may share similarities or experiences influencing the phenomenon under investigation.
The Spatial Durblin Model (SDM) extends the traditional linear regression model to incorporate spatial dependencies among observations, as shown in Equation 2 below.
where Conf is the armed conflict intensity variable for country i. ρ is the spatial autoregressive coefficient, representing impact of lagged armed conflict values in neighboring countries on the current country’s armed conflict. Wij is the spatial weight between countries i and j, indicating the spatial relationship. Xi is a vector of exogenous variables for country i that may influence armed conflict which include the GDPpc and corruption and ϵ_i is the error term.
The SAR model is employed to analyze spatial dependencies in data, as specified in Equation 3 below.
where ρ represents the spatial autocorrelation parameter and is the spatially lagged armed conflict term, representing the weighted average of armed conflict values in neighboring countries.
The SEM allows for spatial autocorrelation in the error term, capturing spatially correlated unobserved factors, as specified in Equation 4 below.
where ηi represents the spatially correlated error term.
Additionally, the study utilizes spatial weight matrices to characterize spatial relationships among observations in the dataset. Two types of spatial weight matrices based on contiguity and distance are considered, with row-standardization ensuring that weights sum up to one on each row. The study also employs Moran’s I statistic to test for spatial autocorrelation, determining whether similar values of the variable tend to cluster together geographically.
3.3.1 Spatial weight matrix
The spatial weighted matrix symbolized by, describes the spatial relationship between observations in the dataset, as indicated in Equation 5 below:
Equation 5 provides information about which observations are reflected as neighbors and how the values are related to each other. The elements indicates whether observations i and j are spatially close. In simpler terms, explains if similar values (high or low) of our variable tend to cluster together geographically. Moran’s I tests is used to determine whether data exhibit spatial dependence.
Here, is the standardization factor, and are the spatial weights. The test helps determine if spatial dependence is present in the data. By employing a variety of spatial econometric techniques and spatial weight matrices, the study aims to provide a comprehensive understanding of the spatial dynamics of armed conflict in SSA, contributing to the robustness and reliability of the findings. Figure 4 provides a diagrammatic flow of the methodological steps of the study.
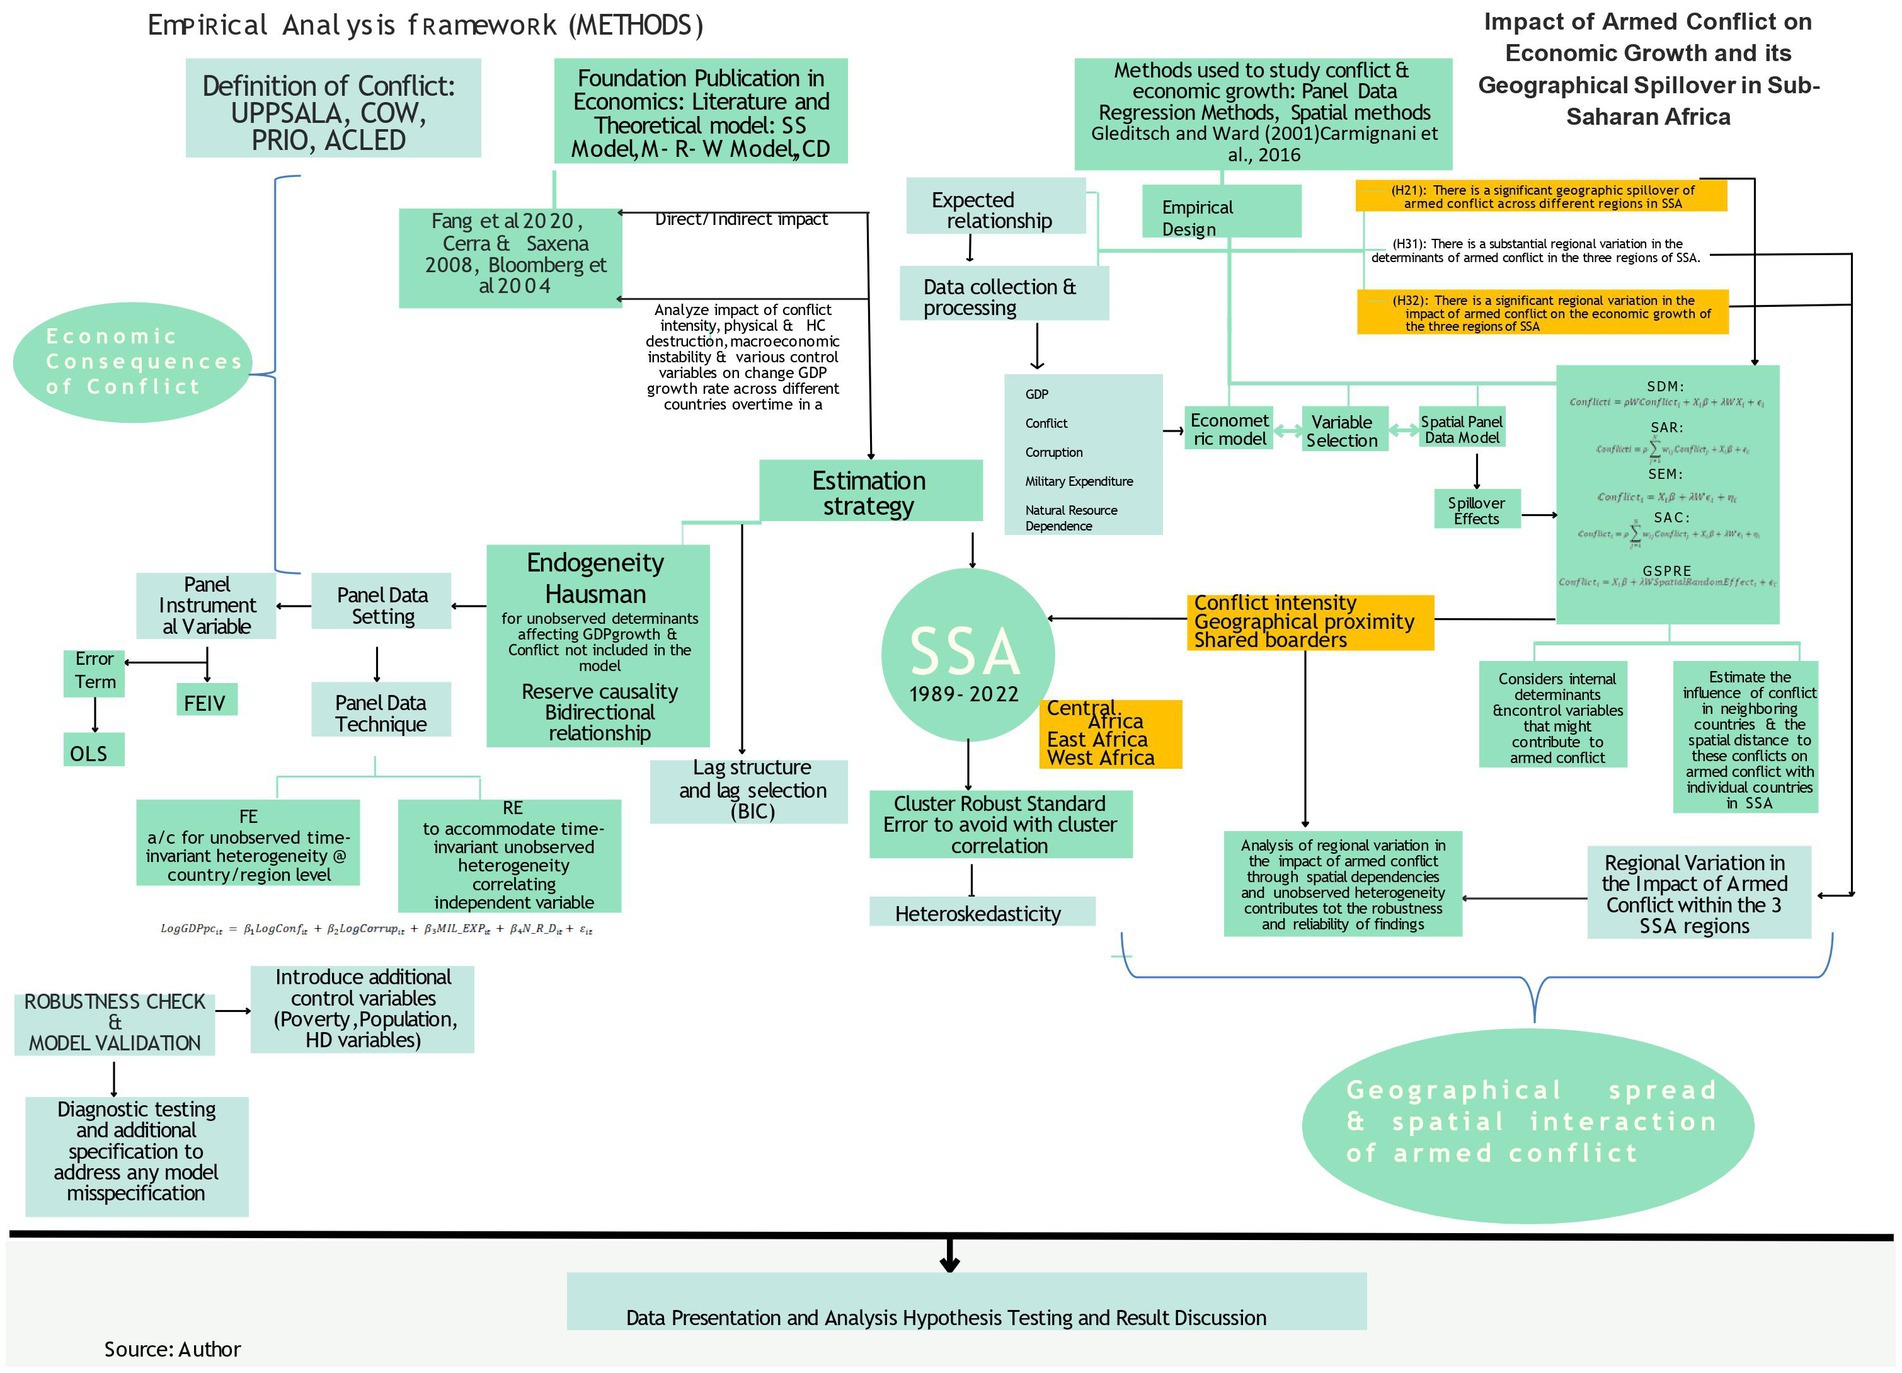
Figure 4. Methodological step flowchart.
4 Results
4.1 Spatial weight matrix result
Table 2 presents the spatial weight matrices for Central, East, and West Africa provide valuable insights into the spatial relationships among neighboring units within each region. In terms of dimensions, Central Africa’s matrix is 6×6, East Africa’s is 12×12, and West Africa’s is 13×13, reflecting the size of the region and the number of countries within each. The minimum value, which represents the lowest level of spatial proximity between neighboring units, is 0 for all three regions, indicating that some units may not share borders or vertices with others.
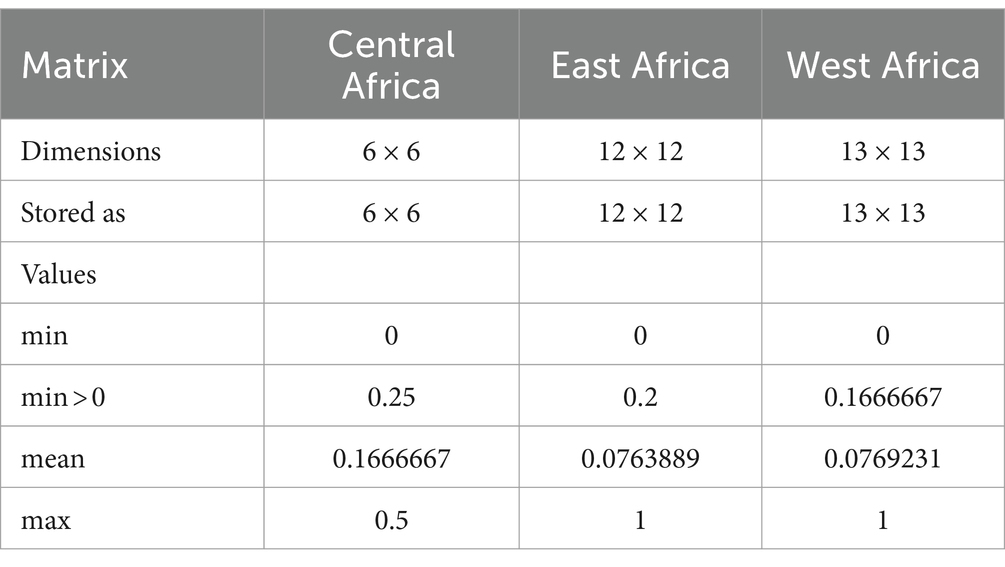
Table 2. Summary of spatial-weighting object W.
The minimum weight greater than zero is 0.25 for Central Africa, 0.2 for East Africa, and approximately 0.1667 for West Africa, indicating the minimum weight assigned to neighboring units with some degree of spatial proximity. The mean weight, reflecting the average weight across all neighboring units, is approximately 0.1667 for Central Africa, 0.0764 for East Africa, and 0.0769 for West Africa. The maximum weight, indicating the highest level of spatial dependence between any two neighboring units, is 0.5 for Central Africa and 1 for both East and West Africa. These values help us understand the strength of spatial relationships among units within each region. Higher weights suggest stronger spatial dependence and a greater likelihood of spatial spillover effects of armed conflict, while lower or zero weights indicate weaker spatial relationships between units.
4.2 Boundary links
Table 3 provides information on the number of links (or connections) between different regions in Africa, specifically Central, East, and West Africa. East Africa has the highest total number of links, indicating a higher level of connectivity or spatial relationships between countries in this region compared to Central and West Africa. West Africa follows closely behind East Africa in terms of the total number of links observed. Central Africa has the lowest total number of links, suggesting relatively fewer connections or spatial relationships between countries in this region compared to East and West Africa.
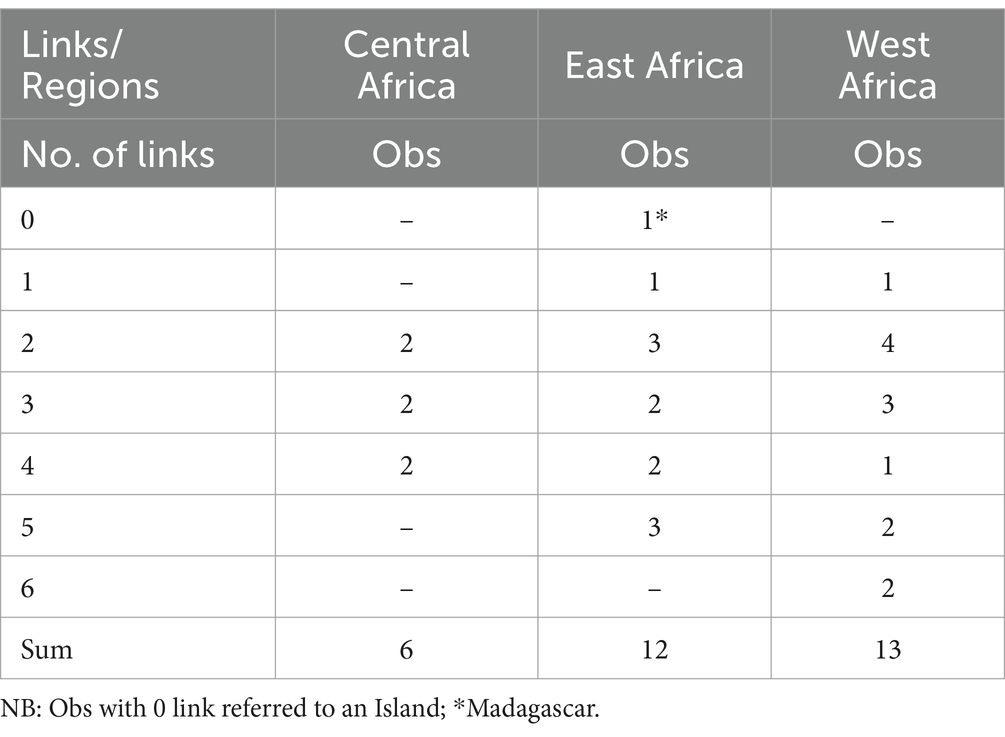
Table 3. Tabulation of links.
The table provides insights into the connectivity and spatial relationships between countries in Central, East, and West Africa, which can further inform our understanding of geographical spillover effects and the spread of armed conflict in these regions. Moving forward, we will interpret the estimated results obtained from the SDM, SAR model, and SEM to gain further insights into the geographical spillover of armed conflict in Central, East, and West Africa.
4.3 Empirical findings of the geographical spillover of armed conflict in SSA regions
4.3.1 Spatial Durbin model (SDM) result
Table 4 depicts the findings of the SDM applied to the three regions in SSA (Central, East, and West) to analyze the geographical spread of armed conflict within each region. Firstly, the estimated spatial autoregressive coefficient (ρ) which is the variable of interest provides crucial information about the impact of armed conflict in neighboring countries on the current country’s conflict intensity. Across the models and regions, the coefficient indicates a significant positive spatial effect, suggesting that armed conflict intensity in neighboring countries tends to influence conflict intensity within the focal country. Under the main effect (without spatial interaction), the coefficient for GDPpc is mostly negative and statistically insignificant across all models and regions. This suggests a weak or inconclusive relationship between higher GDPpc and reduced conflict intensity. Specifically, In Central Africa, GDPpc has a negative coefficient, indicating that higher GDPpc is associated with lower levels of conflict, although the coefficient is not statistically significant at conventional levels.
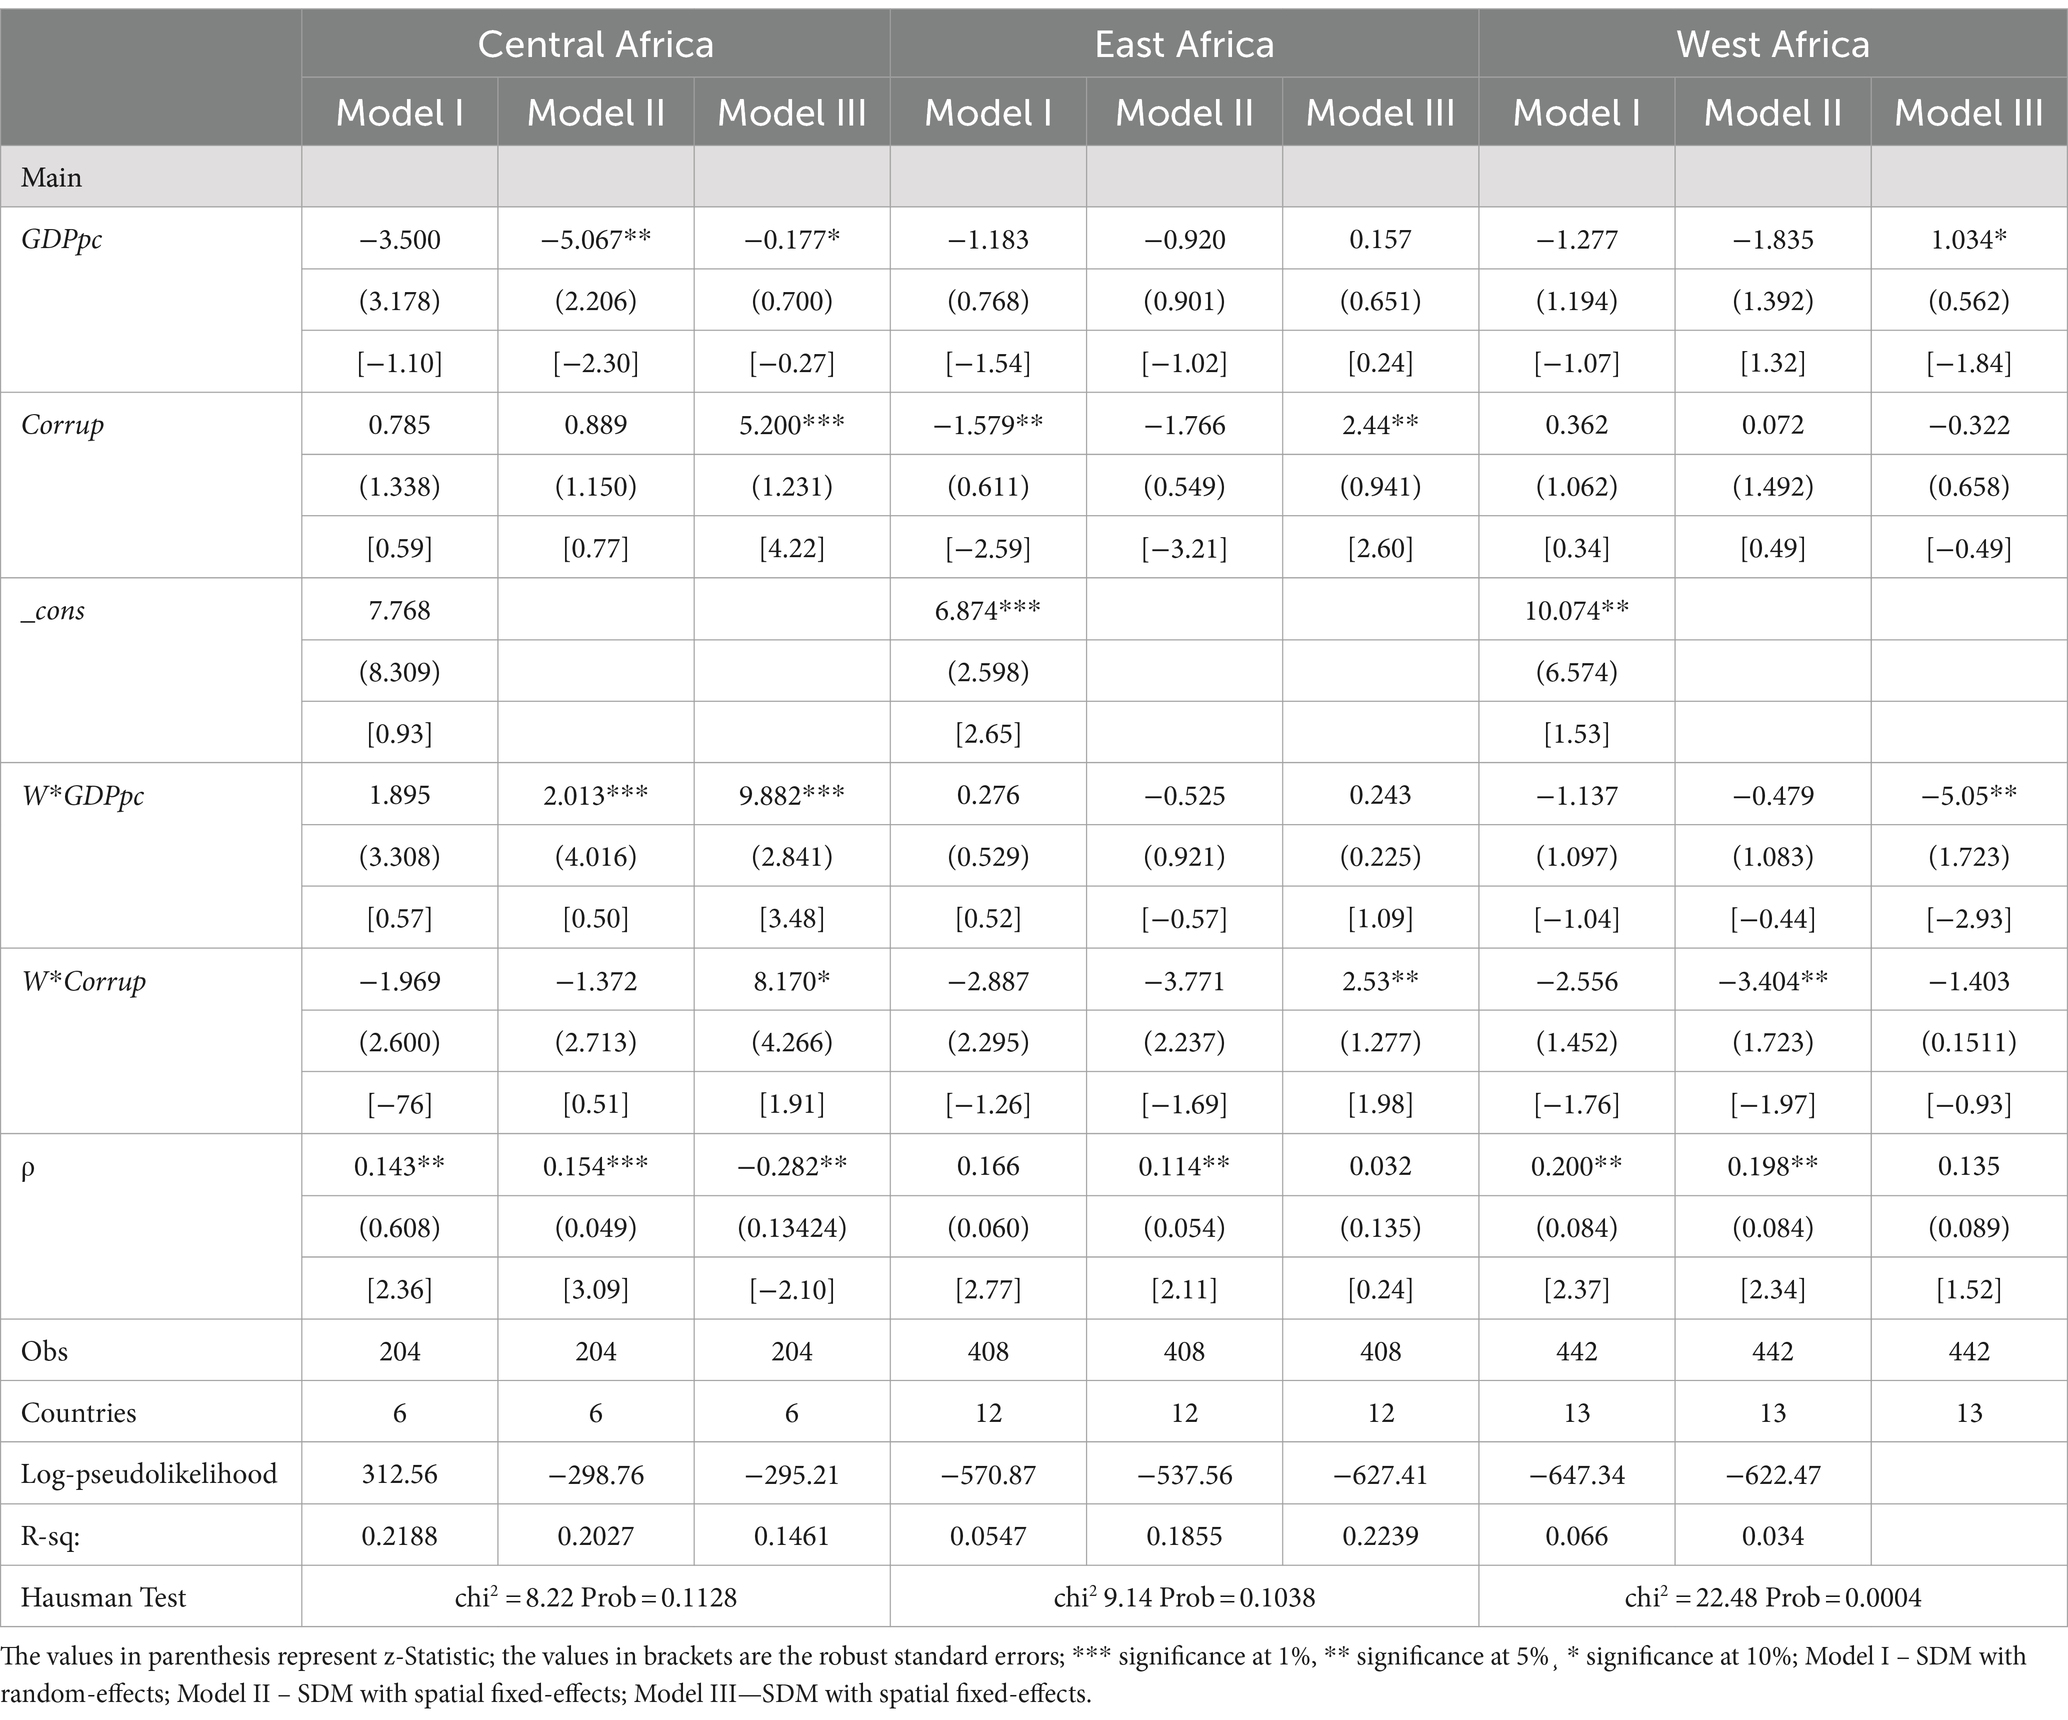
Table 4. Spatial Durbin Model (SDM).
In East Africa, the coefficient is negative and statistically significant at the 5% level, suggesting that higher GDPpc is associated with lower conflict levels. In West Africa, the coefficient is positive but not statistically significant.
The results for corruption are mixed. In Central Africa (Model I and II) and West Africa (Model III), the coefficient is positive and statistically significant, indicating that higher levels of corruption (lower control of corruption scores) are associated with increased conflict intensity. This aligns with the notion that corruption can create grievances, undermine trust in institutions, and create opportunities for conflict actors. However, the opposite is true in West Africa (Model I and II), suggesting a more complex relationship. Explicitly, in Central Africa, corruption has a positive coefficient, indicating that higher levels of corruption are associated with higher levels of conflict, although the coefficient is not statistically significant. In East Africa, corruption has a positive and statistically significant coefficient, suggesting that higher corruption levels are associated with higher conflict levels. In West Africa, corruption also has a positive and statistically significant coefficient.
However, considering the result of the spatial effects W*GDPpc (spatial lag of GDPpc) which captures the spillover effects of neighboring countries’ GDPpc on a country’s own conflict intensity. The coefficient is positive and statistically significant for East Africa (all models) and West Africa (Model III). This implies that higher economic prosperity in neighboring countries can reduce conflict intensity in a focal country. This might be due to increased trade opportunities, regional cooperation, or a “demonstration effect” where economic success inspires peaceful development. W*Corrup captures the spillover effects of neighboring countries’ corruption levels on a country’s own conflict intensity. For Central Africa (all models) and West Africa (Model I and II), the coefficient is negative and statistically significant. This suggests that higher levels of corruption in neighboring countries exacerbate conflict intensity in the focal country. This might be due to the spread of corrupt practices, cross-border criminal networks, or instability spilling over from neighboring regions.
In conclusion, the spatial autocorrelation (ρ) parameter measures the overall spatial dependence of conflict intensity across regions. All models show a significant positive spatial autocorrelation (ρ), indicating that a country’s conflict intensity is statistically associated with conflict intensity in its neighboring countries. This reinforces the importance of considering spatial effects when analyzing conflict dynamics. The Hausman test in the study compares the Random Effects (Model I) with the Spatial Fixed Effects (Models II and III). A significant result (p-value <0.05) indicates that the spatial fixed effects model is preferable, suggesting that unobserved spatial heterogeneity is present in the data. This justifies using the spatial models (Model II and III) for a more robust analysis.
4.3.2 Spatial-autoregressive model (SAR)
Table 5 displays the findings from the SAR applied to the three SSA regions. The coefficient for GDPpc is mostly negative and statistically insignificant across models and regions. Similar to the SDM results, there is a weak or inconclusive association between higher GDPpc and reduced conflict intensity. Specifically, in Central Africa, the coefficient for GDPpc is negative, indicating that higher GDPpc is associated with lower levels of conflict, although the coefficient is not statistically significant. In East Africa, the coefficient is negative and statistically significant at the 5% level, suggesting that higher GDPpc is associated with lower conflict levels. In West Africa, the coefficient varies across models, with Model I and Model III showing negative coefficients, although not statistically significant, and Model II showing a positive coefficient. The results for corruption are more consistent compared to the SDM. The coefficient is mostly positive and significant, particularly in Central Africa (all models) and West Africa (Model I and II). This reinforces the notion that higher corruption is associated with increased conflict intensity. Additionally, the spatial autocorrelation (ρ) parameter which measures the overall spatial dependence of conflict intensity indicates that all models except West Africa (Model III) show a significant positive spatial autocorrelation (ρ). This indicates that a country’s conflict intensity is statistically related to the conflict intensity in its neighboring countries.
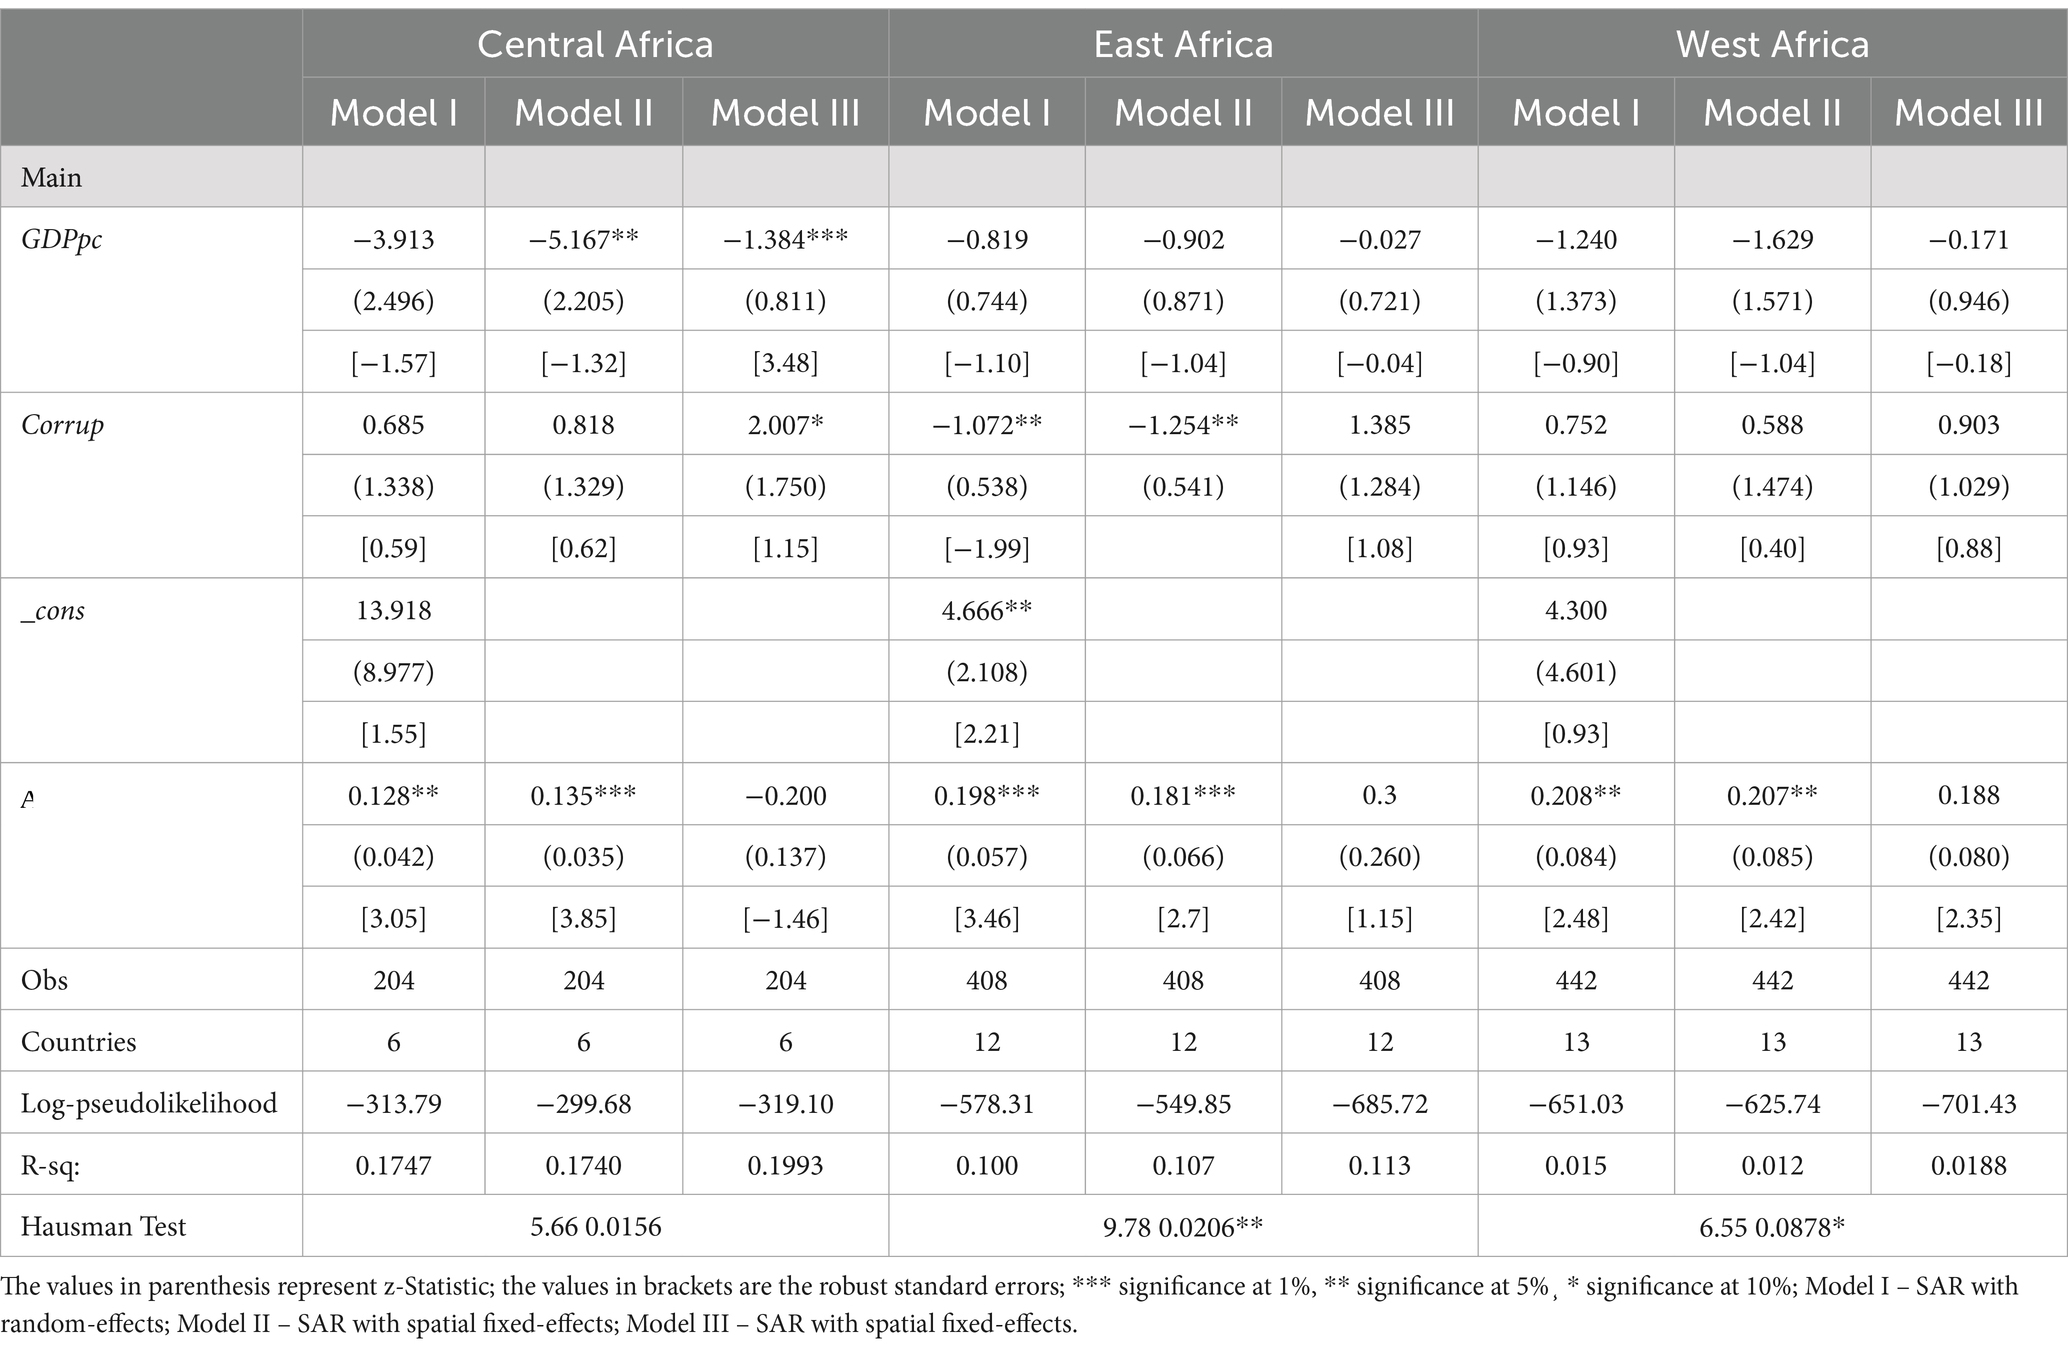
Table 5. Spatial-AutoRegressive Model (SAR).
The Hausman test compares Random Effects (Model I) with Spatial Fixed Effects (Models II and III). A significant result (p-value <0.05) is observed in some cases (East Africa Model II, West Africa Model III), indicating that the spatial fixed effects model is preferable. This suggests the presence of unobserved spatial heterogeneity in the data. One key difference between this model and SDM is that the SAR model does not consider the spatial lag of the independent variables (GDPpc and Corruption). It focuses on the spatial dependence of the dependent variable (conflict intensity) itself. This might explain why the spatial effects (ρ) are generally stronger in the SAR model compared to the SDM, especially for East Africa and Central Africa. The findings highlight the spatial dimension of conflict dynamics. Conflict intensity in a country is influenced by the level of conflict in its neighboring regions. Higher levels of corruption are associated with increased conflict intensity, particularly in Central and West Africa.
4.3.3 Spatial error model (SEM)
Table 6 depicts the findings of the SEM. Results for GDPpc and Corruption are similar to the previous models (SAR and SDM). There is a weak or inconclusive relationship between GDPpc and conflict, while corruption is positively associated with conflict intensity, particularly in Central and West Africa. Furthermore, all models, except West Africa (Model III), show a significant positive spatial error term (λ). This suggests that unobserved factors causing conflict in a country are related to similar factors in neighboring countries. This could be due to regional instability, spillover effects of conflict dynamics, or shared environmental or economic challenges. The Hausman test results are inconsistent, unlike the previous models. This suggests that both Random Effects (Model I) as well as Spatial Fixed Effects (Model II and III) may be valid for some regions.
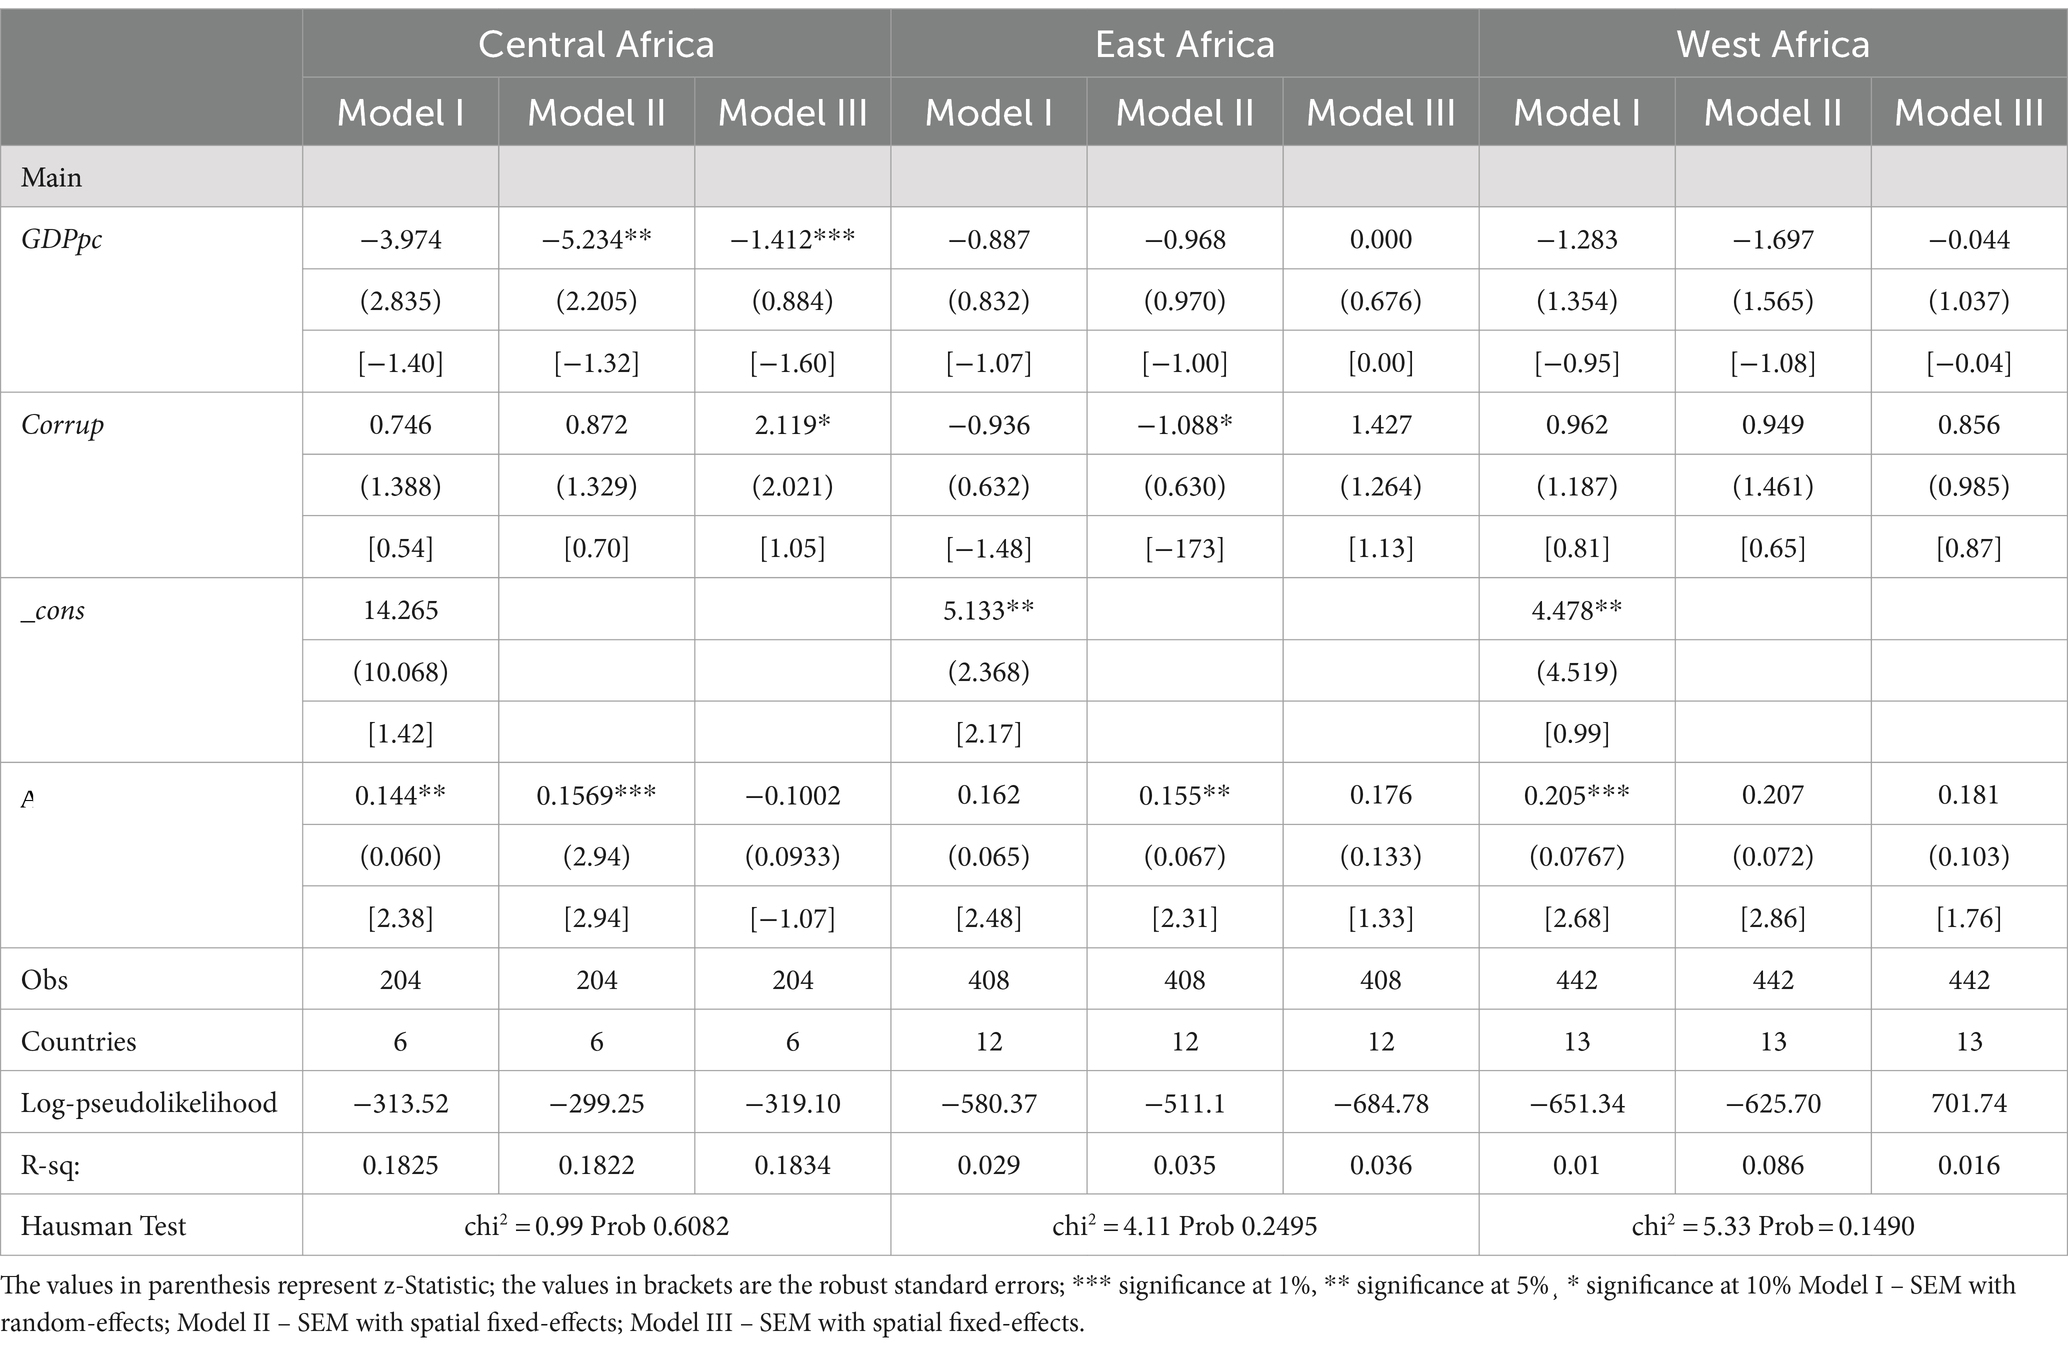
Table 6. Spatial Error Model (SEM).
The key differences from SAR and SDM is that, the SEM focuses on spatial dependence in the error terms, not the dependent variable (conflict intensity) itself. This implies that unobserved spatial factors are influencing conflict intensity across regions, independently of the included explanatory variables. The findings highlight the importance of considering unobserved spatial factors that contribute to conflict dynamics. These factors might be regional political instability, shared economic challenges, or historical grievances.
Figure 5 display four decades conflict intensity data fed into the SSA map. The provided data on conflicts related deaths in Sub-Saharan Africa (SSA) from 1989 to 2022 offers a comprehensive view of the geographical shift in conflict intensity. The figures in the tables and corresponding maps (Figures 5AD) reveal dynamic patterns over time, shedding light on the evolving nature of armed conflicts across different countries in the region. From Figure 5A, during this period (1989–1998), notable conflict intensity is observed in countries such as Angola, Burundi, Democratic Republic of Congo, Eritrea, Ethiopia, Liberia, Mozambique, Rwanda, Sierra Leone, Somalia, and South Sudan. These nations experienced substantial conflicts, with varying degrees of severity. Figure 5B indicates a shift in conflict intensity during this period. While some countries, such as the Democratic Republic of Congo, Eritrea, Ethiopia, Sierra Leone, Somalia, and South Sudan, continued to face significant conflicts, others like Burundi, Chad, Cote d’Ivoire, and Liberia experienced a decrease in conflicts. Additionally, new conflict dynamics emerged in countries like Kenya, Nigeria, Sudan, and Uganda. Figure 5C shows further changes in conflict intensity. Countries like Burundi, Central African Republic, Chad, Democratic Republic of Congo, Ethiopia, Mali, Nigeria, Somalia, South Sudan, Sudan, and Uganda continued to grapple with conflicts. Notably, some countries experienced a decrease in conflicts, including Angola, Cote d’Ivoire, Liberia, Mozambique, and Sierra Leone.
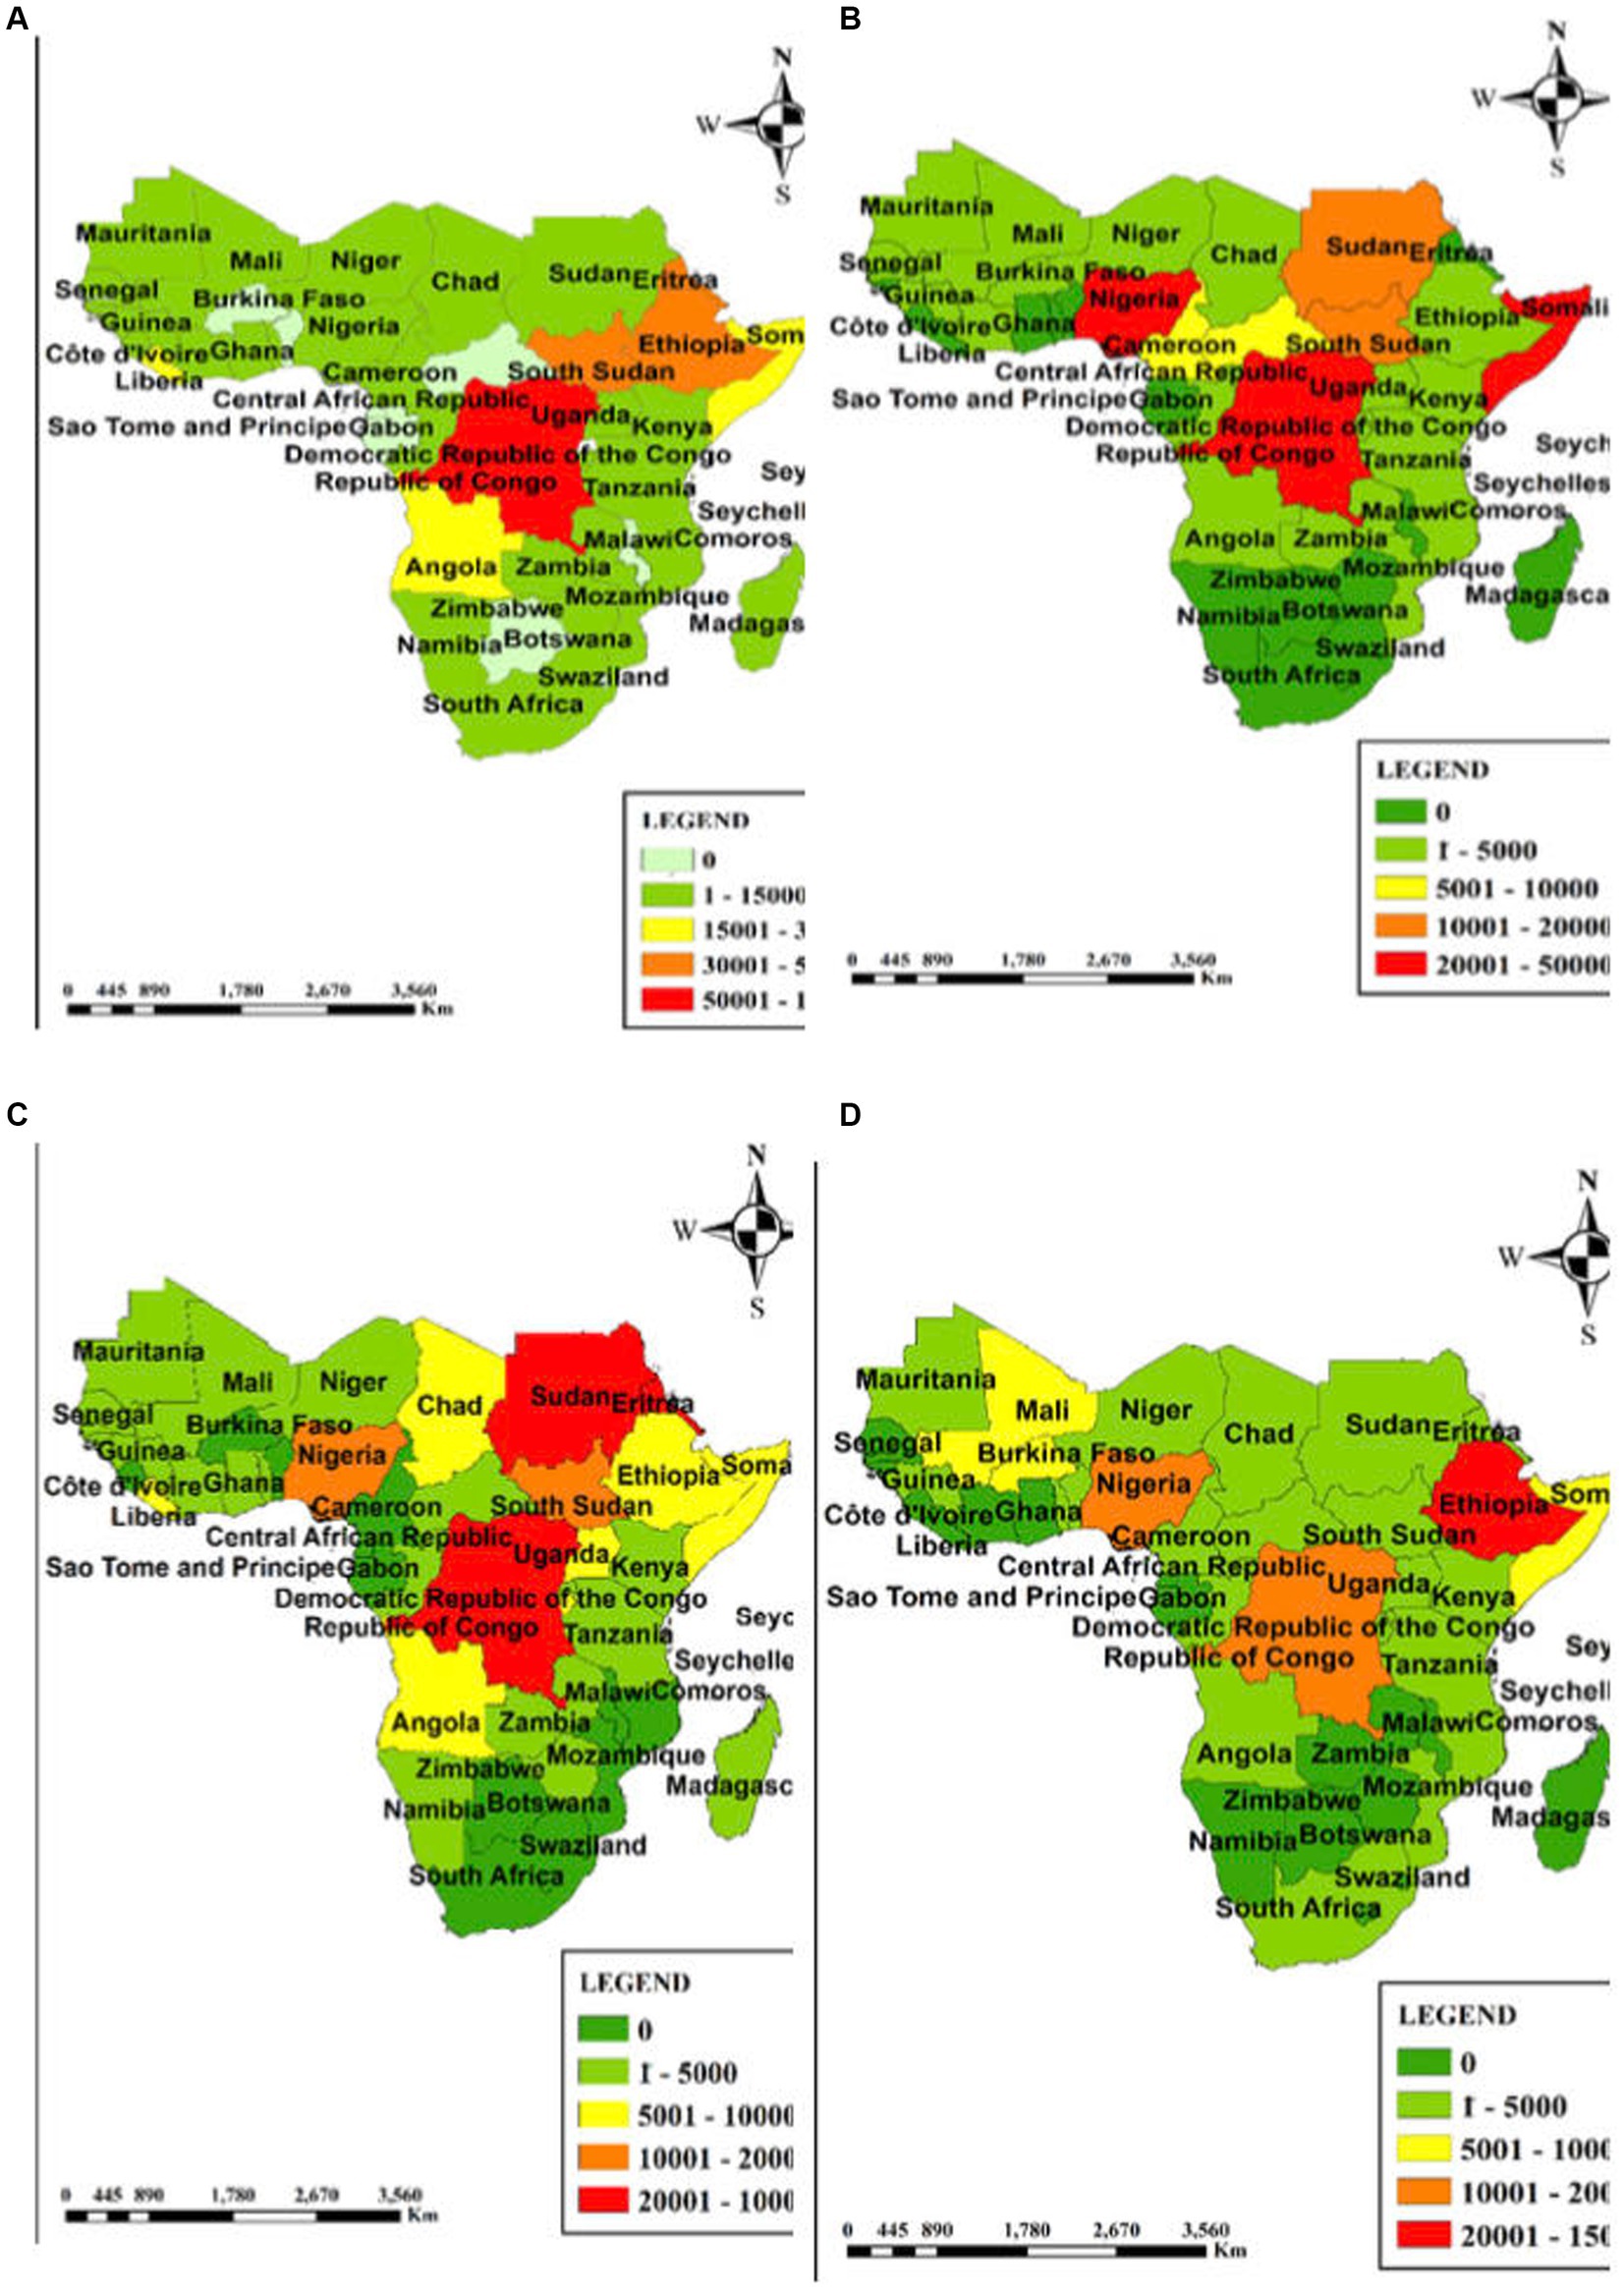
Figure 5. Conflict Intensity 1989–1998. Conflict Intensity 1999–2008. Conflict Intensity 2009–2018. Conflict Intensity 2019–2022.
4.3.4 Model selection
After conducting spatial panel analysis using SDM, SAR model, and SEM, a model selection test based on Belotti et al. (2017) was performed to determine the most appropriate model for the analysis. The test results revealed that the SDM is the most suitable choice. This decision was based on several factors such as the spatial autocorrelation test. The test results did not strongly reject the null hypothesis, indicating the presence of spatial autocorrelation. This suggests that there is a spatial dependency between observations, supporting the use of a spatial model. Similarly, the joint significance of the spatial lag of GDPpc and corruption in the SAR model was statistically significant. This indicates that neighboring countries’ economic variables have a significant influence on the focal country’s economic variables, further supporting the choice of the SDM. Finally, the joint significance of the spatial lag of GDPpc and corruption in the SEM was statistically significant. This reinforces the conclusion drawn from the SAR test and provides additional evidence in favor of the SDM. Based on these tests and the diagnostic criteria outlined by Belotti et al. (2017), the SDM emerges as the most appropriate model for the spatial panel analysis. It effectively accounts for spatial autocorrelation and captures the spatial dependencies present in the data, making it a robust choice for comprehending the interconnectedness of armed conflict, economic variables, and spatial dynamics in SSA.
4.4 Empirical findings of the impact of armed conflict on economic growth
Table 7 depicts the results estimating the effect of armed conflict on economic growth across three African regions (Central Africa, East Africa, and West Africa) using Ordinary Least Squares (OLS), Fixed Effects (FE), and Random Effects (RE) models. The coefficient for conflicts is inverse as well as statistically significant in all models (except West Africa - RE). This suggests that a surge frequency or intensity of conflict is related to a decrease in economic growth, as expected. This implies that armed conflict has a detrimental effect on economic growth. The magnitude of this negative effect varies across regions. Central Africa experiences the strongest negative impact, followed by East Africa and West Africa. This suggests that the economic disruption caused by armed conflict is more severe in Central Africa. Similar to the previous spatial models, the results for corruption are mixed across regions. In Central Africa, the coefficient is negative as well as insignificant in the OLS and FE models, signifying no clear link between corruption and growth. However, the RE model indicates positive as well as insignificant outcome. For East Africa, corruption positively as well as significantly related to growth in our OLS model but becomes negative and significant in the FE and RE models. This inconsistency might be due to unobserved factors captured by fixed and random effects. For West Africa, corruption positively as well as significantly with growth in the OLS model, however it becomes negative and significant in the FE model. This suggests that controlling for unobserved country-specific effects reveals a negative impact of corruption on growth.
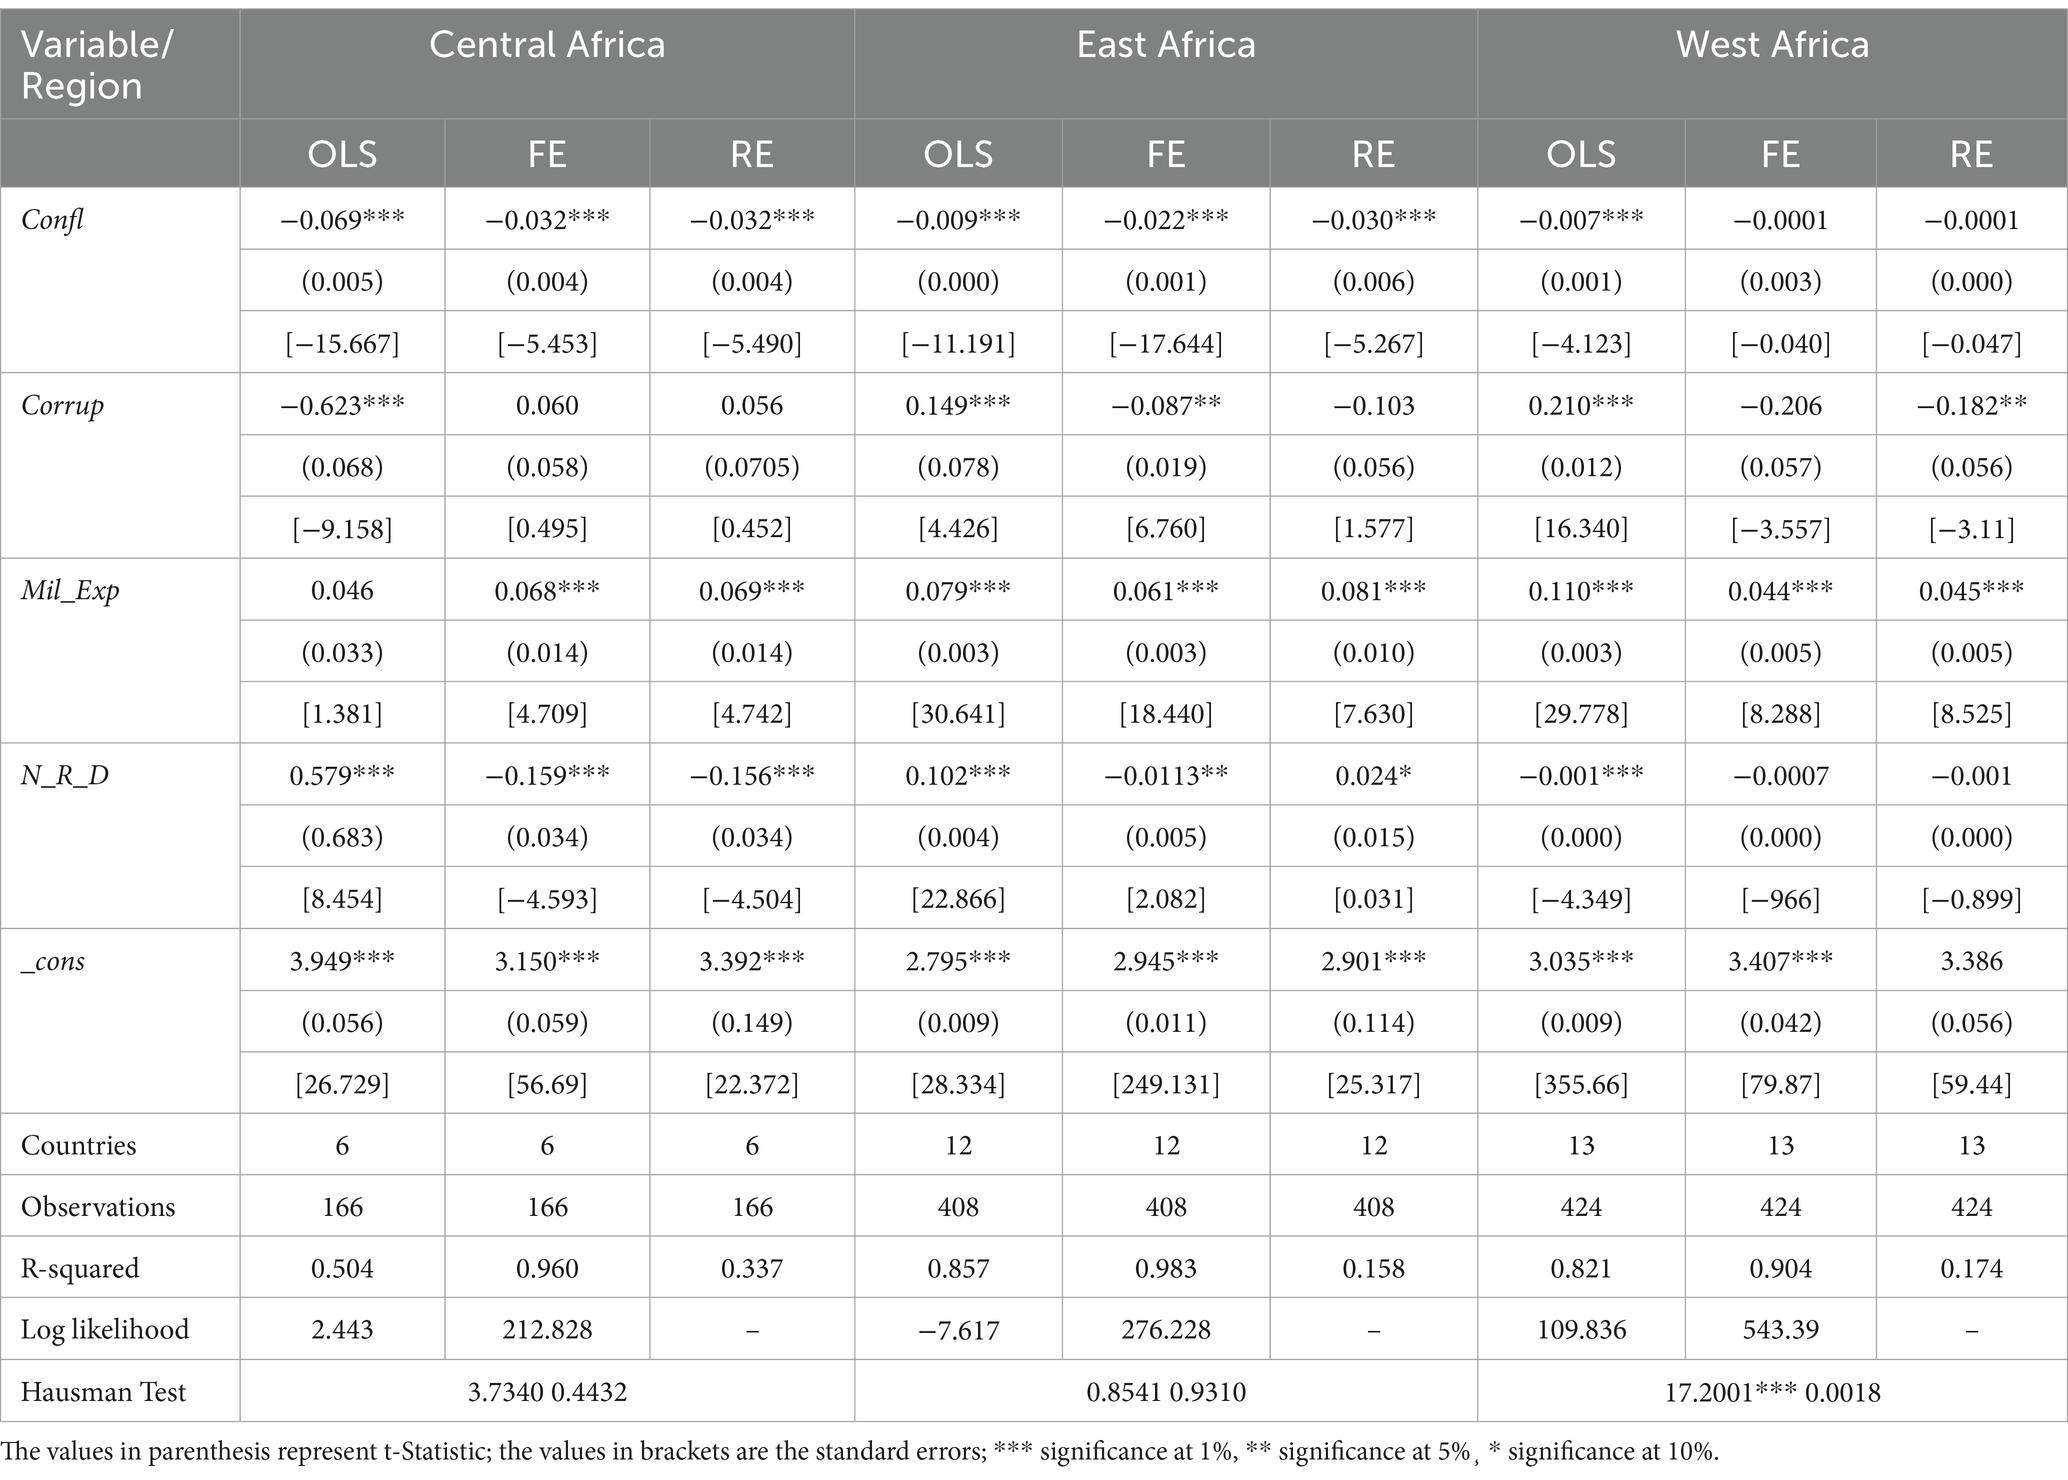
Table 7. Impact of armed conflict on economic growth across SSA’s sub-regions.
The coefficient for military expenditure is positive and significant across most models and regions. This suggests that increased military spending might boost economic growth, possibly due to increased government spending or technological advancements. The impact of natural resource dependence is mixed across regions. In Central Africa, this is a positively and significantly related to growth in all models. This suggests that resource wealth contributes to economic growth in this region. In East Africa, the coefficient is negative and significant across all models. This paradoxical effect might be due to the “resource curse,” where reliance on resource extraction hinders economic diversification and fosters corruption. In West Africa, the results are inconclusive, with a negative and significant coefficient in the OLS model and insignificant effects in the FE and RE models. The Hausman test indicates that fixed effects are preferable for East Africa due to a significant result, suggesting unobserved country-specific effects are important. For the other regions, the test is inconclusive. The results provide evidence that armed conflict has a negative impact on economic growth in African regions. The relationship between corruption, military expenditure, and natural resource dependence with economic growth seems more complex and might vary across regions. The fixed effects models appear to proffer better fit for data by accounting for unobserved regional effects.
In summary the study examines the impact of armed conflict on economic growth in Central, East, and West Africa using spatial econometric models along with traditional models. The results show that armed conflict significantly hampers economic growth, particularly in Central Africa, with conflicts in neighboring countries also influencing a country’s conflict intensity, highlighting the importance of considering spatial dependencies. While GDPpc generally shows a weak or inconclusive relationship with conflict, corruption levels are mixed, sometimes correlating with increased conflict intensity and reduced growth. Military expenditure is often linked to positive economic outcomes, and natural resource dependence has region-specific effects, boosting growth in Central Africa but hindering it in East Africa. The Spatial Durbin Model is identified as the most suitable for analyzing these spatial dynamics, effectively capturing the interconnectedness of conflict, economic factors, and regional spillovers.
4.5 Discussions
The analysis conducted in Tables 4–6 delves into the relationship between armed conflict intensity, economic variables, and spatial dependencies across Central Africa, East Africa, and West Africa. These findings shed light on the dynamics of conflict and its spatial spread within SSA. The SDM results reveal significant spatial effects of armed conflict intensity, indicating that conflict in neighboring countries exerts a substantial influence on conflict levels within a focal country. This aligns with prior research highlighting the interconnectedness of conflict dynamics across borders (Mansury et al., 2023; Alfar, 2022; Raleigh et al., 2010; Buhaug and Gleditsch, 2008; Fearon and Laitin, 2003). Interestingly, while the relationship between GDPpc and conflict intensity is generally weak or inconclusive, East Africa stands out with a significant negative association, implying that higher economic prosperity in neighboring countries may mitigate conflict within the region. This weak or inconclusive relationship between GDPpc and conflict intensity is consistent with some studies (see, for example, Vesco et al., 2020), but contradicts others that find a strong negative association (see, for example, Le et al., 2022; Fang et al., 2020; De Groot, 2010; Collier and Hoeffler, 2004).
Conversely, the positive association between corruption and conflict intensity, particularly in Central and West Africa, underscores the destabilizing influence of corruption on governance and social cohesion (Belloni, 2012). Higher levels of corruption are positively associated with increased conflict intensity, particularly in Central and West Africa. This aligns with Olsson’s (2014) idea that corruption undermines institutions, fosters grievances, and creates opportunities for conflict actors. Additionally, the spatial lags SDM results show that higher economic prosperity in neighboring countries (WGDPpc) can reduce conflict intensity in the focal country (East and West Africa). This suggests potential benefits of regional economic cooperation and “demonstration effects” encouraging peaceful development. On the other hand, higher corruption levels in neighboring countries (WCorrup) can exacerbate conflict intensity (Central and West Africa). This highlights the risk of contagious corruption and spillover of instability across borders.
Moreover, the significant positive spatial autocorrelation parameter (ρ) underscores the importance of spatial effects in understanding conflict dynamics, echoing previous research emphasizing the need to account for spatial dependencies in conflict analysis (Schneider et al., 2003). The spatial spillover coefficient (ρ) in West Africa shows a more pronounced effect compared to Central and East Africa. Specifically, the coefficient for West Africa ranges from approximately 18 to 20%, indicating that for every 1% increase in conflict intensity in neighboring countries, conflict intensity within the focal country increases by 18 to 20%. In contrast, Central and East Africa exhibit lower ρ coefficients, suggesting a lesser percentage increase in conflict intensity for the same increase in neighboring conflict. This implies that conflicts in West Africa have a stronger tendency to spread across borders, potentially leading to a higher percentage increase in conflict intensity compared to other regions.
Similarly, results from our SAR model corroborate SDM outcomes regarding weak relationship of GDPpc with conflict intensity across regions. However, the positively and significantly associated relation of corruption and conflict intensity is more consistent, aligning with prior literature emphasizing corruption’s role in fueling conflict (Wedel, 2012; Fearon and Laitin, 2003). Notably, the significant positive spatial autocorrelation in conflict intensity highlights the spatial diffusion of conflict dynamics, with neighboring countries’ conflicts influencing each other. This underscores the interconnected nature of conflict within SSA and the importance of regional approaches to conflict resolution (Amarasinghe et al., 2000; Collier and Hoeffler, 2004). Furthermore, the SEM findings reaffirm the positive association between corruption and conflict intensity observed in previous models, underscoring corruption’s detrimental impact on governance and stability (Belloni, 2012). Moreover, the significant positive spatial error term indicates the presence of unobserved spatial factors contributing to conflict dynamics across regions, highlighting the need for comprehensive and context-specific approaches to conflict resolution.
Therefore, based on the results discussed hypothesis H1 – There is a significant geographic spillover of armed conflict across different subregions within SSA is supported. The findings indicate a significant geographic spillover of armed conflict across different subregions within SSA. This is evidenced by the significant positive spatial autocorrelation parameter (ρ) in all regions, highlighting the interconnectedness of conflict dynamics across borders. Additionally, the spatial spillover coefficient (ρ) is more pronounced in West Africa compared to Central and East Africa, indicating a stronger tendency for conflicts to spread across borders in this region. These results underscore the importance of considering spatial dependencies and regional dynamics in understanding armed conflict in SSA. Therefore, the hypothesis that there is a significant geographic spillover of armed conflict across different subregions within SSA is supported by the findings. Overall, the findings from these models provide valuable insights into the interplay between economic variables, corruption, spatial dependencies, and conflict intensity in SSA. While economic prosperity of neighboring countries may mitigate conflict, corruption emerges as a significant destabilizing factor. Furthermore, the spatial spread of conflict underscores the importance of regional cooperation and coordinated interventions to address the underlying drivers of conflict in the region.
On the other hand, findings presented in Table 7 portray the impact of conflict on growth across subregions of SSA and are aligned with the hypothesis that the impact varies significantly across these subregions. The coefficients for armed conflicts are negative and statistically significant in most models and regions, suggesting that increased conflict intensity is associated with decreased economic growth, consistent with previous research (Collier and Hoeffler, 2004). Notably, the magnitude of the negative effect varies across subregions, with Central Africa experiencing the strongest negative impact, followed by East Africa and West Africa. This supports the hypothesis that the impact of armed conflict differs across SSA subregions. Furthermore, the coefficients for corruption and military expenditure also vary across regions. In Central Africa, higher levels of corruption are significantly associated with decreased economic growth, highlighting the destabilizing influence of corruption on governance and economic development (Belloni, 2012). Conversely, in West Africa, corruption is positively and significantly linked to economic growth in the OLS model but becomes negative and significant in the FE model, suggesting that controlling for unobserved country-specific effects reveals an inverse effect of corruption on growth. Such variability underscores heterogeneous nature of interactions between corruption and economic growth across SSA subregions.
Besides, the coefficients for natural resource dependence also exhibit variations across regions. In Central Africa, natural resource dependence is positively and significantly related to economic growth across the models, suggesting that resource wealth contributes to economic growth in this region. However, in East Africa, the coefficient is negative and significant in all models, indicating the paradoxical effect of the “resource curse” (Collier and Hoeffler, 2004). Therefore, the results from Table 7 support the hypothesis that “the impact of armed conflict on economic growth varies significantly across the subregions of SSA,” with different regions experiencing distinct economic consequences of conflict and its related factors. These findings highlight substantial regional heterogeneity in the impact of armed conflict on economic growth within SSA. Central Africa appears most vulnerable, likely due to factors like weaker institutions or greater reliance on resource extraction in conflict-prone areas (Carmignani and Chowdhury, 2012; Braithwaite, 2005). East and West Africa exhibit a weaker negative impact, suggesting potentially stronger institutions or more diversified economies that can buffer the effects of conflict. The findings also provide compelling evidence that armed conflict is detrimental to economic growth across SSA. However, severity varies significantly across subregions. Central Africa appears most vulnerable, while East and West Africa experience a weaker negative effect. These findings highlight the need for regionally tailored policy interventions to address the economic consequences of armed conflict in SSA.
Also, the finding for Figure 5 highlights the significant geographic spillover of armed conflict in Sub-Saharan Africa (SSA), supported by a positive spatial autocorrelation coefficient in the SAR model. This aligns with existing literature emphasizing the regional dynamics of armed conflict in SSA, attributing this spillover to factors like refugee movements, arms trafficking, and ethnic ties. The interconnectedness of conflicts within the region is underscored, with neighboring countries influencing each other’s conflict experiences, forming a conflict network. Understanding armed conflict in SSA necessitates a regional perspective due to potential spillover effects, impacting regional stability and security. Various studies emphasize the importance of considering regional dynamics in conflict prevention and resolution efforts within SSA. The presence of significant spillover effects is acknowledged, with mechanisms including population displacement, cross-border recruitment, and resource competition fueling conflict escalation across borders. While most research supports positive spillover effects, there is recognition that not all conflicts exhibit such patterns, with variations in intensity based on conflict type and regional contexts. The long-term consequences of conflict spillover in SSA require further exploration, as current literature often focuses on immediate effects. Economic consequences are long-term in nature. Collaboration and shared experiences with conflict have the potential to promote conflict resolution in neighboring countries. Ultimately, the findings stress the complex nature of conflict spillover in SSA, highlighting the need for comprehensive regional approaches in addressing and mitigating its impacts.
4.5.1 Managerial insights and policy implications
For researchers, this study provides fresh opportunities to investigate the interaction between regional characteristics and conflict outcomes, creating deeper exploration into the mechanisms driving regional variations. The findings advocate for a shift away from the monolithic, broad, one-size-fits-all solutions to more localized approaches that reflect distinctive economic vulnerabilities of different SSA regions. This is crucial in forming a basis for developing targeted interventions that enhance the effectiveness of post-conflict recovery efforts that contribute to sustainable economic development. Similarly, with the findings, policymakers are able to develop tailored interventions that address specific regional needs. For example, strategies towards regional peace-building initiatives, strengthening institutional frameworks, and tackling corruption are crucial to create resilient economic environment. Promoting regional economic integration and fostering cross-border cooperation through trade can also mitigate the negative spillover effects of conflict, thereby enhancing overall stability and prosperity in SSA.
4.5.2 Conclusion and policy implication
This study investigates the complex relationship between armed conflict and economic growth in Sub-Saharan Africa (SSA), focusing on Central, East, and West Africa. Using spatial econometric models (SDM, SAR, SEM) alongside traditional models (OLS, FE, RE), the research reveals a significant, negative impact of armed conflict on economic growth, with Central Africa being the most affected. The study’s novelty lies in highlighting the substantial regional heterogeneity in the economic consequences of conflict, emphasizing the need for regionally tailored policy interventions. The spatial analysis shows positive spatial autocorrelation, suggesting that conflict in one country can spill over into neighboring countries, exacerbating regional instability and economic decline. It also finds that higher economic prosperity and lower corruption levels in neighboring countries can mitigate conflict risk in a focal country, underscoring the importance of regional dynamics. Despite its contributions, the study is limited by the quality and availability of data in conflict zones, which may affect the accuracy and generalizability of the findings. The assumptions underlying the spatial models, such as consistent spatial relationships across regions, could introduce biases and fail to capture more complex interactions. Future research should address these limitations by incorporating more granular and reliable data and developing advanced spatial models that better account for the complexities of conflict dynamics. Further exploration into the causal mechanisms linking conflict, corruption, and economic growth, as well as the effectiveness of regional integration and governance initiatives, will provide valuable insights for scholars and policymakers. This study underscores the critical need for multifaceted strategies that not only address conflict within individual countries but also promote stability and economic prosperity across SSA’s diverse regions.
Data availability statement
The original contributions presented in the study are included in the article/Supplementary material, further inquiries can be directed to the corresponding author.
Author contributions
MO: Conceptualization, Data curation, Formal analysis, Investigation, Methodology, Writing – original draft. MA: Data curation, Writing – review & editing. YD: Conceptualization, Funding acquisition, Methodology, Supervision, Writing – review & editing.
Funding
The author(s) declare that financial support was received for the research, authorship, and/or publication of this article. The Petroleum Technology Development Fund: made funding for the analysis and interpretation of data, as well as the dissemination of results through conferences and publications (if needed). The initiative had no involvement in the study’s design, data collection, analysis, or preparation of the manuscript.
Conflict of interest
The authors declare that the research was conducted in the absence of any commercial or financial relationships that could be construed as a potential conflict of interest.
Publisher’s note
All claims expressed in this article are solely those of the authors and do not necessarily represent those of their affiliated organizations, or those of the publisher, the editors and the reviewers. Any product that may be evaluated in this article, or claim that may be made by its manufacturer, is not guaranteed or endorsed by the publisher.
Supplementary material
The Supplementary material for this article can be found online at: https://www.frontiersin.org/articles/10.3389/fpos.2024.1433584/full#supplementary-material
Footnotes
1. ^The Uppsala Conflict Data Program (UCDP) is renowned as the foremost source for comprehensive data on organized violence and armed conflict worldwide. Their categorization system distinguishes between three primary types of conflicts: state-based armed conflict, non-state conflict, and one-sided violence. This study uses the aggregate conflict related deaths (Armed Conflict Database, 2023; UCDP, 2024).
2. ^Central Africa - the six countries are Angola, Cameroon, the Central African Republic, Chad, the Republic of the Congo, Democratic Republic of Congo.
3. ^East African – the 12 countries considered Burundi, Ethiopia, Eritrea, Kenya, Madagascar, Mozambique, Rwanda, Somalia, Tanzania, Uganda, Zambia, and Zimbabwe.
4. ^West Africa – the 13 countries Benin, Burkina Faso, Côte D’Ivoire, Gambia, Ghana, Guinea, Guinea-Bissau, Liberia, Mali, Mauritania, Niger, Nigeria, Senegal, Sierra Leone, and Togo.
References
Abadie, A., and Gardeazabal, J. (2003). The economic costs of conflict: a case study of the Basque country. Am. Econ. Rev. 93, 113–132. doi: 10.1257/000282803321455188
Addy, W. O., HongXing, Y., Otchere, S. K., and Beraud, J. J. D. (2021). Economic development, political and socio-political violence crisis in the sub-Saharan Africa: an economic panel study. Eur. J. Bus. Manag. Res. 6, 34–40. doi: 10.24018/ejbmr.2021.6.4.763
Agu, C., Mbah, A. J., and Agu, C. S. (2023). Investigating the economic consequence of terrorism in sub-Saharan Africa: evidence from a dynamic panel model. Statist. Polit. Policy 14, 125–149. doi: 10.1515/spp-2022-0014
Alfar, A. J. (2022). The impact of conflict on the shadow economy and FDI: Evidence from causal and spatial inference, England: University of Hull.
Amarasinghe, A., Raschky, P., Zenou, Y., and Zhou, J. (2000). DP14300 conflicts in spatial networks‘, CEPR discussion paper no. 14300. Cambridge, MA: NBER.
Armed Conflict Database (2023). Escalating Violence and the Worsening Civilian Burden. Available at: https://acleddata.com/acleddatanew/wp-content/uploads/2023/02/ACLED_2022-Year-in-Review_Report_Jan2023.pdf (Accessed January 20, 2024).
Artadi, E., and Sala-i-Martin, X. (2003). The Economic Tragedy of the Xxth Century: Growth in Africa. NBER Working Papers 9865. Available at: http://www.nber.org/papers/w9865
Bearzotti, E., Geranio, A., Keresztes, V. K., and Müllerová, M., (2015). Containing Boko Haram’s transnational reach, United Nations: Toward a developmental approach to border management.
Belloni, R. (2012). “Part of the problem or part of the solution?: civil society and corruption in post-conflict states” in Corruption and post-conflict peacebuilding (London: Routledge), 218–236.
Belotti, F., Hughes, G., and Mortari, A. P. (2017). Spatial panel-data models using Stata. Stata J. 17, 139–180. doi: 10.1177/1536867X1701700109
Benoit, E. (1978). Growth and defence in developing countries. Econ. Dev. Cult. Chang. 26, 271–280. doi: 10.1086/451015
Bertinelli, L., Comertpay, R., and Maystadt, J. F., (2022). Refugees, Diversity and Conflict in Sub-Saharan Africa, World Bank.
Blattman, C., and Miguel, E. (2010). Civil war, Civil war. J. Econ. Lit. 48, 3–57. doi: 10.1257/jel.48.1.3
Boly, A., and Kéré, É.N., (2022). Terrorism and military expenditure in Africa, African Development Bank: An analysis of spillover.
Braithwaite, A. (2005). Location, location, location… identifying hot spots of international conflict. Int. Interact. 31, 251–273. doi: 10.1080/03050620500294234
Braithwaite, A. (2010). Resisting infection: how state capacity conditions conflict contagion. J. Peace Res. 47, 311–319. doi: 10.1177/0022343310362164
Buhaug, H., and Gleditsch, K. S. (2008). Contagion or confusion? Why conflicts cluster in space. Int. Stud. Q. 52, 215–233. doi: 10.1111/j.1468-2478.2008.00499.x
Carmignani, F., and Chowdhury, A. (2012). The geographical dimension of the development effects of natural resources. Environ. Resour. Econ. 52, 479–498. doi: 10.1007/s10640-011-9539-x
Carmignani, F., and Kler, P. (2016a). Surrounded by wars: quantifying the role of spatial conflict spillovers. Econ. Anal. Policy 49, 7–16. doi: 10.1016/j.eap.2015.11.016
Carmignani, F., and Kler, P. (2016b). The geographical spillover of armed conflict in sub-Saharan Africa. Econ. Syst. 40, 109–119. doi: 10.1016/j.ecosys.2015.08.002
Cederman, L. E., and Pengl, Y. (2019). Global conflict trends and their consequences : United Nations, Department of Economic and Social Affairs, Zürich.
Cerra, V., and Sweta, C. S. (2008). “Growth Dynamics: The Myth of Economic Recovery,”in American Economic Review. 98, 439–457. doi: 10.1257/aer.98.1.439
Collier, P., Elliot, L., Hegre, H., and Hoeffler, A. (2003). Breaking the conflict trap: Civil war and development policy. Oxford: Oxford University Press.
Collier, P., and Hoeffler, A. (2002). On the incidence of civil war in. J. Confl. Resolut. 46, 13–28. doi: 10.1177/0022002702046001002
Collier, P., and Hoeffler, A. (2004). Greed and grievance in civil war. Oxf. Econ. Pap. 56, 563–595. doi: 10.1093/oep/gpf064
Cuvelier, J., Vlassenroot, K., and Olin, N. (2014). Resources, conflict and governance: a critical review. Extract. Indust. Soc. 1, 340–350. doi: 10.1016/j.exis.2014.07.006
De Groot, O. J. (2010). The spillover effects of conflict on economic growth in neighbouring countries in Africa. Defence Peace Econ. 21, 149–164. doi: 10.1080/10242690903570575
Dunne, J. P. (2012). Military spending, growth, development and conflict. Defence Peace Econ. 23, 549–557. doi: 10.1080/10242694.2012.663576
Dunne, J., Smith, P., and Willenbockel, D. (2005). Models of military expenditure and growth: a critical review. Defence Peace Econ. 16, 449–461. doi: 10.1080/10242690500167791
Dunne, J. P., and Tian, N. (2019). Costs of civil war and fragile states in Africa. Rev. Dev. Econ. 23, 1220–1237. doi: 10.1111/rode.12612
Elfversson, E., and Höglund, K. (2021). Are armed conflicts becoming more urban? Cities 119:103356. doi: 10.1016/j.cities.2021.103356
Emeka, E. T., Ogbuabor, J. E., and Ekeocha, D. O. (2024). Terrorism and economic complexity in Africa: the unconditional impact of military expenditure. Afr. Dev. Rev. 36, 139–152. doi: 10.1111/1467-8268.12732
Fang, X., Kothari, S., McLoughlin, C., and Yenice, M., (2020). The economic consequences of conflict in sub-Saharan Africa, International Monetary Fund.
Fearon, J. D., and Laitin, D. D. (2003). Ethnicity, insurgency, and civil war. Am. Polit. Sci. Rev. 97, 75–90. doi: 10.1017/s0003055403000534
Fiandrino, S., Cattuto, C., Paolotti, D., and Schifanella, R. (2023). Combining environmental and socioeconomic data to understand determinants of conflicts in Colombia. Data Anal. Soc. Impact 6:1107785. doi: 10.3389/fdata.2023.1107785
Fitzgerald, V., Stewart, F., and Wang, M. (2001). The economic and social consequences of Conflict,volume 1 of war and underdevelopment, chapter an overview of the case studies. Oxford: Oxford University Press.
Ganegodage, K. R., and Rambaldi, A. N. (2013). Economic consequences of war, Elsevier: Evidence from Sri Lanka.
Ghazalian, P. L., and Hammoud, M. (2021). The peace level of nations: an empirical investigation into the determining factors. Defence Peace Econ 32, 509–532. doi: 10.1080/10242694.2020.1743957
Gleditsch, K. S. (2007). Transnational dimensions of civil war. J. Peace Res. 44, 293–309. doi: 10.1177/0022343307076637
Gleditsch, K. S., and Ward, M. D. (2001). Measuring space: a minimum-distance database and applications to international studies. J. Peace Res. 38, 739–758. doi: 10.1177/0022343301038006006
Gyimah-Brempong, K., and Corley, M. (2005). Civil war and economic growth in sub-Saharan Africa. J. Afr. Econ. 280:4. doi: 10.1093/jae/eji004
Humphreys, M. (2003). Economics and violent conflict. Cambridge, MA: Harvard Humanitarian Initiative.
Karimi, M. S., Khezri, M., and Razzaghi, S. (2022). Impacts of regional conflicts on tourism in Africa and the Middle East: a spatial panel data approach. Curr. Issue Tour. 25, 1649–1665. doi: 10.1080/13683500.2021.1931054
Khalid, U., Okafor, L. E., and Aziz, N. (2020). Armed conflict, military expenditure and international tourism. Tour. Econ. 26, 555–577. doi: 10.1177/1354816619851404
Landau, D. (1996). Is one of the ‘peace dividends negative? Military expenditure and economic growth in the wealthy OECD countries. Q. Rev. Econ. Finance 36, 183–195. doi: 10.1016/s1062-9769(96)90038-1
Le Billon, P. (2003). Buying peace or fuelling war: the role of corruption in armed conflicts. J. Int. Dev. 15, 413–426. doi: 10.1002/jid.993
Le, T. H., Bui, M. T., and Uddin, G. S. (2022). Economic and social impacts of conflict: a cross-country analysis. Econ. Model. 115:105980. doi: 10.1016/j.econmod.2022.105980
Mansury, Y., Kim, W., and Li, J. (2023). Militarized conflict, trade, and economic development in a structural equation model with spatial considerations. Int. Reg. Sci. Rev. :016001762311604. doi: 10.1177/01600176231160495
Murdoch, J. C., and Sandler, T. (2002). Economic growth, civil wars, and spatial spillovers. J. Confl. Resolut. 46, 91–110. doi: 10.1177/0022002702046001006
Newiak, M., Ouedraogo, R., Tenison, B., Yao, J., and Yenice, M., (2013). The economic consequences of conflicts, International Monetary Fund.
Oestman, J. (2021). A price for peace: troop contributing countries’ responses to peacekeeper fatalities. Int. Interact. 47, 986–1015. doi: 10.1080/03050629.2021.1959327
Okunlola, O. C., and Okafor, I. G. (2022). Conflict–poverty relationship in Africa: a disaggregated approach. J. Interdiscip. Econ. 34, 104–129. doi: 10.1177/0260107920935726
Olsson, S. A. , (2014). Corruption and political participation. Available at: https://www.gu.se/sites/default/files/2020-05/QoGWP_2014_12_Arkhede%20Olsson.pdf (Accessed December 12, 2023).
Opongo, E. O. (2022). “Enhancing conflict resolution in Africa” in The Palgrave handbook of sustainable peace and security in Africa (Cham: Springer International Publishing), 505–523.
Raga, S., Lemma, A., and Keane, J. (2023). The Sahel conflict: Economic & security spillovers on West Africa, England and Wales: ODI.
Ragoubi, H., and El Harbi, S. (2018). Entrepreneurship and income inequality: a spatial panel data analysis. Int. Rev. Appl. Econ. 32, 374–422. doi: 10.1080/02692171.2017.1342776
Raleigh, C., Witmer, F. D., and O’Loughlin, J., (2010). The spatial analysis of war: Oxford research encyclopedia of international studies.
Rontos, K., Salvati, L., and Vavouras, I. (2013). Corruption in the world: its economic, political and geographic determinants and their interactions. J. Region. Soc. Econ. Issues 3, 5–26.
Rother, M. B., Pierre, M. G., Lombardo, D., Herrala, R., Toffano, M. P., Roos, M. E., et al. (2016). The economic impact of conflicts and the refugee crisis in the Middle East and North Africa. International Monetary Fund 16:1. doi: 10.5089/9781475535785.006
Salehyan, I., and Gleditsch, K. S. (2006). Refugee flows and the spread of civil war. Int. Organ. 60, 335–366. doi: 10.1017/S0020818306060103
Schneider, G., Barbieri, K., and Gleditsch, N. P. (2003). Globalization and armed conflict, London: Rowman & Littlefield.
Sefa, C. A., and Siew, Y. L. (2018). The effect of military expenditure on growth; an empirical synthesis. Empir. Econ. 55, 1357–1387. doi: 10.1007/s00181-017-1300-z
Stewart, F., Huang, C., and Wang, M. (2001). The economic and social consequences of conflict, volume 1 of war and underdevelopment, chapter internal wars in developing countries: An empirical overview of economic and social consequences. Oxford: Oxford University Press.
Tar, U. A., and Ahmed, N. G. (2022). “Counterterrorism and counterinsurgency engagements of Cameroon and Nigeria along common border areas” in Cameroon-Nigeria relations: Trends and perspectives, 175. doi: 10.5771/9781793635952-175
Tian, N. (2020). “The inter-relation between arms trade, military expenditure and armed conflict” in Research handbook on the arms trade (United Kingdom: Edward Elgar Publishing), 66–79.
Tilly, C. H. (1975). The formation of national states in Western Europe. Princeton NJ: Princeton: University Press.
UCDP . (2024). Yearly datasets covering 1989–2023. Available at: https://ucdp.uu.se/downloads/ (Accessed February 16, 2022).
Vesco, P., Dasgupta, S., De Cian, E., and Carraro, C. (2020). Natural resources and conflict: a meta-analysis of the empirical literature. Ecol. Econ. 172:106633. doi: 10.1016/j.ecolecon.2020.10663
Vestby, J., Buhaug, H., and von Uexkull, N. (2021). Why do some poor countries see armed conflict while others do not? A dual sector approach. World Dev. 138:105273. doi: 10.1016/j.worlddev.2020.105273
Walter, B. F. (2009). Bargaining failures and civil war. Annu. Rev. Polit. Sci. 12, 243–261. doi: 10.1146/annurev.polisci.10.101405.135301
Wang, D., Zhou, T., Lan, F., and Wang, M. (2021). ICT and socio-economic development: evidence from a spatial panel data analysis in China. Telecommun. Policy 45:102173. doi: 10.1016/j.telpol.2021.102173
Ward, M. D., and Gleditsch, K. S. (2002). An MCMC approach to modeling the spatial context of war and peace. Polit. Anal. 10, 244–260. doi: 10.1093/pan/10.3.244
Wedel, J. R. (2012). Rethinking corruption in an age of ambiguity. Annu. Rev. Law Soc. Sci. 8, 453–498. doi: 10.1146/annurev.lawsocsci.093008.131558
Winne, J. D., and Peersman, G. (2021). The impact of food prices on conflict revisited. J. Bus. Econ. Stat. 39, 547–560. doi: 10.1080/07350015.2019.1684301
World Bank . (2024). The World Bank in Africa. Availabe at: https://www.worldbank.org/en/region/afr/overview (Accessed April 28, 2024).
Keywords: sub-Saharan Africa, armed conflict, economic growth, spatial effects, boundary links
Citation: Ogbe MA, Abdullahi MS and Ding Y (2024) Measuring how armed conflict impacts economic growth in sub-Saharan Africa through spatial analysis. Front. Polit. Sci. 6:1433584. doi: 10.3389/fpos.2024.1433584
Edited by:
Akeem Olawale Olaniyi, Kaduna State University, NigeriaReviewed by:
Abu-hanifa Babati, Kaduna State University, NigeriaUmmukulthum Ibrahim Alkali, Nigerian Army University, Nigeria
Copyright © 2024 Ogbe, Abdullahi and Ding. This is an open-access article distributed under the terms of the Creative Commons Attribution License (CC BY). The use, distribution or reproduction in other forums is permitted, provided the original author(s) and the copyright owner(s) are credited and that the original publication in this journal is cited, in accordance with accepted academic practice. No use, distribution or reproduction is permitted which does not comply with these terms.
*Correspondence: Yibing Ding, ZGluZ3liQGpsdS5lZHUuY24=