 Maxime Walder1,2*
- 1Department of Political Science and International Relations, University of Geneva, Geneva, Switzerland
- 2Department of Social Science, University of Basel, Basel, Switzerland
Ideology is a key concept in political science. In studies related to political representation, policy responsiveness, and the quality of decision-making in elections, ideology is a central concept that needs precise measurement to test related hypotheses. Despite its prominence in the political science literature, ideology is often measured differently for elites and voters with indicators that do not correlate among themselves. As a result, it is not possible to assess whether the measures of ideology and the latent dimensionality behind measures of ideology in the population and the political elites align or to what extent they differ. In this paper, I build on existing research and propose a way to measure the ideology of voters in population survey on the same space as the political elites by the same policy questions answered by political elites to voters. Furthermore, I show that researchers only need a rather limited number of questions to reach an accurate measure of ideology. Using Monte-Carlo simulations as well as real-world election data from a voting advice application (VAA) and a post-election survey in a Bayesian Item-Response Theory framework, I show that, using only a limited number of policy questions, it is possible to position voters and political elites in a similar ideological space. In sum, this paper shows that taking a handful of policy questions from elites surveys enables the operationalization of a common ideological space for political elites and citizens. This has large implications for the study of the relationship between citizens, voters, parties, and politicians.
1 Introduction
Political ideology is a crucial concept in political science. Fundamental models of voting posit that voters and politicians exist in a common ideological space in which they interact (Downs, 1957; Rabinowitz and Macdonald, 1989; Stimson et al., 1995). A shared space between voters and the elite is a quintessential feature of the concept of ideology. As Sartori (1969, p. 408) highlights, the elites' belief system substantially influences the mass public's ideology. Despite its prominence, achieving consensus on how to measure ideology remains an ongoing challenge. The current literature uses diverse metrics to measure the ideology of political elites and citizens. Thus, any assumption on the measure of ideology in a similar space is, at best, theoretical (Adams et al., 2019). While measuring ideology for the mass public and elites in a shared space is crucial in studying democratic institutions, we still lack consistent ways to do so in population surveys. This paper aims to contribute to this gap and proposes to include similar policy questions in elites and population surveys to measure the latent ideology of voters and political elites in the same space.
In Europe, studies usually estimate the ideology of survey respondents and the mass public with left-right self-placement (Adams et al., 2004, 2006, 2009; Spoon and Klüver, 2014; Spoon and Williams, 2017; Steenbergen et al., 2007). However, these measures have an explicit limitation as it is context-dependent and subject to self-perception of the latent ideological left-right space. Furthermore, the increased salience of a second ideological dimension based on post-materialist values makes it challenging to self-position on a left-right scale (Caughey et al., 2019). In parallel, the position of the political elites and the political parties are often measured with Expert surveys or the comparative manifesto project (Lehmann et al., 2023). However, Adams et al. (2019) show that these measures have a weak positive and even negative correlation when considering ideological position changes. In sum, not only do we not have a way to measure the ideology of voters and elites in the same space, but individual measures of the public and the elite's position are subjected to severe criticism. The current paper proposes a way to ensure the comparability of the elite's and voters' ideological positions using a limited number of survey items in a Bayesian Item-Response Theory framework.
Recent developments use roll-call votes to place elected officials in a single space (Hug and Schulz, 2007; Caughey and Warshaw, 2015; Kubinec, 2019). The gold standard to measure position using roll call votes is the Bayesian Item-Response Theory (IRT) model (Clinton et al., 2004). It uses the response to policy questions to define an ability parameter called in political science the “ideal position.” Using this model, Caughey et al. (2019) were able to estimate the position of the mass public in Europe for more than 30 years, using attitudes questions in the European Social Survey. However, we do not know how the political elites position in this space. As emphasized by Sartori (1969), the challenge lies in evaluating the public ideology and establishing a method that aligns with the ideological space defined by political elites. Nevertheless, Caughey et al. (2019) showed that the ideology of the mass public can be estimated consistently with policy questions, and political elites also have political attitudes.
Despite a lack of consensus on the designs and the methods, many researchers have compared the policy positions of voters and political elites in various manners. In their seminal meta-analysis, Shim and Gherghina (2020) use 100 different empirical works that measure mass-elites congruence. However, one remaining challenge is that these studies measure the distance between voters and political elites. While this ensures the comparability of voters and political elites, it does not directly relate to the computation of individual ideological positions. Nevertheless, other authors have computed and compared the ideological positions of voters and political elites. Leimgruber et al. (2010) use a commonly drafted elite and population survey from the 2007 Swiss national election to measure the position of both voters and political elites and compare them. Similarly, Kurella and Rosset (2018) use a principal component analysis with the jointly drafted elites and voters survey from the 2015 Swiss national election to position the voters and the political candidates in the same ideological space. However, researchers commonly drafted an elite and a voter survey during a national election in all of these cases. For researchers aiming to measure the ideology of voters in a random population survey, conducting an elite-based survey is not always possible. In this paper, I argue that researchers can use existing elite surveys and ask a sample of the same policy questions when drafting population surveys. In doing so, it is possible to use a similar process as the work of Leimgruber et al. (2010) as well as Kurella and Rosset (2018) and measure the ideological position of voters in a population survey on the same space as the political elites.
In this paper, I first propose to utilize a limited number of survey items in a population survey that have also been answered by the political elites in the same measurement model to ensure the comparability of the positions. For the measurement, I rely on a Bayesian ordered Item-Response Theory (IRT) model to measure the ideal position of survey respondents and political elites in the same ideological space. In doing so, I extend the model proposed by Caughey et al. (2019) to the masses and the elites, ensuring the comparability between the position of both types of actors, using a similar approach as Leimgruber et al. (2010). Second, through a field experiment with a partial invitation to use a voting advice application (VAA), I demonstrate that only a small subset of questions is sufficient to measure the political ideology of the population and the political elites in a unique ideological space. By leveraging the pseudo-random VAA usage of the treatment group, I compare their positions to a control group that answered only 7 out of 51 policy questions. This unique design is able to show the similarity in the distribution of positions between the treatment and control groups. I then confirm this approach with Monte-Carlo simulations, showing that, despite a higher error in the control group model, the posterior estimates of ideological position exhibit a high correlation with the true positions, indicating that the limited number of questions does not introduce bias. This innovative approach proposes a way to systematize the process and demonstrates that only a handful of questions are sufficient to do so.
In the following sections, I outline the general procedure for selecting items from elite surveys to estimate ideology in a single space. In a second step, I present the results of applying this methodology during a sub-national election survey using data from a voting advice application (VAA). Finally, I validate the approach with Monte-Carlo simulations and present concluding remarks on the implication of such measurement in political science research.
2 Measuring ideology of political elites and voters using the same policy questions
Researchers have employed various methods to measure the ideology of voters and political elites. First, for voters, the most commonly used method is left-right self-placement. However, Caughey et al. (2019) argue that this is problematic for comparing ideology between contexts and that this self-placement does not consider the increased saliency of post-materialist values in the latent ideological space. Second, researchers often rely on expert surveys and party manifestos to measure the position of political parties. However, Adams et al. (2019) show that these computations do not necessarily correlate well between them, especially when operationalizing position changes over time. To address this issue, Adams et al. (2019) suggest looking for other ways to measure party positions, and Caughey et al. (2019) propose to measure the latent ideology of voters using survey responses to policy questions. While their measurement improves the comparison of ideology over time, one issue is the comparability between elites and voters. Indeed, while it is possible to use the measurement of Caughey et al. (2019) to measure voters' latent ideology and roll call votes, for instance, to measure political elites' latent ideology, it is not possible to ensure that the latent ideological space is similar, or even correlate.
In this paper, I propose using policy questions from elite surveys or Voting Advice Applications to estimate the latent ideology of voters and political elites in the same space. The main innovation is to use similar policy questions for voters and political elites. If researchers aim to measure ideology in a population survey, they may take existing policy questions answered by political elites and ask voters to position on these questions. Then, by considering both the answers of the political elites and the survey respondents to these questions, it is possible to compute the latent ideology of both types of actors in a single latent ideological space. While it is difficult to compare the policy positions of voters and candidates based on parliamentary projects, elite surveys and Voting Advice Applications develop surveys where political elites answer policy questions accessible to researchers. Including policy questions answered by political elites in the population survey enables us to consider all the responses from voters and political elites in a similar measurement model and thus compute their latent ideology in a single space. In doing so, I propose way to generalize the adoption of the approach of Leimgruber et al. (2010) to enable all population surveys to measure the latent ideological position of respondents on the same space as the political elites.
In summary, the first part of the process involves incorporating a set of policy questions answered by political elites into a population survey. The second step is to compute the latent ideology of political elites and the population. This computation uses the responses of survey voters and political elites to these policy questions, which are processed using an appropriate measurement model. The entire process is illustrated in the scheme presented in Figure 1.

Figure 1. Summary of estimation strategy to measure ideology of voters and political elites in the same space.
As shown in Figure 1, the suggested estimation strategy presented in this paper has three main steps. The first step (A) is to include policy questions from elite surveys into the original population survey in which researchers aim to measure voters' ideology. The second step (B) requires the compilation of political elites and voters' responses to the policy questions in the same measurement model. Finally, the third step (C) extracts the ideological position of voters and political elites from the measurement model. This way, researchers should be able to compute the individual ideological position of each survey respondent from the measurement model and ensure that this position is measured in the same space as the political elites' ideological position.
To empirically test this estimation strategy, I use data from a sub-national election panel survey in the canton of Bern, Switzerland. The election was held on the 22nd of March 2022. The first survey wave was conducted between the 14th of January and the 9th of February 2022. The second wave was conducted right after the election between the 28th of March and the 8th of April. Overall, 5,723 respondents participated in the two survey waves. We invited a random sample of two-thirds of the respondents between survey waves to use a voting advice application. Of the 5,723 respondents who participated in both survey waves, 2,454 used the VAA. To compare their position to the position of the control group—those who were not invited to use the VAA—we askes a subset of the same questions in the second wave survey to the respondents from the control group. As we did not have the space to ask all of the 51 policy questions asked to the treatment group. Thus, we selected 7 of the 51 policy questions from the VAA and included them to survey respondents in the control group and non-compliers to the treatment. To increase the validity of the measure, we kept only survey respondents and VAA users who replied to at least five different policy questions. Overall, out 3,269 survey respondents, 3,079 replied at least five of the seven short battery policy questions in the second survey waves, and out of the 2,454 VAA users, 2,391 replied to at least five of the full battery of 51 policy questions using the VAA between survey waves. In the data, the response of 1,905 candidates to the election who answered at least five VAA question was included. Overall, the data used to compute the ideological position of voters and political candidates contains responses to policy question of 1,905 political candidates, 2,391 VAA users and 3,079 survey respondents. The results presented in the paper thus contain the ideological position of 7,375 individuals.
The policy questions I use in the empirical test are taken from a voting advice application and were elaborated by the Smartvote team. Smartvote specializes in voting advice applications and has been at the forefront of VAA development in Europe for the last 20 years. In this time, it has covered more than 350 local sub-national and national elections in Switzerland and has also been active in other countries such as Bulgaria, Luxemburg or Australia.1 The Smartvote team elaborates on the policy questions used in this study and covers many topics, such as gay marriage, retirement age, taxation, environment protection, immigration, energy, and healthcare, to cite a few. The way this VAA works is that, early in the campaign, political candidates are invited to use the tool and position themselves on the 51 policy questions. Then, the VAA is open to voters, who can reply to the same policy questions as the political candidates. Ultimately, voters can see a matching list of candidates with the most similar replies to the VAA, effectively computing a congruence score between the voter and each political candidate. They also propose a smartspider2 in which they regroup these 51 policy questions into nine sub-dimensions so voters can visualize their position and compare it to the position of political candidates on the same issue.
The seven questions asked in the survey to the control group were chosen to cover a variety of topics that had been salient for the Swiss party competition. While one question on corporate taxes cites the canton of Bern, which was chosen for its salience on the economic dimension, the other questions are nationally relevant questions, aiming at being chosen to be replicated in other contexts. Overall, the questions chosen in the survey concern the relationship between Switzerland and the European Union, energy provision, the minimum wage, or the corporate taxes to cover salient questions related to different issues. The full list of questions is presented in the Supplementary material, in which I highlighted the seven questions selected for the survey.
The policy questions taken from the VAA have four response categories. Respondents to the VAA can indicate “yes (1),” “rather yes (2),” “rather no (3),” or “no (4)” to the different policy questions. The summary statistics of each question for the treatment, the control group, and the political elites are presented in the Supplementary material. We use an ordered Bayesian IRT to estimate the latent, unobserved ideological position from the observed response to policy questions. As emphasized by previous researchers (Leimgruber et al., 2010), the “Item-response Theory (IRT) model provides a convenient framework for this task” (Caughey et al., 2019, p. 679). These four item questions are ordinal, I thus estimate the latent position using an ordinal logit model. The model can be summarized as follows:
Where ϕ is the cumulative normal distribution, θj is the ideal position of respondent j, βi is the discrimination parameter of item i and αi, k is its difficulty of each k category of item i. The parameters αi, k are ordered so that αi, 1 < αi, 2 < … < αi, k−1 < αi, k. Our main goal is to estimate and analyze the posterior prediction of θj. We give the standard normal distribution as a prior distribution for θj and five times the standard normal distribution for βi and αi.
The outcome of the model Yij is the response of respondent j to question i. In this paper, I use the Bayesian framework to compute the ordinal IRT model to compute the latent ideology of respondents who reply to 51 and 7 policy questions in a similar model without deleting responses from unused items or requiring missing data imputation. To compute this model, I use the statistical software Stan (Carpenter et al., 2017), which has been used in other instances to compute similar models (Kubinec, 2019; Luo and Jiao, 2018).
As indicated in the model, a single θ parameter is estimated for each respondent j. This means that the results presented in the next section position elites and voters on a unidimensional ideological space. One key limitation with this modeling is that the literature has long theorized and observe the emergence of a cultural dimension (Kriesi et al., 2006; Inglehart, 1990; Kitschelt, 1994). Yet, the current approach is not limited to unidimensional measures of the ideological space. Indeed, Leimgruber et al. (2010), using a similar measurement model, placed both political elites and voters on a two dimensional space. Also, Caughey et al. (2019) classified the different questions into four general issues and measured the latent ideology of voters on four ideological space. Thus, the measurement model can also be applied to a multidimensional space. However, I conducted a principal component analysis that shows a high proportion of variance explained by the first component and only marginal additions of the second and following component for different groups of voters. Table 1 presents the results of the principal component analyses3 with the proportion of variance explained by the five first component.
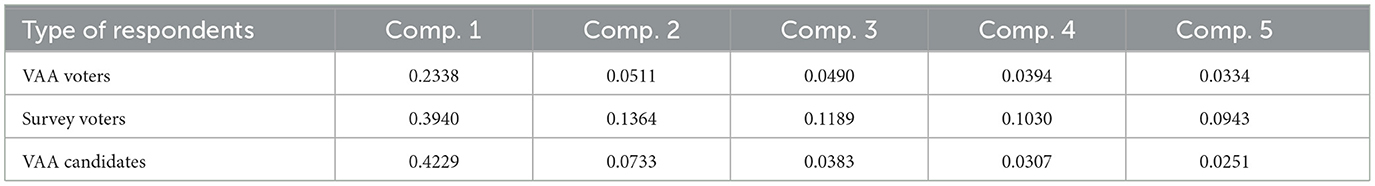
Table 1. Proportion of variance explained by the five first component of principal component analyses using survey respondents and political candidates' answer to the items used in this paper.
The results presented in Table 1 show that, in each case, the first component explains much more proportion of variance than the second component. Furthermore, a clear cutoff between the first and the second dimension can be identified. Indeed, we see only small differences between the proportion of the variance explained by the second component than by what is explained by the third, fourth and fifth components. In sum, the results show that while adding one or more dimensions improve the explanatory power of the model, a single dimension model seems appropriate to describe the position of the different types of actors based on the set of chosen questions.
In the next section, I present the results of different analyses aiming to validate the suggested approach to measure the ideological position of voters and candidates in the same latent space. I first present the distribution of ideal positions of political candidates and survey respondents based on the response to the VAA and survey voters from the treatment group. In doing so, I expect that the distribution of positions between VAA users and survey respondents matches, as the pseudo-random allocation of VAA should give a similar distribution of positions between VAA users—the treatment group—and non-VAA users—the control groups. It also shows that the position of each political candidate and survey respondent can be placed in the same space. Second, I provide subgroup analysis to show that the distribution of positions for voters of the treatment and the control group are similar by the level of political interest. Third, I evaluate the relationship between the ideal position and the left-right self-position of voters, which helps validate the approach as the relationship between the self-position and the ideal position should be the same for VAA users and non-users. Furthermore, this shows the discrepancy and limited correlation we find between left-right self-position and the ideal position of voters. Fourth, I present the results of two Monte-Carlo simulations where we evaluate the measure accuracy based on the 51 or the 7 questions. Finally, I present concluding remarks and recommendations for future survey research to measure the ideology of voters and the political elites in the same space.
3 Distribution of latent ideological position of political candidates, VAA users and survey respondents
To present the results of the analyses, we first show the distribution of ideal positions. This analysis aims to show that the model can place candidates and voters in the same latent space and that the ideal position of survey respondents computed with a small and a large battery of policy questions are similarly distributed. Figure 2 presents the distribution of the ideal position for voters based on a large and small battery of questions and the ideal position of political candidates.
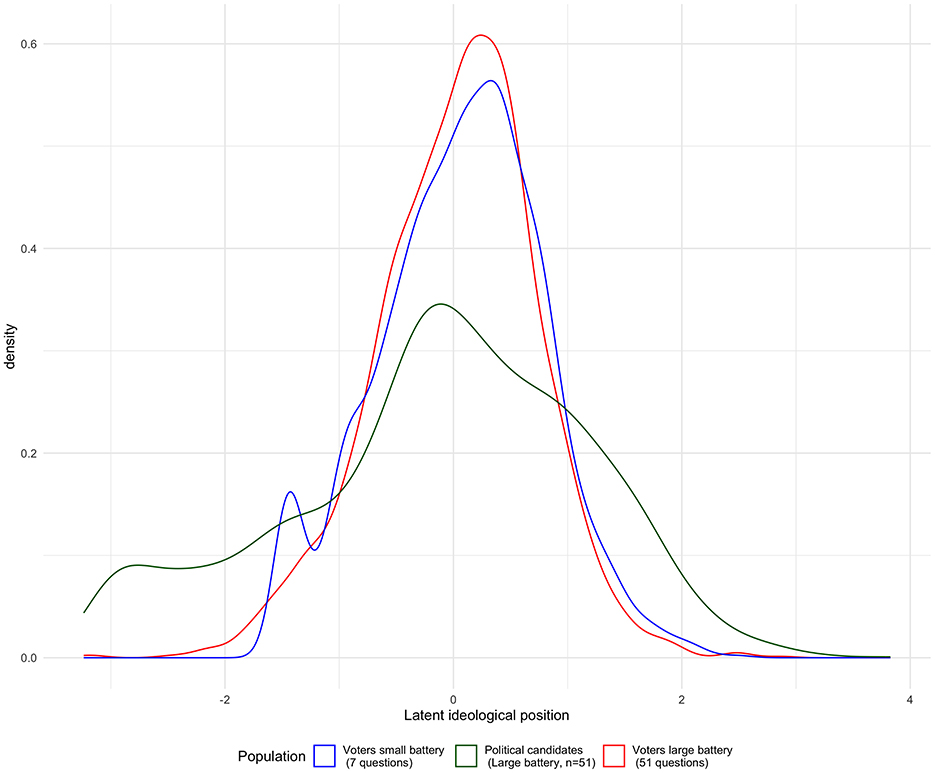
Figure 2. Distribution of ideal position for VAA users, non users, and political candidates.
Figure 2 displays the distribution of the ideal positions of political candidates and voters. The ideal position of voters is computed with a small and large battery of questions. A crucial observation from Figure 2 is the similarity in the distribution of ideal positions between the computation based on the large and the small battery of questions. Given the random invitation to use the VAA—which decides whether respondents answered the large or small question battery, we would expect these distributions to align. This result suggests that the distribution of the latent ideological positions, computed with seven policy questions, closely resembles those computed based on 51 questions. Additionally, the figure shows the distribution of ideal positions for political candidates in the same space as voters. Notably, while the position distribution among political candidates is centered around the ideological midpoint, their distribution is considerably broader than that of voters. This indicates that political candidates tend to occupy a less concentrated position within the ideological space than voters. In sum, this underscores that selecting a handful of policy questions—in our case, seven—from elite surveys facilitates estimating the ideal position of political elites and citizens on the same ideological continuum.
The second analysis compares the distribution of the latent ideological position of voters who used VAA—the treatment group—to the position of voters who replied to the limited number of policy questions within the survey by levels of political interest. Figure 3 presents the result of this analysis.
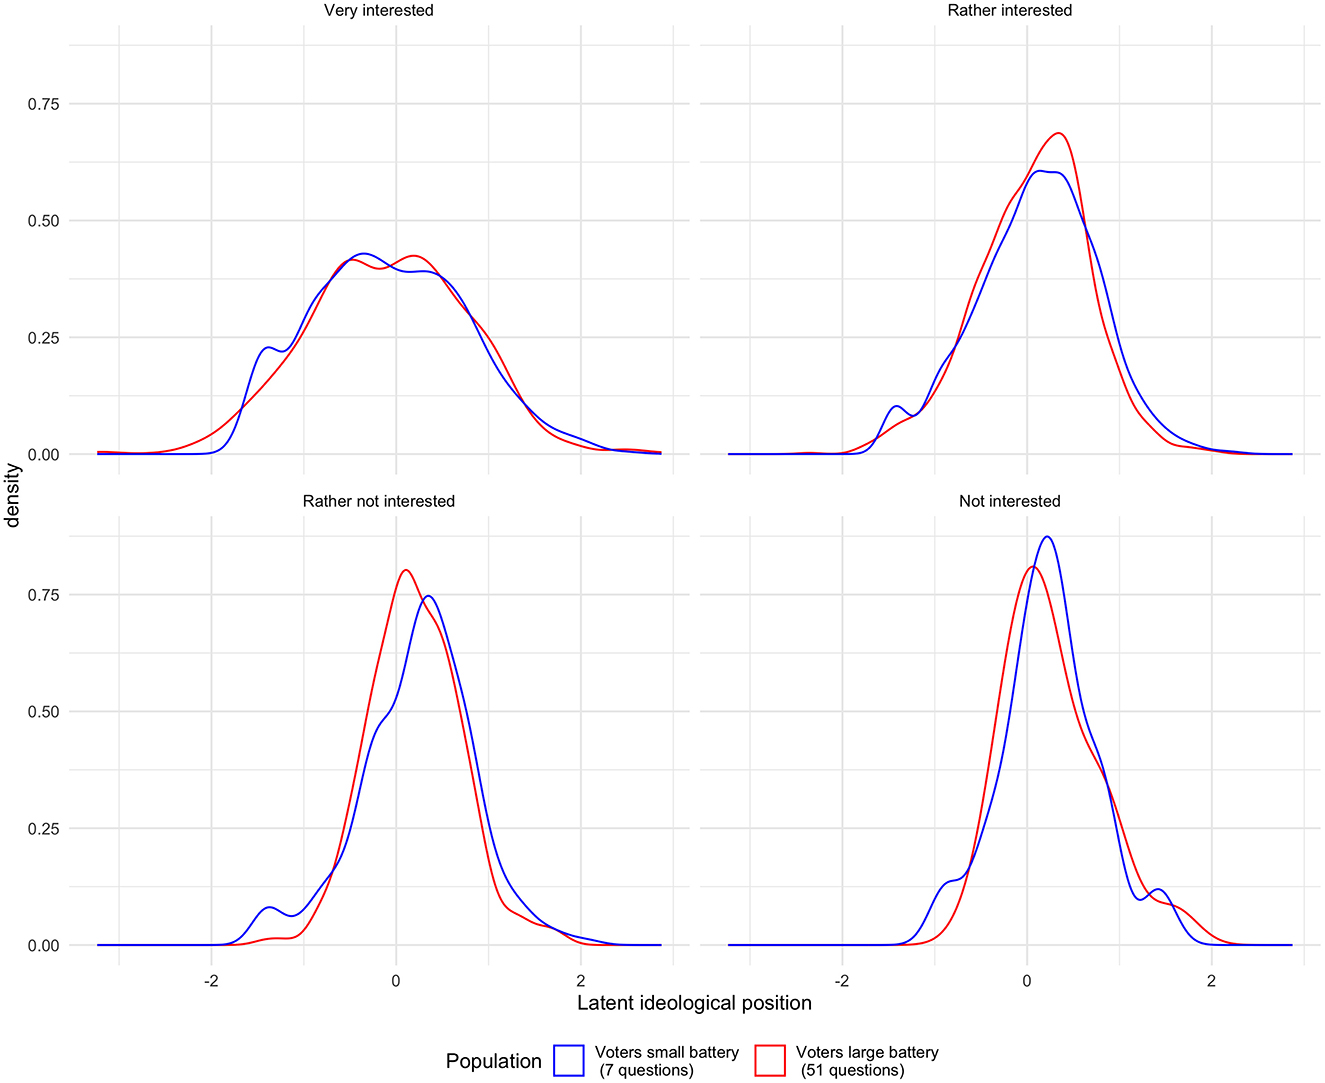
Figure 3. Distribution of ideal position for VAA users and non users by levels of political interest.
Figure 3 first shows that the distribution of respondents from the treatment and the control group by levels of political knowledge are very similar. Indeed, we see that for each subset of respondents, the distribution of the latent ideological position of voters follows the same path. Second, the figure shows that the position distribution is less centralized for more interested voters than those with low political interest. This result shows that voters with low political interest generally tend to take a more centrist position on policies than voters with high interest. For this paper, however, the interesting finding is that the positions of voters from the treatment and the control group are distributed similarly despite the lower number of questions presented to the control group.
The third analysis aims to compare the outcomes of the ideal position model with another positional metric. I explore the relationship between the ideal position and the left-right self-placement, examining whether the measures derived from 7 and 51 questions exhibit similar correlations with respondents' self-positioning. Figure 4 visually presents the ideal position alongside the left-right self-placement of respondents.
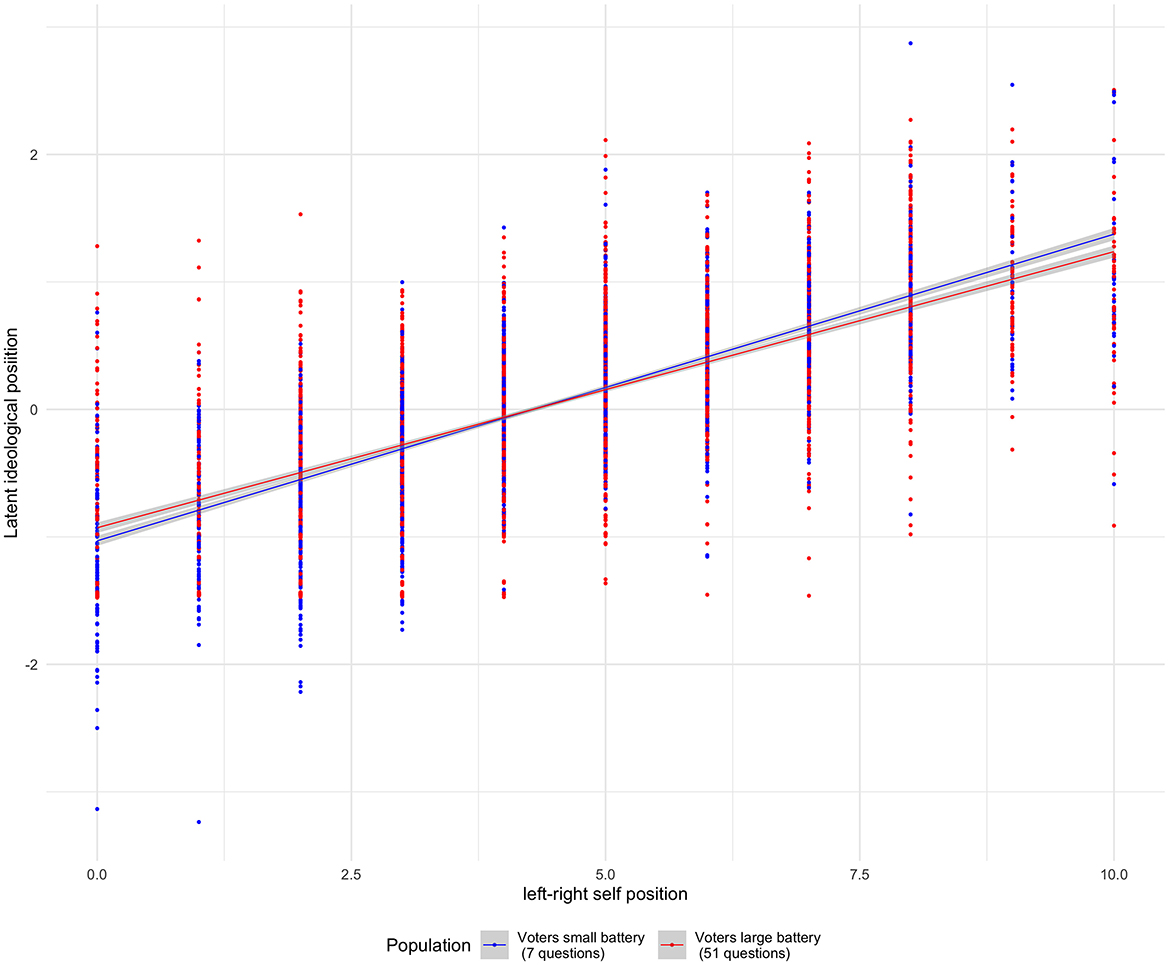
Figure 4. Correlation between left-right self-position and ideal position for VAA users and non users.
The results depicted in Figure 4 show two critical observations. First, a positive correlation exists between the ideal position of voters and their left-right self-position for positions computed using the large and the small battery of questions. This correlation appears slightly stronger for VAA users, indicating that the alignment between the ideal and self-reported positions is more pronounced among VAA users. Given the random VAA invitation, the fact that only a portion of respondents participated introduces some differences. Higher treatment attrition among respondents with a heightened political interest may explain the slight variation, suggesting that VAA users—typically more politically engaged voters—tend to position themselves more adeptly within the ideological space. Despite these subtle distinctions, Figure 4 demonstrates a comparable correlation for both VAA users and non-users.
The second observation from Figure 4 is the substantial variance in the ideal position for a single point on the left-right scale. The ideal positions of survey respondents span both sides of the status quo (the center 0 of the scale) across all points on the left-right continuum. This implies that while a clear positive correlation exists between the ideal position and left-right self-position, individual survey respondents may position themselves markedly differently than suggested by their policy preferences. The difference between the left-right self-placement and the latent ideological position underscores the significant divergence between traditional approaches to measuring voter ideology and the methodologies presented in this paper and in the work of Caughey et al. (2019) previously discussed.
4 Monte-Carlo simulations
The final piece of evidence in this paper is a comparison between two Monte-Carlo simulations. In this analysis, we simulate the responses of 1,000 individuals whose true positions follow a normal distribution. Subsequently, we simulate the responses of these 1,000 individuals to 7 and 51 questions, using parameters equal to the posterior estimates derived from the observed data for the difficulty and the discrimination parameters in the model. This simulation provides insights into how effectively the model with 7 and 51 questions can estimate the true positions of a simulated population, where the true positions conform to a standard normal distribution. Employing these simulations enables the assessment of the accuracy of the model. Following the presentation of the joint distribution of ideal and true positions for models with 51 and 7 questions, I adhere to the recommendations of Hopkins et al. (2024) for Monte-Carlo simulations and discuss the Root-Squared Mean Error, the Bias, and the Standard Deviation of the models. Figure 5 illustrates the relationship between the true position and the ideal position computed with seven questions (left) and 51 questions (right).
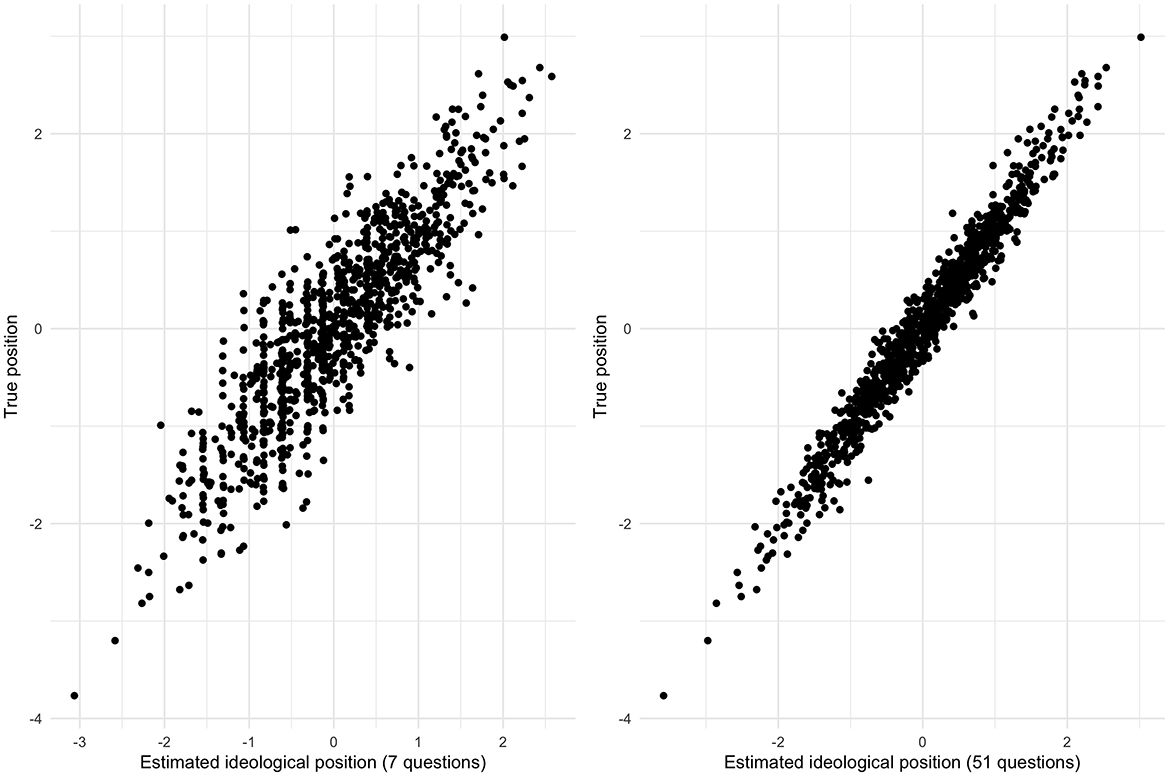
Figure 5. Relationship between the true position and the ideal position computed with 7 (Left) and 51 (Right) policy questions.
Figure 5 shows that, while the model with 51 questions presents ideal point estimates closer to the true parameter value, the model with seven questions exhibits ideal position estimates with a high correlation to the true position. Strong correlations and limited errors are evident between both models' true and ideal positions. The errors also display a normal distribution centered around the true position value.
To evaluate the disparity in performance between the two models, we follow the recommendations of Hopkins et al. (2024) and calculate three performance indicators. Given our primary objective of estimating the true position of voters in the policy space, we compute the Root Mean Squared Error, which indicates the sum of measurement errors in the model. To assess the source of the error, we calculate the Bias and standard deviation. A Bias close to 0 would imply equally distributed errors, while a standard deviation close to 1 suggests a deviation equivalent to that defined in the true position. The values of these three performance indicators for both models are presented in Table 2.

Table 2. Performance indicator for the Monte-Carlo simulations with 7 and 51 questions.
Table 2 shows that the errors in the two models are not biased and that the posterior estimates give positions that follow a standard normal distribution. Indeed, in both cases, the Bias is close to 0 (under −0.02), and the standard deviation is close to the true standard deviation of the simulated ideological position. However, we see that the RMSE is larger for the model with seven questions than for the model with 51. This is unsurprising as it means the model with 51 questions performs better than the model with seven questions. Despite this, the results indicate that with only a handful of questions, it is possible to reach highly accurate measures of the ideal position. Indeed, while 51 questions lower the RMSE to around 6, the RMSE with only one eight of the questions is < 15. In sum, the simulations show that selecting a handful of questions enables high accuracy and does not increase the Bias of the posterior estimates.
5 Conclusion
In this paper, I propose placing political candidates and voters on a similar ideological dimension with a handful of policy questions. Using the data from a VAA during an election campaign, I show that by asking similar policy questions to voters and political candidates, it is possible to position each actor in a similar ideological space. As a result, a key recommendation of the paper is to consider and elaborate a set of common policy questions to ask voters and politicians in surveys.
This paper follows recent developments on the measure of ideology, most notably the contribution of Caughey et al. (2019), which measures the policy position of European voters over 30 years. Their paper (Caughey et al., 2019) shows that it is possible to position voters from various countries in a similar policy dimension. In this paper, we add to this finding and show that it is possible to position both types of actors in the same policy space by asking similar policy questions to political elites and voters. Future studies should combine these two approaches—asking a set of policy questions to voters and political candidates in various countries—which would enable the creation of a single policy space for political candidates and voters in different countries. Such advancement in measuring ideology could improve the measurement issues related to ideology and ideological changes as emphasized by Adams et al. (2019). This could lead to a surge in the study of classical directional and proximity models of vote choice (Downs, 1957; Rabinowitz and Macdonald, 1989) and dynamic representation (Stimson et al., 1995) in comparative perspective. Although long-lasting surveys such as the European Social Survey (ESS) or the Chaptel Hill Expert Surveys (CHES) would need to add or adapt some survey items, the research related to the democratic theory of representation could highly benefit from such shifts.
One key limitation of the paper is the single policy dimension in which the ideological space is defined. For several decades, researchers agree that a second policy dimension related to cultural issues has risen (Inglehart, 1971; Kitschelt, 1988; Kriesi et al., 2006). In this paper, we limit the policy position to a single dimension. However, the framework is adaptable mainly for multiple dimensions (Caughey et al., 2019; Leimgruber et al., 2010). Of course, as the number of parameters in the model substantially increases when estimating position in a multiple dimension space, the number of questions and accuracy of posterior predictions will be impacted by the adaptation. Nevertheless, one of the strengths of IRT models is the possibility of modeling multi-dimensional spaces. Thus, this framework is also ready to welcome innovation in the policy space by adding dimension or actors to the models.
Overall, this paper shows that it is possible to define a common policy space by asking a set of policy questions to both the political elites and the voters. Future research should implement this idea in survey research and in comparative perspective. Furthermore, future research should also investigate the dimensionality of the policy space. This new approach to measuring ideology opens new ways to study voting decisions, political representation, political congruence, and, more generally, the quality of democratic institutions in representative democracy.
Data availability statement
The data analyzed in this study is subject to the following licenses/restrictions: the data used comes from an original survey and an voting advice application. For data protection reasons, the VAA does not enable the publication of the data. Requests to access these datasets should be directed to maxime.walder@unige.ch.
Ethics statement
The studies involving humans were approved by Commission Universitaire pour une Recherche Ethique à l'Université de Genève (CUREG). The studies were conducted in accordance with the local legislation and institutional requirements. The ethics committee/institutional review board waived the requirement of written informed consent for participation from the participants or the participants' legal guardians/next of kin because it was a survey, informed consent was given to respondents but not written by them.
Author contributions
MW: Data curation, Methodology, Validation, Visualization, Writing – original draft, Writing – review & editing.
Funding
The author(s) declare financial support was received for the research, authorship, and/or publication of this article. This data was provided by a SNF funded project entitled: Online News Exposure: A Threat to Democracy? How Digital Transformation Affects Opinion Formation, Political Polarization and Trust (Grant no 197439).
Conflict of interest
The author declares that the research was conducted in the absence of any commercial or financial relationships that could be construed as a potential conflict of interest.
Publisher's note
All claims expressed in this article are solely those of the authors and do not necessarily represent those of their affiliated organizations, or those of the publisher, the editors and the reviewers. Any product that may be evaluated in this article, or claim that may be made by its manufacturer, is not guaranteed or endorsed by the publisher.
Supplementary material
The Supplementary Material for this article can be found online at: https://www.frontiersin.org/articles/10.3389/fpos.2024.1425406/full#supplementary-material
Footnotes
1. ^For more information on Smartvote see https://www.smartvote.ch/en/wiki/about-us.
2. ^For more information see https://www.smartvote.ch/fr/wiki/methodology-smartspider.
3. ^The principal component analysis has been conducted considering only respondents to answered the full battery of questions, meaning 51 questions for the VAA voters and the VAA candidates groups and seven questions for the Survey voters group.
References
Adams, J., Bernardi, L., Ezrow, L., Gordon, O. B., Liu, T.-P., and Phillips, M. C. (2019). A problem with empirical studies of party policy shifts: alternative measures of party shifts are uncorrelated. Eur. J. Polit. Res. 58, 1234–1244. doi: 10.1111/1475-6765.12324
Adams, J., Clark, M., Ezrow, L., and Glasgow, G. (2004). Understanding change and stability in party ideologies: do parties respond to public opinion or to past election results? Br. J. Polit. Sci. 34, 589–610. doi: 10.1017/S0007123404000201
Adams, J., Clark, M., Ezrow, L., and Glasgow, G. (2006). Are niche parties fundamentally different from mainstream parties? the causes and the electoral consequences of western european parties' policy shifts, 1976-1998. Am. J. Polit. Sci. 50, 513–529. doi: 10.1111/j.1540-5907.2006.00199.x
Adams, J., Haupt, A. B., and Stoll, H. (2009). What moves parties? The role of public opinion and global economic conditions in Western Europe. Comp. Polit. Stud. 42, 611–639. doi: 10.1177/0010414008328637
Carpenter, B., Gelman, A., Hoffman, M. D., Lee, D., Goodrich, B., Betancourt, M., et al. (2017). Stan: a probabilistic programming language. J. Stat. Softw. 76:1. doi: 10.18637/jss.v076.i01
Caughey, D., O'Grady, T., and Warshaw, C. (2019). Policy ideology in European Mass Publics, 1981–2016. Am. Polit. Sci. Rev. 113, 674–693. doi: 10.1017/S0003055419000157
Caughey, D., and Warshaw, C. (2015). Dynamic estimation of latent opinion using a hierarchical group-level IRT model. Polit. Anal. 23, 197–211. doi: 10.1093/pan/mpu021
Clinton, J., Jackman, S., and Rivers, D. (2004). The statistical analysis of roll call data. Am. Polit. Sci. Rev. 98, 355–370. doi: 10.1017/S0003055404001194
Downs, A. (1957). An economic theory of political action in a democracy. J. Polit. Econ. 65, 135–150. doi: 10.1086/257897
Hopkins, V., Kagalwala, A., Philips, A. Q., Pickup, M., and Whitten, G. D. (2024). How do we know what we know? Learning from Monte Carlo simulations. J. Polit. 86, 000–000. doi: 10.1086/726934
Hug, S., and Schulz, T. (2007). Left–right positions of political parties in switzerland. Party Polit. 13, 305–330. doi: 10.1177/1354068807075938
Inglehart, R. (1971). The silent revolution in europe: intergenerational change in post-industrial societies. Am. Polit. Sci. Rev. 65, 991–1017. doi: 10.2307/1953494
Inglehart, R. (1990). Culture Shift in Advanced Industrial Society. Princeton, NJ: Princeton University Press.
Kitschelt, H. (1994). The Transformation of European Social Democracy. Cambridge: Cambridge University Press.
Kitschelt, H. P. (1988). Left-libertarian parties: explaining innovation in competitive party systems. World Polit. 40, 194–234. doi: 10.2307/2010362
Kriesi, H., Grande, E., Lachat, R., Dolezal, M., Bornschier, S., and Frey, T. (2006). Globalization and the transformation of the national political space: six European countries compared. Eur. J. Polit. Res. 45, 921–956. doi: 10.1111/j.1475-6765.2006.00644.x
Kubinec, R. (2019). Generalized Ideal Point Models for Time-Varying and Missing-Data Inference. doi: 10.31219/osf.io/8j2bt
Kurella, A.-S., and Rosset, J. (2018). The rise of cultural issues as an opportunity for the right? Insights from the 2015 swiss election. Swiss Polit. Sci. Rev. 24, 381–399. doi: 10.1111/spsr.12327
Lehmann, P., Franzmann, S., Burst, T., Regel, S., Riethmüller, F., Volkens, A., et al. (2023). The Manifesto Data Collection. Manifesto Project (MRG/CMP/MARPOR). Version 2023a. doi: 10.25522/manifesto.mpds.2023a
Leimgruber, P., Hangartner, D., and Leemann, L. (2010). Comparing candidates and citizens in the ideological space. Swiss Polit. Sci. Rev. 16, 499–531. doi: 10.1002/j.1662-6370.2010.tb00439.x
Luo, Y., and Jiao, H. (2018). Using the stan program for Bayesian item response theory. Educ. Psychol. Meas. 78, 384–408. doi: 10.1177/0013164417693666
Rabinowitz, G., and Macdonald, S. E. (1989). A directional theory of issue voting. Am. Polit. Sci. Rev. 83, 93–121. doi: 10.2307/1956436
Sartori, G. (1969). Politics, ideology, and belief systems. Am. Polit. Sci. Rev. 63, 398–411. doi: 10.2307/1954696
Shim, J., and Gherghina, S. (2020). Measuring the mass-elite preference congruence: findings from a meta-analysis and introduction to the symposium. Eur. Polit. Sci. 19, 509–527. doi: 10.1057/s41304-020-00273-y
Spoon, J.-J., and Klüver, H. (2014). Do parties respond? How electoral context influences party responsiveness. Elect. Stud. 35, 48–60. doi: 10.1016/j.electstud.2014.04.014
Spoon, J.-J., and Williams, C. (2017). It takes two: how eurosceptic public opinion and party divisions influence party positions. West Eur. Polit. 40, 741–762. doi: 10.1080/01402382.2016.1277876
Steenbergen, M. R., Edwards, E. E., and De Vries, C. E. (2007). Who's cueing whom? Mass-elite linkages and the future of European integration. Eur. Union Polit. 8, 13–35. doi: 10.1177/1465116507073284
Keywords: ideology, Item-Response modeling, Monte-Carlo simulation, political elites, voters
Citation: Walder M (2024) On the same space? Measuring the ideology of voters and political elites. Front. Polit. Sci. 6:1425406. doi: 10.3389/fpos.2024.1425406
Received: 29 April 2024; Accepted: 22 August 2024;
Published: 19 September 2024.
Edited by:
Marco Steenbergen, University of Zurich, SwitzerlandReviewed by:
Alexander Jedinger, GESIS Leibniz Institute for the Social Sciences, GermanyAndrés Santana, Autonomous University of Madrid, Spain
Copyright © 2024 Walder. This is an open-access article distributed under the terms of the Creative Commons Attribution License (CC BY). The use, distribution or reproduction in other forums is permitted, provided the original author(s) and the copyright owner(s) are credited and that the original publication in this journal is cited, in accordance with accepted academic practice. No use, distribution or reproduction is permitted which does not comply with these terms.
*Correspondence: Maxime Walder, maxime.walder@unige.ch