 Thomas J. Scotto
 Carla Xena
 Jason Reifler3
- 1School of Social and Political Sciences, University of Glasgow, Glasgow, United Kingdom
- 2Institute for Social and Economic Research, University of Essex, Essex, United Kingdom
- 3Department of Politics, University of Exeter, Exeter, United Kingdom
In this paper, we examine the measurement of citizens’ beliefs that politicians and political systems are responsive (external efficacy) and that citizens see themselves sufficiently skilled to participate in politics (internal efficacy). This paper demonstrates techniques that allow researchers to establish the cross-context validity of conceptually important ordinal scales. In so doing, we show an alternative set of efficacy indicators to those commonly appearing on cross-national surveys to be more promising from a validity standpoint. Through detailed discussion and application of multi-group analysis for ordinal measures, we demonstrate that a measurement model linking latent internal and external efficacy factors performs well in configural and parameter invariance testing when applied to representative samples of respondents in the United States and Great Britain. With near full invariance achieved, differences in latent variable means are meaningful and British respondents are shown to have lower levels of both forms of efficacy than their American counterparts. We argue that this technique may be particularly valuable for scholars who wish to establish the suitability of ordinal scales for direct comparison across nations or cultures.
1 Introduction
Answering key political and social science questions often requires operationalizing unobserved or latent constructs that are measured by a series of ordinal survey questions. Prominent examples include scales that capture racial animosity otherwise missed by more explicit measures and or concepts like civic engagement and life satisfaction.1 Across nations, interest lies in comparing and understanding the causes and consequences of terms such as a nation’s “level of democracy” that, to the lay-person, should be straightforward to understand and observe but prove to be elusive concepts that are difficult to measure.2
Whether survey items designed in one group or nation are equally valid or “mean the same thing” in other contexts often is overlooked. Coming up with a measure of racism in its modern form is difficult enough if we wish to understand its levels within the United States. Comparing the level of racism manifested by the Unites States population to what we might find in another country is an incredibly complex undertaking. Can racism scales designed for use in the United States work in other contexts simply by replacing the outgroup referent? How can scholars assess whether scales and latent variables used by social scientists possess cross-cultural validity?
This question of cross-context comparability is particularly important for cross-national comparative work, particularly as multi-nation surveys such as the European Social Survey (ESS), the Comparative Study of Electoral Systems (CSES), and the World Values Survey provide exciting opportunities to examine attitudes and behavior across national contexts. Yet only a small number of concepts on these surveys are subject to cross-cultural validation via Multigroup Confirmatory Factor Analysis (MGCFA). Examples include Reeskens and Hooghe, (2008) and Coromina and Peral (2020), who explore the three item ESS battery for political trust, and an exploration of the 2008–2009 ageism battery by Seddig, Maskileyson and Davidov (2020). Davidov et al. (2008) employ MGCFA to examine the cross-cultural validity of a battery of basic human values developed by Schwartz (1994). Many of these examples rely on assuming the variables are continuous, which is a concern as Lubke and Muthén (2004) show that treating ordinal indicators as continuous can be problematic in the analysis of multiple groups using structural equation modeling. An exception is Meuleman and Billiet (2012) who treat the scale of the 2002–2003 ESS immigration battery as ordinal in their study of the scale’s cross-national validity.
This paper combines an instructional and substantive aim: We demonstrate the use of MGCFA with ordinal indicators to show cross-national validity of less commonly used political efficacy measures. The paper is motivated by the work of Xena (2015) who suggests that the indicators for these concepts fielded as part of the ESS in the early 2000s lack cross-cultural validity. In light of these findings, we examine an alternative set of efficacy indicators developed by Craig, Niemi and their associates (Craig, Niemi and Silver 1990; Niemi, Craig and Mattei 1991). As we intend to write this article partially as an instructional tool, we build on the work of Millsap and Yun-Tein (2004), Temme (2006) and the efforts of Davidov et al. (2018) to describe the process for conducting MGCFA with ordinal data. Employing the Mplus software package, our analyses of alternative indicators for internal and external efficacy have almost the same structure across the two groups (in this case, the United States and Great Britain). This analysis leads to two key substantive findings. First, Britons express less political efficacy than their American counterparts. Second, there is higher within country variation in political efficacy for Americans. The paper concludes with suggesting the possibility to abandon the traditional indicators of political efficacy and derivatives thereof on future cross-national surveys and avenues to consider in further developing the alternative indicators employed in this paper.
2 Political Efficacy: A Contested Literature
The measurement of political efficacy matters because of the concept’s theoretical importance: an efficacious citizenry is more likely to confer legitimacy on political systems and avoid the types of disillusionment that generate civic and participatory decline, or worse outcomes such as illegal political activity or violent protest movements (Easton and Dennis 1967; Finifter 1970; Pateman 1970). However, testing theoretical claims across contexts requires validating that the measures themselves are valid across contexts.
Although early work treats efficacy as a uni-dimensional construct, Lane, (1959: 149) argues that efficacy “combines the image of the self and the images of democratic government” to suggest that two distinct concepts are important. Nonetheless, survey questions remained uni-dimensional. Classic analyses of data from the American National Election Studies (ANES) in the 1950s employ the following four items, asking respondents their levels of disagreement or agreement with the statements (cf. Campbell et al. (1954: 187–188)3: 1) I don’t think public officials care what people like me think; 2) Voting is the only way that people like me can have any say about the way the government runs things; 3) People like me don’t have any say about what the government does; and 4) Sometimes government and politics seem so complicated that a person like me can’t really understand what’s going on. Two additional statements appear on the ANES from 1968 to 1980 (Acock and Clarke, 1990): 5) Parties are only interested in people’s votes, not opinions; and 6) Generally speaking, those we elect to Congress in Washington loose touch with the people pretty quickly. The modern cross-national incarnation employed the first wave of the European Social Survey in 2002 utilises items 1, 4, and 5 and adds questions asking respondents (see Xena, 2015): 7) Do you think you could take an active role in a group involved with political issues? and 8) How easy is it to make up your mind about political issues?
Balch (1974) finds that items two and four have a modest correlation with conventional and unconventional participation and are nearly unrelated to attitudes towards political trust. In contrast, items one and three relate better to attitudes towards trust. This analysis further justifies treating efficacy as multi-dimensional: Items two and four are reflective of an individual’s “confidence in his own abilities regardless of political circumstances” and therefore a reflection of internal efficacy. Items one and three correspond to respondents’ beliefs about “the potential responsiveness of individuals” or external efficacy (Balch 1974: 24). As 5 and 6 enter the survey, Miller and Traugott, 1989 argue that item 3 (along with items two and 4) is now reflective of internal efficacy.
Analyzing ANES data from 1972 to 1976, Craig and Maggiotto (1982) question the conceptual validity of the indicators, particularly the idea that item four reflects the internal dimension. They argue that item two also is problematic because disagreement can be an efficacious response if the individual believes there are other avenues to effective political participation. Acock et al. (1985) argue that indicators are salvageable if researchers: 1) drop item 2, 2) specify items 3 and 4 as internal efficacy indicators, 3) assign items 5 and 6 as external efficacy indicators, and 4) allow item one to load on both latent dimensions. Using data from seven western countries, they find that model fit is adequate across groups, and the dimensions are appropriately associated with external validators. Subsequent research by Acock, Clarke, and colleagues employs these indicators to study the change in efficacy over the course of an election (Clarke and Acock, 1989), differences across levels of government in the Canadian system (Stewart et al., 1992), or in further validation exercises to cope with additional revisions to the ANES battery on the 1984 study (Acock and Clarke, 1990).
Xena’s (2015) research on the cross-national validity of a modified form of the traditional efficacy indicators designates items 4, 7, and 8 as reflective of internal efficacy and items one and 5 indicative of external efficacy. Single country CFAs testing fit of the data to this model across 21 European countries revels less than ideal model fit. Moreover, an examination of the factor loadings or relationships between the latent factors and the designated indicators reveals that the loadings of the pair linked to the external dimension to be reasonably stable in magnitude across countries. However, wide variation in the size of the three items designated to be reflective of internal efficacy mimics the problems Craig and Maggiotto (1982) identify using ANES data. Diagnostic statistics suggest that for some of the countries, certain statements hypothesized to be reflective of internal efficacy actually fit better when a path opens between indicators 4, 7, and/or eight and the latent external efficacy dimension. Results from invariance testing using the Multi-Group Confirmatory Factor Analysis (MGCFA) techniques we describe below lead Xena (2015: 67) to conclude that the indicators of “political efficacy used by the ESS [in] 2002 is not invariant across Europe, as partial invariance, required in the ordinal case to guarantee measurement equivalence is not supported.” Thus, comparing mean scores on the latent dimensions across nations is not comparing like-for-like.
The lack of cross-cultural validity for efficacy measures may require scholars to revisit previous findings. For example, closer inspection of Muller's (1970) classic five nation study examining the ability of efficacy to influence political participation reveals that loadings for efficacy indicators (generalised variants of numbers 3–5) vary considerably across nations. Thus, comparison of the latent variable scores across nations and in follow-up multivariate research may be invalid.
In the late 1980s, efforts to replace problematic indicators proceeded in a piecemeal fashion. Craig et al. (1990: 289–290) note that the ad hoc process and lack of consensus results both in a loss of cross-temporal and cross-national validity and “without rigorous prior testing” fails to reassure that substitute indicators are any more valid or reliable. The authors make use of the 1987 ANES Pilot Study as an instrument for revising items pertaining to trust and efficacy. Starting with the premise that efficacy is a multidimensional concept, internal efficacy should have relationships with campaign participation, political knowledge, and interest that exceeds that of external efficacy. In contrast, political trust should have a higher correlation with external efficacy. Six revised indicators for internal political efficacy emerged with relative ease (see Section 3 for wording) demonstrating hypothesized associations. Four indicators of external efficacy materialise, but Craig et al. (1990) are more tepid in unabashedly recommending them because they combine the concepts of belief that the regime and current political figures are responsive to the political desires of individual. Although some contend regime and incumbent based external efficacy differ, the researchers find that they perform well together as indicators of the single concept of external efficacy. A follow-up study analyzing the performance of the ten indicators as reflections of internal and external efficacy after their placement on the much larger 1988 ANES further validates their performance (Niemi et al., 1991).
The intention for these measures is that they are “comparable across times, places, and populations” (Craig et al., 1990: 296). Morrell (2003) conducts an extensive review and finds the internal efficacy indicators to perform well across a multitude of contexts but remains agnostic as to the utility of the four indicators for external efficacy. Furthermore, while Morrell indicates that researchers employ the revised internal efficacy indicators in a variety of contexts, formal testing of their cross-group and cross-national comparability is absent. The updated external efficacy indicators have yet to receive serious scrutiny. Given this shortcoming, we turn to subjecting the ten revised indicators to empirical tests of cross-cultural validity—multigroup analyses with representative samples drawn from populations of the United States and United Kingdom.
3 Data and Indicators
In late May and early June 2012, an online survey with a primary focus on the measurement of citizen attitudes towards international affairs was fielded to samples of respondents matched to the British and American populations.4 Indicators of internal and external efficacy are a carbon copy of those of Craig et al. (1990), and are presented below.
• Internal Efficacy:
1. I feel that I could do as good of a job in public office as most other people. (PUBOFF)
2. I think I am as well-informed about politics and government as most people. (INFORM)
3. I don’t often feel sure of myself when talking with other people about politics and government. (NOTSURE)
4. I feel that I have a pretty good understanding of the important political issues facing our country. (UNDERSTAND)
5. I consider myself well-qualified to participate in politics. (SELFQUAL)
6. Sometimes politics and government seem so complicated that a person like me can’t really understand what’s going on. (COMPLEX)
• External Efficacy:
1. There are many legal ways for citizens to successfully influence what the government does. (LEGAL)
2. Under our form of government, the people have the final say about how the country is run, no matter who is in office. (FINALSAY)
3. If public officials are not interested in hearing what the people think, there is really no way to make them listen. (MAKELSTN)
4. People like me don’t have any say about what the government does. (NOSAY)
Respondents receive the questions (along with others measuring political trust) on two separate grids and the item order rotates. There are six possible responses interviewees can provide to each item: Strongly Disagree, Disagree, Neither Agree nor Disagree, Agree, Strongly Agree, and Don’t Know. “Don’t Know” responses are coded as missing and the remainder of the scale is ordinal.5 Efficacious responses receive higher scores, so the NOTSURE, COMPLEX, MAKELSTN, and NOSAY indicators are reverse coded.
Table 1 compares the response distributions for the six hypothesized internal efficacy indicators for British and American respondents. For each statement, the dispersion of responses across the five categories differs significantly across the two nations. With the exception of British responses to the COMPLEX indicator, respondents in both groups are more likely than not to provide an efficacious response. At a glance, Americans appear, on the whole, more likely than their British counterparts to provide responses at the both extreme ends of the scale. As we discuss in the next section, this empirical result underscores the importance of taking into serious consideration the relationship between the hypothesized latent variable and indicator that comes via the factor loadings and the thresholds.
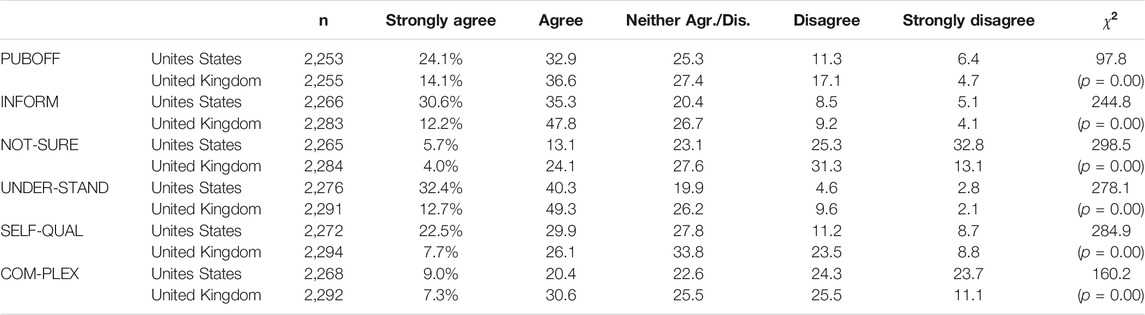
TABLE 1. Distributions of hypothesized internal efficacy indicators.
Table 2 tallies the responses, by country, to the statements hypothesized to be reflective of the external efficacy dimension. Again, Americans appear more likely than their British counterparts to provide answers at the endpoints of the scales. For each indicator, answers by country are statistically different from one another (although this is just so for the NOSAY indicator at
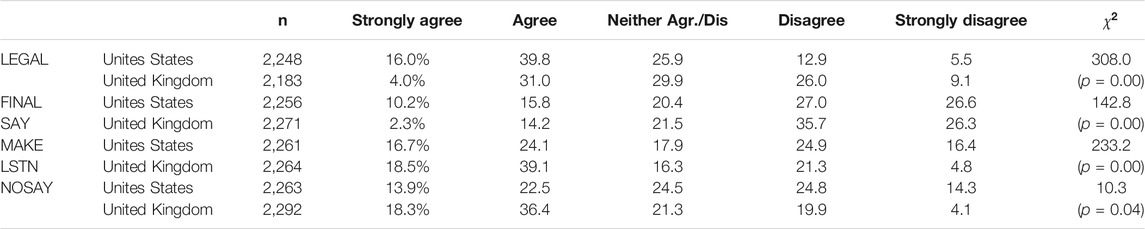
TABLE 2. Distributions of hypothesized external efficacy indicators.
4 Multi-Group Confirmatory Factor Analysis With Ordinal Data
4.1 Model Specifics
Parameters from the Multi-Group Confirmatory Factor Analysis (MGCFA) with ordinal data in Mplus are obtained via its Weighted Least Squares Estimator (WLSMV) that utilizes the ordered probit link function (Muthén and Muthén 2017). As implemented, respondents’ level of agreement or disagreement with the ten indicators is not directly a function of their location on the latent internal or external factors. The answers to the statements we observe instead are hypothesized to come indirectly via a continuous and multivariate normally distributed latent response variable,
Equation 1 states that an individual (i) for an indicator (j) in a group (g) has a position on the response variable,
Due to the joint estimation of the thresholds, intercepts, and factor loadings when data are ordinal, the procedures for MGCFA differ in substantive ways in comparison to procedures employed when the data for the observed indicators are continuous. For the latter, it is possible and often desirable to conduct MGCFA in sequential stages, first testing for equivalence and differences in the factor loadings (metric invariance) and then testing for the equality of item specific intercepts (scalar invariance) across groups (e.g. Meredith 1993; Little 1997). Metric invariance indicates that the underlying latent construct is the same across groups. When established after metric invariance, scalar invariance signals that individuals with the same values on a latent variable across groups will have the same observed value for the indicator across the groups (Hong et al., 2003).
For multi-group analyses with continuous observed data, the factor loadings alone are enough to establish the slopes linking latent variable to indicators. However, as Davidov et al. (2011:160) note, the resulting observed category responses on ordinal indicators are, as Eqs. 1, Eqs 2 imply, “jointly influenced by the factor loadings … [and] thresholds … [meaning] a distinction between metric and scalar invariance is not substantively meaningful [and] there [should be] only one step in the measurement invariance test, the step that constrains all parameters to be equal.” A difference in the magnitude of the factor loadings across groups is a difference in the strength of the relationship between the latent variable and continuous response variable, while dissimilarities in the thresholds signify that respondents in different groups must reach distinct levels on the response variable to move from one answer category to the next. Erroneously holding thresholds equivalent when they are not could force group differences to artificially appear in the loadings, leading researchers to draw the wrong conclusions about the substantive differences in the indicators. For our data, this distinction is important–recall from Tables 1, 2 that American respondents appear far more likely than their British counterparts to offer responses at the extreme ends of the ordinal scale; constraining thresholds to be equal might create artificial differences in the factor loadings. As we will see below, much of the observed differences are functions of unequal variances in the latent variables, with additional minor contributions from the unequal group variances of the errors for the ten indicators.
4.2 Model Constraints
The equations described above generate a model that is under-identified, meaning restrictions on some of the parameters are necessary before estimation is attempted. As is the case with single group CFA with continuous indicators, the latent variables in a MGCFA with ordinal variables must be scaled either by fixing the loading of one indicator per factor to 1.0 or the variances of the factors to 1.0. As the variance of the Internal and External latent factors is of interest, we choose the former. Much like MGCFA with continuous indicators, identification also necessitates setting the latent variable means for the internal and external efficacy factors,
Additional constraints are necessary when the indicators are ordinal and are dependent partially upon how the researcher wishes to parameterize the model. Mplus offers two options for MGCFA, the so-called “Delta” or “Theta” parameterisations, and the option selected determines some of the model constraints that must be imposed. Under the former, identification is achieved, in part, by setting the variances of the latent variables in the reference group all to 1.0. For substantive reasons, we find this empirically untenable and therefore choose the Theta parameterization that requires us, in the first instance, to fix the variance of the residuals for each indicator (
Following the suggestions of Millsap and Yun-Tein, (2004), we impose the following additional constraints to ensure model identification: 1) We hold lowest category threshold on each indicator (
The direction of travel is as follows: First, we take each group separately, and establish the validity of a two factor model of internal and external efficacy in both the United States and United Kingdom. We then combine the data and formally run MGCFA. First, we establish a baseline “Configural Model” where paths between the response variables and indicators (
The estimation and validation of the Configural Model produces a baseline
Below we show that a MGCFA model with equality constraints across the thresholds and indicators is tenable after the restriction which fixes the error variances for the observed indicators to 1.0 across groups is relaxed. Testing reveals, in the end, significant differences in the latent mean levels of internal or external efficacy and the relationship between the two in the United States and United Kingdom.
5 Valid Latent Models of Political Efficacy
5.1 Independent Models of Efficacy–United States and United Kingdom
Confirmatory Factor Analysis (CFA) allows formally testing whether the restrictions placed on the asymptotic covariance matrix by the choice of paths linking the latents to indicators are valid. Separate CFAs for the American and British samples produce models that fit the data poorly. The
The source of the poor fit lies with the reverse coded indicators, that is where disagreement with the statement is the more efficacious answer. When a third “methods” factor with freed paths to the reverse coded indicators is added to the model, fit improves substantially (Unites States:
Despite the vast improvement in model fit by adding a methods factor, substantive misfit remains. In the United Kingdom, PUBOFF, has a negative loading on the internal efficacy factor that is significant but with a magnitude which pales in comparison to the link between the indicator and the external efficacy dimension. Freeing this loading results in approximate fit statistics that suggest a reasonable fit to the data
Further improvements in fit are possible for both the Unites States and United Kingdom samples by allowing the errors of the indicators to correlate. We do not take this further step because doing so because would not only be atheoretical, but could potentially change the meanings of the latent variables, complicating comparisons across time and space. We proceed with a multi-group analysis of a model of political efficacy where the factor structure of the model is equivalent, save the single exception that the PUBOFF indicator loads on both dimensions in the United Kingdom and the NOTSURE indicator loads on both dimensions in the Unites States. (Standardised loadings and thresholds may be found in the Online Appendix, along with schematic representations of the hypothesized and final measurement models).
5.2 Configural Invariance
Step 1 in multi-group analysis reaffirms that model fit and structure are acceptable for both nations when CFAs for both groups are estimated simultaneously. Additionally, this estimation establishes an unrestricted model to serve as a basline model in the multigroup setting. As discussed above, testing for simple “configural” invariance involves obtaining parameters from a model where the structure is the same but both factor loadings and thresholds obtained via ordered probit are allowed to vary across groups.9 Applying this step in our case produces a model with acceptable approximate fit to the data. The combined
Table 3 presents the standardized loadings of each of the indicators on the two dimensions, by country.10 In both the United States and the United Kingdom, the six indicators hypothesized to load on the internal efficacy dimension do so and we judge them to be significant manifestations of the latent dimensions. Although things can change when equality constraints are placed on the loadings and thresholds, a first glance at the table shows the primary loadings to be similar across the two nations. In a departure from the high correlations we see when employing the traditional indicators of internal and external efficacy (e.g., Acock and Clarke 1990), the correlations between the dimensions are modest in the case of the United States and the two dimensions are nearly orthogonal to one another in the United Kingdom group. The unstandardised variances reported in the bottom half of Table 3 suggest that respondents in both groups are more dispersed on the internal efficacy dimension and that the latent levels of both types of efficacy for Americans is more dispersed, possibly a function of the greater number of group respondents who provide “strongly agree” or “strongly disagree” responses to the ten statements.
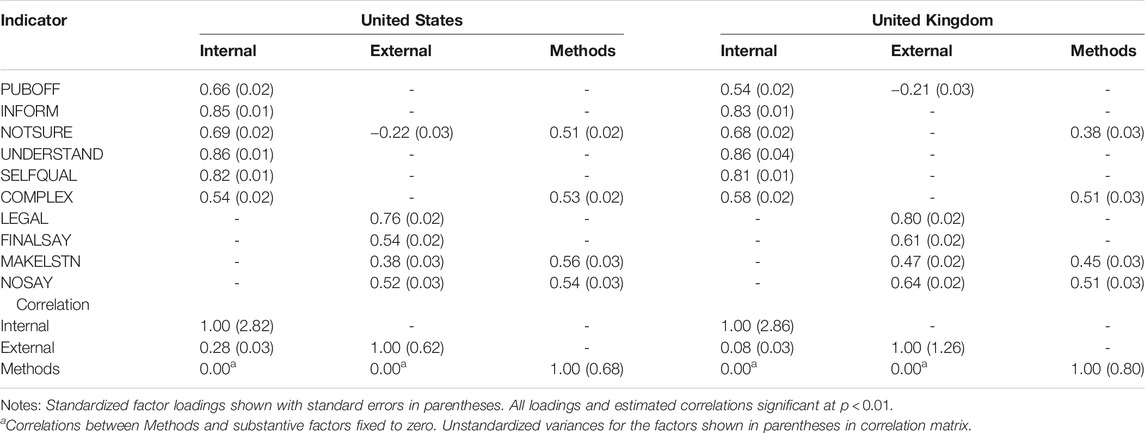
TABLE 3. Configural model: Factor loadings.
Loadings of the four indicators hypothesized to load on the external efficacy dimension differ slightly more, and while MAKELSTN is a significant reflective indicator of external efficacy in the United States, the magnitude of the loading is quite modest. The methods factor absorbs measurement error that comes about as a result of the reverse direction of these statements (or other common extraneous covariance that may exist among these indicators). Even after controlling for this form of error, the loadings of these statements on the substantive latent variables are as predicted. Nonetheless, the magnitude of the loadings of these statements on the methods factor is large and, in the case of the NOSAY and MAKELSTN indicators in the Unites States group greater than the size of the loadings on the predicted external efficacy dimension. We return to this particular finding in the discussion.
Table 4 lists the standardized thresholds for each indicator. Interpretation is a bit challenging—they are the z-score or standard scores obtained when the factor scores are zero. Not surprisingly, a conversion of the z-scores into probabilities reveals very low probabilities of obtaining points at the extreme (strongly agree, strongly disagree) ends of the scale. Take the “INFORM” indicator that has an estimated threshold splitting category 1 (strongly disagree to disagree) of
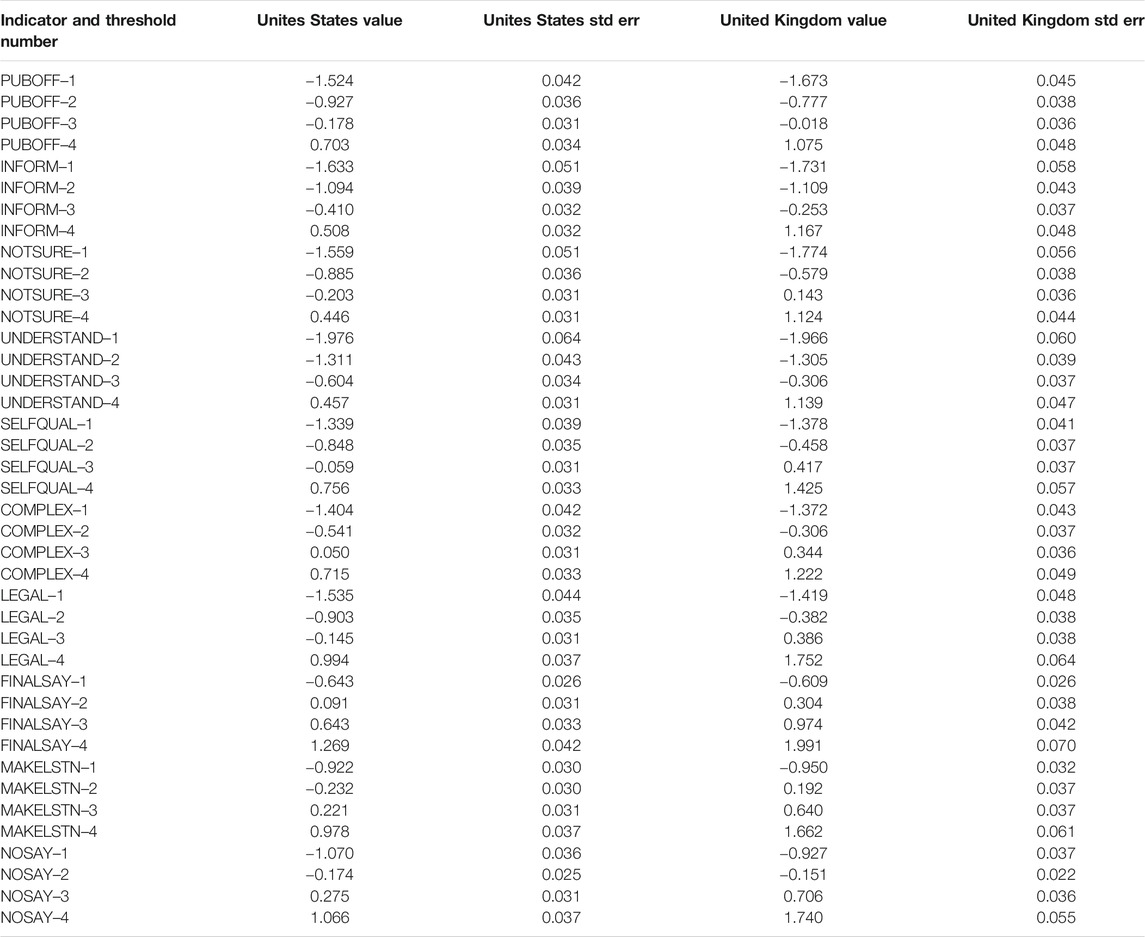
TABLE 4. Configural model: Unites States and United Kingdom thresholds.
5.3 Models With Equality Constraints
When examining models with equality constraints, we first compare a very restrictive model to the configural baseline estimated above. Model A restricts all thresholds, factor loadings, and means to be equal across the two groups. As shown in the Appendix, the magnitudes of the parameters do not change dramatically, but the fit of the model is poor (
An inspection of the Mplus output Modification Indices (MIs), which constitute empirical suggestions as to the contribution of each model restriction to the overall
Model B retains equality constraints on all factor loadings and thresholds but sacrifices an adjusted four degrees of freedom by allowing the latent means to vary across the two countries. The result is that fit improves dramatically:
Parameter estimates provided by Model B with the large number of equality constraints generates a model with approximate fit to the data. However, compared to the modified configural model where latent means are freed, the fit is still worse
Model C frees the ten error variances in the United Kingdom group, and the exact and approximate fit statistics generated by this model are promising:
An examination of the remaining MIs from the output of Model C suggests that the fixed paths contributing to large spikes in the
An inspection of the factor loadings from Model C in Table 5 demonstrates a pattern similar to the initial configural model presented in Table 3. Comparing these tables, loadings are generally within 0.02 of a standardized unit from one another. It is important to emphasize that the unstandardized loadings are equivalent across groups, but because we allow other elements of the model to vary freely across groups, the standardized loadings vary.
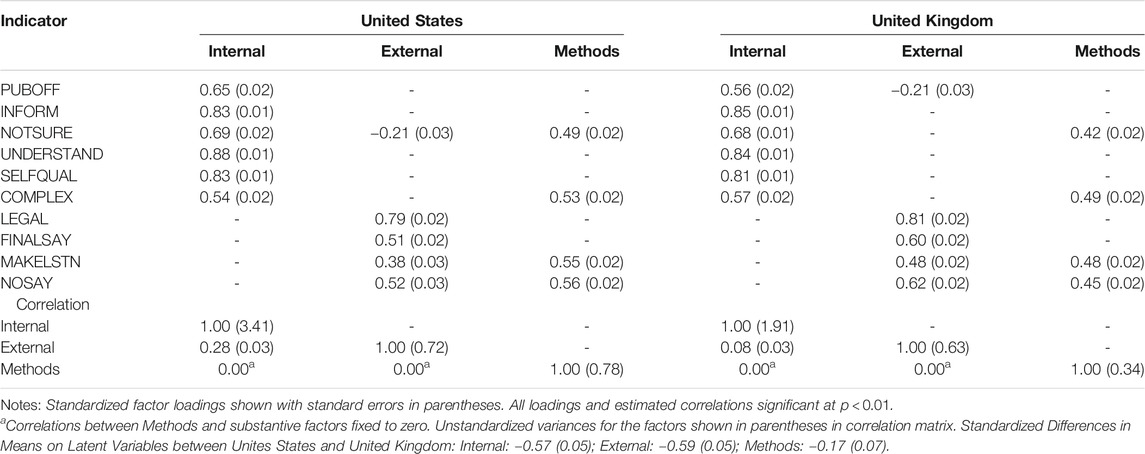
TABLE 5. Final model (C): Factor loadings and variance matrix.
The bottom half of Table 5, however, reveals important aspects to distinguish the groups. The unstandardised variance of the internal efficacy factor (3.41) in the Unites States group is more than 175% greater than what we see in for the United Kingdom group (1.91). On the external efficacy dimension, dispersion in the Unites States (0.72) also is slightly greater than that obtained in the United Kingdom (0.63). As is the case in earlier model iterations, the correlations between the internal and external latent variables in Model C is much lower than what we see when the traditional efficacy indicators are employed. Similar to the initial models, there is a modest positive correlation between the two substantive dimensions in the US and only a slight association between the two in the United Kingdom. Finally, the standardized mean differences on the two substantive dimensions is large and statistically significant–in a measurement model that is nearly equivalent across groups, Britons come out with levels of internal and external efficacy that are, on average, more than half a standardised unit below their American counterparts.14
The standardized thresholds for Model C, as reported in Table 6 do differ across groups, sometimes to a greater degree then we observe in Table 4. Again, this can be explained by the fact that there are substantial differences in the factor means, variances, and covariances in the Unites States and United Kingdom cases. In the United Kingdom, the standardized thresholds still allow us to predict the breakdown of responses to the statements we are likely to observe when an individual has a score of 0.0 on the latent Internal and/or External (and/or Methods) dimension(s). However, recall that Model C allows means to vary, and the British, on average, score significantly lower on the substantive latent dimensions. Hence a British respondent with a score(s) of 0.0 on the latent dimension(s) is one that has higher levels of political efficacy than the average United Kingdom respondent.
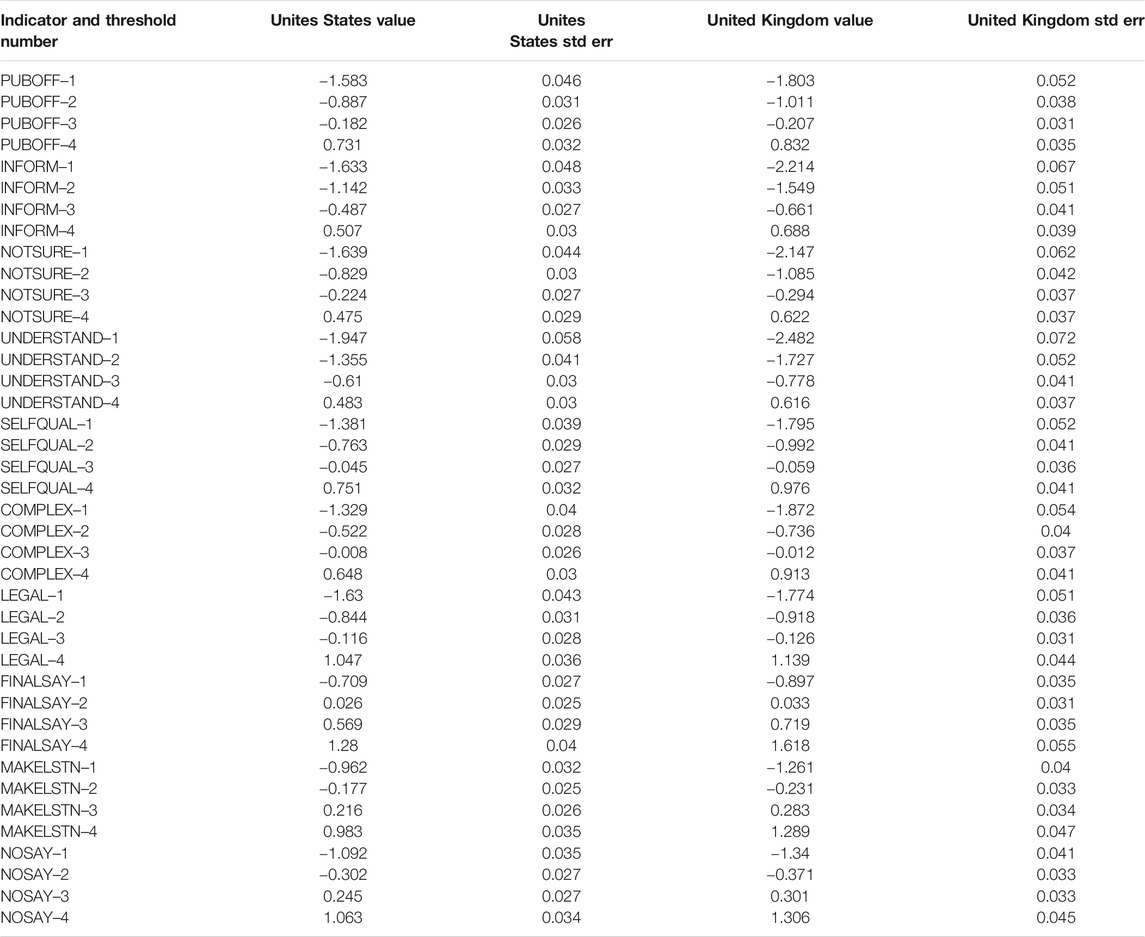
TABLE 6. Standardized thresholds to accompany Table 5.
Table 7 shows the standardized error variances for each of the indicators that this model allows to vary across groups. As is common across the social sciences, these estimates are all statistically significant which signifies the factors do not explain all the variation in responses to the ten indicators. The differences in the magnitudes of the standardized error variances across groups also varies.
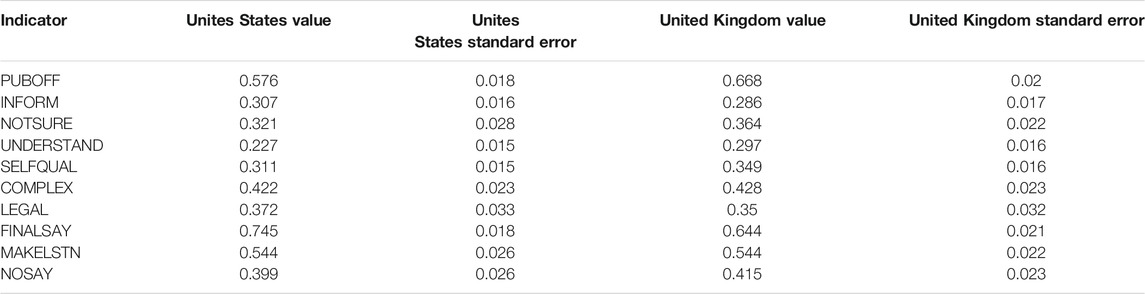
TABLE 7. Standardized indicator error variances to accompany Table 5.
Further iterations of the model explore the viability of placing constraints on the covariance between the internal and external ifficacy indicators, the variances of the three latent variables and re-establishing the equivalence constraint on the latent variable means for the Methods factor. All restrictions on the variance/covariance matrix are untenable. The equivalence restriction on the average score of the Methods factor produced a difference test that just creeps into the realm making the fit of the model significantly worse at
6 Substantive Discussion
Political efficacy receives pride of place in many models of political participation and, in the case of cross-cultural group or country comparisons, some suggest that efficacy is an important signal of the health of representative democracies or anomie among marginalised groups. Large cross-cultural studies of political and social behaviour such as the Comparative Study of Electoral Systems (CSES) and European Social Survey (ESS) still employ the traditional indicators of political efficacy. In empirical analyses utilizing the techniques described above, cross-national comparisons by Xena (2015) finds such indicators do not perform well.
Work by Richard Niemi, Stephen Craig, and their associates (1990, 1991) argue for a set of indicators they believe to clearly reflect the latent concepts of internal and external efficacy and better distinguish between the two. Subsequent work by Morrell (2003) reviews use of their revised indicators in the literature and conducts his own analyses to attest to their internal and external validity, particularly insofar as internal efficacy is concerned. However there is still much work to be done in the area of cross-cultural validation. A failure to do so leaves open the possibility that we are comparing apples to oranges when discussing how efficacy affects politics and political systems.
The above analyses scratch the surface of cross-nationally validating the indicators in two English speaking longstanding democracies, using multi-group confirmatory factor analysis (MGCFA). Although MGCFA dates back to the work of Jöreskog (1971), the ordinal nature of the response choices for the revised indicators necessitate techniques appropriate for the measurement level of the variables. Building on the work of Millsap and Yun-Tein, (2004), Temme (2006), and Davidov et al. (2011, 2018), Section 4 details the ordinal probit model the widely used software package, Mplus, utilizes to obtain parameters for the MGCFA. Attention is given to the constraints necessary to identify the model, and the importance for considering both the equivalence of factor loadings and thresholds in a simultaneous fashion. This is an important departure from the separate steps of metric and scalar invariance those conducting MGCFA with continuous indicators employ.
When we conduct analyses with the appropriate techniques for analyzing latent variable models with ordinal indicators, we demonstrate that the alternative indicators perform extremely well, with separate confirmatory factor models for Unites States and United Kingdom data fitting the hypothesized model with the exception of a single separate substantive dual loading in each group (and the need to designate a “methods” factor for reverse coded indicators). We use MGCFA to demonstrate that, save the exception of the dual loading of NOTSURE on external efficacy in the US and PUBOFF on external efficacy in the United Kingdom, the models have statistically equivalent loadings and thresholds on all three latent variables.
The equivalence of the loadings and thresholds allow us to free the latent variable means, and it is clear that Britons have much lower levels of both internal and external efficacy than do their American counterparts. Americans vary more in their latent levels of political efficacy then do Britons. Finally, in what we believe is a first in the literature, we leverage the equality constraints on the loadings and thresholds to free the error variances on the indicators. Although the indicator variances significantly vary across groups, the standardized estimates presented in Table 7 suggest that the magnitude of these differences is relatively small. This leads to an important substantive point: Recall from Tables 1, 2 that the observed distributions of the American responses to the ten indicators vary more than those of the Britons. The equality of loadings and thresholds coupled with the large differences in the latent variances on both substantive and the “Methods” dimensions suggest that the variation we observe is a function of “true” latent variation on the dimensions.
The analyses presented in this paper do not free us from some remaining substantive questions concerning the measurement of political efficacy using the revised indicators. The final model presented in Table 5 produces standardised estimates for MAKELSTN that are below 0.5 in both groups and the loadings for most of the indicators on the external efficacy dimension are lower than those designated as reflective of the internal efficacy dimension. Previous work gives considerably more attention to the robustness of the latter (see Morrell 2003), and future work may wish to ask whether it is time to pay closer attention to the former. Craig et al. (1990) contend that the four indicators on this dimension appropriately combine citizen beliefs concerning “Incumbent” and “Regime” based efficacy. The modest loadings we observe may end up being a function of trying to combine two concepts that, especially in recent times, are distinct. In both the United Kingdom and United States, support for politicians are at all time lows but support for institutions of government remains comparatively stronger.
Models of internal and external efficacy utilizing the traditional indicators yield correlations between the two dimensions that are sometimes greater than 0.90, and this calls into question the ability of the indicators to distinguish between the two concepts. In sharp contrast, the correlations we report above are much more modest. In the United States, the correlation of 0.28, exactly matches the coefficient obtained by Craig et al. (1990) a quarter century ago. In the United Kingdom, the dimensions are nearly orthogonal. There are competing theoretical arguments as to whether the dimensions should be distinct or interrelated. Coleman and Davis, (1976: 191–193) believe in the close association, noting “[individuals] who believe the system is responsive to people like themselves will be more likely to believe that they personally have the skills to induce government officials to act.” In contrast, Craig and Maggiotto (1982) contend that there is no reason that beliefs about internal “political effectiveness” should be related to attitudes concerning “system responsiveness”. Further theoretical and empirical work is necessary to adjudicate between these rival viewpoints.
We would be remiss if we did not remark on the magnitude of loadings the negatively worded indicators on the Methods Factor, some of which are higher than the substantive loadings of the indicators in question. The agree-disagree statements were put to respondents in a grid based format delivered via an internet survey. Consistent with Kaminska et al. (2010), this finding suggests that a not insignificant number of respondents likely engaged in “satisficing” or quickly filling out a pattern of answers regardless of question content to move to the next screen. The inclusion of the Methods Factor allows us to “purge” the substantive factors of measurement error likely related to satisficing. However, the need for a “Methods Factor” reinforces the argument that the use of grids in survey questionnaires have tradeoffs–they allow respondents to move through a survey more quickly and this allows more questions to be placed on the survey, but this decision comes at the cost of increased measurement error related to question ordering. On a more positive note, the similarity in the structure of this “nuisance” factor across the two groups suggests that representative samples of respondents in the United States and United Kingdom in approach grid based questionnaires in a similar manner.
These potential problems notwithstanding, Xena’s (2015) finding that the traditional indicators found on cross-national surveys such as the ESS are completely lacking in cross-cultural validity and our analysis that the revised indicators for internal and external efficacy are equivalent across two major English speaking democracies suggest that the modified indicators are a better jumping off points for future (minor) revisions to the battery. Future work should also extend MGCFAs to include non-English speaking countries. If, with the addition of additional nations, equivalence holds, the latent dimensions with the revised indicators can be put to use in testing aggregate or multilevel theories concerning the role of nationwide and individual efficacy levels play in a variety of contexts.
7 Methodological Conclusion: Was It Worth It?
As this manuscript demonstrates, multi-group analysis where indicator continuity cannot be assumed is a complex process. We hope the above provides a useful guide to the mathematical basis and procedure for multi-group invariance testing with ordinal data. Whether to treat data as ordinal or continuous remains a contentious debate and disciplinary practices vary. Given differences, the results of a single, two-group comparison cannot form the basis for a definitive answer. The procedure chosen may lie with the question the researcher is attempting to answer. Recall that Table 1 indicates cross-group (UK-US) differences in the intensity of ordinal responses to the indicators, with Unites States respondents more likely to indicate that they Agree or Disagree “strongly” to the items. If researcher interest concerns substantive reasons behind the difference in observed preferences, then the only way of attacking the problem would be to treat the indicators as ordinal.
Countering this purposive reason to treat our data as ordinal, Robitzsch (2020) notes that the assumptions underlying the construction of factor scores when the indicators are treated as continuous or ordinal are quite different, and only through examining the covariance of the efficacy factors with known correlates can the researcher evaluate whether treating the indicators as ordinal are superior to more simplistic assumptions of continuity. External validation of the factors is beyond the scope of this article, but we ran supplementary estimations of Models A-C that employ Robust Maximum Likelihood estimators and treat the indicators as continuous. Results suggest that if we put aside the complexities of factor scoring, full structural models employing the efficacy measures as predictors should behave quite similarly. Differences in the latent variable means and variances are minor, and the fit of the models employing MLR estimator are similar. In short, the decision on how to treat the measurement of indicators in multigroup analysis is one driven both by substantive and statistical assumptions and questions that often lie with the researcher and research question at hand.
Data Availability Statement
The datasets presented in this study can be found in online repositories. The names of the repository/repositories and accession number(s) can be found below: https://reshare.ukdataservice.ac.uk/851142/.
Ethics Statement
The studies involving human participants were reviewed and approved by the University of Essex, ethics committee. Survey respondents consisted of those who voluntarily opted into the YouGov panel, and the neither identity of survey respondents nor identifying information was made available to the authors.
Author Contributions
TS wrote the initial version of the article, read up on the technical aspects of multi-group analysis with ordinal variables and ran the analyses in Mplus. TS was a principal investigator on the survey that collected the data used in the analyses presented in this paper. CX conducted extensive research that identified the problem of considerable cross-cultural variance in the political efficacy indicators on the European Social Survey, which motivated the paper and assisted in the writing and editing of the first draft. JR was a co-designer of the survey that collected the data and extensively edited a revised version of the article that constitutes our submission.
Funding
The ESRC funded the surveys that generated the data used in the paper and TS’s time on the project. Funding for this project was provided by ESRC Grant #RES-061-25-0405.
Conflict of Interest
The authors declare that the research was conducted in the absence of any commercial or financial relationships that could be construed as a potential conflict of interest.
Footnotes
1For a discussion on symbolic racism see, e.g., Tarman and Sears (2005) and Gomez and Wilson (2006); and for civic engagement and life satisfaction conceptualised as latent variables, see Brehm and Rahn (1997).
2For a discussion of democracy as an unobserved latent variable, see Bollen and Jackman (1989); for a trenchant critique concerning the measurement assumptions behind the measurement assumptions commonly made when conducting multivariate research, see Treier and Jackman (2008).
3ANES studies included additional survey questions to measure efficacy, but these four are those that persistently appear in published research.
4Fieldwork conducted by YouGov and this wave constitutes the second in a series of the multi-country panel studies. The effective sample size for the British sub-sample is 2,318 and the effective sub-sample size for the American group is 2,295. Funding for the surveys came from ESRC Grant RES-061–25–0405, and support for Scotto and Xena’s time on the project comes from the ESRC Research Centre on Micro-Social Change (MISOC) at Essex.
5In the multivariate analyses, the “pairwise present” method of recovering missing observations, as implemented in Mplus for the WLSMV estimator, is employed. Over 90% of each element of the asymptotic variance-covariance matrix for each group is observed.
6In our case, the group, g, either is the United States or Great Britain and the specific factor, p, either is the internal or external efficacy dimension. As we discuss below, for model fitting purposes, we require a third “Methods” factor to be added to the hypothesized model. Thus p ranges from one to three in the final model.
7As a reminder, the variances on the latent variables and the covariance between the internal and external efficacy dimensions are free across groups, and we fix initially the error variances on all of the ten indicators to 1.0 in both groups.
8The Comparative Fit Index (CFI) compares the estimated model to one where all indicators are uncorrelated via the
9Technically, we only test for partial invariance because of the dual loadings of the PUBOFF indicator in the United Kingdom and NOTSURE indicator in the US. To avoid wordiness, we do not always reference this below. For the testing of latent mean differences and differences in the magnitude of the errors, minor violations of strict invariance usually are judged as permissable (cf. Steenkamp et al. (2010)).
10Although the unstandardized factor loadings for the UNDERSTAND and NOSAY indicators are fixed to 1.0 and the bottom two thresholds for these indicators are set to equality across groups (as are the lowest thresholds for all indicators), the standardized loadings of fixed parameters are not equivalent across the groups. This is because standardization takes into account parameters that are not fixed to equality (e.g. the variances of the latent variables).
11The
12The standardized difference in latent variable means for the Methods Factor is -0.19
13Contribution to the
14The mean difference on the Methods Factor just crosses into the realm of statistical significance–We interpret the difference as meaning Britons are slightly less prone than their American counterparts to fall into the “trap” of acquiescence bias. However, the robust and equivalent loadings of these negatively phrased questions on the Methods factor across the two groups leaves little doubt of its presence on representative samples of internet respondents in both nations.
References
Acock, A. C., and Clarke, H. D. (1990). Alternative Measures of Political Efficacy: Models and Means. Qual. Quantity 24 (1), 87–105. doi:10.1007/bf00221386
Acock, A., Clarke, H. D., and Stewart, M. C. (1985). A New Model for Old Measures: A Covariance Structure Analysis of Political Efficacy. J. Polit. 47 (4), 1062–1084. doi:10.2307/2130807
Asparouhov, T., Muthén, B., and Muthén, B. O. (2006). Robust Chi Square Difference Testing with Mean and Variance Adjusted Test Statistics. matrix 1 (5), 1–6.
Balch, G. I. (1974). Multiple Indicators in Survey Research: The Concept “Sense of Political Efficacy”. Polit. Methodol. 1, 1–43.
Bollen, K. A., and Jackman, R. W. (1989). Democracy, Stability, and Dichotomies. Am. Sociological Rev. 54, 612–621. doi:10.2307/2095882
Brehm, J., and Rahn, W. (1997). Individual-level Evidence for the Causes and Consequences of Social Capital. Am. J. Polit. Sci. 41, 999–1023. doi:10.2307/2111684
Byrne, B. M. (1994). Structural Equation Modeling with EQS and EQS/Windows: Basic Concepts, Applications, and Programming. Thousand Oaks: Sage.
Clarke, H. D., and Acock, A. C. (1989). National Elections and Political Attitudes: The Case of Political Efficacy. Br. J. Polit. Sci 19 (4), 551–562. doi:10.1017/s0007123400005639
Coleman, K. M., and Davis, C. L. (1976). The Structural Context of Politics and Dimensions of Regime Performance. Comp. Polit. Stud. 9 (2), 189–206. doi:10.1177/001041407600900203
Coromina, L., and Bartolomé Peral, E. (2020). Comparing Alignment and Multiple Group CFA for Analysing Political Trust in Europe during the Crisis. Methodology 16 (1), 21–40. doi:10.5964/meth.2791
Craig, S. C., Niemi, R. G., and Silver, G. E. (1990). Political Efficacy and Trust: A Report on the NES Pilot Study Items. Polit. Behav. 12 (3), 289–314. doi:10.1007/bf00992337
Davidov, E., Datler, G., Schmidt, P., and Schwartz, S. H. (2011). Testing the Invariance of Values in the Benelux Countries with the European Social Survey: Accounting for Ordinality. Cross-Cultural Anal. Methods Appl., 149–168.
Davidov, E., Schmidt, P., Billiet, J., and Meuleman, B. (2018). Cross-cultural Analysis: Methods and Applications. Oxfordshire, England: Routledge.
Davidov, E., Schmidt, P., and Schwartz, S. H. (2008). Bringing Values Back in: The Adequacy of the European Social Survey to Measure Values in 20 Countries. Public Opin. Q. 72 (3), 420–445. doi:10.1093/poq/nfn035
Easton, D., and Dennis, J. (1967). The Child'S Acquisition of Regime Norms: Political Efficacy. Am. Polit. Sci. Rev. 61 (1), 25–38. doi:10.2307/1953873
Finifter, A. W. (1970). Dimensions of Political Alienation. Am. Polit. Sci. Rev. 64 (2), 389–410. doi:10.2307/1953840
Gomez, B. T., and Wilson, J. M. (2006). Rethinking Symbolic Racism: Evidence of Attribution Bias. J. Polit. 68 (3), 611–625. doi:10.1111/j.1468-2508.2006.00449.x
Hong, S., Malik, M. L., and Lee, M.-K. (2003). Testing Configural, Metric, Scalar, and Latent Mean Invariance across Genders in Sociotropy and Autonomy Using a Non-western Sample. Educ. Psychol. Meas. 63 (4), 636–654. doi:10.1177/0013164403251332
Jöreskog, K. G. (1971). Simultaneous Factor Analysis in Several Populations. Psychometrika 36 (4), 409–426. doi:10.1007/bf02291366
Kaminska, O., McCutcheon, A. L., and Billiet, J. (2010). Satisficing Among Reluctant Respondents in a Cross-National Context. Public Opin. Q. 74 (5), 956–984. doi:10.1093/poq/nfq062
Kline, R. B. (2005). Principles and Practice of Structural Equation Modeling. Vol. 366, New York, NY: Gilford Publications.
Little, T. D. (1997). Mean and Covariance Structures (MACS) Analyses of Cross-Cultural Data: Practical and Theoretical Issues. Multivariate Behav. Res. 32 (1), 53–76. doi:10.1207/s15327906mbr3201_3
Lubke, G. H., and Muthén, B. O. (2004). Applying Multigroup Confirmatory Factor Models for Continuous Outcomes to Likert Scale Data Complicates Meaningful Group Comparisons. Struct. Equation Model. A Multidisciplinary J. 11 (4), 514–534. doi:10.1207/s15328007sem1104_2
Meredith, W. (1993). Measurement Invariance, Factor Analysis and Factorial Invariance. Psychometrika 58 (4), 525–543. doi:10.1007/bf02294825
Meuleman, Bart., and Billiet, Jaak. (2012). Measuring Attitudes toward Immigration in Europe: The Cross–Cultural Validity of the ESS Immigration Scales. Ask. Res. Methods 21 (1), 5–29.
Miller, W. E., and Traugott, S. (1989). American National Election Studies Data Sourcebook, 1952-1986. Cambridge: Harvard University Press.
Millsap, R. E., and Yun-Tein, J. (2004). Assessing Factorial Invariance in Ordered-Categorical Measures. Multivariate Behav. Res. 39 (3), 479–515. doi:10.1207/s15327906mbr3903_4
Morrell, M. E. (2003). Survey and Experimental Evidence for a Reliable and Valid Measure of Internal Political Efficacy. Public Opin. Q. 67 (4), 589–602. doi:10.1086/378965
Muller, E. N. (1970). Cross-national Dimensions of Political Competence. Am. Polit. Sci. Rev. 64 (3), 792–809. doi:10.2307/1953463
Muthén, L. K., and Muthén, B. (2017). Mplus User's Guide: Statistical Analysis with Latent Variables, User's Guide.
Niemi, R. G., Craig, S. C., and Mattei, F. (1991). Measuring Internal Political Efficacy in the 1988 National Election Study. Am. Polit. Sci. Rev. 85, 1407–1413. doi:10.2307/1963953
Reeskens, T., and Hooghe, M. (2008). Cross-cultural Measurement Equivalence of Generalized Trust. Evidence from the European Social Survey (2002 and 2004). Soc. Indicators Res. 85 (3), 515–532. doi:10.1007/s11205-007-9100-z
Robitzsch, A. (2020). Why Ordinal Variables Can (Almost) Always Be Treated as Continuous Variables: Clarifying Assumptions of Robust Continuous and Ordinal Factor Analysis Estimation Methods. Front. Educ. 5, 177. doi:10.3389/feduc.2020.589965
Schwartz, S. H. (1994). Are there universal aspects in the structure and contents of human values? J. Soc. Issues 50 (4), 19–45. doi:10.1111/j.1540-4560.1994.tb01196.x
Seddig, D., Maskileyson, D., and Davidov, E. (2020). The Comparability of Measures in the Ageism Module of the Fourth Round of the European Social Survey, 2008-2009. Surv. Res. Methods 14, 351–364. doi:10.18148/srm/2020.v14i4.7369
Steenkamp, J. B. E., De Jong, M. G., and Baumgartner, H. (2010). Socially Desirable Response Tendencies in Survey Research. J. Mark. Res. 47 (2), 199–214.
Stewart, M. C., Kornberg, A., Clarke, H. D., and Acock, A. (1992). Arenas and Attitudes: A Note on Political Efficacy in a Federal System. J. Polit. 54 (1), 179–196. doi:10.2307/2131649
Tarman, C., and Sears, D. O. (2005). The Conceptualization and Measurement of Symbolic Racism. J. Polit. 67 (3), 731–761. doi:10.1111/j.1468-2508.2005.00337.x
Temme, D. (2006). “Assessing Measurement Invariance of Ordinal Indicators in Cross-National Research,” in International advertising and communication (Berlin: Springer), 455–472.
Treier, S., and Jackman, S. (2008). Democracy as a Latent Variable. Am. J. Polit. Sci. 52 (1), 201–217. doi:10.1111/j.1540-5907.2007.00308.x
Keywords: cross-cultural validity, political efficacy, structural equation analyses, latent variable analyses, survey research
Citation: Scotto TJ, Xena C and Reifler J (2021) Alternative Measures of Political Efficacy: The Quest for Cross-Cultural Invariance With Ordinally Scaled Survey Items. Front. Polit. Sci. 3:665532. doi: 10.3389/fpos.2021.665532
Received: 08 February 2021; Accepted: 21 June 2021;
Published: 16 July 2021.
Edited by:
Katharina Meitinger, Utrecht University, NetherlandsReviewed by:
Márton Bene, Hungarian Academy of Sciences (MTA), HungaryEldad Davidov, University of Cologne, Germany
Copyright © 2021 Scotto, Xena and Reifler. This is an open-access article distributed under the terms of the Creative Commons Attribution License (CC BY). The use, distribution or reproduction in other forums is permitted, provided the original author(s) and the copyright owner(s) are credited and that the original publication in this journal is cited, in accordance with accepted academic practice. No use, distribution or reproduction is permitted which does not comply with these terms.
*Correspondence: Thomas J. Scotto, VGhvbWFzLlNjb3R0b0BnbGFzZ293LmFjLnVr