 Zixuan Nie
 Jikai Ma
 Chengkun Wang
 Ming Tang
 Ting Jia1,2
 Guoxiang Liao
 Lu Zhang
- 1Jiangxi Provincial Key Laboratory of Subtropical Forest Resources Cultivation, College of Forestry, Jiangxi Agricultural University, Nanchang, China
- 22011 Collaboration Innovation Center of Jiangxi Typical Trees Cultivation and Utilization, College of Forestry, Jiangxi Agricultural University, Nanchang, China
- 3Jiangxi Provincial Key Laboratory of Improved Variety Breeding and Efficient Utilization of Native Tree Species, College of Forestry, Jiangxi Agricultural University, Nanchang, China
Introduction: Meliaceae, a significant group in Sapindales, possesses material and medicinal value due to its applications in timber and bioactive compounds. However, the high morphological diversity of the Meliaceae species and the lack of comparative studies of chloroplast (cp) genomes have led to great challenges in the classification and identification of Meliaceae species.
Methods: In this study, we sequenced the complete cp genomes of three Toona species (Toona fargesii, Toona ciliata, and Toona sinensis), and conducted comparative analyses of these cp genomes along with 29 previously published cp genomes of Meliaceae. Additionally, we performed the phylogenetic analyses and estimated the divergence times of Meliaceae.
Results: The cp genomes of 32 Meliaceae species ranged from 158,558 bp to 160,978 bp in length. Specifically, the cp genomes of Toona varied from 159,242 bp to 159,617 bp in length. These cp genomes contained a total of 135 unique genes, comprising 90 protein-coding, 8 rRNA, and 37 tRNA genes. Divergence time estimation revealed that the Meliaceae family diverged into two subfamilies (Cedreloideae and Melioideae) approximately 72.92 Ma (95% HPD: 60.62-87.01 Ma) in the Late Cretaceous. The diversification of Cedreloideae (47.86 Ma, 95% HPD: 47.42-48.22 Ma) occurred later than that of Melioideae (66.60 Ma, 95% HPD: 55.41-79.73 Ma). Furthermore, comparative genomic analysis identified 52 to 116 simple sequence repeats (SSRs) and twelve highly variable regions (HVRs) found among the cp genomes of Meliaceae.
Discussion: Divergence time estimation indicates that most Meliaceae species have a relatively recent origin, with rapid divergence occurring during the Late Oligocene or Early Miocene epochs. Comparative analysis of cp genomes revealed that Meliaceae exhibits relative conservation in terms of cp genome size, inverted-repeat (IR) boundary, genome structure, HVRs and codon patterns. Although differences exist between the Cedreloideae and Melioideae subfamilies, the overall similarity remains notably high. Furthermore, the ycf1, trnK-rps16, and ndhF-rpl32 regions exhibited the highest nucleotide polymorphism within Meliaceae, while the rpl22 gene displayed significant genetic diversity within both subfamilies. As candidate molecular markers, these regions may effectively distinguish among species. These findings not only provide insights into the evolution and species identification but also establish a scientific foundation for future systematics within Meliaceae.
1 Introduction
Meliaceae is a family of flowering plants that includes both trees and shrubs. It comprises 51 genera and 778 species and is widely distributed across tropical and subtropical regions (Laino Gama et al., 2021). Moreover, the majority of Meliaceae members are commercially valued timber trees, primarily belonging to the subfamily Cedreloideae (such as Khaya, Swietenia, Entandrophragma, Cedrela, and Toona) (Koenen, 2011). Furthermore, the Meliaceae family encompasses several economically valuable species with edible, medicinal, and ornamental values (such as Azadirachta indica, Lansium domesticum, and Melia azedarach). The diversity of fruit, floral, and seed morphologies within Meliaceae is remarkable and frequently influenced by environmental factors. The leaves include two morphologies: pinnately compound and simple (rarely); the inflorescences are typically thyrses, while racemose and spicate forms are relatively rare; the anthers are generally fused to form a tubular structure; the fruits of this family encompass capsules, berries, drupes, and nuts (rarely) (Yadav et al., 2015). Consequently, the phylogeny and infrageneric division of Meliaceae have been contentious, attracting extensive research. Originally, Pennington and Styles (1975) proposed that the Meliaceae family be divided into four subfamilies (Melioideae, Cedreloideae, Quivisianthoideae, and Capuronianthoideae), based on morphological characteristics. This concept was refuted by Muellner et al. (2003), who proposed to retain only two subfamilies (Cedreloideae and Melioideae). They suggested that the Capuronianthus subfamily be classified within the Cedreloideae, and the Quivisianthe subfamily be classified within the Melioideae (Muellner and Mabberley, 2008). The majority of available genetic and morphological evidence supports the classification of Meliaceae into two subfamilies. In a recent study, the classification perspective of Oyedeji Amusa et al. (2024) based on molecular systematics and anatomical data was consistent with Muellner et al. (2003).
Toona (Endl.) M. Roem., a significant lineage belonging to the Cedreloideae subfamily, has free stamens that are adnate to an androgynophore, different from other genera in Meliaceae. It is primarily distributed in Eastern, Southern, and Southeast Asia, as well as Eastern Australia (Mabberley et al., 1995), with approximately 15 species globally. In China, the genus includes four species: T. sinensis, T. ciliata, T. fargesii, and T. sureni. This genus has been widely utilized for over 250 years and is considered one of the most significant tropical and subtropical hardwoods (Edmonds, 1993). These trees are characterized by their fast growth, straight and well-proportioned form, and attractive wood texture. The obvious distinction between heartwood and sapwood grants them the admirable title of “Chinese mahogany” (Jia et al., 2024). Among these, T. sinensis is recognized as a traditional Chinese woody vegetable, serving as a source of timber, as well as having edible and medicinal functions. It has high economic value and development prospects, leading to its widespread cultivation in China. Additionally, three other Toona species are sporadically distributed in China. Meanwhile, their populations have been severely reduced due to habitat fragmentation and shrinkage from over-harvesting, utilization, and exploitation of agriculture and industry. Therefore, these species have been classified as threatened (Fu and Jin, 1992). Enhancing the conservation and sustainable utilization of these species is imperative.
Chloroplasts are important organelles responsible for photosynthesis and several metabolic processes in plants, algae, and certain protists. Most chloroplast (cp) genomes possess a tetrameric structure, including four parts: a large single-copy region (LSC), a small single-copy region (SSC), and two inverted-repeat regions (IRA and IRB) (Liu et al., 2022). Variations in the size and orientation of IRA and IRB primarily result in alterations to cp genome size and the appearance of duplicate genes. The cp genome exhibits greater conservation in terms of genetic structure, number, and composition compared to nuclear and mitochondrial genomes (Petit et al., 2005). Owing to these specific characteristics, the cp genome has been extensively utilized on the species identification, phylogeny, and evolution within Meliaceae (Lu et al., 2022). Previous studies employing phylogenetic methods have utilized partial sequences, variable regions, or multi-locus sequences. Muellner et al. (2011) evaluated the rpoC1, rpoB, and accD regions within the cp genomes of Meliaceae. Unfortunately, these genetic regions were insufficient for accurate species identification. Koenen et al. (2015) constructed a phylogenetic tree for Meliaceae using the cp genome fragments (rbcL, matK, rps16, and ycf1), which exhibited increased support rates and enhanced topological stability compared to earlier studies. Nevertheless, these sequences lack sufficient information for distinguishing among similar species (Daniell et al., 2016). To elucidate evolutionary relationships among closely related species, complete cp genomes have been employed. Lu et al. (2022) indicated that Toona and Cedrela belong to the subfamily Cedreloideae, with T. ciliata and T. sinensis displaying a close genetic relationship. Guo et al. (2018) revealed that Xylocarpus rumphii is more closely related to Xylocarpus moluccensis and Xylocarpus granatum. Additionally, comparative analyses of the cp genomes can identify variations to develop molecular markers for species identification, conservation genetics, and phylogenetic analysis. Four highly variable regions (HVRs) have been identified as molecular markers for distinguishing among the five Meliaceae species (Mader et al., 2018). Tan et al. (2023) reported that two genes and four non-coding gene regions exhibited high variability between mangrove and non-mangrove species. However, these studies have primarily concentrated on a limited number of Meliaceae species, leaving the variability in the cp genomes of other species unclear.
Currently, the cp genomes of 34 species across 17 genera within Meliaceae have been published, such as Entandrophragma cylindricum, Cedrela odorata, T. sinensis, M. azedarach. Among them, A. indica was the first species within Meliaceae to have its cp genome documented in GenBank (Accession Number: KF986530). In this research, we sequenced the cp genomes of three species, including T. sinensis, T. ciliata, and T. fargesii. Furthermore, we re-annotated previously published Meliaceae cp genomes from NCBI. These cp genomes were utilized for phylogenetic analyses, estimation of divergence time, and comparative analysis. Our specific objectives were as follows: (1) to supply newly sequenced complete cp genomes of the Toona genus, with the cp genome of T. fargesii being reported for the first time; (2) to construct the phylogenetic relationships and infer the divergence times in the evolutionary history of Meliaceae; (3) to compare the sequences and structures of cp genomes within Meliaceae; and (4) to identify the HVRs and SSRs as new barcodes that can distinguish species within Meliaceae.
2 Materials and methods
2.1 Plant material and DNA isolation
Fresh leaves of T. fargesii, T. ciliata, and T. sinensis utilized in this study were collected from Zhangzhou City, Fujian Province (25°55’N, 116°57’E), Baoshan City, Yunnan Province (25°04’N, 99°06’E), and Nanchang City, Jiangxi Province (28°46’N, 115°49’E), respectively. Voucher specimens were deposited at the College of Forestry, Jiangxi Agricultural University (JXAU), Nanchang, Jiangxi Province. Approximately 5 g of fresh leaves were selected from each material, and total genomic DNA was extracted using an improved CTAB method (Doyle and Doyle, 1987). The purity and concentration of the DNA were assessed using agarose gel electrophoresis and a NanoDrop 2000 microspectrophotometer. After meeting the requirements of sequencing, the DNA was submitted to the Illumina HiSeq 2000 platform at Novogene Bioinformatics Technology Co. Ltd. (Beijing, China), applying the paired-end (PE) 150 bp reads.
2.2 Genome assembly and annotation
FastQC v0.19.7 was employed to evaluate the quality of the raw sequencing data. We obtained clean data with a Q20/Q30 score greater than 96/90. With k-mers of 55, 87, and 121, the remaining clean reads were assembled using GetOrganelle v1.7.5 (Jin et al., 2020). Using the published T. sinensis cp genome (GenBank accession number: ON244456) as a reference, the cp genomes were annotated using the CPGAVAS2 (Shi et al., 2019) and Geseq (Tillich et al., 2017) platforms. The results were manually checked and adjusted using Geneious v9.0.2 (Kearse et al., 2012). The annotated sequences were uploaded to the NCBI using BankIt to obtain the sequence accession number: PQ634666 (T. fargesii), PQ634667 (T. ciliata), and PQ634668 (T. sinensis). These cp genomes of Toona were mapped using the online tool Chloroplot (Zheng et al., 2020).
2.3 Structural characterization and comparative chloroplast genome analysis
A total of 32 cp genomes of Meliaceae were obtained from the NCBI database (Table 1), among which 29 were published sequences, and 3 were newly sequenced in this study. Geneious v9.0.2 was employed to analyze the cp genomic characteristics of the 32 Meliaceae species, including genome size, length of LSC/SSC/IR, GC content, gene composition, and function. To establish a consensus on the standard and minimize errors, the cp genomes of Meliaceae obtained from NCBI were reannotated.
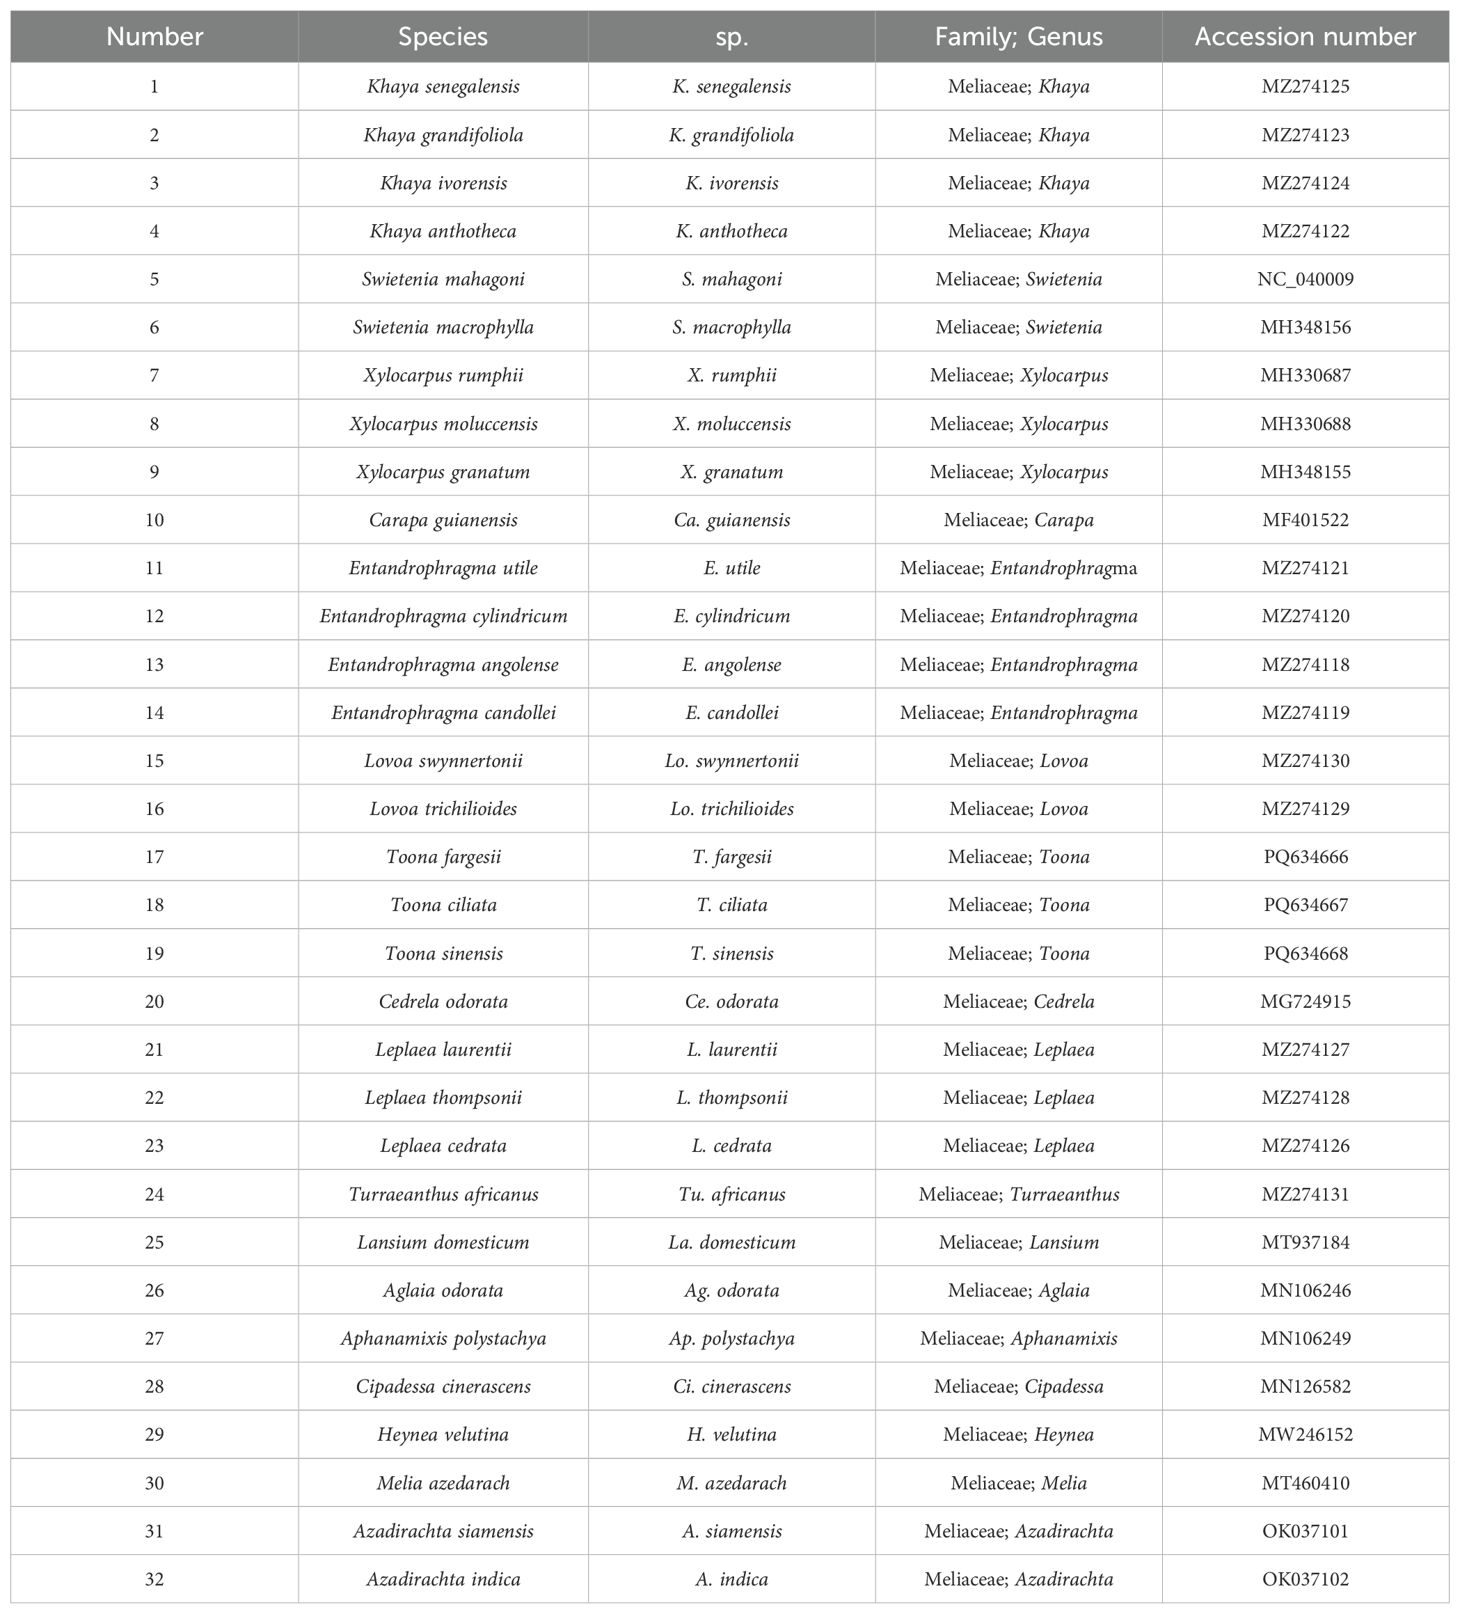
Table 1. Species used in present study.
2.4 Phylogenetic analyses
The cp genomes of 32 Meliaceae species were employed to elucidate their phylogenetic relationships, with Leitneria floridana (Simaroubaceae, Leitneria) serving as the outgroup (GenBank accession number of NC_030482). The cp genomes were aligned by MAFFT v7.520 (Katoh et al., 2002), and the optimal tree-building model was subsequently determined by the ModelFinder function of PhyloSuite v1.2.3 (Zhang et al., 2020). The phylogenetic tree was constructed using the maximum likelihood (ML) approach with 1000 bootstrap replicates in IQ-tree v1.6.8 (Nguyen et al., 2015). This study referred to the classification proposed by Muellner et al. (2003) and Oyedeji Amusa et al. (2024) to avoid confusion.
2.5 Divergence time analysis
The approximate divergence times among Meliaceae were estimated using MCMCTree (Puttick, 2019). Four credible fossils that are widely used in molecular dating analysis of Meliaceae (Koenen et al., 2015) were used as calibration points. Calibration point information is as follows: (1) the stem node of Cedreloideae at 47.8 Ma (Chandler, 1964). (2) the stem age of Cedreleae (28.1 Ma) (McGinite, 1953). (3) the stem node of Swietenia (22.5 Ma) (Castañeda Posadas and Cevallos Ferriz, 2007). (4) the stem node of the ‘La. Domesticum-Ap. Polystachya’ clade (23 Ma) (Conran et al., 2014). The uncorrelated lognormal relaxed clock model was selected, and the GTR substitution model was used as the phylogenetic tree model. The convergence of MCMCTree was assessed using Tracer v1.7.2 (Rambaut et al., 2018), and the effective sample size (ESS) value was verified to be above 200. A burn-in of 20% of generations was discarded. The results were visualized by using Figtree v1.4.4 (Rambaut, 2007).
2.6 Genome structural variations and sequence divergences
The alterations in the IR boundaries of cp genomes within Meliaceae were analyzed using IRscope (Amiryousefi et al., 2018). The mVISTA online tool (Brudno et al., 2003) employing the Shuffle-LAGAN model was utilized to visualize the variable regions for comparative analysis of Meliaceae cp genomes, with Khaya senegalensis (GenBank accession number: MZ274125) serving as the reference. Additionally, cp genome sequences of Meliaceae were aligned using MAFFT v7.520 for further study. The nucleotide polymorphism (Pi) was computed using DnaSP software v6.12.03 (Rozas et al., 2017) with a sliding window length of 600 bp and a step size of 200 bp.
2.7 Simple sequence repeats analysis
Simple sequence repeats (SSRs) were analyzed using the MISA online tool (Beier et al., 2017). The minimum threshold of repeats was set to 10 (mononucleotides), 5 (dinucleotides), 4 (trinucleotides), 3 (tetranucleotides), 3 (pentanucleotides), and 3 (hexanucleotides). In addition, the minimum distance between SSRs was set to 100 bp.
2.8 Codon usage analysis
To avoid bias, we excluded protein-coding genes (PCGs) shorter than 300 bp and repetitive using Geneious v9.0.2. A total of 52 coding sequences were retained. CodonW v1.4.2 was utilized to calculate the relative synonymous codon usage (RSCU) (Wu et al., 2007) of Meliaceae for an examination of codon usage preference. The results were visualized using the ChiPlot online tool (https://www.chiplot.online/).
3 Results
3.1 Chloroplast genome structure and features
The cp genome sizes of Meliaceae ranged from 158,558 bp (Ce. odorata) to 160,978 bp (Aglaia odorata), with the former exhibiting the shortest IR (26,894 bp) and the latter possessing the longest IR (27,089 bp). The cp genome sizes of Toona were 159,578 bp, 159,617 bp, and 159,242 bp, respectively, which was within the size observed in the subfamily Cedreloideae (158,558 bp-159,841 bp). All cp genomes of Toona exhibit a typical tetrameric structure containing four regions: LSC, SSC, IRB, and IRA (Figure 1), consistent with those of Meliaceae. In Meliaceae, the lengths of these regions range from 86,390 bp to 88,197 bp for LSC, 17,967 bp to 18,709 bp for SSC, and 26,894 bp to 27,089 bp for IR, respectively. Furthermore, the cp genome size, LSC length, and SSC length of the subfamily Cedreloideae are shorter than those of the subfamily Melioideae; however, the GC contents of cp genomes in Cedreloideae (37.77%-38.01%) are greater than those of the Melioideae (37.18%-37.70%) (Table 2). K. senegalensis exhibits the highest GC content in chloroplast genomes (38.01%), while M. azedarach has the lowest GC content.

Figure 1. Chloroplast genome maps of (A) T. fargesii, (B) T. ciliata and (C) T. sinensis. The different colored rectangles on the large ring represent different kinds of genes. Genes located outside the large ring are transcribed in a counterclockwise direction, while those inside the large ring are transcribed in a clockwise direction. The dark gray area of the small ring indicates the G and C content.
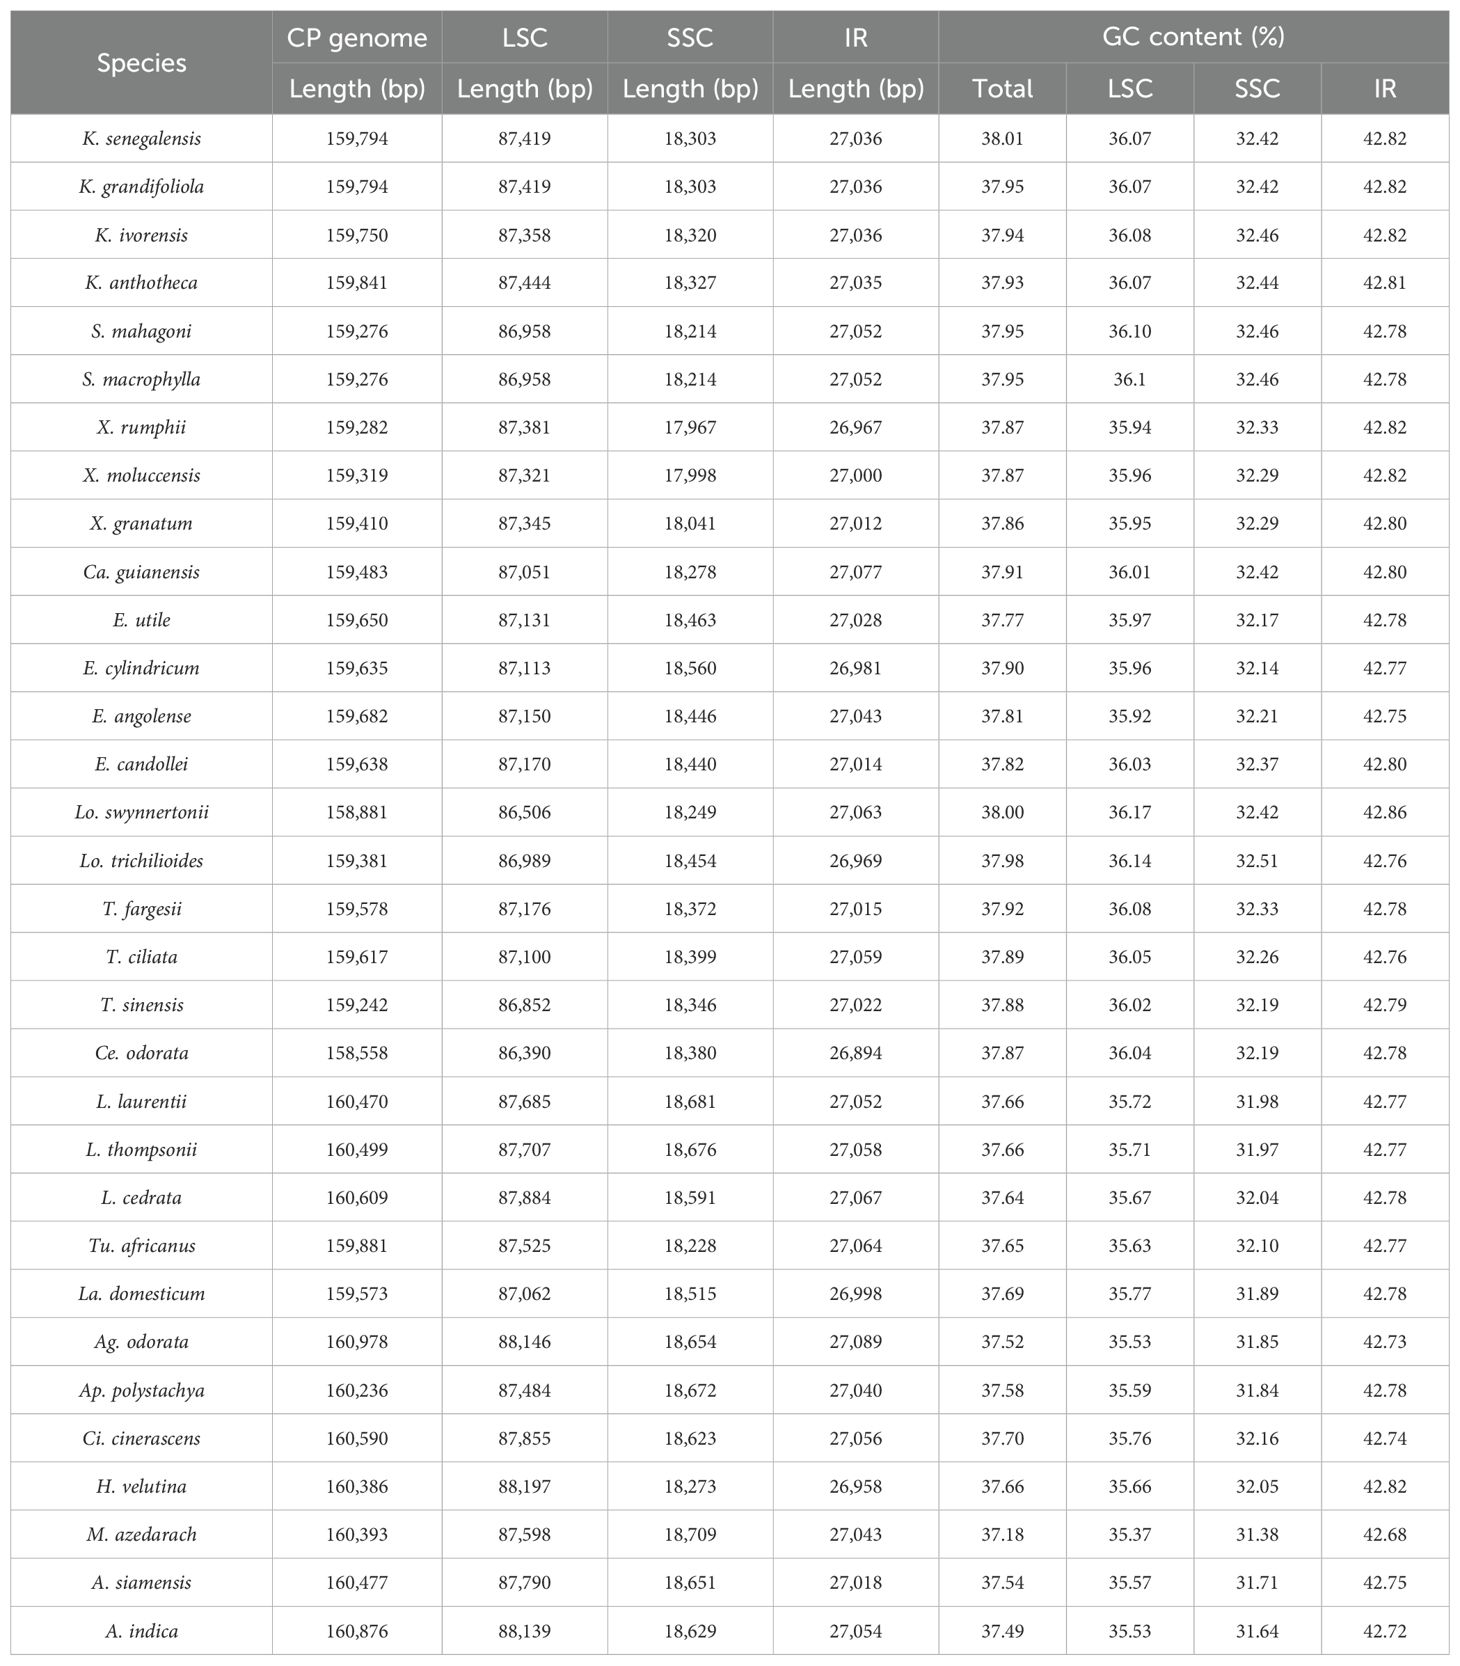
Table 2. The sequence statistic of cp genomes of Meliaceae.
A total of 135 genes were annotated in the cp genomes of Meliaceae species, comprising 90 protein-coding, 37 tRNA, and 8 rRNA genes (Supplementary Table 1). The genes were categorized into four groups: 76 self-replicating genes, 45 photosynthesis-related genes, 6 other genes, and 8 genes of unknown function.
3.2 Phylogenetic analyses
The optimal model was obtained based on TVM + F + I + I + R5 using PhyloSuite, and the ML tree among 33 species of Meliaceae was reconstructed based on the cp genomes. In the phylogenetic tree, 90% of the branches had 100% support, and all branches had > 75% support (Figure 2). This indicates that the clustering results were highly reliable. Our results were consistent with previous reports (Muellner et al., 2016), which divided Meliaceae into two subfamilies, Cedreloideae (20 species across 8 genera) and Melioideae (12 species across 9 genera). Meliaceae can be further divided into four clades (I-IV). However, there is a slight difference compared to previous reports (Guo et al., 2018) in the location of Swietenia. In clade I, Khaya and Swietenia (BS = 100%), as well as Xylocarpus and Carapa (BS = 100%), each form two distinct monophyletic clades, respectively. Clades II-IV exhibited little controversy. In clade II, Toona clustered with Cedrela (BS = 100%), while Entandrophragma clustered with Lovoa (BS = 76%). Among them, T. fargesii is more closely related to T. ciliata than to T. sinensis within Toona. In clade III, Leplaea was found to share a close relationship with six other genera (Turraeanthus, Lansium, Aglaia, Aphanamixis, Cipadessa, and Heynea). Furthermore, Melia and Azadirachta formed the IV clade (Figure 2).
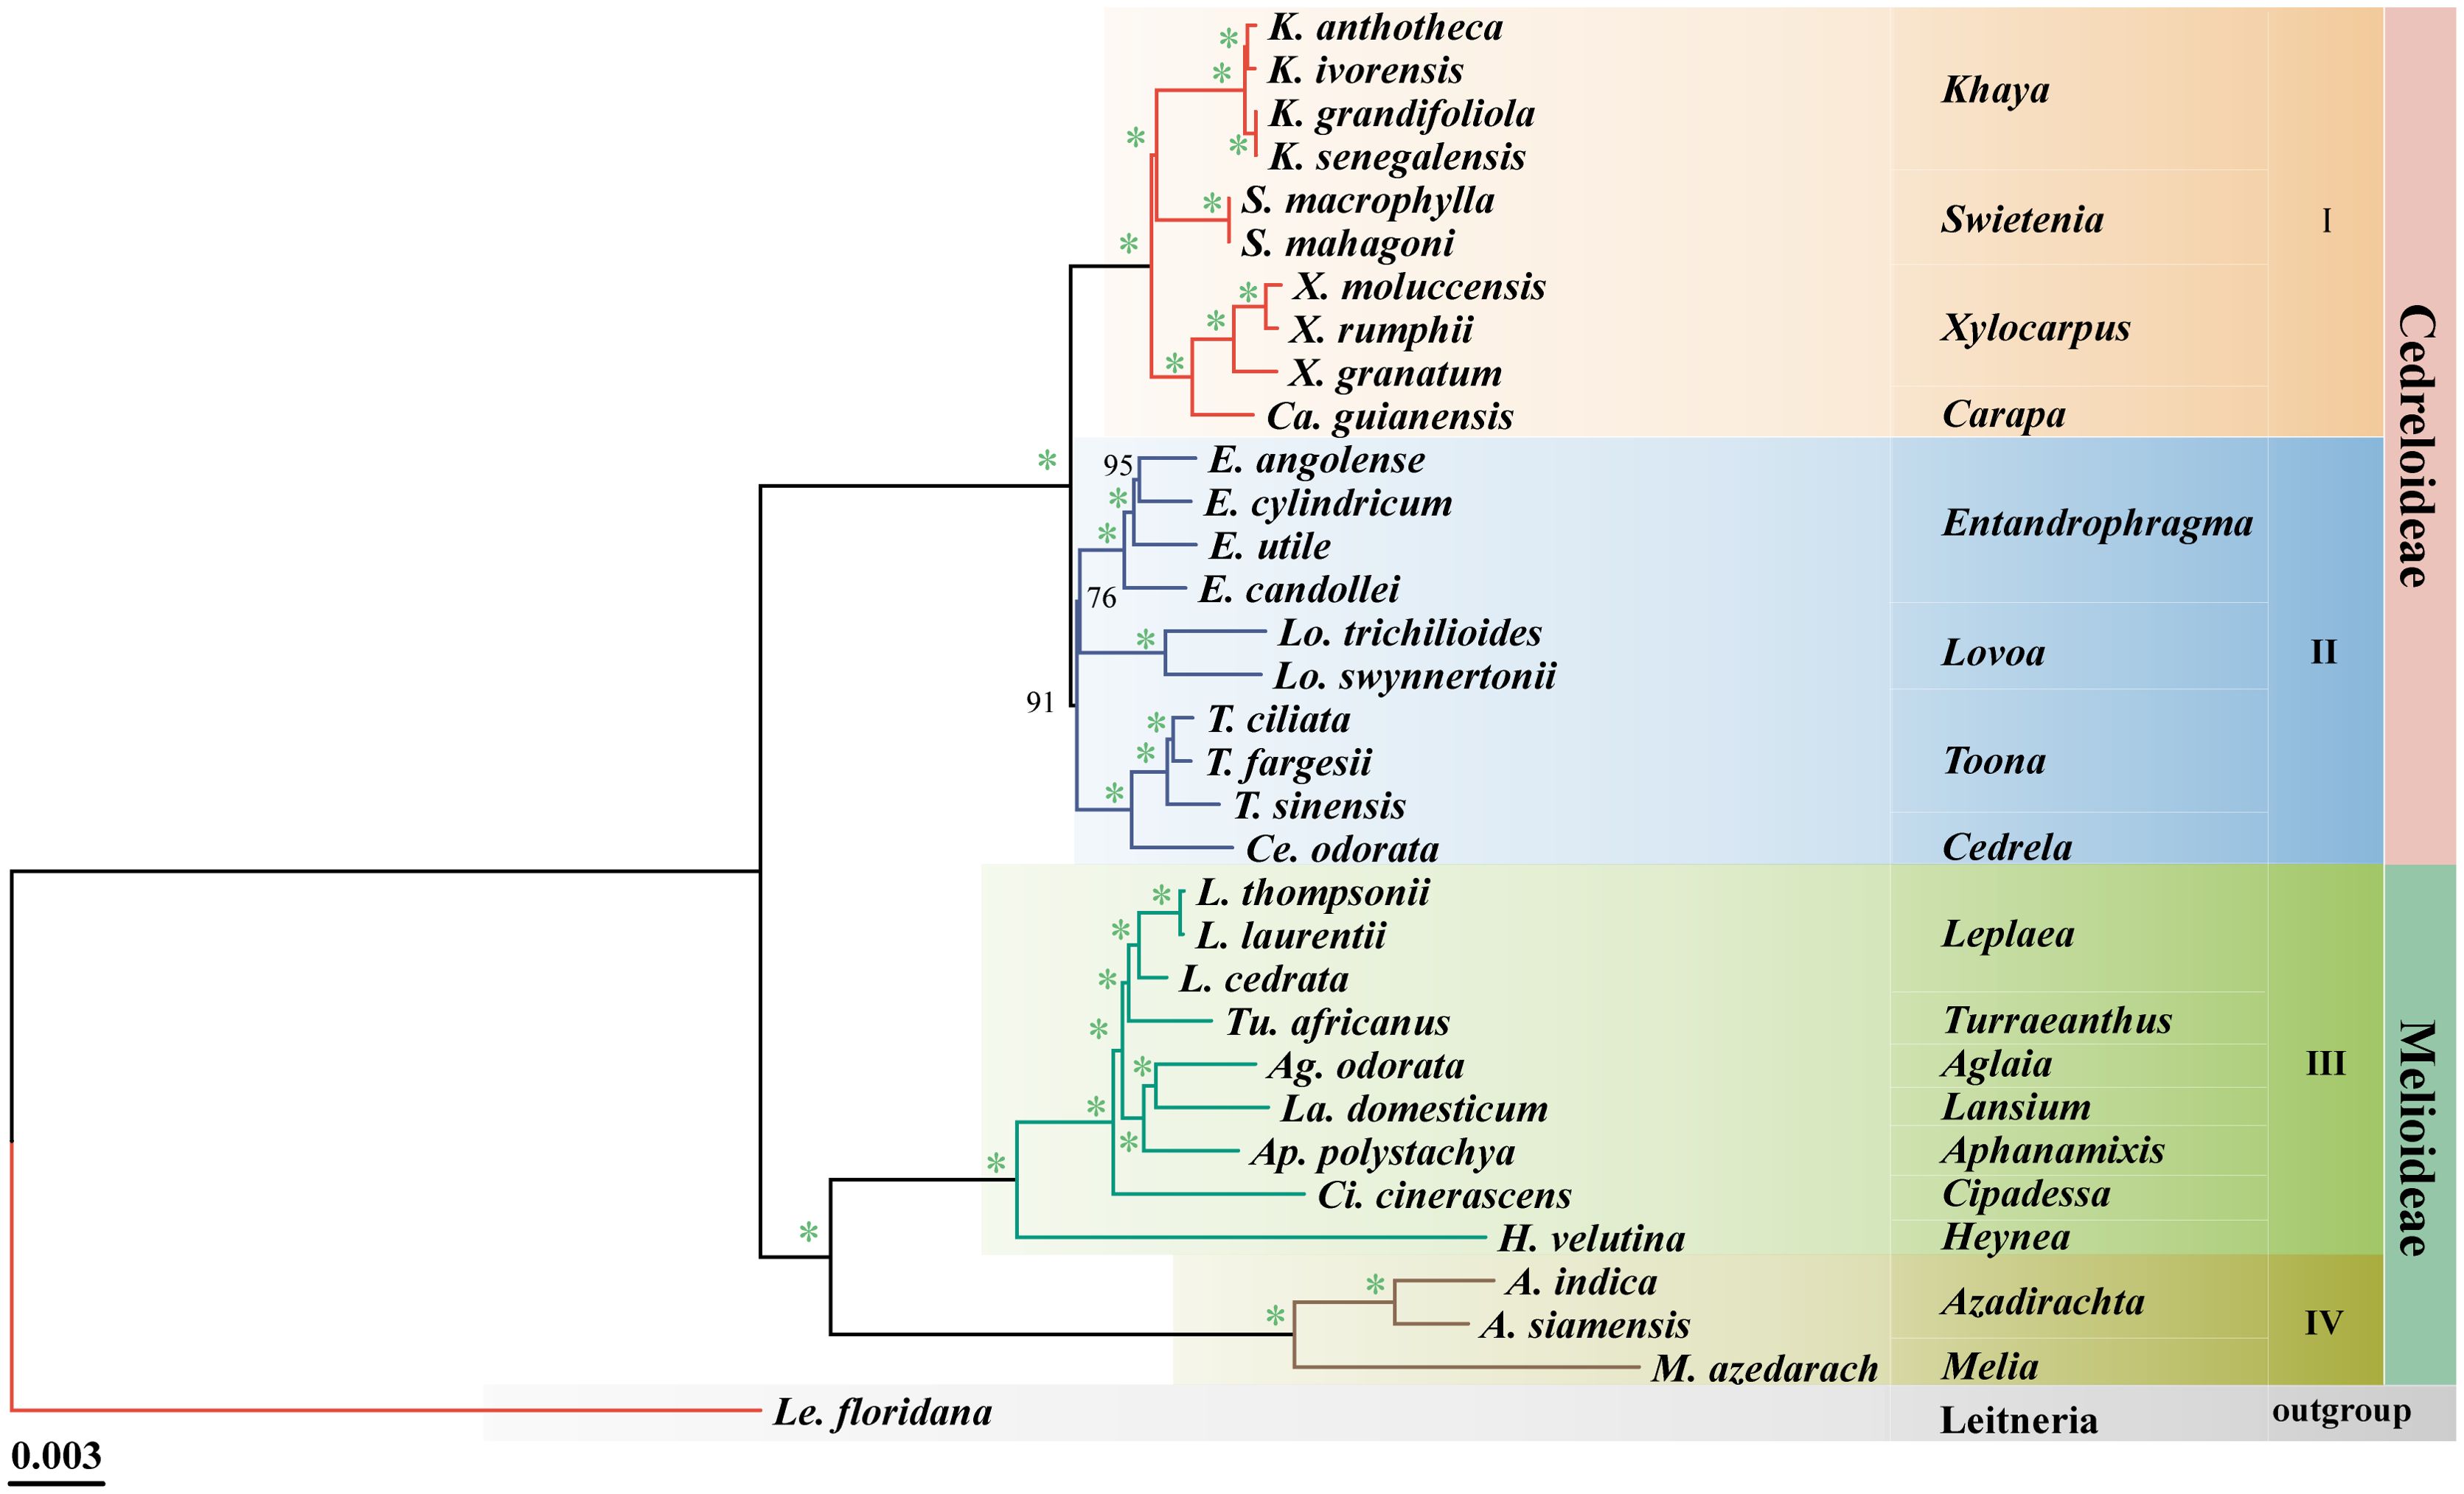
Figure 2. Phylogenetic tree of the cp genome of Meliaceae based on the maximum likelihood (ML) analysis. Bootstrap values (BS) are indicated at branch nodes, with an asterisk indicates support of 100% bootstrap.
3.3 Divergence time estimation
The differentiation times of Meliaceae were shown in Figure 3. The ESS values, as tested by Tracer, were significantly higher than 200, indicating the credibility of the results obtained. The common ancestor of 32 Meliaceae species can be traced back to 72.92 million years ago (Ma) (95% HPD: 60.62-87.01). The Cedreloideae subfamily differentiated at the Eocene epoch, approximately 47.86 Ma (95% HPD: 47.82-48.22), later than the Melioideae subfamily (66.60 Ma, 95% HPD: 55.41-79.73 Ma). The four clades (I, II, III, and IV) differentiated at approximately 40.28 Ma, 46.18 Ma, 46.87 Ma, and 30.18 Ma, respectively. The oldest divergence of Khaya species, including K. senegalensis, K. grandifoliola, K. ivorensis, and K. anthotheca, from their common ancestor occurred at 9.59 Ma (95% HPD: 2.79-17.14 Ma). In contrast, Heynea was the earliest to diverge at 46.87 Ma (95% HPD: 37.78-58.92 Ma). Other Meliaceae species diverged from the Oligocene and the Miocene epochs. Specific node information was detailed in Supplementary Table 2.
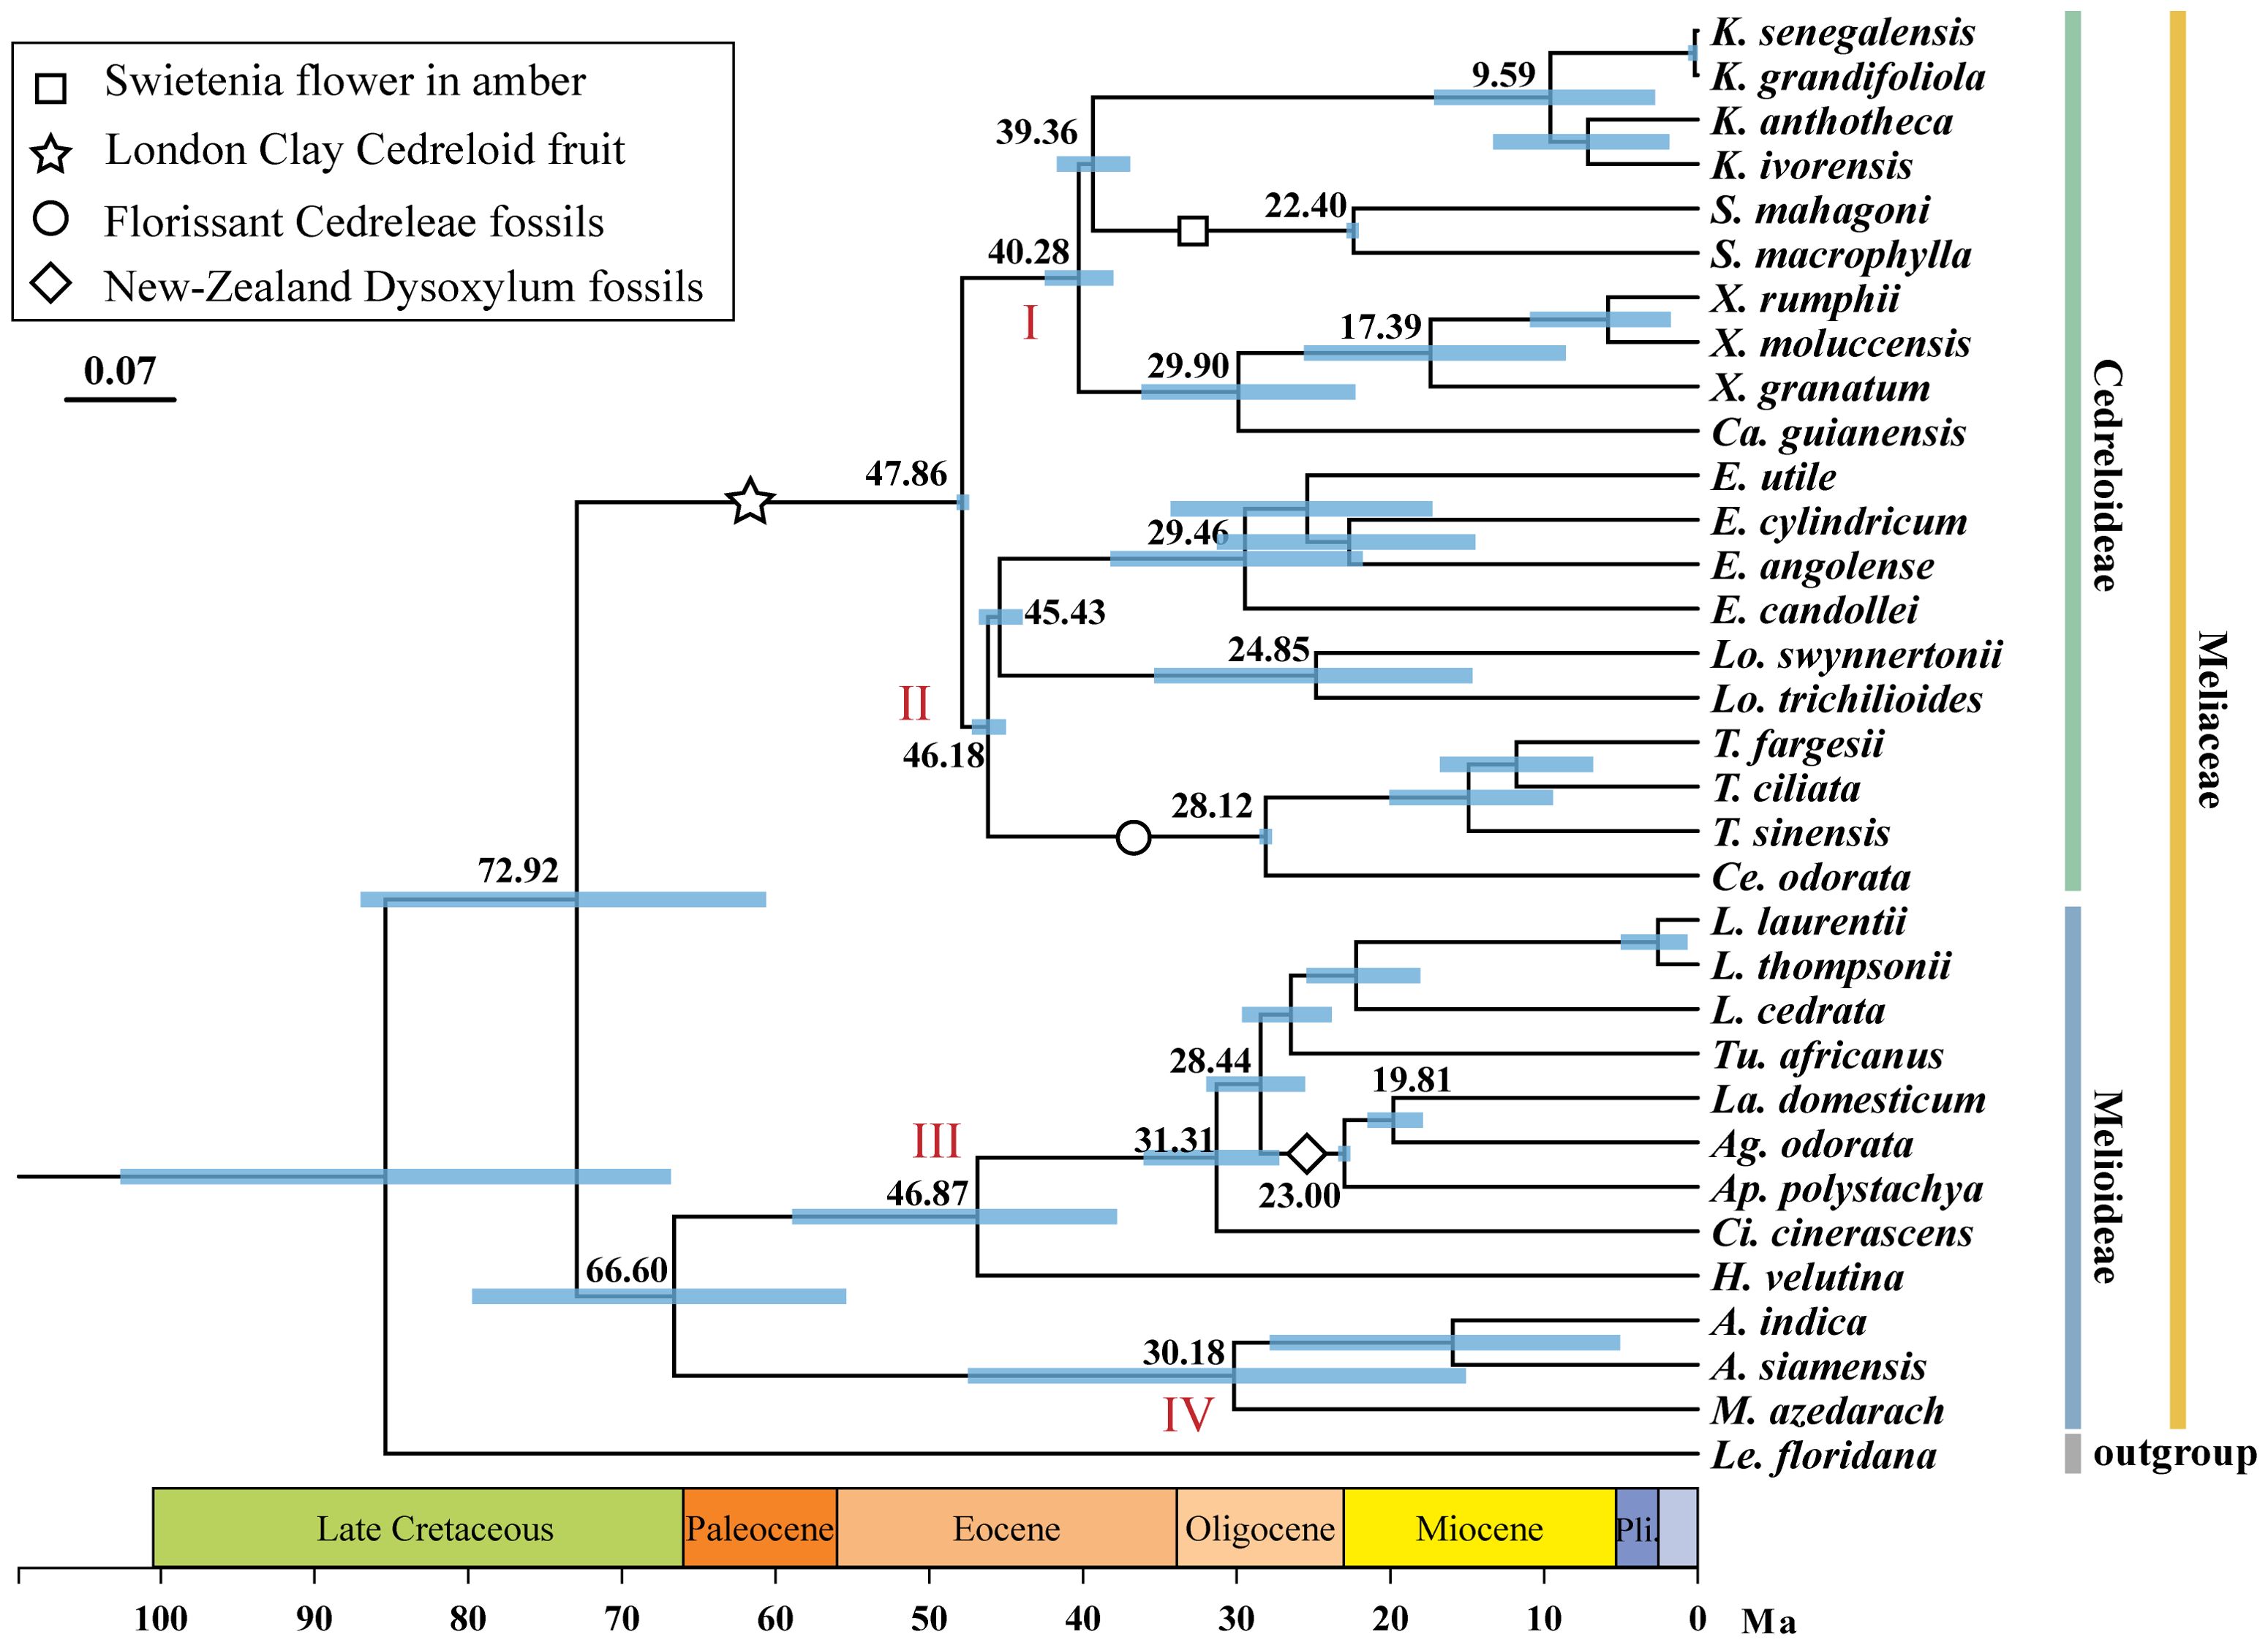
Figure 3. Divergence times of major clades within Meliaceae. The mean and 95% HPD intervals of the divergent time (Ma) are presented for select major nodes, indicated by blue lines. Black and white symbols represent the four calibration points.
3.4 Comparative genomic analysis
3.4.1 IR contraction and expansion
During the evolution of the cp genome, the four boundaries (LSC, SSC, IRB, and IRA) have undergone expansions and contractions, facilitating the entry of specific genes into IR, LSC, and SSC. Boundary expansion and contraction analyses revealed slight variations at the boundary locations among Meliaceae species (Figure 4). In all Meliaceae cp genomes, the LSC/IRB (JLB) boundaries and the LSC/IRA (JLA) boundaries were located within the rpl22 gene. Notably, the length of rpl22 in the ‘X. rumphii-Ca. guianensis’ clade increased significantly. In clades I and II, rpl22 spanned the JLB boundary, with 219-229 bp located in IRB. Similarly, in clades III and IV, rpl22 also extended across the JLB boundary, with 236 bp and 212-213 bp, respectively, within the IRB. The SSC/IRA (JSA) boundaries were located within the ycf1 gene. The distances between the ends of ycf1 and the JSA boundaries ranged from 1023 to 1194 bp. Excluding E. cylindricum and T. ciliata, where the ndhF genes were entirely located within the SSC, the ndhF genes of other Meliaceae cp genomes were found in the SSC/IRB (JSB). Specifically, the ndhF in the I, III, and IV clades crossed the JLB boundary, with 9-10 bp, 21-23 bp, and 33-37 bp located in the IRB, respectively. In the I and II clades, with the exception of T. sinensis, where trnH was situated 1 bp away from the JLA, trnH was found in the LSC, positioned 2-6 bp away from the JLA. In the III clade, excluding Heynea velutina, where trnH was located 16 bp away from the JLA, trnH was situated just 1 bp to the right of the JLA boundary. In clade IV, trnH expanded into the IRA by 2-3 bp.
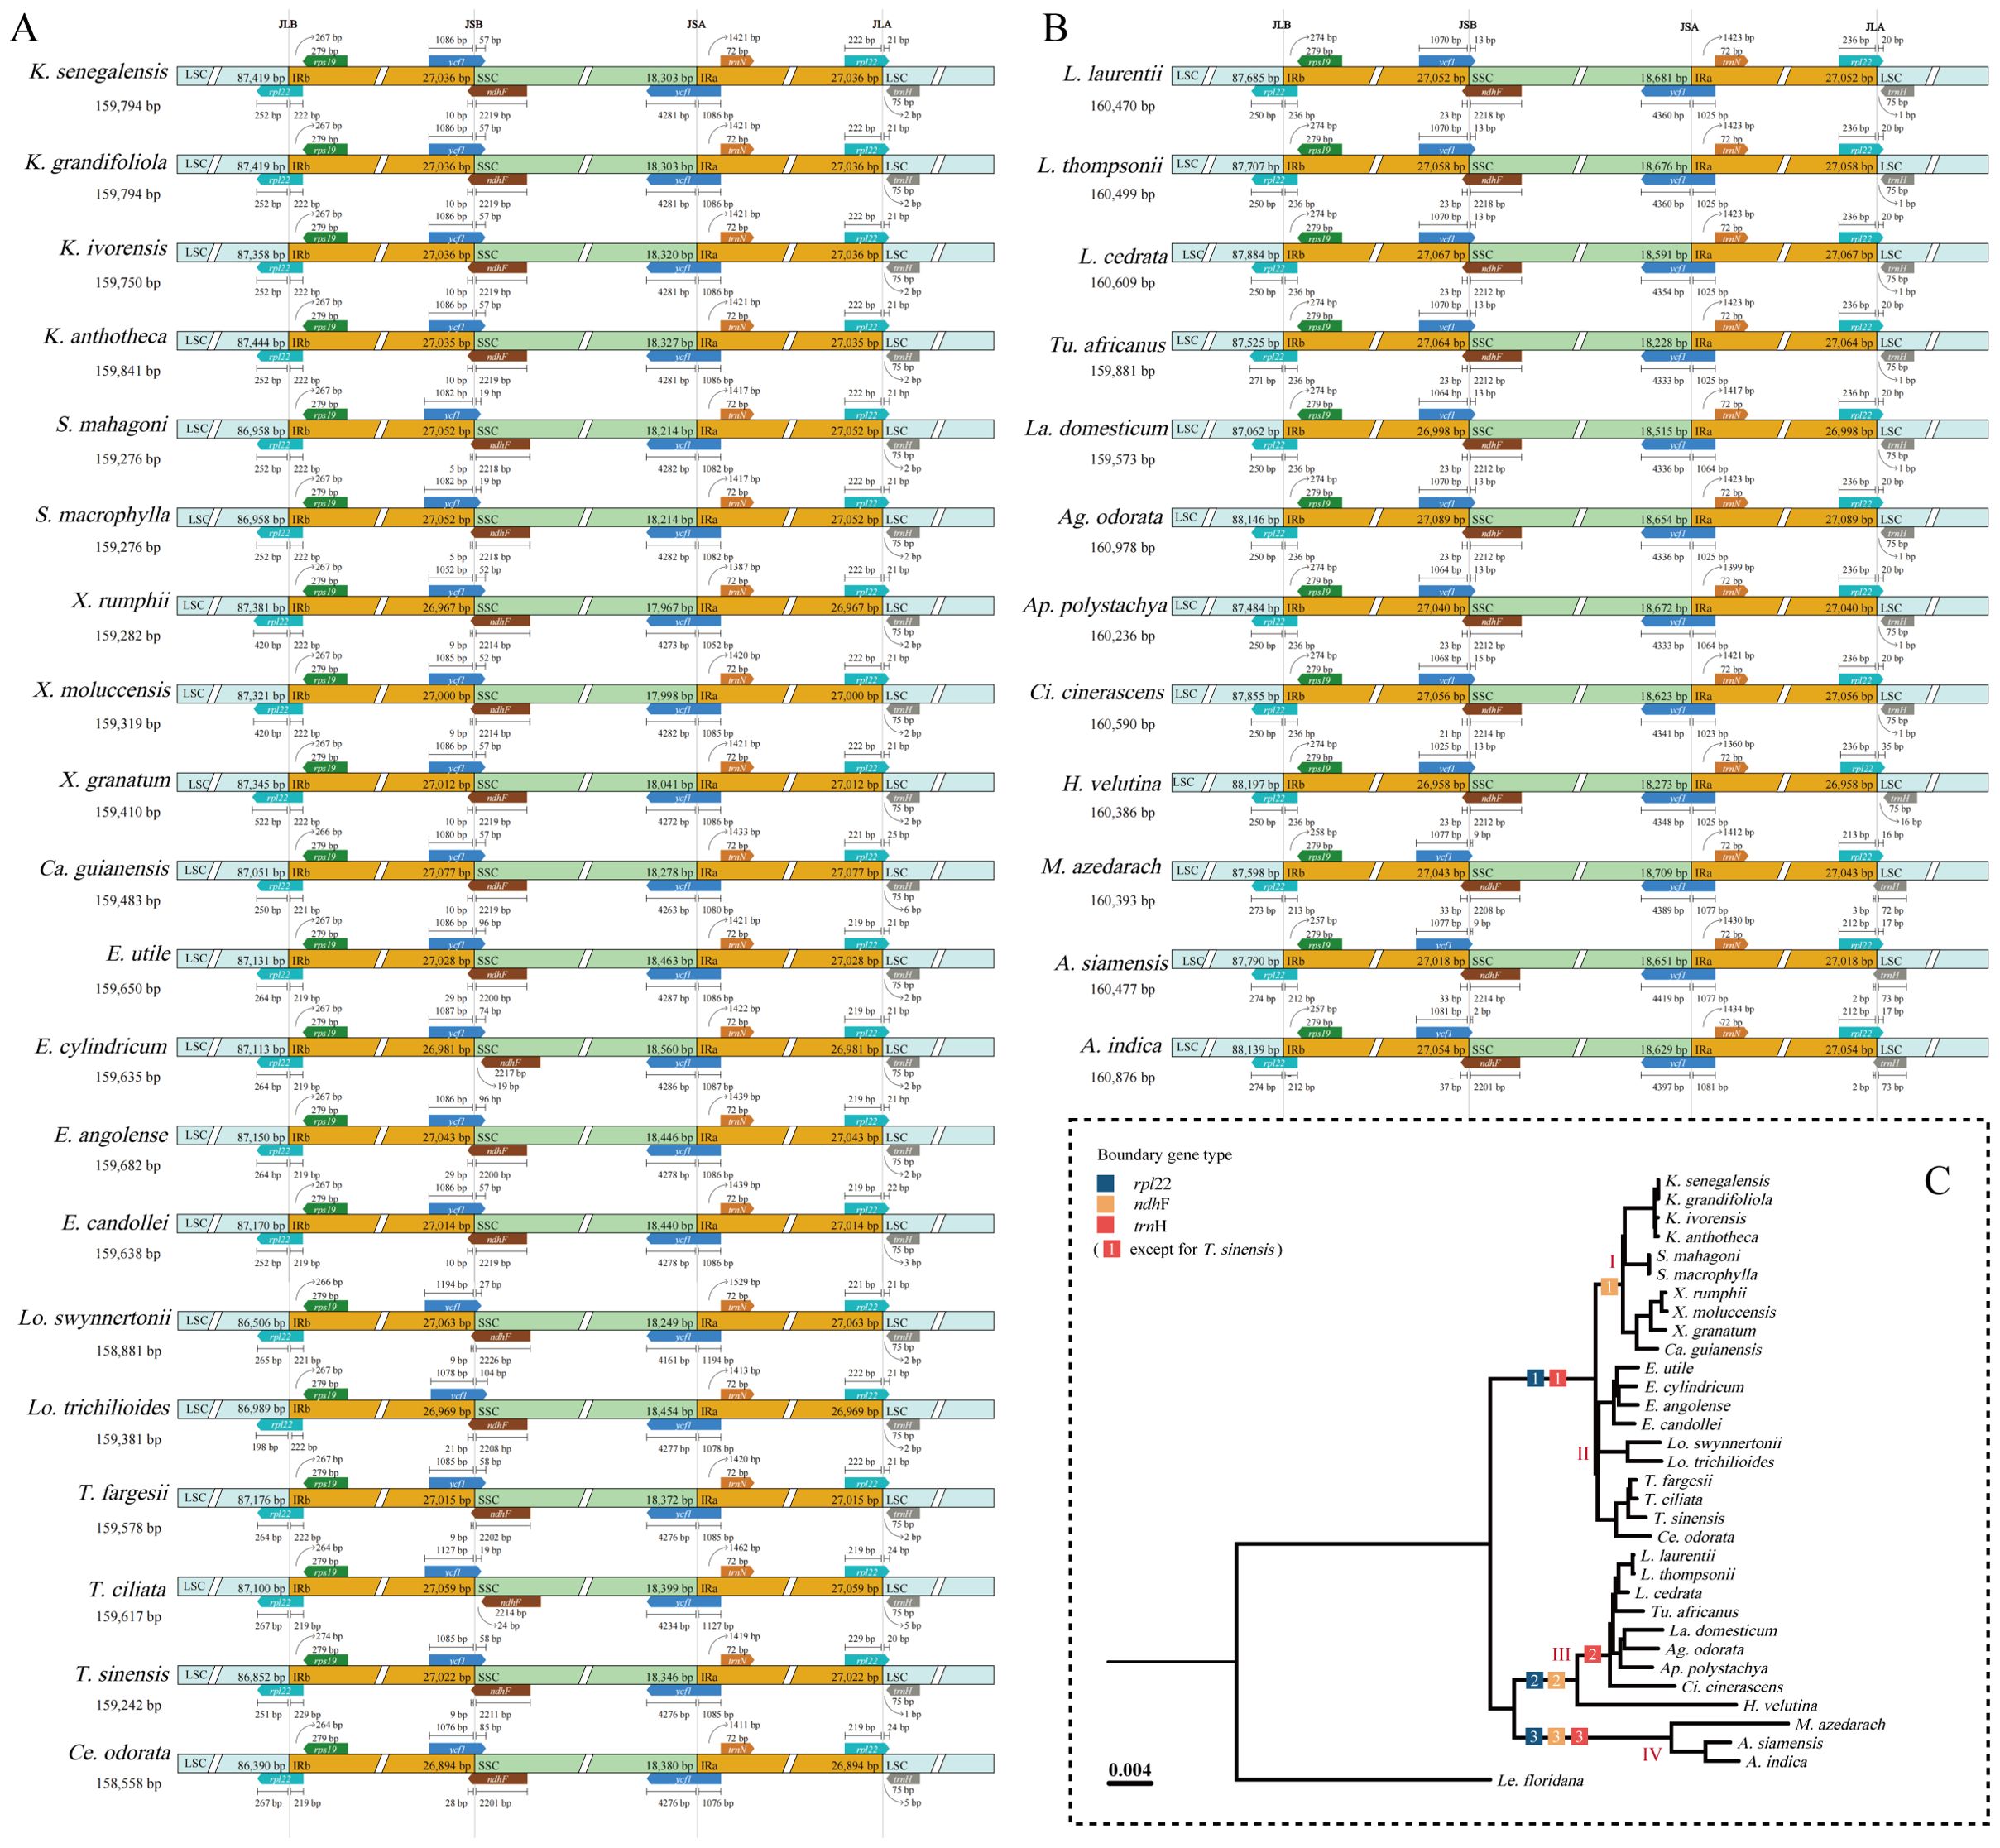
Figure 4. Changes in IR boundary analysis of 32 Meliaceae species. (A) Cedreloideae; (B) Melioideae; (C) Variations in gene locations near the IR boundary were depicted in in the Phylogeny tree.
3.4.2 Comparison of diversity in cp genomes
In this research, the cp genome of K. senegalensis served as the reference. The cp genomes of 32 Meliaceae species were compared using mVISTA. The results (Figure 5) indicate that the IR showed higher conservation compared to both the LSC and SSC. Moreover, the coding regions demonstrated greater conservation than the non-coding regions (CNS). High levels of diversity were observed in CNS, particularly in the trnH-psbA, trnK-rps16, rps16-trnQ, petN-psbM, psbZ-trnG, and ndhF-rpl32, rpl32-trnL regions. Additionally, several genes, including matK, rpoC2, ndhF, and ycf1, exhibited variable regions.
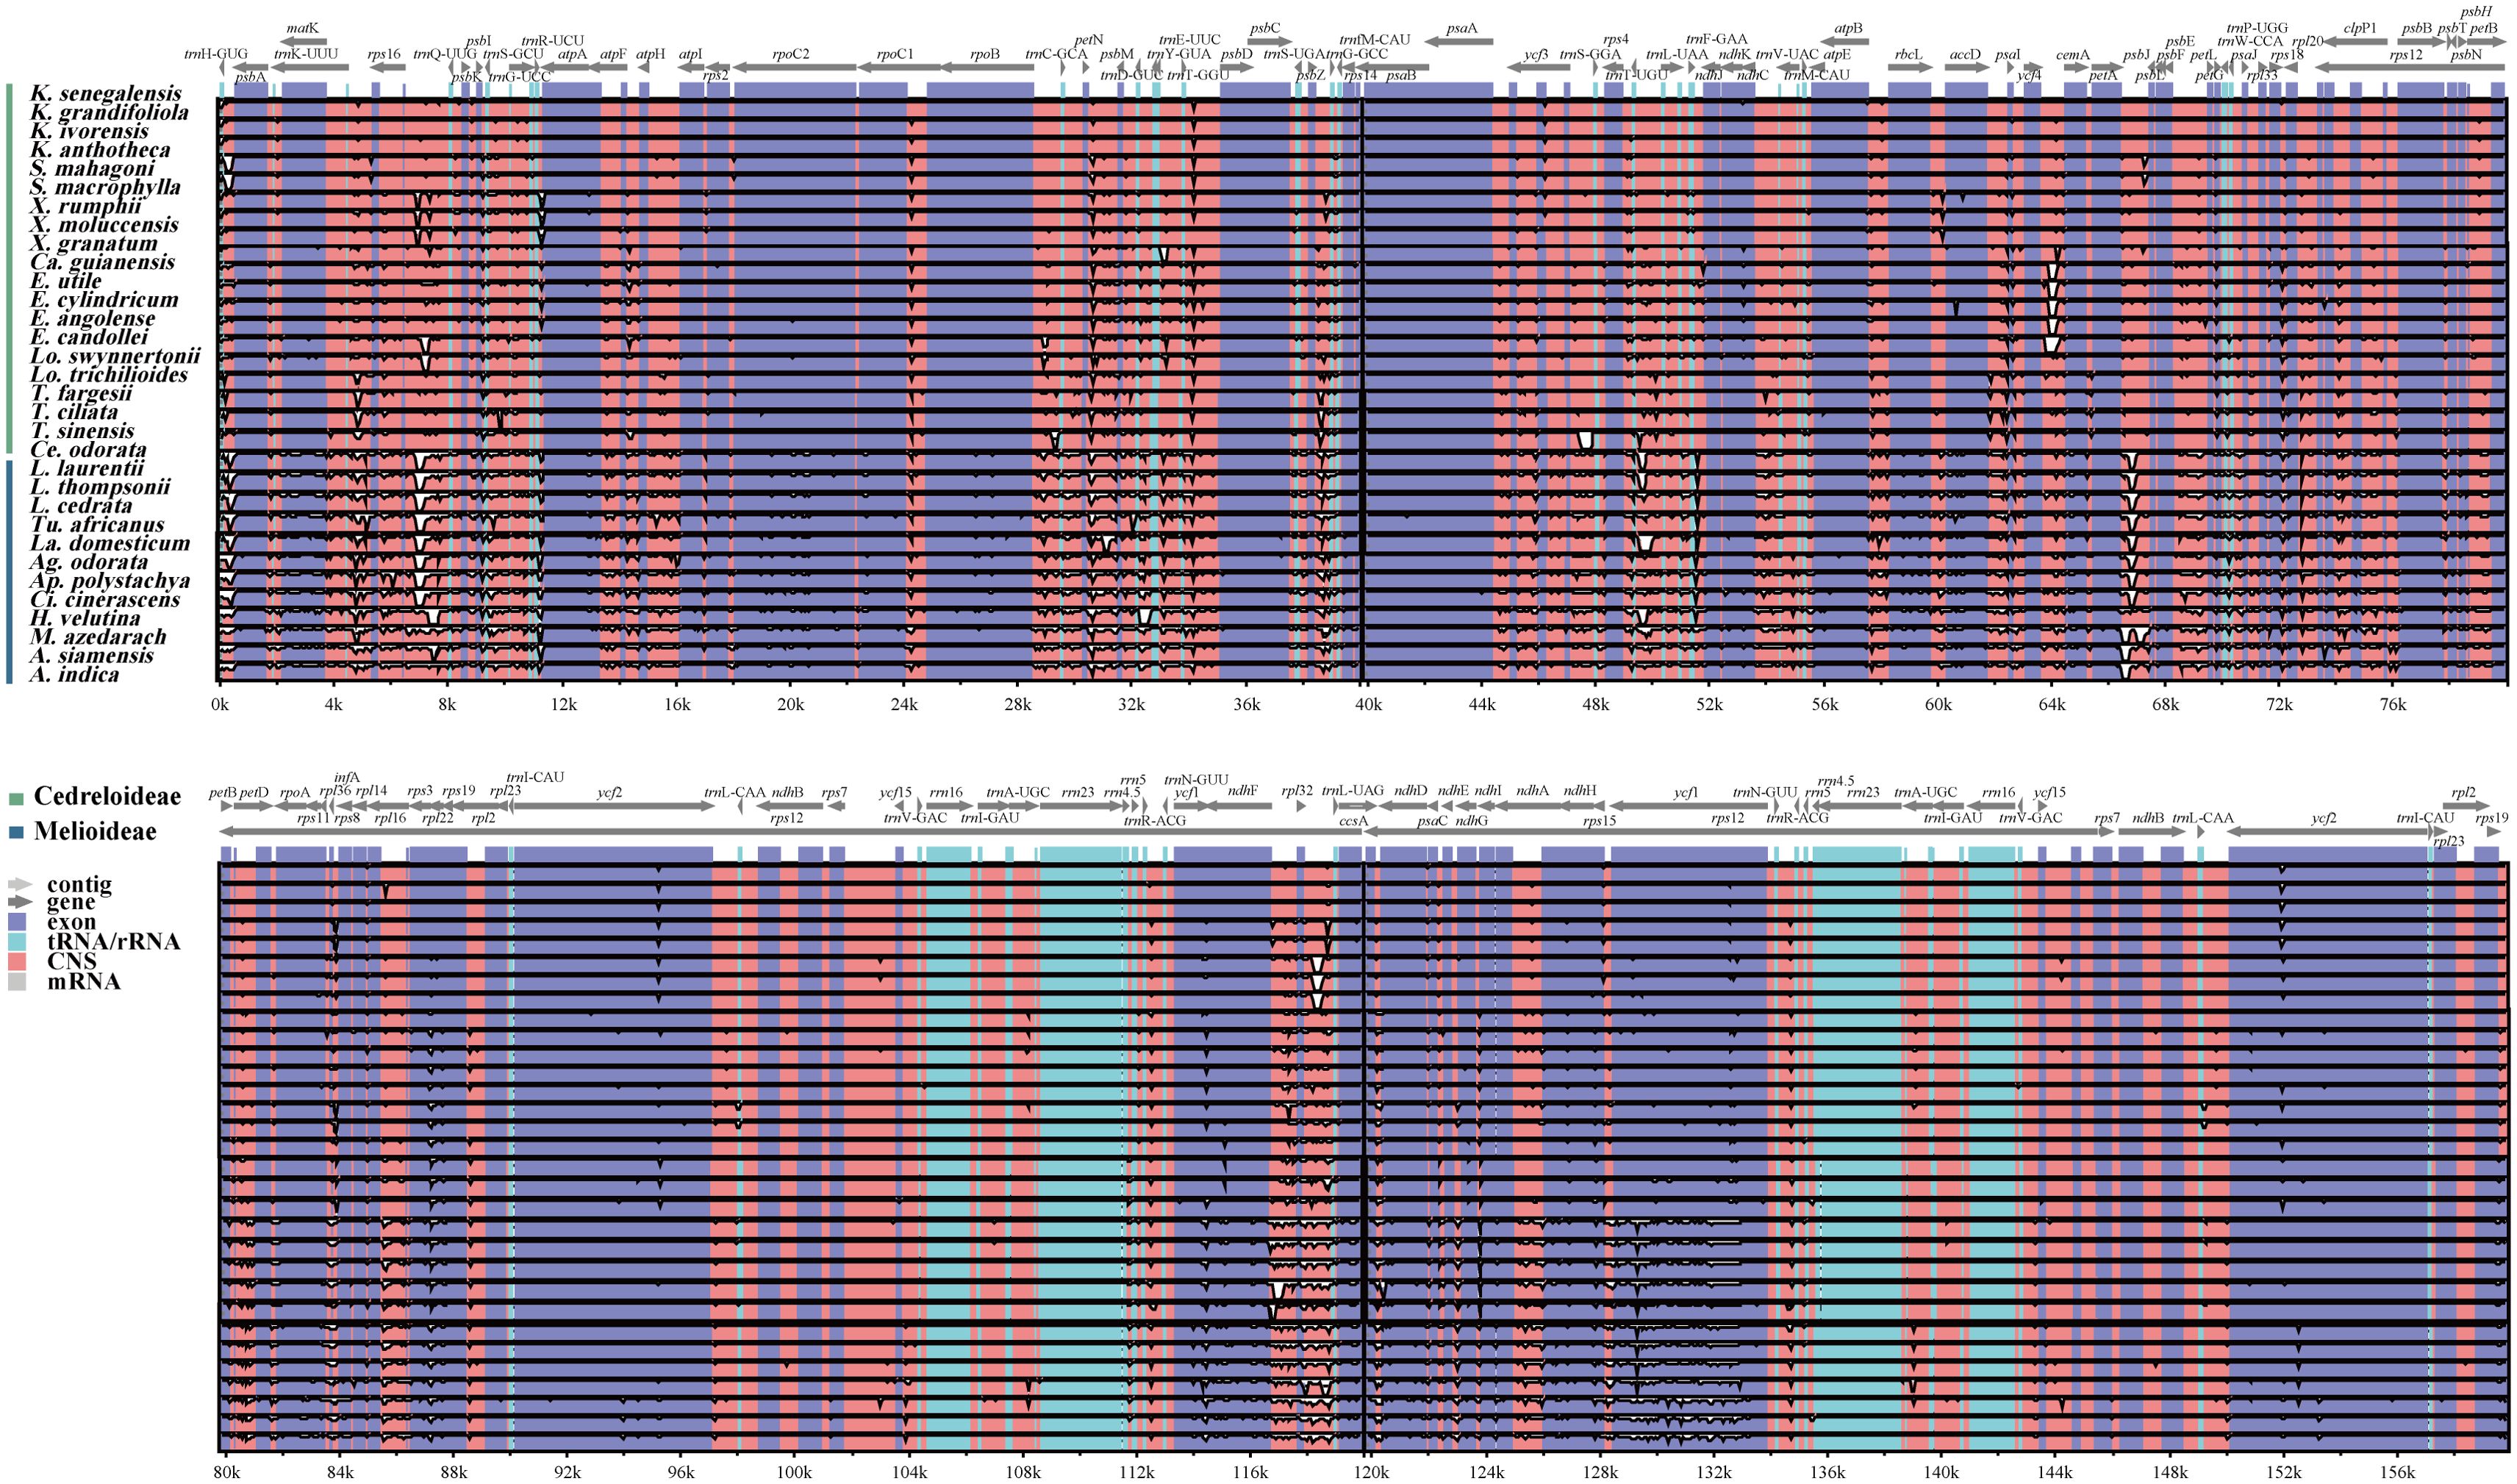
Figure 5. Visualization of the alignment of cp genome sequences Meliaceae species. The vertical scale represents the percentage of identity, ranging from 50% to 100%.
To assess sequence variation within the cp genomes of Meliaceae, we employed DNAsp software to calculate nucleotide diversity of the 32 cp genomes. The results of the sliding window analysis (Figure 6) indicated that Pi ranged from 0 to 0.0881 (for ycf1), with a mean value of 0.01641. A total of 13,062 polymorphic sites were detected. Using Pi > 0.04 as the threshold, twelve regions with HVRs, including ycf1, trnK-rps16, rps16-trnQ, ndhF-rpl32, rps16, rpl32, rpl32-trnL, rpl22, trnL, petN-psbM, and ndhC-trnV, were identified in Meliaceae. Among the variable sites, Melioideae has 15 sites with Pi > 0.04, whereas Cedreloideae has only one such site (rpl22). All identified HVRs were located in LSC and SSC. Furthermore, we analyzed the variation within certain genera of Meliaceae. The results showed (Supplementary Figure 1) that the individual genera in Meliaceae exhibited little variation, with pi values being less than 0.04, except for the ycf4-cemA of Lovoa (Pi = 0.05) and the trnK-rps16 of Azadirachta (Pi = 0.055). These loci can be further utilized for the study of gene polymorphisms.
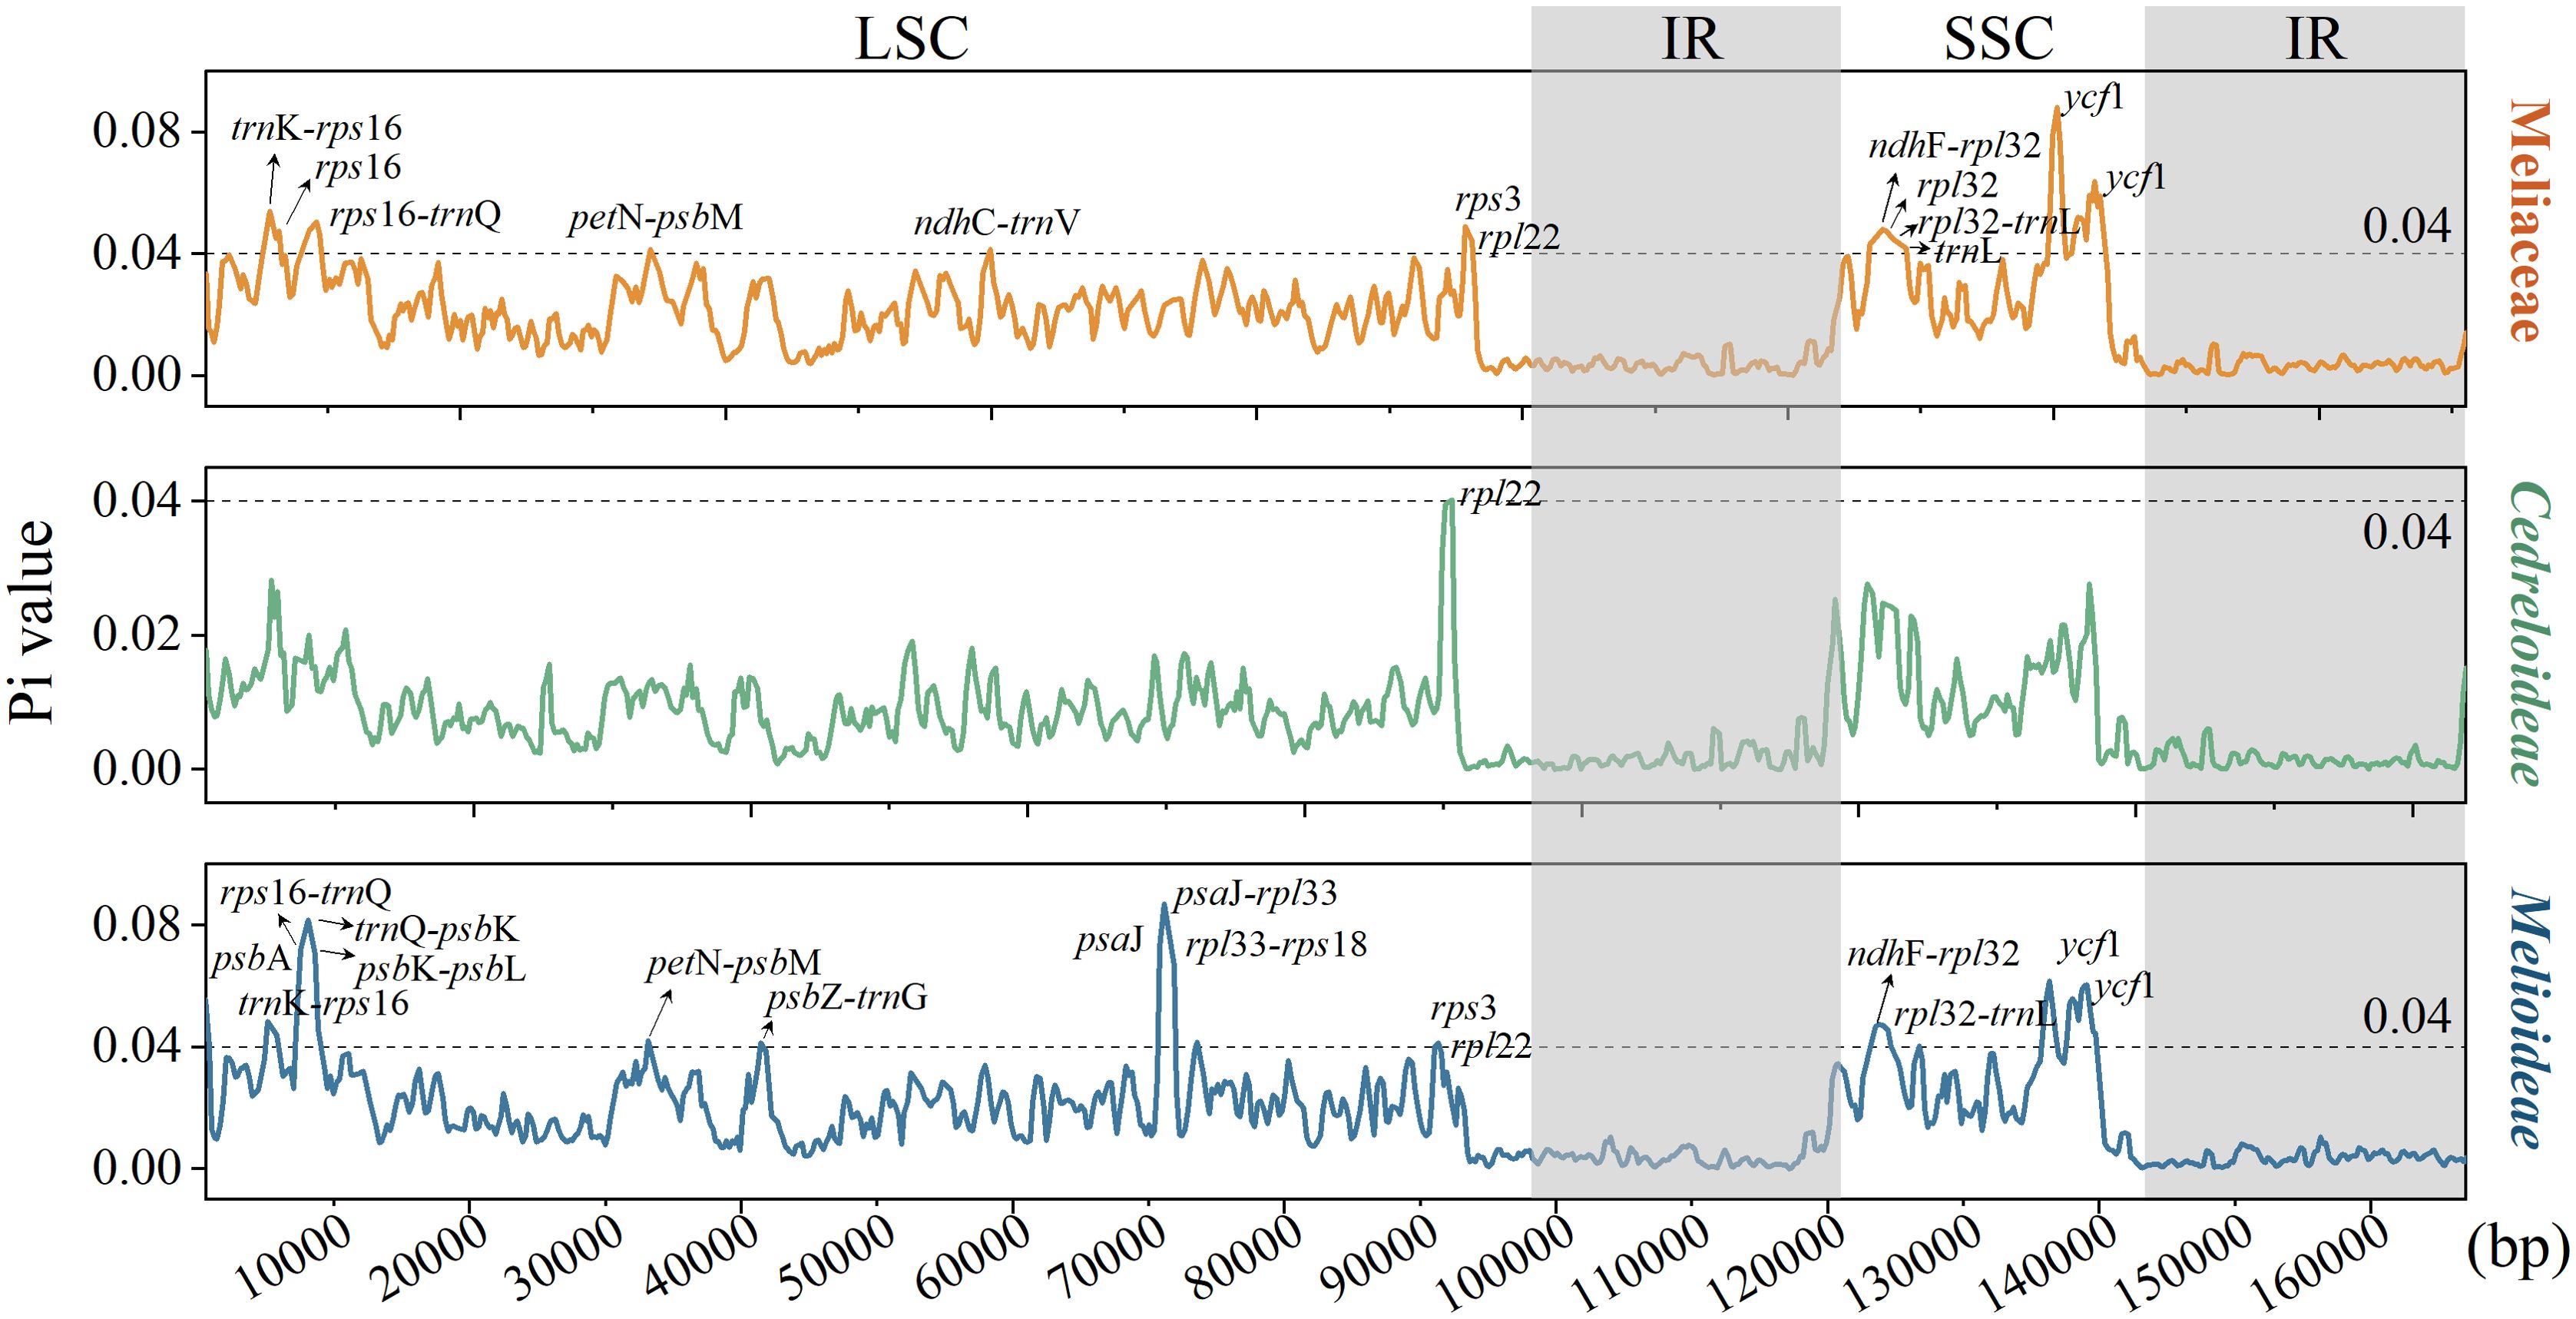
Figure 6. Nucleotide polymorphism analysis of cp genome within Meliaceae, Cedreloideae, and Melioideae.
3.4.3 Simple sequence repeats
Using MISA software for simple sequence repeat analysis, the findings revealed that the number of SSRs in Meliaceae ranged from 52 (Leplaea thompsonii) to 116 (Ag. odorata) (Figure 7A). There are six types of nucleotides in Meliaceae, comprising mononucleotide repeats through hexanucleotide repeats. Among these, mononucleotide repeats were the most abundant, ranging from 32 to 85, with A/T bases being the predominant bases. In Cedreloideae, tetranucleotide repeats accounted for the second-highest percentage. In contrast, within Melioideae, nine species exhibited a greater number of dinucleotide repeats than tetranucleotide repeats. Additionally, the AC/GT bases were found exclusively in the III clade; only Toona and Cedrela each had 2 AG/CT bases, while other species contained 0-1 AG/CT bases. Tetranucleotide repeats were the most abundant, comprising nine types; however, the AAGT/ACTT bases were limited to the ‘K. senegalensis-Lo. trichilioides’ clade, and only Entandrophragma candollei exhibited the AATT/AATT base. We identified five kinds of pentanucleotides within Meliaceae, of which AAAAG/CTTTTT occurred only in Xylocarpus and Carapa, while AAAAT/ATTTT was found exclusively in Ag. odorata, Azadirachta siamensis, and Aphanamixis polystachya, and each species of Cedreloideae contained AAATT/AATTT bases. Furthermore, only Ag. odorata possessed AATTC/AATTG bases. Hexanucleotides were detected in a limited number of Meliaceae species (Supplementary Table 3).
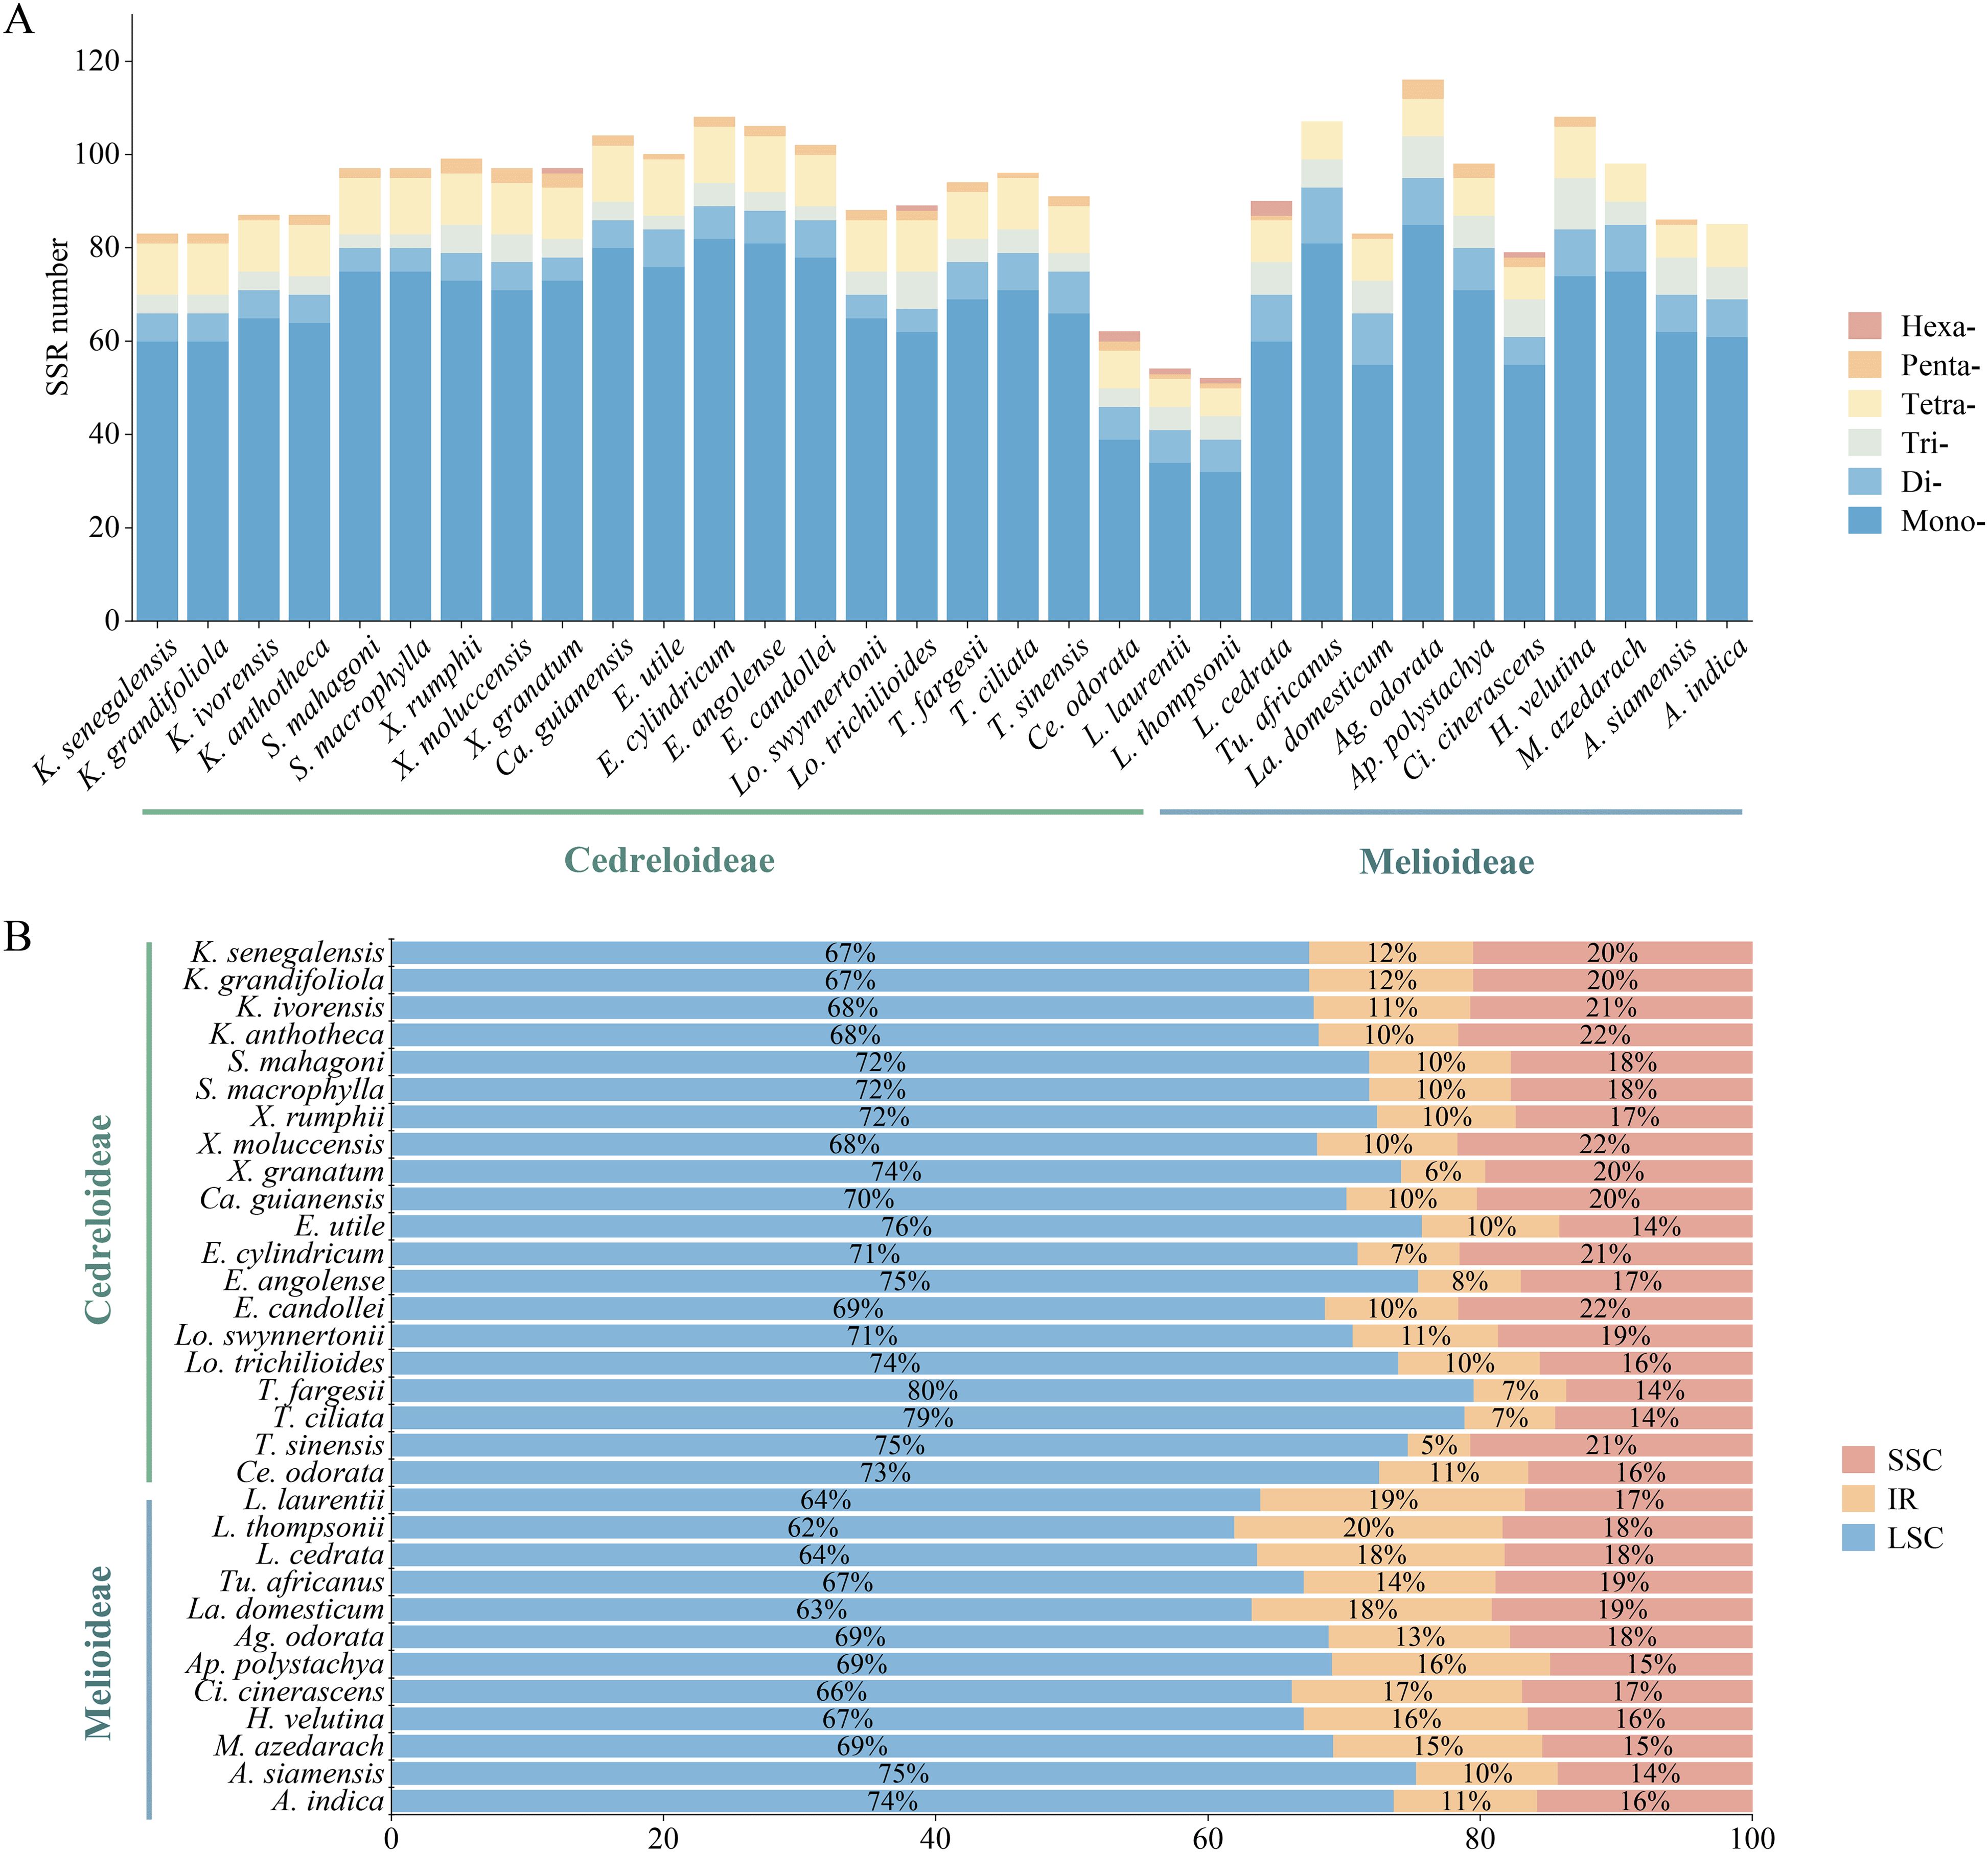
Figure 7. SSR type in the cp genomes of Meliaceae. (A) Number of SSRs in different species. (B) Percentage distribution of SSRs in different genomic regions.
Most SSRs were located in the LSC (61.97%-79.55%), while a smaller percentage were distributed in the SSC (4.6%-19.72%) and IR (13.61%-21.65%) (Figure 7B). The proportion of SSRs in Cedreloideae species in the SSC was higher than that in the IR. However, some Melioideae species exhibited an SSR percentage in the IR that was greater than or equal to that in the SSC. The SSR proportions were consistent within the same genus, with one exception noted in Leplaea.
3.4.4 Codon preference
The results of RSCU values revealed that the same codons from all Meliaceae species had similar color distributions and codon usage patterns (Figure 8; Supplementary Table 4). These codons encode for 20 amino acids (excluding stop codons). Except for methionine and tryptophan, which are encoded by single codons each, all other amino acids are encoded by multiple codons. The most frequently used codons are UUA, GCU, and AGA. Meliaceae cp genomes contain 30-31 codons with RSCU > 1. Among the 32 Meliaceae species, seven species (all of which belong to Cedreloideae) contained 31 codons with RSCU > 1. The codons with RSCU > 1 corresponded to amino acids that are preferentially coded, such as AUG, UUA, and GCU. Except for the codons UUG, AUG, and UCC, the third base of the remaining high-frequency codons terminates with either an A or U base.
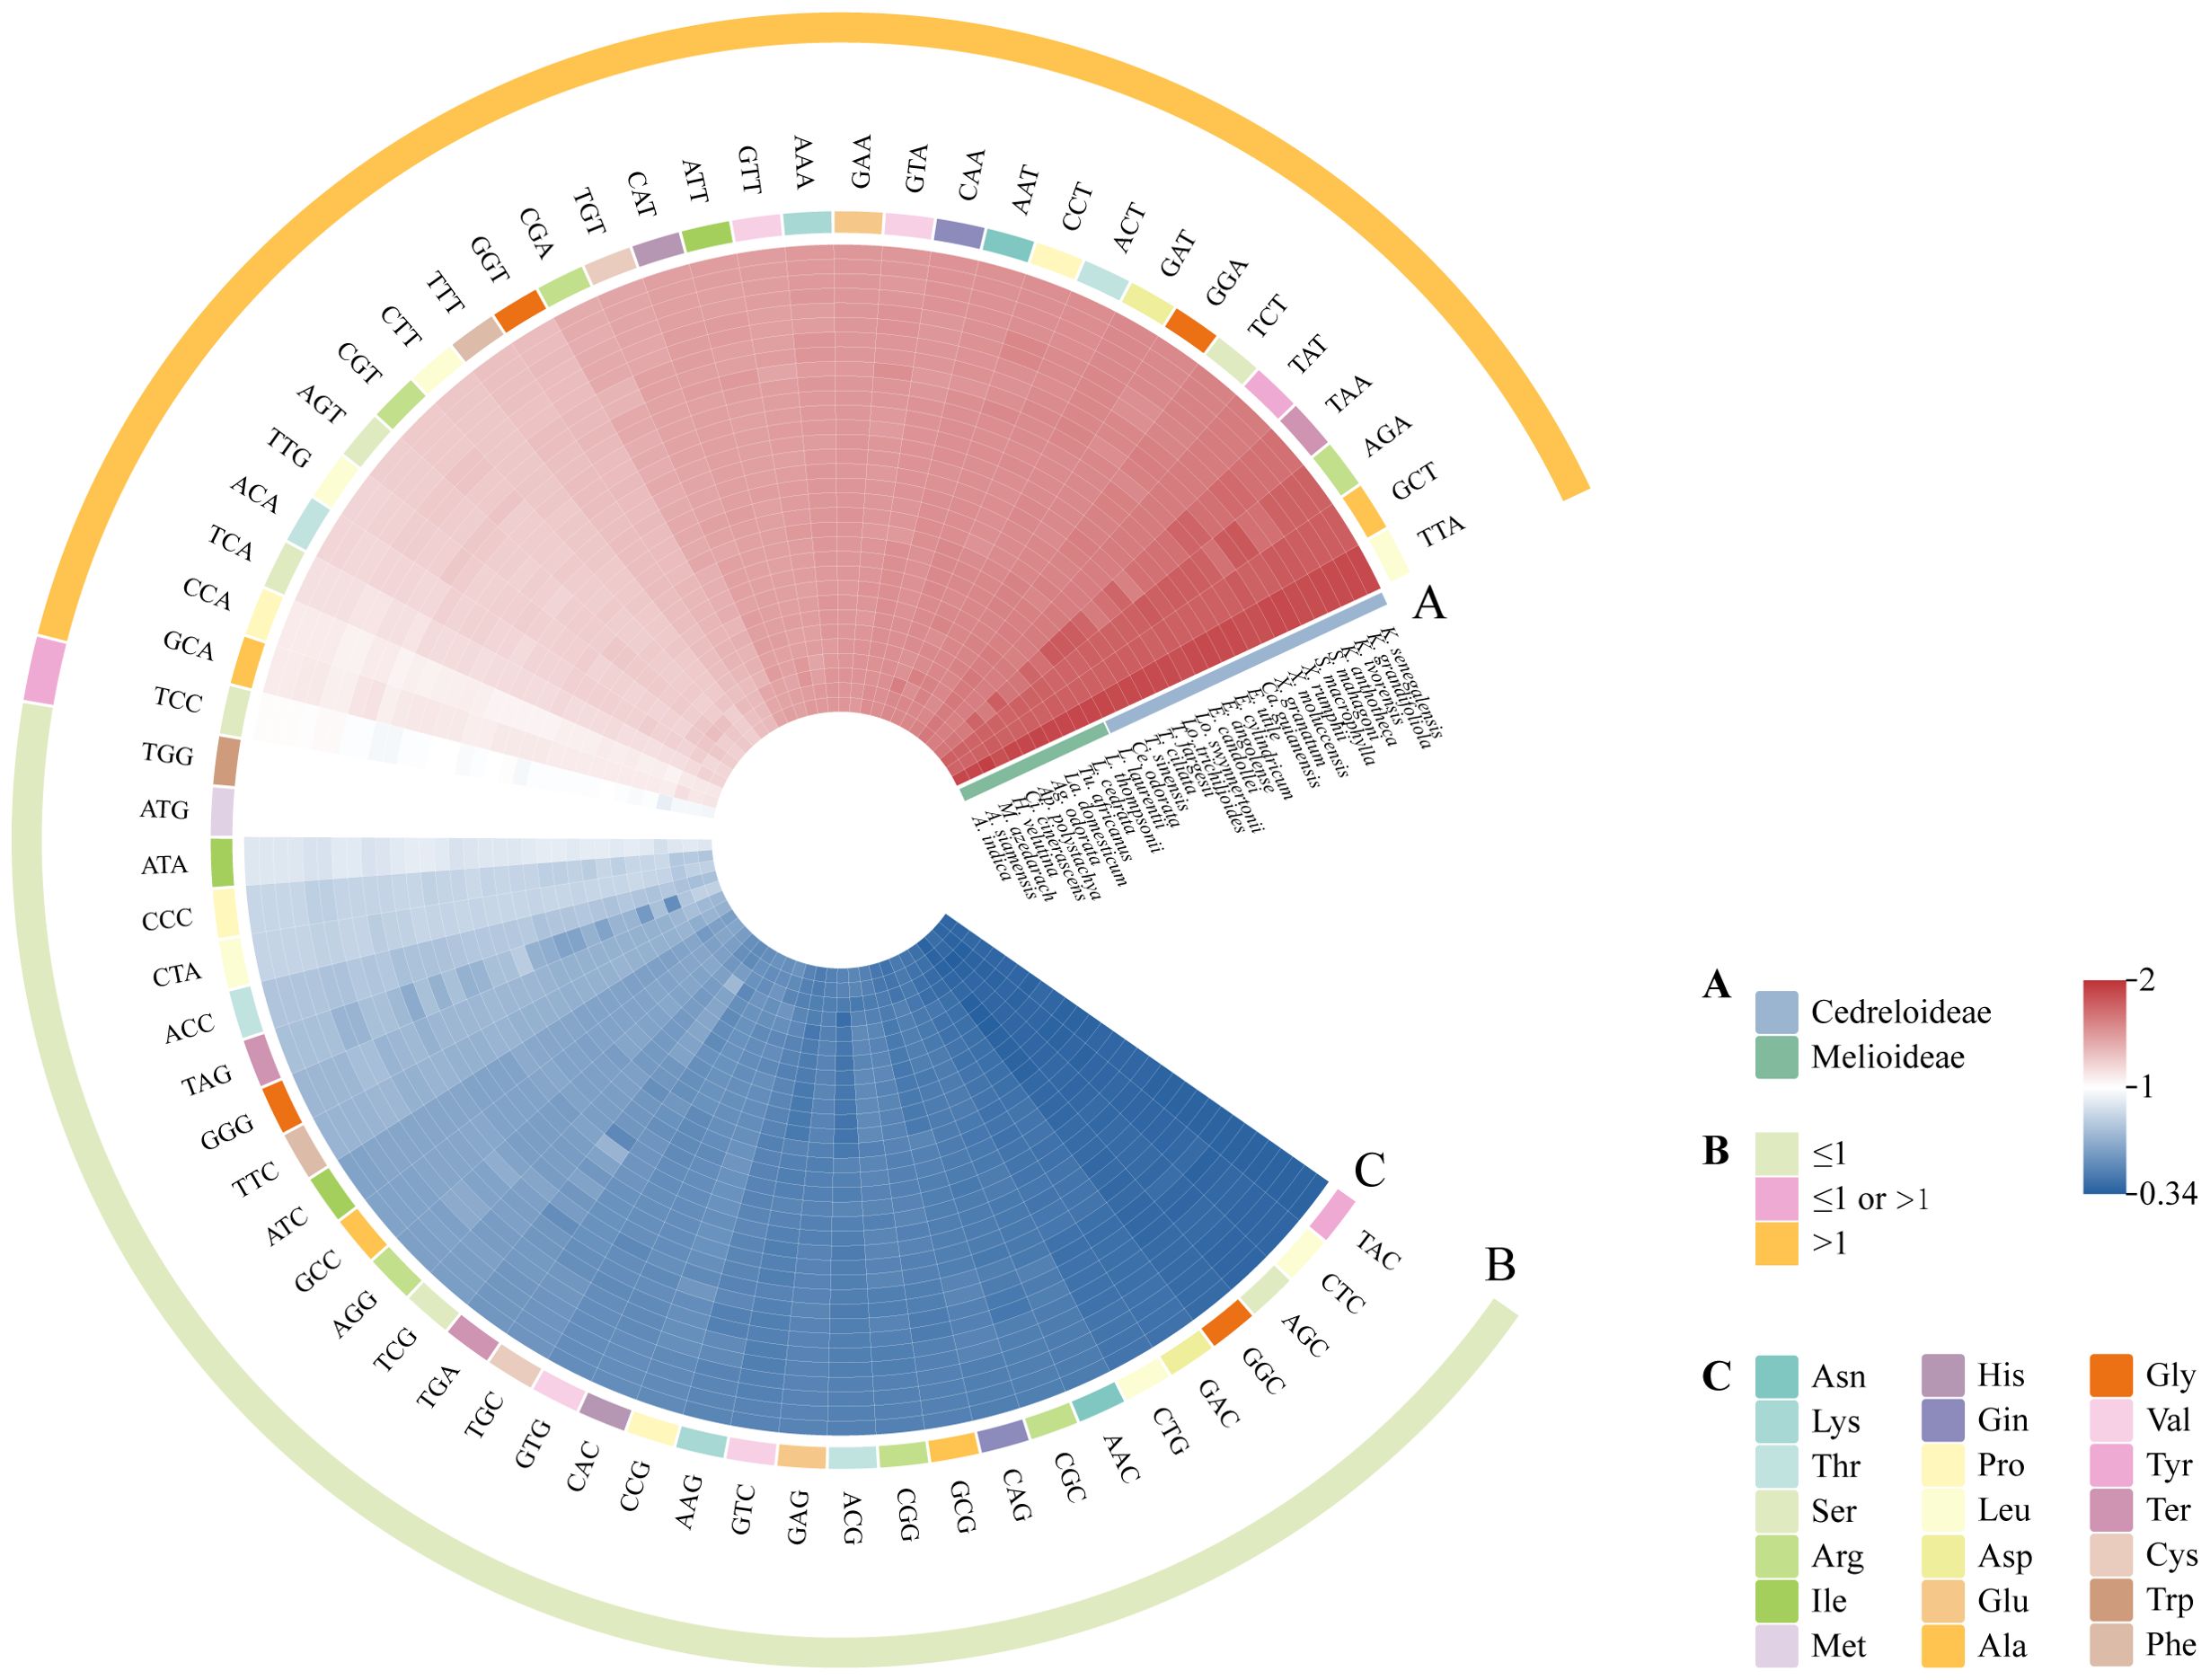
Figure 8. Codon usage mode of cp genomes in Meliaceae. The color intensity in the heatmaps represented the magnitude of the RSCU values. (A) Species from different clades are represented in different colors. (B) Yellow circles represent codons with RSCU > 1, pink circles represent codons with RSCU > 1 or RSCU ≤ 1, and green circles represent codons with RSCU ≤ 1. (C) Different colored rectangles indicate different types of amino acids encoded.
4 Discussion
4.1 Cp genome structure and gene of Meliaceae
In this research, we sequenced the cp genomes of three Toona and performed comparative analyses with 29 other Meliaceae cp genomes from NCBI. Among them, the cp genome of T. fargesii is reported for the first time. The cp genomes of Toona exhibit typical tetrameric structures, comprising LSC, SSC, IRA, and IRB. The cp genomes of Toona ranged from 159,242 bp to 159,617 bp in length, with a total GC content varying from 37.88% to 37.92%. Within Meliaceae, the lengths of the cp genome, LSC, SSC, and IR were 158,558 bp-160,978 bp, 86,390 bp-88,197 bp, 17,967 bp-18,709 bp, and 26,894 bp-27,089 bp, respectively. The total GC content ranged from 37.18% to 38.01%. Furthermore, the GC content in the IR (42.68%-42.86%) was significantly higher than that in the LSC (35.37%-36.17%) and the SSC (31.38%-32.51%). This finding is consistent with previous reports in other plant species (Wang et al., 2022). This difference may be attributed to the presence of rRNA genes with higher GC content in the IR (Li and Zheng, 2018), while the lower GC content in the SSC may be associated with the presence of the ndhH gene located within this region. Additionally, species within the Cedreloideae subfamily exhibited a higher GC content (37.77%-38.01%) compared to those within the Melioideae subfamily (37.18%-37.70%). Hao et al. (2022) found that the evolutionary rate has a negative correlation with GC content. We speculate that Cedreloideae evolved more recently than Melioideae, which is consistent with the estimation of divergence time in this study. All cp genomes of Meliaceae were annotated to 135 genes, primarily involved in photosynthesis, transcription, and translation, which is consistent with general angiosperms. These results indicate that the genome structure and gene numbers are relatively conserved among Meliaceae plants.
4.2 Phylogenetic analyses
Considerable research has been conducted on the origin and evolution of Meliaceae (Wikström et al., 2001; Muellner et al., 2007; Bell et al., 2010; Koenen et al., 2015). However, nearly all studies have constructed phylogenetic trees using plastid fragments and nuclear internal transcribed spacers. While these results identified the major clades within Meliaceae, support for certain clades composed of similar species was relatively low (Muellner et al., 2003, 2007; Muellner and Mabberley, 2008; Muellner et al., 2016; Guo et al., 2018). The use of complete cp genomes for classification has been widely recognized across several plant taxonomic groups, such as Panax (Xia et al., 2025) and Cyclorhiza (Song et al., 2025). Consequently, we constructed a phylogenetic tree of 33 complete cp genomes, including 32 distinct Meliaceae species, with Le. floridana serving as the outgroup. Phylogenetic analyses strongly support the classification of these 32 Meliaceae species into the Cedreloideae and Melioideae subfamilies. Morphological evidence further supports this division: each locule of Melioideae plants contains one or two ovules, while each ovule of Cedreloideae plants contains three or more ovules (Laino Gama et al., 2021). Furthermore, the relationships identified in our results generally agree with those reported in previous studies (Muellner et al., 2016), with most clades receiving greater support; however, subtle differences in the positioning of Swietenia were also observed. Previous studies have indicated that Swietenia, along with Khaya, Xylocarpus, and Carapa, formed the tribe Xylocarpeae (Laino Gama et al., 2021). These four genera share several morphological traits, such as a corolla with contorted aestivation and anthers inserted on the inner side of the staminal tube (Laino Gama et al., 2021). Based on five cpDNA loci, earlier taxonomy by Guo et al. (2018) suggested that Swietenia was more closely related to the Xylocarpus and Carapa clade than to Khaya. In contrast, our analysis of complete cp genomes indicates that Khaya and Swietenia formed a sister group, while Xylocarpus and Carapa constituted another sister group in our analysis. This difference may be due to the lack of sufficient information for genes or gene spacers when compared to complete cp genomes. All genera within Meliaceae exhibited strong monophyly, consistent with the findings of Oyedeji Amusa et al. (2024). However, some genera within Melioideae were represented by only one species in our analysis. We recommend collecting additional species to enhance the understanding of phylogenetic relationships within Meliaceae.
4.3 Divergence time of Meliaceae
In this study, the earliest divergence in the Meliaceae to have approximately occurred in 72.92 Ma (95% HPD: 60.62-87.01 Ma). Previous studies have reported earlier divergence time (67.5 Ma, 95% HPD: 51.8-86.4 Ma) (Guo et al., 2018), later divergence times (79.60 Ma; 80.4 Ma, 95% HPD: 69.66-89.77 Ma; 95% HPD:69.1-91.6 Ma) (Muellner et al., 2016; Koenen et al., 2015), and the divergence time that are consistent with our findings (73.0 Ma, 95% HPD: 61.4-83.9 Ma) (Muellner et al., 2007) (Supplementary Table 5). These divergence times did not differ much from our results, suggesting the reliability of our result. Most current species of Meliaceae were distributed in tropical or subtropical regions, inhabiting diverse habitats ranging from rainforests and mangrove swamps to semi-deserts (Yadav et al., 2015). Muellner et al. (2006) indicated that Meliaceae likely originated from Gondwanan and experienced an “out-of-Africa” dispersal through different routes. In the late Cretaceous, the separation of Africa and South America began at about 135-130 Ma with seafloor spreading in the South Atlantic and ended at 90-85 Ma (Jones, 1987). Subsequently, the frequency of plant dispersal gradually decreased until the Miocene epoch (Morley, 2003). Therefore, we infer that the breakup of Gondwana and subsequent continental drift led to the initial diversification of Meliaceae (about 72.92 Ma, 95% HPD: 60.62-87.01 Ma). Koenen et al. (2015) showed that Meliaceae experienced a rapid differentiation event. This rapid radiation has resulted in significant morphological overdiversification and taxonomic confounding within this family. Our results are similar to those of Koenen et al. (2015), indicating that Meliaceae species rapidly diverged from the Late Oligocene or the Early Miocene epochs. Recent speciation events may be related to the substantial fluctuations in sea level and CO2 concentrations (Carrapa et al., 2019). Plate subduction along the Pacific margin and the collision of new plates resulted in the formation of the Andes between 34 and 65 Ma (Hoorn et al., 2010). The construction of the mountains peaked for the first time during the late Oligocene to early Miocene (approximately 23 Ma). As the mountains uplifted, rainfall increased on the eastern side, promoting changes in the ecological environment (Hoorn et al., 2010). This transformation may have converted some rainforest habitats into coastal wetlands, thereby providing opportunities for Meliaceae species to colonize intertidal environments, which likely contributed to increased speciation rates within this family.
4.4 Comparative genomic analysis
Contraction and expansion of IRs are occurrences in plant evolution, affecting the length and copy number of cp genomes, leading to gene deletions, duplications, and the generation of pseudogenes. Ycf1 and rps19 have been observed to originate from the contraction and expansion of IR in angiosperms (Zhu et al., 2016). Consistent with observations in most angiosperms, ycf1 in Meliaceae begins in IR and then extends into SSC, resulting in the formation of pseudogenes. Rps19 is typically positioned at the JLA and JSB boundaries. The cp genomes of Meliaceae have undergone an expansion of IR, letting rps19 entirely into the IR. This pattern is comparable to observations in certain species from the Hydrangeaceae family (Raman et al., 2023). Contraction and expansion analyses of the IR boundaries of the cp genome in Meliaceae exhibited a high level of conservation, with the exception of the JLB junction in E. cylindricum and T. ciliata, and the JLA junction in the IV clade (Melia and Azadirachta). Khaya and Swietenia showed minimal shifts in these boundaries. This finding indicates that these two genera are the most conserved within Meliaceae.
Comparative analysis of the Meliaceae cp genomic sequences revealed the presence of several HVRs. These HVRs were identified in the interstitial regions of trnH-psbA, trnK-rps16, rps16-trnQ, petN-psbM, psbZ-trnG, ndhF-rpl32, and rpl32-trnL, as well as within the gene regions such as matK, rpoC2, ndhF, and ycf1. The majority of these HVRs were primarily concentrated in LSC and SSC. The HVRs in CNS were more abundant than those found in coding regions, similar to the patterns observed in other angiosperms (Shi et al., 2023). Among these, rpl32-trnL exhibits significant nucleotide mutations, making it an ideal molecular marker for low-order metaclassification studies in plants. TrnH-psbA and matK are commonly employed in plant DNA barcoding studies; however, previous research has revealed that trnH-psbA (Fukuda et al., 2003) and matK (Muellner et al., 2003) exhibit ordinary levels of universality and resolvability for species identification in Meliaceae.
To further elucidate the variations of HVRs, we analyzed the Pi values for Meliaceae, Cedreloideae, and Melioideae using a standardized threshold (Pi > 0.04). We identified twelve regions in Meliaceae cp genomes exhibiting high Pi values, including ycf1, trnK-rps16, rps16-trnQ, ndhF-rpl32, rps16, rpl32, rpl32-trnL, rpl22, trnL, petN-psbM, and ndhC-trnV. Furthermore, the findings indicate that the distribution of polymorphic sites changes significantly among different subfamilies. Among these, the sites of ycf1, trnK-rps16 and ndhF-rpl32 showed the highest Pi values. In Melioideae, fifteen regions were identified with high Pi values. However, only one region, rpl22, was identified as having high Pi values in Cedreloideae. This observation may be attributed to differing rates of evolution among the various subfamilies. Moreover, trnK-rps16 also exhibited higher variability detected in the Azadirachta genus. The Pi values among species within all genera were low, suggesting that the degree of species differentiation within genera is low. Most of these HVRs were located within LSC and SSC, with intergenic regions exhibiting greater variability compared to gene regions, potentially due to reduced selective pressures. Plastid barcoding markers have been employed in Meliaceae (Erickson et al., 2008), confirming their stability for species identification. For instance, Koenen (2011) revealed that ycf1 has been effectively utilized as a molecular markers, providing more informative data than conventional markers in phylogenetic analyses of Meliaceae.
Simple repetitive sequences are DNA fragments characterized by multiple repetitions of one to six nucleotides. These SSRs can be utilized in plant population genetics and evolutionary studies due to their distinct parental genetic characteristics (Su et al., 2023). We identified between 52 and 116 SSRs within Meliaceae, with mononucleotide repeats comprising the majority, consistent with earlier research (Sun et al., 2024). The predominant presence of A/T in these SSRs can be attributed to polyadenylation at the 3’ end of mRNA following transcription. Alternatively, this may result from the relative ease with which the A/T-rich strand separates from its complementary G/C-rich strand during DNA replication, which subsequently increases the likelihood of strand slippage and mismatch (Dodsworth et al., 2014). All examined cp genomes possessed mononucleotides to pentanucleotides repeats, with a minority also containing hexanucleotides repeats. Notably, the AAAAG/CTTTT repeat was identified exclusively within the ‘X. rumphii-Ca. guianensis’ clade. Combined with the IR boundary analysis results, we suspect that this is caused by the length variation of rpl22 in this clade. Specific SSR types were only observed in certain species, such as AAC/GTT (H. velutina), AATTC/AATTG (Ag. odorata), AAAAGT/ACTTTT (Ce. odorata), AACGAT/ATCGTT (Lo. trichilioides), AAGAAT/ATTCTT (L. cedrata), and AATATT/AATATT (Cipadessa cinerascens). Furthermore, species belonging to some genera (Leplaea and Aglaia) were found to lack the ACAT/ATGT repeat. However, this analysis was conducted based on the 32 sequences we employed. Therefore, broader sampling is essential in order to fully enhance the accuracy and reliability of the results. The development of such a method will greatly contribute to SSR assessments. In addition, the pattern of SSRs varied little within Leplaea, especially L. thompsonii and L. cedrata, which is similar to their phylogenetic results. Two distinct patterns of SSR distribution were evident in Meliaceae. The first pattern indicated that SSRs are predominantly located in LSC, followed by SSC, with IR exhibiting the least SSR concentration. In contrast, a second pattern revealed that while LSC remained the primary region for SSR distribution, the presence of SSRs in the IR was comparable to that in the SSC. With the exception of seven Melioideae species, the majority of species in Meliaceae conformed to the first distribution pattern. The concentration of SSRs in LSC may correlate with increased gene density and functional diversity, whereas the limited distribution of SSRs in IR could be linked to its role in maintaining genome stability. Variations in repeat types indicate diverse evolutionary histories, likely influenced by shifting selective pressures and environmental factors (Martin and Orgogozo, 2013). These SSRs represent promising candidate molecular markers for species within Meliaceae.
Codon preference is prevalent in plants and is influenced by various factors, including gene expression levels, GC content, amino acid conservation, and transcriptional selection. These factors play an important role in species evolution and genetic studies (Quax et al., 2015). RSCU is the ratio of the actual frequency of a codon to the theoretical frequency. An RSCU value greater than 1 indicates that the codon is utilized more frequently than other synonymous codons, indicating it as a high-frequency codon. Conversely, an RSCU value less than 1 suggests that the codon is a low-frequency codon. An RSCU value equal to 1 means there is no codon usage bias (De Oliveira et al., 2021). In this study, we observed that the highest frequency codons predominantly end with A/U. Our findings align with previous studies on Veratrum (Zhang et al., 2022) and Aconitum (Wang et al., 2024). The preference for A/T-ending codons may correlate with mRNA stability and translational efficiency, as these codons potentially reduce the energy required for mRNA folding, thereby accelerating translation. Specifically, the TCC codon in certain species exhibited an RSCU > 1, all of which belong to Cedreloideae. This phenomenon may result from differing mutation pressures and natural selection across clades, leading to distinct codon usage biases (Hao et al., 2022).
5 Conclusions
In this study, we sequenced and assembled the complete cp genomes of Toona. These cp genomes, along with 29 previously reported cp genomes, were comparatively analyzed within Meliaceae. Based on 32 Meliaceae complete cp genomes, we constructed an ML phylogenetic tree that exhibited high bootstrap support. The results showed that the cp genomes of 32 Meliaceae species ranged in size from 158,558 bp to 160,978 bp. These cp genomes were annotated to contain 135 unique genes. Divergence time estimation revealed that most Meliaceae species differentiated into Cedreloideae and Melioideae subfamilies (72.92 Ma, 95% HPD: 60.62-87.01 Ma) in the late Cretaceous, with many species showing recent differentiation. The pantropical distribution of Meliaceae may be attributed to long-distance dispersal, and speciation events may be explained by geological activities, fluctuations in global temperatures, sea level, and CO2 concentrations. The cp genomes of Meliaceae exhibited slight differences in genome size, IR boundaries, genomic structure, HVRs, and codon patterns. These differences were consistent with phylogenetic relationships, likely attributable to distinct environmental selection pressures and evolutionary histories. Additionally, comparative analysis of the cp genomes revealed that we identified 52-116 simple repeats (SSRs), some of which appeared only in specific groups; twelve highly variable regions were detected with Pi > 0.04. Ycf1, trnK-rps16, and ndhF-rpl32 showed the highest nucleotide polymorphisms in the cp genomes of Meliaceae, while rpl22 demonstrated high nucleotide polymorphisms in both subfamilies. These regions were utilized as candidate molecular markers for phylogenetic studies and species identification. Overall, these results can not only provide insights into the evolution and species identification of Meliaceae, but also establish a scientific foundation for the future systematic research within this family.
Data availability statement
The datasets presented in this study can be found in online repositories. The names of the repository/repositories and accession number(s) can be found in the article/Supplementary Material.
Author contributions
ZN: Data curation, Formal analysis, Methodology, Software, Visualization, Writing – original draft, Writing – review & editing. JM: Investigation, Writing – review & editing, Supervision. CW: Data curation, Writing – review & editing, Visualization. TJ: Writing – review & editing, Investigation. GL: Writing – review & editing, Investigation. MT: Writing – review & editing, Investigation, Supervision. LZ: Writing – review & editing, Conceptualization, Funding acquisition, Project administration, Supervision.
Funding
The author(s) declare that financial support was received for the research, authorship, and/or publication of this article. This study was supported by grants from the National Natural Science Foundation of China (No. 32460387, 32101515).
Conflict of interest
The authors declare that the research was conducted in the absence of any commercial or financial relationships that could be construed as a potential conflict of interest.
Generative AI statement
The author(s) declare that no Generative AI was used in the creation of this manuscript.
Publisher’s note
All claims expressed in this article are solely those of the authors and do not necessarily represent those of their affiliated organizations, or those of the publisher, the editors and the reviewers. Any product that may be evaluated in this article, or claim that may be made by its manufacturer, is not guaranteed or endorsed by the publisher.
Supplementary material
The Supplementary Material for this article can be found online at: https://www.frontiersin.org/articles/10.3389/fpls.2025.1536313/full#supplementary-material
References
Amiryousefi, A., Hyvönen, J., Poczai, P. (2018). Irscope: an online program to visualize the junction sites of chloroplast genomes. Bioinformatics 34, 3030–3031. doi: 10.1093/bioinformatics/bty220
Beier, S., Thiel, T., Münch, T., Scholz, U., Mascher, M. (2017). Misa-web: a web server for microsatellite prediction. Bioinformatics 33, 2583–2585. doi: 10.1093/bioinformatics/btx198
Bell, C. D., Soltis, D. E., Soltis, P. S. (2010). The age and diversification of the angiosperms re-revisited. Am. J. Bot. 97, 1296–1303. doi: 10.3732/ajb.0900346
Brudno, M., Malde, S., Poliakov, A., Do, C. B., Couronne, O., Dubchak, I., et al. (2003). Glocal alignment: finding rearrangements during alignment. Bioinformatics 19, i54–i62. doi: 10.1093/bioinformatics/btg1005
Carrapa, B., Clementz, M., Feng, R. (2019). Ecological and hydroclimate responses to strengthening of the hadley circulation in south america during the late miocene cooling. PNAS 116, 9747–9752. doi: 10.1073/pnas.1810721116
Castañeda Posadas, C., Cevallos Ferriz, S. R. (2007). Swietenia (Meliaceae) flower in late oligocene-early miocene amber from simojovel de allende, chiapas, Mexico. Am. J. Bot. 94, 1821–1827. doi: 10.3732/ajb.94.11.1821
Chandler, M. (1964). The lower tertiary floras of southern England. Bulletin of the British Museum of Natural History. Geology 12, 1–151. doi: 10.5962/bhl.title.110079
Conran, J. G., Lee, W. G., Lee, D. E., Bannister, J. M., Kaulfuss, U. (2014). Reproductive niche conservatism in the isolated New Zealand flora over 23 million years. Biol. Lett. 10, 20140647. doi: 10.1098/rsbl.2014.0647
Daniell, H., Lin, C., Yu, M., Chang, W. (2016). Chloroplast genomes: diversity, evolution, and applications in genetic engineering. Genome Biol. 17, 134. doi: 10.1186/s13059-016-1004-2
De Oliveira, J. L., Morales, A. C., Hurst, L. D., Urrutia, A. O., Thompson, C. R., Wolf, J. B. (2021). Inferring adaptive codon preference to understand sources of selection shaping codon usage bias. Mol. Biol. Evol. 38, 3247–3266. doi: 10.1093/molbev/msab099
Dodsworth, S., Chase, M. W., Kelly, L. J., Leitch, I. J., Macas, J., Novak, P., et al. (2014). Genomic repeat abundances contain phylogenetic signal. Syst. Biol. 64, 112–126. doi: 10.1093/sysbio/syu080
Doyle, J. J., Doyle, J. L. (1987). A rapid DNA isolation procedure for small quantities of fresh leaf tissue. Phytochem. Bull. 19, 11–15. doi: 10.2307/4119796
Edmonds, J. M. (1993). The potential value of Toona species (Meliaceae) as multipurpose and plantation trees in Southeast Asia. Com. For. Rev. 72, 181–186.
Erickson, D. L., Spouge, J., Resch, A., Weigt, L. A., Kress, J. W. (2008). DNA barcoding in land plants: developing standards to quantify and maximize success. Taxon 57, 1304–1316. doi: 10.1002/tax.2008.57.issue-4
Fukuda, T., Yokoyama, J., Tsukaya, H. (2003). Phylogenetic relationships among species in the genera Chisocheton and Guarea that have unique indeterminate leaves as inferred from sequences of chloroplast DNA. Int. J. Plant Sci. 164, 13–24. doi: 10.1086/344741
Guo, Z., Guo, W., Wu, H., Fang, X., Ng, W. L., Shi, X., et al. (2018). Differing phylogeographic patterns within the indo-west pacific mangrove genus Xylocarpus (Meliaceae). J. Biogeogr. 45, 676–689. doi: 10.1111/jbi.13151
Hao, J., Liang, Y., Ping, J., Li, J., Shi, W., Su, Y., et al. (2022). Chloroplast gene expression level is negatively correlated with evolutionary rates and selective pressure while positively with codon usage bias in Ophioglossum vulgatum L. BMC Plant Biol. 22, 580. doi: 10.1186/s12870-022-03960-8
Hoorn, C., Wesselingh, F. P., ter Steege, H., Bermudez, M. A., Mora, A., Sevink, J., et al. (2010). Amazonia through time: andean uplift, climate change, landscape evolution, and biodiversity. Sci. 330, 927–931. doi: 10.1126/science.1194585
Jia, T., Liu, K., Li, Y., Cheng, Q., Cao, W., Luo, H., et al. (2024). Differential metabolites regulate the formation of chromatic aberration in Toona fargesii wood. Ind. Crop Prod. 219, 119021. doi: 10.1016/j.indcrop.2024.119021
Jin, J. J., Yu, W. B., Yang, J. B., Song, Y., DePamphilis, C. W., Yi, T. S., et al. (2020). GetOrganelle: a fast and versatile toolkit for accurate de novo assembly of organelle genomes. Genome Biol. 21, 241. doi: 10.1186/s13059-020-02154-5
Jones, E. J. W. (1987). Fracture zones in the equatorial Atlantic and the breakup of western Pangea. Geology 15, 533–536. doi: 10.1130/0091-7613(1987)15<533:FZITEA>2.0.CO;2
Katoh, K., Misawa, K., Kuma, K., Miyata, T. (2002). Mafft: a novel method for rapid multiple sequence alignment based on fast fourier transform. Nucleic Acids Res. 30, 3059–3066. doi: 10.1093/nar/gkf436
Kearse, M., Moir, R., Wilson, A., Stones-Havas, S., Cheung, M., Sturrock, S. (2012). Geneious basic: an integrated and extendable desktop software platform for the organization and analysis of sequence data. Bioinformatics 28, 1647–1649. doi: 10.1093/bioinformatics/bts199
Koenen, E. (2011). Phylogenetic and biogeographic studies in Guareeae (Meliaceae: Melioideae). (dissertation). University of Wageningen, Wageningen, Netherlands.
Koenen, E., Clarkson, J. J., Pennington, T. D., Chatrou, L. W. (2015). Recently evolved diversity and convergent radiations of rainforest mahoganies (Meliaceae) shed new light on the origins of rainforest hyperdiversity. New Phytol. 207, 327–339. doi: 10.1111/nph.13490
Laino Gama, R., Muellner Riehl, A. N., Demarco, D., Pirani, J. R. (2021). Evolution of reproductive traits in the mahagony family (Meliaceae). J. Syst. Evol. 59, 21–43. doi: 10.1111/jse.12572
Li, B., Zheng, Y. (2018). Dynamic evolution and phylogenomic analysis of the chloroplast genome in schisandraceae. Sci. Rep. 8, 9285. doi: 10.1038/s41598-018-27453-7
Liu, Y., Lin, L., Yang, D., Zou, X., Zhang, Z., Liu, M., et al. (2022). Comparative phylogenetic analysis of oolong tea (Phoenix Dancong tea) using complete chloroplast genome sequences. Heliyon 8, e12557. doi: 10.1016/j.heliyon.2022.e12557
Lu, Z., Dong, X., Fan, Y., Liu, W., Dai, J., Han, X., et al. (2022). Complete chloroplast genome of Toona ciliata Roem. var. pubescens (Franch.) Hand.-Mazz (Meliaceae), ‘Chinese mahogany’. Mitochondrial DNA B. 7, 495–497. doi: 10.1080/23802359.2022.2049987
Mabberley, D. J., Pannell, C. M., Sing, A. M. (1995). Meliaceae. Flora Malesiana-Series 1 Spermatophyta 12, 1–407. doi: 10.5555/19960605484
Mader, M., Pakull, B., Blanc-Jolivet, C., Paulini-Drewes, M., Bouda, Z. H. N., Degen, B., et al. (2018). Complete chloroplast genome sequences of four Meliaceae species and comparative analyses. Int. J. Mol. Sci. 19, 701. doi: 10.3390/ijms19030701
Martin, A., Orgogozo, V. (2013). The loci of repeated evolution: a catalog of genetic hotspots of phenotypic variation. Evolution 67, 1235–1250. doi: 10.1111/evo.12081
Morley, R. J. (2003). Interplate dispersal paths for megathermal angio-sperms. Perspect. Plant Ecol. Evol. Syst. 6, 5–20. doi: 10.1078/1433-8319-00039
Muellner, A. N., Mabberley, D. J. (2008). Phylogenetic position and taxonomic disposition of turraea breviflora (Meliaceae), a hitherto enigmatic species. Blumea 53, 607–616. doi: 10.3767/000651908X607549
Muellner, A. N., Samuel, R., Johnson, S. A., Cheek, M., Pennington, T. D., Chase, M. W., et al. (2003). Molecular phylogenetics of Meliaceae (Sapindales) based on nuclear and plastid DNA sequences. Am. J. Bot. 90, 471–480. doi: 10.3732/ajb.90.3.471
Muellner, A. N., Savolainen, V., Samuel, R., Chase, M. W. (2006). The mahogany family “out-of-Africa”: Divergence time estimation, global biogeographic patterns inferred from plastid rbcL DNA sequences, extant, and fossil distribution of diversity. Mol. Phylogenet. Evol. 40, 236–250. doi: 10.1016/j.ympev.2006.03.001
Muellner, A. N., Schaefer, H., Lahaye, R. (2011). Evaluation of candidate DNA barcoding loci for economically important timber species of the mahogany family (Meliaceae). Mol. Ecol. Resour. 11, 450–460. doi: 10.1111/j.1755-0998.2011.02984.x
Muellner, A. N., Vassiliades, D. D., Renner, S. S. (2007). Placing biebersteiniaceae, a herbaceous clade of Sapindales, in a temporal and geographic context. Plant Syst. Evol. 266, 233–252. doi: 10.1007/s00606-007-0546-x
Muellner, A. N., Weeks, A., Clayton, J. W., Buerki, S., Nauheimer, L., Chiang, Y. C., et al. (2016). Molecular phylogenetics and molecular clock dating of Sapindales based on plastid rbcL, atpB and trnL-trnF DNA sequences. Taxon 65, 1019–1036. doi: 10.12705/655.5
Nguyen, L. T., Schmidt, H. A., Von Haeseler, A., Minh, B. Q. (2015). IQ-TREE: a fast and effective stochastic algorithm for estimating maximum-likelihood phylogenies. Mol. Biol. Evol. 32, 268–274. doi: 10.1093/molbev/msu300
Oyedeji Amusa, M. O., Stewart, R. D., van der Bank, M., van Wyk, B. (2024). A taxonomic review of South African indigenous meliaceae using molecular systematics and anatomical data. Diversity 16, 113. doi: 10.3390/d16020113
Petit, R. J., Duminil, J., Fineschi, S., Hampe, A., Salvini, D., Vendramin, G. G., et al. (2005). Comparative organization of chloroplast, mitochondrial and nuclear diversity in plant populations. Mol. Ecol. 14, 689–701. doi: 10.1111/j.1365-294X.2004.02410.x
Puttick, M. N. (2019). McmctreeR: functions to prepare MCMCtree analyses and visualize posterior ages on trees. Bioinformatics 35, 5321–5322. doi: 10.1093/bioinformatics/btz554
Quax, T. E., Claassens, N. J., Söll, D., van der Oost, J. (2015). Codon bias as a means to fine-tune gene expression. Mol. Cell 59, 149–161. doi: 10.1016/j.molcel.2015.05.035
Raman, G., Choi, K., Lee, E. M., Morden, C. W., Shim, H., Kang, J. S., et al. (2023). Extensive characterization of 28 complete chloroplast genomes of Hydrangea species: a perspective view of their organization and phylogenetic and evolutionary relationships. Comp. Struct. Biotechnol. J. 21, 5073–5091. doi: 10.1016/j.csbj.2023.10.010
Rambaut, A. (2007). FigTree v1.4.4. IEB UoE. Available online at: https://github.com/rambaut/figtree (Accessed September 10, 2024).
Rambaut, A., Drummond, A. J., Xie, D., Baele, G., Suchard, M. A. (2018). Posterior summarization in bayesian phylogenetics using tracer 1.7. Syst. Biol. 67, 901–904. doi: 10.1093/sysbio/syy032
Rozas, J., Ferrer-Mata, A., Sanchez-DelBarrio, J. C., Guirao-Rico, S., Librado, P., Ramos-Onsins, S. E., et al. (2017). DnaSP 6: DNA sequence polymorphism analysis of large data sets. Mol. Biol. Evol. 34, 3299–3302. doi: 10.1093/molbev/msx248
Shi, L., Chen, H., Jiang, M., Wang, L., Wu, X., Huang, L., et al. (2019). CPGAVAS2, an integrated plastome sequence annotator and analyzer. Nucleic. Acids Res. 47, W65–W73. doi: 10.1093/nar/gkz345
Shi, W., Song, W., Liu, J., Shi, C., Wang, S. (2023). Comparative chloroplast genome analysis of Citrus (Rutaceae) species: insights into genomic characterization, phylogenetic relationships, and discrimination of subgenera. Sci. Hortic. 313, 111909. doi: 10.1016/j.scienta.2023.111909
Song, B. N., Aou, X., Tian, R. M., Cai, J., Tan, W. Y., Liu, C. K., et al. (2025). Morphology, phylogeography, phylogeny, and taxonomy of Cyclorhiza (Apiaceae). Front. Plant Sci. 15. doi: 10.3389/fpls.2024.1504734
Su, H., Ding, X., Liao, B., Zhang, D., Huang, J., Bai, J., et al. (2023). Comparative chloroplast genomes provided insights into the evolution and species identification on the Datureae plants. Front. Plant Sci. 14. doi: 10.3389/fpls.2023.1270052
Sun, W., Wei, Z., Gu, Y., Wang, T., Liu, B., Yan, Y. (2024). Chloroplast genome structure analysis of Equisetum unveils phylogenetic relationships to ferns and mutational hotspot region. Front. Plant Sci. 15. doi: 10.3389/fpls.2024.1328080
Tan, F., Li, W., Feng, H., Huang, Y., Banerjee, A. K. (2023). Interspecific variation and phylogenetic relationship between mangrove and non-mangrove species of a same family (Meliaceae)-insights from comparative analysis of complete chloroplast genome. Peerj 11, e15527. doi: 10.7717/peerj.15527
Tillich, M., Lehwark, P., Pellizzer, T., Ulbricht-Jones, E. S., Fischer, A., Bock, R., et al. (2017). GeSeq-versatile and accurate annotation of organelle genomes. Nucleic. Acids Res. 45, W6–W11. doi: 10.1093/nar/gkx391
Wang, G., Ren, Y., Su, Y., Zhang, H., Li, J., Han, J. (2024). Molecular marker development and phylogenetic analysis of Aconitum species based on chloroplast genomes. Ind. Crop Prod. 221, 119386. doi: 10.1016/j.indcrop.2024.119386
Wang, S., Gao, J., Su, Y., Chao, H., Zhao, L., Pu, W. (2022). Comparative chloroplast genomes of nicotiana species (Solanaceae): insights into the genetic variation, phylogenetic relationship, and polyploid speciation. Front. Plant Sci. 13. doi: 10.3389/fpls.2022.899252
Wikström, N., Savolainen, V., Chase, M. W. (2001). Evolution of the angiosperms: calibrating the family tree. Proc. R. Soc Lond. B Biol. Sci. 268, 2211–2220. doi: 10.1098/rspb.2001.1782
Wu, X., Wu, S., Ren, D., Zhu, Y., He, F. (2007). The analysis method and progress in the study of codon bias. Hereditas 29, 420–426. doi: 10.1360/yc-007-0420
Xia, P., Huang, Y., Zhu, J. (2025). The complete chloroplast genome sequences of 11 Panax species: Providing insights for evolution and species identification. Ind. Crop Prod. 223, 120160. doi: 10.1016/j.indcrop.2024.120160
Yadav, R., Pednekar, A., Avalaskar, A., Rathi, M., Rewachandani, Y. (2015). A comprehensive review on Meliaceae family. World J. Pharm. Sci. 3, 1572–1577.
Zhang, D., Gao, F., Jakovlić, I., Zou, H., Zhang, J., Li, W. X., et al. (2020). PhyloSuite: an integrated and scalable desktop platform for streamlined molecular sequence data management and evolutionary phylogenetics studies. Mol. Ecol. Resour. 20, 348–355. doi: 10.1111/1755-0998.13096
Zhang, Y., Han, L., Yang, C., Yin, Z., Tian, X., Qian, Z., et al. (2022). Comparative chloroplast genome analysis of medicinally important Veratrum (Melanthiaceae) in China: insights into genomic characterization and phylogenetic relationships. Plant Divers. 44, 70–82. doi: 10.1016/j.pld.2021.05.004
Zheng, S., Poczai, P., Hyvonen, J., Tang, J., Amiryousefi, A. (2020). Chloroplot: an online program for the versatile plotting of organelle genomes. Front. Genet. 11. doi: 10.3389/fgene.2020.576124
Keywords: Meliaceae, Toona, chloroplast genome, comparative analyses, divergence times
Citation: Nie Z, Ma J, Wang C, Tang M, Jia T, Liao G and Zhang L (2025) Comparative analysis of chloroplast genomes on Meliaceae species: insights into the evolution and species identification. Front. Plant Sci. 16:1536313. doi: 10.3389/fpls.2025.1536313
Received: 28 November 2024; Accepted: 21 February 2025;
Published: 11 March 2025.
Edited by:
Zhuchou Lu, Chinese Academy of Forestry, ChinaReviewed by:
Xiu-Qun Liu, Huazhong Agricultural University, ChinaHafiz Muhammad Wariss, University of Sargodha, Pakistan
Copyright © 2025 Nie, Ma, Wang, Tang, Jia, Liao and Zhang. This is an open-access article distributed under the terms of the Creative Commons Attribution License (CC BY). The use, distribution or reproduction in other forums is permitted, provided the original author(s) and the copyright owner(s) are credited and that the original publication in this journal is cited, in accordance with accepted academic practice. No use, distribution or reproduction is permitted which does not comply with these terms.
*Correspondence: Lu Zhang, emhhbmdsdTg1NkBtYWlsLmp4YXUuZWR1LmNu