
94% of researchers rate our articles as excellent or good
Learn more about the work of our research integrity team to safeguard the quality of each article we publish.
Find out more
ORIGINAL RESEARCH article
Front. Plant Sci., 06 March 2025
Sec. Photosynthesis and Photobiology
Volume 16 - 2025 | https://doi.org/10.3389/fpls.2025.1478346
This article is part of the Research TopicPhotosynthesis under Variable Environmental ConditionsView all 4 articles
 Xiao-Long Yang1,2†
 Ting An3†Zi-Wu-Yin Ye4
 Hua-Jing Kang5
 Piotr Robakowski6
 Zi-Piao Ye7,8*
 Fu-Biao Wang8
 Shuang-Xi Zhou9*
Effective quantum efficiency of photosystem II (ΦPSII) represents the proportion of photons of incident light that are actually used for photochemical processes, which is a key determinant of crop photosynthetic efficiency and productivity. A robust model that can accurately reproduce the nonlinear light response of ΦPSII (ΦPSII–I) over the I range from zero to high irradiance levels is lacking. In this study, we tested a ΦPSII–I model based on the fundamental properties of light absorption and transfer of energy to the reaction centers via photosynthetic pigment molecules. Using a modeling-observation intercomparison approach, the performance of our model versus three widely used empirical ΦPSII–I models were compared against observations for two C3 crops (peanut and cotton) and two cultivars of a C4 crop (sweet sorghum). The results highlighted the significance of our model in (1) its accurate and simultaneous reproduction of light response of both ΦPSII and the photosynthetic electron transport rate (ETR) over a wide I range from light limited to photoinhibition I levels and (2) accurately returning key parameters defining the light response curves.
Light intensity (I; see Table 1 for list of abbreviations and definitions) exhibits dynamic fluctuations across various temporal scales, ranging from seconds to months due to wind-induced leaf movements and diurnal solar variations (Liu et al., 2021). Under low I conditions, plants efficiently channel the majority of absorbed light to reaction centers for photochemical processes. Under high I conditions, plants dissipate approximately 80% of absorbed light as heat through non-photochemical quenching (NPQ) to prevent light damage (Niyogi and Truong, 2013). The generation of NPQ primarily originates from the de-excitation of light-harvesting pigment molecules in excited state (Nk). Consequently, there exists a significant correlation between the quantity of Nk and the magnitude of NPQ. Additionally, the light environment within leaves is highly heterogeneous due to the focusing effect of epidermal cells and the light-guiding properties of vascular bundle sheath structures (Xiao et al., 2016; Song et al., 2017). This heterogeneity results in significant I variations among different cells within the leaf and even among chloroplasts within the same mesophyll cell (Xiao et al., 2016). Photosystems within chloroplasts constantly operate in a highly dynamic light environment, and accurate modeling of photosynthetic responses to rapid change of I is important for us to understand the adaptive responses of plants to the changing light environments.
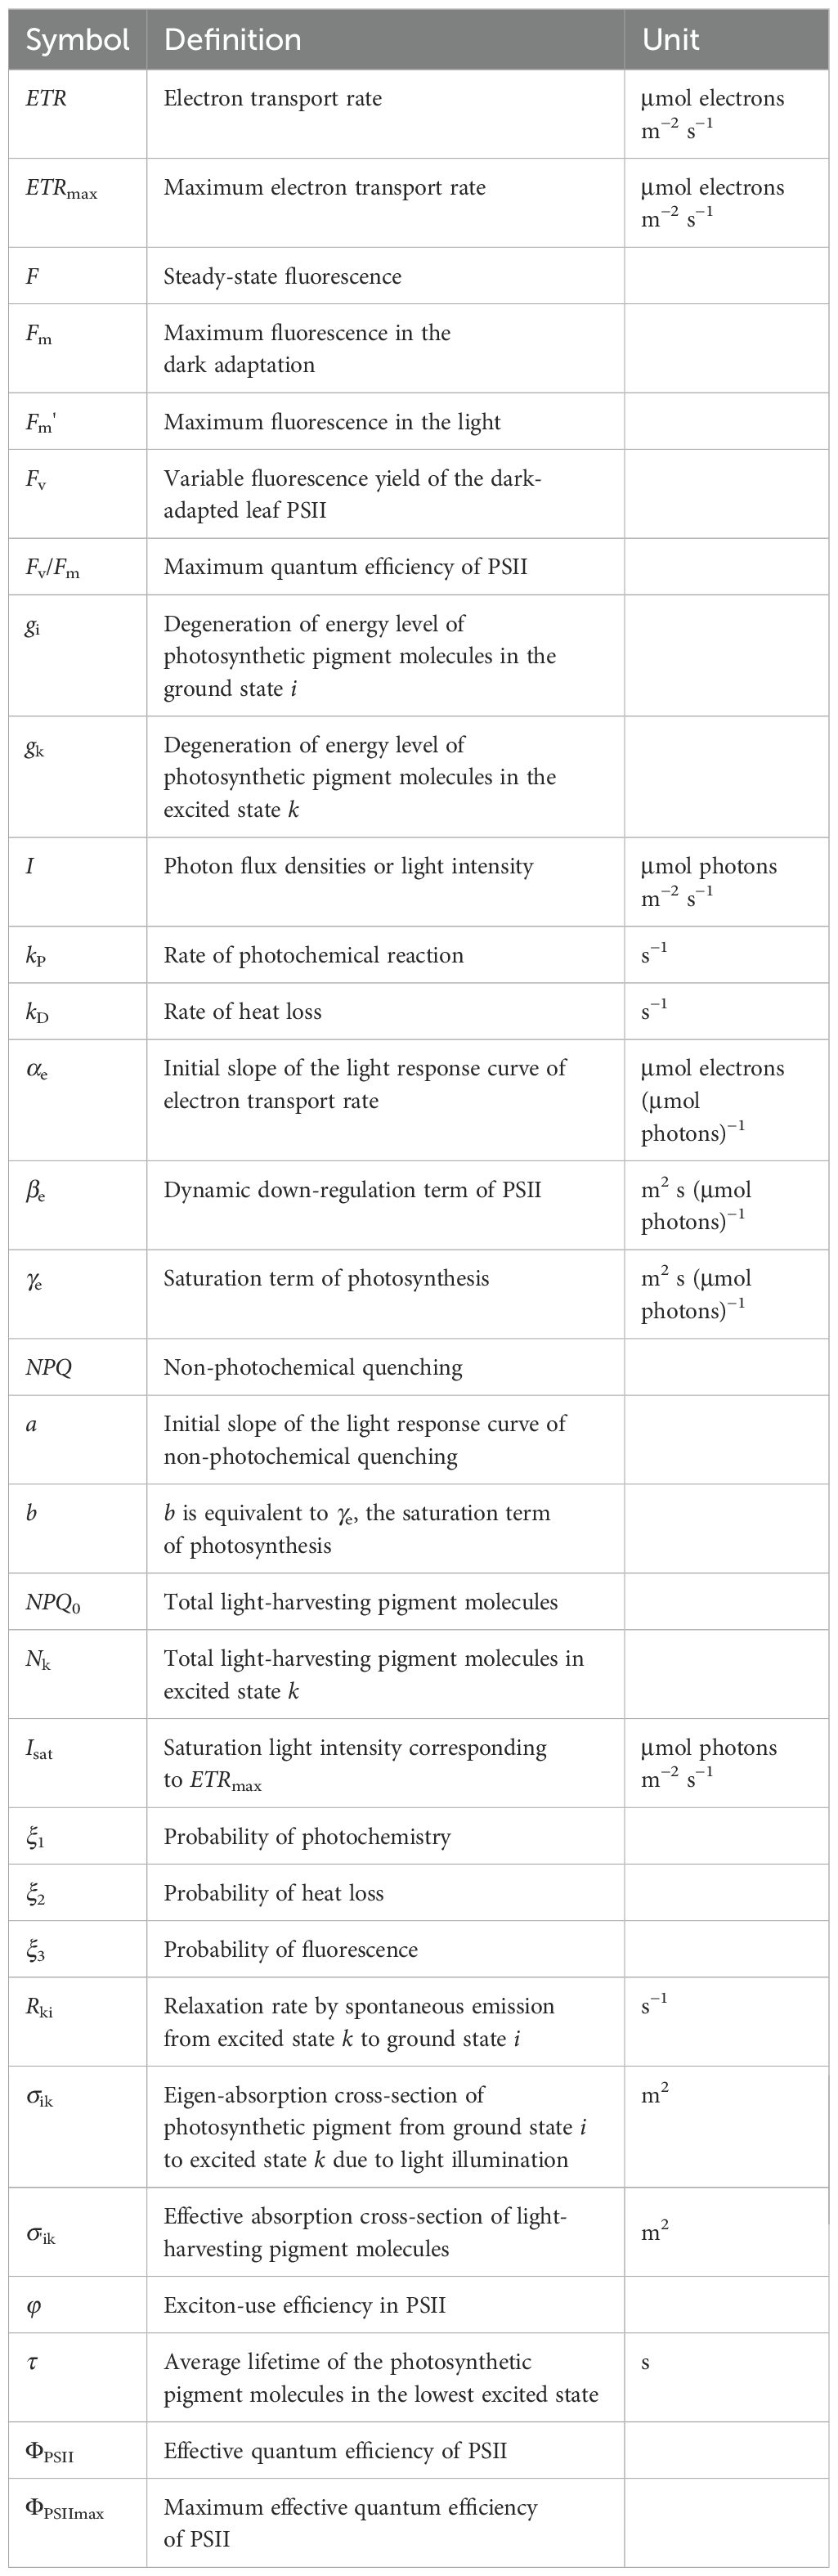
Table 1. List of major model parameters defining the light response curves of effective quantum efficiency of photosystem II (ΦPSII) and electron transport rate (ETR).
Photosystem II (PSII) is pivotal in the light-dependent reactions of photosynthesis, driving the initial steps of energy conversion. Its activity can be conveniently assayed using bio-optical techniques (Buckley and Farquhar, 2004; Robakowski, 2005; Baker, 2008; Pavlovič et al., 2011; Shevela et al., 2023), with chlorophyll a fluorescence being the most widely adopted method. This technique facilitates the research into several key photosynthetic properties, including the maximum quantum efficiency of PSII (Fv/Fm), the effective quantum efficiency of PSII [ΦPSII = (Fm′ − F′)/Fm′, where Fm′ is the maximum fluorescence in the light and F′ is steady-state fluorescence], the photosynthetic electron transport rate (ETR) and NPQ. In addition, given that the generation of NPQ mainly results from the de-excitation of Nk, the concurrent change in Nk and NPQ with the increasing I should be able to be characterized with a robust model.
ΦPSII and ETR are the most widely used photochemical parameters to assess the efficiency of plant photochemistry in different environments (Genty et al., 1989; Moin et al., 2016). ΦPSII represents the proportion of photons of incident light that are actually used to drive photochemistry, and it is closely linked with the closure and opening of PSII in photosynthetic primary reactions and chlorophyll fluorescence emission (Baker, 2008). Meanwhile, ETR is closely related to ΦPSII and I (Genty et al., 1989; Krall and Edwards, 1992). Many studies using fluorescence techniques to determine ΦPSII found it decreasing nonlinearly with the increasing I (Robakowski, 2005; Pavlovič et al., 2011; van der Tol et al., 2014; Córdoba et al., 2016). With the increasing I, ETR initially increased, and then, it reached a platform or there occurred photoinhibition or dynamic downregulation of PSII at high light intensities. This nonlinear relationship reflects the complex interplay between light absorption, energy transfer, and dissipation mechanisms in the photosynthetic apparatus, highlighting the adaptive responses of plants to varying environments.
No model has yet been reported to simultaneously accurately reproduce ΦPSII–I and ETR–I curves over a wide I range from zero to photoinhibitory I levels. Among the limited studies characterizing the ΦPSII–I curve, the negative exponential function and the exponential function are the most widely used models (Webb et al., 1974; Smyth et al., 2004; Ritchie, 2008; Ritchie and Bunthawin, 2010; Silsbe and Kromkamp, 2012; Robakowski et al., 2018). However, it has been reported that the values of Isat estimated by the negative exponential functions are significantly higher than the measured values (Robakowski, 2005; Ritchie, 2008; Ritchie and Bunthawin, 2010). In addition, the non-rectangular hyperbolic model (NRH model) is the most widely used to characterize the ETR–I curve and returning ETRmax (von Caemmerer, 2000; Long and Bernacchi, 2003; Miao et al., 2009; Yin et al., 2009; Gu et al., 2010; Bernacchi et al., 2013; von Caemmerer, 2013; Buckley and Diaz-Espejo, 2015; Cai et al., 2018; Yin et al., 2021). However, the NRH model significantly have been reported to overestimate ETRmax, and it cannot return a realistic Isat due to its asymptotic function (Buckley and Diaz-Espejo, 2015; Yang et al., 2024). Experimentally, the value of ΦPSIImax was measured when I was 0 μmol photons m−2 s−1.
In this study, we aimed to develop and test a ΦPSII–I model based on the fundamental properties of light absorption of photosynthetic pigment molecules (Ye et al., 2013a, 2013b). We evaluated the performance of the model using a modeling-observation intercomparison approach against observations conducted on two C3 corps (peanut and cotton) and two genotypes of a C4 crop (sweet sorghum cultivars KFJT-1 and KFJT-4). We also compared the robustness of this model against three widely used empirical ETR–I and ΦPSII–I models (i.e., the negative exponential function, the exponential function, and the NRH model) in their performances of (1) reproducing the observed light response curves and (2) returning key parameters defining the curves (i.e., ΦPSIImax, ETRmax and the corresponding Isat).
Seeds of peanut (Arachis hypogaea L.) and cotton (Gossypium hirsutum L.) were surface disinfected with 70% ethanol and 20% bleach, then planted in trays and placed in an RDN-1000E-4 growth chamber (Ningbo Dongnan Instrument Co., China) under conditions of 23°C and 28°C (16 h/8 h light/dark cycle) for cultivation. When the seedlings developed two cotyledons, they were transplanted into the fields of the Botanical Garden at Nantong University. Field management was carried out according to the previously described methods (Wang et al., 2017). Seedling cultivation of sweet sorghum (Sorghum bicolor L. Moench, KFJT-1 and KFJT-4) followed the protocols established in our previous research (Yang et al., 2024). These two strains were developed by the Institute of Modern Physics, Chinese Academy of Sciences, through heavy ion irradiation of the parental line KFJT-CK. The cultivated seedlings were transferred to plastic pots and placed in a climate-controlled chamber, where they were grown under 25,000 lx light intensity, at 25°C, and with a 16 h/8 h light/dark cycle. Healthy plants bearing eight leaves were selected for data measurements for each species.
The Ye model provides a mechanistic framework for describing the light response of ETR in PSII based on the biophysical properties of light-harvesting pigment molecules using Equation 1 (Ye et al., 2013a, 2013b):
where φ is the exciton-use efficiency in PSII, N0 is total photosynthetic pigment molecules of the measured leaf, S is the leaf area (m2), and gi and gk are the degeneration of energy levels of photosynthetic pigments in the ground state (i) and excited state (k), respectively. kP and kD are rates of the photochemical reaction and heat loss, respectively (Baker, 2008). ξ1, ξ2, and ξ3 are the occupation probability of photochemistry, heat loss, and fluorescence emission, respectively. σik is the eigen-absorption cross-section of photosynthetic pigments from the ground state i to the excited state k via light exposure, and τ is the average lifetime of the photosynthetic pigments in the lowest excited state k.
To simplify Equation 1, three aggregate parameters encapsulating biophysical dynamics are introduced: [μmol electrons (μmol photons)−1] represents the initial slope of the light response curve of electron transport rate (ETR–I curve), [m2 s (μmol photons)−1] reflects the dynamic downregulation term of PSII, and [m2 s (μmol photons)−1] represents the saturation term of photosynthesis.
With these parameters, Equation 1 simplifies to:
Equations 1 and 2 describe ETR–I function and depict the interdependence between ETR and biophysical parameters.
Since Equation 1 is a non-asymptotic function, it has the first derivative. When the first derivative of Equation 1 equals to zero, Isat is calculated as follows:
Substituting Equation 3 into Equation 2, the maximum ETR (ETRmax) can be determined using Equation 4:
Moreover, combing Equation 1 with ETR =α×β×ΦPSII×I (Krall and Edwards, 1992), the relationship between ΦPSII and I can be described as follows:
Simplified, this becomes:
where .
The effective absorption cross-section of light-harvesting pigment molecules (σ′ik), which represents its ability to absorb light energy with I, can also be expressed as a function of I (Ye et al., 2013b). Namely,
Equation 7 shows that σ′ik increases with kP, kD, ξ1, ξ2, ξ3, and 1/τ but decreases with I. σ′ik = σik when I = 0 μmol photons m−2 s−1. As such, the light absorption cross-section is not a constant under any given I (excluding I = 0 μmol photons m−2 s−1). By introducing βe and γe, Equation 7 can be simplified to:
Comparing Equation 5 with Equation 7, the relationship between ΦPSII and σ′ik is described by Equation 9:
For a given species under given environmental conditions, the values of ΦPSIImax and σik are constants. Equation 9 demonstrates that ΦPSII is directly proportional to σ′ik, and it changes as a function of σ′ik.
The number of photosynthetic pigment molecules in the excited state k (Nk) can be expressed as:
Equation 10 demonstrates that Nk is a dynamic variable, exhibiting continuous fluctuations rather than maintaining constant values. Nk decreases with kP, kD, ξ1, ξ2, and ξ3 but increases with σik, τ, and I. Under dark conditions (I = 0 μmol photons m−2 s−1), it must be that Nk equals 0.
By applying βe and γe to Equation 10, it can be simplified to:
Equation 11 shows that Nk increases with the increasing I.
Considering that chlorophyll fluorescence primarily stems from light-harvesting pigment molecules in the excited state, it is logical to infer that NPQ response to I would closely mirror the response of Nk to I. Building on Equation 11, the light response expression for NPQ can be deduced from the light response model of Nk, the expression for NPQ in response to light can be derived as:
where is initial slope of the light response curve of NPQ, is equivalent to γe, the saturation term of photosynthesis, and NPQ0 is NPQ at I = 0 μmol photons m−2 s−1.
Equations 2, 5 (and 6), 8, 11, and 12 represent how Model 1 (Ye model) describes ΦPSII–I, ETR–I, σ′ik–I Nk–I, and NPQ–I curves, respectively.
It has been found experimentally that ΦPSII, ranging from 0 to 1, usually follows a simple negative exponential function as follows (Ritchie, 2008; Ritchie and Bunthawin, 2010; Buckley and Diaz-Espejo, 2015):
where ΦPSIImax is defined as the maximum effective quantum efficiency when I = 0 μmol photons m−2 s−1, kw is a scaling constant, and I is the light intensity. The values of ΦPSIImax and kw can be obtained when ΦPSII–I curves are simulated by Equation 13.
Substituting Equation 13 into ETR = α×β×ΦPSII×I (Krall and Edwards, 1992), we get the following expression for ETR:
When the first derivative of Equation 14 equals to zero, we can calculate saturation I (Isat=1/kw), then substitute kw =1/Isat into Equation 14 to determine the maximum electron transport rate (ETRmax = α×β×Isat×ΦPSIImax×e−1).
Equations 13 and 14 represent how the negative exponential function (Model 2) describes ΦPSII–I and ETR–I curves. It should be noted that there are two values of ΦPSIImax to be returned when both ΦPSII–I and ETR–I curves are simulated by Equations 13 and 14, respectively.
The exponential function was introduced to simulate ΦPSII–I curves as follows (Smyth et al., 2004; Silsbe and Kromkamp, 2012):
where Fv/Fm is the “dark-adapted” maximum operating efficiency of PSII, and Isat is the saturation I (Smyth et al., 2004). However, it should be noted that ΦPSIImax cannot be estimated by Equation 15, but Isat and Fv/Fm can be estimated when ΦPSII–I curve is fitted by Equation 15.
Similarly, substituting Equation 15 into ETR = α×β×ΦPSII×I (Krall and Edwards, 1992), we get the following expression for ETR:
The values of Isat and Fv/Fm can be returned when ETR–I curves are simulated by Equation 16.
The maximum ETR can be calculated by Equation 17:
Equations 15 and 16 represent how the exponential function (Model 3) describes ΦPSII–I and ETR–I curves. Similarly, it should be noted that there are two values of Isat and Fv/Fm to be returned when both ΦPSII–I and ETR–I curves are simulated by Equations 15 and 16, respectively.
The non-rectangular hyperbolic (NRH) model has been mainly used to fit the ETR–I curves of plants (von Caemmerer, 2000; Long and Bernacchi, 2003; Miao et al., 2009; Yin et al., 2009; Gu et al., 2010; Bernacchi et al., 2013; von Caemmerer, 2013; Buckley and Diaz-Espejo, 2015; Cai et al., 2018; Yin et al., 2021), and it has been a sub-model in the FvCB model when irradiance is below the saturation level (Farquhar et al., 1980; von Caemmerer, 2000, 2013; Park et al., 2016; Yin et al., 2021). In the NRH model, the dependence of ETR on I can be expressed as follows:
where α′ is defined as the initial slope of the ETR–I curve, θ is a degree of curvature, and ETRmax is the maximum ETR. Because the first derivative of Equation 18 is always greater than zero, we cannot use Equation 18 to estimate Isat.
Similarly, combing Equation 18 with ETR = α×β×ΦPSII×I (Krall and Edwards, 1992), we get the following expression for ΦPSII:
Equations 18 and 19 represent how the NRH model (Model 4) describes ETR–I and ΦPSII–I curves. However, it should be noted that ΦPSIImax and its corresponding Isat cannot be estimated by Equation 19. In addition, there are two values of ETRmax to be returned when both ETR–I and ΦPSII–I curves are simulated by Equations 18 and 19, respectively.
Measurements were performed on plant leaves using a LI-6800 portable photosynthesis system (LI-COR Inc., USA) equipped with a LI-6800-01A leaf chamber fluorometer (LI-COR Inc., USA). A fully unfolded, dark green, and healthy leaf was used for each measurement. The initial fluorescence (F0) was recorded after 25 min of dark adaptation in the cuvette. The maximal fluorescence level of the dark-adapted leaves (Fm) and light-adapted leaves (Fm′) were determined by applying saturating flashes (15,000 μmol photons m−2 s−1) lasting 1 s, to promote the closure of the PSII reaction centers (Maxwell and Johnson, 2000). Fv/Fm and NPQ were calculated as (Fm−F0)/Fm and (Fm−Fm′)/Fm′, respectively (van Kooten and Snel, 1990).
Light response measurements were conducted on sunny days from 8:30–11:30 a.m. to 2:00–5:00 p.m. using the automatic measurement program of the LI-6800 system. Leaves were flatly clamped into the leaf chamber and gradually exposed to light intensities of 0 μmol photons m−2 s−1, 25 μmol photons m−2 s−1, 50 μmol photons m−2 s−1, 100 μmol photons m−2 s−1, 200 μmol photons m−2 s−1, 300 μmol photons m−2 s−1, 400 μmol photons m−2 s−1, 600 μmol photons m−2 s−1, 800 μmol photons m−2 s−1, 1,000 μmol photons m−2 s−1, 1,200 μmol photons m−2 s−1, 1,400 μmol photons m−2 s−1, 1,600 μmol photons m−2 s−1, 1,800 μmol photons m−2 s−1, 1,900 μmol photons m−2 s−1, to 2,000 μmol photons m−2 s−1. For each light intensity, a minimum waiting time of 2 min and a maximum waiting time of 3 min were set before recording data. The instrument automatically matched the reference and sample chambers before data recording to ensure accuracy. The ambient CO2 concentration in the leaf chamber was maintained at 410 μmol mol−1, supplied via an external CO2 gas cylinder connected to the instrument’s CO2 injection system, with a flowrate of 500 μmol s−1. Air temperature in the leaf chamber was set at 30°C. Before measurements, leaves were exposed to sunlight or a light intensity of 1,800 μmol photons m−2 s−1 for 40 min to ensure activation. ETR was calculated as ETR = α×β×ΦPSII×I, where α is the distribution coefficient of absorption light energy by PSII and PSI, assumed to be 0.5 (Krall and Edwards, 1992; Maxwell and Johnson, 2000; Evans, 2009), and β is leaf absorptance, assumed to be 0.84 (Ehleringer, 1981). In this study, the values of ΦPSII at I = 0 μmol photons m−2 s−1 were taken as the maximum ΦPSII (ΦPSIImax). Key parameters (e.g., ΦPSIImax, ETRmax, Fv/Fm, and Isat) from ETR–I curves and ΦPSII–I curves were fitted using Model 1–4, respectively, with SPSS 24.0 statistical software (SPSS, Chicago, IL).
Leaf disks were removed from the labeled leaves, followed by rapidly clipping of leaf area of 1 cm diameter for each leaf, to be cut into fine shreds and placed into glass test tube containing 5 mL of 80% (v/v) acetone. The airtight tubes were placed in the dark overnight or until the leaf was blanched at 25°C. All treatments were performed in triplicate. The extracts were centrifuged at 4,000 rpm for 10 min. Absorbances at 663 nm and 645 nm were measured using a spectrophotometer (UVICON-930, Kontron Instruments, Zürich, Switzerland) to determine the contents of chlorophyll (Chl) a and Chl b according to previous reported method by Wellburn (1994) (Wellburn, 1994). In addition, we may use the measured chlorophyll content to estimate N0 and then use Equation 1 to simulate the ETR–I curves of leaves to obtain αe, βe, and γe, respectively. The values of σik can be estimated by (in this study, α is 0.5, β is 0.84, φ is 0.95, and S is 6×10⁻⁴ m2), the values of σ′ik can be estimated by Equation 7 when the values of σik, βe, and γe were determined. ETR–I curves were fitted with the Photosynthesis Model Simulation Software (PMSS) at http://photosynthetic.sinaapp.com/index.html, in both Chinese and English, using Simulated Annealing and the Metropolis Algorithm to extract key parameters (e.g., αe, βe, γe, σik, σ′ik, ETRmax, and Isat).
All variables are expressed as mean values ± SE from five samples for each species. Data were analyzed with one-way analysis of variance (ANOVA), and then, the values of ETRmax and Isat estimated by four models were compared using a paired-sample t-test at p < 0.05 (p-significance level) using the SPSS 24.0 statistical software (SPSS, Chicago, IL). In addition, to compare the advantages and disadvantages of the study models, we took the Akaike’s information criterion (AIC), mean absolute error (MAE), and determination coefficient (R2) as indicators to assess the fitting results of the three models. AIC was calculated by reference to Akaike’s method (Akaike, 1974), which equals 2k+n×ln(SSR/n) (here, k is the number of parameters, n is the sample size, and SSR is the sum square of residuals) and R2 was given directly by SPSS 24.0 after fitting the data.
All plant species exhibited a characteristic rapid initial increase in ETR with rising I, followed by a saturation phase (Figure 1). Both C3 crops (A. hypogaea and G. hirsutum) displayed a slight decline in ETR beyond the saturation I, indicating a dynamic downregulation of PSII or photoinhibition (Figures 1A, B). The observed values of Isat were approximately 1,600 μmol photons m−2 s−1and 1,820 μmol photons m−2 s−1 for A. hypogaea and G. hirsutum, respectively, with the corresponding ETRmax values as approximately 195.49 µmol electrons m–2 s–1 and 228.83 µmol electrons m–2 s–1 (Figures 1A, B; Table 2). In contrast, the two cultivars of the C4 crop S. bicolor showed less notable reduction in ETR after I surpassed Isat (Figures 1C, D). The observed values of ETRmax for KFJT-1 and KFJT-4 were approximately 133.84 µmol electrons m–2 s–1 and 170.15 µmol electrons m–2 s–1, respectively, with the corresponding Isat values approximately 1,600 μmol photons m−2 s−1 (Figures 1C, D; Table 3).
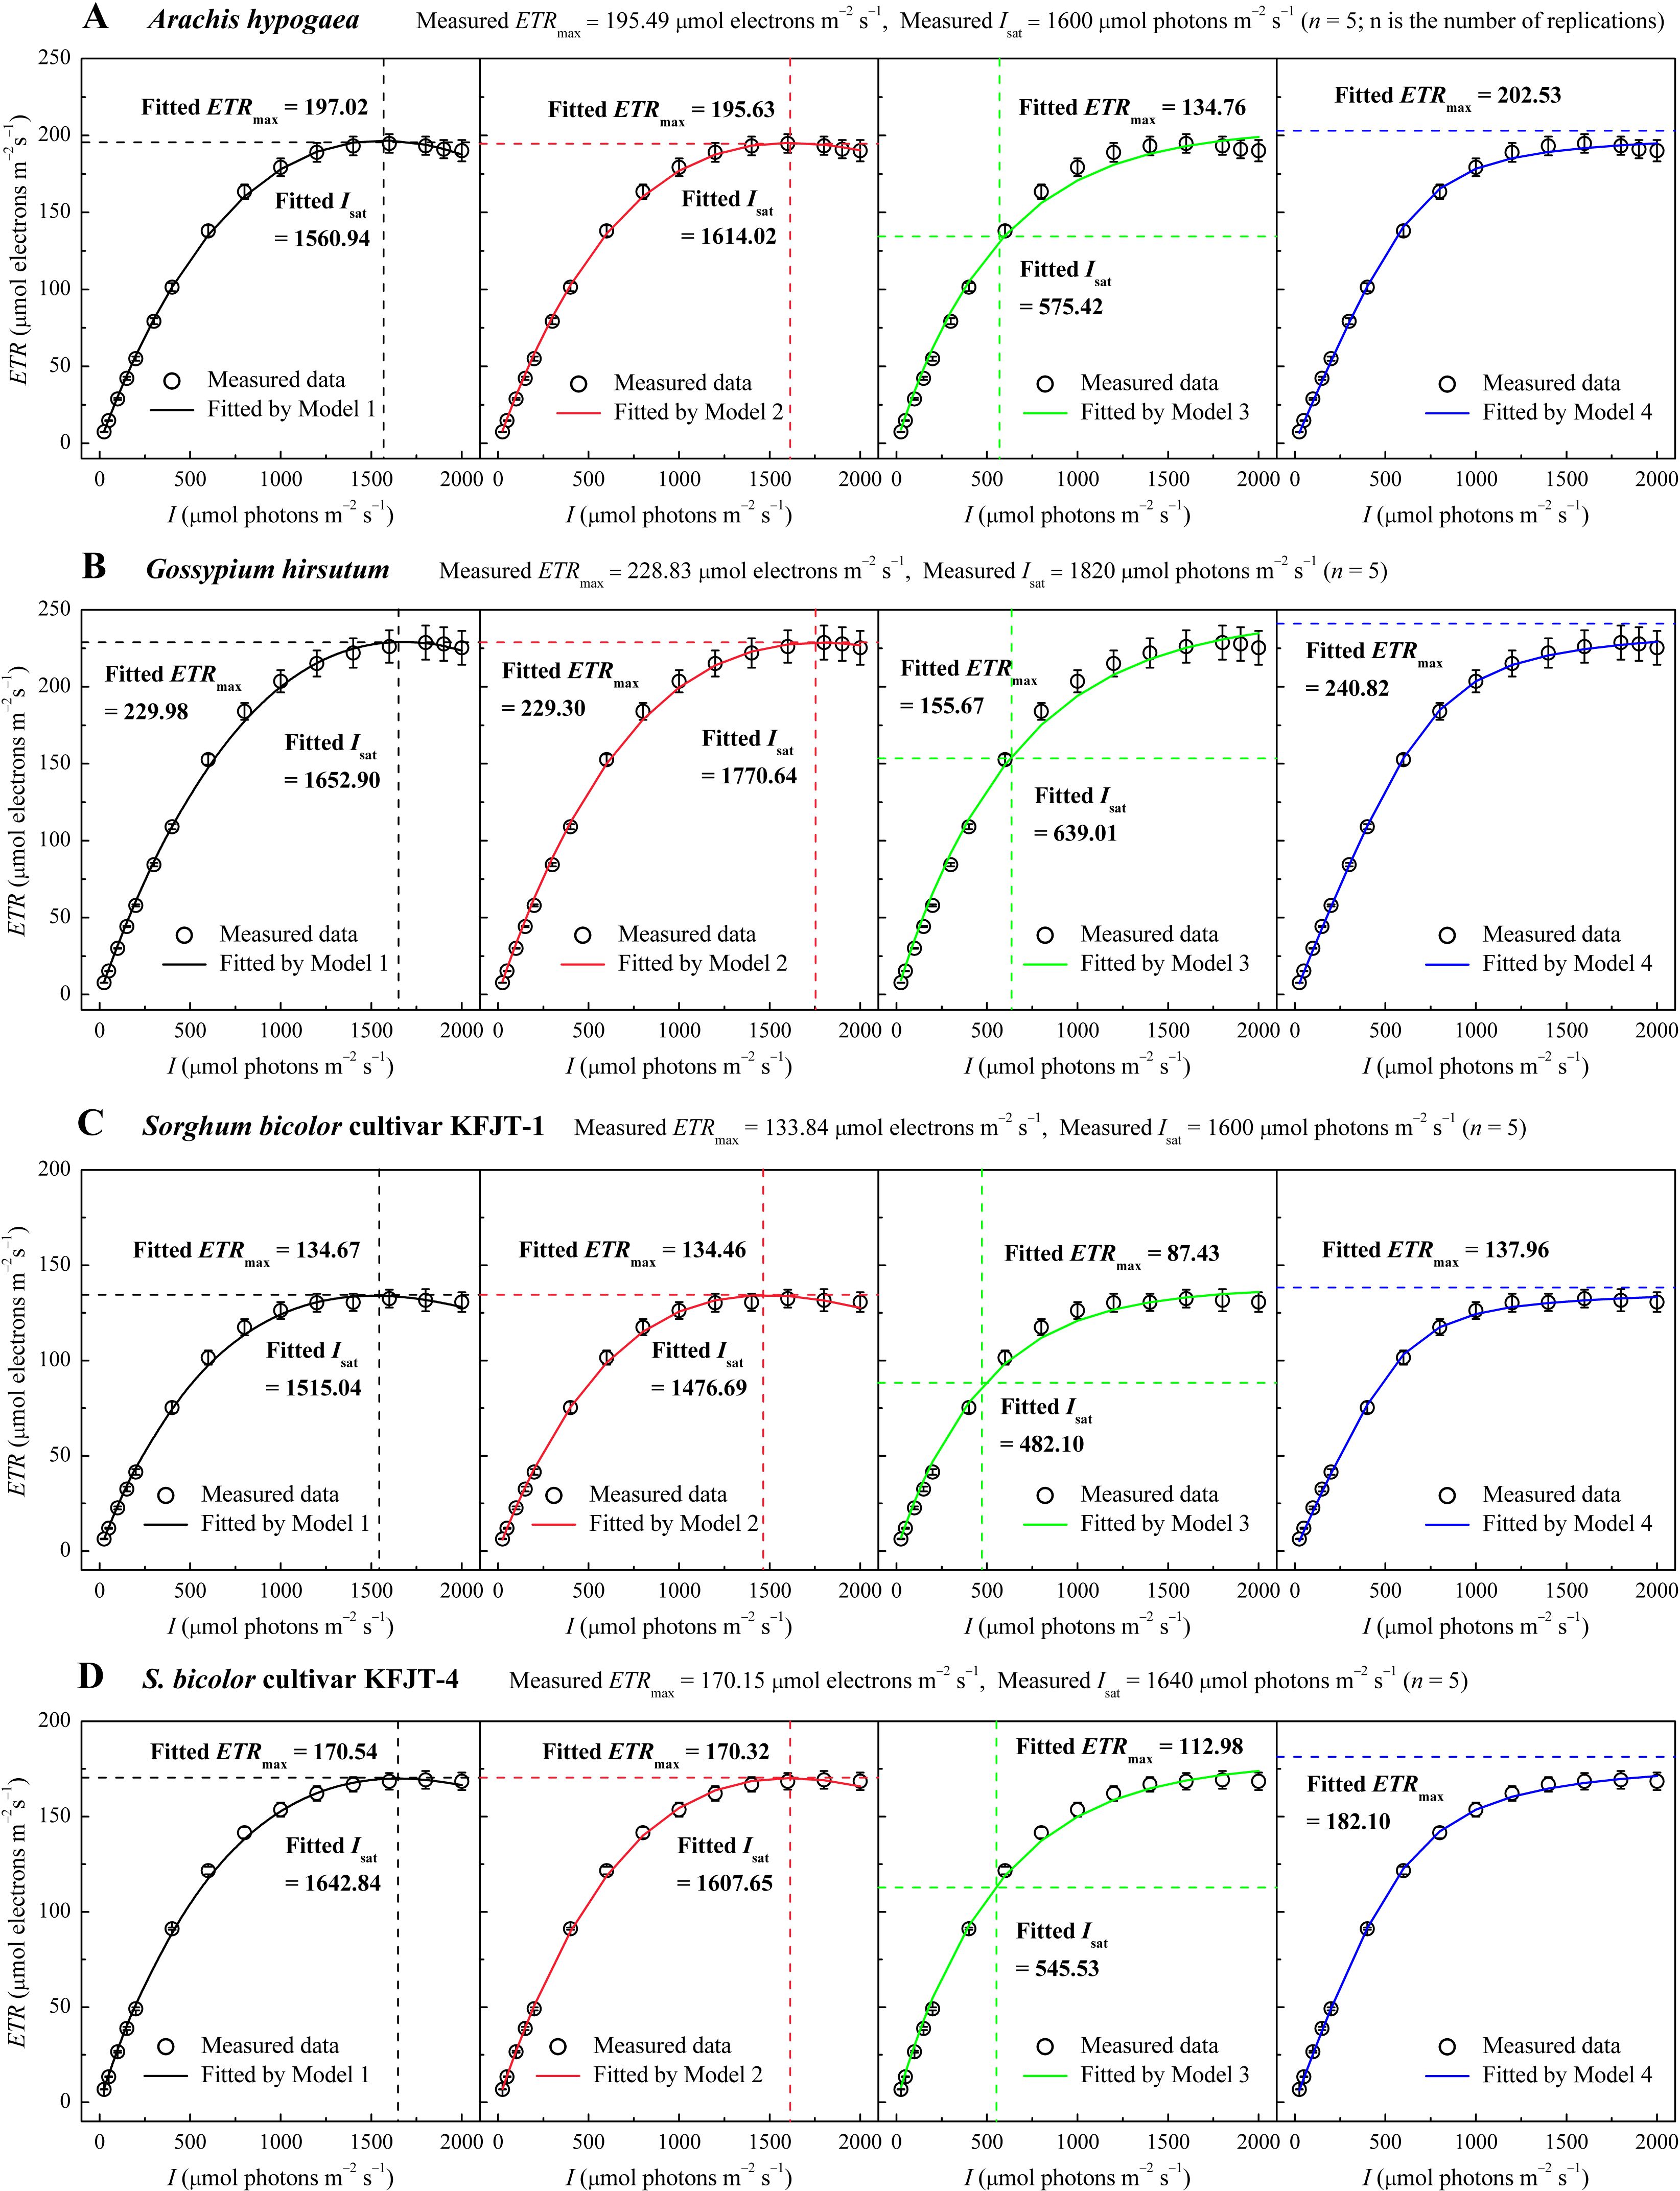
Figure 1. Light response curves of the electron transport rate (ETR–I) for various crops—Arachis hypogaea (A), Gossypium hirsutum (B), Sorghum bicolor cultivar KFJT-1 (C), and S. bicolor cultivar KFJT-4 (D). The curves were simulated by Models 1–4, respectively. Values were presented as means ± SE (n = 5). A horizontal dashed line represents the the fitted value of ETRmax from the model (μmol electrons m−2 s−1), while a vertical dashed line represents the fitted value of Isat from the model (μmol photons m−2 s−1).
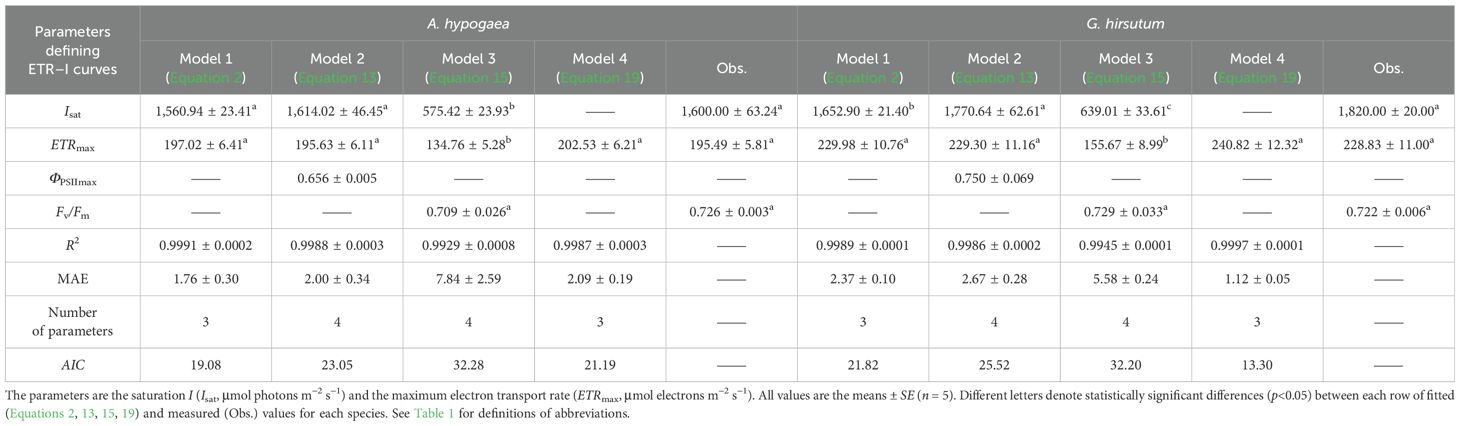
Table 2. Fitted (Equations 2, 13, 15, 19) and measured (Obs.) values of parameters defining ETR–I curves of A. hypogaea and G. hirsutum.
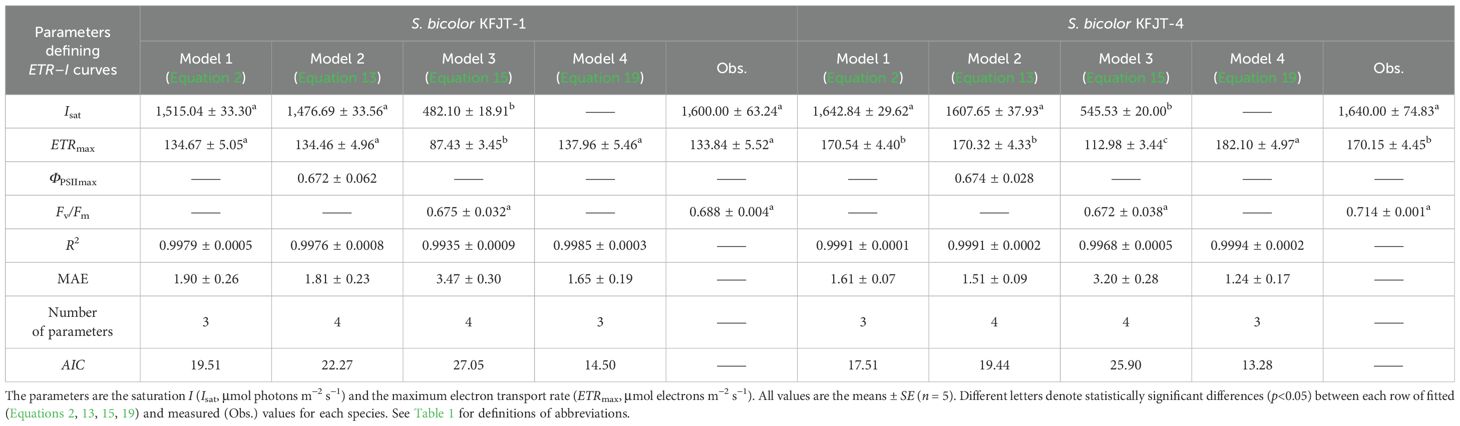
Table 3. Fitted (Equations 2, 13, 15, 19) and measured (Obs.) values of parameters defining ETR–I curves of two S. bicolor cultivars.
Compared to Models 1, 2, and 4, Model 3 largely failed to represent the observed ETR–I curves (Figure 1). Models 1, 2, and 4 demonstrated high goodness-of-fit, based on the coefficient of determination (R2) and mean absolute error (MAE) (Tables 2, 3). Although Model 4 showed higher R2 values than Models 1 and 2 (Tables 2, 3), it overestimated ETRmax and cannot return Isat. Models 1 and 2 provided ETRmax and Isat values closely aligned with observed data across all species, but Model 1 demonstrated the lowest AIC, indicating an optimal balance between predictive accuracy and model parsimony. Model 3 underestimated both ETRmax and Isat, with significant differences between fitted and measured data across all crops (p<0.05) (Figure 1C; Tables 2, 3). Additionally, despite Model 3 being able to produce Fv/Fm values by fitting ETR–I curves, these values significantly deviated from the observed Fv/Fm across all crops.
The four models varied significantly in characterizing ΦPSII–I curves (Figure 2; Tables 4, 5). The ΦPSII–I curves, fitted using Models 1 (Equation 6), 2 (Equation 14), 3 (Equation 16), and 4 (Equation 18), exhibited a characteristic decrease in ΦPSII with the increasing I for all crops (Figure 2). Among the models, Model 1 most accurately simulated the nonlinear relationship between ΦPSII and I, obtaining the highest R2 and the lowest MAE compared to Models 2 and 3, which exhibited notable deviation from observations, particularly for A. hypogaea and G. hirsutum (Figures 2A, B; Tables 4, 5). Despite being able to estimate Fv/Fm, Model 3 produced Fv/Fm values that were significantly different from the measured values. Additionally, Model 3 generated an Isat value with an unknown or unclear meaning (Tables 4, 5). While Model 4 exhibited the highest fitting degree for G. hirsutum and S. bicolor KFJT-4, the fitted curves fluctuated in the low light intensity range (below 600 μmol photons m−2 s−1) (Figure 2). Furthermore, Model 4 generated a significantly higher ETRmax than the measured value. Another key difference among the models is their ability to return the ΦPSIImax. Models 1 and 2 can return ΦPSIImax, while Models 3 and 4 cannot. Compared to Model 2, Model 1 returned ΦPSIImax values closer to the observed values.
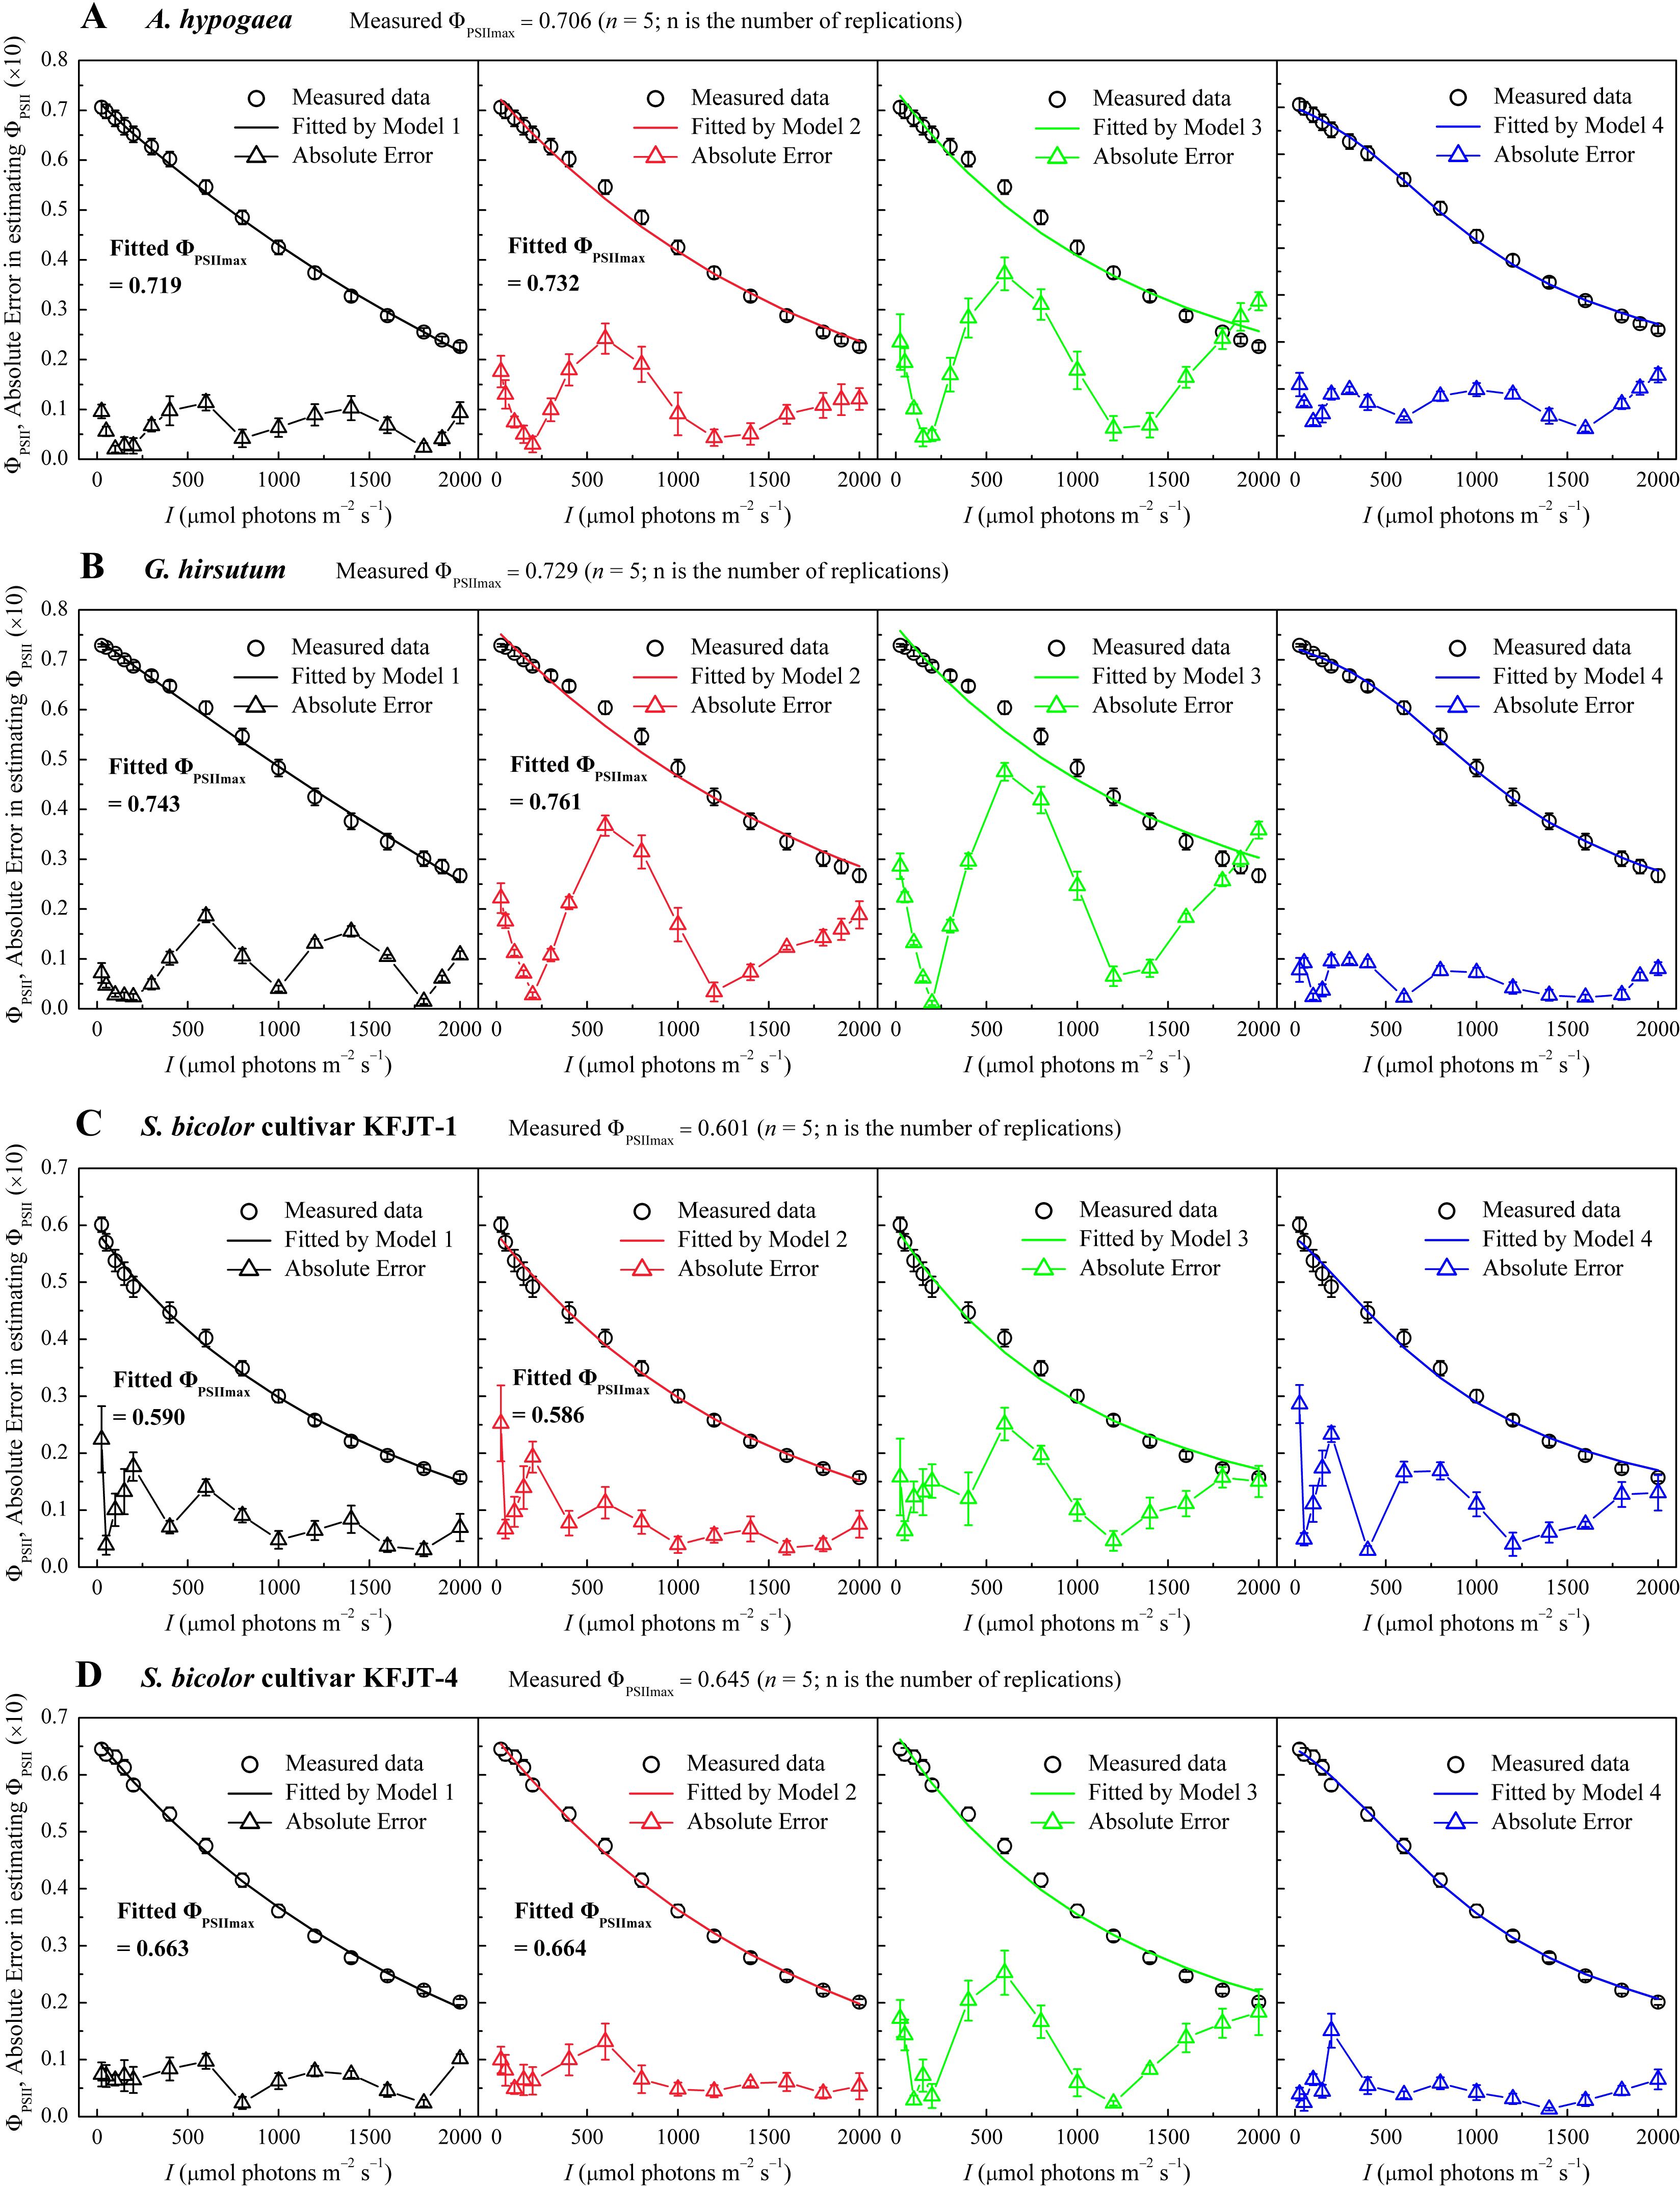
Figure 2. Light response curves of effective quantum efficiency (ΦPSII–I) for various crops—A. hypogaea (A), G. hirsutum (B), S. bicolor cultivar KFJT-1 (C), and S. bicolor cultivar KFJT-4 (D). The curves were simulated by Model 1–4, respectively, and the fitted absolute error is shown. Values were presented as means ± SE (n = 5).
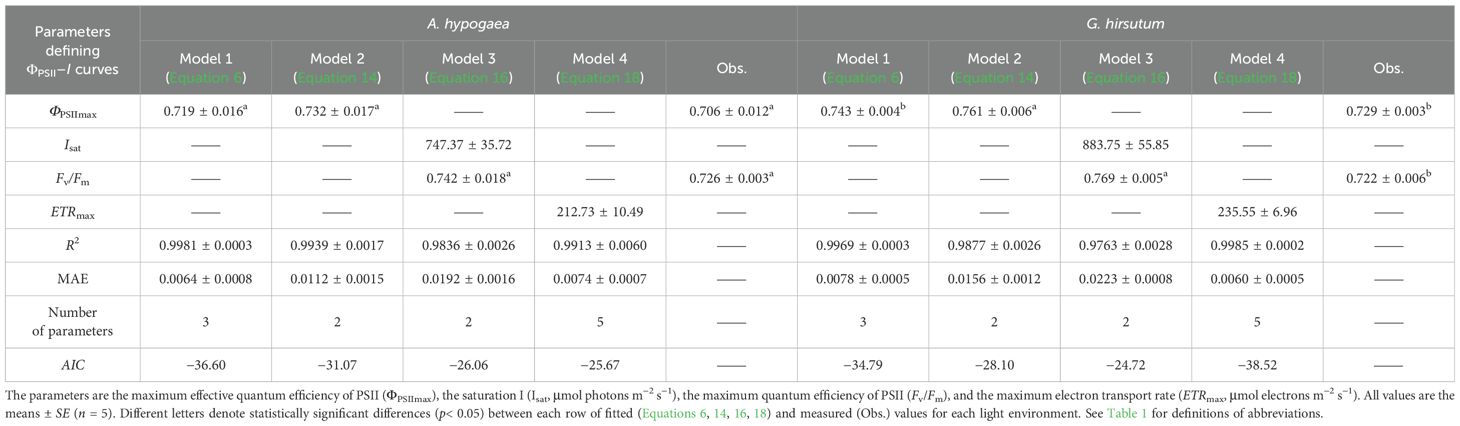
Table 4. Fitted (Equations 6, 14, 16, 18) and measured (Obs.) values of parameters defining ΦPSII–I curves of A. hypogaea and G. hirsutum..
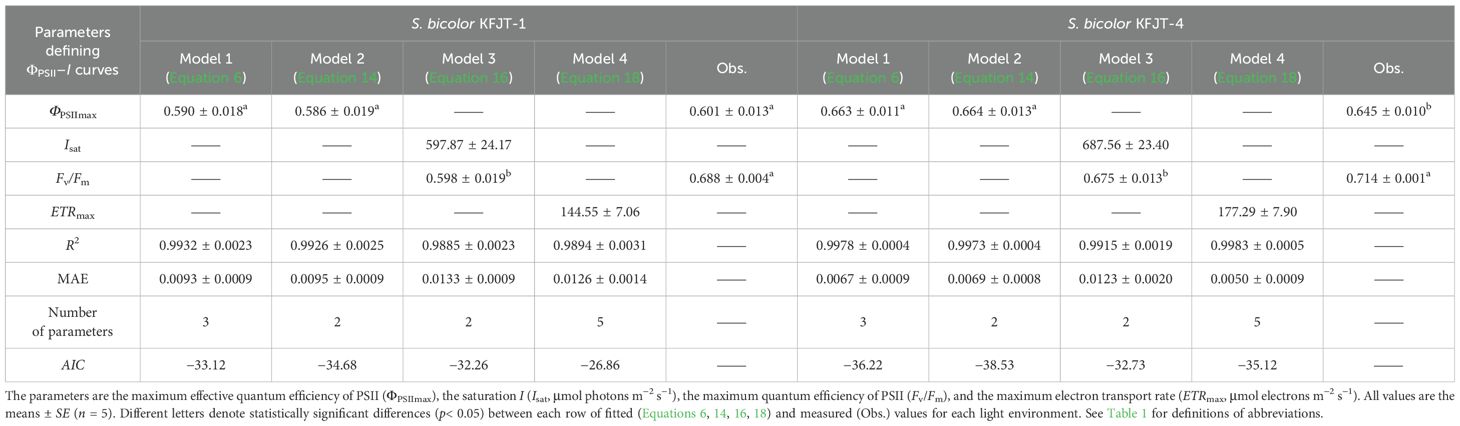
Table 5. Fitted (Equations 6, 14, 16, 18) and measured (Obs.) values of parameters defining ΦPSII–I curves of two S. bicolor cultivars.
NPQ increased nonlinearly with I across all plant species, with distinct patterns observed between C3 and C4 plants (Figures 3A–D). When I was below 600 μmol photons m−2 s−1, the NPQ of A. hypogaea and G. hirsutum increased very slowly with the increasing I. When I was more than 600 μmol photons m−2 s−1, NPQ increased rapidly (Figures 3A–D). In contrast, the NPQ of the two S. bicolor cultivars showed nearly linear increase when I was below 1,800 μmol photons m−2 s−1. Under high I condition, the NPQ of A. hypogaea and G. hirsutum was significantly higher than that of the two S. bicolor cultivars. For example, at 1,800 μmol photons m−2 s−1, the NPQ values of A. hypogaea and G. hirsutum were 1.54 and 1.35, respectively, whereas the NPQ values of the two S. bicolor cultivars were only 0.77 and 0.81 (Figures 3A–D). Nk increased nonlinearly with the increasing I for all crops (Figure 3E–H), more rapidly in S. bicolor compared to that in A. hypogaea and G. hirsutum. At I = 1,800 μmol photons m−2 s−1, the Nk values for S. bicolor cultivars KFJT-1 and KFJT-4 were 0.61 and 0.64, respectively, and A. hypogaea and G. hirsutum demonstrated lower Nk values (0.48 and 0.45, respectively).
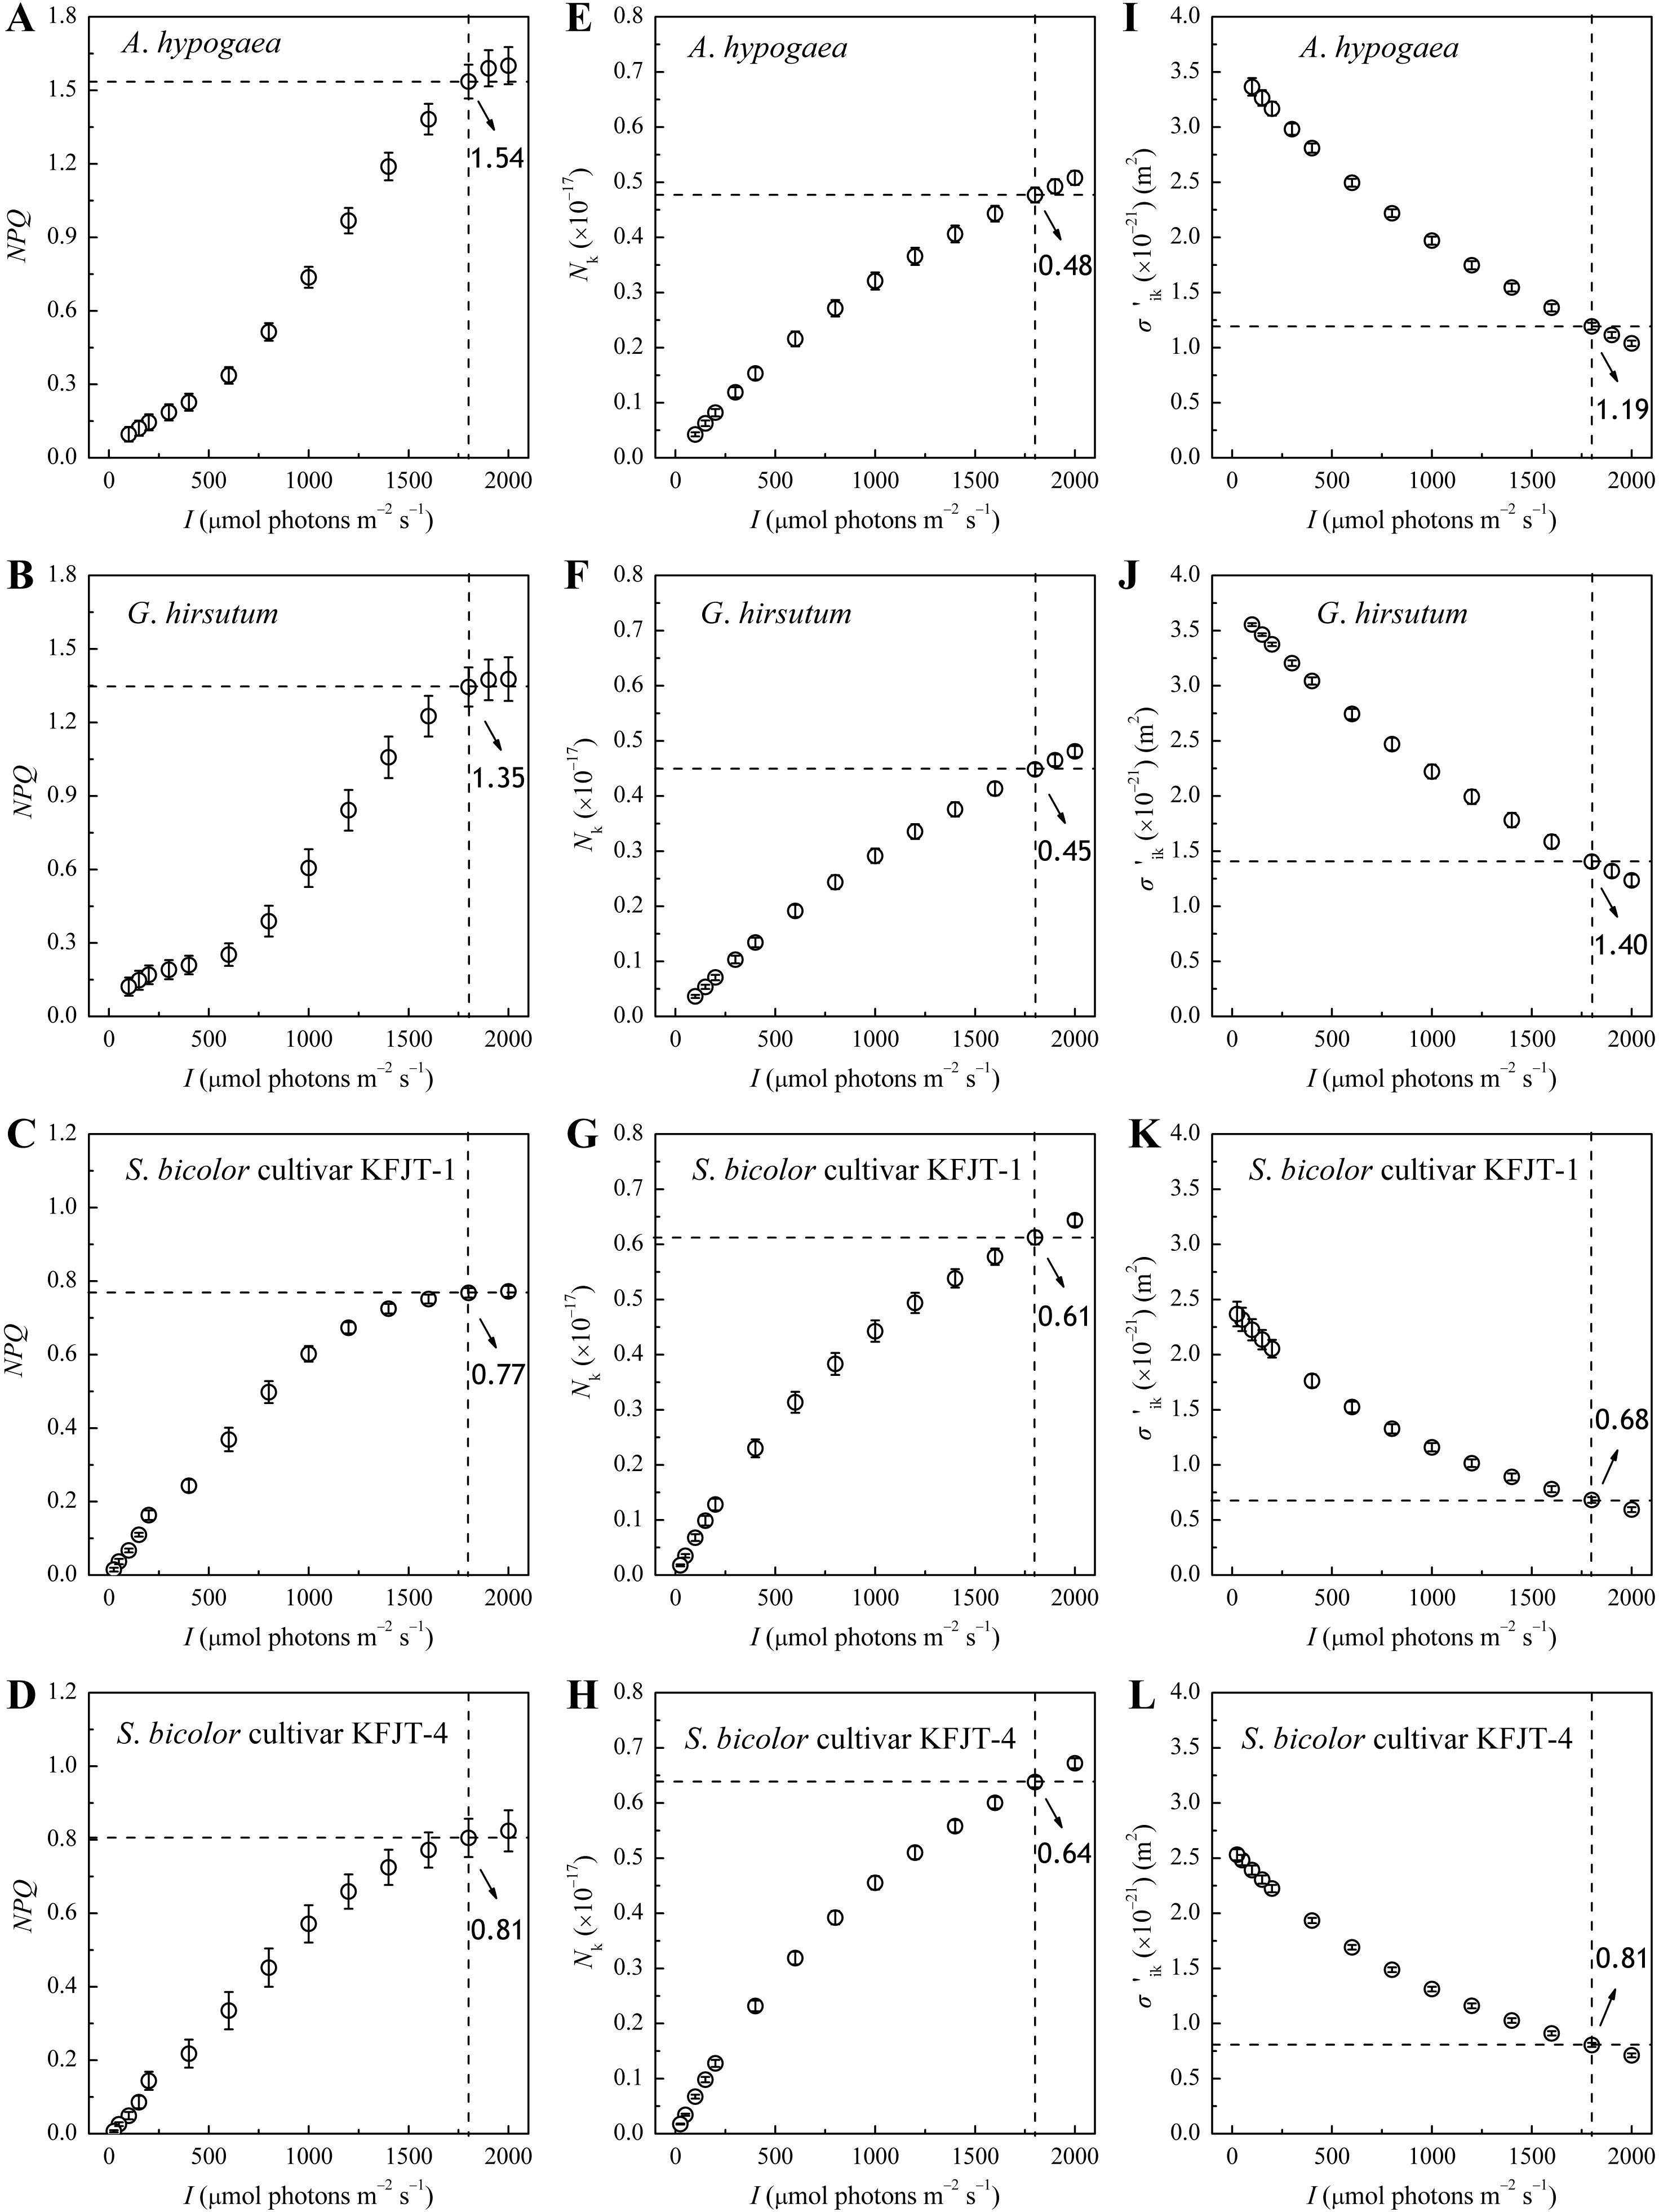
Figure 3. Non-photochemical quenching (NPQ), total light-harvesting pigment molecules in excited state (Nk), and effective light energy absorption cross-section (σ′ik, m2) for A. hypogaea (A, E, I), G. hirsutum (B, F, J), S. bicolor cultivar KFJT-1 (C, G, K), and S. bicolor cultivar KFJT-4 (D, H, K). Values were presented as means ± SE (n = 5). The intersection of the black horizontal and vertical dashed lines in each graph represents their measured value at I = 1,800 μmol photons m−2 s−1.
During photosynthesis, light-harvesting pigment molecules absorb light energy and transition to different excited states. The ability of these molecules to absorb light energy is represented by their effective absorption cross-section (σ′ik). As illustrated in Figures 3I–L, σ′ik nonlinearly decreased with the increasing I for all crops, whose σ′ik–I curves exhibited similar trends to their ΦPSII–I curves (Figure 2), indicating a strong correlation between light absorption and photosynthetic efficiency. Within the tested range of I, A. hypogaea and G. hirsutum exhibited significantly higher σ′ik values compared to the two cultivars of S. bicolor. When I was 1,800 μmol m-2 s-1, the σ′ik of A. hypogaea and G. hirsutum were 1.19 × 10⁻²¹ m2 and 1.40 × 10⁻²¹ m2, respectively (Figures 3I, J), and the σ′ik values of S. bicolor cultivars KFJT-1 and KFJT-4 were 0.68 × 10⁻²¹ m2 and 0.81 × 10⁻²¹ m2 (Figures 3K, L). σik showed similar inter-specific difference as that of σ′ik. The σik values estimated by Model 1 (Equation 1) for A. hypogaea and G. hirsutum were (3.60 ± 0.10) × 10−21 m2 and (3.74 ± 0.23) × 10−21 m2, respectively. The σik values of S. bicolor cultivars KFJT-1 and KFJT-4 were (2.42 ± 0.12) × 10−21 m2 and (2.58 ± 0.54) × 10−21 m2, respectively.
Classic empirical models typically rely on mathematical analyses of measured data to establish quantitative functions, often lacking explicit incorporation of biological processes. Through the intercomparison among the four models and observations, this study demonstrates that Model 1 (Ye model) can accurately and simultaneously simulate ETR–I and ΦPSII–I curves. Model 1 demonstrated its consistent robustness and accuracy for the studied crops in (1) reproducing the ETR–I and ΦPSII–I curves and (2) returning key quantitative traits defining the light response functions.
By employing an explicit and transparent analytical framework with consistent definitions, Ye model incorporates the fundamental processes of light energy absorption, conversion, and transfer to the reaction centers of PSII via photosynthetic pigments. These processes include light harvesting, exciton resonance transfer, quantum level transitions, and de-excitation (Ye et al., 2013a, 2013b; Shevela et al., 2023). Equation 5 incorporated the quantitative relationship between ΦPSII and the intrinsic characteristics of light-harvesting pigment molecules (i.e., N0, σik, τ, φ, kP, kD, gi, gk, ξ1, ξ2, and ξ3. Our results highlight that the consistent decrease in ΦPSII and σ′ik with the increasing I (Figures 2, 3I–L), a finding consistent with previous studies (Suggett et al., 2004, 2007; Ye et al., 2013a).
The observed decrease in σ′ik with increasing I (Figures 3I–L) support previous studies (Suggett et al., 2004, 2007; Ye et al., 2013a). For instance, Suggett et al. (2004) reported the increase in effective absorption cross-sections for PSII of Emiliania huxleyi with the decrease in I in the plant growth environment. These results demonstrated that plants could adjust their light absorption properties to optimize photosynthetic efficiency and minimize photodamage under the changing light environment.
Moreover, the values of ETRmax and Isat fitted by Ye model (Equation 2) were in close agreement with the observed data (Figure 1; Tables 2, 3), supporting previous reports (Ye et al., 2013a, 2013b; Robakowski et al., 2018). In contrast, Model 3 underestimated ETRmax and the corresponding Isat (Figure 1; Tables 2, 3). While Model 4 has been widely used to estimate ETRmax and is a sub-model of FvCB model (Farquhar et al., 1980; von Caemmerer, 2000; Long and Bernacchi, 2003; Sharkey et al., 2007; Miao et al., 2009; Yin et al., 2009; Gu et al., 2010; Bernacchi et al., 2013; von Caemmerer, 2013; Park et al., 2016; Cai et al., 2018; Yin et al., 2021), it overestimated ETRmax and cannot return the corresponding Isat (Figure 1; Tables 2, 3). These results support the previous studies reporting the limitations of these empirical models in accurately characterizing ETR–I curves (Smyth et al., 2004; Silsbe and Kromkamp, 2012; Buckley and Diaz‐Espejo, 2015; Yang et al., 2024). Meanwhile, Ye model (Equation 6) can also accurately characterize the ΦPSII–I curves (Figure 2; Tables 4, 5). The negative exponential function (Model 2) overestimated ΦPSIImax (Figure 2; Tables 4). The exponential function (Model 3) and the NRH model (Model 4) cannot return ΦPSIImax (Tables 4, 5).
Our study also highlights distinct photosynthetic responses between C3 and C4 plants. For instance, the ΦPSII in A. hypogaea and G. hirsutum was significantly higher than that in two cultivars of S. bicolor, suggesting that C3 plants may possess a greater capacity for light energy utilization compared to C4 plants. The results demonstrate that Ye model (Model 1) can be used to estimate the absorption cross-section of pigment molecules for both C3 and C4 plants, supporting previous studies on other photosynthetic organisms (e.g., algae and cyanobacteria) (Yang et al., 2023; Ye et al., 2024). Ley and Mauzerall (1982) (Ley and Mauzerall, 1982) reported that the absolute absorption cross-section for oxygen production for chlorophyll in Chlorella vulgaris at 596 nm in vivo was 2.9×10⁻²¹ m2, which was independent of total cell chlorophyll content. In this study, σik estimated by Ye model (Equation 1) for A. hypogaea, G. hirsutum, S. bicolor KFJT-1, and S. bicolor KFJT-4 were 3.60 × 10⁻²¹ m2, 3.74 × 10⁻²¹ m2, 2.42 × 10⁻²¹ m2 and 2.58 × 10⁻²¹ m2, respectively.
C3 and C4 plants represent distinct evolutionary adaptations to different environmental conditions. The differences in their photosynthetic machinery and carbon fixation mechanisms lead to distinct responses in parameters such as ΦPSII, ETR, and NPQ across light intensities (Stefanov et al., 2022). The different σik values between C3 and C4 plants observed in this study reflect their differential adaptations to light environments. C3 plants, which evolved in more moderate light environments, typically have a higher light absorption capacity (i.e., higher σik). It allows them to efficiently capture light in potentially light-limited conditions. However, this higher absorption capacity also makes them more susceptible to photoinhibition at high light intensities, as observed in the ETR–I curves where A. hypogaea and G. hirsutum showed more notable decline in ETR beyond Isat (Figure 1). In contrast, the C4 plants (S. bicolor) in this study showed lower σik values, contributing to their ability to maintain relatively constant ETR even when I surpasses Isat (Figure 1). The carbon-concentrating mechanism allows C4 plants to maintain high photosynthetic rates under high light conditions without the need for excessive light absorption, thereby reducing the risk of photodamage (Yang et al., 2024).
While the Ye model provides a robust representation of light response mechanisms in PSII, it has limitations that warrant further research. The model assumes steady-state photosynthetic conditions, which may not fully capture dynamic processes such as stomatal closure, changes in chloroplast morphology, or fluctuating light intensities. Additionally, factors such as nutrient availability, water stress, or temperature effects are not explicitly included in the current framework. These variables can significantly impact photosynthetic efficiency and could be integrated into future iterations of the model. This study validated the model on a limited set of crops (peanut, cotton, and sweet sorghum) under controlled conditions. Therefore, future studies should expand validation to a broader range of species (e.g., maize, rice, and wheat), and environmental contexts (e.g., fluctuating light, drought, and extreme temperatures) would strengthen the generalizability of model. Incorporating dynamic elements into the model to simulate transient responses to light fluctuations would be valuable. Furthermore, investigating the integration of abiotic stress factors into the model framework could improve predictions of photosynthetic efficiency under stress conditions such as drought or extreme heat.
The accurate assessment of key photosynthetic parameters, such as ETRmax, ΦPSIImax, Isat, σik, σ′ik, Nk, and NPQ, positions the Ye model as a transformative tool for advancing photosynthetic research. These parameters are critical in understanding how plants respond to fluctuating light environments, optimize photochemical efficiency, and manage photoprotection. For instance, the ability of Ye model to quantify Nk and σ′ik enables detailed exploration of how light-harvesting complexes dynamically adjust to varying light intensities. Similarly, the coupling of ΦPSII and NPQ predictions provides insight into the balance between photochemical utilization and dissipation of excess light energy, a critical factor under high-stress conditions such as drought or extreme light fluctuations.
This capability has direct implications for plant breeding and crop management in the context of climate change. By leveraging the outputs of the model, researchers can identify genotypes with optimized light absorption and photoprotective traits for high light variability scenarios, such as those experienced in marginal or degraded agricultural lands. Moreover, the model can support breeding programs aimed at developing cultivars with enhanced yield stability by selecting for traits that mitigate photoinhibition or excessive NPQ under fluctuating light. Additionally, incorporating these parameter assessments into ecosystem and agricultural productivity models can improve predictions of carbon assimilation and crop yield under diverse environmental conditions.
To the best of our knowledge, this is the first study reporting a robust model (Equations 2, 6) that can simultaneously and accurately simulate ETR–I and ΦPSII–I curves and returning values of key physical and biochemical parameters of photosynthetic pigments (i.e., intrinsic absorption cross-section and the effective absorption cross-section of light-harvesting pigment molecules). The findings could also help quantify key light-harvesting properties associated with photoacclimation (Fiebig et al., 2023), photoprotection (Niyogi and Truong, 2013), dynamic downregulation of PSII (Ralph and Gademann, 2005), and/or photoinhibition (Govindjee, 2002) in response to environmental change. This study is useful for (1) plant experimentalists quantifying intra- and/or inter-specific variation in ΦPSII–I responses and (2) modelers working on better model representation of photosynthetic processes under dynamic light environment.
The original contributions presented in the study are included in the article/supplementary material. Further inquiries can be directed to the corresponding authors.
X-LY: Conceptualization, Data curation, Formal analysis, Investigation, Methodology, Writing – original draft, Writing – review & editing. TA: Data curation, Formal analysis, Investigation, Writing – review & editing. Z-W-YY: Formal analysis, Software, Writing – review & editing. H-JK: Data curation, Formal analysis, Methodology, Writing – review & editing. PR: Methodology, Software, Writing – review & editing. F-BW: Data curation, Formal analysis, Software, Writing – review & editing. Z-PY: Conceptualization, Funding acquisition, Methodology, Software, Supervision, Writing – original draft, Writing – review & editing. S-XZ: Methodology, Writing – original draft, Writing – review & editing.
The author(s) declare that financial support was received for the research, authorship, and/or publication of this article. This work was supported by the National Natural Science Foundation of China (grant numbers 31960054, 41961005, and 31860045) and the Program for Construction of the Advantage Science and Technology Innovation Group of Jiangxi Province (grant number 20142BCB24010).
The authors declare that the research was conducted in the absence of any commercial or financial relationships that could be construed as a potential conflict of interest.
All claims expressed in this article are solely those of the authors and do not necessarily represent those of their affiliated organizations, or those of the publisher, the editors and the reviewers. Any product that may be evaluated in this article, or claim that may be made by its manufacturer, is not guaranteed or endorsed by the publisher.
Akaike, H. (1974). A new look at the statistical model identification. IEEE T. Automat. Contr. 19, 716–723. doi: 10.1109/TAC.1974.1100705
Baker, N. R. (2008). Chlorophyll fluorescence: a probe of photosynthesis in vivo. Annu. Rev. Plant Biol. 59, 89–113. doi: 10.1146/annurev.arplant.59.032607.092759
Bernacchi, C. J., Bagley, J. E., Serbin, S. P., Ruiz-Vera, U. M., Rosenthal, D. M., Vanloocke, A. (2013). Modelling C3 photosynthesis from the chloroplast to the ecosystem. Plant Cell Environ. 36, 1641–1657. doi: 10.1111/pce.2013.36.issue-9
Buckley, T. N., Diaz-Espejo, A. (2015). Reporting estimates of maximum potential electron transport rate. New Phytol. 205, 14–17. doi: 10.1111/nph.13018
Buckley, T. N., Farquhar, G. D. (2004). A new analytical model for whole-leaf potential electron transport rate. Plant Cell Environ. 27, 1487–1502. doi: 10.1111/j.1365-3040.2004.01232.x
Cai, C., Li, G., Yang, H., Yang, J., Liu, H., Struik, P. C., et al. (2018). Do all leaf photosynthesis parameters of rice acclimate to elevated CO2, elevated temperature, and their combination, in FACE environments? Global Change Biol. 24, 1685–1707. doi: 10.1111/gcb.13961
Córdoba, J., Molina-Cano, J. L., Martínez-Carrasco, R., Morcuende, R., Pérez, P. (2016). Functional and transcriptional characterization of a barley mutant with impaired photosynthesis. Plant Sci. 244, 19–30. doi: 10.1016/j.plantsci.2015.12.006
Ehleringer, J. J. O. (1981). Leaf absorptances of Mohave and Sonoran desert plants. Oecologia 49, 366–370. doi: 10.1007/BF00347600
Evans, J. R. (2009). Potential errors in electron transport rates calculated from chlorophyll fluorescence as revealed by a multilayer leaf model. Plant Cell Physiol. 50, 698–706. doi: 10.1093/pcp/pcp041
Farquhar, G. D., von Caemmerer, S., Berry, J. A. (1980). A biochemical model of photosynthetic CO2 assimilation in leaves of C3 species. Planta 149, 78–90. doi: 10.1007/BF00386231
Fiebig, O. C., Harris, D., Wang, D., Hoffmann, M. P., Schlau-Cohen, G. S. (2023). Ultrafast dynamics of photosynthetic light harvesting: atrategies for acclimation across organisms. Ann. Rev. Phys. Chem. 74, 493–520. doi: 10.1146/annurev-physchem-083122-111318
Genty, B., Briantais, J.-M., Baker, N. R. (1989). The relationship between the quantum yield of photosynthetic electron transport and quenching of chlorophyll fluorescence. BBA-Gen. Subj. 990, 87–92. doi: 10.1016/S0304-4165(89)80016-9
Govindjee (2002). A role for a light-harvesting antenna complex of photosystem II in photoprotection. Plant Cell 14, 1663–1668. doi: 10.1105/tpc.140810
Gu, L. H., Pallardy, S. G., Law, B. E., Wullschleger, S. D. (2010). Reliable estimation of biochemical parameters from C3 leaf photosynthesis-intercellular carbon dioxide response curves. Plant Cell Environ. 33, 1852–1874. doi: 10.1111/j.1365-3040.2010.02192.x
Krall, J. P., Edwards, G. E. (1992). Relationship between photosystem II activity and CO2 fixation in leaves. Physiol. Plantarum 86, 180–187. doi: 10.1111/j.1399-3054.1992.tb01328.x
Ley, A. C., Mauzerall, D. C. (1982). Absolute absorption cross-sections for photosystem II and the minimum quantum requirement for photosynthesis in Chlorella vulgaris. BBA-Bioenergetics 680, 95–106. doi: 10.1016/0005-2728(82)90320-6
Liu, F., Song, Q., Zhao, J., Mao, L., Bu, H., Hu, Y., et al. (2021). Canopy occupation volume as an indicator of canopy photosynthetic capacity. New Phytol. 232, 941–956. doi: 10.1111/nph.17611
Long, S. P., Bernacchi, C. J. (2003). Gas exchange measurements, what can they tell us about the underlying limitations to photosynthesis? Procedures and sources of error. J. Exp. Bot. 54, 2393–2401. doi: 10.1093/jxb/erg262
Maxwell, K., Johnson, G. N. (2000). Chlorophyll fluorescence—a practical guide. J. Exp. Bot. 51, 659–668. doi: 10.1093/jexbot/51.345.659
Miao, Z., Xu, M., Lathrop, R. G., Jr., Wang, Y. (2009). Comparison of the A–Cc curve fitting methods in determining maximum ribulose 1,5-bisphosphate carboxylase/oxygenase carboxylation rate, potential light saturated electron transport rate and leaf dark respiration. Plant Cell Environ. 32, 109–122. doi: 10.1111/j.1365-3040.2008.01900.x
Moin, M., Bakshi, A., Saha, A., Udaya Kumar, M., Reddy, A. R., Rao, K. V., et al. (2016). Activation tagging in indica rice identifies ribosomal proteins as potential targets for manipulation of water-use efficiency and abiotic stress tolerance in plants. Plant Cell Environ. 39, 2440–2459. doi: 10.1111/pce.12796
Niyogi, K. K., Truong, T. B. (2013). Evolution of flexible non-photochemical quenching mechanisms that regulate light harvesting in oxygenic photosynthesis. Curr. Opin. Plant Biol. 16, 307–314. doi: 10.1016/j.pbi.2013.03.011
Park, K. S., Kim, S. K., Cho, Y.-Y., Cha, M. K., Jung, D. H., Son, J. E. (2016). A coupled model of photosynthesis and stomatal conductance for the ice plant (Mesembryanthemum crystallinum L.), a facultative CAM plant. Hortic. Environ. Biote. 57, 259–265. doi: 10.1007/s13580-016-0027-7
Pavlovič, A., Slováková, L. U., Pandolfi, C., Mancuso, S. (2011). On the mechanism underlying photosynthetic limitation upon trigger hair irritation in the carnivorous plant Venus flytrap (Dionaea muscipula Ellis). J. Exp. Bot. 62, 1991–2000. doi: 10.1093/jxb/erq404
Ralph, P. J., Gademann, R. (2005). Rapid light curves: a powerful tool assesses photosynthetic activity. Aquat. Bot. 82, 222–237. doi: 10.1016/j.aquabot.2005.02.006
Ritchie, R. J. (2008). Fitting light saturation curves measured using modulated fluorometry. Photosynth. Res. 96, 201–215. doi: 10.1007/s11120-008-9300-7
Ritchie, R. J., Bunthawin, S. (2010). The use of pulse amplitude modulation (PAM) fluorometry to measure photosynthesis in a CAM orchid, Dendrobium spp. (D. cv. Viravuth Pink). Int. J. Plant Sci. 171, 575–585. doi: 10.1086/653131
Robakowski, P. (2005). Susceptibility to low-temperature photoinhibition in three conifers differing in successional status. Tree Physiol. 25, 1151–1160. doi: 10.1093/treephys/25.9.1151
Robakowski, P., Pers-Kamczyc, E., Ratajczak, E., Thomas, P. A., Ye, Z.-P., Rabska, M., et al. (2018). Photochemistry and antioxidative capacity of female and male Taxus baccata L. acclimated to different nutritional environments. Front. Plant Sci. 9. doi: 10.3389/fpls.2018.00742
Sharkey, T. D., Bernacchi, C. J., Fa Rquhar, G. D., Singsaas, E. L. (2007). Fitting photosynthetic carbon dioxide response curves for C3 leaves. Plant Cell Environ. 30, 1035–1040. doi: 10.1111/j.1365-3040.2007.01710.x
Shevela, D., Kern, J. F., Govindjee, G., Messinger, J. (2023). Solar energy conversion by photosystem II: principles and structures. Photosynth. Res. 156, 279–307. doi: 10.1007/s11120-022-00991-y
Silsbe, G. M., Kromkamp, J. C. (2012). Modeling the irradiance dependency of the quantum efficiency of photosynthesis. Limnol. Oceanogr. - Meth. 10, 645–652. doi: 10.4319/lom.2012.10.645
Smyth, T. J., Pemberton, K. L., Aiken, J., Geider, R. J. (2004). A methodology to determine primary production and phytoplankton photosynthetic parameters from Fast Repetition Rate Fluorometry. J. Plankton Res. 26, 1337–1350. doi: 10.1093/plankt/fbh124
Song, Q., Wang, Y., Qu, M., Ort, D. R., Zhu, X.-G. (2017). The impact of modifying photosystem antenna size on canopy photosynthetic efficiency—Development of a new canopy photosynthesis model scaling from metabolism to canopy level processes. Plant Cell Environ. 40, 2946–2957. doi: 10.1111/pce.13041
Stefanov, M. A., Rashkov, G. D., Apostolova, E. L. (2022). Assessment of the photosynthetic apparatus functions by chlorophyll fluorescence and P700 absorbance in C3 and C4 plants under physiological conditions and under salt stress. Int. J. Mol. Sci. 23, 3768. doi: 10.3390/ijms23073768
Suggett, D. J., Le Floc’H, E., Harris, G. N., Leonardos, N., Geider, R. J. (2007). Different strategies of photoacclimation by two strains of Emiliania huxleyi (Haptophyta). J. Phycol. 43, 1209–1222. doi: 10.1111/j.1529-8817.2007.00406.x
Suggett, D. J., MacIntyre, H. L., Geider, R. J. (2004). Evaluation of biophysical and optical determinations of light absorption by photosystem II in phytoplankton. Limnol. Oceanogr. - Meth. 2, 316–332. doi: 10.4319/lom.2004.2.316
van der Tol, C., Berry, J. A., Campbell, P. K. E., Rascher, U. (2014). Models of fluorescence and photosynthesis for interpreting measurements of solar-induced chlorophyll fluorescence. J. Geophys. Res.-Biogeo. 119, 2312–2327. doi: 10.1002/2014JG002713
van Kooten, O., Snel, J. F. H. (1990). The use of chlorophyll fluorescence nomenclature in plant stress physiology. Photosynth. Res. 25, 147–150. doi: 10.1007/BF00033156
von Caemmerer, S. (2000). Biochemical models of leaf photosynthesis (Victoria, Australia: CSIRO Publishing).
von Caemmerer, S. (2013). Steady-state models of photosynthesis. Plant Cell Environ. 36, 1617–1630. doi: 10.1111/pce.12098
Wang, B., Zhuang, Z., Zhang, Z., Draye, X., Shuang, L.-S., Shehzad, T., et al. (2017). Advanced backcross QTL analysis of fiber strength and fineness in a cross between Gossypium hirsutum and G. mustelinum. Front. Plant Sci. 8. doi: 10.3389/fpls.2017.01848
Webb, W. L., Newton, M., Starr, D. (1974). Carbon dioxide exchange of Alnus rubra. Oecologia 17, 281–291. doi: 10.1007/BF00345747
Wellburn, A. R. (1994). The spectral determination of chlorophylls a and b, as well as total carotenoids, using various solvents with spectrophotometers of different resolution. J. Plant Physiol. 144, 307–313. doi: 10.1016/S0176-1617(11)81192-2
Xiao, Y., Tholen, D., Zhu, X.-G. (2016). The influence of leaf anatomy on the internal light environment and photosynthetic electron transport rate: exploration with a new leaf ray tracing model. J. Exp. Bot. 67, 6021–6035. doi: 10.1093/jxb/erw359
Yang, X. L., Dong, W., Liu, L. H., Bi, Y. H., Xu, W. Y., Wang, X. (2023). Uncovering the differential growth of Microcystis aeruginosa cultivated under nitrate and ammonium from a pathophysiological perspective. ACS ES&T Water 3, 1161–1171. doi: 10.1021/acsestwater.2c00624
Yang, X.-L., Ma, X.-F., Ye, Z.-P., Yang, L.-S., Shi, J.-B., Wang, X., et al. (2024). Simulating short-term light responses of photosynthesis and water use efficiency in sweet sorghum under varying temperature and CO2 conditions. Front. Plant Sci. 15. doi: 10.3389/fpls.2024.1291630
Ye, Z.-P., An, T., Govindjee, G., Robakowski, P., Stirbet, A., Yang, X.-L., et al. (2024). Addressing the long-standing limitations of double exponential and non-rectangular hyperbolic models in quantifying light-response of electron transport rates in different photosynthetic organisms under various conditions. Front. Plant Sci. 15. doi: 10.3389/fpls.2024.1332875
Ye, Z. P., Robakowski, P., Suggett, D. J. (2013a). A mechanistic model for the light response of photosynthetic electron transport rate based on light harvesting properties of photosynthetic pigment molecules. Planta 237, 837–847. doi: 10.1007/s00425-012-1790-z
Ye, Z. P., Suggett, J. D., Robakowski, P., Kang, H. J. (2013b). A mechanistic model for the photosynthesis-light response based on the photosynthetic electron transport of photosystem II in C3 and C4 species. New Phytol. 199, 110–120. doi: 10.1111/nph.12242
Yin, X., Busch, F. A., Struik, P. C., Sharkey, T. D. (2021). Evolution of a biochemical model of steady-state photosynthesis. Plant Cell Environ. 44, 2811–2837. doi: 10.1111/pce.14070
Yin, X., Struik, P. C., Romero, P., Harbinson, J., Vos, J. (2009). Using combined measurements of gas exchange and chlorophyll fluorescence to estimate parameters of a biochemical C3 photosynthesis model: a critical appraisal and a new integrated approach applied to leaves in a wheat (Triticum aestivum) canopy. Plant Cell Environ. 32, 448–464. doi: 10.1111/j.1365-3040.2009.01934.x
Keywords: Ye model, effective quantum efficiency of photosystem II (ΦPSII), non-photochemical quenching, light absorption cross-section, light-harvesting pigment molecules, photosynthetic light response
Citation: Yang X-L, An T, Ye Z-W-Y, Kang H-J, Robakowski P, Ye Z-P, Wang F-B and Zhou S-X (2025) Modeling light response of effective quantum efficiency of photosystem II for C3 and C4 crops. Front. Plant Sci. 16:1478346. doi: 10.3389/fpls.2025.1478346
Received: 09 August 2024; Accepted: 04 February 2025;
Published: 06 March 2025.
Edited by:
Weimin Ma, Shanghai Normal University, ChinaReviewed by:
Jun Li, Chinese Academy of Sciences (CAS), ChinaCopyright © 2025 Yang, An, Ye, Kang, Robakowski, Ye, Wang and Zhou. This is an open-access article distributed under the terms of the Creative Commons Attribution License (CC BY). The use, distribution or reproduction in other forums is permitted, provided the original author(s) and the copyright owner(s) are credited and that the original publication in this journal is cited, in accordance with accepted academic practice. No use, distribution or reproduction is permitted which does not comply with these terms.
*Correspondence: Shuang-Xi Zhou, c2h1YW5neGkuemhvdUBkcGlyZC53YS5nb3YuYXU=; Zi-Piao Ye, eWV6cEBqZ3N1LmVkdS5jbg==
†These authors have contributed equally to this work
Disclaimer: All claims expressed in this article are solely those of the authors and do not necessarily represent those of their affiliated organizations, or those of the publisher, the editors and the reviewers. Any product that may be evaluated in this article or claim that may be made by its manufacturer is not guaranteed or endorsed by the publisher.
Research integrity at Frontiers
Learn more about the work of our research integrity team to safeguard the quality of each article we publish.