 David Aguilar-Benitez
 Natalia Gutierrez
 Inés Casimiro-Soriguer
 Ana M. Torres
95% of researchers rate our articles as excellent or good
Learn more about the work of our research integrity team to safeguard the quality of each article we publish.
Find out more
ORIGINAL RESEARCH article
Front. Plant Sci. , 07 April 2025
Sec. Plant Breeding
Volume 16 - 2025 | https://doi.org/10.3389/fpls.2025.1457812
Faba bean is a key protein feed and food worldwide that still requires accurate genomic tools to facilitate molecular marker-assisted breeding. Efficient quantitative trait locus (QTL) mapping in faba bean is restricted by the low or medium density of most of the available genetic maps. In this study, a recombinant inbred line faba bean population including 124 lines from the cross Vf6 x Vf27, highly segregating for autofertility, flowering time, plant architecture, dehiscence, and yield-related traits, was genotyped using the ‘Vfaba_v2’ SNP array. Genotypic data were used to generate a high-density genetic map that, after quality control and filtering, included 2,296 SNP markers. The final map consisted of 1,674 bin markers distributed across the six faba bean chromosomes, covering 2,963.87 cM with an average marker distance of 1.77 cM. A comparison of the physical and genetic maps revealed a good correspondence between chromosomes and linkage groups. QTL analysis of 66 segregating traits, previously phenotyped in different environments and years, identified 99 significant QTLs corresponding to 35 of the traits. Most QTLs were stable over the years and QTLs for highly correlated traits were mapped to the same or adjacent genomic regions. Colocalization of QTLs occurred in 13 major regions, joining three or more overlapping QTLs. Some of the pleiotropic QTL regions, especially in chromosome VI, shared the same significant marker for different traits related to pollen quantity and size, number of ovules per ovary, seeds per pod, and pod set. Finally, several putative candidate genes for yield-related traits, recently identified using a genome-wide association study, fall inside the colocalizing groups described in this study, indicating that, apart from refining the position of the QTLs and the detection of candidates, the dense new map provides a valuable tool for validation of causative loci derived from association studies and will help advance breeding programs in this crop.
Faba bean (Vicia faba L.), one of the oldest and most globally grown cool-season grain legumes, is a partially allogamous insect-pollinated species with a mixed mating system. This legume ranks sixth in terms of the world average production of pulse crops (FAOSTAT, 2022) with a value of 6.1 Mt. China is the largest producer, followed by Ethiopia, the United Kingdom, Australia, and France. With one of the highest protein contents, faba bean is a major food and feed crop used worldwide as a dry grain (pulse), green grain/pod, and green manure. Apart from its nutritional value, faba bean cultivation contributes to more sustainable production in the entire cropping system by providing several agronomic, environmental, and ecological services. By fixing atmospheric nitrogen in symbiosis with rhizobia, faba bean improves soil fertility and contributes to a reduction in the use of synthetic fertilizers, thus promoting circularity and mitigating the environmental impact associated with N2O emissions. Moreover, faba bean crop rotations promote diversification, improves the yield of the subsequent crop, and breaks the cycles of pests and diseases, enhancing soil health and structure.
Despite the global significance of the crop and its long history of use, from the 60s to the present, faba bean worldwide cultivation has decreased from 5.4 million hectares to approximately 2.7 million hectares (FAOSTAT, 2022). Lower faba bean profitability compared to other cash crops (such as cereals) and the instability of yields are among the main causes of this decline (Zander et al., 2016). Faba bean production is often threatened by environmental conditions, especially extreme temperatures, drought, and acidity, that, together with diseases (e.g. chocolate spot or ascochyta blight), parasitic weeds of the Orobanche genus, and pests (e.g. leaf or seed weevils and aphids), reduce crop yield and affect the commercialization of the grains. Therefore, resistance/tolerance to these biotic and abiotic stresses, together with yield and quality trait improvements, are major priorities in current breeding programs.
Valuable progress has been made through conventional breeding in the last century but faba bean genomic studies have lagged far behind other grain legume crops. One limitation for such development in faba bean has been its large and complex genome (13 Gbp), the largest among the cool season legumes, with a high presence of repeat DNA (Macas et al., 2015), which has hampered the development of saturated genetic linkage maps and the development of diagnostic markers within the quantitative trait locus (QTL) intervals. In the last two decades, however, significant efforts have been made to enrich genetic and genomic resources in this crop, and faba bean has also slowly benefited from modern breeding methods based on molecular genetic tools (Adhikari et al., 2021; Khazaei et al., 2021). As a result, a large number of markers and maps have now been developed that can be used to understand faba bean genetics and in comparative genomic studies.
The first genetic maps were based on morphological and isoenzyme markers, anonymous random amplified polymorphic DNA (RAPD) markers, and simple sequence repeats (SSR) (Torres et al., 1993; Vaz Patto et al., 1999; Román et al., 2002; Avila et al., 2004; Román et al., 2004; Avila et al., 2005; Ellwood et al., 2008; Zeid et al., 2009; Ma et al., 2013). RAPDs were further used to develop trait-linked sequence characterized amplified regions (SCARs) for simple seed quality parameters such as tannins and vicine-convicine (Gutierrez et al., 2006, 2007, 2008) or for the selective selection of the determinate growth habit (Avila et al., 2006, 2007). Subsequently, comparative genomic approaches with the model Medicago truncatula and the development of high-throughput sequencing technologies allowed the development of expressed sequence tags (ESTs) and the identification of single nucleotide polymorphisms (SNPs) that reinforced faba bean genetic studies and breeding approaches (Kaur et al., 2014; Ocaña et al., 2015; Ray et al., 2015; Webb et al., 2016; Carrillo-Perdomo et al., 2020).
Biparental mapping populations have been used in faba bean to identify QTLs associated with disease resistances, such as ascochyta and broomrape resistance (Román et al., 2002, 2003; Avila et al., 2004, 2005; Díaz-Ruiz et al., 2009, 2010; Gutierrez et al., 2013; Kaur et al., 2014; Atienza et al., 2016; Ocaña-Moral et al., 2017; Sudheesh et al., 2019; Gutierrez and Torres, 2021); abiotic stresses (Arbaoui et al., 2008); and architectural, flowering and yield-related traits in different genetic backgrounds and populations (Cruz-Izquierdo et al., 2012; Avila et al., 2017; Catt et al., 2017). Furthermore, consensus maps have integrated the information of multiple populations from diverse genetic backgrounds. The first consensus map in faba bean was reported by Satovic et al. (2013) with 729 markers, half of them being RAPDs. Subsequently, Webb et al. (2016) developed the first consensus map based exclusively on SNPs derived from M. truncatula, which contained 687 markers using six mapping populations. Moreover, Carrillo-Perdomo et al. (2020) reported a high saturated faba bean consensus map with 1,728 SNP markers, using three mapping populations.
The development of dense and robust genetic maps based on gene-based markers is a prerequisite for gene mapping, gene cloning, and marker-assisted selection (MAS). The availability of large-scale SNP markers, together with the reduction in sequencing and genotyping cost, has enabled the development of cost-effective low- to high-density genotyping platforms for applied genomic research outside of model species (Zhao et al., 2023). One of the first faba bean high density genotyping platforms combined information from different faba bean transcriptome datasets (Ocaña et al., 2015; Webb et al., 2016; Khan et al., 2019; Lyu et al., 2021) to develop the Vfaba_v2 Axiom SNP array with 60K SNPs (O’Sullivan et al., 2019; Khazaei et al., 2021), which is available from the University of Reading, UK. Recently, Zhao et al. (2023), using the Faba_bean_130 K SNP TNGS genotyping platform, developed the most ultra-dense faba bean map published thus far, consisting of 12,023 SNP markers. These new genomic tools have been utilized to identify alleles associated with target traits using different methods, such as QTL mapping or genome-wide association studies (GWASs) (Sallam et al., 2022). Some of the GWASs reported thus far in this crop aimed to identify candidate genes associated with frost, freezing, heat, and drought tolerance (Ali et al., 2016; Sallam et al., 2016; Maalouf et al., 2022; Sallam et al., 2022; Gutierrez et al., 2023), resistance to Ascochyta fabae (Faridi et al., 2021); tolerance to herbicides (Abou-Khater et al., 2022); phenological and morphological traits (Skovbjerg et al., 2023; Jayakodi et al., 2023); flowering and seed quality traits (Ohm et al., 2024); and yield-related traits (Skovbjerg et al., 2023; Gutierrez et al., 2024) such as pod and seeds per plant, hundred seed weight, seed size, and plot yield. Furthermore, the recent development of a faba bean reference genome (Jayakodi et al., 2023) provides a foundational resource for molecular breeding and increases the opportunities to identify the specific genes and alleles that underpin valuable traits. This new genomic tool represents a step-change in the process, allowing the comparison of significant markers for major genes or QTLs detected from both interval maps and GWASs and thus providing more strength of evidence for further validation experiments.
Despite the significant advances described above, the efficiency and precision of QTL mapping in faba bean is still restricted by the low or medium density of most of the available faba bean maps. For this reason, our objective in this study was to re-analyse the phenotypic data accumulated in a recombinant inbred line (RIL) population in which genotyping has been updated using the Vfaba_v2 SNP array to generate a high-density genetic map. Subsequently, QTL mapping for autofertility, flowering time, plant architecture, dehiscence, and yield-related traits, crucial factors for faba bean performance and final production, were conducted. The high-density genetic map and the QTLs detected will be the basis for fine mapping and the identification of candidate genes for future marker-assisted breeding in this crop.
In this study, we used the RIL population Vf6 x Vf27 consisting of 124 F8:9 individuals developed from single seed descendants in insect proof cages. The female genotype Vf6 is an asynaptic equina line and the male parent Vf27 is a paucijuga type with small seed size considered to be close to the unknown faba bean wild progenitor. Both lines belong to the Instituto de Investigación y Formación Agraria, Pesquera, Alimentaria y de la Producción Ecológica (IFAPA) germplasm collection. The population segregates for architecture, flowering time, autofertility, dehiscence, and yield-related traits. Phenotypic evaluations for autofertility (33 traits) (Aguilar-Benitez et al., 2022), flowering time (4 traits) (Cruz-Izquierdo et al., 2012; Aguilar-Benitez et al., 2021), plant architecture (15 traits) (Avila et al., 2017), yield (9 traits) (Cruz-Izquierdo et al., 2012; Avila et al., 2017), and dehiscence (5 traits) (Aguilar-Benitez et al., 2020a) were used for QTL mapping and the high density map was built upon the most recent map reported (Aguilar-Benitez et al., 2022). Descriptions of the different traits and the acronyms used are given in Supplementary Table S1.
For DNA extraction, young leaves were collected from each individual plant, frozen, and stored at -80°C until use. Genomic DNA was isolated using a DNeasy Plant Kit (QIAGEN ltd, UK). DNA quality was checked using agarose gel electrophoresis while the concentration was estimated using the QubitTM dsDNA Broad Range Assay Kit (Invitrogen by ThermoFisher Scientific, UK), following the manufacturer’s instructions.
For genotyping, we used the ‘Vfaba_v2’ 60k SNP array (O’Sullivan et al., 2019; Khazaei et al., 2021). Polymorphic SNP markers were incorporated into the previous marker dataset (Aguilar-Benitez et al., 2022) to develop a high-density genetic map. To determine the SNP chromosomal position and their corresponding contig, flanking sequences were aligned against the Vicia faba reference genome (Jayakodi et al., 2023) using the “map to reference” option in Geneious v.7.1.9 (Gutierrez et al., 2023). After quality control, only markers with a call rate above 97%, a minor allele frequency (MAF) above 30%, and less than 10% heterozygotes were used for further analysis. Furthermore, individuals showing poor DNA quality were removed. Missing alleles were imputed with the LD-kNNi method (Money et al., 2015) in Tassel v5.2.88 (Bradbury et al., 2007).
The BIN tool algorithm in QTL IciMapping 4.2 (Meng et al., 2015) was used to bin the markers with identical segregation patterns. Segregated data were analyzed for goodness of fit to the expected 1:1 ratio using the chi-square test, and linkage groups were determined based on the LOD threshold value ranging from 6.5 to 10.5. The ordering of markers distributed over each linkage group was performed using the two-opt heuristic algorithm in the QTL IciMapping software. The visualization of the high density SNP marker map was conducted in R 3.6.1 (R Development Core Team, 2022) using the LinkageMapView package (Ouellette et al., 2018). A comparative assembly of the alignment between the genetic and physical maps was obtained using the software implemented in the Pretzel platform (Keeble-Gagnère et al., 2019; http://pulses.plantinformatics.io/mapview).
The high-density genetic map was used in the QTL analysis based on prior phenotypic evaluations. The QTLs were named using the trait’s abbreviated name followed by a number when the trait was evaluated in different years. A list of traits used in this study with detailed descriptions is shown in Supplementary Table S1. QTL detection was conducted using the maximum likelihood (ML) algorithm in the R package R/qtl (Broman et al., 2003), performing a single-QTL genome scan with a normal model. The threshold for the detection of a QTL was determined using 1,000 permutations and a significance (p-value) level of 0.05. The most likely position of a QTL was estimated by the point where the maximum LOD score was found. The confidence interval of each QTL position was estimated with the 1-LOD and 2-LOD support intervals (Conneally et al., 1985; van Ooijen, 1992). The percentage of phenotypic variance explained (R2) by each QTL was obtained using the method proposed by Stansell et al. (2019). To visualize the position of each QTL, the information of the relative position of the peak of LOD was added to the map.
Overlapping QTLs within a given genetic region were designed as colocalizing groups. The criteria to determine the colocalizing groups were: (1) a group has to contain at least three QTLs, (2) QTLs with confidence intervals connecting different QTL groups were discarded and, (3) the LOD peak of each QTL within a group has to fall in or very close to the confidence interval of the other colocalized QTLs. To understand the relationship among the traits, we performed a Pearson correlation analysis for each colocalizing group using the PerformanceAnalytics R package (Peterson and Carl, 2020).
The physical map information was used to determine the number of genes falling within each QTL or colocalizing group interval and the QTL distance in megabase pairs (Mbp).
The sequences flanking each significant SNP marker detected in the QTL analysis or the markers belonging to the same bin were blasted (BLASTx) against the NCBI (https://blast.ncbi.nlm.nih.gov/Blast.cgi) Medicago truncatula and Arabidopsis thaliana reference genomes to annotate the potential candidate genes responsible of each trait.
A population of 124 RILs and their parental lines were genotyped using the ‘Vfaba_v2’ 60k Axiom array, obtaining 34,320 SNP markers with a call rate above 97%. After quality control, seven individual samples were removed from the genotyping matrix due to poor DNA quality. The 34,320 SNP markers and the previous dataset (450 markers) were filtered for MAF > 30% and heterozygotes < 10%, obtaining a final matrix of 2,296 SNP markers.
Co-segregated or tightly linked SNP markers, continuous at non-recombining intervals, were defined as bin markers (Guo et al., 2023). We obtained 1,676 bin markers that were finally used to construct the genetic map. Two of the bin markers were unlinked, and thus, the final map contained 1,674 bin markers well-distributed across the six faba bean chromosomes in eight linkage groups (chromosomes II and V were separated into two linkage groups each). Chromosome assignment of the SNP markers was performed by mapping the sequences against the recent faba bean genomic sequence (Jayakodi et al., 2023). Thus, 1,942 of them could be ascribed to a specific chromosome, while 352, named Vf0 (73 markers in chr. I, 64 in chr. II, 66 in chr. III, 74 in chr. IV, 14 in chr. V and 61 in chr. VI), were unassigned (Supplementary Table S2). The total map distance was 2,963.87 cM, with an average marker distance of 1.77 cM (Table 1). The number of markers in each linkage group (LG) ranged from 486 in LG I to 22 in LG II-1, the highest and lowest genomic distances (2.38 and 1.27 cM) were found in LGs V-2 and IV, respectively, and the maximum and minimum gap between markers (38.06 and 9.64 cM) in LGs VI and V-1, respectively. The chi-square test revealed that 34.77% of the bin markers showed distorted segregation and the highest percentages were observed in LGs V-1, II-2, and V-2 (78.26%, 64.22%, and 62.07%, respectively) (Table 1).
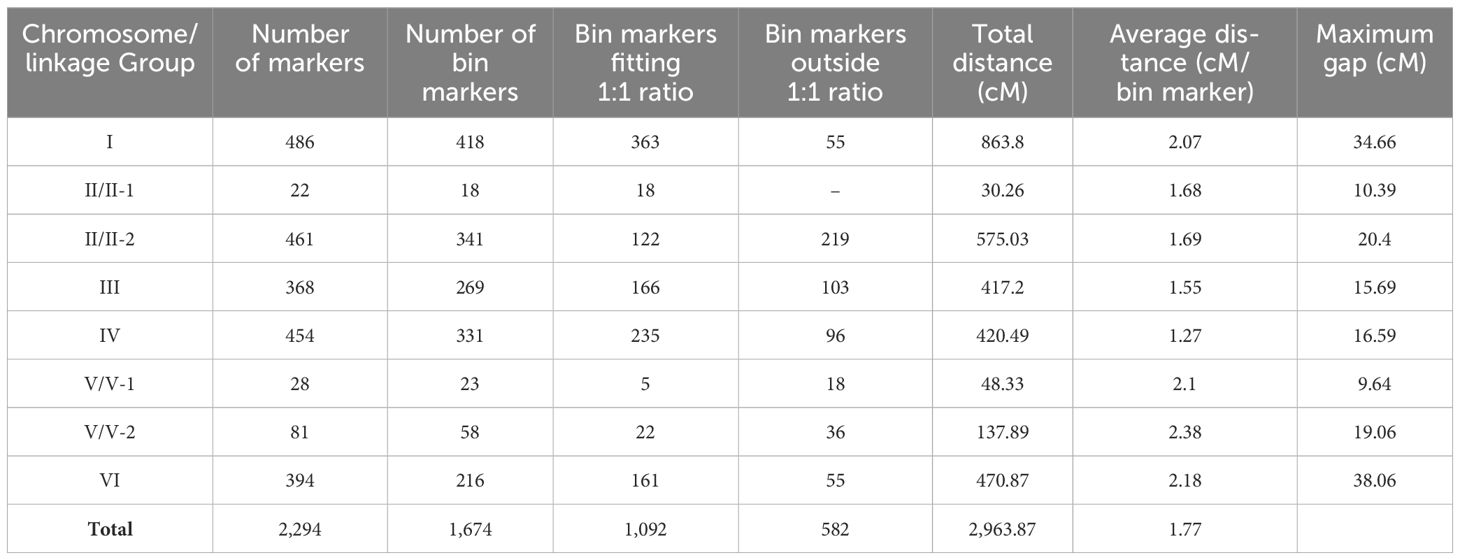
Table 1. Summary of the faba bean genetic map developed in this study.
The QTL analysis of 66 faba bean traits detected 99 significant QTLs corresponding to 35 traits (24 QTLs for autofertility traits, 6 for flowering time, 46 for plant architecture, 22 for yield-related traits, and 1 for dehiscence). The high-density bin map and the location of each QTL are shown in Figure 1. Chromosome I included 27 QTLs and chr. II 14 QTLs (one in LG II-1 and 13 in LG II-2). Furthermore, 11 QTLs were located in chr. III, 13 in chr. IV, and four in chr. V, whereas chr. VI showed 30 QTLs.
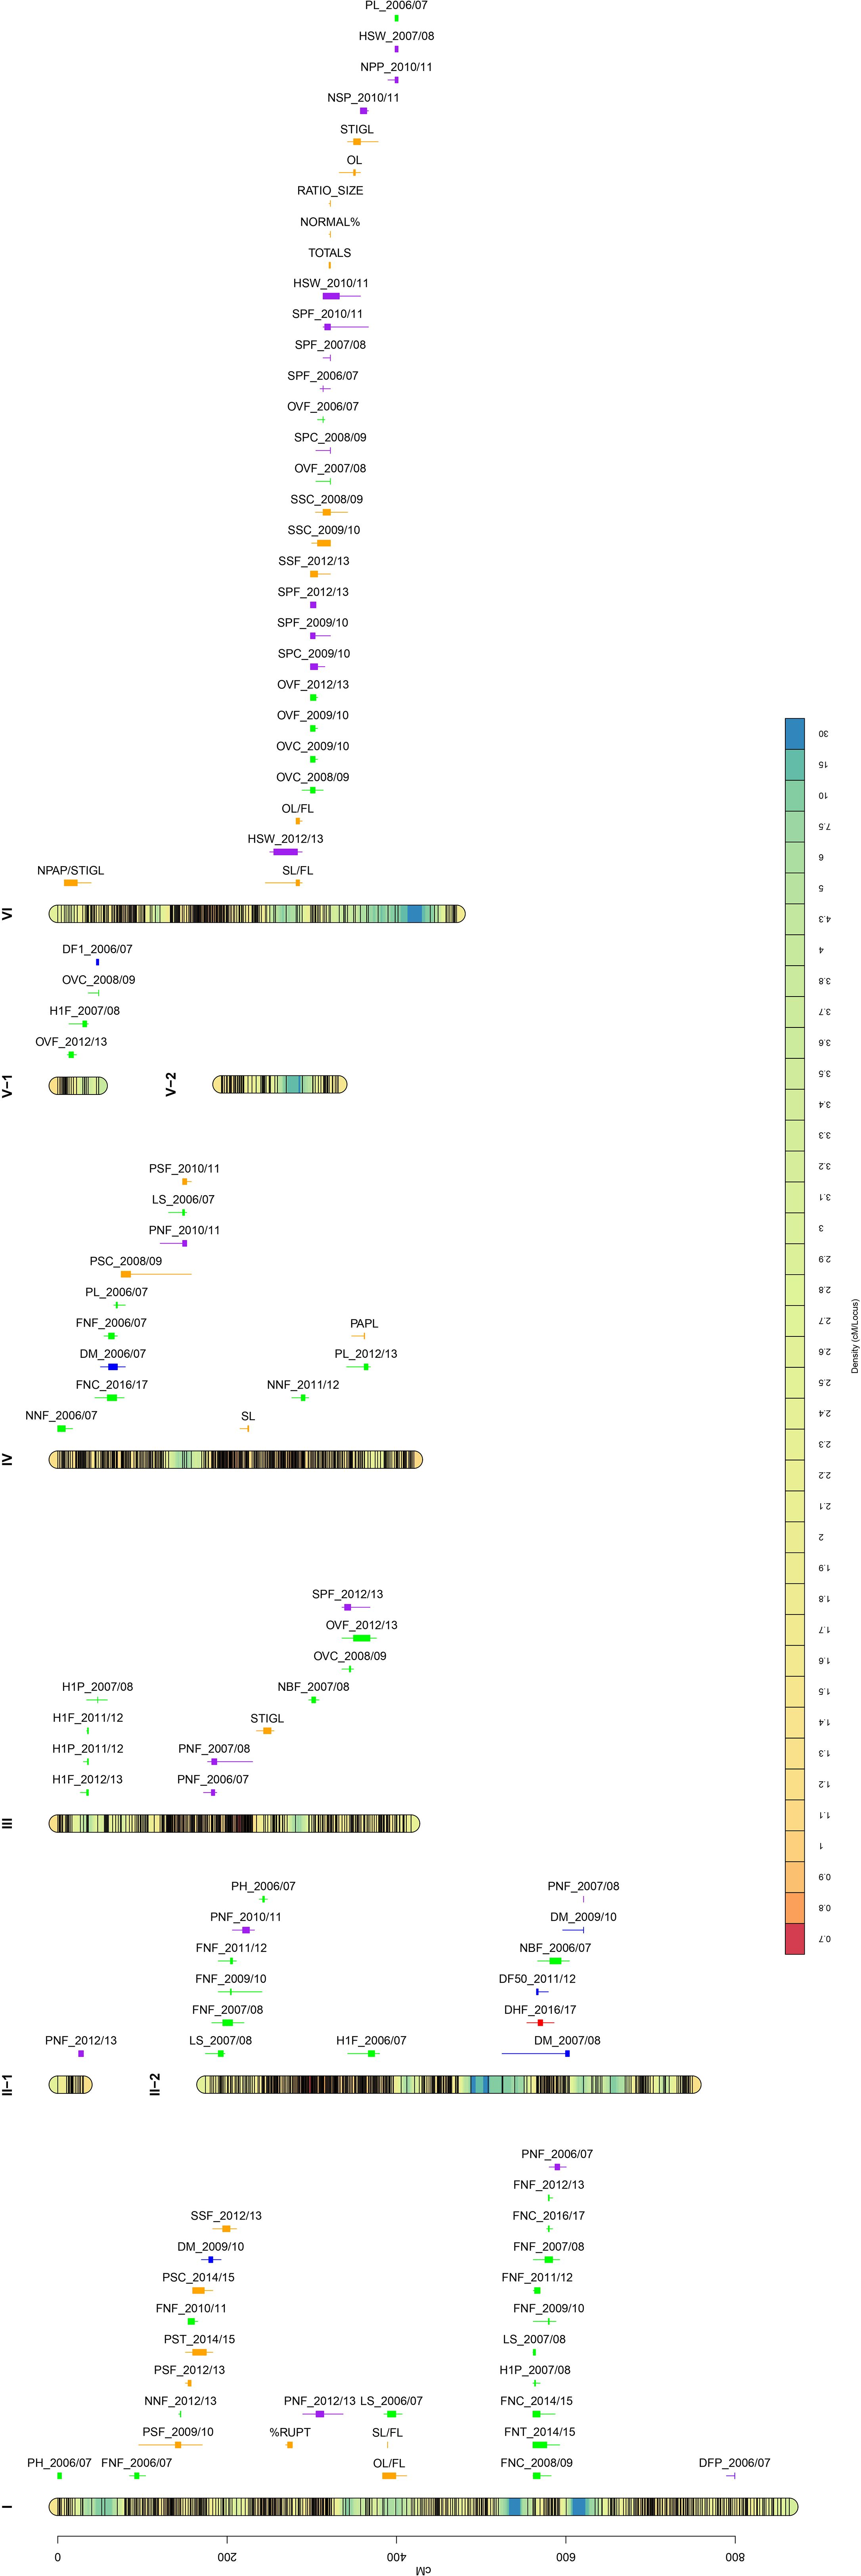
Figure 1. Bin marker density genetic map for the cross Vf6 x Vf27 (left side) and QTL position (right side). Color scale bar in the linkage groups ascribed to six faba bean chromosomes indicates the density of the SNP markers. Significant QTLs for the 35 traits evaluated are labeled with different colors: autofertility (orange), flowering time (blue), plant architecture (green), yield (purple), and dehiscence (red). QTL locations are represented by bars (2-LOD interval) and boxes (1-LOD interval).
Significant QTLs for autofertility traits were detected across the whole genome except in chrs. II and V (Figure 1; Table 2), with the highest number of QTLs (11) in chr. VI. LOD scores ranged from 3.1 (NPAP/STIGL) to 8.12 (NORMAL%), with a percentage of phenotypic variation explained varying from 11.49% (NPAP/STIGL) to 27.36% (NORMAL%). Interestingly, traits related with pollen measures revealed one main zone of colocalized QTLs in chr. VI associated with the marker AX-181158608. Furthermore, three different measures for seed set (SS) were found in the same position or close to it (SSC_2008/09, SSF_2012/13 and SSC_2009/10). We found a relevant genomic region in chr. I for different pod set (PS) evaluations. Some significant QTLs for morphological floral measures were detected such as stigma length (STIGL) in chr. III and VI, style length (SL) in chr. IV, ovary length (OL) in chr. VI and their standardization with flower length (SL/FL and OL/FL) in chrs. I and VI. Furthermore, the number of stigmatic papillae divided by stigma length (N_PAP/STIGL) in chr. VI or papilla length (PAPL) in chr. IV were also detected (Table 2). Finally, one significant QTL related to the rupture of the stigmatic cuticle (%RUPT) was found in chr. I was associated with the marker AX-416819105 with 13.38% of variation explained. In addition, we detected some non-significant QTLs for autofertility traits that colocalized with other significant QTLs, one of which (RUPTL) was located in chr. I in the same position as %RUPT (Supplementary Table S3). Furthermore, a QTL for the quantity of pollen with normal size (NORMALS) located in chr. I was associated with a significant QTL of PS. Finally, a non-significant QTL for %RUPTAREA was found at a distance of 3.55 cM from the LOD peak of NPAP/STIGL QTL in chr. VI (Supplementary Table S2).
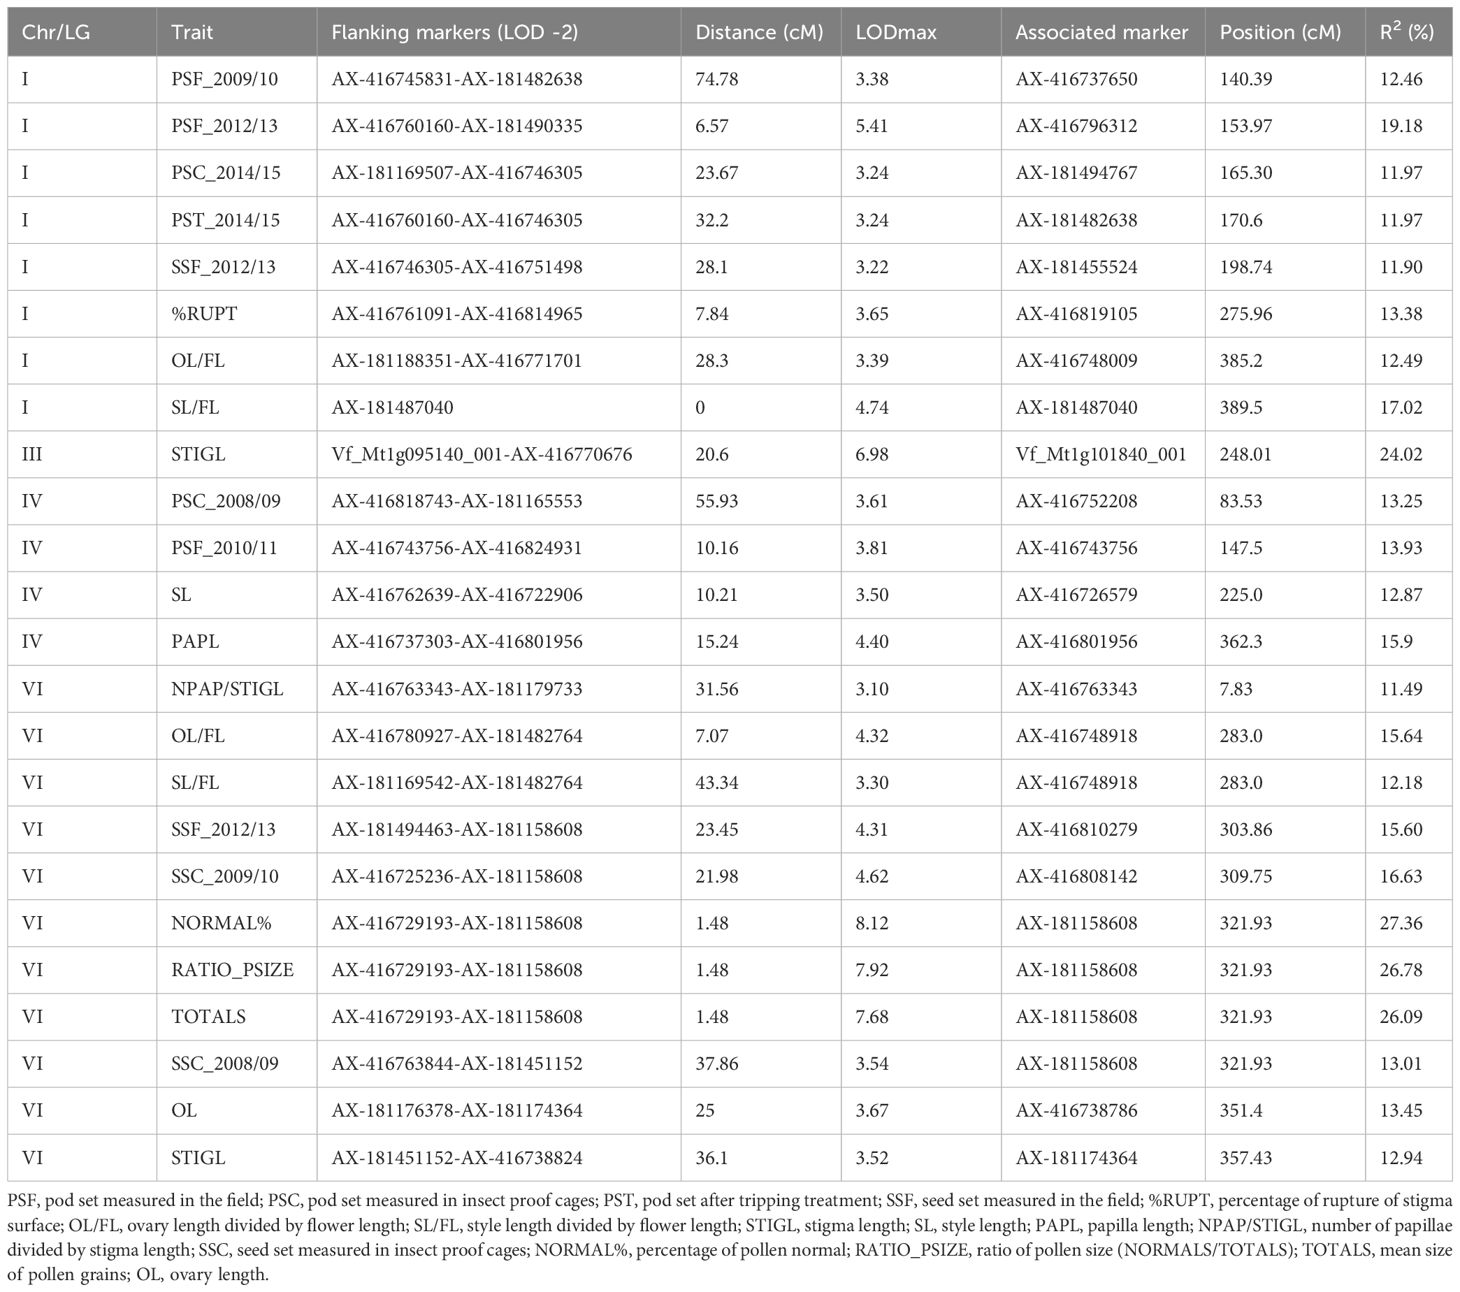
Table 2. QTLs for autofertility traits.
We detected six QTLs for flowering time distributed in chromosomes I, II, IV, and V (Figure 1; Table 3). The QTLs explained a percentage of phenotypic variation ranging from 12.22% (DM_2009/10) to 15.2% (DF1_2006/07). QTLs for days to maturity (DM) were located in chrs. I, II, and IV: a QTL for the number of days until the 50% of the plants had open flowers (DF50) in chr. II and another QTL for the number of days to the first flower appearance (DF1) in chr. V. Despite not reaching statistical significance, a putative QTL for DM colocalized with the significant QTL for DM in chr. II and several suggestive QTLs for other flowering time measures overlapped in the DF1 QTL region in chr. V (Supplementary Table S3).
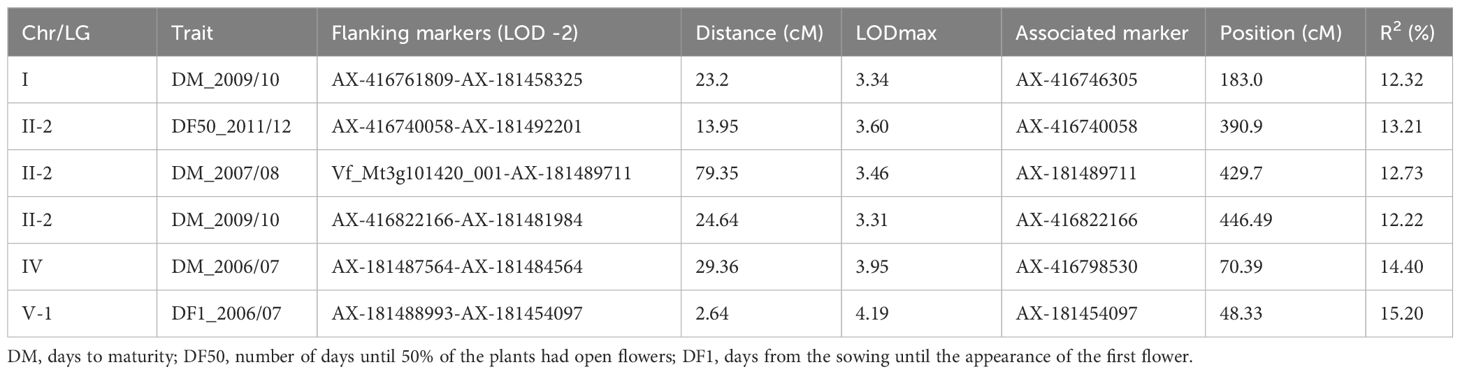
Table 3. QTLs for flowering time.
Up to 46 significant QTLs across the whole genome were found for traits related to plant architecture (Figure 1; Table 4), with the highest number of QTLs in chromosome I (15 QTLs). LOD values ranged from 3.18 (PL_2012/13) to 8.74 (OVF_2006/07), with the percentage of phenotypic variation ranging from 11.76% to 29.11%, respectively. In total, 29 QTLs contributed over 15% of the phenotypic variation. Eight out of ten QTLs for the number of flowers per node (FN) were located in a narrow interval in chr. I, QTLs for ovules per ovary (OV) were mostly localized in chr. VI, and two of them were associated with the same marker (AX-416759442). Although the data collection was performed in different agronomic seasons, most of the QTLs colocalized or were found at very close positions, indicating that both traits are well conserved across the years. Some QTLs for the height of the first flower (H1F) and the height of the first pod (H1P) were located in chr. III, and three of them were associated with the same marker (AX-416801028). QTLs for other traits were distributed across the genome, with no specific location or aggregation pattern.
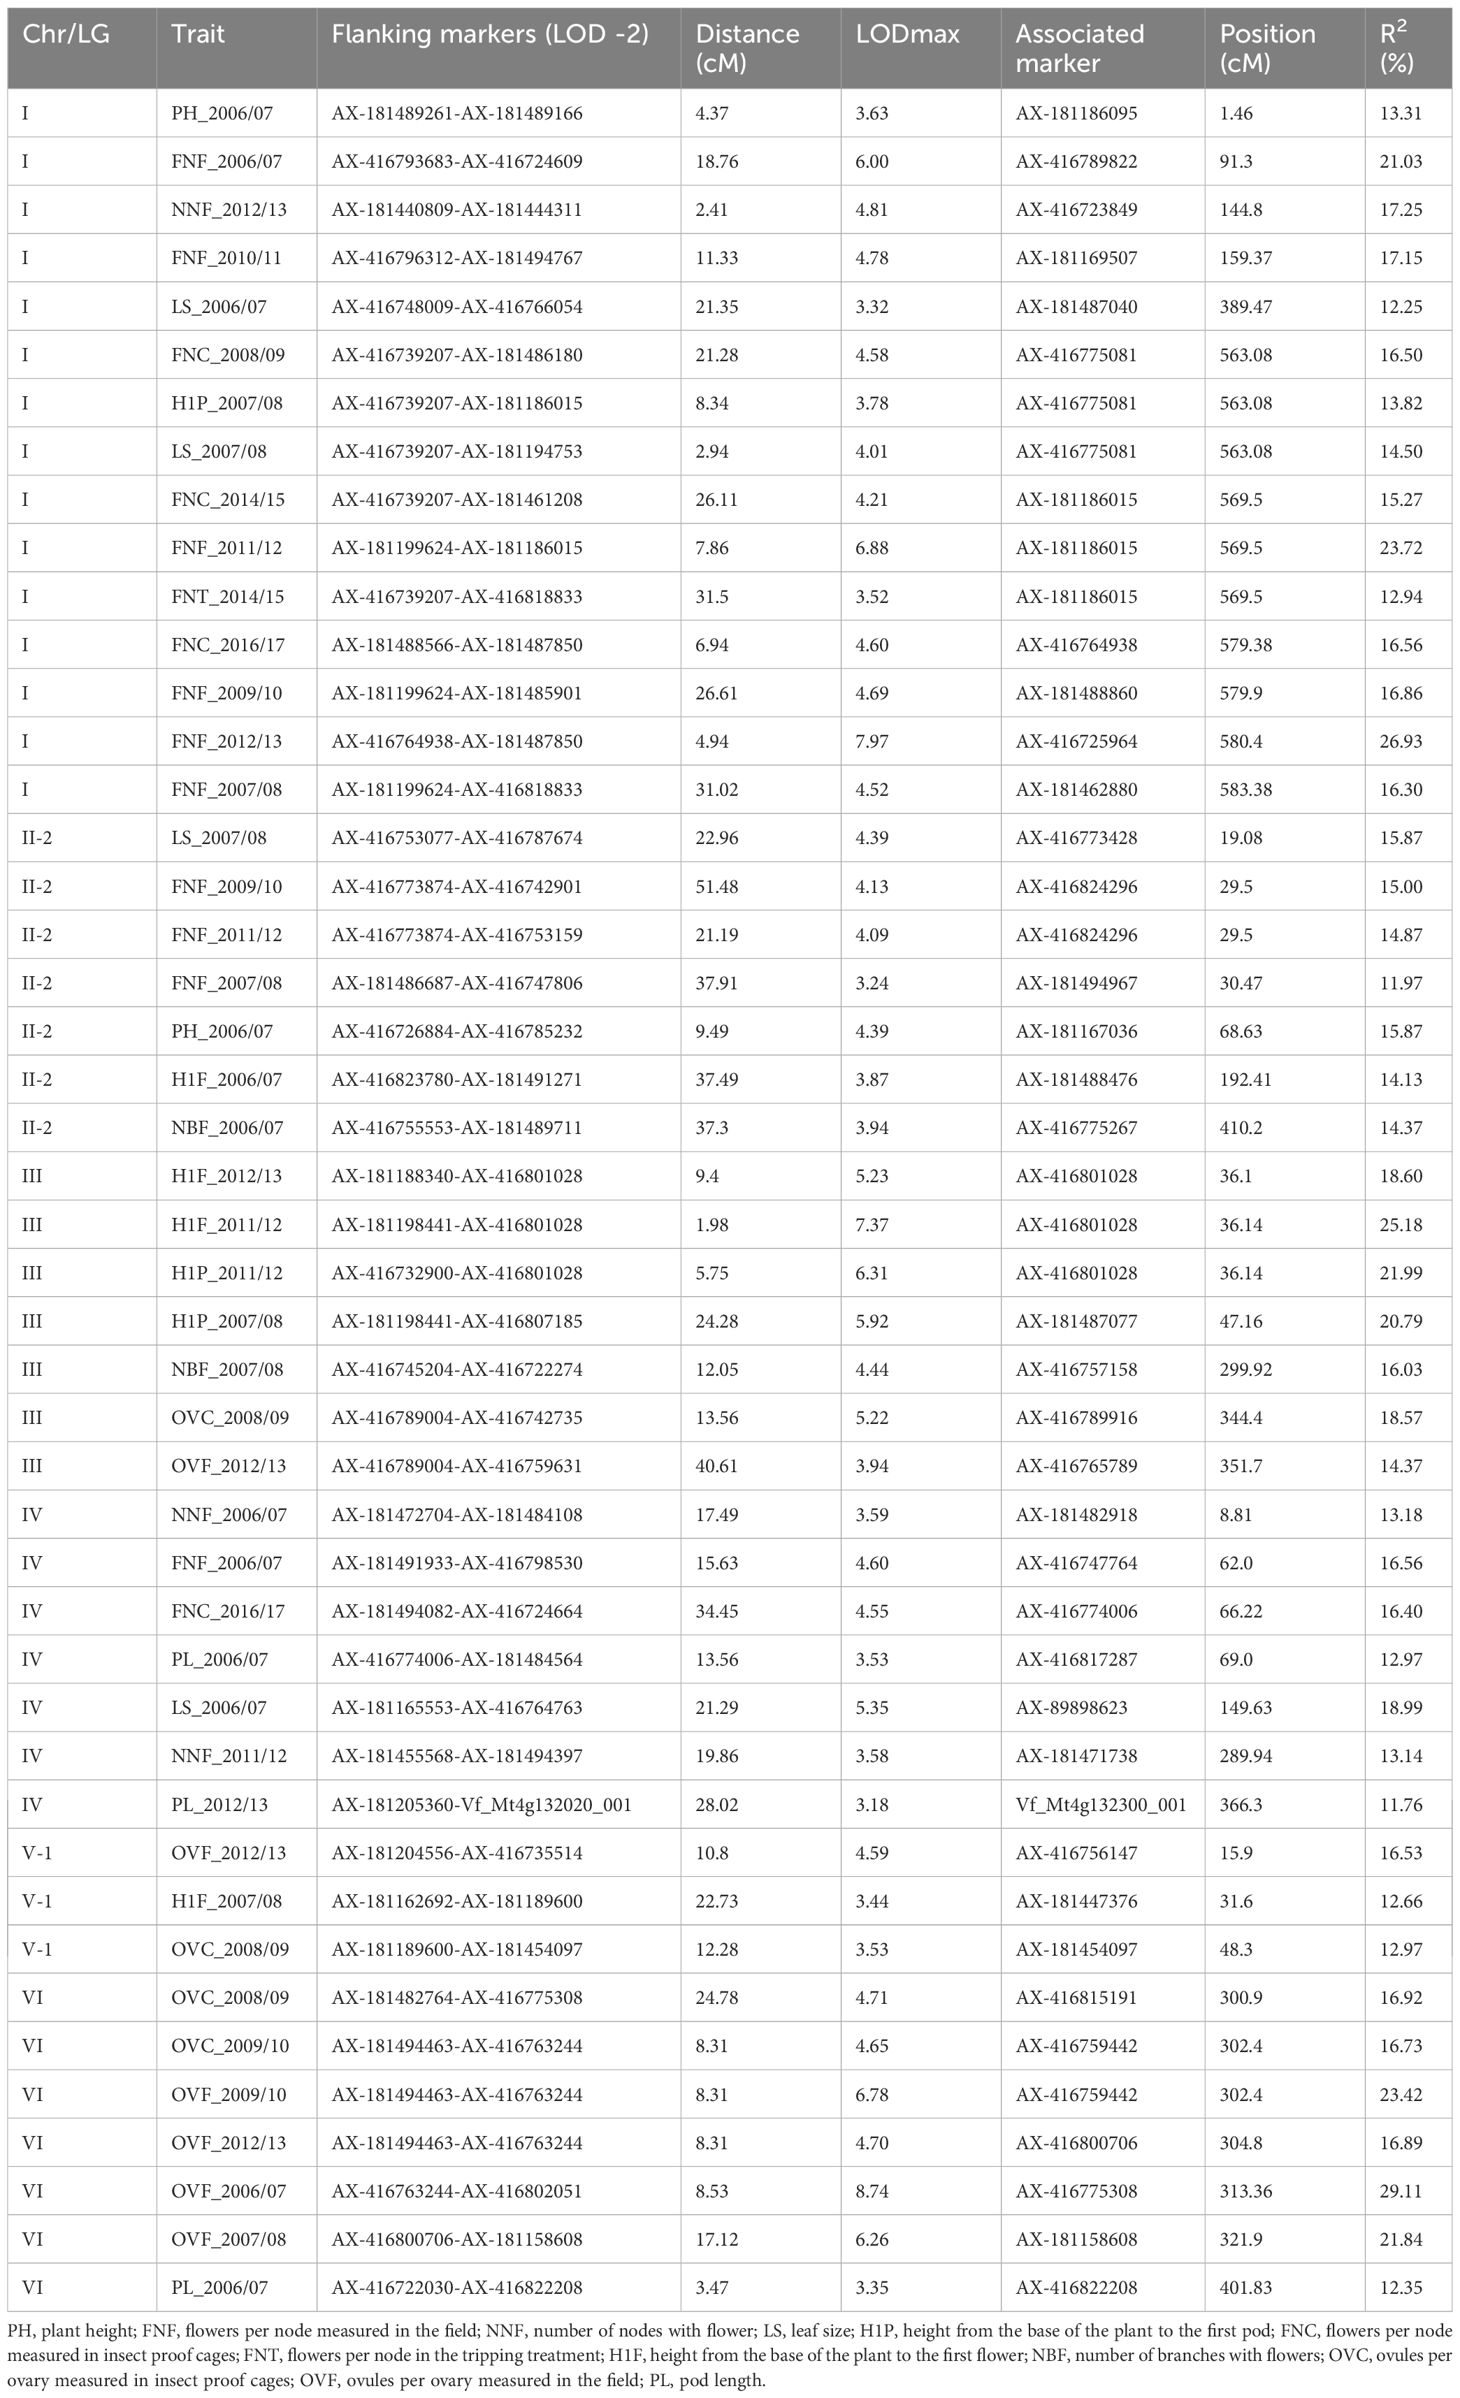
Table 4. QTLs for plant architecture and flower-related traits.
In total, 22 significant QTLs for yield-related traits were distributed along the faba bean genome except in chromosome V (Figure 1; Table 5). LOD values ranged from 2.46 (HSW_2010/11) to 10.65 (SPF_2006/07), with the percentage of phenotypic variation explained varying from 9.23% to 34.24%, respectively. Eight QTLs for pods per node (PN) were found in chrs. I, II, III, and IV. In chr. VI, we detected a hotspot region bearing seven QTLs for seeds per pod (SP) with a percentage of phenotypic variation explained > 14%.
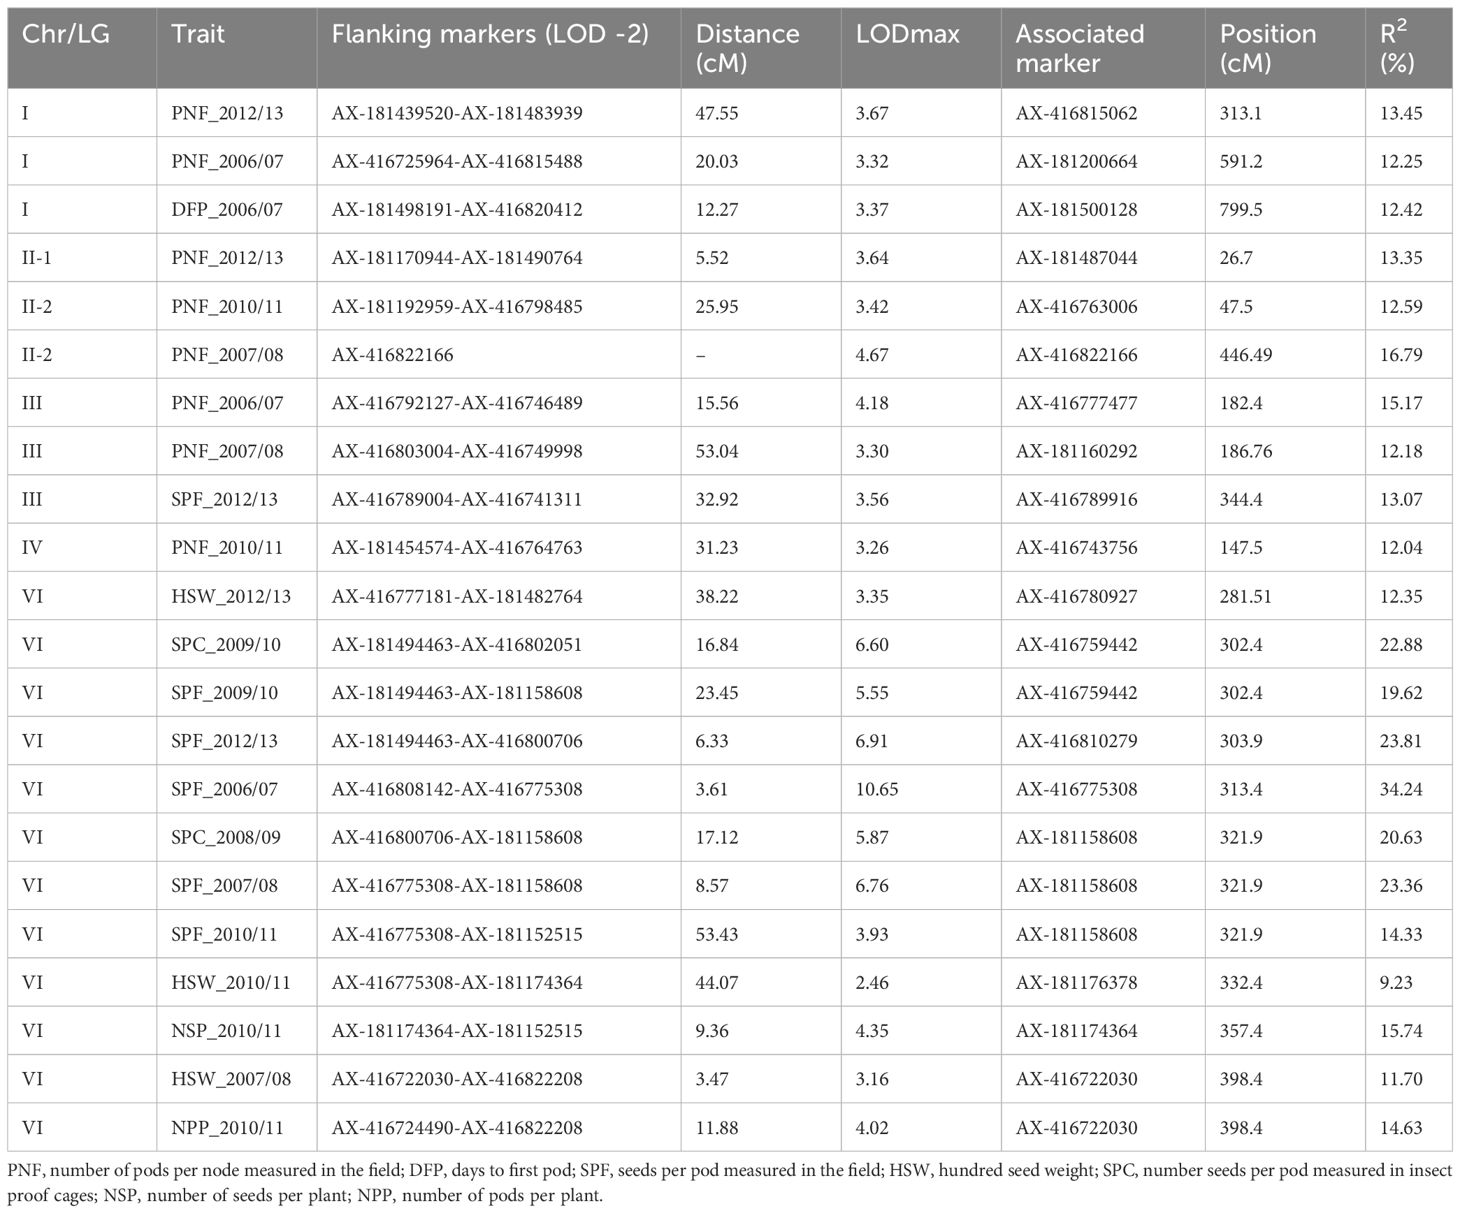
Table 5. QTLs for yield-related traits.
Only one QTL was significant for the different dehiscence traits. This QTL was located in chromosome II (Figure 1; Table 6), with an LOD of 3.41, and it explained 12.56% of the phenotypic variation. Interestingly, we also found non-significant QTLs for other dehiscence traits in chrs. III, IV, and VI co-localizing with seed and pod-related traits (Supplementary Table S3).

Table 6. QTL for dehiscence.
We observed 46 minor QTLs that did not reach the LOD threshold value for statistical significance but colocalized with other significant QTLs (Supplementary Table S3). In total, 16 were located in chr. I, 6 in chr. II, 5 in chr. III, 8 in chr. IV, 7 in chr. V, and 4 in chr. VI. Furthermore, 10 of these QTLs correspond to autofertility traits, 5 to flowering time traits, 9 to plant architecture traits, 17 to yield-related measures, and 5 to dehiscence. The comparison of the map position revealed that four minor QTLs associated with hundred seed weight (HSW), PNC, NLL, NSP, and NPP in chr. I overlapped in a zone bearing several significant QTLs for pod set (PS) and FN. A similar situation was found in chr. IV, where a group of non-significant QTLs colocalized with QTLs for PNF, PSF, and LS. As mentioned above, in chr. V, several non-significant flowering time-related QTLs colocalized in the region with statistically significant QTLs for DF1 and OVC.
Across the linkage map, we identified 13 zones with at least three colocalizing QTLs (Figure 1; Supplementary Table S4). Three of them were found in chr. I and VI; two in chrs. II, III, and IV; and one in chr. V. We numbered the groups following the order of appearance (1-13). Group 1 included five QTLs, three of them belonging to pod set traits in chr. I. Group 3 in chr. I and group 4 in chr. II gathered eight and three colocalized QTLs for flowers per node, respectively. Group 5, clustered together three flowering time QTLs. Finally, group 12 contained 23 colocalized QTLs for plant architecture, autofertility, and yield-related traits (Supplementary Tables S2, S4). Phenotypic correlations between groups of traits are shown in Supplementary Figure S1. Most of them showed significant positive correlations (p < 0.05), ranging from 0.20 to 0.99. By contrast, only a few significant negative correlations were found in groups 1, 5, 10, and 12, ranging from -0.21 to -0.52. In group 1, PS, FN, and DM were negatively correlated. Groups 3 and 4 revealed a high (r > 0.50) significance and positive correlations between traits belonging to plant architecture. In group 5, DH and PN displayed significant negative correlations with the flowering time traits, whereas in group 8, DM showed a significant positive correlation with different plant architecture traits. In group 10, DF1 displayed a significant negative correlation with the number of ovules per ovary. In group 12, we observed significant positive correlations between traits of the same category and between different autofertility (pollen traits), yield (SP), and plant architecture traits (OV). Finally, in group 13, HSW and PL revealed a highly significant positive correlation. For each QTL or colocalizing group, we estimated the number of genes included in the genetic intervals, according to the genome physical map (Supplementary Table S4). A total of 3,967 genes were found in those regions spanning 2281.42 Mbp. The number of genes in the groups of colocalized QTLs ranged from 14 (group 13) to 929 genes (group 9) and the physical distances ranged from 6.84 Mbp (group 13) to 571.24 Mbp (group 9). The rest of the groups revealed a mean distance of 140.02 Mbp with an average of 250 genes.
Genomic resources in faba bean have lagged behind other grain legume species, a fact attributed to the lower investment combined with the difficulties in assembling its giant genome of ~13 Gb. In default of a reference genome, exploiting the synteny with closely related and sequenced species, such as Medicago truncatula, Cicer arietinum, or Pisum sativum, allowed researchers to develop the first gene-based genetic maps, identify quantitative trait loci, and in a few cases, determine candidate genes. Transcriptome sequencing from different tissues or conditions (Ocaña et al., 2015; Webb et al., 2016; Khan et al., 2019; Lyu et al., 2021; Casimiro-Soriguer et al., 2024) led to comprehensive transcript databases useful for saturation mapping. Present advances in next-generation sequencing platforms and high-throughput genotyping techniques are providing enormous advances in faba bean (He et al., 2014; Annicchiarico et al., 2017; Varshney et al., 2019; Gutierrez et al., 2023, 2024). Thus, recent publications (Li et al., 2023; Zhao et al., 2023) describe the development of the most ultra-dense genetic maps (with 5,103 and 12,023 markers, respectively) reported thus far in this crop, using SNP markers derived from targeted next-generation sequencing (TNGS) genotyping platforms. Here, we have developed a new high-density genetic map in the RIL population Vf6 x Vf27 consisting of 124 F8:9 individuals using the Vfaba_v2 Axiom 60K SNP array and we have mapped a total of 35 traits detecting 99 significant QTLs. After quality control, we obtained 2,296 SNP markers, grouped into 1,674 bins, that were used to construct the genetic map. The recent publication of the faba bean genome sequence (Jayakodi et al., 2023) allowed us to assign the LGs to chromosomes. Moreover, 352 markers formerly unassigned to a physical position (Vf0), could be ascribed to chromosomes thanks to the construction of this genetic map (Supplementary Table S2). Population size is a key factor determining QTL position and effects and the power of the analysis increases with larger populations (Vales et al., 2005; Alonso-Blanco et al., 2006; Wang et al., 2012). In biparental QTL mapping analysis, the standard number of lines used (approximately 100) may underestimate the number of QTLs with small effects. Nevertheless, despite the relatively limited population size used in this study, the major QTLs detected in several years are conserved as would be in a larger population (Vales et al., 2005).
The proportion of bin markers with distorted segregation considering all the chromosomes was relatively high (34.77%), with LG V-1 having the highest distortion rate (78.26%). The distorted markers did not affect the grouping in the map, a fact supported by the high LOD threshold value (10.5) used, thus suggesting that distortion may be due to biological mechanisms. Distorted segregation is common in most plant genetic mapping experiments and has been mainly associated with preferential gametic or zygotic selection affecting recombination frequency (Li et al., 2011; Dai et al., 2016; Zhang et al., 2019). Due to the fear of unpredictable consequences in the results, distorted markers have usually been excluded in linkage map construction and QTL mapping (Zhan and Xu, 2011). However, the removal of these markers results in a loss of information that decreases marker density and increases the average marker distances. Different authors have demonstrated that distorted segregation can be incorporated into existing QTL mapping studies without compromising the accuracy of the genetic maps or the QTL detection (Zuo et al., 2019). In this study, we kept the markers that showed distortion in the Mendelian segregation (> 30%) to build the genetic map and perform the QTL analysis. This could explain the larger genetic distance achieved (2,963.87 cM) compared to other recent high density faba bean maps (Li et al., 2023; Zhao et al., 2023), confirmed by the fact that the removal of distorted markers from our dataset greatly reduced the genetic map distance (data not shown).
The comparison of the physical and genetic maps, using the Pretzel platform (Keeble-Gagnère et al., 2019; http://pulses.plantinformatics.io/mapview), showed a good correspondence between chromosomes and linkage groups, especially in chrs. I, II, and IV (Supplementary Figure S2). Chromosomes II and V showed a division in two different linkage groups (1 and 2), and despite this, they showed a good correspondence with the physical map. Chromosomes III and VI showed several twists in the marker order. Furthermore, we found huge gaps in chromosomes IV and V. The gap in chr. IV was located around 150 cM, corresponding to the physical chromosome section between 300 Mbp and 1 Gbp. The gap in chr. V coincided with the division in the two linkage groups and corresponds to a distance from 400 Mbp to 1 Gbp in the physical chromosome (Supplementary Figure S2). We have observed that most of the markers that had been removed because of their high distortion rates are located in this gap region and could explain the division of chromosome V due to the limited number of markers in this area.
To identify candidate genes for autofertility, flowering time, plant architecture, yield, and dehiscence traits, the genomic sequences of the significant markers associated with a QTL were searched for homologs in the M. truncatula and A. thaliana genomes. In the next sections, we will discuss the QTLs detected consistently in previous studies and the putative candidate genes harboring the significant markers clearly related with the trait.
Several traits related to autofertility were analyzed in this work, including pod set, seed set, and floral measurements taken on the male and female structures. The results revealed 24 QTLs for autofertility traits in all chromosomes except chrs. II and V (Table 2). A previous study (Aguilar-Benitez et al., 2022) reported a QTL for pollen size in chr. VI with a close position to the significant marker detected in this study [AX-181158608, (Vfaba.Hedin2.R1.6g115480.2)]. Similarly, in the same study, we also found two QTLs for seed set (number of seeds/number of ovules x 100) in chr. VI associated with Mtr4g088524, which is closely positioned to the significant markers detected in this study for seed set in the field or in insect-proof cages (Supplementary Table S5).
Two markers associated with the seed set QTL detected in this study showed functions related to pollen germination and pollen tube growth. The first one was AX-181455524 (Vfaba.Hedin2.R1.1g093640.1) in chr. I. corresponding to a “chloride channel C” (Supplementary Table S6), which is expressed during pollen germination and pollen tube growth (Wang et al., 2008). The second marker, AX-181158608 (Vfaba.Hedin2.R1.6g115480.1) located in colocalizing group 12 (chr. VI) (Supplementary Tables S2, S4, S6), was identified as a “cellulose synthase-like G2 protein”, responsible for cellulose synthesis and important for a correct pollen tube growth (Cai et al., 2011) and essential for the pollen wall. Mutations in this enzyme showed aberrant pollen morphology and male sterility (Persson et al., 2007).
For pod set (number of pods/number of flowers x 100), three QTLs were detected in chr. I, colocalizing in group 1 with a genetic interval of 32.2 cM. The significant marker AX-181494767 associated with PSC_2014/15 showed homology with a protein kinase homolog to a “Sid1 protein” in yeast (Van Damme et al., 2004) (Supplementary Table S6). This protein is implicated in cytokinesis associated with the spindle poles, and it is important in cell proliferating tissues such as seeds and pods. The significant marker AX-181482638 associated with PST_2014/15 showed as ortholog a “Teosinte Branched 1 (TCP3) protein”, which is related to cytokinin signaling pathways implicated in organogenesis (Li and Zachgo, 2013; Yang et al., 2020). Furthermore, we detected two QTLs for pod set in chr. IV. The significant SNP marker (AX-416752208) linked to PSC_2008/09 (Supplementary Table S6) was identified as a “phosphatidylinositol-4-phosphate 5-kinase family protein (PIP5K6)”. Mutants for this gene in Arabidopsis thaliana showed defects in pollen germination and pollen tube growth, affecting fecundation and formation of siliques (Ischebeck et al., 2008; Kato et al., 2024).
Female morphological traits (e.g., style, ovary, or papilla morphology and number of stigmatic papillae) revealed QTLs in chrs. I, III, IV, and VI. The style length (SL) QTL detected in chr. IV in the physical interval 4g165880-4g171920 revealed a close position to the previously reported QTL (Aguilar-Benitez et al., 2022) for the same trait (Supplementary Tables S2, S5). The significant marker belongs to a bin marker composed of four markers. Two of these, AX-416790655 and AX-416745029 (Supplementary Table S6), corresponded to ortholog proteins whose biological functions were related to actively growing tissues, including flower development (Bessire et al., 2011; Fabre et al., 2016; Jin et al., 2019; Zhu et al., 2020). Furthermore, QTLs for OL/FL and SL/FL in colocalizing group 11 in chr. VI (Supplementary Table S4) showed associated markers related with an “ethylene responsive element binding factor 2 (ERF2)” implicated in ethylene signaling in Arabidopsis (Supplementary Table S6). This hormone in cucurbits affects ovary length during flower development (Boualem et al., 2022).
We detected six QTLs for flowering time in chrs. I, II, IV, and V, as previously reported by Cruz-Izquierdo et al. (2012); Catt et al. (2017), and Aguilar-Benitez et al. (2021). Nevertheless, the position of the QTL for DF1 in chr. V identified by Aguilar-Benitez et al. (2021) was not conserved in this work, probably due to the removal of the most distorted markers, including some of the markers closely located to flowering time genes (FT).
A QTL for DF50 in chr. II detected in this study showed a close position to that previously described by Aguilar-Benitez et al. (2021) (Supplementary Table S5).
Two QTLs for DM were located in chr. II (Supplementary Table S6), and one of the significant SNP markers (AX-181489711) was identified as a “phosphatidic acid phosphohydrolase 2 protein” implicated in the regulation of glycolipids, signaling molecules involved in flower development (Nakamura et al., 2014). The other significant marker AX-416822166 corresponds to a “casein kinase I-like 3”, which regulates the activity of cryptochromes by blue light (Tan et al., 2013). Both genes could affect flowering time and pod development in faba bean (Kang and Wang, 2020).
This group of traits is the most extensive, including traits for different parts of the plant (e.g., flowers, leaves, and stems). In this study, we detected 46 QTLs for architectural traits along the genome with interesting and conserved regions for some specific traits. The trait FN was highly conserved between evaluations. Several QTLs colocalized in groups 3, 4 and 8, being most of them in chr. I in a range of ~32 cM (Table 4; Figure 1; Supplementary Tables S2, S4). The significant SNP markers (AX-181191222, AX-181490810, AX-416758150) associated to QTLs for FN in chr.I showed a close position with the previously QTL reported by Avila et al. (2017). The significant marker AX-181488860 identified for FNF_2009/10 in chr.I (Supplementary Table S6), the candidate gene, was a “FG-GAP repeat-containing protein” (NERD1) in Arabidopsis, implicated in several aspects of plant growth and development, including root and shoot growth and flowering. This gene has been related with changes in the number of flowers in Arabidopsis (Yuan and Kessler, 2019; Xu et al., 2020), as could be the case for faba bean.
Interestingly, a recent GWAS analysis identified two marker-trait associations (MTAs) for plant height (PH) in chr. I (Skovbjerg et al., 2023; Ohm et al., 2024). We checked the location of these MTAs in our QTLs and found that AX-416796020 is the same significant marker described by Skovbjerg et al. (2023), and D15935 was close to the region defined by the flanking markers for PH_2006/07 in chr.I, thus supporting our results (Supplementary Table S5). Moreover, MTAs previously identified for pods per plant (PP), seed per plant (SPL), and HSW (Gutierrez et al., 2023, 2024) showed close physical positions to QTLs for NNF and PL in chr. IV described in the current study (Supplementary Table S5). Marker AX-416788562 for PP and SPL identified by Gutierrez et al. (2024) was close to the NNF_2011/12 QTL, indicating a possible relationship between the number of nodes with flowers and yield in faba bean genotypes. In the case of HSW, the associated marker AX-416740666 reported by Gutierrez et al. (2023) was now next to PL_2012/13, pointing to a possible relationship between pod length and seed weight. In a recent work, Li et al. (2023) developed high-density maps in two faba bean populations and identified several QTLs for plant architectural traits. The locations of QTLs for PH (chrs. I and II), H1F (chrs. II, III and V), and H1P (chrs. I and III) were consistent with the results presented here.
The five QTLs detected for H1F and H1P in chrs. I and III showed close physical positions to the previously described by Avila et al. (2017) (Supplementary Table S5). The significant marker AX-181488476, associated with H1F in chr. II, corresponds to a “galacturonosyltransferase-like 3 (GATL3) protein” (Supplementary Table S6). In A. thaliana, a mutant in a gene of the same family showed a reduction of inflorescence stem height of 20% in comparison with wild-type (Lao et al., 2003). Similarly, the AX-416801028 marker associated with the H1P and H1F colocalizing group 6 (Supplementary Tables S4, S6) was identified as a “SMAX1-like 3 protein” in Arabidopsis. Mutations in a member of this gene family showed a reduced primary inflorescence height in Arabidopsis plants (Stirnberg et al., 2002).
The significant marker AX-89898623, associated with the LS QTL in chr. IV, (Supplementary Table S6) was identified as a “SUMO-conjugating enzyme (SCE1)”. SUMO family proteins are responsible for posttranscriptional modifications regulating transcription factor activity, subcellular location, and protein-protein interactions. A SUMO protein of A. thaliana showed a relationship with the leaf elongation and enlargement, affecting the total leaf area (Catala et al., 2007).
OV was a very stable trait belonging to colocalizing groups 7, 10, and 12 and ascribed to chrs. III, V, and VI (Table 4; Figure 1; Supplementary Table S4). AX-416775308, associated with OVF_2006/07 in the colocalizing group 12, was identified as an “Auxin Response Transcription Factor 3 (ARF3)” (Supplementary Table S6) previously implicated in carpel and ovule development (Sessions et al., 1997; Kelley et al., 2012; Andres-Robin et al., 2018).
In total, QTLs for yield-related traits were distributed across the genome (except chr. V), although the major genomic region was detected in chr. VI (Table 5, Supplementary Tables S2, S4). Seven QTLs for SP were identified in the colocalizing group 12 (chr. VI) and the significant markers were close to QTLs previously detected for this trait (Cruz-Izquierdo et al., 2012; Avila et al., 2017) (Supplementary Table S5). Similarly, significant markers for the QTL for HSW reported by Avila et al. (2017) showed a close position with a QTL detected in this study (HSW_2012/13) in chr. VI (Supplementary Table S5). Our results were also supported by Li et al. (2023) who identified QTLs for HSW in chr. VI.
Furthermore, AX-181205104, the significant marker for PNF_2007/08 detected in chr. III in this study, was the same as that reported in a recent GWAS analysis (Gutierrez et al., 2024) for SPL and shattering (SH), showing a possible relationship between these yield-related traits.
Several proteins with a wide variety of functions were identified by the associated markers but only few of them showed biological functions that were apparently related with these traits. Thus, two markers associated to pods per node in chrs. I (AX-416815062) and II (AX-181487044), (Supplementary Table S6) were involved in the distribution of siliques in A. thaliana (Rodor et al., 2011; Yang et al., 2012). Compared with the wild-type, mutants in these genes showed variations in the spatial position of siliques or even a total lack of siliques.
A marker associated with the QTL for the number of days to the first pod (DFP) in chr. I (AX-181500128) was orthologous to an Arabidopsis gene whose function was related to seed coat development, specifically the cellulosic microfibrils (Yang et al., 2022). This outcome points towards a possible relationship between the timing of pod formation and the correct development of the seed’s coat.
The significant marker AX-416759442, associated with QTLs for OV and SP, located in group 12 (chr. VI) and highly correlated between them (Supplementary Tables S2, S4, S6; Supplementary Figure S1), was identified as a transmembrane protein implicated in pollen germination and pollen tube growth, affecting fertilization and seed and fruit formation (Lalanne et al., 2004).
Evaluation of pod dehiscence is complicated because pod shattering is highly affected by environmental conditions. Several studies evaluating the dehiscence in different species have identified a variety of genes implicated in cell wall formation and composition (Funatsuki et al., 2014; Ballester and Ferrándiz, 2017; Aguilar-Benitez et al., 2020a, b; Di Vittori et al., 2021). In this study, a QTL in chr. II was identified close to a previously QTL reported by Aguilar-Benitez et al. (2020a) (Supplementary Table S5). The significant marker associated, AX-416755553 (Supplementary Table S6), was identified in Arabidopsis as a “CLPC homologue 1 protein”, localized into chloroplast and related to chloroplast development and degradation. Mutants in this gene showed a reduced photosynthetic capability and evident chlorosis (Sjögren et al., 2004). Paralog genes showed a high expression during different abiotic stresses, including dehydration and senescence (Nakashima et al., 1997; Simpson et al., 2003), indicating a possible relationship between senescence and pod drying and this gene.
The present study identified several colocalizing groups of traits linking PS or PN with FN and flowering time traits (groups 1, 3, 4, and 5, Supplementary Table S4). Egli (2005), studying the reproductive process in soybean, described that the pod set was affected by the position of flowers and the flowering time, indicating a high pod abortion in cultivars with late and long flowering time periods. Negative correlations obtained in this study between flowering time traits (DF and DM) and PS and PN (groups 1 and 5, Supplementary Figure S1) support the relationship among these traits. Similarly, the positive correlation found in this study between PL and HSW in group 13 (Supplementary Figure S1) is in agreement with previous studies in soybean (Bravo et al., 1980) or Brassica napus (Li et al., 2019), indicating that pod length and width are significantly correlated with the final seed size and can be used as an indirect selection for final yield.
The largest colocalizing group, including OV, SP, and SS in group 12 (Figure 1; Supplementary Table S4), was positively correlated (Supplementary Figure S1), evidence that the number of ovules per ovary determines the maximum number of seeds per pod. According to Qadir et al. (2021), the biological regulation of OV and SP implicates several plant hormones, such as auxin. Previously, we have described an auxin transport (ARF3) as the candidate gene for the ovules per ovary QTL in chr. VI. This hormone regulates the gynoecium and ovule development through several transporters and transcription factors. A recent work in pigeonpea (Cajanus cajan) showed an overexpression of ARF3 in a line with a high number of seeds per pod in comparison with a line with a lower number of seeds (Arpita et al., 2023). Our results were consistent with these previous studies, pointing to ARF3 as a possible candidate for OV and SP traits.
Although QTL mapping in biparental populations provides high statistical power for detecting a QTL, the resolution is still low due to the limited genetic diversity existing between the parents. A GWAS is an additional tool to dissect polygenic traits by utilizing the genetic diversity and historical recombination events present in wide germplasm collections. An association analysis increases the mapping resolution and enables minor effect genes to be detected. The combination of both methods may help identify the causal gene or mutation and provide new insights into the genetic architecture of complex traits.
Some of the MTAs recently reported (Gutierrez et al., 2023, 2024) fall inside the colocalizing groups described in this study. Thus, the MTA AX-416785709 (no significant similarity found), related to the number of pods per plant under drought conditions (Gutierrez et al., 2023), was found in group 5 (chr. II), including flowering time, dehiscence, plant architecture, and yield-related traits. Furthermore, the MTA AX-416807594, also related to the number of pods per plant (Gutierrez et al., 2024), was found in group 7 (chr. III), where QTLs for ovules per ovary and number of seeds per pod were described. The candidate gene corresponding to this marker was identified as an “ACTIVITY OF BC1 COMPLEX KINASE 1 protein” in Arabidopsis (Gutierrez et al., 2024) and its function was related to the regulation of reactive oxygen species (ROS) (Qin et al., 2020). ROS play a crucial role during female gametogenesis and fertilization in A. thaliana (Martin et al., 2013), thus suggesting a putative relationship among the number of ovules, seeds, and pods in faba bean. Finally, the MTA AX-416801028, associated with plot yield (Gutierrez et al., 2024), was located in group 6 (chr. III), an important genomic region with QTLs for H1P and H1F, indicating a positive relationship between the height to first inflorescence and the final yield per plot.
In the present study, the genotyping data generated from a faba bean RIL population using the ‘Vfaba_v2’ SNP genotyping array has facilitated the construction of a high-density genetic linkage map including 2,296 SNP markers that cover 2,963.87 cM with an average marker distance of 1.77 cM. A comparison of the physical and genetic maps revealed a good correspondence between linkage groups and chromosomes. QTL analysis of the phenotyping data from 66 traits, previously evaluated across several years, led to the identification of 99 significant QTLs corresponding to 35 traits. A large percentage of QTLs were stable across years and environments and represent important targets for breeding, as they correspond to highly heritable genomic regions and those less affected by environmental factors. A major finding in the study was the colocalization of QTLs (including three or more overlapping QTLs) in 13 major genomic regions. The integration of the QTL mapping with recently reported GWAS data has been useful to uncover and refine the most consistent genomic regions related to several yield-related traits. After further QTL fine-mapping and candidate gene validation, exploring the functional significance of these candidates or integrating genomic data with physiological studies will enhance the understanding of trait regulation in faba bean and will provide targets for future marker assisted selection in this crop species.
The original contributions presented in the study are publicly available. This data can be found here: https://doi.org/10.6084/m9.figshare.28668263.v1.
DA: Investigation, Writing – original draft, Formal analysis, Methodology, Writing – review & editing. NG: Writing – review & editing, Formal analysis, Supervision, Methodology. IC: Writing – review & editing, Supervision. AT: Funding acquisition, Project administration, Writing – review & editing, Conceptualization, Supervision.
The author(s) declare that financial support was received for the research and/or publication of this article. This research was supported by the following projects and programs: PID2020-114952RR-I00 funded by MCIN/AEI/10.13039/501100011033; European Union’s Horizon Europe research and innovation program under grant agreement BELIS (No. 101081878) and PR.AVA23.INV2023.009, co-financed by the European Regional Development Fund (ERDF).
We acknowledge the computer resources and technical support provided by the Plataforma Andaluza de Bioinformática, University of Málaga, Spain.
The authors declare that the research was conducted in the absence of any commercial or financial relationships that could be construed as a potential conflict of interest.
All claims expressed in this article are solely those of the authors and do not necessarily represent those of their affiliated organizations, or those of the publisher, the editors and the reviewers. Any product that may be evaluated in this article, or claim that may be made by its manufacturer, is not guaranteed or endorsed by the publisher.
The Supplementary Material for this article can be found online at: https://www.frontiersin.org/articles/10.3389/fpls.2025.1457812/full#supplementary-material
Abou-Khater, L., Maalouf, F., Jighly, A., Alsamman, A. M., Rubiales, D., Rispail, N., et al. (2022). Genomic regions associated with herbicide tolerance in a worldwide faba bean (Vicia faba L.) collection. Sci. Rep. 12, 158. doi: 10.1038/s41598-021-03861-0
Adhikari, K. N., Khazaei, H., Ghaouti, L., Maalouf, F., Vandenberg, A., Link, W., et al. (2021). Conventional and molecular breeding tools for accelerating genetic gain in faba bean (vicia faba L.). Front. Plant Sci. 12. doi: 10.3389/fpls.2021.744259
Aguilar-Benitez, D., Casimiro-Soriguer, I., Ferrandiz, C., Torres, A. M. (2022). Study and QTL mapping of reproductive and morphological traits implicated in the autofertility of faba bean. BMC Plant Biol. 22, 175. doi: 10.1186/s12870-022-03499-8
Aguilar-Benitez, D., Casimiro-Soriguer, I., Torres, A. M. (2020a). First approach to pod dehiscence in faba bean: genetic and histological analyses. Sci. Rep. 10, 17678. doi: 10.1038/s41598-020-74750-1
Aguilar-Benitez, D., Casimiro-Soriguer, I., Torres, A. M. (2021). Linkage mapping and QTL analysis of flowering time in faba bean. Sci. Rep. 11 (1), 13716. doi: 10.1038/s41598-021-92680-4
Aguilar-Benitez, D., Rubio, J., Millán, T., Gil, J., Die, J. V., Castro, P. (2020b). Genetic analysis reveals PDH1 as a candidate gene for control of pod dehiscence in chickpea. Mol. Breed. 40, 40. doi: 10.1007/s11032-020-01117-9
Ali, M. B. M., Welna, G. C., Sallam, A., Martsch, R., Balko, C., Gebser, B., et al. (2016). Association analyses to genetically improve drought and freezing tolerance of faba bean (Vicia faba L.). Crop Sci. 56, 1036–1048. doi: 10.2135/cropsci2015.08.0503
Alonso-Blanco, C., Koornneef, M., van Ooijen, J. W. (2006). “QTL analysis,” in Arabidopsis protocols, vol. 323 . Eds. Salinas, J., Sanchez Serrano, J. (Methods in Molecular Biology), 79–99.
Andres-Robin, A., Reymond, M. C., Dupire, A., Battu, V., Dubrulle, N., Mouille, G., et al. (2018). Evidence for the regulation of gynoecium morphogenesis by ETTIN via cell wall dynamics. Plant Physiol. 178, 1222–1232. doi: 10.1104/pp.18.00745
Annicchiarico, P., Nazzicari, N., Wei, Y., Pecetti, L., Brummer, E. C. (2017). Genotyping-by-sequencing and its exploitation for forage and cool-season grain legume breeding. Front. Plant Sci. 8. doi: 10.3389/fpls.2017.00679
Arbaoui, M., Link, W., Satovic, Z., Torres, A.-M. (2008). Quantitative trait loci of frost tolerance and physiologically related trait in faba bean (Vicia faba L.). Euphytica 164, 93–104. doi: 10.1007/s10681-008-9654-0
Arpita, K., Sharma, S., Srivastava, H., Kumar, K., Mushtaq, M., Gupta, P., et al. (2023). Genome-wide survey, molecular evolution and expression analysis of Auxin Response Factor (ARF) gene family indicating their key role in seed number per pod in pigeonpea (C. cajan L. Millsp.). Int. J. Biol. Macromol. 253, 126833. doi: 10.1016/j.ijbiomac.2023.126833
Atienza, S. G., Palomino, C., Gutierrez, N., Alfaro, C. M., Rubiales, D., Torres, A. M., et al. (2016). QTLs for ascochyta blight resistance in faba bean (Vicia faba L.): validation in field and controlled conditions. Crop Pasture Sci. 67, 216–224. doi: 10.1071/CP15227
Avila, C. M., Atienza, S. G., Moreno, M. T., Torres, A. M. (2007). Development of a new diagnostic marker for growth habit selection in faba bean (Vicia faba L.) breeding. Theor. Appl. Genet. 115, 1075–1082. doi: 10.1007/s00122-007-0633-y
Avila, C. M., Nadal, S., Moreno, M. T., Torres, A. M. (2006). Development of a Simple PCR-based Marker for the Determination of Growth Habit in Vicia faba L. using a Candidate Gene Approach. Mol. Breed. 17, 185–190. doi: 10.1007/s11032-005-4075-4
Avila, C. M., Ruiz-Rodríguez, M. D., Cruz-Izquierdo, S., Atienza, S. G., Cubero, J. I., Torres, A. M. (2017). Identification of plant architecture and yield-related QTL in Vicia faba L. Mol. Breed. 37, 88. doi: 10.1007/s11032-017-0688-7
Avila, C. M., Satovic, Z., Sillero, J. C., Nadal, S., Rubiales, D., Moreno, M. T., et al. (2005). QTL detection for agronomic traits in faba bean (Vicia faba L.). Agric Consp Sci. 70, 65–73.
Avila, C. M., Satovic, Z., Sillero, J. C., Rubiales, D., Moreno, M. T., Torres, A. M. (2004). Isolate and organ-specific QTLs for ascochyta blight resistance in faba bean (Vicia faba L). Theor. Appl. Genet. 108, 1071–1078. doi: 10.1007/s00122-003-1514-7
Ballester, P., Ferrándiz, C. (2017). Shattering fruits: variations on a dehiscent theme. Curr. Opin. Plant Biol. 35, 68–75. doi: 10.1016/j.pbi.2016.11.008
Bessire, M., Borel, S., Fabre, G., Carraça, L., Efremova, N., Yephremov, A., et al. (2011). A member of the PLEIOTROPIC DRUG RESISTANCE family of ATP binding cassette transporters is required for the formation of a functional cuticle in Arabidopsis. Plant Cell 23, 1958–1970. doi: 10.1105/tpc.111.083121
Boualem, A., Berthet, S., Devani, R. S., Camps, C., Fleurier, S., Morin, H., et al. (2022). Ethylene plays a dual role in sex determination and fruit shape in cucurbits. Curr. Biol. 32, 2390–2401.e4. doi: 10.1016/j.cub.2022.04.031
Bradbury, P. J., Zhang, Z., Kroon, D. E., Casstevens, T. M., Ramdoss, Y., Buckler, E. S. (2007). TASSEL: software for association mapping of complex traits in diverse samples. Bioinformatics 23, 2633–2635. doi: 10.1093/bioinformatics/btm308
Bravo, J. A., Fehr, W. R., de Cianzio, S. R. (1980). Use of pod width for indirect selection of seed weight in soybeans1. Crop Sci. 20, 507–510. doi: 10.2135/cropsci1980.0011183X002000040022x
Broman, K. W., Wu, H., Sen, S., Churchill, G. A. (2003). R/qtl: QTL mapping in experimental crosses. Bioinformatics 19, 889–890. doi: 10.1093/bioinformatics/btg112
Cai, G., Faleri, C., Del Casino, C., Emons, A. M. C., Cresti, M. (2011). Distribution of callose synthase, cellulose synthase, and sucrose synthase in tobacco pollen tube is controlled in dissimilar ways by actin filaments and microtubules. Plant Physiol. 155, 1169–1190. doi: 10.1104/pp.110.171371
Carrillo-Perdomo, E., Vidal, A., Kreplak, J., Duborjal, H., Leveugle, M., Duarte, J., et al. (2020). Development of new genetic resources for faba bean (Vicia faba L.) breeding through the discovery of gene-based SNP markers and the construction of a high-density consensus map. Sci. Rep. 10, 6790. doi: 10.1038/s41598-020-63664-7
Casimiro-Soriguer, I., Aguilar-Benitez, D., Gutierrez, N., Torres, A. M. (2024). Transcriptome analysis of stigmas of Vicia faba L. Flowers. Plants 13, 1443. doi: 10.3390/plants13111443
Catala, R., Ouyang, J., Abreu, I. A., Hu, Y., Seo, H., Zhang, X., et al. (2007). The Arabidopsis E3 SUMO ligase SIZ1 regulates plant growth and drought responses. Plant Cell 19, 2952–2966. doi: 10.1105/tpc.106.049981
Catt, S. C., Braich, S., Kaur, S., Paull, J. G. (2017). QTL detection for flowering time in faba bean and the responses to ambient temperature and photoperiod. Euphytica 213, 125. doi: 10.1007/s10681-017-1910-8
Conneally, P. M., Edwards, J. H., Kidd, K. K., Lalouel, J. M., Morton, N. E., Ott, J., et al. (1985). Report of the committee on methods of linkage analysis and reporting. Cytogenet. Cell Genet. 40, 356–359. doi: 10.1159/000132186
Cruz-Izquierdo, S., Avila, C. M., Satovic, Z., Palomino, C., Gutierrez, N., Ellwood, S. R., et al. (2012). Comparative genomics to bridge Vicia faba with model and closely-related legume species: stability of QTLs for flowering and yield-related traits. Theor. Appl. Genet. 125, 1767–1782. doi: 10.1007/s00122-012-1952-1
Dai, B., Guo, H., Huang, C., Ahmed, M. M., Lin, Z. (2016). Identification and characterization of segregation distortion loci on cotton chromosome 18. Front. Plant Sci. 7. doi: 10.3389/fpls.2016.02037
Díaz-Ruiz, R., Torres, A., Gutierrez, M. V., Rubiales, D., Román, B. (2009). Mapping of quantitative trait loci controlling Orobanche foetida Poir. resistance in faba bean (Vicia faba L.). Afr. J. Of Biotechnol. 8 (12), 2718–2724.
Díaz-Ruiz, R., Torres, A. M., Satovic, Z., Gutierrez, M. V., Cubero, J. I., Román, B. (2010). Validation of QTLs for Orobanche crenata resistance in faba bean (Vicia faba L.) across environments and generations. Theor. Appl. Genet. 120, 909–919. doi: 10.1007/s00122-009-1220-1
Di Vittori, V., Bitocchi, E., Rodriguez, M., Alseekh, S., Bellucci, E., Nanni, L., et al. (2021). Pod indehiscence in common bean is associated with the fine regulation of PvMYB26. J. Exp. Bot. 72, 1617–1633. doi: 10.1093/jxb/eraa553
Egli, D. B. (2005). Flowering, pod set and reproductive success in soya bean. J. Agro. Crop Sci. 191, 283–291. doi: 10.1111/j.1439-037X.2005.00171.x
Ellwood, S. R., Phan, H. T. T., Jordan, M., Hane, J., Torres, A. M., Avila, C. M., et al. (2008). Construction of a comparative genetic map in faba bean (Vicia faba L.); conservation of genome structure with Lens culinaris. BMC Genomics 9, 380. doi: 10.1186/1471-2164-9-380
Fabre, G., Garroum, I., Mazurek, S., Daraspe, J., Mucciolo, A., Sankar, M., et al. (2016). The ABCG transporter PEC1/ABCG32 is required for the formation of the developing leaf cuticle in Arabidopsis. New Phytol. 209, 192–201. doi: 10.1111/nph.13608
FAOSTAT (2022). FAOSTAT. Available online at: http://www.fao.org/faostat/en/data (Accessed May 9, 2024).
Faridi, R., Koopman, B., Schierholt, A., Ali, M. B., Apel, S., Link, W. (2021). Genetic study of the resistance of faba bean (Vicia faba) against the fungus Ascochyta fabae through a genome-wide association analysis. Plant Breed. 140, 442–452. doi: 10.1111/pbr.12918
Funatsuki, H., Suzuki, M., Hirose, A., Inaba, H., Yamada, T., Hajika, M., et al. (2014). Molecular basis of a shattering resistance boosting global dissemination of soybean. Proc. Natl. Acad. Sci. U.S.A. 111, 17797–17802. doi: 10.1073/pnas.1417282111
Guo, T., Qiu, Q., Yan, F., Wang, Z., Bao, J., Yang, Z., et al. (2023). Construction of a high-density genetic linkage map based on bin markers and mapping of QTLs associated with fruit size in Jujube (Ziziphus jujuba mill.). Horticulturae 9, 836. doi: 10.3390/horticulturae9070836
Gutierrez, N., Avila, C. M., Duc, G., Marget, P., Suso, M. J., Moreno, M. T., et al. (2006). CAPs markers to assist selection for low vicine and convicine contents in faba bean (Vicia faba L.). Theor. Appl. Genet. 114, 59–66. doi: 10.1007/s00122-006-0410-3
Gutierrez, N., Avila, C. M., Moreno, M. T., Torres, A. M. (2008). Development of SCAR markers linked to zt-2, one of the genes controlling absence of tannins in faba bean. Aust. J. Agric. Res. 59, 62. doi: 10.1071/AR07019
Gutierrez, N., Avila, C. M., Rodriguez-Suarez, C., Moreno, M. T., Torres, A. M. (2007). Development of SCAR markers linked to a gene controlling absence of tannins in faba bean. Mol. Breed. 19, 305–314. doi: 10.1007/s11032-006-9063-9
Gutierrez, N., Palomino, C., Satovic, Z., Ruiz-Rodríguez, M. D., Vitale, S., Gutierrez, M. V., et al. (2013). QTLs for Orobanche spp. resistance in faba bean: identification and validation across different environments. Mol. Breed. 32, 909–922. doi: 10.1007/s11032-013-9920-2
Gutierrez, N., Pégard, M., Balko, C., Torres, A. M. (2023). Genome-wide association analysis for drought tolerance and associated traits in faba bean (Vicia faba L.). Front. Plant Sci. 14. doi: 10.3389/fpls.2023.1091875
Gutierrez, N., Pégard, M., Solis, I., Sokolovic, D., Lloyd, D., Howarth, C., et al. (2024). Genome-wide association study for yield-related traits in faba bean (Vicia faba L.). Front. Plant Sci. 15. doi: 10.3389/fpls.2024.1328690
Gutierrez, N., Torres, A. M. (2021). QTL dissection and mining of candidate genes for Ascochyta fabae and Orobanche crenata resistance in faba bean (Vicia faba L.). BMC Plant Biol. 21, 551. doi: 10.1186/s12870-021-03335-5
He, J., Zhao, X., Laroche, A., Lu, Z.-X., Liu, H., Li, Z. (2014). Genotyping-by-sequencing (GBS), an ultimate marker-assisted selection (MAS) tool to accelerate plant breeding. Front. Plant Sci. 5. doi: 10.3389/fpls.2014.00484
Ischebeck, T., Stenzel, I., Heilmann, I. (2008). Type B phosphatidylinositol-4-phosphate 5-kinases mediate Arabidopsis and Nicotiana tabacum pollen tube growth by regulating apical pectin secretion. Plant Cell 20, 3312–3330. doi: 10.1105/tpc.108.059568
Jayakodi, M., Golicz, A. A., Kreplak, J., Fechete, L. I., Angra, D., Bednář, P., et al. (2023). The giant diploid faba genome unlocks variation in a global protein crop. Nature 615, 652–659. doi: 10.1038/s41586-023-05791-5
Jin, X., Lv, Z., Gao, J., Zhang, R., Zheng, T., Yin, P., et al. (2019). AtTrm5a catalyses 1-methylguanosine and 1-methylinosine formation on tRNAs and is important for vegetative and reproductive growth in Arabidopsis thaliana. Nucleic Acids Res. 47, 883–898. doi: 10.1093/nar/gky1205
Kang, J., Wang, Z. (2020). Mut9p-LIKE KINASE family members: new roles of the plant-specific casein kinase I in plant growth and development. Int. J. Mol. Sci. 21 (5), 1562. doi: 10.3390/ijms21051562
Kato, M., Watari, M., Tsuge, T., Zhong, S., Gu, H., Qu, L.-J., et al. (2024). Redundant function of the Arabidopsis phosphatidylinositol 4-phosphate 5-kinase genes PIP5K4-6 is essential for pollen germination. Plant J. 117, 212–225. doi: 10.1111/tpj.16490
Kaur, S., Kimber, R. B. E., Cogan, N. O. I., Materne, M., Forster, J. W., Paull, J. G. (2014). SNP discovery and high-density genetic mapping in faba bean (Vicia faba L.) permits identification of QTLs for ascochyta blight resistance. Plant Sci. 217–218, 47–55. doi: 10.1016/j.plantsci.2013.11.014
Keeble-Gagnère, G., Isdale, D., Suchecki, R., Kruger, A., Lomas, K., Carroll, D., et al. (2019). Integrating past, present and future wheat research with Pretzel. BioRxiv. doi: 10.1101/517953
Kelley, D. R., Arreola, A., Gallagher, T. L., Gasser, C. S. (2012). ETTIN (ARF3) physically interacts with KANADI proteins to form a functional complex essential for integument development and polarity determination in Arabidopsis. Development 139, 1105–1109. doi: 10.1242/dev.067918
Khan, M. A., Alghamdi, S. S., Ammar, M. H., Sun, Q., Teng, F., Migdadi, H. M., et al. (2019). Transcriptome profiling of faba bean (Vicia faba L.) drought-tolerant variety hassawi-2 under drought stress using RNA sequencing. Electron. J. Biotechnol. 39, 15–29. doi: 10.1016/j.ejbt.2019.02.004
Khazaei, H., O’Sullivan, D. M., Stoddard, F. L., Adhikari, K. N., Paull, J. G., Schulman, A. H., et al. (2021). Recent advances in faba bean genetic and genomic tools for crop improvement. Legume Sci. 3, e75. doi: 10.1002/leg3.75
Lalanne, E., Honys, D., Johnson, A., Borner, G. H. H., Lilley, K. S., Dupree, P., et al. (2004). SETH1 and SETH2, two components of the glycosylphosphatidylinositol anchor biosynthetic pathway, are required for pollen germination and tube growth in Arabidopsis. Plant Cell 16, 229–240. doi: 10.1105/tpc.014407
Lao, N. T., Long, D., Kiang, S., Coupland, G., Shoue, D. A., Carpita, N. C., et al. (2003). Mutation of a family 8 glycosyltransferase gene alters cell wall carbohydrate composition and causes a humidity-sensitive semi-sterile dwarf phenotype in Arabidopsis. Plant Mol. Biol. 53, 647–661. doi: 10.1023/B:PLAN.0000019074.60542.6c
Li, M., He, Y., Liu, R., Li, G., Wang, D., Ji, Y. S., et al. (2023). Construction of SNP genetic map based on targeted next-generation sequencing and QTL mapping of vital agronomic traits in faba bean (Vicia faba L.). J. Integr. Agric. 22, 2095–3119. doi: 10.1016/j.jia.2023.01.003
Li, N., Song, D., Peng, W., Zhan, J., Shi, J., Wang, X., et al. (2019). Maternal control of seed weight in rapeseed (Brassica napus L.): the causal link between the size of pod (mother, source) and seed (offspring, sink). Plant Biotechnol. J. 17, 736–749. doi: 10.1111/pbi.13011
Li, X., Wang, X., Wei, Y., Brummer, E. C. (2011). Prevalence of segregation distortion in diploid alfalfa and its implications for genetics and breeding applications. Theor. Appl. Genet. 123, 667–679. doi: 10.1007/s00122-011-1617-5
Li, S., Zachgo, S. (2013). TCP3 interacts with R2R3-MYB proteins, promotes flavonoid biosynthesis and negatively regulates the auxin response in Arabidopsis thaliana. Plant J. 76, 901–913. doi: 10.1111/tpj.12348
Lyu, J. I., Ramekar, R., Kim, J. M., Hung, N. N., Seo, J. S., Kim, J.-B., et al. (2021). Unraveling the complexity of faba bean (Vicia faba L.) transcriptome to reveal cold-stress-responsive genes using long-read isoform sequencing technology. Sci. Rep. 11, 21094. doi: 10.1038/s41598-021-00506-0
Ma, Y., Bao, S., Yang, T., Hu, J., Guan, J., He, Y., et al. (2013). Genetic linkage map of Chinese native variety faba bean (Vicia faba L.) based on simple sequence repeat markers. Plant Breed. 132, 397–400. doi: 10.1111/pbr.12074
Maalouf, F., Abou-Khater, L., Babiker, Z., Jighly, A., Alsamman, A. M., Hu, J., et al. (2022). Genetic dissection of heat stress tolerance in faba bean (Vicia faba L.) using GWAS. Plants 11 (9), 1108. doi: 10.3390/plants11091108
Macas, J., Novák, P., Pellicer, J., Čížková, J., Koblížková, A., Neumann, P., et al. (2015). In depth characterization of repetitive DNA in 23 plant genomes reveals sources of genome size variation in the legume tribe fabeae. PloS One 10, e0143424. doi: 10.1371/journal.pone.0143424
Martin, M. V., Fiol, D. F., Sundaresan, V., Zabaleta, E. J., Pagnussat, G. C. (2013). oiwa, a female gametophytic mutant impaired in a mitochondrial manganese-superoxide dismutase, reveals crucial roles for reactive oxygen species during embryo sac development and fertilization in Arabidopsis. Plant Cell 25, 1573–1591. doi: 10.1105/tpc.113.109306
Meng, L., Li, H., Zhang, L., Wang, J. (2015). QTL IciMapping: Integrated software for genetic linkage map construction and quantitative trait locus mapping in biparental populations. Crop J. 3, 269–283. doi: 10.1016/j.cj.2015.01.001
Money, D., Gardner, K., Migicovsky, Z., Schwaninger, H., Zhong, G.-Y., Myles, S. (2015). Linkimpute: fast and accurate genotype imputation for nonmodel organisms. G3 (Bethesda) 5, 2383–2390. doi: 10.1534/g3.115.021667
Nakamura, Y., Teo, N. Z. W., Shui, G., Chua, C. H. L., Cheong, W.-F., Parameswaran, S., et al. (2014). Transcriptomic and lipidomic profiles of glycerolipids during Arabidopsis flower development. New Phytol. 203, 310–322. doi: 10.1111/nph.12774
Nakashima, K., Kiyosue, T., Yamaguchi-Shinozaki, K., Shinozaki, K. (1997). A nuclear gene, erd1, encoding a chloroplast-targeted Clp protease regulatory subunit homolog is not only induced by water stress but also developmentally up-regulated during senescence in Arabidopsis thaliana. Plant J. 12, 851–861. doi: 10.1046/j.1365-313x.1997.12040851.x
O’Sullivan, D. M., Angra, D., Harvie, T., Tagkouli, V., Warsame, A. (2019). A genetic toolbox for Vicia faba improvement. In: International Conference on Legume Genetics and Genomics (ICLGG), (Dijon, France).
Ocaña, S., Seoane, P., Bautista, R., Palomino, C., Claros, G. M., Torres, A. M., et al. (2015). Large-Scale Transcriptome Analysis in faba Bean (Vicia faba L.) under Ascochyta fabae Infection. PLoS One 10, e0135143. doi: 10.1371/journal.pone.0135143
Ocaña-Moral, S., Gutierrez, N., Torres, A. M., Madrid, E. (2017). Saturation mapping of regions determining resistance to Ascochyta blight and broomrape in faba bean using transcriptome-based SNP genotyping. Theor. Appl. Genet. 130, 2271–2282. doi: 10.1007/s00122-017-2958-5
Ohm, H., Åstrand, J., Ceplitis, A., Bengtsson, D., Hammenhag, C., Chawade, A., et al. (2024). Novel SNP markers for flowering and seed quality traits in faba bean (Vicia faba L.): characterization and GWAS of a diversity panel. Front. Plant Sci. 15. doi: 10.3389/fpls.2024.1348014
Ouellette, L. A., Reid, R. W., Blanchard, S. G., Brouwer, C. R. (2018). LinkageMapView-rendering high-resolution linkage and QTL maps. Bioinformatics 34, 306–307. doi: 10.1093/bioinformatics/btx576
Persson, S., Paredez, A., Carroll, A., Palsdottir, H., Doblin, M., Poindexter, P., et al. (2007). Genetic evidence for three unique components in primary cell-wall cellulose synthase complexes in Arabidopsis. Proc. Natl. Acad. Sci. U.S.A. 104, 15566–15571. doi: 10.1073/pnas.0706592104
Peterson, B. G., Carl, P. (2020). PerformanceAnalytics: Econometric tools for performance and risk analysis. R package version 2.0.4. Available online at: https://CRAN.R-project.org/package=PerformanceAnalytics (Accesed January 8, 2024).
Qadir, M., Wang, X., Shah, S. R. U., Zhou, X.-R., Shi, J., Wang, H. (2021). Molecular network for regulation of ovule number in plants. Int. J. Mol. Sci. 22 (23), 12965. doi: 10.3390/ijms222312965
Qin, X., Duan, Z., Zheng, Y., Liu, W.-C., Guo, S., Botella, J. R., et al. (2020). ABC1K10a, an atypical kinase, functions in plant salt stress tolerance. BMC Plant Biol. 20, 270. doi: 10.1186/s12870-020-02467-4
Ray, H., Bock, C., Georges, F. (2015). Faba bean: transcriptome analysis from etiolated seedling and developing seed coat of key cultivars for synthesis of proanthocyanidins, phytate, raffinose family oligosaccharides, vicine, and convicine. Plant Genome 8, eplantgenome2014.07.0028. doi: 10.3835/plantgenome2014.07.0028
R Development Core Team (2022). R: a language and environment for statistical computing (Vienna: R Foundation for Statistical Computing).
Rodor, J., Jobet, E., Bizarro, J., Vignols, F., Carles, C., Suzuki, T., et al. (2011). AtNUFIP, an essential protein for plant development, reveals the impact of snoRNA gene organisation on the assembly of snoRNPs and rRNA methylation in Arabidopsis thaliana. Plant J. 65, 807–819. doi: 10.1111/j.1365-313X.2010.04468.x
Román, B., Satovic, Z., Avila, C. M., Rubiales, D., Moreno, M. T., Torres, A. M. (2003). Locating genes associated with Ascochyta fabae resistance in Vicia faba. Aust. J. Agric. Res. 54, 85. doi: 10.1071/AR02034
Román, B., Satovic, Z., Pozarkova, D., Macas, J., Dolezel, J., Cubero, J. I., et al. (2004). Development of a composite map in Vicia faba, breeding applications and future prospects. Theor. Appl. Genet. 108, 1079–1088. doi: 10.1007/s00122-003-1515-6
Román, B., Torres, A. M., Rubiales, D., Cubero, J. I., Satovic, Z. (2002). Mapping of quantitative trait loci controlling broomrape (Orobanche crenata Forsk.) resistance in faba bean (Vicia faba L.). Genome 45, 1057–1063. doi: 10.1139/g02-082
Sallam, A., Dhanapal, A. P., Liu, S. (2016). Association mapping of winter hardiness and yield traits in faba bean (Vicia faba L.). Crop Pasture Sci. 67, 55. doi: 10.1071/CP15200
Sallam, A., Moursi, Y. S., Martsch, R., Eltaher, S. (2022). Genome-wide association mapping for root traits associated with frost tolerance in faba beans using KASP-SNP markers. Front. Genet. 13. doi: 10.3389/fgene.2022.907267
Satovic, Z., Avila, C. M., Cruz-Izquierdo, S., Díaz-Ruíz, R., García-Ruíz, G. M., Palomino, C., et al. (2013). A reference consensus genetic map for molecular markers and economically important traits in faba bean (Vicia faba L.). BMC Genomics 14, 932. doi: 10.1186/1471-2164-14-932
Sessions, A., Nemhauser, J. L., McColl, A., Roe, J. L., Feldmann, K. A., Zambryski, P. C. (1997). ETTIN patterns the Arabidopsis floral meristem and reproductive organs. Development 124, 4481–4491. doi: 10.1242/dev.124.22.4481
Simpson, S. D., Nakashima, K., Narusaka, Y., Seki, M., Shinozaki, K., Yamaguchi-Shinozaki, K. (2003). Two different novel cis-acting elements of erd1, a clpA homologous Arabidopsis gene function in induction by dehydration stress and dark-induced senescence. Plant J. 33, 259–270. doi: 10.1046/j.1365-313x.2003.01624.x
Sjögren, L. L. E., MacDonald, T. M., Sutinen, S., Clarke, A. K. (2004). Inactivation of the clpC1 gene encoding a chloroplast Hsp100 molecular chaperone causes growth retardation, leaf chlorosis, lower photosynthetic activity, and a specific reduction in photosystem content. Plant Physiol. 136, 4114–4126. doi: 10.1104/pp.104.053835
Skovbjerg, C. K., Angra, D., Robertson-Shersby-Harvie, T., Kreplak, J., Keeble-Gagnère, G., Kaur, S., et al. (2023). Genetic analysis of global faba bean diversity, agronomic traits and selection signatures. Theor. Appl. Genet. 136, 114. doi: 10.1007/s00122-023-04360-8
Stansell, Z., Farnham, M., Björkman, T. (2019). Complex horticultural quality traits in broccoli are illuminated by evaluation of the immortal boltbdh mapping population. Front. Plant Sci. 10. doi: 10.3389/fpls.2019.01104
Stirnberg, P., van De Sande, K., Leyser, H. M. O. (2002). MAX1 and MAX2 control shoot lateral branching in Arabidopsis. Development 129, 1131–1141. doi: 10.1242/dev.129.5.1131
Sudheesh, S., Kimber, R. B. E., Braich, S., Forster, J. W., Paull, J. G., Kaur, S. (2019). Construction of an integrated genetic linkage map and detection of quantitative trait loci for ascochyta blight resistance in faba bean (Vicia faba L.). Euphytica 215, 42. doi: 10.1007/s10681-019-2365-x
Tan, S.-T., Dai, C., Liu, H.-T., Xue, H.-W. (2013). Arabidopsis casein kinase1 proteins CK1.3 and CK1.4 phosphorylate cryptochrome2 to regulate blue light signaling. Plant Cell 25, 2618–2632. doi: 10.1105/tpc.113.114322
Torres, A. M., Weeden, N. F., Martín, A. (1993). Linkage among isozyme, RFLP and RAPD markers in Vicia faba. Theor. Appl. Genet. 85, 937–945. doi: 10.1007/BF00215032
Vales, M. I., Schön, C. C., Capettini, F., Chen, X. M., Corey, A. E., Mather, D. E., et al. (2005). Effect of population size on the estimation of QTL: a test using resistance to barley stripe rust. Theor. Appl. Genet. 111 (7), 1260–1270. doi: 10.1007/s00122-005-0043-y
Van Damme, D., Bouget, F.-Y., Van Poucke, K., Inzé, D., Geelen, D. (2004). Molecular dissection of plant cytokinesis and phragmoplast structure: a survey of GFP-tagged proteins. Plant J. 40, 386–398. doi: 10.1111/j.1365-313X.2004.02222.x
van Ooijen, J. W. (1992). Accuracy of mapping quantitative trait loci in autogamous species. Theor. Appl. Genet. 84, 803–811. doi: 10.1007/BF00227388
Varshney, R. K., Pandey, M. K., Bohra, A., Singh, V. K., Thudi, M., Saxena, R. K. (2019). Toward the sequence-based breeding in legumes in the post-genome sequencing era. Theor. Appl. Genet. 132, 797–816. doi: 10.1007/s00122-018-3252-x
Vaz Patto, M. C., Torres, A. M., Koblizkova, A., Macas, J., Cubero, J. I. (1999). Development of a genetic composite map of Vicia faba using F2 populations derived from trisomic plants. Theor. Appl. Genet. 98, 736–743. doi: 10.1007/s001220051129
Wang, H., Smith, K. P., Combs, E., Blake, T., Horsley, R. D., Muehlbauer, G. J. (2012). Effect of population size and unbalanced data sets on QTL detection using genome-wide association mapping in barley breeding germplasm. Theor. Appl. Genet. 124, 111–124. doi: 10.1007/s00122-011-1691-8
Wang, Y., Zhang, W.-Z., Song, L.-F., Zou, J.-J., Su, Z., Wu, W.-H. (2008). Transcriptome analyses show changes in gene expression to accompany pollen germination and tube growth in Arabidopsis. Plant Physiol. 148, 1201–1211. doi: 10.1104/pp.108.126375
Webb, A., Cottage, A., Wood, T., Khamassi, K., Hobbs, D., Gostkiewicz, K., et al. (2016). A SNP-based consensus genetic map for synteny-based trait targeting in faba bean (Vicia faba L.). Plant Biotechnol. J. 14, 177–185. doi: 10.1111/pbi.12371
Xu, D., Mondol, P. C., Ishiguro, S., Shi, J., Zhang, D., Liang, W. (2020). NERD1 is required for primexine formation and plasma membrane undulation during microsporogenesis in Arabidopsis thaliana. aBIOTECH 1, 205–218. doi: 10.1007/s42994-020-00022-1
Yang, W., Choi, M.-H., Noh, B., Noh, Y.-S. (2020). De novo shoot regeneration controlled by HEN1 and TCP3/4 in arabidopsis. Plant Cell Physiol. 61, 1600–1613. doi: 10.1093/pcp/pcaa083
Yang, B., Stamm, G., Bürstenbinder, K., Voiniciuc, C. (2022). Microtubule-associated IQD9 orchestrates cellulose patterning in seed mucilage. New Phytol. 235, 1096–1110. doi: 10.1111/nph.18188
Yang, L., Wu, G., Poethig, R. S. (2012). Mutations in the GW-repeat protein SUO reveal a developmental function for microRNA-mediated translational repression in Arabidopsis. Proc. Natl. Acad. Sci. U.S.A. 109, 315–320. doi: 10.1073/pnas.1114673109
Yuan, J., Kessler, S. A. (2019). A genome-wide association study reveals a novel regulator of ovule number and fertility in Arabidopsis thaliana. PLoS Genet. 15, e1007934. doi: 10.1371/journal.pgen.1007934
Zander, P., Amjath-Babu, T. S., Preissel, S., Reckling, M., Bues, A., Schläfke, N., et al. (2016). Grain legume decline and potential recovery in European agriculture: a review. Agron. Sust. Developm. 36, 26. doi: 10.1007/s13593-016-0365-y
Zeid, M., Mitchell, S., Link, W., Carter, M., Nawar, A., Fulton, T., et al. (2009). Simple sequence repeats (SSRs) in faba bean: new loci from Orobanche -resistant cultivar ‘Giza 402.’. Plant Breed. 128, 149–155. doi: 10.1111/j.1439-0523.2008.01584.x
Zhan, H., Xu, S. (2011). Generalized linear mixed model for segregation distortion analysis. BMC Genet. 12, 97. doi: 10.1186/1471-2156-12-97
Zhang, C., Wang, P., Tang, D., Yang, Z., Lu, F., Qi, J., et al. (2019). The genetic basis of inbreeding depression in potato. Nat. Genet. 51, 374–378. doi: 10.1038/s41588-018-0319-1
Zhao, N., Xue, D., Miao, Y., Wang, Y., Zhou, E., Zhou, Y., et al. (2023). Construction of a high-density genetic map for faba bean (Vicia faba L.) and quantitative trait loci mapping of seed-related traits. Front. Plant Sci. 14. doi: 10.3389/fpls.2023.1201103
Zhu, B., Li, H., Xia, X., Meng, Y., Wang, N., Li, L., et al. (2020). ATP-binding cassette G transporters SGE1 and MtABCG13 control stigma exsertion. Plant Physiol. 184, 223–235. doi: 10.1104/pp.20.00014
Keywords: faba bean, density map, QTLs, autofertility, flowering time, plant architecture, yield, dehiscence
Citation: Aguilar-Benitez D, Gutierrez N, Casimiro-Soriguer I and Torres AM (2025) A high-density linkage map and fine QTL mapping of architecture, phenology, and yield-related traits in faba bean (Vicia faba L.). Front. Plant Sci. 16:1457812. doi: 10.3389/fpls.2025.1457812
Received: 01 July 2024; Accepted: 27 February 2025;
Published: 07 April 2025.
Edited by:
Leonardo Velasco, Spanish National Research Council (CSIC), SpainReviewed by:
Juan Jose Ferreira, Servicio Regional de Investigación y Desarrollo Agroalimentario (SERIDA), SpainCopyright © 2025 Aguilar-Benitez, Gutierrez, Casimiro-Soriguer and Torres. This is an open-access article distributed under the terms of the Creative Commons Attribution License (CC BY). The use, distribution or reproduction in other forums is permitted, provided the original author(s) and the copyright owner(s) are credited and that the original publication in this journal is cited, in accordance with accepted academic practice. No use, distribution or reproduction is permitted which does not comply with these terms.
*Correspondence: Natalia Gutierrez, bmF0YWxpYS5ndXRpZXJyZXoubGVpdmFAanVudGFkZWFuZGFsdWNpYS5lcw==
†ORCID: Natalia Gutierrez, orcid.org/0000-0001-5248-0390
Disclaimer: All claims expressed in this article are solely those of the authors and do not necessarily represent those of their affiliated organizations, or those of the publisher, the editors and the reviewers. Any product that may be evaluated in this article or claim that may be made by its manufacturer is not guaranteed or endorsed by the publisher.
Research integrity at Frontiers
Learn more about the work of our research integrity team to safeguard the quality of each article we publish.