
95% of researchers rate our articles as excellent or good
Learn more about the work of our research integrity team to safeguard the quality of each article we publish.
Find out more
ORIGINAL RESEARCH article
Front. Plant Sci. , 20 February 2025
Sec. Plant Abiotic Stress
Volume 16 - 2025 | https://doi.org/10.3389/fpls.2025.1455592
This article is part of the Research Topic Salinity and Drought Stress in Plants: Understanding Physiological, Biochemical and Molecular Responses Volume II View all 26 articles
 Liangqin Zeng1,2
 Sylvia E. Brown1He Wu1Wenhua Dongchen1Yunbin Li1Chun Lin1,3Zhengjie Liu1,3,4*
 Zichao Mao1,3,4*
Introduction: Hydroxy-3-methylglutaryl-coenzyme A reductase (HMGR) is a key enzyme in the terpenoid biosynthetic pathway, playing a crucial role in plant stress responses. However, the HMGR gene family in Asparagus taliensis, a traditional Chinese medicinal herb with high steroidal saponin content and strong stress tolerance, remains poorly understood. This study investigates the stress response mechanisms of the HMGR gene family in A. taliensis under abiotic stress conditions.
Methods: A comprehensive genome-wide analysis of the HMGR gene family in A. taliensis was conducted. The analysis included chromosomal localization, phylogenetic tree construction, linear analysis, gene structure characterization, motif distribution, cis-acting elements, and protein structure. Candidate AtaHMGR10 gene were overexpressed in Arabidopsis thaliana to analyze phenotypic changes under osmotic and salt stress, including seed germination rate and primary root length. Physiological parameters were also analyzed, and gene expression was validated using qPCR under drought, osmotic, and salt stress conditions.
Results: A total of 18 HMGR gene family members were identified in A. taliensis. The functions and evolution of AtaHMGR genes are conserved. AtaHMGR10 was selected as a promising candidate due to its unique expression profile. Docking analysis revealed that AtaHMGR10 has conserved motifs for binding both HMG-CoA and NADPH/NADH, showing equal affinity for both. Overexpression of AtaHMGR10 in transgenic A. thaliana enhanced tolerance to abiotic stresses, as evidenced by higher germination rates, improved primary root length, increased chlorophyll and proline levels, enhanced peroxidase (POD) and catalase (CAT) activities, and reduced malondialdehyde (MDA) content compared to non-transgenic plants under stress conditions.
Discussion: These findings highlight the role of AtaHMGR10 in enhancing plant stress tolerance, particularly in combating drought, osmotic, and salt stress. This understanding of its potential function provides avenues for improving crop resilience to abiotic stress through future gene modification.
Abiotic stresses such as drought, cold and high salinity impact growth, development as well as distribution of plants. To counter these challenges, plants have developed a variety of adaptive mechanisms at the molecular, cellular, physiological, and biochemical levels. Among these, terpenoids, especially steroidal saponins are key secondary metabolites that have critical roles against stresses. In Angiosperm plants, isopentenyl diphosphate (IPP) and dimethylallyl diphosphate (DMAPP) as basic five carbon unit for biosynthesis of terpenoids (e.g. steroidal compounds and phytohormones) are synthesized by two different pathways: the mevalonate (MVA) pathway in the cytoplasm and the 2-C-methyl-D-erythritol-4-phosphate pathway (MEP) in plastids (Kuravadi et al., 2015; Pandreka et al., 2015). HMGR, which is a rate-limiting enzyme in the MVA pathway (Segatto et al., 2014), catalyzes the conversion of 3-hydroxy-3-methylglutaryl-CoA (HMG-CoA) to MVA using two molecules of nicotinamide adenine dinucleotide phosphate (NADPH) or nicotinamide adenine dinucleotide (NADH) as reducing agents (Bach, 1986; Segatto et al., 2014). The MVA pathway is responsible for producing terpenoids e.g., artemisinin-a natural antimalarial drug isolated from the Chinese medicinal plant Artemisia annua (Li et al., 2023).
Recent research have underscored the pivotal functions of the HMGR in catalyzing terpenoids synthesis across a variety of plant species. In Azadirachta indica, overexpression of AiHMGR2 directly correlated with the production of azadirachtin, a terpenoid with notable pesticidal properties (Bhambhani et al., 2017). Overexpression of AaHMGR in Artemisia annua resulted in increased artemisinin content (Li et al., 2024), while overexpression of OkHMGR in Ocimum kilimandscharicum enhanced the production of aromatic terpenoids (Bansal et al., 2018). Similarly, in hybrid Populus, elevated expression of PtHMGR led to increased terpenoid levels, enhancing the plant’s resistance to stress (Wei et al., 2019). These findings demonstrate the roles of HMGR genes in the biosynthesis of terpenoids and isoprenoids for plants’ adaptation to diverse environmental signals.
Environmental stresses and developmental signals (e.g., phytohormones) profoundly affect plant physiology. HMGR genes are normally upregulated under such conditions, enhancing stress-related biosynthesis of metabolites. For example, SmHMGR2 and SmHMGR3 were positively regulated by phytohormonal stimulations (Ma et al., 2012). MdHMGR4 demonstrated a root-specific expression pattern in apple and its expression was significantly enhanced by phytohormonal treatments (Lv and Zhang, 2017). In rice, drought treatment upregulated OsHMGR genes, facilitating phytosterol synthesis, thereby enhancing the plant’s resistance to drought conditions (Kumar et al., 2015, 2018). Overexpression of MdHMGR5 in apple increased plant tolerance to oxidative stress by enhancing reactive oxygen species (ROSs) scavenging abilities in transgenic plants (Zhang et al., 2020). Similarly, overexpression of PtHMGR in Populus led to remarkable decrease in membrane damage under drought stress (Wei et al., 2020). Moreover, the expression of HMGRs were positively regulated by hormonal treatment, as demonstrated in grapes where VvHMGR1 maintained high expression levels potentially linked to growth and stress-related phytohormones synthesis and signaling (Zheng et al., 2021). Additionally, PtHMGR5 is reported to be involved in the increased tolerance to drought in Populus (Ma et al., 2023). β-Sitosterol, its precursors of biosynthesis was catalyzed by EkHMGR, was reported to enhance plant drought tolerance (Wang et al., 2024), therefore HMGRs have been applied to enhance plant stress tolerance by transgenic approaches. Previous studies have shown that overexpression of HMGR enhances resistance to abiotic stresses in various plant species. However, little is known about Asparagus taliensis, a species of the genus Asparagus (Asparagaceae) endemic to Yunnan, China, which has traditionally been used as herbal medicine due to the presence of steroidal saponins, which have anti-inflammatory properties, ability to induce cancer cells apoptosis and modulation of immune responses (Podolak et al., 2010; Sparg et al., 2004).
Asparagus L. contains more than 200 species distributed across the old world, with southern Africa being the cradle center and southwestern China, regarded as the diversity center of dioecious Asparagus species (Wu et al., 2024) among which 8 dioecious species including, A. taliensis are endemic in Yunnan province of China (Saha et al., 2015). The phylogenetic study showed that in the dioecious Asparagus species of Eurasia, A. taliensis clustered with Asparagus conchinchinensis into a small clade, suggesting a closer phylogenic relationship (Bentz et al., 2024a). A. taliensis exhibits strong tolerance to environmental stresses, such as drought and cold, as it grows well in the low precipitation winters of Yunnan. The tuber roots of A. taliensis, which are used for medicinal purposes, are larger than those of A. cochinchinensis, making it an alternative plant for A. cochinchinensis replacement planted in wide regions of China for higher yields. It is also regarded as an ideal germplasm for breeding of A. cochinchinensis through interspecific hybridization due to their closer phylogenetic relationship. Based on our assembled and annotated A. taliensis genome (unpublished), this study involved a comprehensive analysis of the HMGR gene family in A. taliensis, and the AtaHMGR10 was predicted as a candidate of significant interest due to its unique expression profile, the potential function inferred from its conserved motifs for the binding HMG-CoA and NADPH/NADH, as well as the equivalent binding abilities of both NADPH and NADH by Alphafold3 docking analysis respectively. Furthermore, the overexpression of AtaHMGR10 in transgenic A. thaliana significantly improved tolerance to both drought and salt treatments. Overall, our research provides critical insights to the HMGR gene family in A. taliensis, contributing to the understanding of its evolutionary and functional roles in enhancing abiotic stress tolerances. This study also offers a valuable gene source for improving germplasm in Asparagus species, promoting the biosynthesis of medicinal terpenoids in microbial hosts using synthetic biology methods, and enhancing stress tolerance in crops through genetic modification.
The seeds of A. taliensis were collected from a cultivation field in Luxi County, Yunnan, China, and the germinated seedlings were transplanted in the field of Yunnan Agricultural University. The 4-month-old seedlings, were treated with 200 μmol/ml jasmonic acid (MeJA) for 72 hrs. Non-MeJA-treated seedlings (control) and MeJA-treated seedlings (12 hr, 24 hr, 36 hr, 48 hr, 60 hr, and 72 hr), along with fresh roots (Rs), stems (Ss) and flowering twigs (Fs) from two-year-old field plants, were sampled with three biological replicates for each. The samples were immediately frozen in liquid nitrogen and stored at -80°C for subsequent RNA extraction and RNA sequencing analysis, as reported in our previous study (Wu et al., 2024).
A. thaliana was used as the transgenic host (wildtype, WT) and the AtaHMGR10 transgenic Arabidopsis plants were generated with the floral dip method (Zhang et al., 2006). The transgenic and WT A. thaliana seeds were surface-sterilized with 75% (v/v) ethanol for 1 minute, rinsed five times with sterile water, and sown on 1/2 Murashige and Skoog (MS) medium (Solarbio, Beijing, China) (pH 5.8). After undergoing vernalization for two days at 4°C, seeds were cultured for seedling preparation in a controlled environment chamber under a 14-hour light at 24°C/10-hour dark at 22°C, maintaining a relative humidity of 60%-70%. The seedlings were transplanted into pods and grown under the same germination conditions as above. Six-week-old WT and transgenic A. thaliana lines were selected and exposed to drought, salt, and osmotic stresses respectively. Plant samples were collected, frozen in liquid nitrogen, and stored at -80°C or directly used for phenotypical observations, as well as physiological, biochemical, and molecular detections.
Based on our assembled and annotated genome of A. taliensis (unpublished), the HMGR family members were predicted through hmmsearch with HMMER (v3.0) software (Finn et al., 2011) using the HMGR Hidden Markov Model (PF00368), downloaded from the Pfam database (Blum et al., 2021) as well as the homologous search by BLASTP with BLAST (v2.11.0+), using query of 12 function confirmed HMGR genes from various plants (e.g. A. thaliana and Oryza sativa), with filtering critical standard set as: similarity > 40%, coverage > 80% and e-values <1e-6 (McGinnis and Madden, 2004). The conserved domains in the resulted HMGR proteins were further confirmed through comparison with the database of InterPro (Lu et al., 2020). The physicochemical properties of the predicted AtaHMGR members were analyzed using TBtools software (v2.142) (Chen et al., 2023). Subcellular localization of HMGR proteins was predicted using the web tools of WoLF PSORT (Horton et al., 2007).
Chromosomal localization of the AtaHMGR genes was performed using the MapGene2Chrom (MG2C) tool (http://mg2c.iask.in/mg2c_v2.1/). The calculation of non-synonymous (Ka) and synonymous (Ks) substitutions, along with their ratios (Ka/Ks), were computed using kakscalculator2 (https://github.com/kullrich/kakscalculator2). Additionally, synteny analysis for the AtaHMGR family members were conducted with the MCScanX tool (Wang et al., 2013), and outputs were visualized with Circos software (https://github.com/node/circos).
Genomic sequences of A. thaliana (GCA_028009825.2), Nymphaea colorata (GCF_008831285.2), Dioscorea zingiberensis (GCA_026586065.1), Asparagus racemosus (GCA_037177215.1), Asparagus setaceus (GCA_012295165.1), and Asparagus officinalis (GCF_001876935.1) were retrieved from the NCBI genome database. Multiple sequence alignments of candidate HMGR proteins were performed using the MUSCLE algorithm with default parameters (Edgar, 2004). A phylogenetic tree was then constructed with MEGA-X software (Kumar et al., 2018b), using the maximum likelihood method with 1000 bootstrap replicates to estimate evolutionary distances. The resulting phylogenetic tree was visualized and refined using the iTOL online tool (Letunic and Bork, 2021).
Conserved motifs were analyzed employing the Multiple Expectation Maximization for Motif Elicitation (MEME Suite) (Bailey et al., 2015). The maximum number of motifs considered was limited to 20 motifs, width of motifs: 6-100, with default parameters. Information on the exon-intron structure for AtaHMGRs was derived from genomic annotated GFF files as well as the manual corrections by BAM file resulted from RNAseq mapping by Hisat2 (Thakur, 2024). Cis-elements of promoter, extending 2000 bp upstream from the start codon (ATG), were predicted using the PlantCARE database (Lescot et al., 2002).
The secondary structure of proteins was predicted using the online tool SOPMA (Geourjon and Deleage, 1995). Folding of the 3D structures for AtaHMGRs as well as their substrate binding sites were conducted using the Alphafold3 (https://alphafoldserver.com/) (Callaway, 2024; Abramson et al., 2024) or SWISS-MODEL (https://swissmodel.expasy.org/), and the resulting 3D structure of 18 AtaHMGRs were visualized using PyMOL (Schrodinger, 2015).
The expression patterns of AtaHMGRs were assessed in three distinct tissues (Fs, Rs, and Ss) of two-year-old field-grown A. taliensis, as well as in four-month-old seedlings grown in pots with or without MeJA treatments. The MeJA-treated seedlings were compared to untreated controls at seven different time points (0, 12, 24, 36, 48, 60, and 72 hours). The total RNAs were extracted by RNAPrep pure plant kit (TianGen, Beijing, China), then reverse transcribed to cDNA using GoScript™ Reverse Transcription Mix, Random Primer kit (Promega, Beijing China) according to the manufacturer’s protocols. The cDNA (~10 μg) was sequenced using the Illumina Genome Analyzer II platform (Illumina, San Diego, USA) with libraries of 300 bp cDNA insertions with 150 bp pair-end (PE) model. All resulted RNAseq data were evaluated with FastQC (https://github.com/topics/fastqc), then filtered with Fastp v0.23.4 (https://github.com/OpenGene/fastp) to get clean data. The clean reads were mapped to the genome of A. taliensis using hisat2 (v2.2.1) (Kim et al., 2015) resulting in BAM files. Expression quantification was performed through scripts of FeatureCounts (Liao et al., 2014) to obtain matrix of TPM (standardized expression units of transcripts per kilobase of exon model per million mapped reads). The expression profiles were visualized using the TBtools software.
Total RNA of A. taliensis was isolated with the RNA Easy Fast Plant Tissue Kit, and the quality and concentration were assessed using the KRIRO K5600 (Kaiao Biotech, Beijing, China). cDNA was obtained using the FastKing gDNA dispelling RT SuperMix. The full coding sequence (CDS) of AtaHMGR10 was amplified with the primers AtaHMGR10-1F and AtaHMGR10-1R and cloned into T-vector. After the sequence correction was confirmed by Sanger sequencing, the CDS of AtaHMGR10, was reamplified with primers AtaHMGR10-2F and AtaHMGR10-2R, and cloned into the pBWA(V)HS vector to obtain expression vector with AtaHMGR10 controlled by a CaMV 35S promoter. The constructed expression vector, was introduced into Agrobacterium tumefaciens GV3101, then subsequently transformed into A. thaliana Col-0 plants via the floral dip method (Narusaka et al., 2012). Screening for hygromycin resistance (20 mg/L) was conducted to select hygromycin resistant plants, and transgenic Arabidopsis plants were further confirmed by PCR amplification with primers AtaHMGR10-1F and AtaHMGR10-1R. All primers used in this study are listed in Supplementary Table S1, and the transgenic Arabidopsis plants were cultivated until second generation of transgenic plant (T2) seeds and harvested for further phenotypical observations.
For detection of AtaHMGR10 subcellular location, pBWA(V)HS -GFP vector was used to construct a fused AtaHMGR10-GFP expression vector. In detail, the coding region of AtaHMGR10 (excluding the stop codon) was amplified by PCR from cDNA with primers of AtaHMGR10-3F and AtaHMGR10-3R (listed in Supplementary Table S1), cloned into the pBWA(V)HS-GFP vector with double digestion of both BgI II and Spe I, resulting in pBWA(V)HS-AtaHMGR10-GFP vector. Protoplasts were isolated from Nicotiana tabacum leaves and underwent polyethylene glycol (PEG)-mediated transformation (Antolín-Llovera et al., 2011). The procedure began by carefully peeling the upper epidermal layer of the leaves and immersing it in an enzymatic solution containing 1.5% cellulase R10, 0.4% macerozyme R10, 0.4 M mannitol, 20 mM KCl, and 10 mM MES-KOH (pH 5.8), which was gently agitated for 10 minutes in the dark. Subsequently, the mixture was filtered through a nylon mesh and washed twice using W5 solution (154 mM NaCl, 125 mM CaCl2, 2 mM KH2PO4, 2 mM MES, 5 mM glucose, pH 5.7-5.8). The protoplasts were then resuspended in MMG solution (0.4 M mannitol, 15 mM MgCl2·6H2O, 4 mM MES-KOH, pH 5.7-5.8) to achieve a density of ~ 2×10⁵ cells/mL. For the transformation process, 10 µg of plasmid DNAs was mixed with 100 µL of the protoplast suspension, followed by adding 110 µL of PEG solution (40% PEG4000, 0.2 M mannitol, 100 mM CaCl2). This mixture was incubated at room temperature for 10-15 minutes in the dark, and then diluted with 1 mL of W5 solution. After centrifugation at 300 rpm for 3 minutes, the collected pellets were washed once or twice with 1 mL of W5 solution, resuspended in the same 1 mL W5 solution, and incubated at 25°C for 18-24 hours. GFP fluorescence signals were observed and images were captured using a confocal scanning microscope (C2-ER, Nikon, Japan).
AtaHMGR10 transgenic A. thaliana seeds (lines OE-1 and OE-3 of T2 generation) were utilized to assess the germination rates under salt and osmotic stress. All experiments were performed in triplicate. Both WT and transgenic A. thaliana seeds were surface-sterilized and plated on 1/2 MS medium supplemented with 0 & 50 mM NaCl, and 0 & 200 mM mannitol, respectively. The plates were then incubated in a growth chamber, and germination rates were determined after 9 days.
The plants of WT and transgenic A. thaliana, aged six weeks, were exposed to drought for 0, 5, and 10 days, with subsequent re-watering for 6 days. Leaves were sampled to assess drought impacts. To gauge the salt and osmotic stress responses, leaves were also sampled at 0, 3, 6, 12, 24, and 36 hours following exposure to 50 mM NaCl and 10% PEG 6000 treatments respectively. These intervals were selected to monitor the immediate stress response dynamics. Biochemical analyses of total chlorophyll, MDA, proline, and POD & CAT activities were conducted using a Boxbio reagent kit (Boxbio Science & Technology, Beijing, China), following the protocols of the manufacturer.
Data collection was facilitated using Microsoft Excel, and statistical analysis was conducted using two-way ANOVA through GraphPad Prism version 10.1.2. This analysis method is consistent with standard practices for evaluating interactive effects in biological experiments. The results were presented as mean ± standard deviation (SD) from three biological replicates. Statistical significance was defined as *P < 0.05 and **P < 0.01 when compared to the control.
The extracted total RNA was reverse transcribed into cDNA using Hifair® II 1st Strand cDNA Synthesis Kit (11119ES60, Yeasen, China). qRT-PCR assays were conducted using ChamQ Universal SYBR qPCR Master Mix(Q711, Vazyme, China) with a QuantStudio 5 Real-Time PCR System (Applied Biosystems). A 20 μL PCR system includes: 10.0 μL 2×ChamQ Universal SYBR qPCR Master Mix, 0.4 μL for each primer (10 μM), 2 μL templates cDNA and 7.2 μL H2O. PCR thermocycle parameters were performed as following: 95°C for 30 s; 40 cycles of 95°C for 10 s, 60°C for 30 s, and 95°C for 15 s, 60°C for 60 s, 95°C for 15 s. The assay was set up with three biological replicates each, employing the 2−ΔΔCt method to calculate relative expression levels. The primers for qRT-PCR detections were listed in Supplementary Table S1.
18 members of HMGR gene family, designated AtaHMGR1–AtaHMGR18 including their chromosomal position, were identified in A. taliensis, and these identified family members were further analyzed for their amino acid (AA) composition, molecular weight (MW), theoretical isoelectric point (pI), aliphatic index, grand average of hydropathicity (GRAVY), instability index, subcellular localization, and other physiochemical characteristics (Supplementary Table S2). The results showed that the gene lengths among the 18 AtaHMGRs ranged from 516 bp (AtaHMGR6) to 7,017 bp (AtaHMGR10), and coding DNA sequences (CDSs) ranged from 276 bp (AtaHMGR2) to 1,722 bp (AtaHMGR8). Protein lengths ranged from 91 AAs (AtaHMGR2) to 573 AAs (AtaHMGR8) with averaging 280 AAs. Four proteins (AtaHMGR8, AtaHMGR10, AtaHMGR11, and AtaHMGR18) exceeded 500 AAs. Molecular weights ranged from 9,653.31 Da (AtaHMGR2) to 61,010.1 Da (AtaHMGR10 and AtaHMGR11), with those of AtaHMGR8, AtaHMGR10, AtaHMGR11, and AtaHMGR18 surpassing 50 kDa, indicating potential basic catalytic roles in MVA pathway with intricate cellular functions. The PI values ranged from 5.14 (AtaHMGR9) to 9.85 (AtaHMGR12), with most above 7, hinting at a predominance of basic amino acids compositions in this family. The instability index varied from 38.1 (AtaHMGR15) to 66.4 (AtaHMGR12) with proteins under 40 considered stable, while GRAVY values varied from -0.181 (AtaHMGR6) to 0.659 (AtaHMGR14), and the aliphatic index showed values between 79.77 (AtaHMGR7) and 117.73 (AtaHMGR14), with 11 proteins having an index above 90, indicative of high diversities of thermal stability as well as membrane binding abilities of AtaHMGRs. Predictive subcellular localization analyses from WoLF PSORT web showed that 5/18 AtaHMGRs were localized to the plasma membrane, 4/18 in the vascular membrane, 3/18 in the cytosol and 2/18 were located in the chloroplast (CP), endoplasmic reticulum (ER) and mitochondrion (MT) respectively suggesting the expression, location and functional diversity of AtaHMGRs.
The resulting chromosomal locations of HMGRs in A. taliensis showed that the 18 AtaHMGR genes were distributed across 8 chromosomes (Chrs) (Supplementary Figures S1, S2A). Chr05 harbors 5 genes of AtaHMGRs, accounting for 27.78%, while Chr 01, 03, and 08 each has 2 genes accounting for 33.3%, in contrast, Chr 02, 04, 06 and 07 has only a single gene each (22%). No AtaHMGR genes were located on Chr 09 and 10, while three of these genes (AtaHMGR16, AtaHMGR17 and AtaHMGR18, accounting for 16.6%) were located on contigs which were not anchored into Chrs (Supplementary Figure S1).
To elucidate the possible phylogenetic relationships and evolutionary dynamics across angiosperm species, six representative species, includes one basal angiosperm species, N. colorata, one representative dicot species, A. thaliana, and four saponin-producing monocot species (i.e., D. zingiberensis, A. setaceus, A. racemosus and A. officinalis) were selected for collinear analysis alongside A. taliensis. The results showed that A. taliensis shares only one collinear gene pair each with N. colorata and A. thaliana; however, multiple collinear gene pairs were found in steroidal saponins producing species having five orthologous gene pairs with D. zingiberensis, A. racemosus and A. officinalis respectively, but had four orthologous gene pairs with A. setaceus (Supplementary Figure S2B, Supplementary Table S3). Interestingly, A. taliensis exhibits an elevated number of synteny connections with saponins producing species indicting AtaHMGRs play roles in steroidal saponins biosynthesis and accumulation. A. taliensis maintains certain levels of collinearity with N. colorata and A. thaliana (no steroidal saponins production), possibly reflecting older divergence events before the monocot evolution. The observed synteny among such divergent angiosperm taxa suggests that some HMGR gene family members are highly conserved across extensive evolutionary events, fulfilling pivotal roles in terpenoids (e.g., cholesterol, brassinosteroids (BRs) and volatile terpenes) metabolism that have persisted through the course of angiosperm evolution. This study also showed that the orthologous gene pairs of AtaHMGR to selected species have either a one-to-many or many-to-one homology models, specifically, three AtaHMGR genes (AtaHMGR8, AtaHMGR10, and AtaHMGR11) displayed collinear associations with more orthologous gene pairs in steroidal saponins producing monocot species (Supplementary Tables S3, S4). However, the study showed no collinear relations for the remained 15 AtaHMGR genes, suggesting that these genes may have been newly duplicated after the species generation of A. taliensis. Based on the multiple gene duplication events observed in current study also suggest the closer phylogenetic ties among the examined saponins producing species in this study.
Gene repetition events in A. taliensis were further analyzed using the MCScanX tools (Wang et al., 2012). The results revealed 40 gene pairs exhibiting gene duplication during the evolutionary history (Supplementary Figure S2A, Supplementary Table S4). Eight genes (AtaHMGR1, AtaHMGR5, AtaHMGR7, AtaHMGR8, AtaHMGR10, AtaHMGR12, AtaHMGR16, and AtaHMGR17) arose from WGD/segmental duplications. The AtaHMGR11 may have resulted from proximal segmental duplication, typically involving gene duplication in neighboring chromosomal regions. In contrast, nine genes (AtaHMGR2, AtaHMGR3, AtaHMGR4, AtaHMGR6, AtaHMGR9, AtaHMGR13, AtaHMGR14, AtaHMGR15, and AtaHMGR18) underwent dispersed duplication model. The analysis of the nonsynonymous-to-synonymous substitution rate ratio (Ka/Ks) provided insights into the evolutionary dynamics and selective pressures affecting these genes. The Ka/Ks ratios, calculated by A. taliensis comparison to the HMGR orthologs in six selected species (Supplementary Table S4) were below 1, consistent with purifying selection and indicative of the evolutionary preservation of these genes.
In summary, these HMGR family member genes likely retain conservative functions across angiosperm taxa indicating that these genes keep the same ancestral roles of terpenoids synthesis even throughout long historical replication, following variations, truncked coding and even removal for environmental adaptation.
To reveal the evolutionary relationships of the HMGR proteins, a total of 30 HMGR protein sequences were used to construct a phylogenetic tree (Supplementary Table S5). The phylogenetic tree, rooted with NcHMGR1 from N.colorata, categorized the HMGR gene family into two major groups: Group I and Group II (Figure 1).Within Group I, A. taliensis HMGR members, AtaHMGR10 and AtaHMGR11, formed a distinct cluster, whereas the remaining 16 AtaHMGR genes were grouped in Group II. This distribution suggests that the HMGR gene family in A. taliensis may have undergone divergent evolutionary pathways, with AtaHMGR10 and AtaHMGR11 potentially representing a lineage distinct from the other genes. Furthermore, HMGR genes from steroidal saponins producing species (A. officinalis, A. setaceus, A. racemosus and D. zingiberensis) were distributed across both Group I and Group II. This cross-group pattern indicates that HMGR genes in these species may have experienced multiple independent evolutionary events or been influenced by varying selective pressures, contributing to the phylogenetic diversity observed within the gene family.
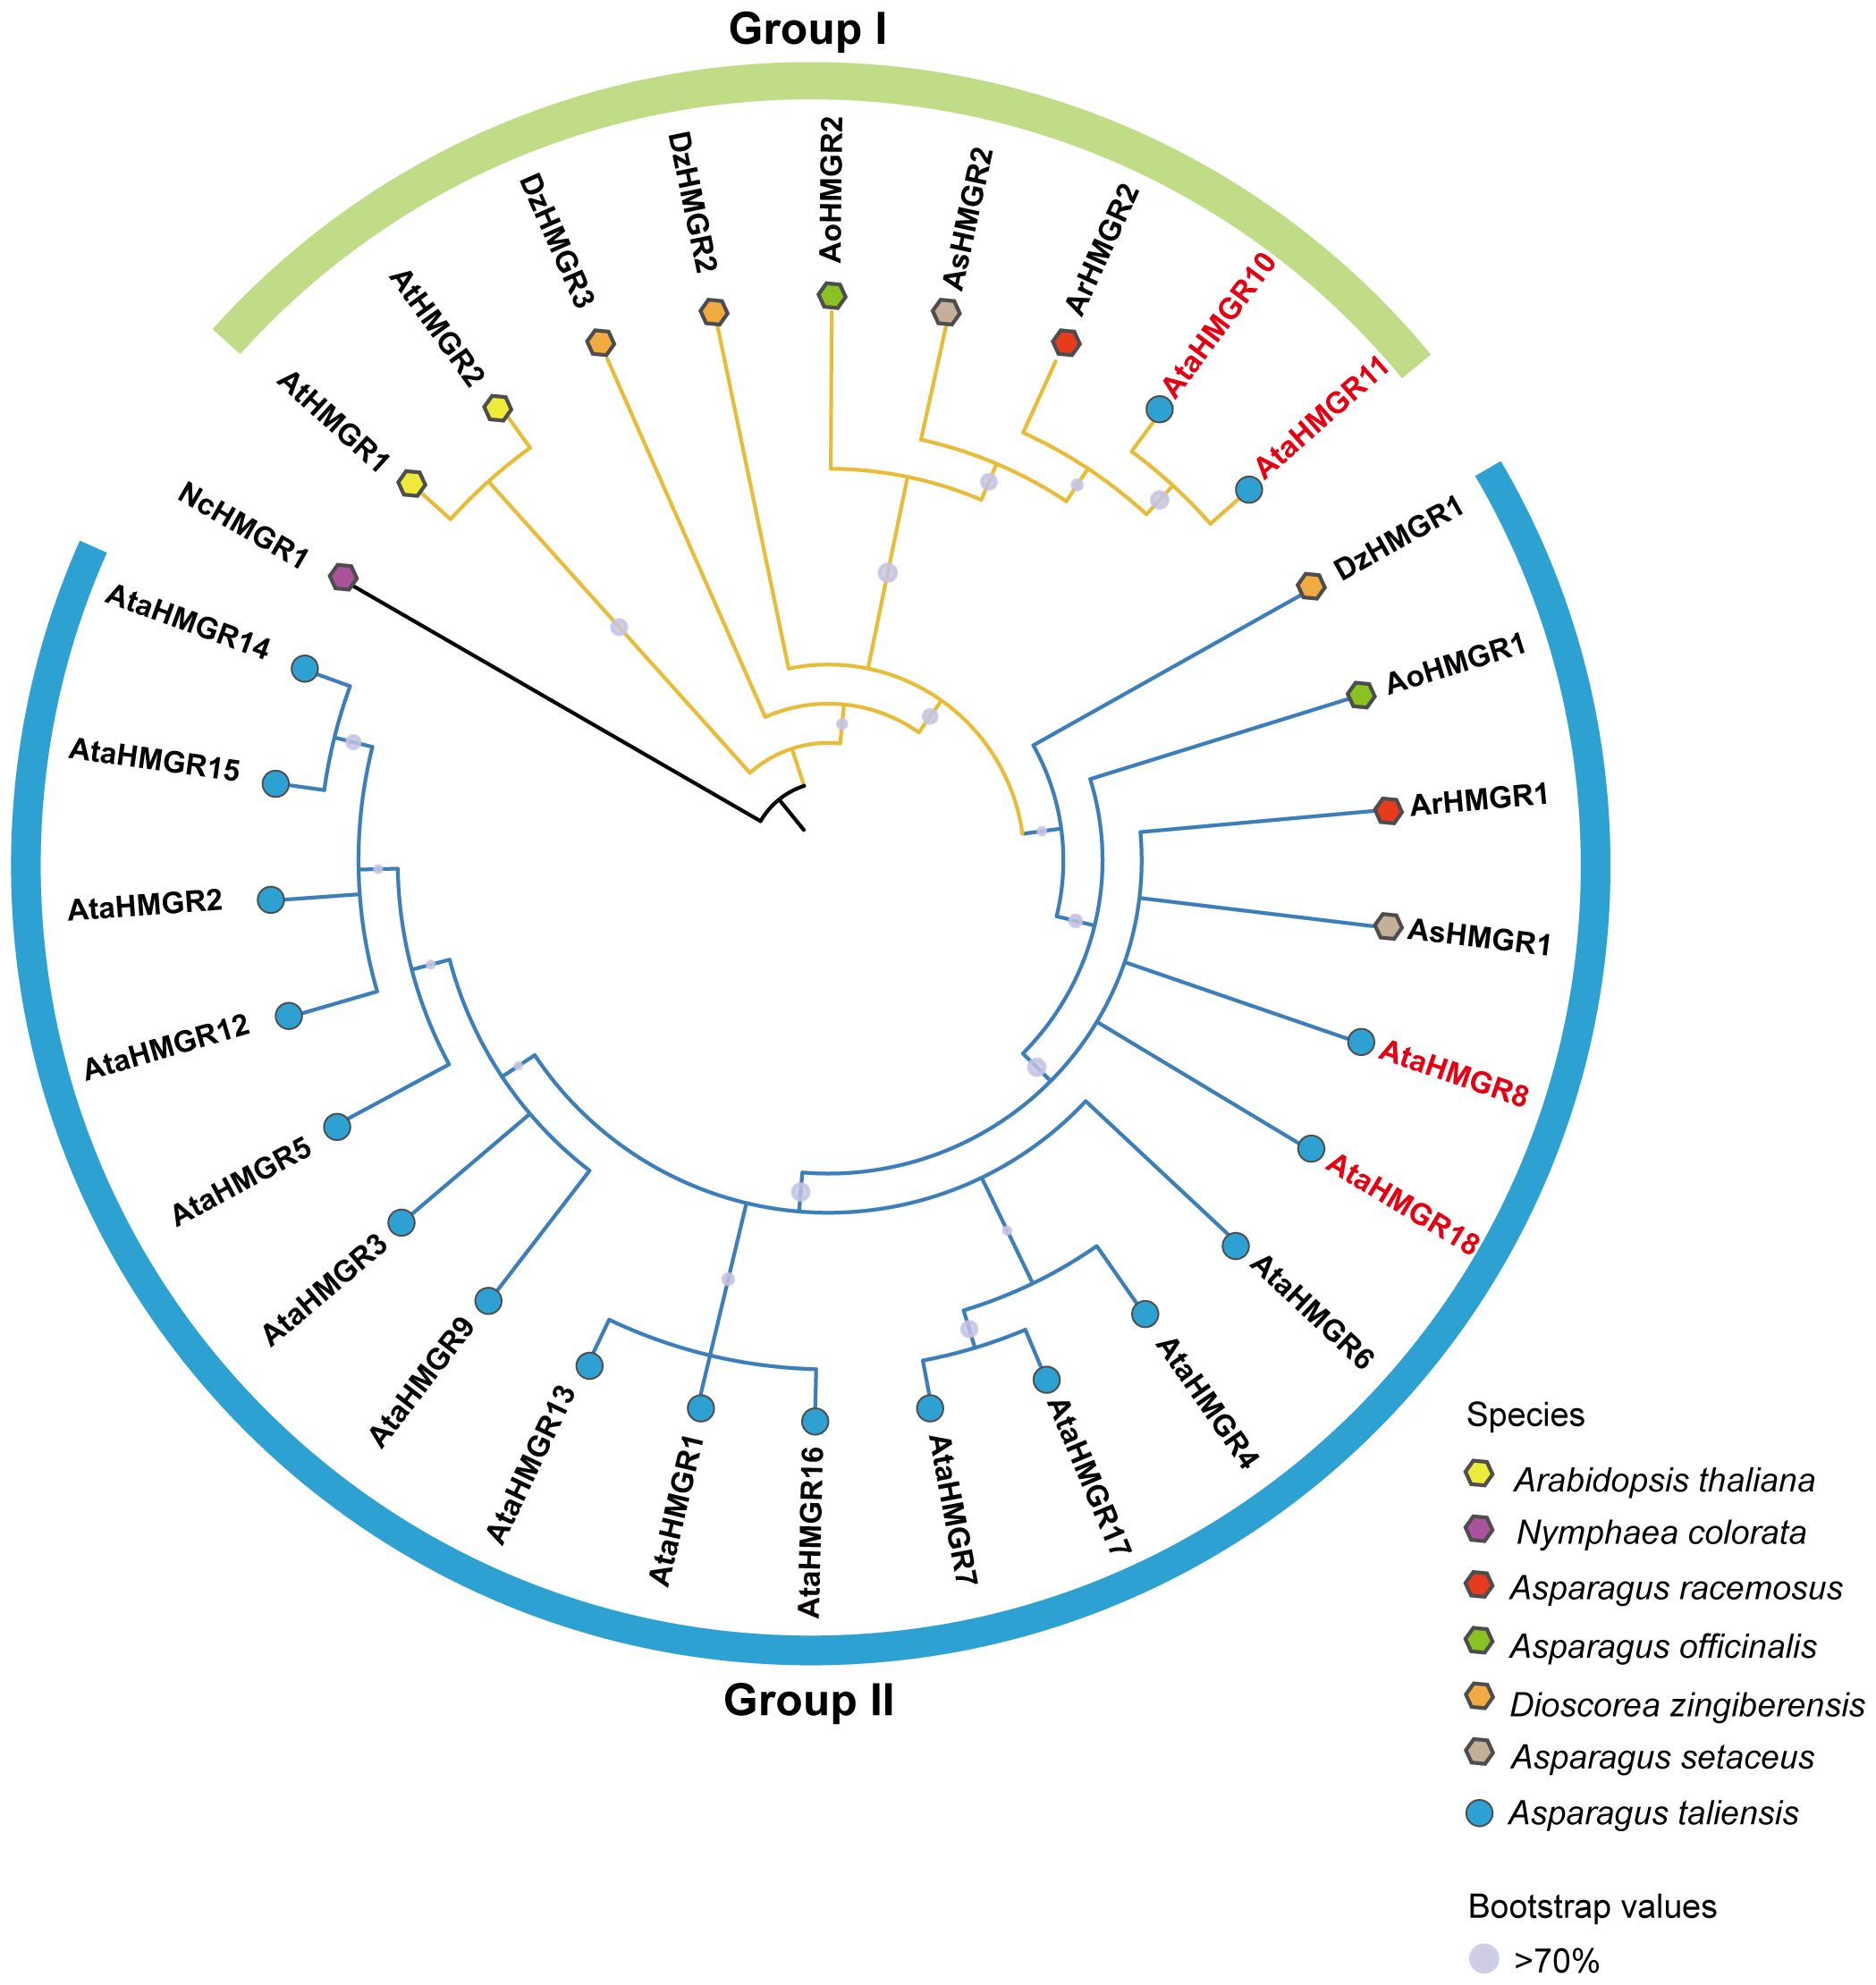
Figure 1. Phylogenetic relationship of HMGR proteins among selected plant species including: A. taliensis, A. thaliana, N. colorata, A. racemosus, A. officinalis, D. zingiberensis, and A. setaceus constructed with MEGA-X. Bootstrap confidence values are symbolized by dark dots, with values of 70 or above indicating substantial statistical support. The size of each circle is directly proportional to its bootstrap value, reflecting the relative confidence in the phylogenetic inference of each clade.
The present study delineates the structural variations of the HMGR gene family members in A. taliensis, based on the comprehensive evaluation of conserved motifs. A significant phylogenetic relationship among the 18 genes of the AtaHMGR family were discerned (Figure 2A). A total of 20 conserved motifs, labeled motifs 1–20 (Figure 2B) were identified, which are variably present across these gene coding proteins. The results also showed that 5 conserved motifs are predominantly observed: motif 1 annotated to a NAD(H)/NADP(H), named as NAD(P)H, binding site (with conserved motif DAMGMNM, same as below), motif 2 to another NAD(P)H binding site (GTVGGGT), motif 3 to a HMG-CoA binding site (EMPVGFVQLP), motif 4 to another HMG-CoA binding site (TTEGCLVA) and motif 5 to a transmembrane helix (ILAIVSLVASLIYLLSFFGIAFVQS) (Figure 2C). Interestingly, the results also showed that the motif 3 (EMPVGFVQI) differs with an individual amino acid residue where tyrosine (Y) was replaced by phenylalanine (F) in comparison with the previously reported sequence (EMPVGYVQI) (Liu et al., 2018). This variation is within the permissible range for the binding ability of HMG-CoA in AtaHMGR functionality, considering the similar biochemical properties of the substituted aromatic amino acids residues.
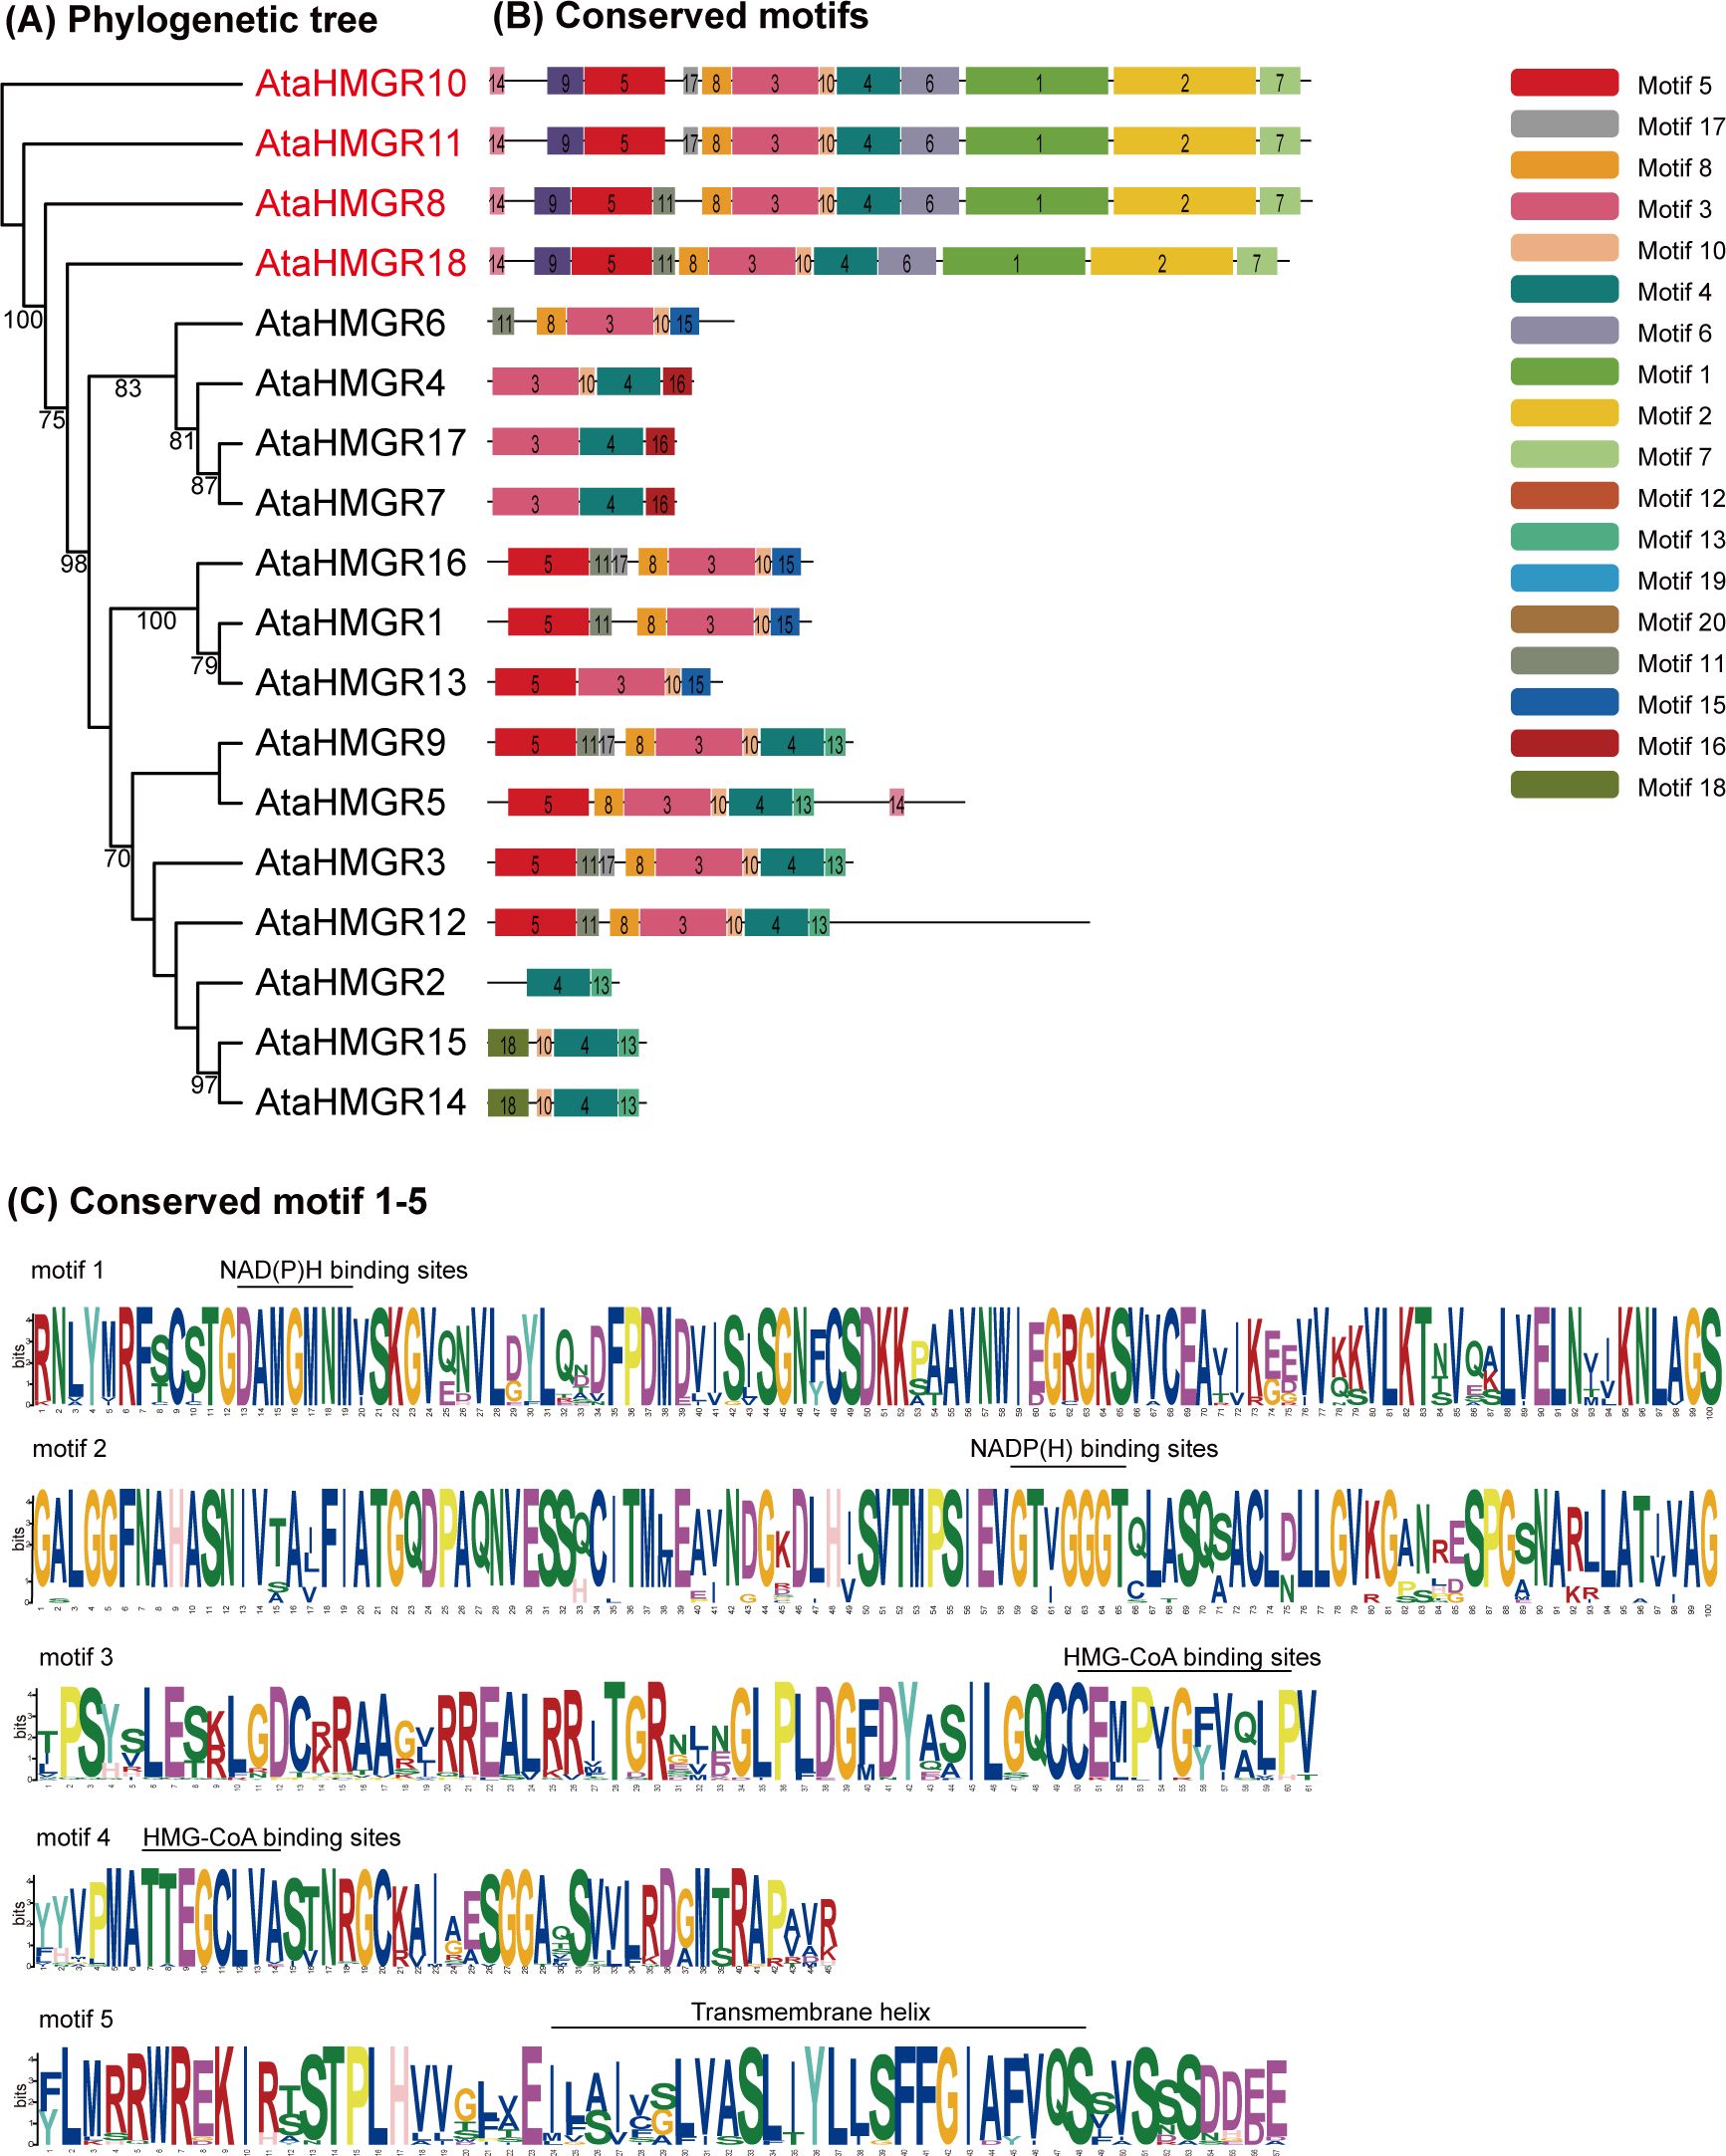
Figure 2. Phylogenetic and conserved motif analysis of HMGR members. (A) The phylogenetic tree of the 18 AtaHMGRs; (B) The distribution of the conserved motifs indicated by different colors; (C) Five conserved motif logos including a transmembrane helix, HMG-CoA binding sites and NAD(P)H binding sites.
AtaHMGR family members clustering on identical phylogenetic branches typically share motif compositions, suggesting functional conservation. The number of motifs across the A. taliensis HMGRs ranges from 2 to 12. Notably, most AtaHMGR proteins cover over 7 motifs, implying sophisticated architecture for fully functional enzymatic activities. The four genes AtaHMGR8, AtaHMGR10, AtaHMGR11, and AtaHMGR18 are distinguished by their protein structures with 12 specific motifs, which may form the core functional elements for maintained HMGR activities. The HMGRs (AtaHMGR8/10/11/18) structure includes motifs 1 through 5, may be crucial for classical HMGR enzymatic functions and other 14 genes without coding sequences of these core motifs of NAD(P)H binding indicates pseudogenes or nova functionalized coding HMGR genes due to adaptation (Figures 2, 3).
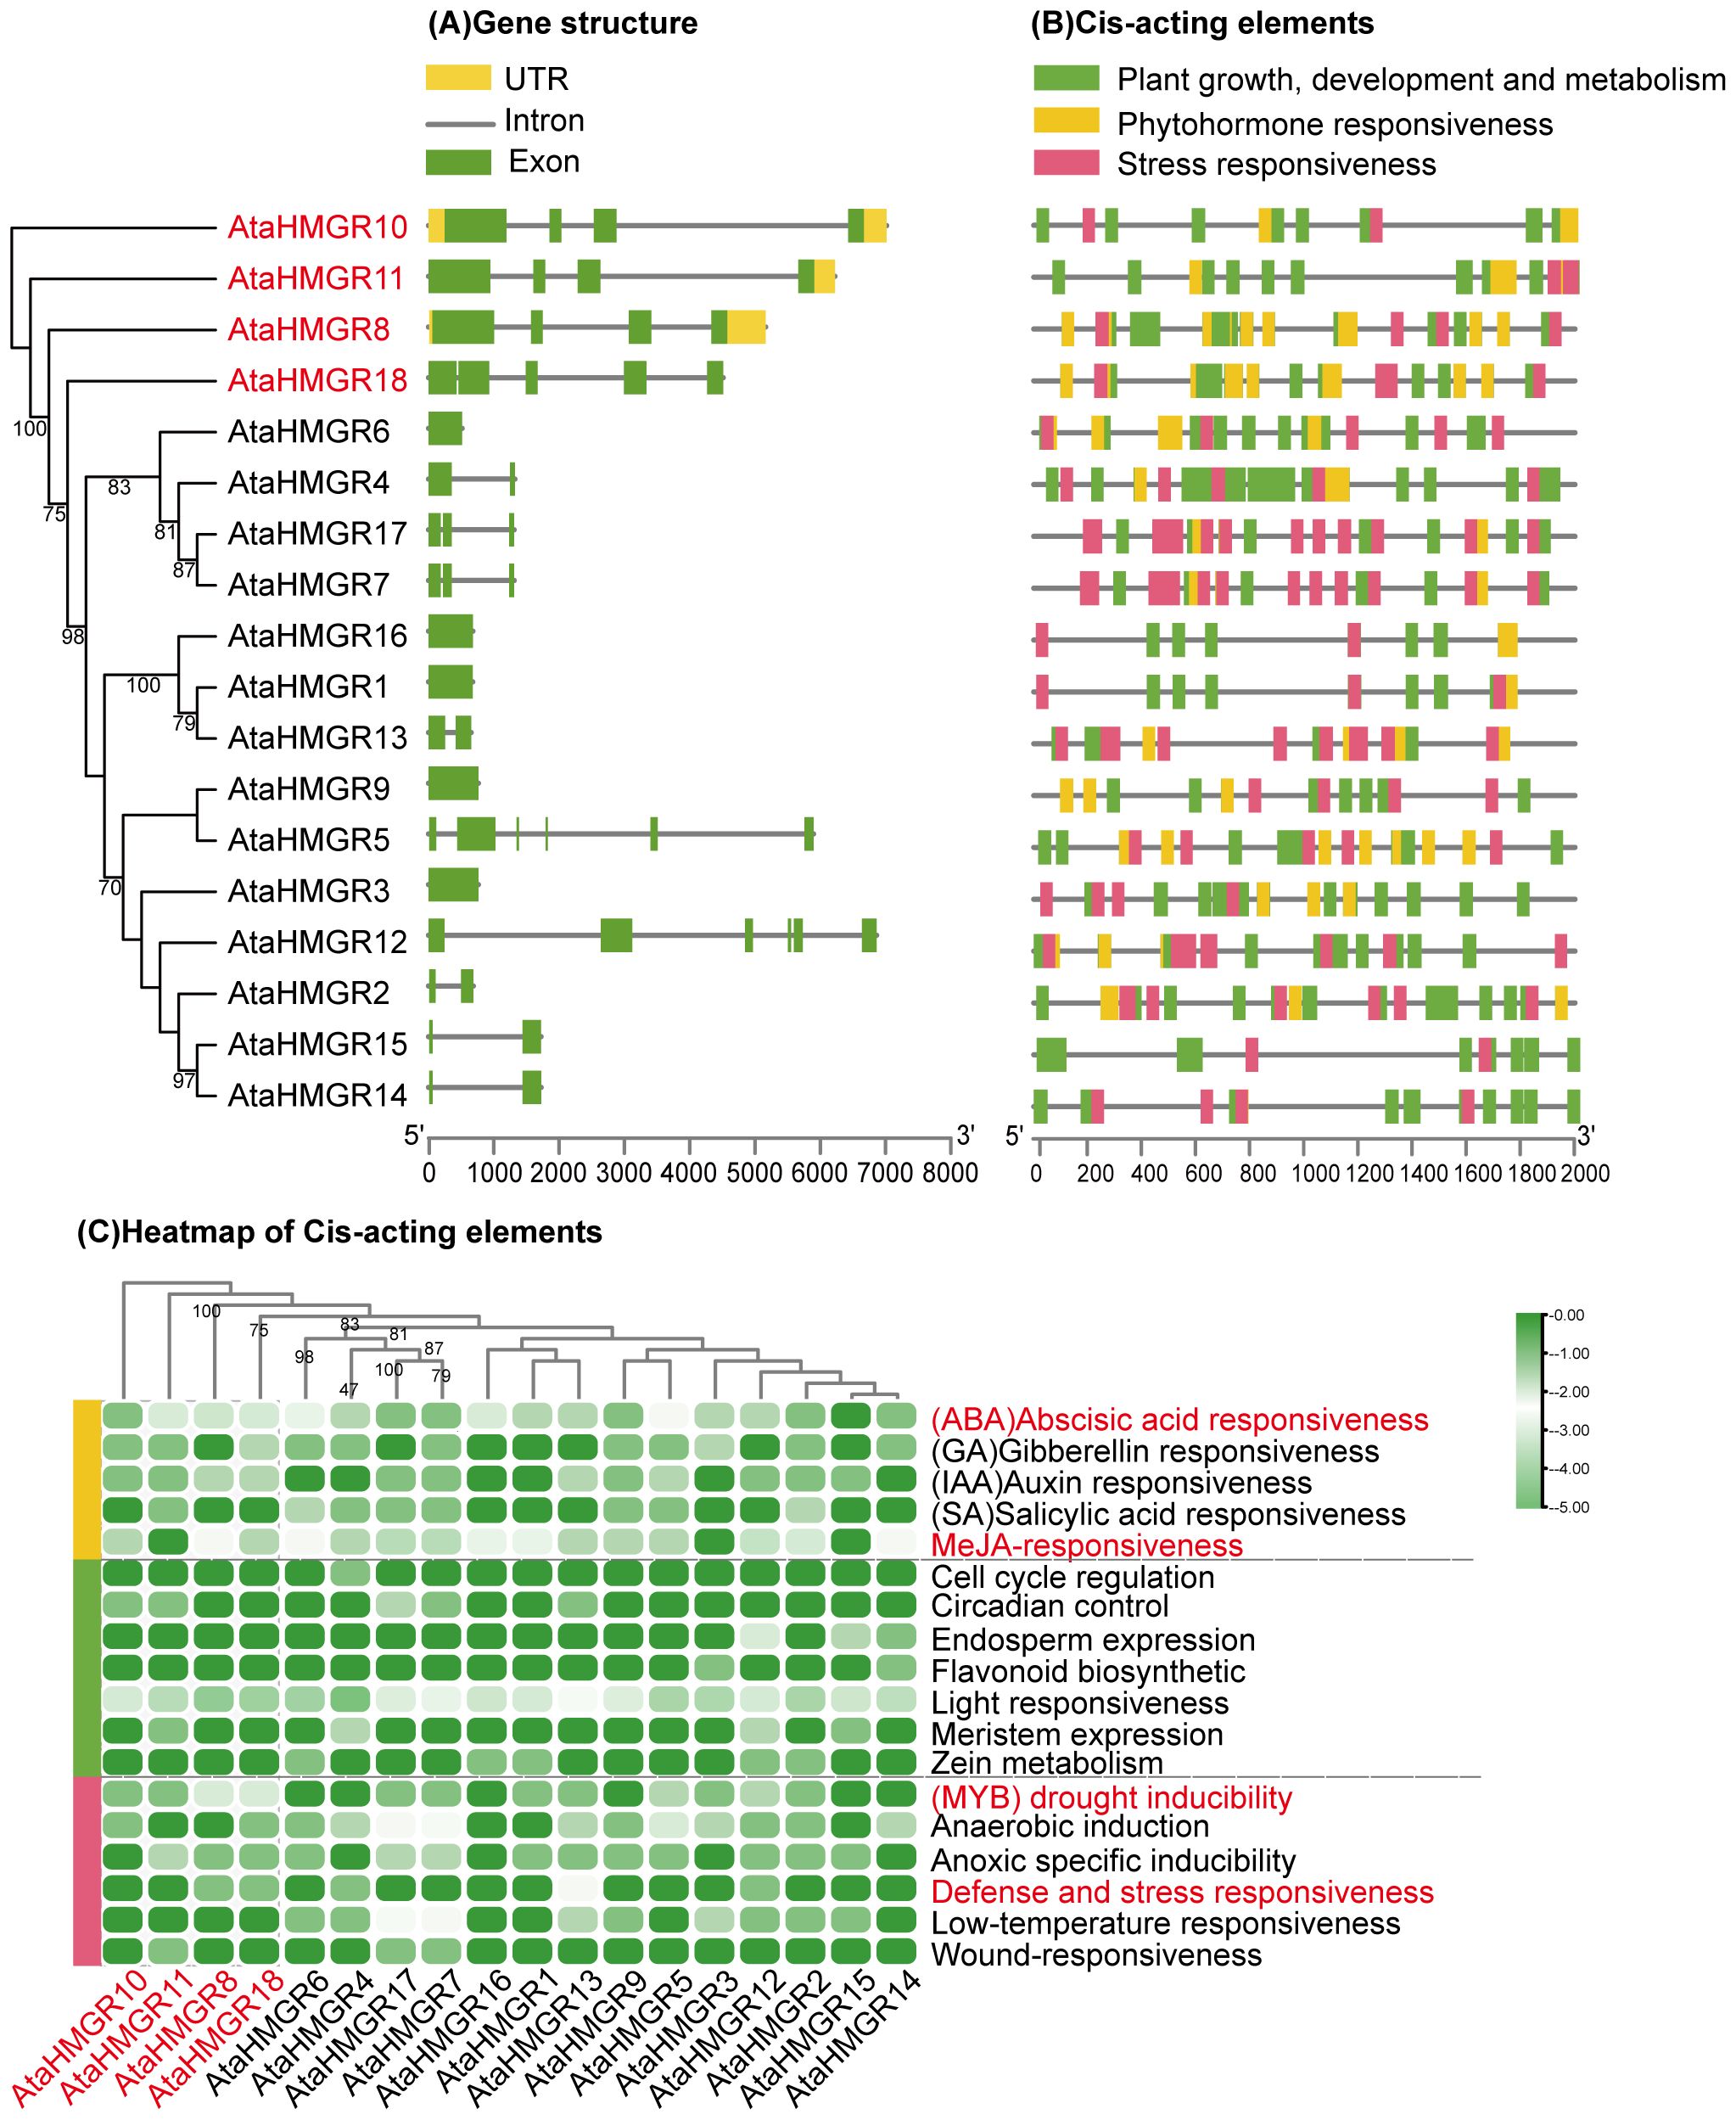
Figure 3. Gene structure and cis-regulatory elements analysis of AtaHMGRs. (A) Exon-intron structure of 18 AtaHMGRs. Green boxes indicate exons, grey lines indicate introns, and yellow boxes indicate UTRs; (B) Cis-acting element distribution patterns on 2 kb upstream promoter regions of AtaHMGRs; (C) The relative cis-element abundance heatmap of AtaHMGR gene family, each cell in the grid corresponds to the presence and quantitative abundance of specific cis-elements associated with plant growth, phytohormone, and stress responsiveness, scaled from 0 (no abundance) to 1 (maximum abundance) using TBtools software. Row scaling was applied with a zero-to-one scale method to normalize the data across all genes.
In summary, the conserved motifs in the AtaHMGR gene family serve as key structural indicators, reflecting the evolutionary lineage and metabolic specialization within A. taliensis. The variation in motif presence across the gene family highlights a diverse range of enzymatic functionalities, possibly correlating with adaptation to specific physiological factors or environmental niches.
Analysis of HMGR gene structure for exon/intron organization revealed that the number of introns per gene varied from 1 to 6, with 44.44% having three exons (Figure 3A). Generally, family members of the same group share similar exon/intron patterns, suggesting that phylogenetic relationships within gene family are highly conserved. The results showed that the AtaHMGR1, AtaHMGR3, AtaHMGR6, AtaHMGR9 and AtaHMGR16 are non-intron genes, contrasting with AtaHMGR5 and AtaHMGR12 having a higher number of exons and introns (6 exons and 5 introns respectively), suggesting these genes may represent pseudogenes or nova functionalized gene forms within this family due to DNA variation leading truncated coding without NAD(P)H binding domain(s) (Figures 2, 3). The genes with intermediate exon-intron structures, like AtaHMGR8, AtaHMGR10, AtaHMGR11, and AtaHMGR18, with 4-5 exons and 3-4 introns, might represent diversification but functional HMGRs due to evolutionary adaptations.
Cis-regulatory elements (CREs) play a pivotal role in the precise spatial and temporal regulation of gene expression. Stress-related CREs equipped plants with the abilities to swiftly adapt their physiological and metabolic status in the face of environmental stimulations, including drought, cold, salinity and extreme temperature fluctuations. Eighteen types of cis-elements were predicted from a set of 497 CREs, with phytohormone response, plant growth and development, and stress response being dominant in the promoters of AtaHMGR (Supplementary Table S6; Figure 3). The representative CREs are illustrated in Figure 3B and the results showed that AtaHMGR4 possessed the highest number of CREs, totaling 41 cis-elements, while AtaHMGR15 had the lowest ones (only 16 elements). These predicted CREs were categorized into three main groups (Figures 3B, C): (i) The first group pertains to phytohormone (166 CREs), including abscisic acid (ABA) (49, 9.86%), gibberellins (GAs) (13, 2.62%), auxin (16, 3.22%),salicylic acid (SA) (10, 2.01%), and MeJA-responsiveness (78, 15.69%). Predominantly, AtaHMGRs show significant responses to ABA and MeJA consistent with its stress tolerance roles for changes of terpenoids biosynthesis (ii) The second group is associated with plant growth, development, and metabolism (241 CREs), including light-responsive elements (215, 43.26%), circadian control (6, 1.21%), meristem expression (6, 1.21%), endosperm expression (6, 1.21%), zein (seed storage protein) metabolism (5, 1.01%), flavonoid biosynthesis (2, 0.4%), and cell cycle regulation (1, 0.2%). (iii)The third group focuses on stress responsiveness (90 CREs), with categories such as anaerobic induction (26, 5.23%), low-temperature responsiveness (19, 3.82%), MYB related drought inducibility (18, 3.62%), anoxic specific inducibility (16, 3.22%), defense and stress responsiveness (8, 1.61%), and wound responsiveness (3, 0.6%). The CREs for anaerobic induction are notably prevalent, followed by low-temperature responsiveness, MYB related drought inducibility, and anoxic-specific inducibility.
The analysis of the secondary structures revealed that the 18 AtaHMGR proteins had α-helices, extended chains, random coils, and β-turns (Supplementary Table S7). The secondary structures of AtaHMGRs were categorized into three groups based on their predominant structural components: (i) Group I, including ten proteins (AtaHMGR1, AtaHMGR4, AtaHMGR7, AtaHMGR8, AtaHMGR9, AtaHMGR10, AtaHMGR11, AtaHMGR16, AtaHMGR17 and AtaHMGR18), were dominated by α-helices compositions, followed by random coils, extended strands, and β-turns, (ii) Group II contained six proteins (AtaHMGR2, AtaHMGR3, AtaHMGR5, AtaHMGR6, AtaHMGR12 and AtaHMGR13), with random coils being the most significant feature, followed by the α-helices, extended strands, and β-turns, (iii) Group III comprised of two proteins (AtaHMGR14 and AtaHMGR15) which were characterized by extended strands as the predominant element, followed by random coils, β-turns and α-helices. The 3D structures of the related AtaHMGR proteins were generated using online modeling described in the method and materials (Figure 4; Supplementary Figure S3). Each model was assessed for its quality and reliability based on parameters such as GMQE scores and sequence identity percentages, ensuring the accuracy of predictions. The structural analysis revealed AtaHMGR8, AtaHMGR10, AtaHMGR11, and AtaHMGR18, which were grouped together based on phylogenetic analyses (Figure 2), showed similar folding patterns and 3D structures likely reflecting their conserved catalytic functions during the evolution. Similarly, AtaHMGR14 & AtaHMGR15 as well as AtaHMGR1, AtaHMGR3 & AtaHMGR16, exhibited similar 3D structural folding.
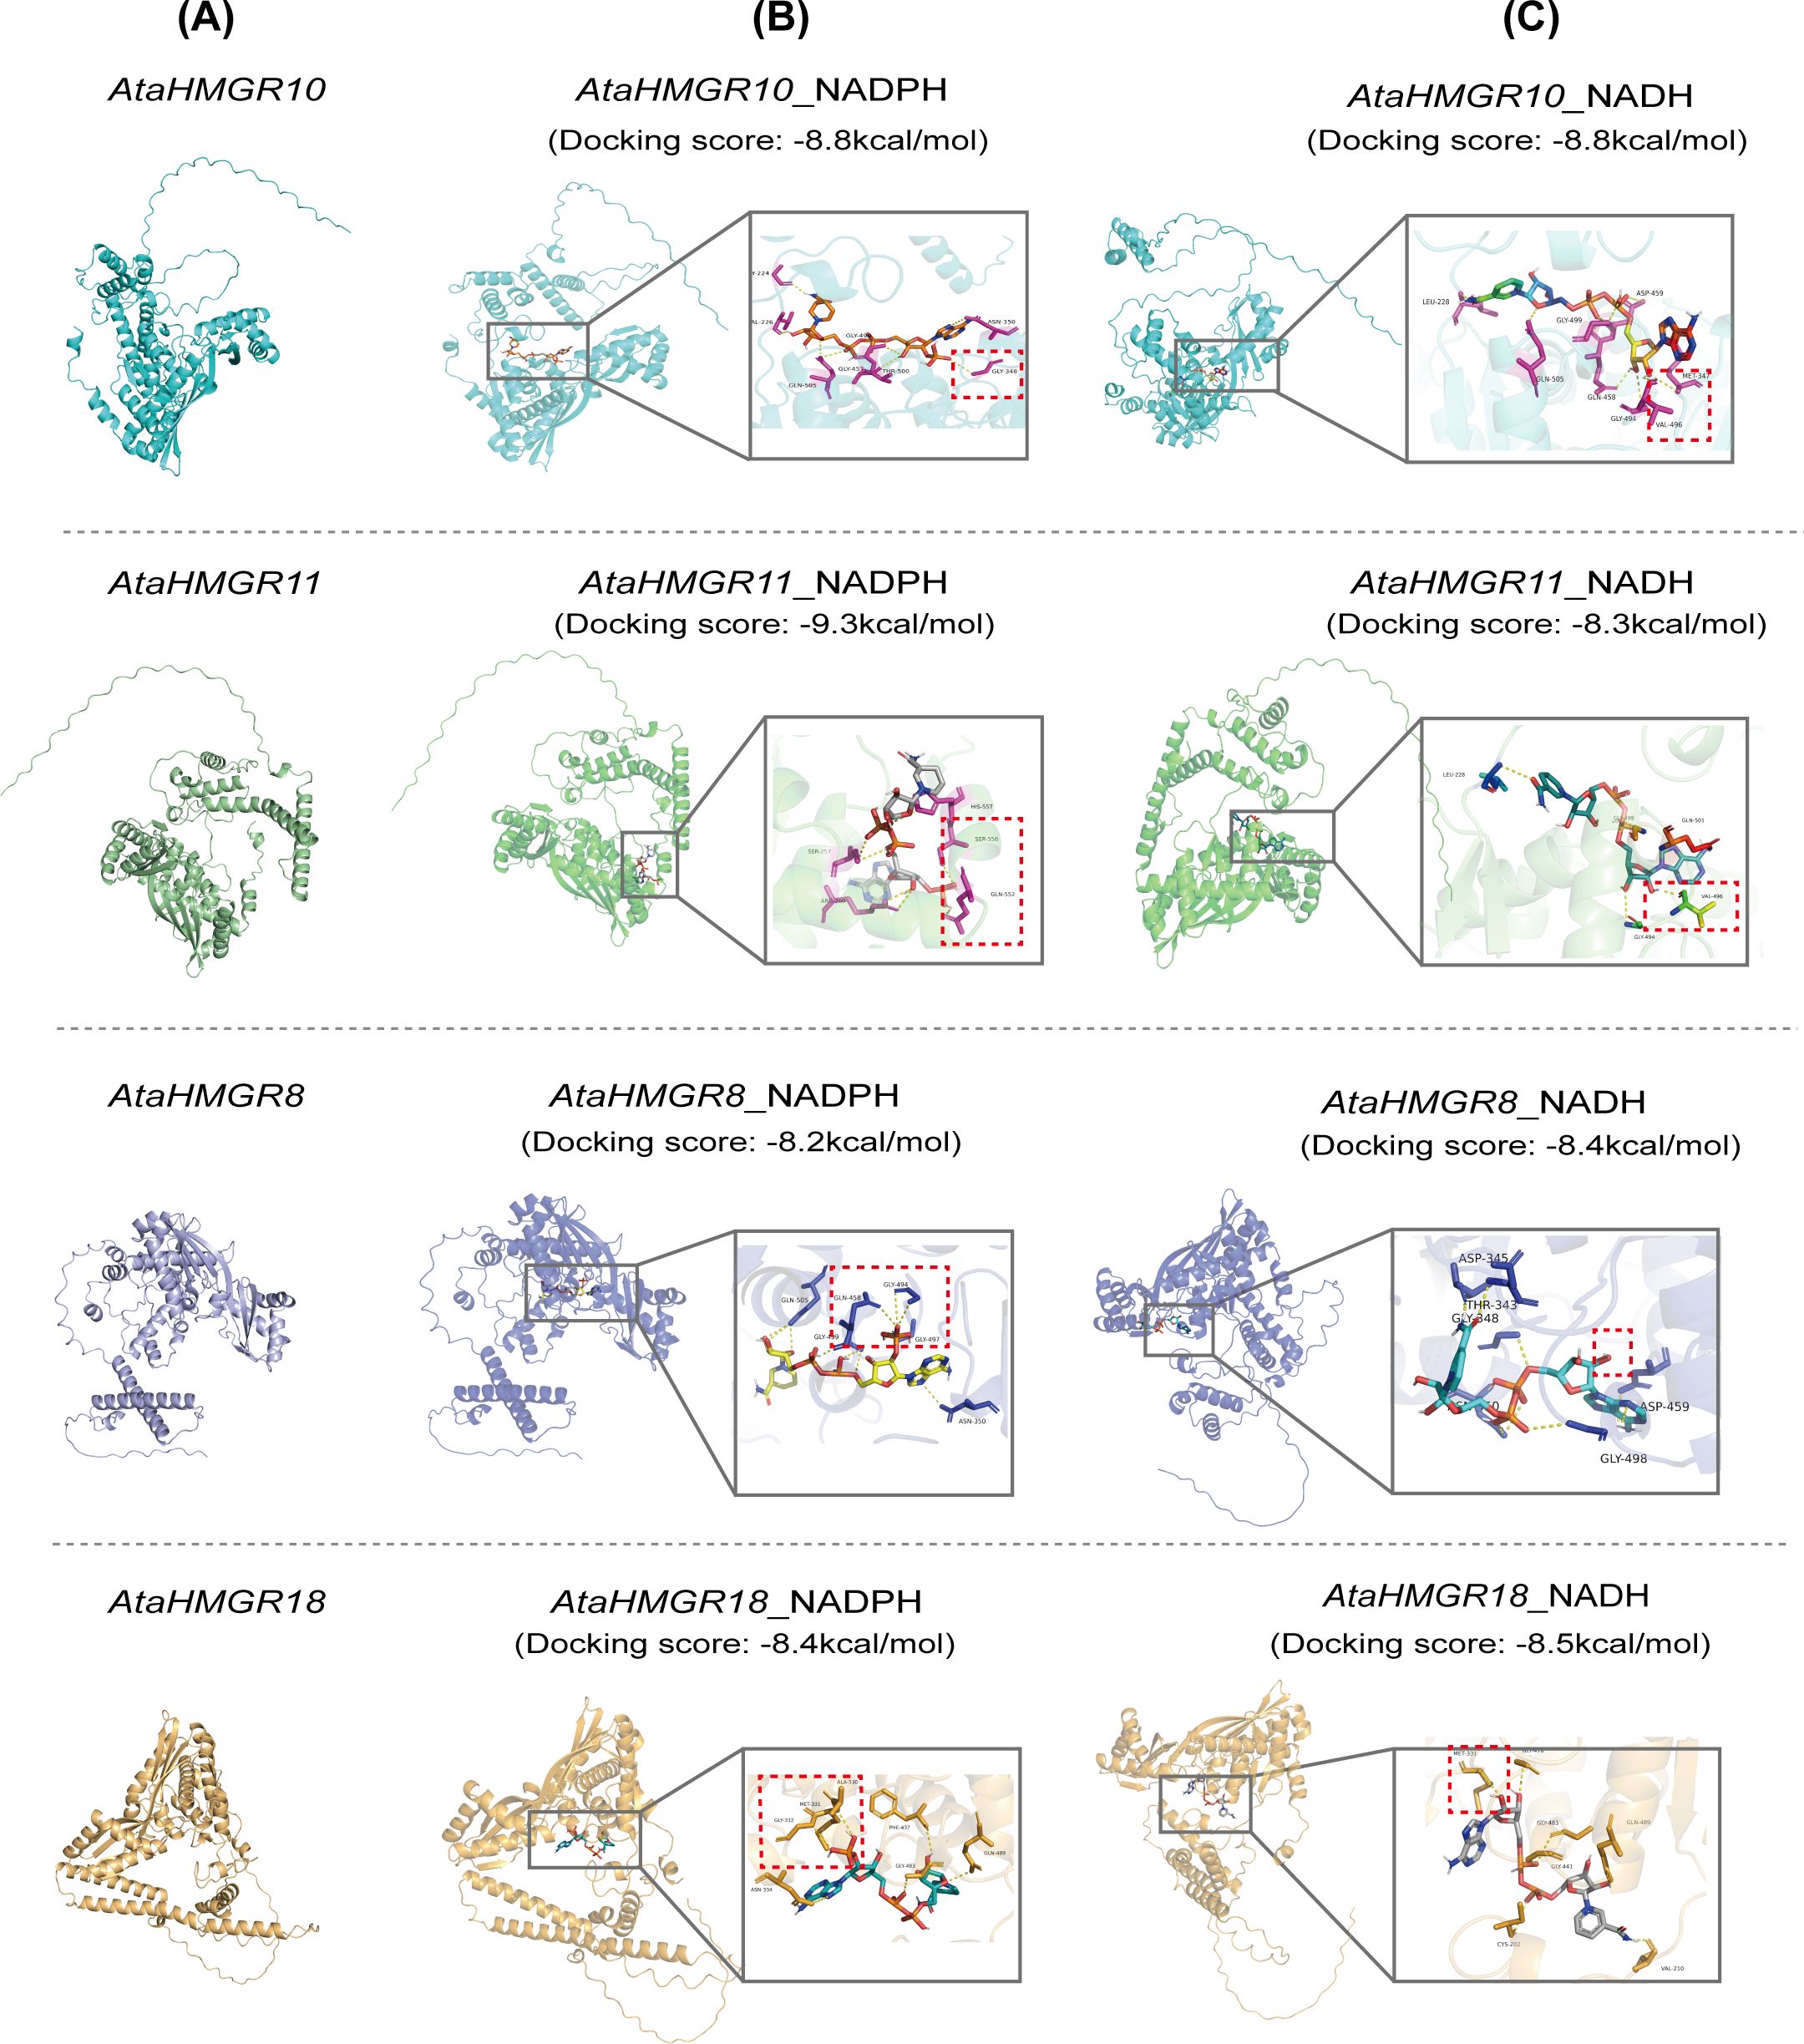
Figure 4. Molecular docking analysis of AtaHMGR proteins with substrates NADPH and NADH. (A) The 3D structures of four AtaHMGR proteins (AtaHMGR10, AtaHMGR11, AtaHMGR8, and AtaHMGR18) are shown. (B) Molecular docking results of AtaHMGR/10/11/8/18 with NADPH. (C) Molecular docking results of AtaHMGR10/10/11/8/18 with NADH. The key interaction sites in (B, C) are indicated by red dashed boxes.
Further the analyses of docking of NADH, NAD, NADPH, and NADP to AtaHMGR8/10/11/18, containing NAD(P)H binding motifs (Figure 4) respectively by AlphaFold3, and the results showed that AtaHMGR8 and HMGR18 preferred NADH, but AtaHMGR11 preferred NADPH, while both AtaHMGR10 did not distinguished NADH and NADPH as reducing agents for catalyzing MVA conversion indicating by its docking scores (the values of reduced free energy after their binding) (Figure 4; Supplementary Table S8). This comprehensive prediction of 3D structure and NADP(H) docking prediction enhances our understanding of the functional dynamics within the HMGR family of A. taliensis and lays the groundwork for future empirical studies aimed at elucidating the biochemical properties and interaction networks and possible evolutional events of these proteins.
RNAseq data were utilized to investigate the expression patterns of AtaHMGR genes in various organs (i.e., roots, stems, and leaves) of two-year-old A. taliensis plants grown in the field, as well as in four-month-old seedlings subjected to MeJA treatment in pots. These expression changes were analyzed to infer the potential biological functions of AtaHMGR genes. The detailed expression levels of each gene in different tissues and under MeJA treatments are summarized in Supplementary Table S9. The AtaHMGR gene family showed varied expressional patterns in response to MeJA, as well as the changed expressions in Rs, Ss and Fs, potentially reflecting the plant’s adaptive mechanisms to environmental stimulations resulting in changes of terpenoids biosynthesis and accumulation. Cluster analysis categorized the tissue-specific expression characteristics of AtaHMGR genes into two principal patterns (Figure 5). Cluster I included four genes: AtaHMGR8, AtaHMGR10, AtaHMGR11, and AtaHMGR18. These genes generally exhibited high and widespread expression during different stages of MeJA treatments, with the highest expression levels observed in flowers (Fs). However, their expression in roots (Rs) and stems (Ss) was significantly lower, suggesting a predominant role of these genes in floral tissues. Among them, AtaHMGR10 and AtaHMGR11 showed elevated expression in seedlings at 48 and 60 hours post-MeJA treatments, while AtaHMGR8 and AtaHMGR18 displayed slightly higher expression levels compared to AtaHMGR10 and AtaHMGR11 under similar conditions. These findings imply that AtaHMGR8 and AtaHMGR18 may play more significant roles in MeJA-mediated responses. Cluster II comprised of 14 genes that manifested minimal or no expression under both normal and MeJA inducing conditions, indicating these genes might be pseudogenes or expressed under specific, untested conditions.
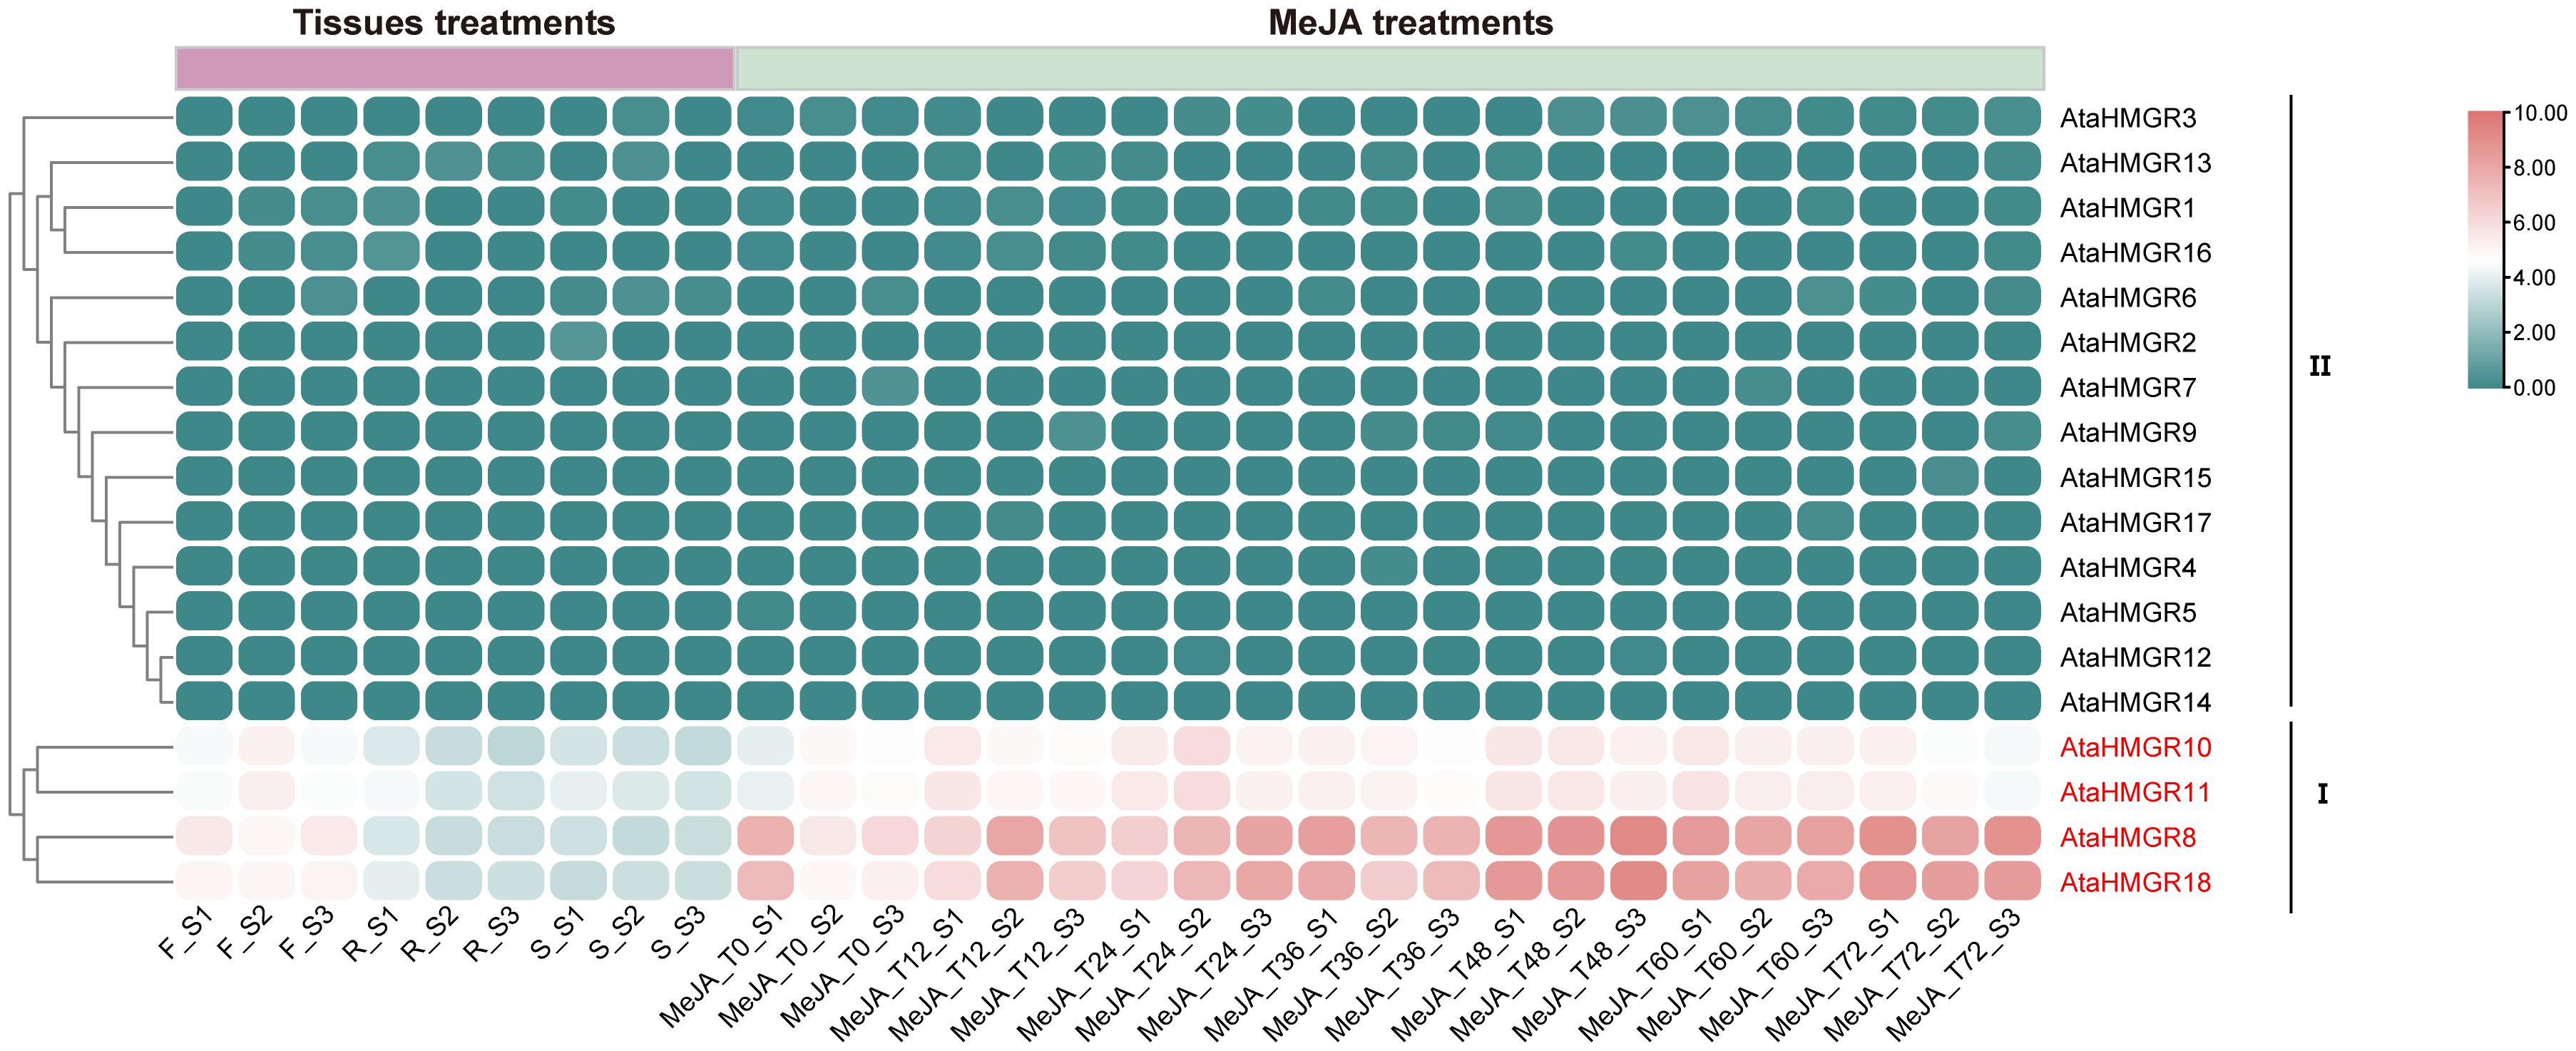
Figure 5. Expression profiles of AtaHMGR genes in different tissues and under MeJA treatments. F, flowering twigs; R, roots; S, stems. Time points T0, T12, T24, T36, T48, T60, and T72 indicate the treatment durations of A. taliensis plants with MeJA for 0, 12, 24, 36, 48, 60, and 72 hours, respectively.
Bioinformatic analyses revealed an abundance of stress-associated cis-regulatory elements (CREs) in the AtaHMGR family members (Figure 3), indicative of their potential role in mediating plant stress responses. Distinct expression profiles of AtaHMGR genes were observed across various tissues and MeJA treatments; AtaHMGR8, AtaHMGR10, AtaHMGR11, and AtaHMGR18 showed the highest expression levels, in contrast to the minimal or undetectable expression of the other members (Figure 5). Additionally, considering the gene structure, conserved motifs, linear analysis, and protein structure of the HMGR genes, AtaHMGR10 was first chosen as a representative for comprehensive functional analyses. Transgenic A. thaliana plants expressing AtaHMGR10 were generated. We selected two T2-generation of AtaHMGR10-overexpression (OE) lines (OE-1 and OE-3) with homozygous AtaHMGR10 for subsequent analyses. To further investigate AtaHMGR10 expression in these lines, we used qRT-PCR to examine the expression levels in the transgenic A. thaliana plants, and the results showed that AtaHMGR10 in AtaHMGR10 transgenic (OEs) lines had higher expression levels (Supplementary Figure S4).
To ascertain the subcellular positioning of AtaHMGR10, the CDS were engineered to be fused upstream with the green fluorescent protein (GFP) in the plant expression vector. This recombinant fusion gene was transiently expressed in the protoplasts of tobacco leaves (Figure 6). The results showed that AtaHMGR10 is predominant located in the endomembrane system, indicating a vital role in intracellular signaling and terpenoids precursors biosynthesis [e.g. cholesterol, stress related volatile terpenes as well as phytohormones (e.g. BRs, GAs and, ABA)].
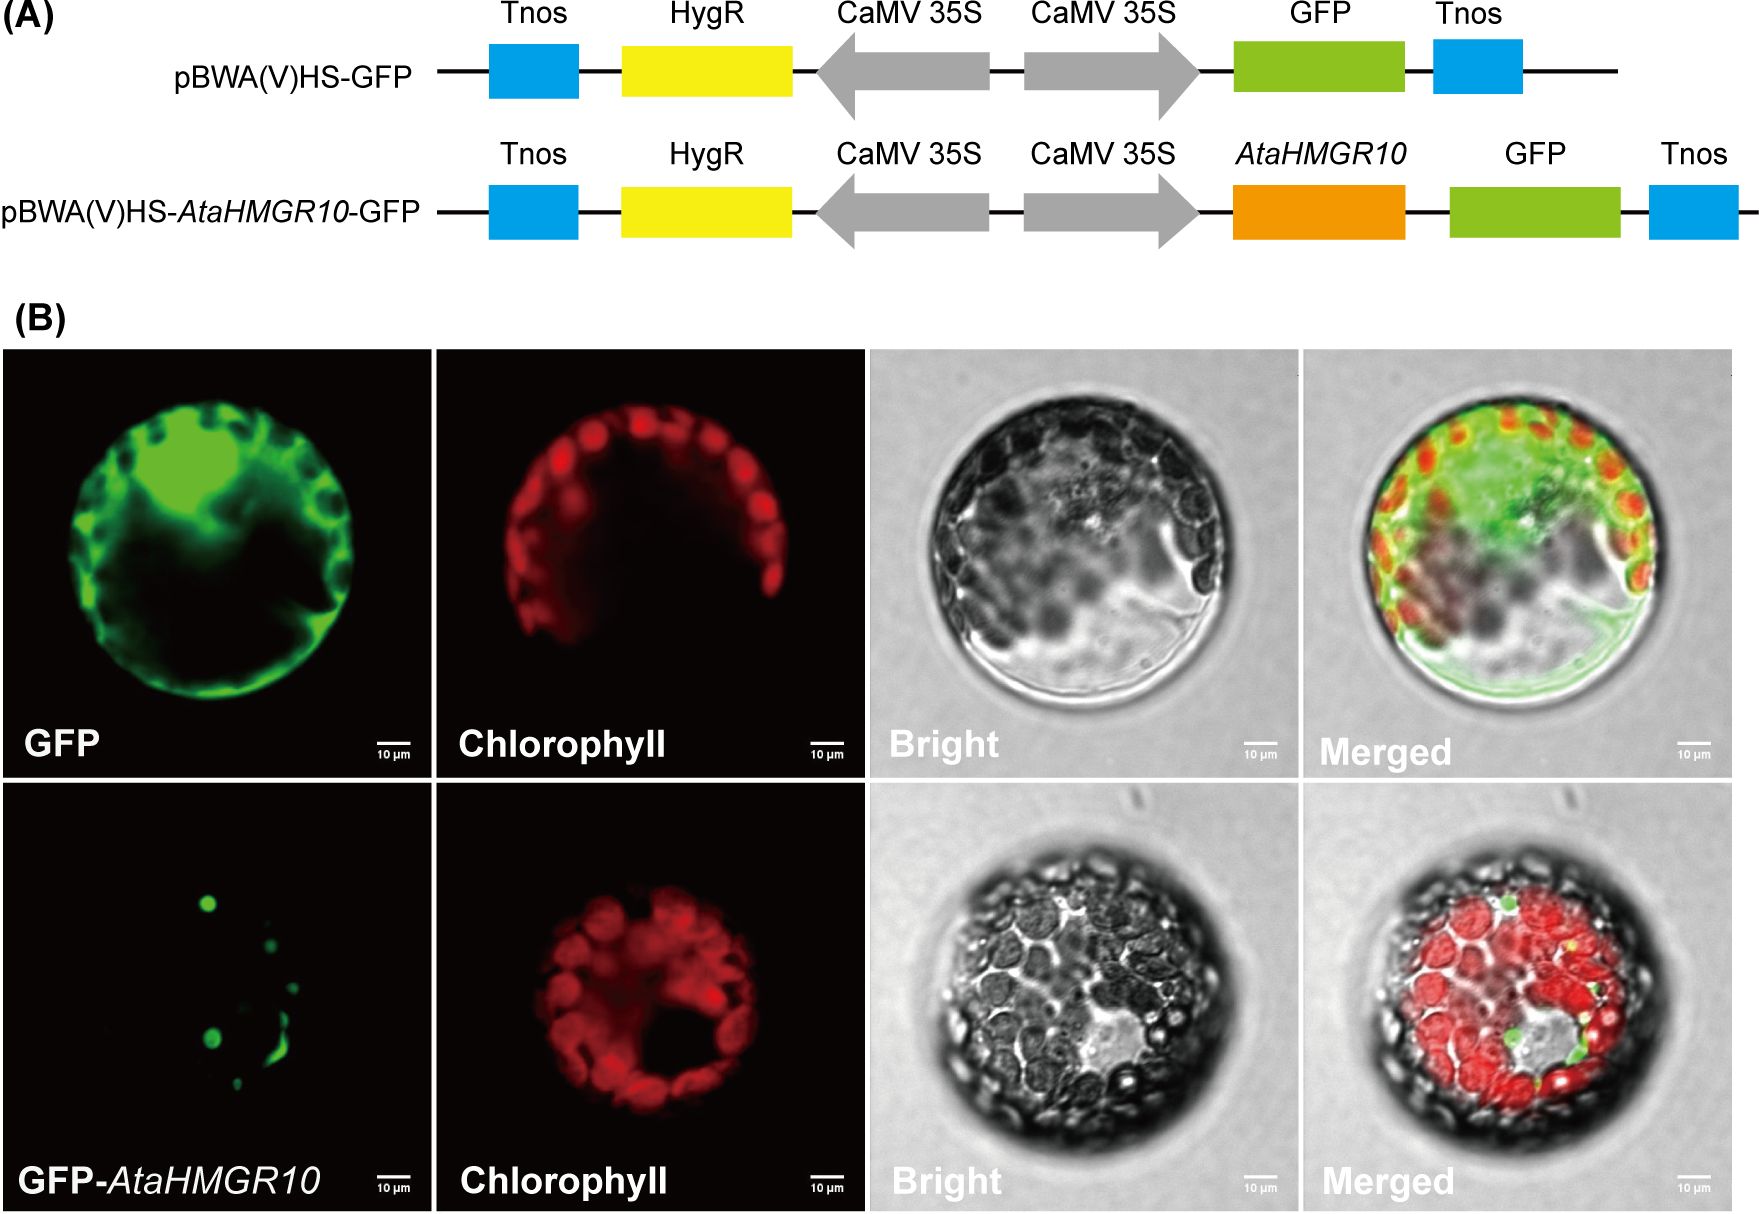
Figure 6. Subcellular localization of AtaHMGR10 in tobacco protoplasts. (A) Vectors for transient expression were created by cloning the full-length coding sequence (CDS) of AtaHMGR10 into the pBWA(V)HS vector. (B) Tobacco leaf protoplasts transfected with either green fluorescent protein (GFP)-AtaHMGR10 fusion or GFP alone using the polyethylene glycol method. Green fluorescence indicates GFP signals; red indicates chlorophyll autofluorescence; and gray represents the bright field image. Merged images illustrate the overlay of all three channels. Scale bar = 10 μm.
To investigate whether AtaHMGR10 overexpression enhanced stress tolerance in A. thaliana plants, seeds of both WT and transgenic lines with homozygotes AtaHMGR10 (OE-1, OE-3 of T2 generation) were cultured on 1/2 MS media, with separate sets receiving either 50 mM NaCl or 10% PEG 6000 as simulations of stress treatments (Figure 7). Germination rates and phenotypic observations were recorded after 9 days. The germination rates of transgenic lines (OE-1 and OE-3) were significantly higher than WT under 1/2 MS medium with salt and osmotic stress treatments respectively (Figure 7D). Under osmotic stress, the primary root length of transgenic plants was longer than that of WT (Figures 7A, B, E). This indicates that heterologous expression of AtaHMGR10 improves the stress tolerance in Arabidopsis plants with root growth promotion. There was no significant difference in the primary root length between WT and transgenic plants when grown on 1/2 MS medium under salt stress (50 mM NaCl) conditions (Figures 7A, C, E). This suggests that the transgenic plants may not exhibit marked difference from WT on normal growth conditions and low salt stress with 50 mM NaCl simulation.
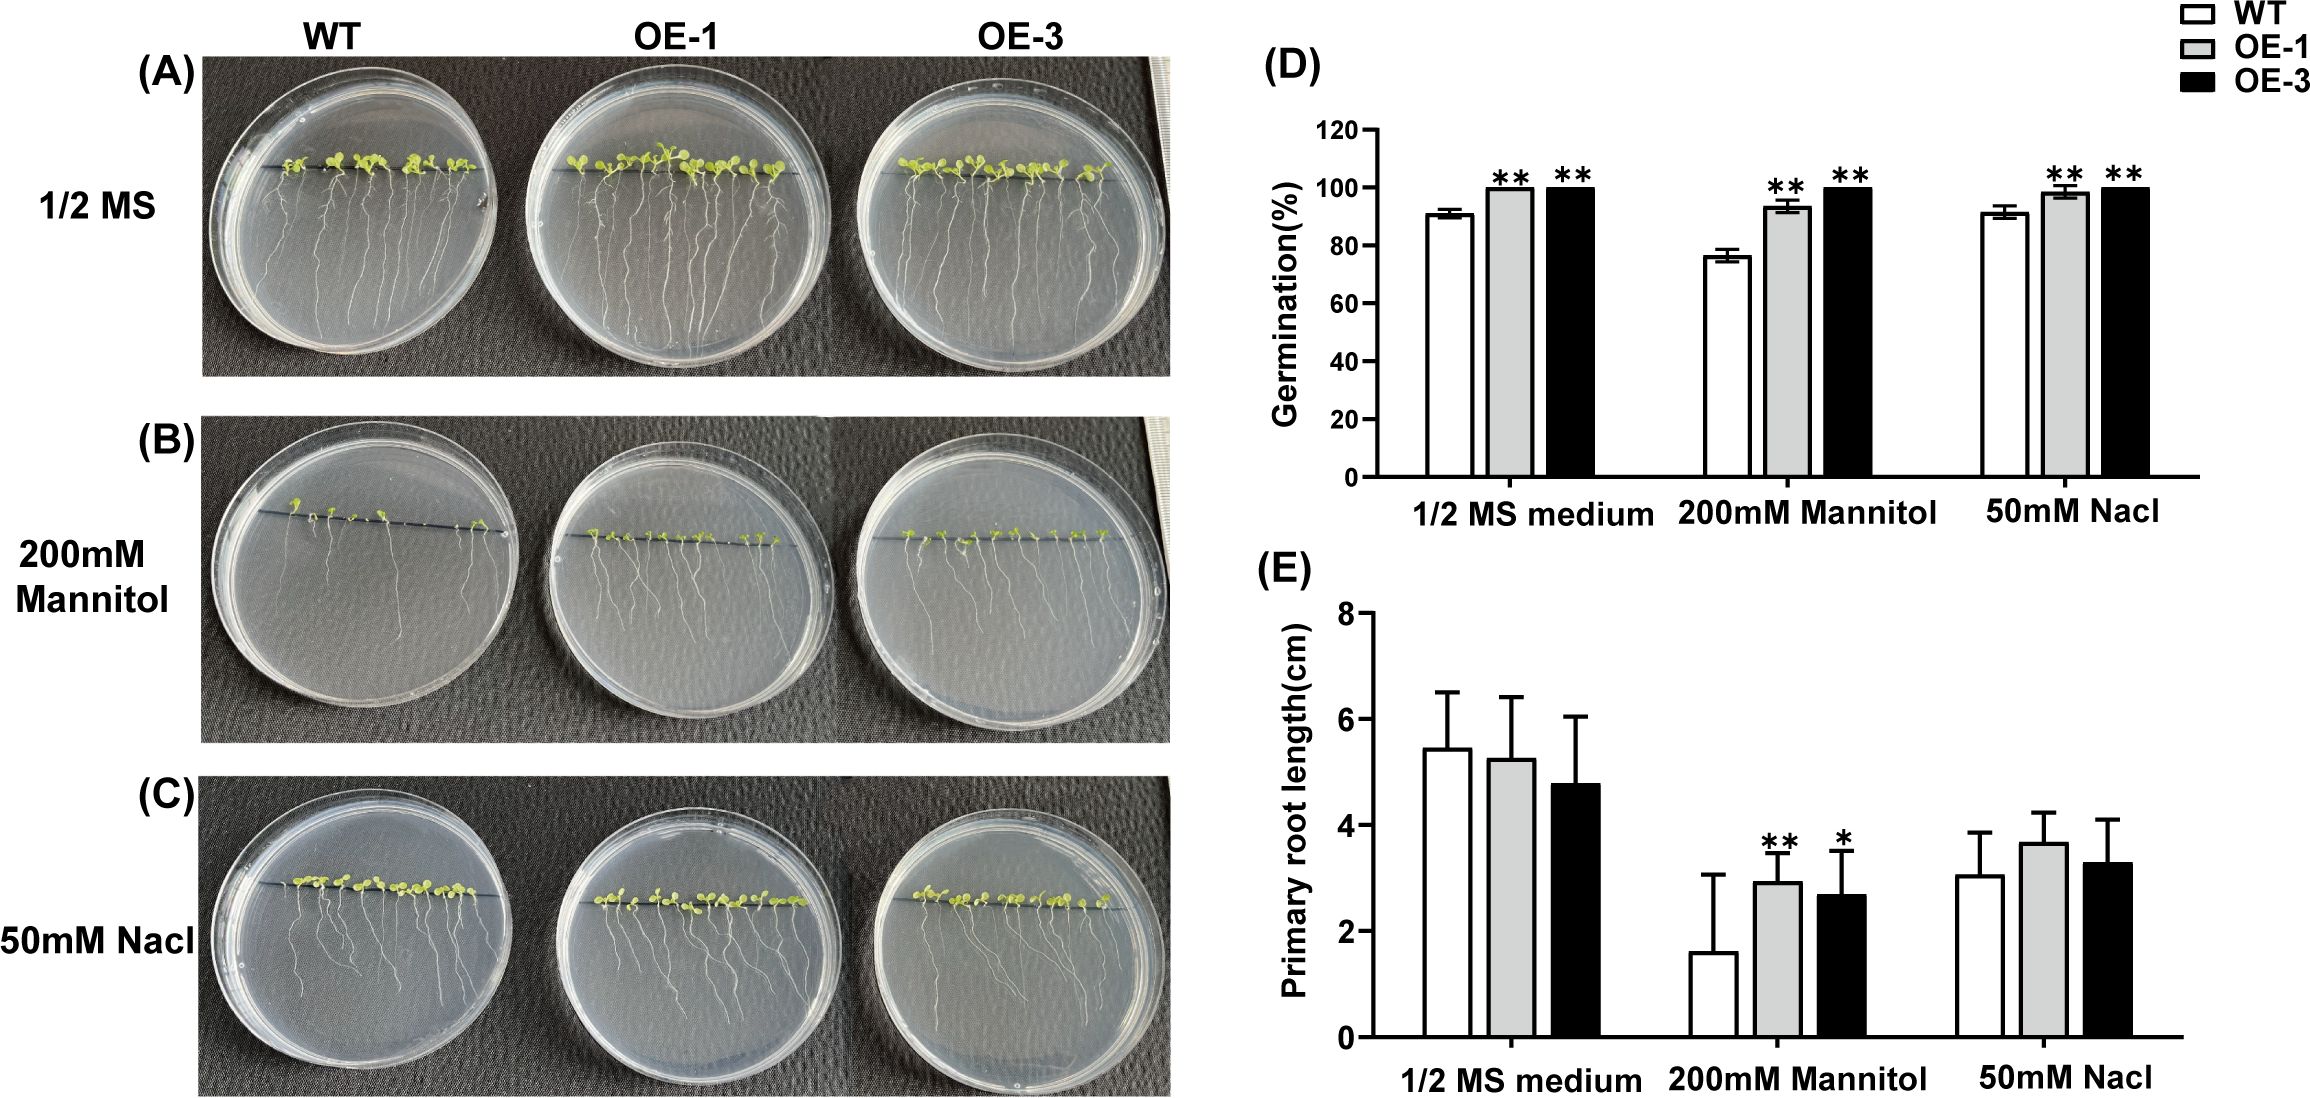
Figure 7. Germination rate and root length comparison of Arabidopsis seedlings under 1/2 MS medium, 200 mM mannitol, and 50 mM NaCl. (A–C) Phenotypes of Arabidopsis seedlings; (D) Germination rate in percentages (%); (E) Primary root length comparison of Arabidopsis seedlings under the above-mentioned conditions. *p < 0.05, **p < 0.01.
To further explore the impacts of AtaHMGR10 overexpression on stress tolerance, 6-weeks WT, OE-1 and OE-3 lines were subjected to drought treatment for 0, 5, and 10 days, followed by re-watering for 6 days. Subsequently, the phenotypes of the plants were observed and the collected leaf samples were used to measure the relevant stress related physiological indicators. No observable differences were found in the growth status between WT and transgenic plants under normal growth conditions. However, after 10 days of drought treatment, WT plants exhibited more severe wilting and chlorosis as compared with the OE plants (Figure 8A). After 6 days with re-watering, majority of the WT plants died, whereas the transgenic plants gradually recovered.
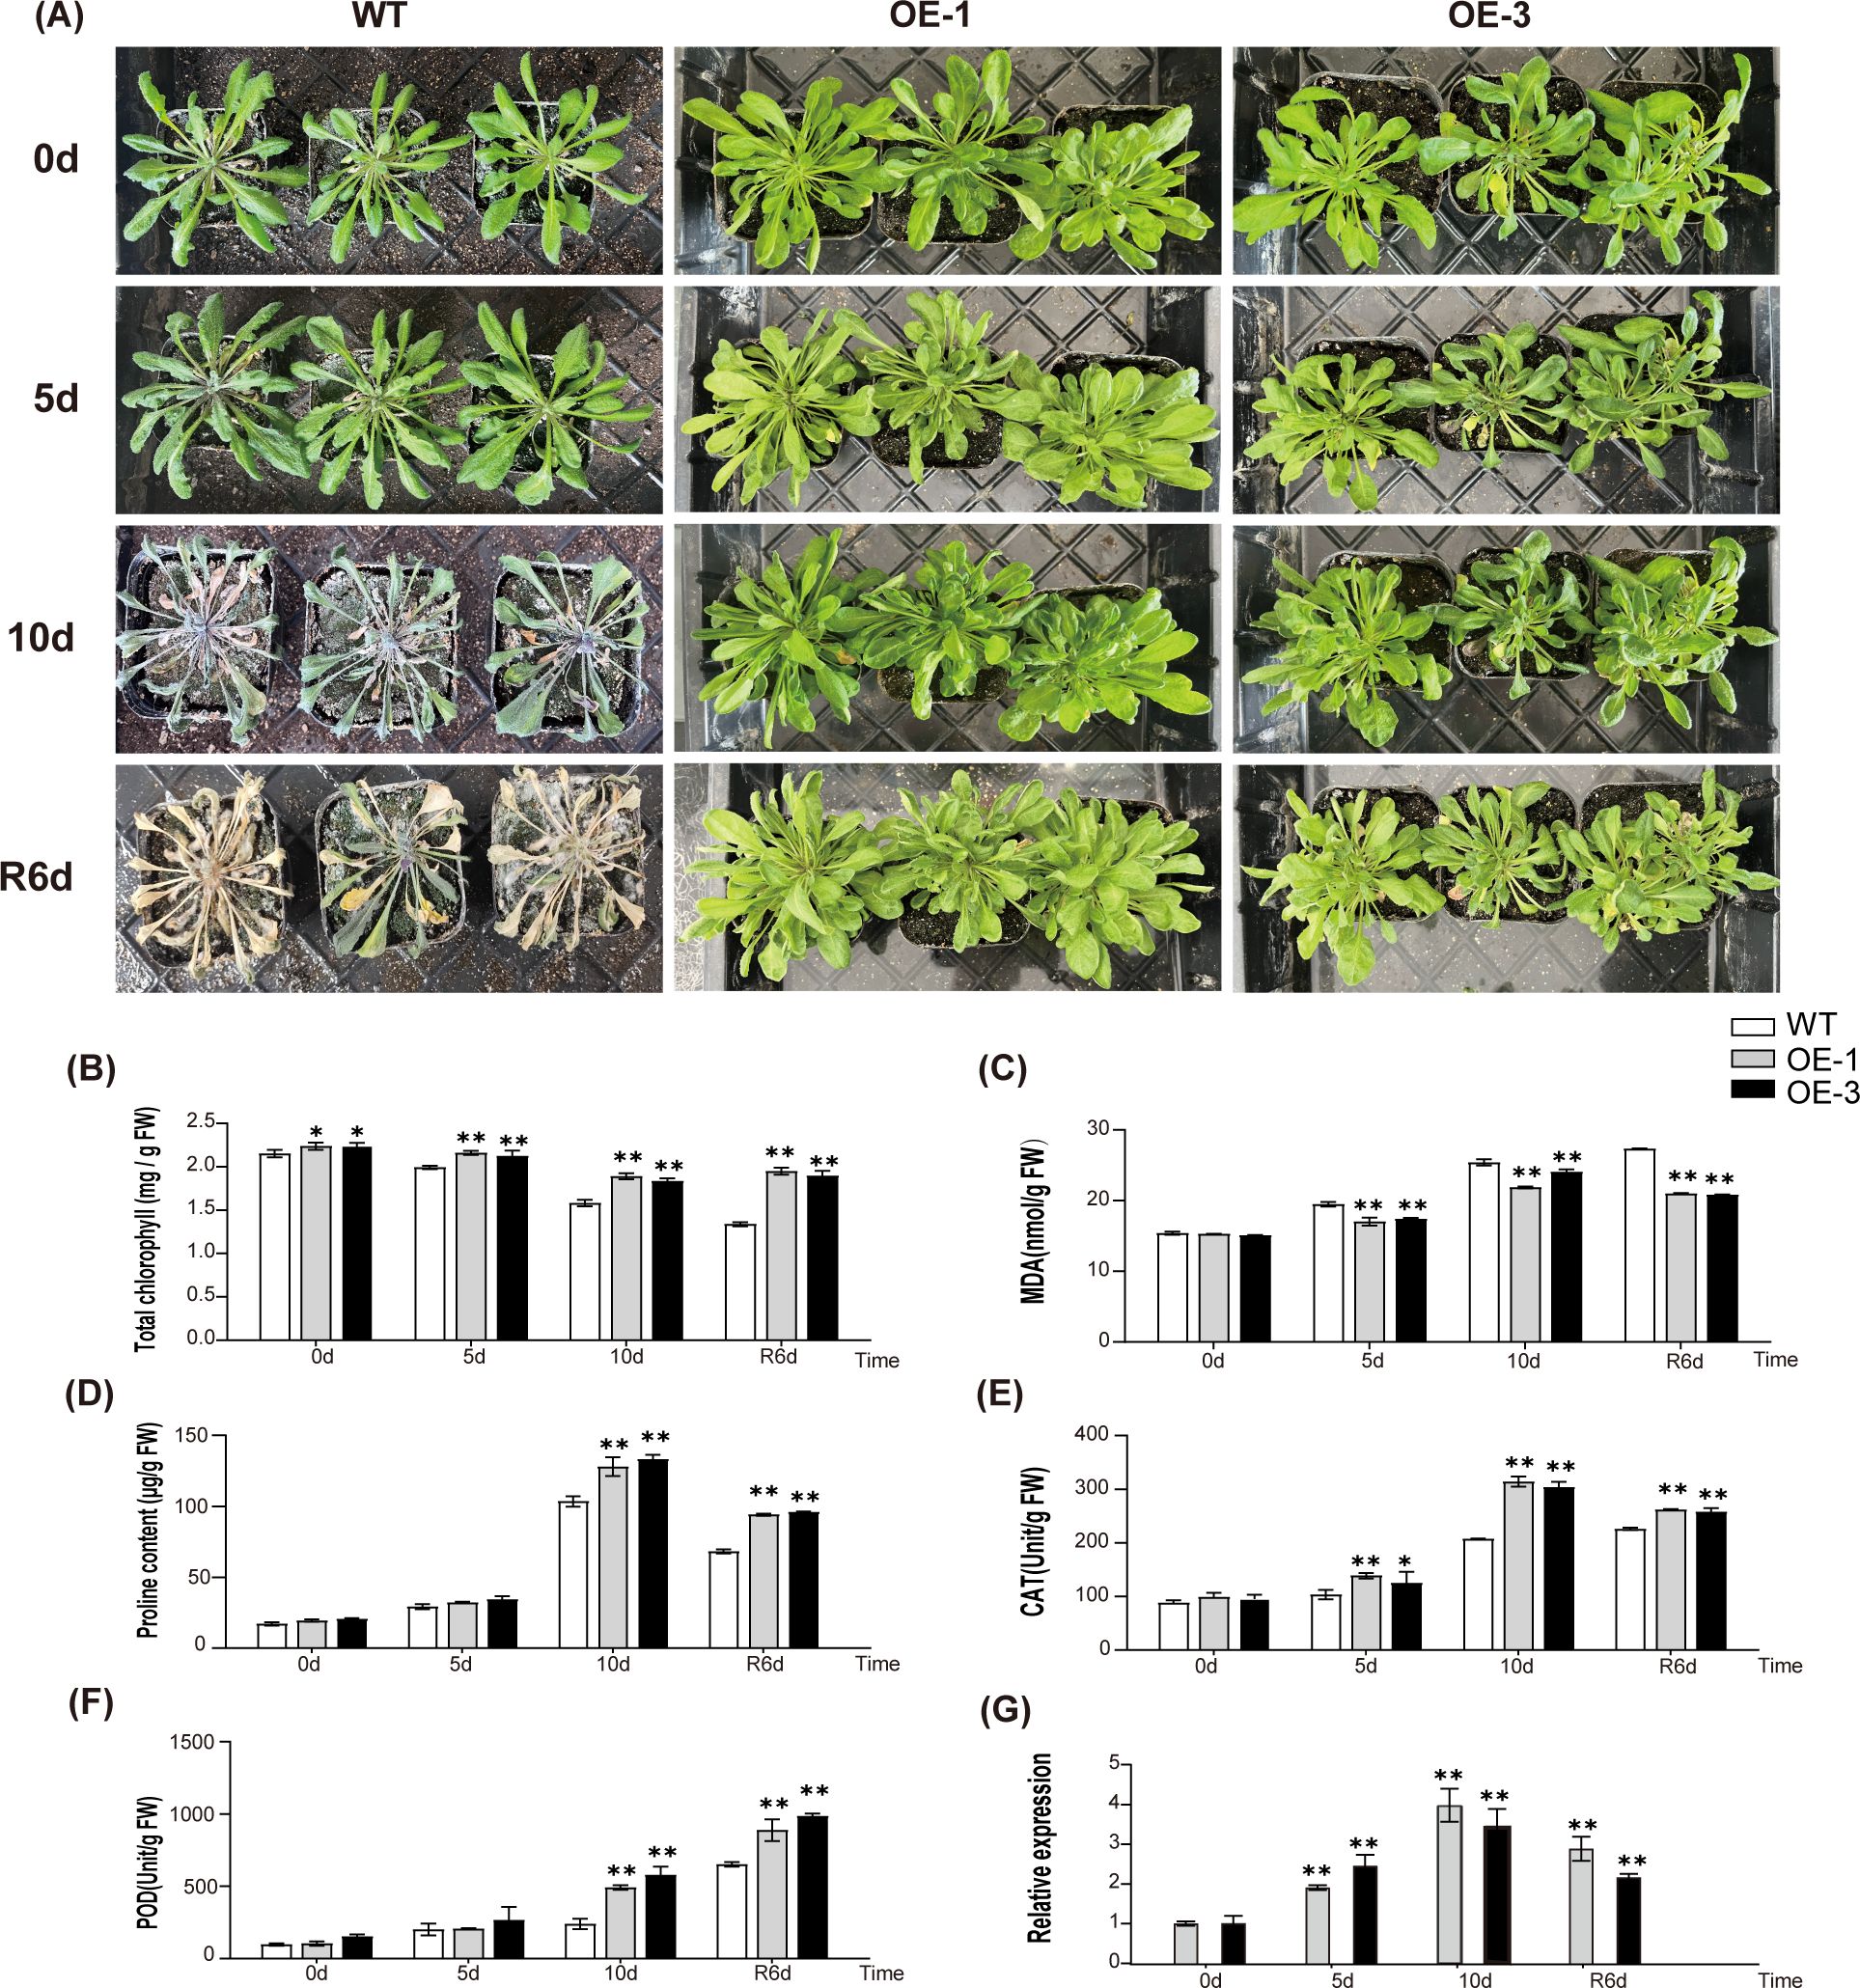
Figure 8. Comparative analysis of drought-induced sensitivity between WT (wild type) and transgenic Arabidopsis. (A) Phenotype comparison of WT and transgenic Arabidopsis. The labels 0 d, 5 d, and 10 d represent the drought exposure periods, while ‘R6d’ represents rewatering for 6 days following 10 days of drought stress. (B–F) Physiological changes in WT and T2 transgenic A. thaliana (OE-1 and OE-3). (B) Changes in chlorophyll contents; (C) Changes in MDA contents; (D) Changes in proline contents; (E) Changes in CAT activities; (F) Changes in POD activities; (G) Relative expression of AtaHMGR10. *p < 0.05, **p < 0.01.
The stress related physiological indicators and transcriptional responses to abiotic stresses in WT and transgenic A. thaliana lines of both OE-1 and OE-3 were illustrated. Under drought stress, a progressive reduction in total chlorophyll contents were observed in both transgenic and WT lines (Figure 8B), with transgenic lines displaying higher contents of chlorophylls, particularly at 10 days, hinting AtaHMGR10’s involvement in ameliorating chlorophyll degradation compared with the WT. The MDA levels, indicator of lipid peroxidation due to membrane damages, escalated in the WT under drought stress while remaining subdued in lines of both OE-1 and OE-3 (Figure 8C), reflecting the heightened oxidative stress resilience in OE-1 and OE-3 by AtaHMGR10 overexpression. Proline, a stress biomarker, surges in all plants under stress treatments, with OE lines showing a significant elevation (Figure 8D), suggesting superior osmotic stress adaptation of OE lines. Antioxidant enzymes activities of both catalases (CATs) and peroxidases (PODs) for removing ROSs damages of membranes were determined and resulted in initial peak activities before declining (Figures 8E, F) with the transgenic lines experiencing a more gradual increase than the WTs, help to understand the AtaHMGR10’s putative protective role against oxidative stressful injuries.
Further analyses results showed that during salt stress, chlorophyll concentrations (Figure 9I-A) underwent a modest reduction, however, but increased at 24 and 36 hours, especially in WT compared with transgenic lines. The MDA concentrations increased across all samples (Figure 9I-B), and the increase were tempered in transgenic lines. Elevated proline levels of transgenic lines (Figure 9I-C) suggest a more favorable osmotic equilibrium by AtaHMGR10 expression. CATs and PODs activities showed an initial upsurge followed by a decrease (Figures 9I-D, E), with a less decline in transgenic lines, implying an AtaHMGR10-induced antioxidant reactions resistance may be due to terpenoids biosynthesis by AtaHMGR10 overexpression. Upon exposure to PEG 6000-induced osmotic stress, all plant lines exhibit a slight initial decrease in chlorophyll contents (Figure 9II-A), which intensifies over time. The chlorophyll content in transgenic lines declined more slowly compared to the WT. The MDA levels increased (Figure 9II-B), yet, the ascent is more tempered in OE-1 and OE-3, hinting at enhanced membrane stability through AtaHMGR10 overexpression. Transgenic lines accrued significantly more proline contents (Figure 9II-C), indicating that AtaHMGR10 may facilitate augmented osmotic adaptation in transgenic lines manifesting in increased CATs and PODs enzymatic activities (Figure 9II-D, E), possibly reflecting an enhanced antioxidant defense.

Figure 9. Physiological changes in WT and T2 transgenic A. thaliana (OE-1 and OE-3) under (I) 50 mM NaCl, and (II) 10% PEG 6000 treatments. (IA, IIA) chlorophyll contents; (IB, IIB) MDA contents; (IC, IIC) proline contents; (ID, IID) CAT activities; (IE, IIE) POD activities. (IF, IIF) Relative expression of AtaHMGR10. *p < 0.05, **p < 0.01.
In summary, under drought, salinity, and osmotic stress, A. thaliana OE lines, OE-1 and OE-3, demonstrated increased tolerance compared to the WT. This tolerance was evident from the OE lines having more stable chlorophyll levels during stress stimulations, indicating the transgenes protective effect on photosynthetic apparatus. MDA assays indicated lower lipid peroxidation in the transgenic lines under all stress conditions, highlighting AtaHMGR10’s role in enhancing membrane stability and antioxidant protection. Elevated activities of antioxidant enzymatic activities of both PODs and CATs in the transgenic lines further supported a bolstered detoxification mechanism against ROSs-induced damages. Significantly higher proline accumulation in OE-1 and OE-3 suggests AtaHMGR10’s involvement in osmotic balance for cellular membrane protection.
The HMGR enzyme, play key roles in MVA pathway for IPP and DMAPP accumulation, generally have key structural features, including two transmembrane helices, two HMG-CoA binding sites (EMPVGY/FVQIP and TTEGCLVA), and two NAD(P)H binding sites (DAMGMNM and GTVGGGT), as discovered by earlier research (Campos and Boronat, 1995; Darabi et al., 2012; Istvan and Deisenhofer, 2000; Leivar et al., 2005). In this study, all AtaHMGR proteins were predicted with a single transmembrane helix at the N-terminus, corresponding to motif 5 (ILAIVSLVASLIYLLSFFGIAFVQS), lacking a second transmembrane helix of the functionalized HMGRs. Most AtaHMGR proteins contained HMG-CoA binding sites (motifs 3 and 4: EMPVGFVQLP and TTEGCLVA), but lacked NAD(P)H binding sites (motifs 1 and 2: DAMGMNM and GTVGGGT). Notably, motif 3 showed an amino acid variation in its residues, with Y (tyrosine) replaced by F (phenylalanine), diverged from previous research on HMG-CoA binding sites. This divergence reflected broader diversities of plant HMGRs, where amino acid residues at HMG-CoA binding sites may vary substrate selectivity and affinities. AtaHMGR8, AtaHMGR10, AtaHMGR11 and AtaHMGR18 contained motifs 1, 2, 3, 4, and 5, highlighting potential evolutionary conservation within these genes, correlating to their functional capacities. Furthermore, some plant HMGR genes in earlier studies also showed sequence variations or even lost the domain entirely. The variations and losses in motifs across AtaHMGR genes coding proteins suggest a complex evolutionary pathway leading to pseudogenes or nova functionalized genes. These structural variations are correlate with functional shifts, influencing enzymatic activities of HMGRs, including substrate selectivity, metabolic pathways changes, expression regulation as well as subcellular localization of HMGRs. The divergence observed in motif 3’s amino acid variation aligns with previous research, indicating a broader evolutionary pattern where variations and losses in structural motifs contribute to functional diversity across plant HMGR families.
The published studies indicated that the expression levels of HMGRs varied in diverse tissues of different plants. In A. thaliana, AtHMGR1 exhibited ubiquitous expression across all organs, whereas AtHMGR2 showed specific expression in rapidly growing tissues, implying its role in regulation of growth and development, especially in stress adaptation and developing cues (Enjuto et al., 1994). Similarly, the HMGR genes in Withania somnifera, Salvia miltiorrhiza, Lithospermum erythrorhizon, apple (Malus pumila), Panax notoginseng, and Populus sp., demonstrated distinct expression patterns, primarily concentrated in specific tissues such as flowers, stems, and leaves (Ma et al., 2012; Akhtar et al., 2013; Liu et al., 2016; Wang et al., 2023). Additionally, HMGR genes in some crops were found to be expressed in specific tissues, for example, endosperm of seed, suggesting their importance in seed development and storage accumulation (Li et al., 2014). In our study, the highest expression accumulation was observed in flowering twigs (Fs) in A. taliensis, with the expression levels of Fs>Rs>Ss consistent with most of the HMGR genes in crops exhibiting higher expression levels in flowers and roots.
To explore the linear relationships within the HMGR gene family, analysis of gene duplication and selection pressure in A. taliensis were conducted. Forty segmental duplicates of gene pairs were identified in this study. Then, the Ka/Ks ratio was calculated to study the selection pressure which affects the segmental duplication of AtaHMGR gene pairs. The Ka/Ks ratio of all orthologous gene pairs were less than 1.0 (Supplementary Table S4), implying that prior to experienced purification selection pressure, gene duplication events occurred.
To further examine the evolutionary relationships of the HMGRs, comparative syntenic patterns were generated from 6 different plant species (4 monocotyledonous, 1 dicotyledonous and a base species of angiosperm). The results indicated that there were more syntenic HMGR gene pairs between A. taliensis and saponins producing monocot species (Supplementary Figure S2; Supplementary Table S4). Among the 18 HMGR genes in A. taliensis, only 3 genes (AtaHMGR8, AtaHMGR10, and AtaHMGR11) exhibited syntenic relationships with genes in all other tested species. The conserved syntenic relationships between these 3 genes and their counterparts in other species imply a shared co-evolutionary history and functional conservation. Conversely, the lack of syntenic relationships for the majority of HMGR genes in A. taliensis suggests evolutionary divergence, potentially resulting from species-specific adaptations or genetic innovations which may be due to the species of Asparagus genus radiating from the cradle center of Africa crossing the Sahara region thus adapting to aridification tolerance (Bentz et al., 2024b). Overall, this analysis provides insights into the evolutionary dynamics and functional diversification of the HMGR gene family across species of angiosperm especially the genus Asparagus.
The promoters of the AtaHMGRs contained abundant cis-acting elements responsive to light, hormones, and abiotic stresses (Figure 3). It is demonstrated that HMGR members expression are related to the plant abiotic stress responses (Wei et al., 2020; Ma et al., 2023; Zhang et al., 2020). Therefore, we speculate that the AtaHMGR genes may be associated with tolerance to abiotic stresses.
Comprehensive expression analysis of the A. taliensis HMGR gene family led to the identification of four AtaHMGR genes (AtaHMGR8, AtaHMGR10, AtaHMGR11, AtaHMGR18) that were associated with plant stress resistance due to the induced expression of MeJA, particularly, AtaHMGR10 was chosen as the first candidate for functional analyses. The subcellular localization of the AtaHMGR10, predominantly within the endomembrane system, suggested a vital role in intracellular signaling and transport processes, essential under stress conditions for terpenoids biosynthesis. Further investigations were conducted to assess its effects on plant stress tolerance through overexpression experiment of AtaHMGR10 in A. thaliana with improvements in the stress tolerance of transgenic lines to drought, salt and osmotic stresses (Figures 8, 9) partially supports the above-mentioned proposal.
Under drought and salt stress, plants were induced to accumulate excessive ROSs, causing lipid peroxidation and subsequent MDA production. In response, plant typically establish a complex antioxidant system by enhancing the activities of enzymes such as PODs, and CATs to maintain redox homeostasis and improve the plant’s capability to scavenge ROSs (AbdElgawad et al., 2016; Sánchez-McSweeney et al., 2021; Zhang et al., 2020; Ma et al., 2023; Hu et al., 2022). Under conditions of drought, salt, and osmotic stress, the levels of total chlorophylls, MDA, proline, along with the enzymatic activities of PODs & CATs, were altered in transgenic A. thaliana lines overexpressing AtaHMGR10. These lines exhibited higher chlorophylls and proline levels, lower MDA concentrations, and increased activities of PODs and CATs compared to the WT (Figure 9).
This study provides significant insights into the function of HMGR gene family in A. taliensis, leading to potential applications in future breeding of crops tolerance improvements as well as medicine terpenoids synthesis in microbial host by genetic modification.
A total of 18 AtaHMGR genes were identified from A. taliensis, and their chromosome localization, phylogenetic tree, linear analysis, gene structure, motif distribution, cis-acting elements, and protein structure were characterized. The function and evolution of plant HMGR genes are conserved, which allows HMGR to serve as a marker for assessing phylogenetic relationships among species. Further functional characterization of AtaHMGR10, its coding enzymes with same binding abilities to both NADH and NADPH, in Arabidopsis has demonstrated a significant enhancement in abiotic stress tolerance, particularly to drought, osmotic, and salt stresses. This study sheds light on the role of AtaHMGRs in enhancing our understanding of their potential functions and providing ways for improving crop abiotic stress resilience by gene modification in the future.
The original contributions presented in the study are included in the article/Supplementary Material. Further inquiries can be directed to the corresponding authors.
LZ: Conceptualization, Formal analysis, Investigation, Validation, Writing – original draft, Writing – review & editing. SB: Writing – review & editing. HW: Formal analysis, Writing – review & editing. WD: Supervision, Investigation, Writing – review & editing. YL: Formal analysis, Writing – review & editing. CL: Supervision, Funding acquisition, Writing – review & editing. ZL: Supervision, Funding acquisition, Writing – review & editing. ZM: Conceptualization, Supervision, Funding acquisition, Writing – review & editing.
The author(s) declare financial support was received for the research, authorship, and/or publication of this article. This research was funded by the National Natural Science Foundation of China (32360089), Yunnan Agricultural joint Fund-key project (202101BD070001-027), and Yunnan Province Major Science and Technology Project (202202AE090021).
The authors declare that the research was conducted in the absence of any commercial or financial relationships that could be construed as a potential conflict of interest.
All claims expressed in this article are solely those of the authors and do not necessarily represent those of their affiliated organizations, or those of the publisher, the editors and the reviewers. Any product that may be evaluated in this article, or claim that may be made by its manufacturer, is not guaranteed or endorsed by the publisher.
The Supplementary Material for this article can be found online at: https://www.frontiersin.org/articles/10.3389/fpls.2025.1455592/full#supplementary-material
AbdElgawad, H., Zinta, G., Hegab, M. M., Pandey, R., Asard, H., Abuelsoud, W. (2016). High salinity induces different oxidative stress and antioxidant responses in maize seedlings organs. Front. Plant Sci. 7, 179763. doi: 10.3389/fpls.2016.00276
Abramson, J., Adler, J., Dunger, J., Evans, R., Green, T., Pritzel, A., et al. (2024). Accurate structure prediction of biomolecular interactions with AlphaFold 3. Nature. 630, 493–500. doi: 10.1038/s41586-024-07487-w
Akhtar, N., Gupta, P., Sangwan, N. S., Sangwan, R. S., Trivedi, P. K. (2013). Cloning and functional characterization of 3-hydroxy-3-methylglutaryl coenzyme A reductase gene from Withania somnifera: an important medicinal plant. Protoplasma. 250, 613–622. doi: 10.1007/s00709-012-0450-2
Antolín-Llovera, M., Leivar, P., Arró, M., Ferrer, A., Boronat, A., Campos, N. (2011). Modulation of plant HMG-CoA reductase by protein phosphatase 2A: positive and negative control at a key node of metabolism. Plant Signaling Behav. 6, 1127–1131. doi: 10.4161/psb.6.8.16363
Bach, T. J. (1986). Hydroxymethylglutaryl-CoA reductase, a key enzyme in phytosterol synthesis? Lipids. 21, 82–88. doi: 10.1007/BF02534307
Bailey, T. L., Johnson, J., Grant, C. E., Noble, W. S. (2015). The MEME suite. Nucleic Acids Res. 43, W39–W49. doi: 10.1093/nar/gkv416
Bansal, S., Narnoliya, L. K., Mishra, B., Chandra, M., Yadav, R. K., Sangwan, N. S. (2018). HMG-CoA reductase from Camphor Tulsi (Ocimum kilimandscharicum) regulated MVA dependent biosynthesis of diverse terpenoids in homologous and heterologous plant systems. Sci. Rep. 8, 3547. doi: 10.1038/s41598-017-17153-z
Bentz, P. C., Burrows, J. E., Burrows, S. M., Mizrachi, E., Liu, Z., Yang, J., et al. (2024a). Bursts of rapid diversification, dispersals out of southern Africa, and two origins of Dioecy punctuate the evolution of asparagus. Genome Biol. Evol. 16 (10), evae200. doi: 10.1093/gbe/evae200
Bentz, P. C., Liu, Z., Yang, J. B., Zhang, L., Burrows, S., Burrows, J., et al. (2024b). Young evolutionary origins of dioecy in the genus Asparagus. Am. J. Bot. 111 (2), e16276. doi: 10.1002/ajb2.v111.2
Bhambhani, S., Lakhwani, D., Shukla, T., Pandey, A., Dhar, Y. V., Asif, M. H., et al. (2017). Genes encoding members of 3-hydroxy-3-methylglutaryl coenzyme A reductase (HMGR) gene family from Azadirachta indica and correlation with azadirachtin biosynthesis. Acta physiologiae plantarum. 39, 1–13. doi: 10.1007/s11738-017-2363-3
Blum, M., Chang, H.-Y., Chuguransky, S., Grego, T., Kandasaamy, S., Mitchell, A., et al. (2021). The InterPro protein families and domains database: 20 years on. Nucleic Acids Res. 49, D344–D354. doi: 10.1093/nar/gkaa977
Callaway, E. (2024). AI protein-prediction tool AlphaFold3 is now more open. Nature. 635, 531–532. doi: 10.1038/d41586-024-03708-4
Campos, N., Boronat, A. (1995). Targeting and topology in the membrane of plant 3-hydroxy-3-methylglutaryl coenzyme A reductase. Plant Cell. 7, 2163–2174. doi: 10.1105/tpc.7.12.2163
Chen, C., Wu, Y., Li, J., Wang, X., Zeng, Z., Xu, J., et al. (2023). TBtools-II: A “one for all, all for one” bioinformatics platform for biological big-data mining. Mol. Plant. 16, 1733–1742. doi: 10.1016/j.molp.2023.09.010
Darabi, M., Masoudi-Nejad, A., Nemat-Zadeh, G. (2012). Bioinformatics study of the 3-hydroxy-3-methylglotaryl-coenzyme A reductase (HMGR) gene in Gramineae. Mol. Biol. Rep. 39, 8925–8935. doi: 10.1007/s11033-012-1761-2
Edgar, R. C. (2004). MUSCLE: multiple sequence alignment with high accuracy and high throughput. Nucleic Acids Res. 32, 1792–1797. doi: 10.1093/nar/gkh340
Enjuto, M., Balcells, L., Campos, N., Caelles, C., Arro, M., Boronat, A. (1994). Arabidopsis thaliana contains two differentially expressed 3-hydroxy-3-methylglutaryl-CoA reductase genes, which encode microsomal forms of the enzyme. Proc. Natl. Acad. Sci. 91, 927–931. doi: 10.1073/pnas.91.3.927
Finn, R. D., Clements, J., Eddy, S. R. (2011). HMMER web server: interactive sequence similarity searching. Nucleic Acids Res. 39, W29–W37. doi: 10.1093/nar/gkr367
Geourjon, C., Deleage, G. (1995). SOPMA: significant improvements in protein secondary structure prediction by consensus prediction from multiple alignments. Bioinformatics. 11, 681–684. doi: 10.1093/bioinformatics/11.6.681
Horton, P., Park, K.-J., Obayashi, T., Fujita, N., Harada, H., Adams-Collier, C., et al. (2007). WoLF PSORT: protein localization predictor. Nucleic Acids Res. 35, W585–W587. doi: 10.1093/nar/gkm259
Hu, D., Li, R., Dong, S., Zhang, J., Zhao, B., Ren, B., et al. (2022). Maize (Zea mays L.) responses to salt stress in terms of root anatomy, respiration and antioxidative enzyme activity. BMC Plant Biol. 22, 602. doi: 10.1186/s12870-022-03972-4
Istvan, E. S., Deisenhofer, J. (2000). The structure of the catalytic portion of human HMG-CoA reductase. Biochim. Biophys. Acta (BBA)-Molecular Cell Biol. Lipids. 1529, 9–18. doi: 10.1016/S1388-1981(00)00134-7
Kim, D., Langmead, B., Salzberg, S. L. (2015). HISAT: a fast spliced aligner with low memory requirements. Nat. Methods. 12, 357–360. doi: 10.1038/nmeth.3317
Kumar, M. S., Ali, K., Dahuja, A., Tyagi, A. (2015). Role of phytosterols in drought stress tolerance in rice. Plant Physiol. Biochem. 96, 83–89. doi: 10.1016/j.plaphy.2015.07.014
Kumar, M. S., Mawlong, I., Ali, K., Tyagi, A. (2018a). Regulation of phytosterol biosynthetic pathway during drought stress in rice. Plant Physiol. Biochem. 129, 11–20. doi: 10.1016/j.plaphy.2018.05.019
Kumar, S., Stecher, G., Li, M., Knyaz, C., Tamura, K. (2018b). MEGA X: molecular evolutionary genetics analysis across computing platforms. Mol. Biol. Evol. 35, 1547–1549. doi: 10.1093/molbev/msy096
Kuravadi, N. A., Yenagi, V., Rangiah, K., Mahesh, H., Rajamani, A., Shirke, M. D., et al. (2015). Comprehensive analyses of genomes, transcriptomes and metabolites of neem tree. PeerJ. 3, e1066. doi: 10.7717/peerj.1066
Leivar, P., González, V. M., Castel, S., Trelease, R. N., López-Iglesias, C., Arró, M., et al. (2005). Subcellular localization of Arabidopsis 3-hydroxy-3-methylglutaryl-coenzyme A reductase. Plant Physiol. 137, 57–69. doi: 10.1104/pp.104.050245
Lescot, M., Déhais, P., Thijs, G., Marchal, K., Moreau, Y., van de Peer, Y., et al. (2002). PlantCARE, a database of plant cis-acting regulatory elements and a portal to tools for in silico analysis of promoter sequences. Nucleic Acids Res. 30, 325–327. doi: 10.1093/nar/30.1.325
Letunic, I., Bork, P. (2021). Interactive Tree Of Life (iTOL) v5: an online tool for phylogenetic tree display and annotation. Nucleic Acids Res. 49, W293–W296. doi: 10.1093/nar/gkab301
Li, W., Liu, W., Wei, H., He, Q., Chen, J., Zhang, B., et al. (2014). Species-specific expansion and molecular evolution of the 3-hydroxy-3-methylglutaryl coenzyme A reductase (HMGR) gene family in plants. PLoS One. 9, e94172. doi: 10.1371/journal.pone.0094172
Li, Y., Qin, W., Liu, H., Chen, T., Yan, X., He, W., et al. (2023). Increased artemisinin production by promoting glandular secretory trichome formation and reconstructing the artemisinin biosynthetic pathway in Artemisia annua. Horticulture Res. 10, uhad055. doi: 10.1093/hr/uhad055
Li, Y., Yang, Y., Li, L., Tang, K., Hao, X., Kai, G. (2024). Advanced metabolic engineering strategies for increasing artemisinin yield in Artemisia annua L. Horticulture Res. 11, uhad292. doi: 10.1093/hr/uhad292
Liao, Y., Smyth, G. K., Shi, W. (2014). featureCounts: an efficient general purpose program for assigning sequence reads to genomic features. Bioinformatics. 30, 923–930. doi: 10.1093/bioinformatics/btt656
Liu, W.-J., Lv, H.-Z., He, L., Song, J.-Y., Sun, C., Luo, H.-M., et al. (2016). Cloning and bioinformatic analysis of HMGS and HMGR genes from Panax notoginseng. Chinese. Herbal Medicines. 8, 344–351. doi: 10.1016/S1674-6384(16)60061-8
Liu, W., Zhang, Z., Li, W., Zhu, W., Ren, Z., Wang, Z., et al. (2018). Genome-wide identification and comparative analysis of the 3-hydroxy-3-methylglutaryl coenzyme a reductase (HMGR) gene family in Gossypium. Molecules. 23, 193. doi: 10.3390/molecules23020193
Lu, S., Wang, J., Chitsaz, F., Derbyshire, M. K., Geer, R. C., Gonzales, N. R., et al. (2020). CDD/SPARCLE: the conserved domain database in 2020. Nucleic Acids Res. 48, D265–D268. doi: 10.1093/nar/gkz991
Lv, D., Zhang, Y. (2017). Isolation and functional analysis of apple MdHMGR1 and MdHMGR4 gene promoters in transgenic Arabidopsis thaliana. Plant Cell Tissue Organ Culture (PCTOC). 129, 133–143. doi: 10.1007/s11240-016-1162-7
Ma, X., Luo, N., Bai, W., Wang, X., Wang, C., Cheng, N., et al. (2023). Genome-wide analysis of the PtHMGR gene family and functional validation of PtHMGR5 improving drought tolerance in Populus trichocarpa. Environ. Exp. Bot. 216, 105544. doi: 10.1016/j.envexpbot.2023.105544
Ma, Y., Yuan, L., Wu, B., Li, X. E., Chen, S., Lu, S. (2012). Genome-wide identification and characterization of novel genes involved in terpenoid biosynthesis in Salvia miltiorrhiza. J. Exp. Bot. 63, 2809–2823. doi: 10.1093/jxb/err466
McGinnis, S., Madden, T. L. (2004). BLAST: at the core of a powerful and diverse set of sequence analysis tools. Nucleic Acids Res. 32, W20–W25. doi: 10.1093/nar/gkh435
Narusaka, Y., Narusaka, M., Yamasaki, S., Iwabuchi, M. (2012). Methods to transfer foreign genes to plants. Transgenic plants-advances limitations, 173–188. doi: 10.5772/32773
Pandreka, A., Dandekar, D. S., Haldar, S., Uttara, V., Vijayshree, S. G., Mulani, F. A., et al. (2015). Triterpenoid profiling and functional characterization of the initial genes involved in isoprenoid biosynthesis in neem (Azadirachta indica). BMC Plant Biol. 15, 1–14. doi: 10.1186/s12870-015-0593-3
Podolak, I., Galanty, A., Sobolewska, D. (2010). Saponins as cytotoxic agents: a review. Phytochem. Rev. 9, 425–474. doi: 10.1007/s11101-010-9183-z
Saha, P. S., Ray, S., Sengupta, M., Jha, S. (2015). Molecular phylogenetic studies based on rDNA ITS, cpDNA trnL intron sequence and cladode characteristics in nine Protasparagus taxa. Protoplasma. 252, 1121–1134. doi: 10.1007/s00709-014-0746-5
Sánchez-McSweeney, A., González-Gordo, S., Aranda-Sicilia, M. N., Rodríguez-Rosales, M. P., Venema, K., Palma, J. M., et al. (2021). Loss of function of the chloroplast membrane K+/H+ antiporters AtKEA1 and AtKEA2 alters the ROS and NO metabolism but promotes drought stress resilience. Plant Physiol. Biochem. 160, 106–119. doi: 10.1016/j.plaphy.2021.01.010
Schrodinger, L. (2015). The PyMOL molecular graphics system. Version 1.8. Available online at: https://pymol.org (Accessed March 6, 2024).
Segatto, M., Manduca, A., Lecis, C., Rosso, P., Jozwiak, A., Swiezewska, E., et al. (2014). Simvastatin treatment highlights a new role for the isoprenoid/cholesterol biosynthetic pathway in the modulation of emotional reactivity and cognitive performance in rats. Neuropsychopharmacology. 39, 841–854. doi: 10.1038/npp.2013.284
Sparg, S., Light, M., Van Staden, J. (2004). Biological activities and distribution of plant saponins. J. ethnopharmacology. 94, 219–243. doi: 10.1016/j.jep.2004.05.016
Thakur, V. (2024). RNA-Seq data analysis for differential gene expression using HISAT2-stringTie-ballgown pipeline. Methods Mol. Biol. 2812, 101–113. doi: 10.1007/978-1-0716-3886-6_5
Wang, Y., Li, J., Paterson, A. H. (2013). MCScanX-transposed: detecting transposed gene duplications based on multiple colinearity scans. Bioinformatics. 29, 1458–1460. doi: 10.1093/bioinformatics/btt150
Wang, M., Sun, Y., Liu, Y., Zhu, L., Yang, X., Xi, R., et al. (2024). Modulation of drought resistance by EkbHLH144-mediated β-sitosterol synthesis through EkHMGR. Ind. Crops Products. 211, 118271. doi: 10.1016/j.indcrop.2024.118271
Wang, Y., Tang, H., Debarry, J. D., Tan, X., Li, J., Wang, X., et al. (2012). MCScanX: a toolkit for detection and evolutionary analysis of gene synteny and collinearity. Nucleic Acids Res. 40, e49–e49. doi: 10.1093/nar/gkr1293
Wang, X., Wang, C., Yang, M., Jie, W., Fazal, A., Fu, J., et al. (2023). Genome-wide comparison and functional characterization of HMGR gene family associated with Shikonin biosynthesis in Lithospermum erythrorhizon. Int. J. Mol. Sci. 24, 12532. doi: 10.3390/ijms241512532
Wei, H., Movahedi, A., Xu, C., Sun, W., Li, L., Wang, P., et al. (2020). Overexpression of PtHMGR enhances drought and salt tolerance of poplar. Ann. Bot. 125, 785–803. doi: 10.1093/aob/mcz158
Wei, H., Xu, C., Movahedi, A., Sun, W., Li, D., Zhuge, Q. (2019). Characterization and function of 3-Hydroxy-3-Methylglutaryl-CoA reductase in Populus trichocarpa: Overexpression of PtHMGR enhances terpenoids in transgenic poplar. Front. Plant Sci. 10, 468424. doi: 10.3389/fpls.2019.01476
Wu, H., Dongchen, W., Li, Y., Brown, S. E., Wei, S., Lin, C., et al. (2024). Mitogenomes comparison of 3 species of Asparagus L shedding light on their functions due to domestication and adaptative evolution. BMC Genomics. 25, 857. doi: 10.1186/s12864-024-10768-3
Zhang, X., Henriques, R., Lin, S. S., Niu, Q. W., Chua, N. H. (2006). Agrobacterium-mediated transformation of Arabidopsis thaliana using the floral dip method. Nat. Protoc. 1, 641–646. doi: 10.1038/nprot.2006.97
Zhang, M., Liu, H., Wang, Q., Liu, S., Zhang, Y. (2020). The 3-hydroxy-3-methylglutaryl-coenzyme A reductase 5 gene from Malus domestica enhances oxidative stress tolerance in Arabidopsis thaliana. Plant Physiol. Biochem. 146, 269–277. doi: 10.1016/j.plaphy.2019.11.031
Keywords: Asparagus taliensis, HMGR gene family, transgene, abiotic stress tolerance, medicinal plant
Citation: Zeng L, Brown SE, Wu H, Dongchen W, Li Y, Lin C, Liu Z and Mao Z (2025) Comprehensive genome-wide analysis of the HMGR gene family of Asparagus taliensis and functional validation of AtaHMGR10 under different abiotic stresses. Front. Plant Sci. 16:1455592. doi: 10.3389/fpls.2025.1455592
Received: 27 June 2024; Accepted: 16 January 2025;
Published: 20 February 2025.
Edited by:
Sunil Kumar Sahu, Beijing Genomics Institute (BGI), ChinaReviewed by:
Muktesh Chandra, Marwadi University, IndiaCopyright © 2025 Zeng, Brown, Wu, Dongchen, Li, Lin, Liu and Mao. This is an open-access article distributed under the terms of the Creative Commons Attribution License (CC BY). The use, distribution or reproduction in other forums is permitted, provided the original author(s) and the copyright owner(s) are credited and that the original publication in this journal is cited, in accordance with accepted academic practice. No use, distribution or reproduction is permitted which does not comply with these terms.
*Correspondence: Zhengjie Liu, bHpqMTAyMkAxNjMuY29t; Zichao Mao, em1hb0B5bmF1LmVkdS5jbg==
Disclaimer: All claims expressed in this article are solely those of the authors and do not necessarily represent those of their affiliated organizations, or those of the publisher, the editors and the reviewers. Any product that may be evaluated in this article or claim that may be made by its manufacturer is not guaranteed or endorsed by the publisher.
Research integrity at Frontiers
Learn more about the work of our research integrity team to safeguard the quality of each article we publish.