- 1Department of Agronomy, Hetao College, Bayannur, China
- 2Bayannur Modern Agriculture and Animal Husbandry Development Center, Bayannur, China
Introduction: S-adenosylmethionine (SAM), a key molecule in plant biology, plays an essential role in stress response and growth regulation. Despite its importance, the SAM synthetase (SAMS) gene family in sunflowers (Helianthus annuus L.) remains poorly understood.
Methods: In this study, the SAMS genes were identified from the sunflower genome. Subsequently, the protein properties, gene structure, chromosomal location, cis-acting elements, collinearity, and phylogeny of the SAMS gene family were analyzed by bioinformatic methods. Finally, the expression patterns of SAMS genes in different tissues, under different hormonal treatment and abiotic stress were analyzed based on transcriptome data and qRT-PCR.
Results: This study identified 58 SAMS genes across nine cultivated sunflower species, which were phylogenetically classified into seven distinct subgroups. Physicochemical properties and gene structure analysis showed that the SAMS genes are tightly conserved between cultivars. Collinearity analysis revealed segmental duplications as the primary driver of gene family expansion. The codon usage bias analysis suggested that natural selection substantially shapes the codon usage patterns of sunflower SAMS genes, with a bias for G/C-ending high-frequency codons, particularly encoding glycine, leucine, and arginine. Analysis of the cis-regulatory elements in promoter regions, implied their potential roles in stress responsiveness. Differential expression patterns for HanSAMS genes were observed in different tissues as well as under hormone treatment or abiotic stress conditions by analyzing RNA-seq data from previous studies and qRT-PCR data in our current study. The majority of genes demonstrated a robust response to BRA and IAA treatments in leaf tissues, with no significant expression change observed in roots, suggesting the response of HanSAMS genes to hormones is tissue-specific. Expression analyses under abiotic stresses demonstrated diverse expression profiles of HanSAMS genes, with HanSAMS5 showing significant upregulation in response to both drought and salt stresses.
Discussion: This comprehensive genomic and expression analysis provides valuable insights into the SAMS gene family in sunflowers, laying a robust foundation for future functional studies and applications in crop improvement for stress resilience.
1 Introduction
Plants have developed sophisticated and adaptable mechanisms to adjust to challenging environments, involving a spectrum of morphological, physiological, and molecular changes (Ahuja et al., 2010). They frequently employ strategies such as strengthening and preserving the integrity of biological membranes, along with boosting the production of antioxidant enzymes, to endure stresses from cold, drought, and high salinity (Yang et al., 2013; Mehari et al., 2021). The cultivated sunflower (Helianthus annuus L.) is a prominent oil crop with global significance, renowned for its resilience in adverse environmental conditions,which is originally domesticated by Native Americans in North America, and later introduced to Europe and subsequently became a vital crop worldwide (Zukovsky, 1950; Mantenese et al., 2006). Nevertheless, the cultivation of sunflowers faces various challenges, with drought and salinity being prominent abiotic stressors (Rele and Mohile, 2003; Keeley et al., 2021). A multitude of gene families, including S-adenosyl-L-methionine synthase (SAMS), are integral to the complex regulatory networks that dictate plant stress responses, impacting their growth and bolstering their resilience to harsh conditions (He et al., 2019).
SAMS genes are distinguished by the presence of a methionine-binding site in their N-terminal domain and an ATP-binding motif in their C-terminal domain. These enzymes catalyze the formation of SAM (S-Adenosyl-L-methionine) through the condensation of methionine with ATP, playing a crucial role in essential biological pathways within eukaryotic cells (Heidari et al., 2020). Numerous SAMS genes have been identified by researchers (Ahuja et al., 2010; Yang et al., 2013; Heidari et al., 2020). In Arabidopsis thaliana, there exist four SAMS genes, with AtSAMS3 demonstrating predominant expression within pollen tissues (Yang et al., 2013). The suppression of OsSAMS1, 2, and 3 in rice (Oryza sativa) led to alterations in histone modifications and DNA methylation patterns, which in turn triggered a delay in flowering time (Li et al., 2011). Espartero et al. observed that the expression of SAMS in tomatoes (Solanum lycopersicum) was altered in response to salt stress (Heidari et al., 2020). Similarly, in cucumbers (Cucumis sativus), salt stress induced the expression of SAMS, implicating its role in the modulation of associated stress-response mechanisms (Roje, 2006; Bürstenbinder et al., 2007). In soybean (Glycine max), the expression profiles of the SAMS gene family exhibited significant variation in the face of drought and waterlogging stress, yet displayed relative stability under treatments involving sodium chloride (NaCl) and low temperatures (Jang et al., 2012; Ma et al., 2017). The gene GhSAMS2 has emerged as a promising candidate for the genetic enhancement of upland cotton’s resistance to multiple abiotic stresses (Gupta et al., 2013). The overexpression of CsSAMS1 and its interaction with CsCDPK6 resulted in the stimulation of ethylene and polyamines biosynthesis, ultimately improving salt stress tolerance in transgenic tobacco (Nicotiana tabacum) plants (Zhu et al., 2021). Overexpressing Medicago sativa subsp. Falcata SAMS1 in transgenic tobacco plants increased their tolerance to cold stress by enhancing oxidation and polyamine synthesis (Guo et al., 2014).
Pan-genomic analysis, now a prevalent approach, is utilized to assess genetic variability within species, explore gene flow between species, and examine the processes of domestication and crop improvement (Hübner et al., 2019; Li et al., 2010; Gao et al., 2019; Tao et al., 2021; Tettelin et al., 2005). A single reference genome might not capture the full spectrum of genetic diversity that evolves over time within a species, possibly leading to the exclusion of many important genes. While the SAMS gene family has been extensively researched in A. thaliana, rice, cotton, and tomato, there is a pronounced shortfall in studies on the SAMS genes in sunflowers, particularly in relation to their pan-genome diversity and how their expression patterns react to abiotic stresses such as cold, drought, and salinity, as well as to external hormonal signals (He et al., 2019; Heidari et al., 2020; Sun et al., 2022).
In this research, we conducted a comprehensive, genome-wide identification of SAMS genes utilizing the sunflower pan-genome. A total of 58 SAMS genes were discovered across nine cultivated sunflower varieties. We investigated their phylogenetic relationships, gene structures, motifs, cis-elements, and the secondary and tertiary structures of the corresponding proteins. Additionally, we analyzed the codon usage bias in these 58 SAMS genes, employing neutrality plot, ENc-plot, PR2-plot, and the Relative Synonymous Codon Usage (RSCU) method. Building on this, we extracted gene expression data for the SAMS gene from a variety of conditions, including exposure to abiotic stresses and treatments with external hormones. Furthermore, we performed a systematic analysis of the SAMS gene expressions, with a particular focus on their expression patterns under drought and salt stress conditions, using quantitative real-time PCR (qRT-PCR). These results provided comprehensive genomic information of sunflower SAMS gene family, enhancing our understanding of their roles in stress response and potentially contributing to the development of sunflower varieties with improved stress tolerance.
2 Materials and methods
2.1 Identification of SAMS genes
Protein sequences of SAMSs from A. thaliana were obtained from the TAIR (https://www.Arabidopsis.org/). Genome and annotation files of Helianthus annuus XRQ) was downloaded from Ensembl plants (https://plants.ensembl.org/index.html). Helianthus annuus (HA89), Helianthus annuus (HA300), Helianthus annuus (IR), Helianthus annuus (LR1), Helianthus annuus (OQP8), Helianthus annuus (PI659440), Helianthus annuus (PSC8) and Helianthus annuus (RHA438) were downloaded from NCBI. The Hidden Markov Model (HMM) (PF02772, PF02773, PF00438) of S-adenosylmethionine synthase was downloaded from the Pfam database (https://pfam.xfam.org/), and were used to search protein databases by HMMER in TBtools-II (Chen et al., 2023) with an E-value<1e−5. Subsequently, all putative SAMS genes shared the three HMM domains were validated by batch-CD search (http://www.ncbi.nlm.nih.gov/Structure/cdd/wrpsb.cgi), Pfam, and HMMER (https://www.ebi.ac.uk/Tools/hmmer/) databases (Potter et al., 2018; Mistry et al., 2021; Wang et al., 2023). The SAMS genes in the XRQ cultivar are named using Latin abbreviations coupled with their chromosomal positions in the XRQ reference genome. For instance, the designation XRQ-HanSAMS1 indicates that XRQ represents the cultivar name, Han refers to Helianthus annuus, and the numeral in SAMS corresponds to the gene’s ordered position on the chromosome, listed from the smallest to the largest. Other cultivars’ genes keep their names but get a SAMS number based on where they group with XRQ-HanSAMS genes in the evolution tree. Furthermore, the biochemical parameters of HanSAMS were determined using the ProtParam tool (https://web.expasy.org/protparam/) (Gasteiger et al., 2005). Finally, the subcellular localizations of HanSAMS were predicted using the WoLF PSORT (https://wolfpsort.hgc.jp/). The NPS@: SOPMA secondary structure (https://npsa-prabi.ibcp.fr/cgi-bin/npsa_automat.pl?page=npsa_sopma.html) was used to predict the secondary structures of HanSAMS proteins. SWISS-MODEL (https://swissmodel.expasy.org/) was employed to 3D protein structure prediction and PyMOL software was used to draw 3D structures of SAMS proteins (PyMOL molecular graphics system; http://www.pymol.org) (DeLano, 2002).
2.2 Phylogenetic, gene structure, cis-element, motif and collinear analysis
Multiple sequences alignments of the full-length SAMS protein sequences was performed using the ClustalX (Larkin et al., 2007). The Neighbor-joining (NJ) tree was constructed by MEGA7.0 with the amino acid substitution Poisson model and 1000 bootstrap replicates test model (Kumar et al., 2016). The exon-intron structure of the SAMS genes was analysed using GSDS 2.0 (http://gsds.cbi.pku.edu.cn/) (Hu et al., 2015). Conserved domains of SAMS proteins were analysed by MEME (http://meme.sdsc.edu/meme/cgi-bin/meme.cgi). The upstream 2000 bp sequences relative to the start codon of each SAMS gene were obtained to analyze the promoter regions, and the cis-elements within these regions were predicted using the PlantCARE (http://bioinformatics.psb.ugent.be/webtools/plantcare/html/) (Lescot et al., 2002). We employed BLASTP to identify homologous genes, with key parameters set to an e-value threshold of 1e-3 and a maximum of 10 target sequences. To identify collinear genes using MCScanX (Wang et al., 2012), we applied the default parameters, include an E_VALUE of 1e-05 and a MAX_GAPS count of 25. The nonsynonymous substitution rate/synonymous substitution rate (Ka/Ks) values were calculated via the DnaSP 6.0 application released by Universitat de Barcelona.
2.3 Estimation of codon bias
A Python-compiled custom program was used to calculate the genomic composition of the SAMS gene family across nine cultivated sunflower varieties, determining the total GC content (GCall) as well as the GC content at the first (GC1), second (GC2), the average GC content at the first and second positions (GC12) and third (GC3) codon positions within the coding DNA sequences (CDS). Additionally, we utilized the software CodonW v1.4.4 (http://codonw.sourceforge.net) to assess the relative synonymous codon usage (RSCU), count the number of effective codons (ENc), and calculate the codon adaptation index (CAI), also determining the length of the amino acid sequences. Furthermore, we conducted a series of analyses to visualize the codon usage bias and neutrality: the Neutrality plot, the PR2 plot, the ENc-plot, and the RSCU plot were all generated using R software.
2.4 Analysis of RNA-seq data of HanSAMS
Hormonal response expression data (NCBI accession number SRP092742) were sourced from the SunExpress V1 database, which provides a comprehensive resource for exploring the expression patterns of genes under various conditions in sunflowers. The FPKM values for all XRQ-HanSAMS genes were extracted and subsequently processed using TBtools-II to create heatmaps.
2.5 Plant cultivation, treatments, RNA isolation, and qRT-PCR
The sunflower salt-tolerant inbred line 19S05 was used to explore the influence of salt and drought stress on sunflower seedlings. We sowed high-quality sunflower seeds in a perforated plastic container filled with nutrient-rich soil, ensuring they received regular watering every three days to support their healthy development. The plants were grown under a controlled photoperiod of 16 hours of light followed by 8 hours of darkness, all within a stable room temperature range of 21 to 25 degrees Celsius(Song et al., 2024b). Once the sunflower seedlings reached the four-true-leaf stage, seedings were treated with 150 mM NaCl solution and 15% PEG6000 solution, respectively. The leaves were then collected at 0 h, 1 h, 3 h, 6 h, 12 h, and 24 h, immediately frozen in liquid nitrogen, and stored at −80°C. The total RNA isolation and purification of samples were performed using an RNAprep Pure Plant Plus Kit (rich in polysaccharides and polyphenolics) (Tiangen, Beijing, China). The RNA isolation for gene expression was done in biological replicates for each sample analyzed. RNA integrity was visualized by 1% agarose gel electrophoresis. The concentration and purity of RNAs (OD260/OD280>1.95) were determined with a NanoDrop Onemicrovolume UVvis spectrophotometer (NanoDrop Technologies, DE, USA). Further, 1 ug of total RNA was reverse transcribed in a 20 ul reaction volume using a PrimeScript RT reagent kit with a gDNA eraser (Code No.6210A, Takara, Beijing, China) following the manufacturer’s instructions to remove traces of contaminant DNA and prepare cDNA. 1 µg of purified total RNA was reverse transcribed into the first strand cDNA that was used to qRT-PCR. Quantitative real-time polymerase chain reaction (qRT-PCR) analysis was used to analyze the expression level of the identified HanSAMSs. The standard qRT-PCR with SYBR Premix Ex Taq II (TaKaRa, Beijing, China) was repeated at least three times on a CFX96 real-time System (BioRad, Beijing). Subsequently, Cycling parameters were 95°C for 30 s, 40 cycles of 95°C for 5 s, and 60°C for 30 s. For melting curve analysis, a program including 95°C for 15 s, followed by a constant increase from 60°C to 95°C, was included following the PCR cycles. Primer Premier 6.0 software were used to designed the specific primers of HanSAMS genes according to their gene sequences, listed in Supplementary Table S1. Results were analyzed by the 2−△△Ct method using the HanActin as the endogenous reference gene (He et al., 2019).
3 Results
3.1 Pangenome-wide identification of SAMS gene family in sunflowers
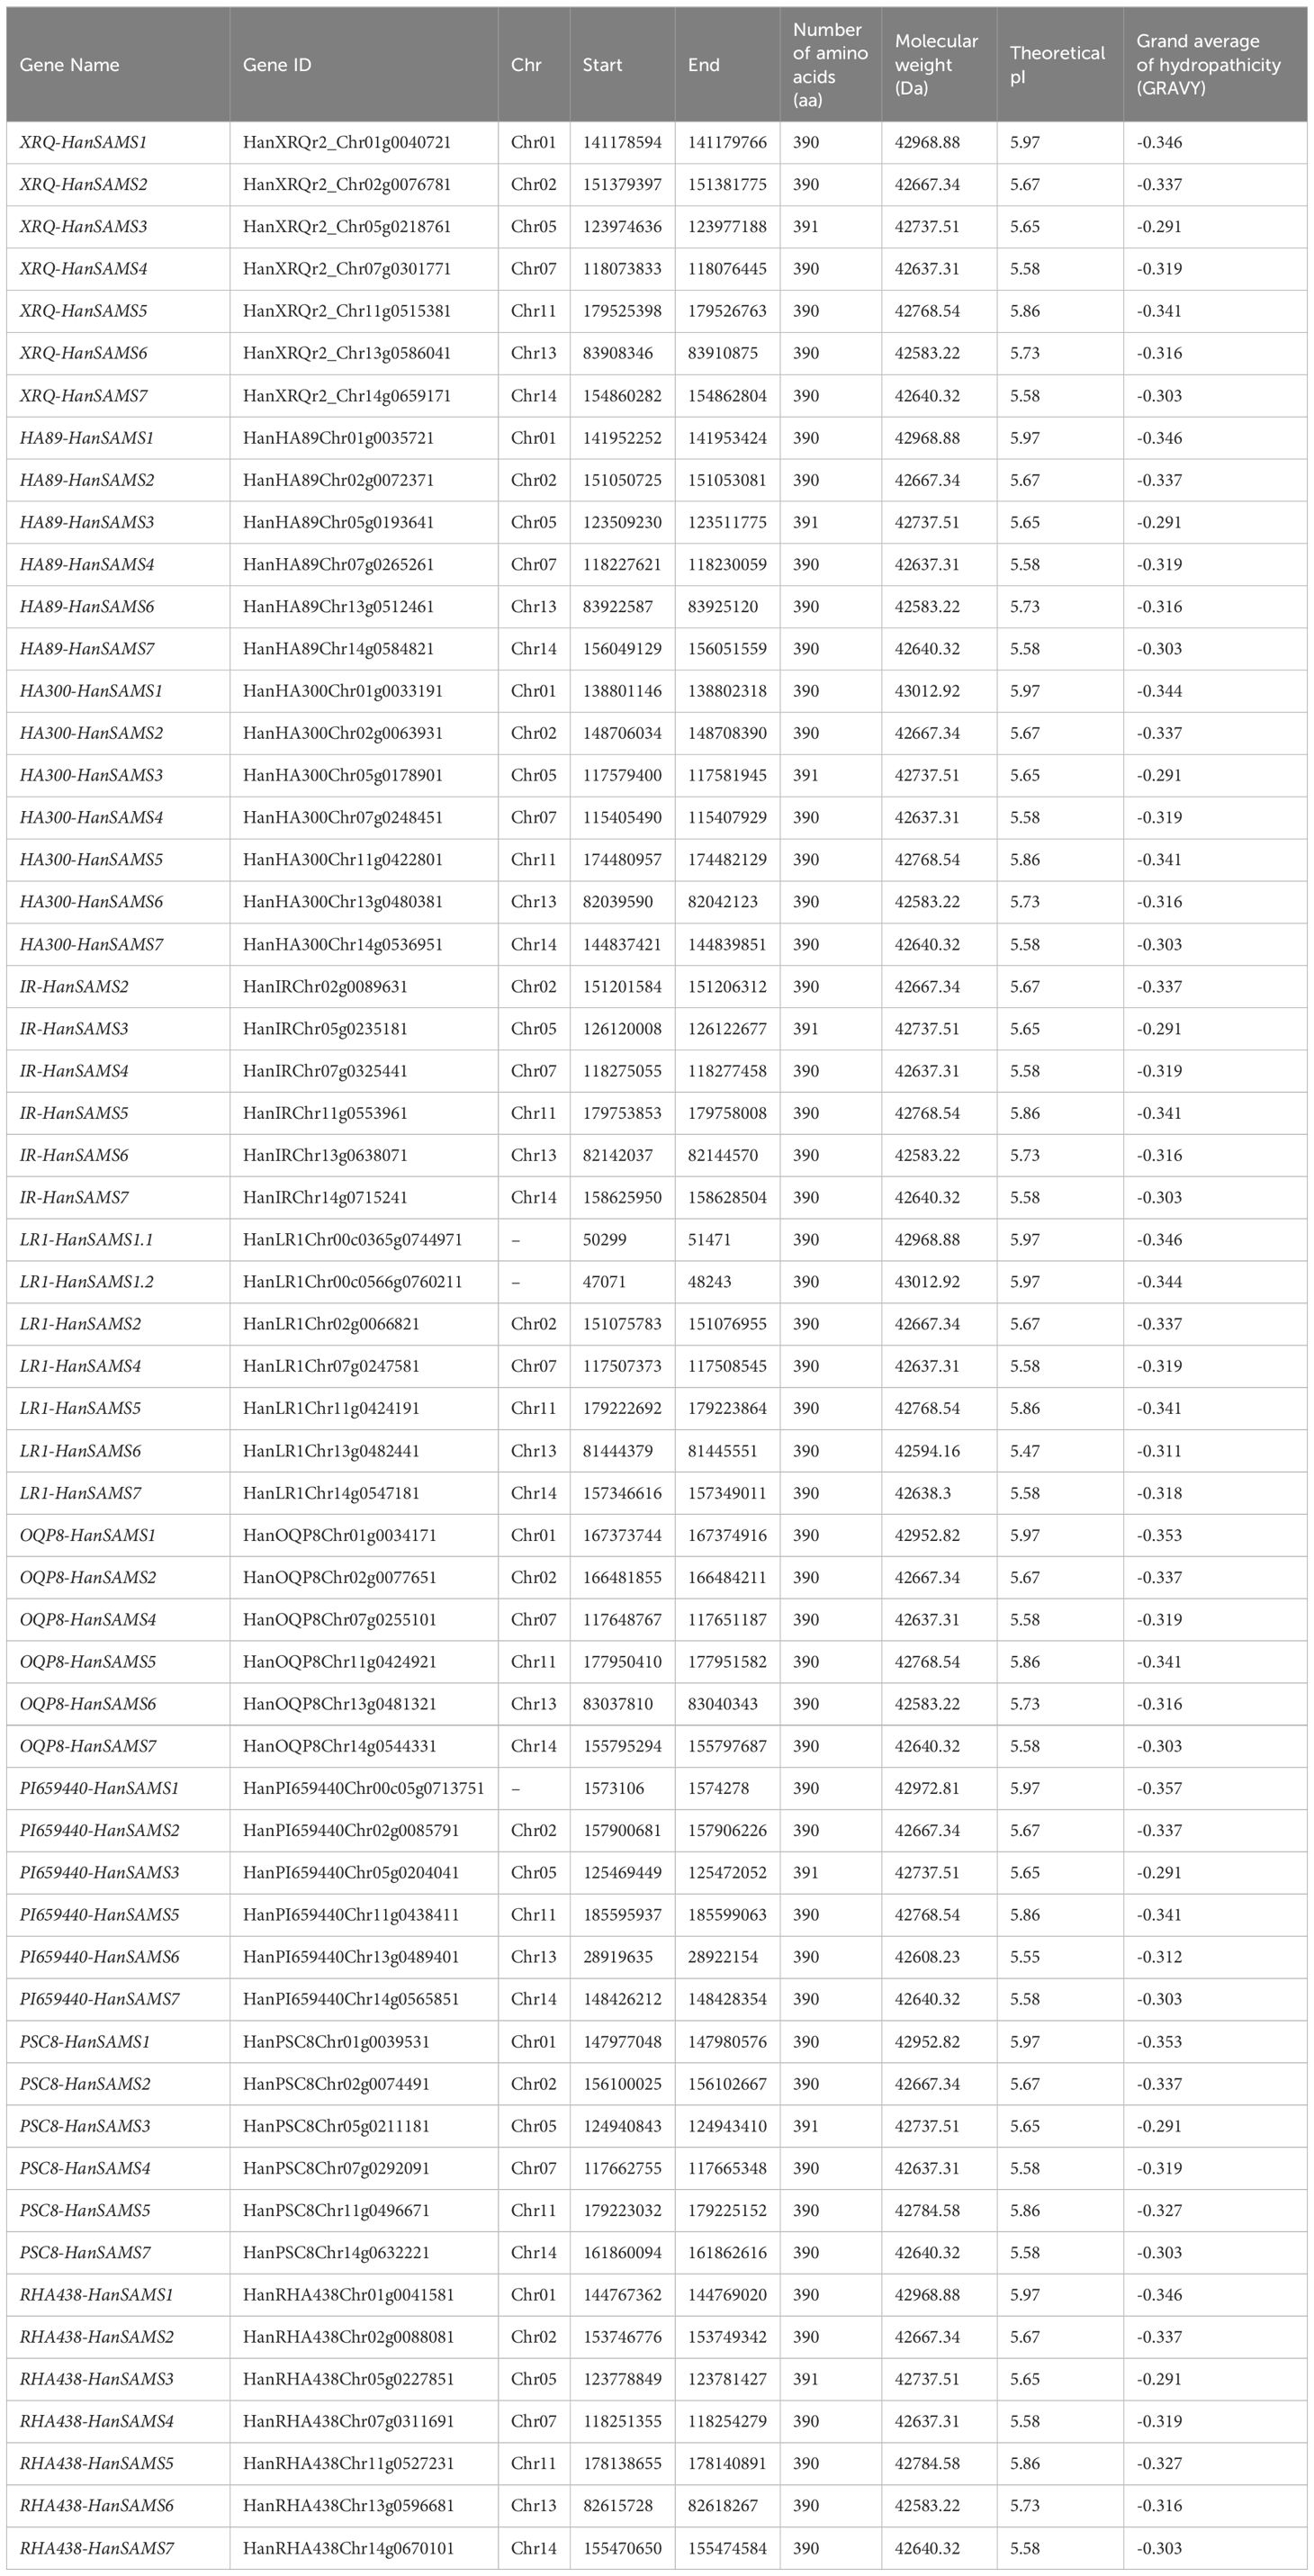
A total of 58 SAMS genes are identified based on the nine sunflowers genomes, including 7 XRQ-HanSAMS, 6 HA89-HanSAMS, 7 HA300-HanSAMS, 6 IR-HanSAMS, 7 LR1-HanSAMS, 6 PI659440-HanSAMS, 6 PSC8-HanSAMS, 6 OQP8-HanSAMS, and 7 RHA438-HanSAMS (Table 1). The physicochemical properties of the SAMS genes were presented in Table 1. Their protein sequence length ranged from 390 to 391 aa, with a molecular weight (MW) varying from 42583.22 to 43012.92 Da. The isoelectric points (pI) of the protein ranged from 5.47 to 5.97. The grand average of hydropathicity (GRAVY) of the proteins ranged from -0.291 to -0.357, all were the hydrophobic proteins. Secondary structure prediction analysis revealed that the proteins encoded by all the genes were predominantly composed of α-helices, β-turns, random coils, and extended chains (Supplementary Table S2). Among these, random coils were the most abundant structural element, accounting for 40.26% to 45.9% of the secondary structure. α-helices were the next most common, representing a proportion of 30.51% to 37.69%. Extended chains followed with a composition of 13.85% to 16.92%. The least prevalent structure was β-turns, which constituted only 6.92% to 8.97% of the total secondary structure content. Tertiary structure prediction showed that seven SAMS proteins from the reference genome XRQ were matching prediction s-adenosylmethionine synthase 2, which including 2 diphosphomethylphosphonic acid adenosyl ester and 2 potassium ion (Supplementary Figure S1).
3.2 Phylogenetic and evolution analysis of HanSAMS gene
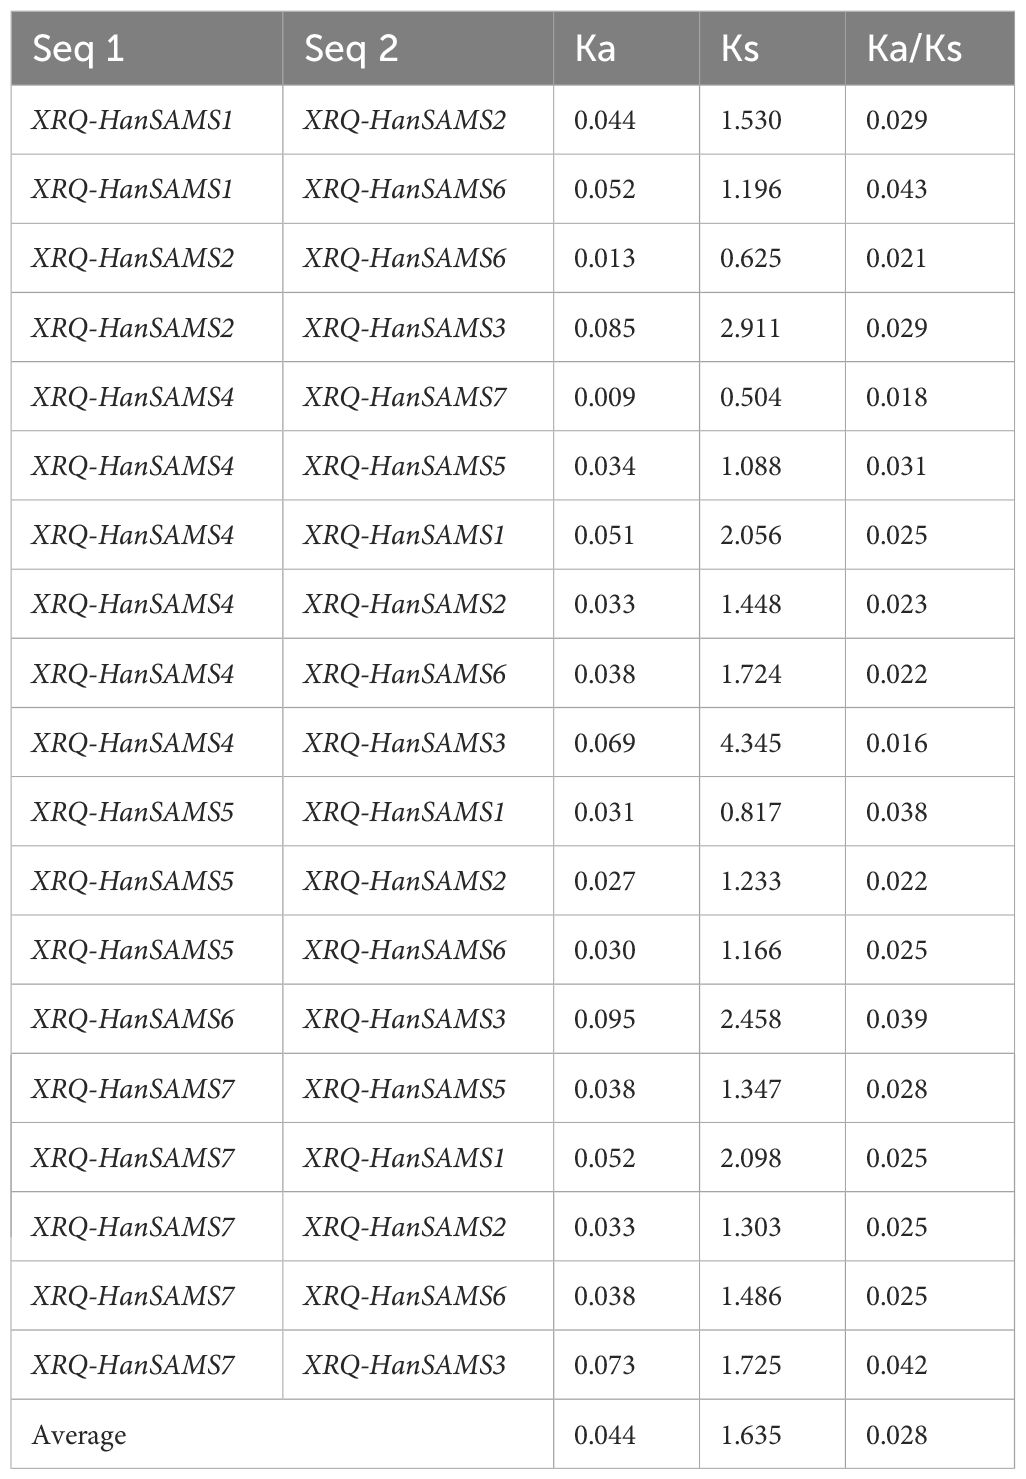
The phylogenetic analysis of nine cultivated sunflower SAMS proteins were performed to examine their relationships. Based on the constructed phylogenetic tree, the SAMS genes could be classified into two major clades with seven groups (SAMS1-SAMS7) (Figure 1). Clade I, which is specific to sunflower SAMS genes, was found to branch into three main divisions, with each division containing a pair of distinct SAMS genes: SAMS1 with SAMS5, SAMS6 with SAMS2, and SAMS4 with SAMS7 (Figure 1). It is proposed that the WGT-1 event around 38-50 million years ago (Badouin et al., 2017) was possibly responsible for generating three homologs within the sunflower SAMS gene family, establishing the three principal branches. Subsequently, the WGD-2 event, occurring approximately 29 million years ago (Badouin et al., 2017), is believed to have caused the duplication of each branch, resulting in two copies per branch and shaping the present structure of the clade I gene family. Notably, the clade II only consists of the SAMS3 group and is uniquely distributed on a separate branch and forms a striking cluster with three homologs from A. thaliana. This finding suggests that the SAMS3 group may share a common ancient ancestor with A. thaliana and appears to have not undergone the most recent whole-genome duplication event, due to lacking the partnered SAMS group that are found clustered together in other SAMS groups. To explore the expansion mechanism of the HanSAMS gene family, we analyzed gene duplication events in sunflowers using the reference genome XRQ. We found that the HanSAMS genes are distributed across seven chromosomes, with one gene per chromosome (see Figure 2), and no tandem clusters were identified. Subsequently, we investigated the gene collinearity within sunflowers and identified 12 pairs of duplicated genes (Figure 2), suggesting that whole genome duplication (WGD) is the primary driver behind the expansion of the HanSAMS gene family. The Ka/Ks values were all lower than 1 for the duplicated genes (Table 2), indicated that the SAMS gene family in sunflower has predominantly experienced purifying selection. The interspecies collinearity analysis of the HanSAMS gene families among XRQ and other eight sunflowers was further performed, and it was found that there were 134 pairs of collinearity, including 19 pairs of HA89, 19 pairs of OQP8, 18 pairs of HA300, 18 pairs of IR, 18 pairs of RHA438, 16 pairs of PSC8, 14 pairs of LR1 and 12 pairs of PI659440 (Figure 3). The collinear relationship among HA89, OQP8 and XRQ genes is the strongest, followed by HA300, IR, RHA438, and the least in PI659440, which may reflect the divergency among nine different cultivated sunflowers.
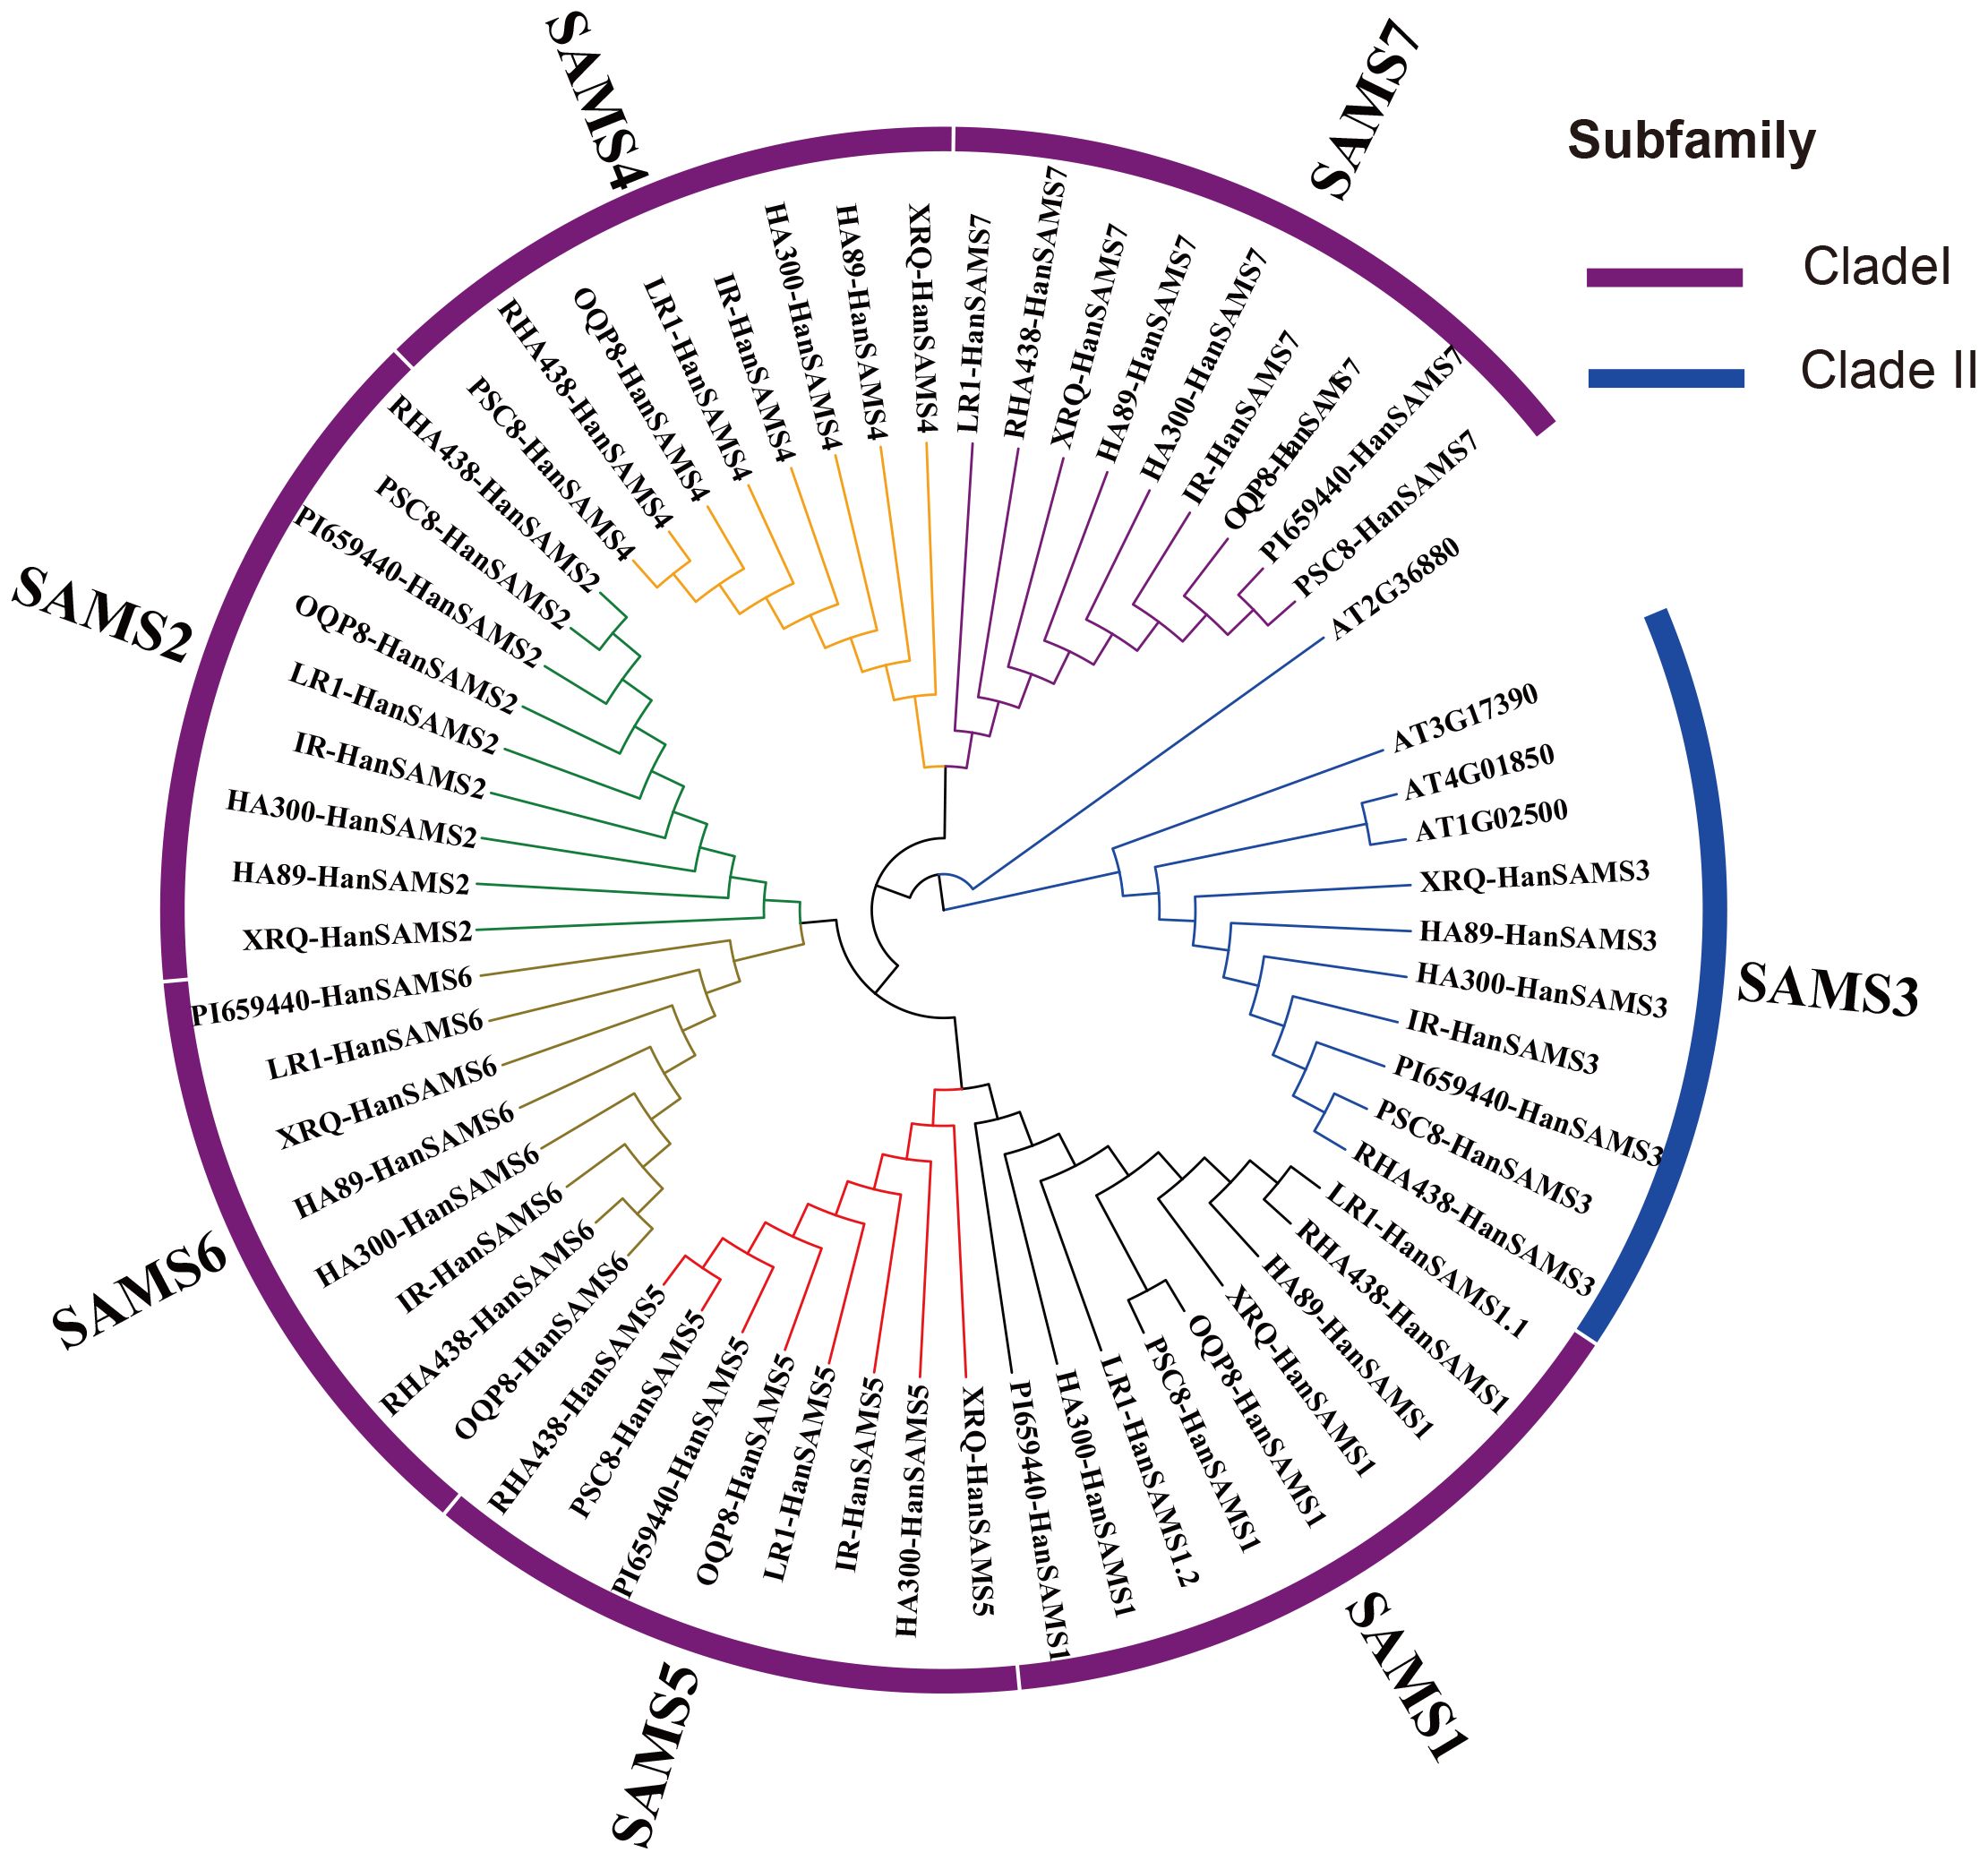
Figure 1. Identification of HanSAMS genes in nine cultivated sunflowers. Phylogenetic tree of nine cultivated sunflowers and Arabidopsis SAMS genes.
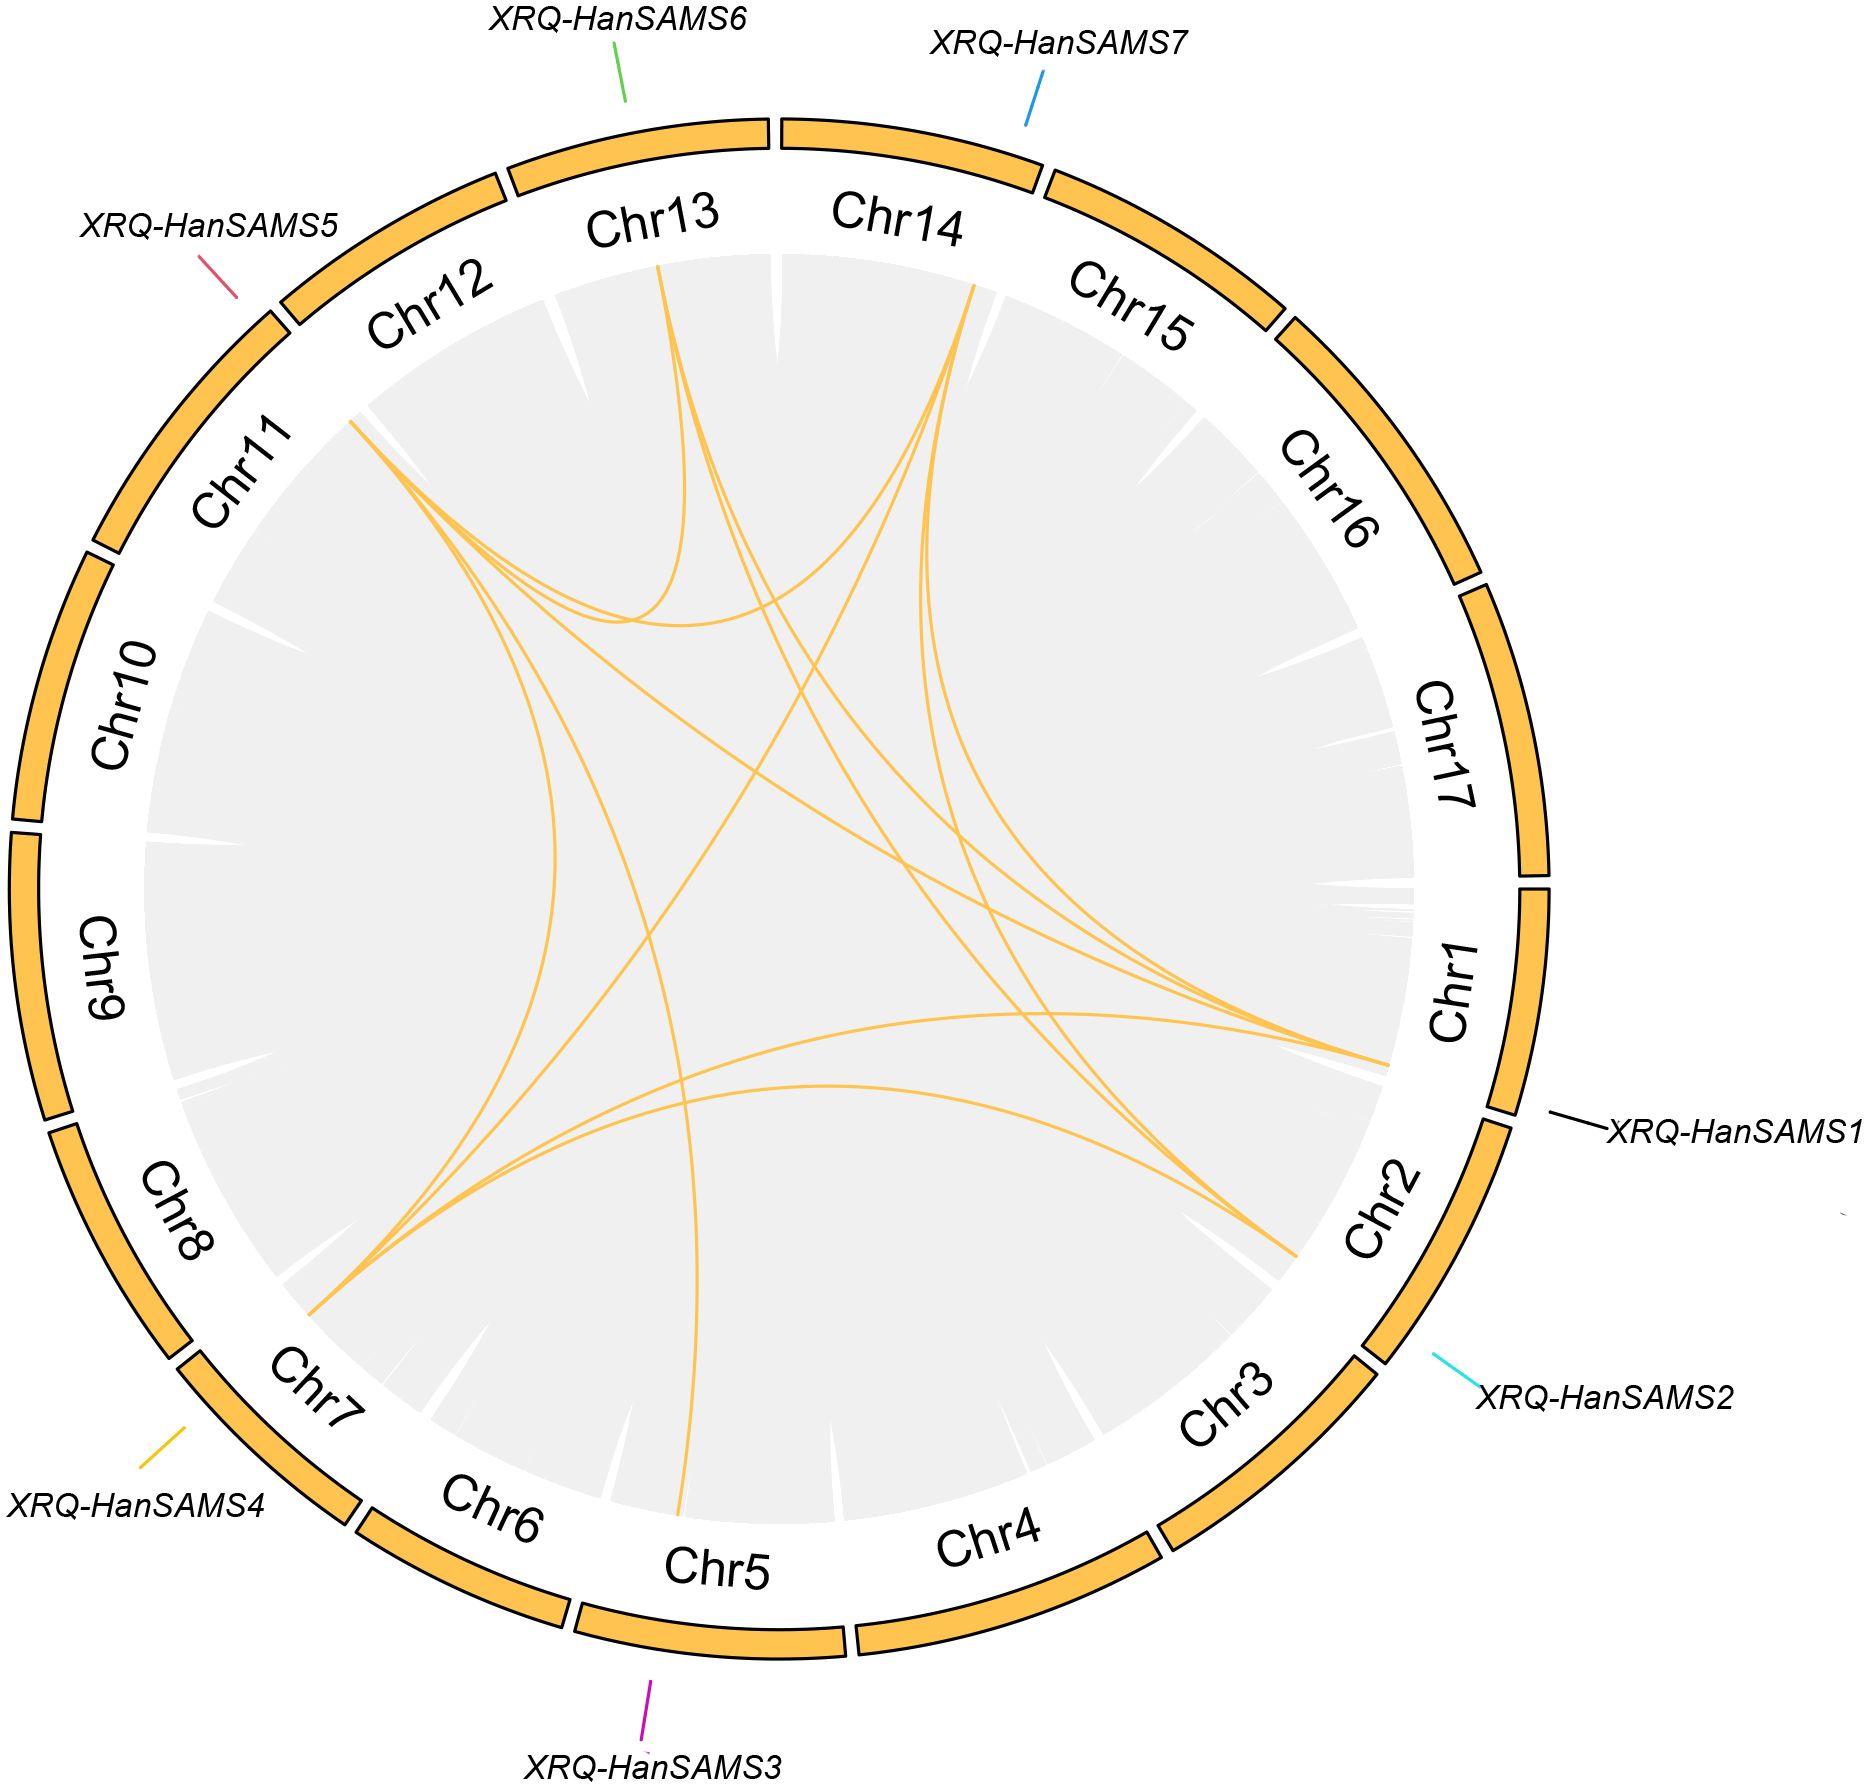
Figure 2. Chromosomal distribution and collinear relationships of the HanSAMS family. The collinearity of all genes within the sunflower is connected by gray background lines, and the collinearity where the SAMS gene is located is marked with yellow lines.
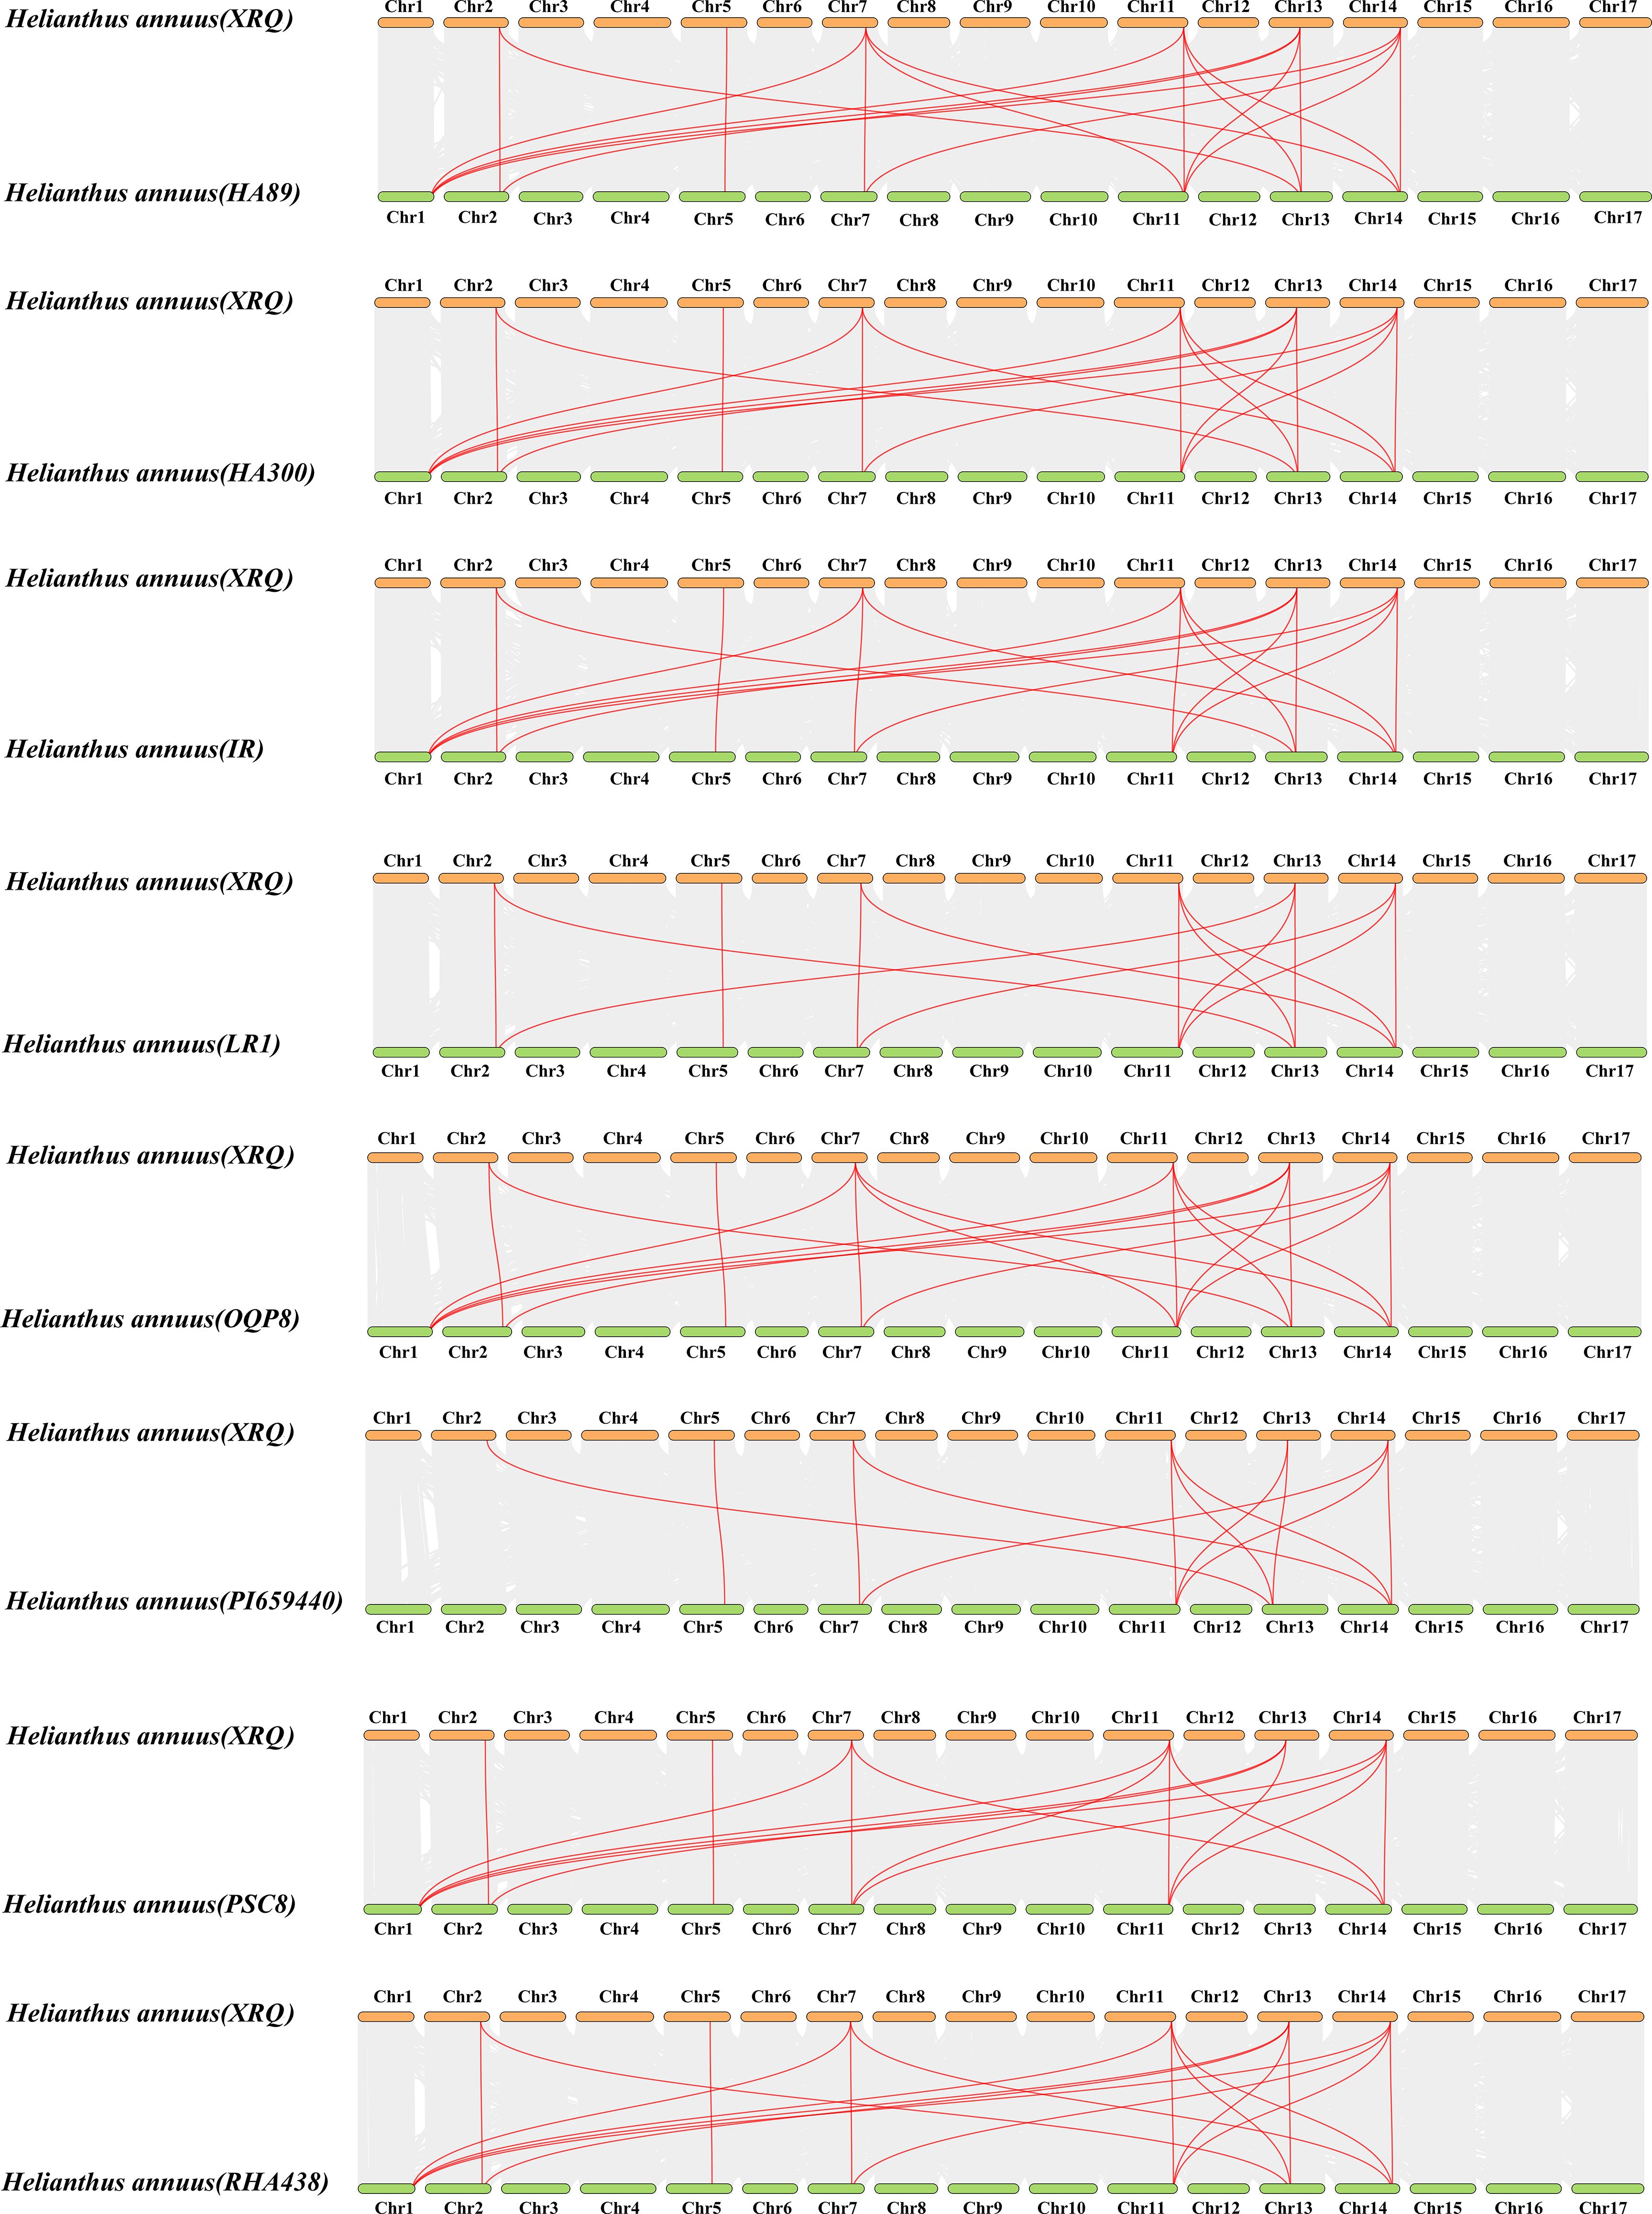
Figure 3. Collinearity analysis of HanSAMS gene families between XRQ and other eight cultivated sunflowers. gray lines indicate all synteny blocks in the sunflower genome, and the red lines indicate duplicated SAMS gene pairs, the chromosome number is indicated at the top or bottom of each chromosome.
3.3 Genes structure and subcellular localization analysis
Examination of gene structures revealed that all SAMS gene in nine sunflowers have only one exon and are devoid of introns (Figure 4A). The HA300-HanSAMS1, HA300-HanSAMS5, HA89-HanSAMS1, LR1-HanSAMS1.1, LR1-HanSAMS1.2, LR1-HanSAMS2, LR1-HanSAMS4, LR1-HanSAMS5, LR1-HanSAMS6, OQP8-HanSAMS1, OQP8-HanSAMS5, PI659440-HanSAMS1, and XRQ-HanSAMS1 were all lacked 5’ and 3’ untranslated regions (UTRs). The subcellular localization prediction suggested that the majority of SAMS proteins are predominantly found in the cytoskeleton, with the exception of SAMS3, which is localized in the cytoplasm, as shown in Figure 4B. The motifs of SAMS protein sequences were predicted using the MEME server, and all members of the SAMS contain motif1-motif10 (Supplementary Figure S2A), indicating highly conserved between different SAMS and different cultivars. The motif2 and motif5 were s-adenosylmethionine synthase domain (central domain), motif1 was s-adenosylmethionine synthase domain (N-terminal domain), motif3 and motif4 were s-adenosylmethionine synthase domain (C-terminal domain), about 50 amino acid residues long and is considered a key element (Supplementary Figure S2B).
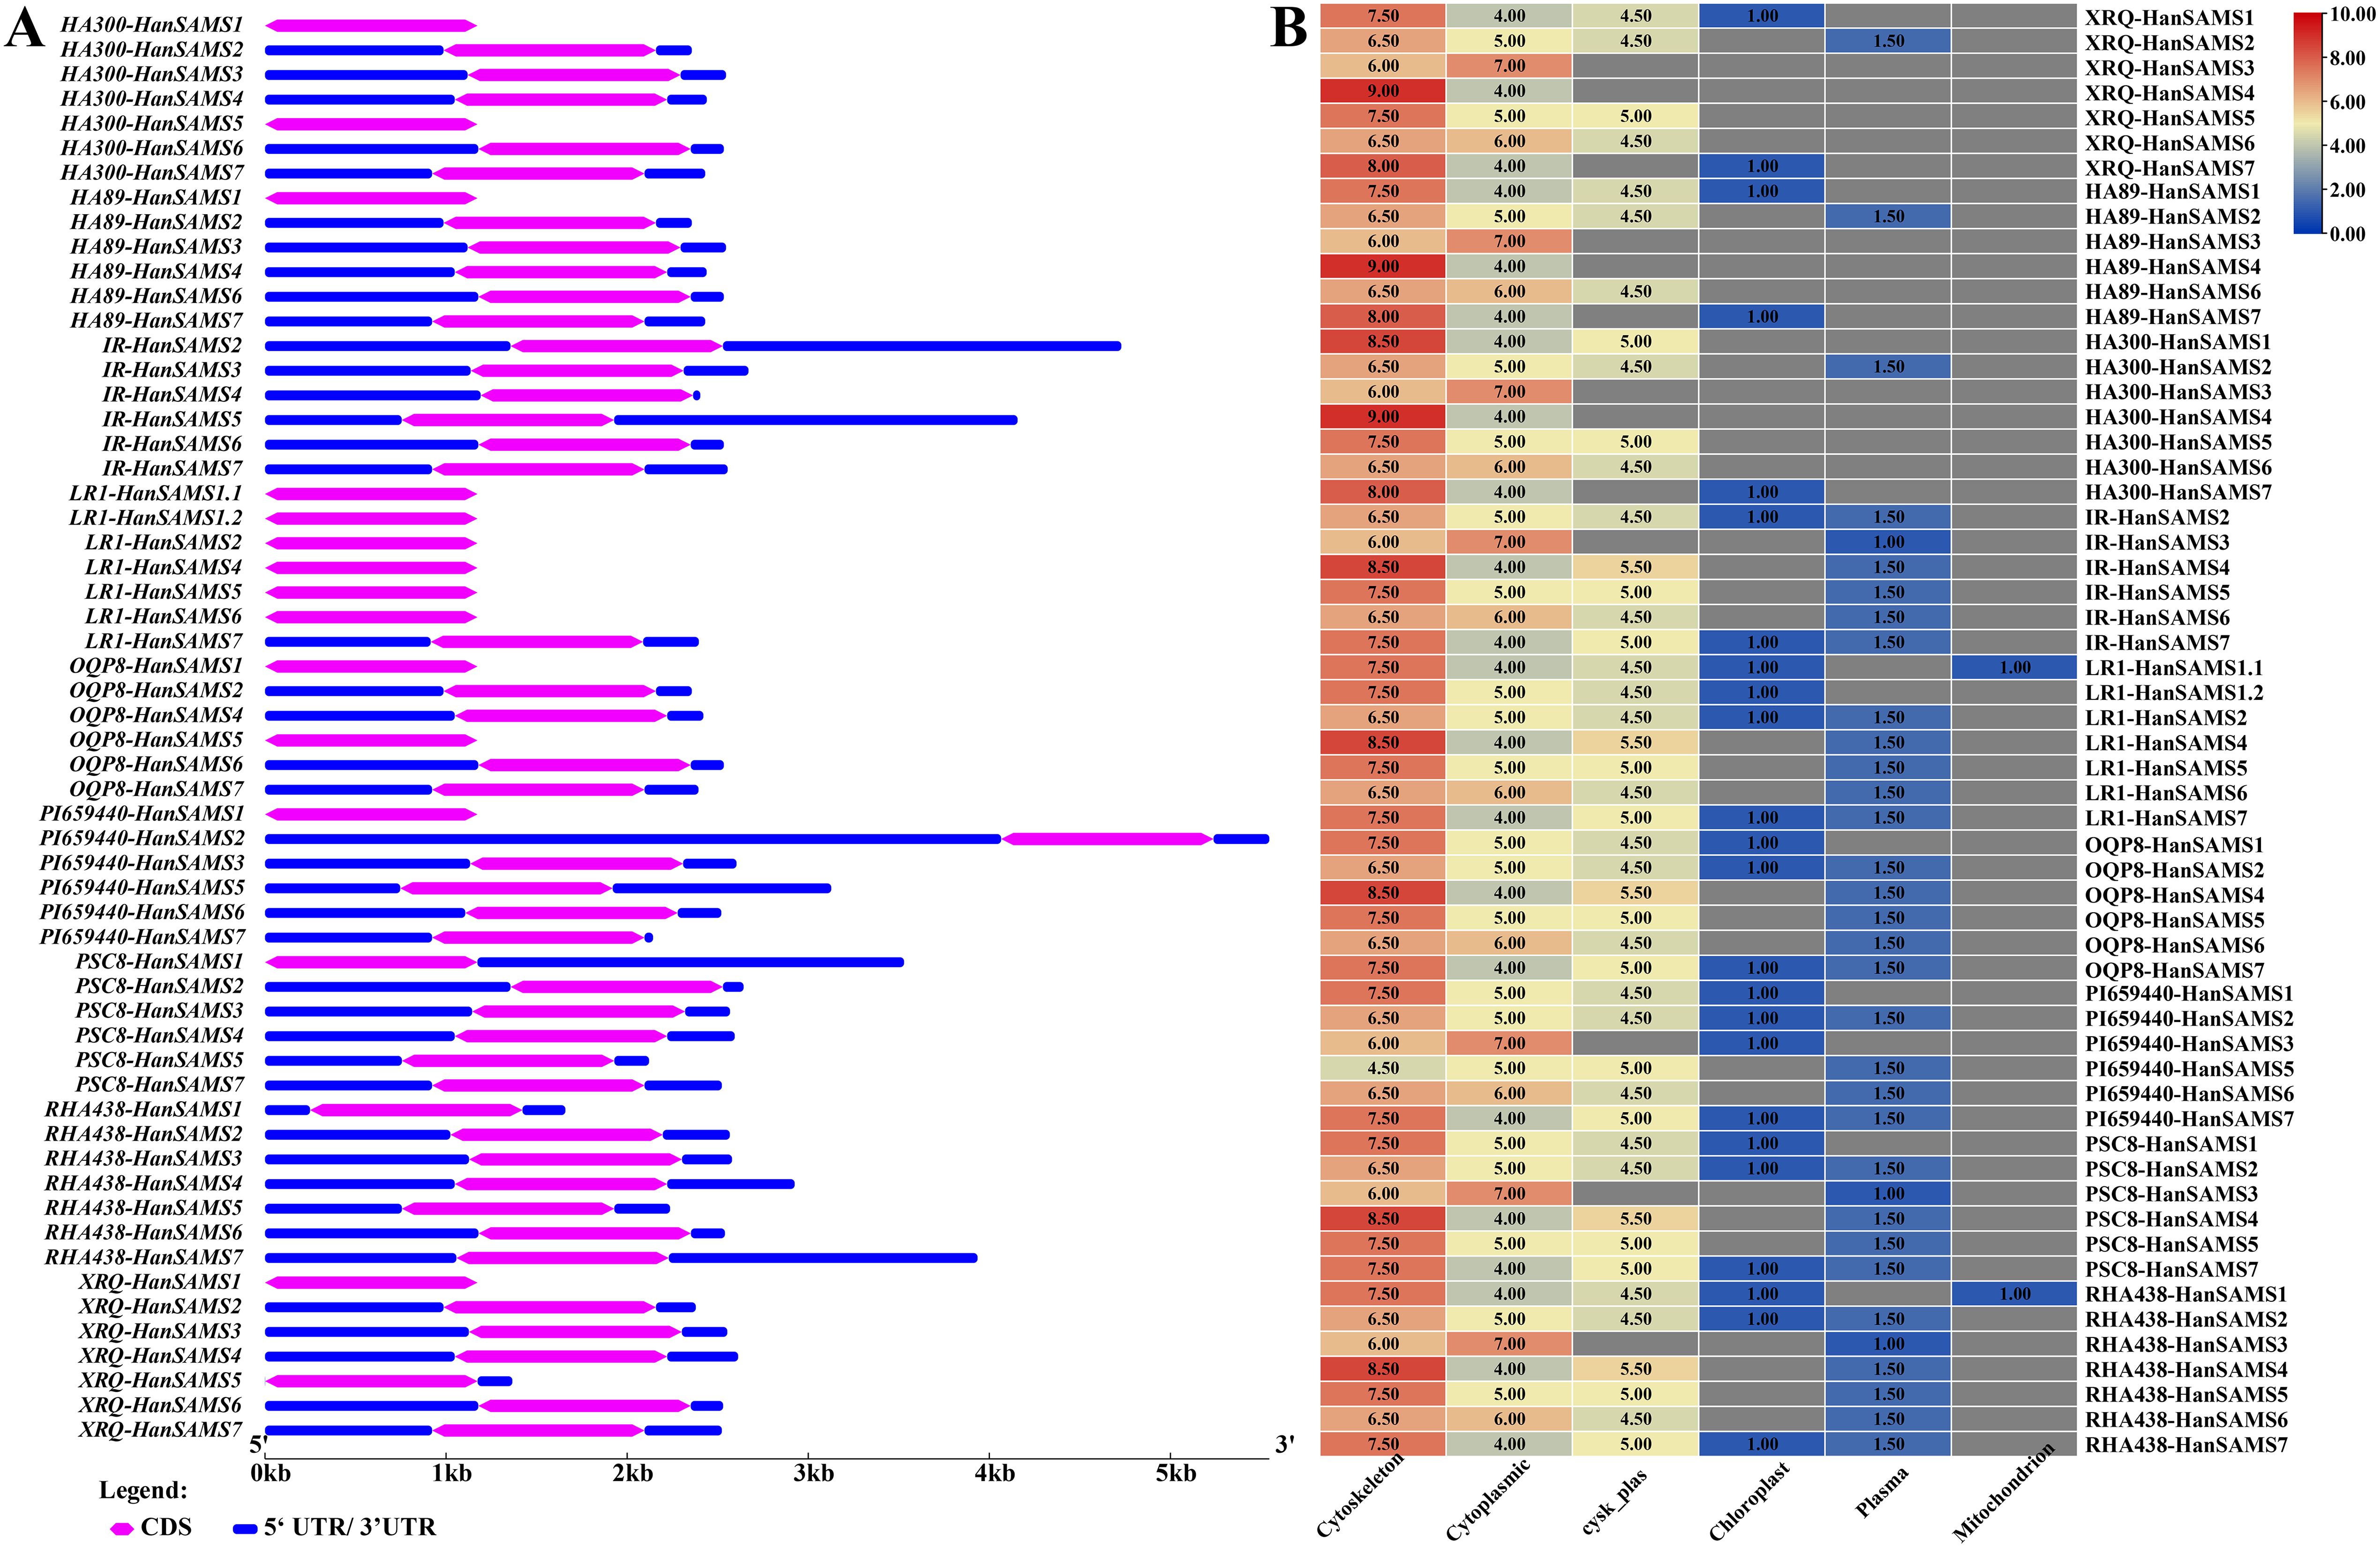
Figure 4. Gene structure and subcellular localization of HanSAMS genes in nine cultivated sunflowers. (A) Comparison of the gene structures of SAMS genes in nine cultivated sunflowers. (B) Comparison of subcellular localization of HanSAMS genes in nine cultivated sunflowers. The values in heatmap represents sorting signals for each candidate locations. Cysk_Plas, cytoskeleton and plasma membrane.
3.4 Analysis of the codon usage bias of HanSAMS genes
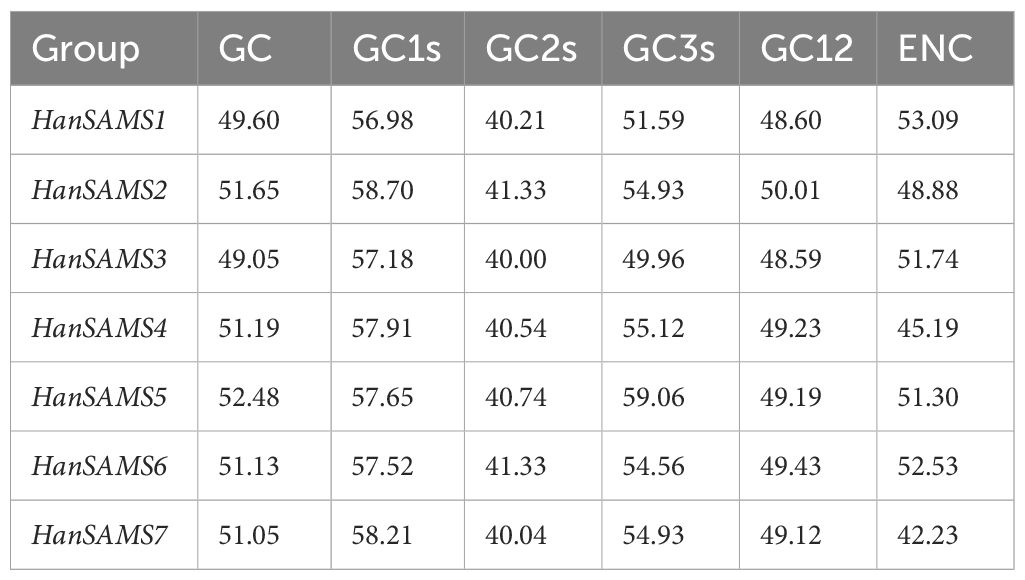
The codon usage bias (CUB) of SAMS gene family in nine sunflowers species was investigated by analyzing the GC, GC1, GC2, and GC3 content (Supplementary Table S3). The GC content of the HanSAMS genes among the nine sunflower genomes ranged from 48.95% to 52.59%, with all group of SAMS and group SAMS3 having the lowest value 50% (Table 3). The GC1 content of all HanSAMS genes and the GC3 content of 91.38% of HanSAMS genes across nine sunflower species exceeded 50%, while the GC2 content remained below 50%. This suggests a notable variation in base composition at different positions and a pronounced bias towards G/C-rich start and stop codons. Although CUB across all HanSAMS genes was generally weak, as indicated by ENc values ranging from 41.76 to 53.62, there were variations among different SAMS groups. Specifically, HanSAMS2, HanSAMS4, and HanSAMS7 exhibited lower ENc values (<50%), suggesting a stronger preference for certain codons compared to HanSAMS groups 1, 3, 5, and 6 (see Supplementary Table S3 for details). The ENc-plots of HanSAMS genes exhibit deviations from the expected curve, suggesting that natural selection predominantly influences CUB (Supplementary Figure S3).
The neutrality curve analysis of GC12 and GC3 values of nine sunflowers HanSAMS gene family revealed positive correlation between GC12 and GC3, with R values ranging from 0.11(IR-HanSAMS) to 0.72(HA89-HanSAMS) and the regression coefficients varying from 0.0576(IR-HanSAMS) to 0.18(HA89-HanSAMS), indicated that CUB of HansSAMS genes was mainly affected by natural selection (Supplementary Figure S4). The PR2-plot analysis reveals the distribution of the third base at the codon. The results show an uneven distribution of scatters across the four regions (Figure 5). Scatters in the top and bottom are predominantly in the lower half, indicating a preference for T at the third position. Those on the left and right are mostly in the left half, indicating a preference for C at the third position. Comparison among the quadrants shows the highest number of scatters in the quadrant three, suggesting a preference for C/T at the third position, implying that natural selection is the primary factor leading to CUB.
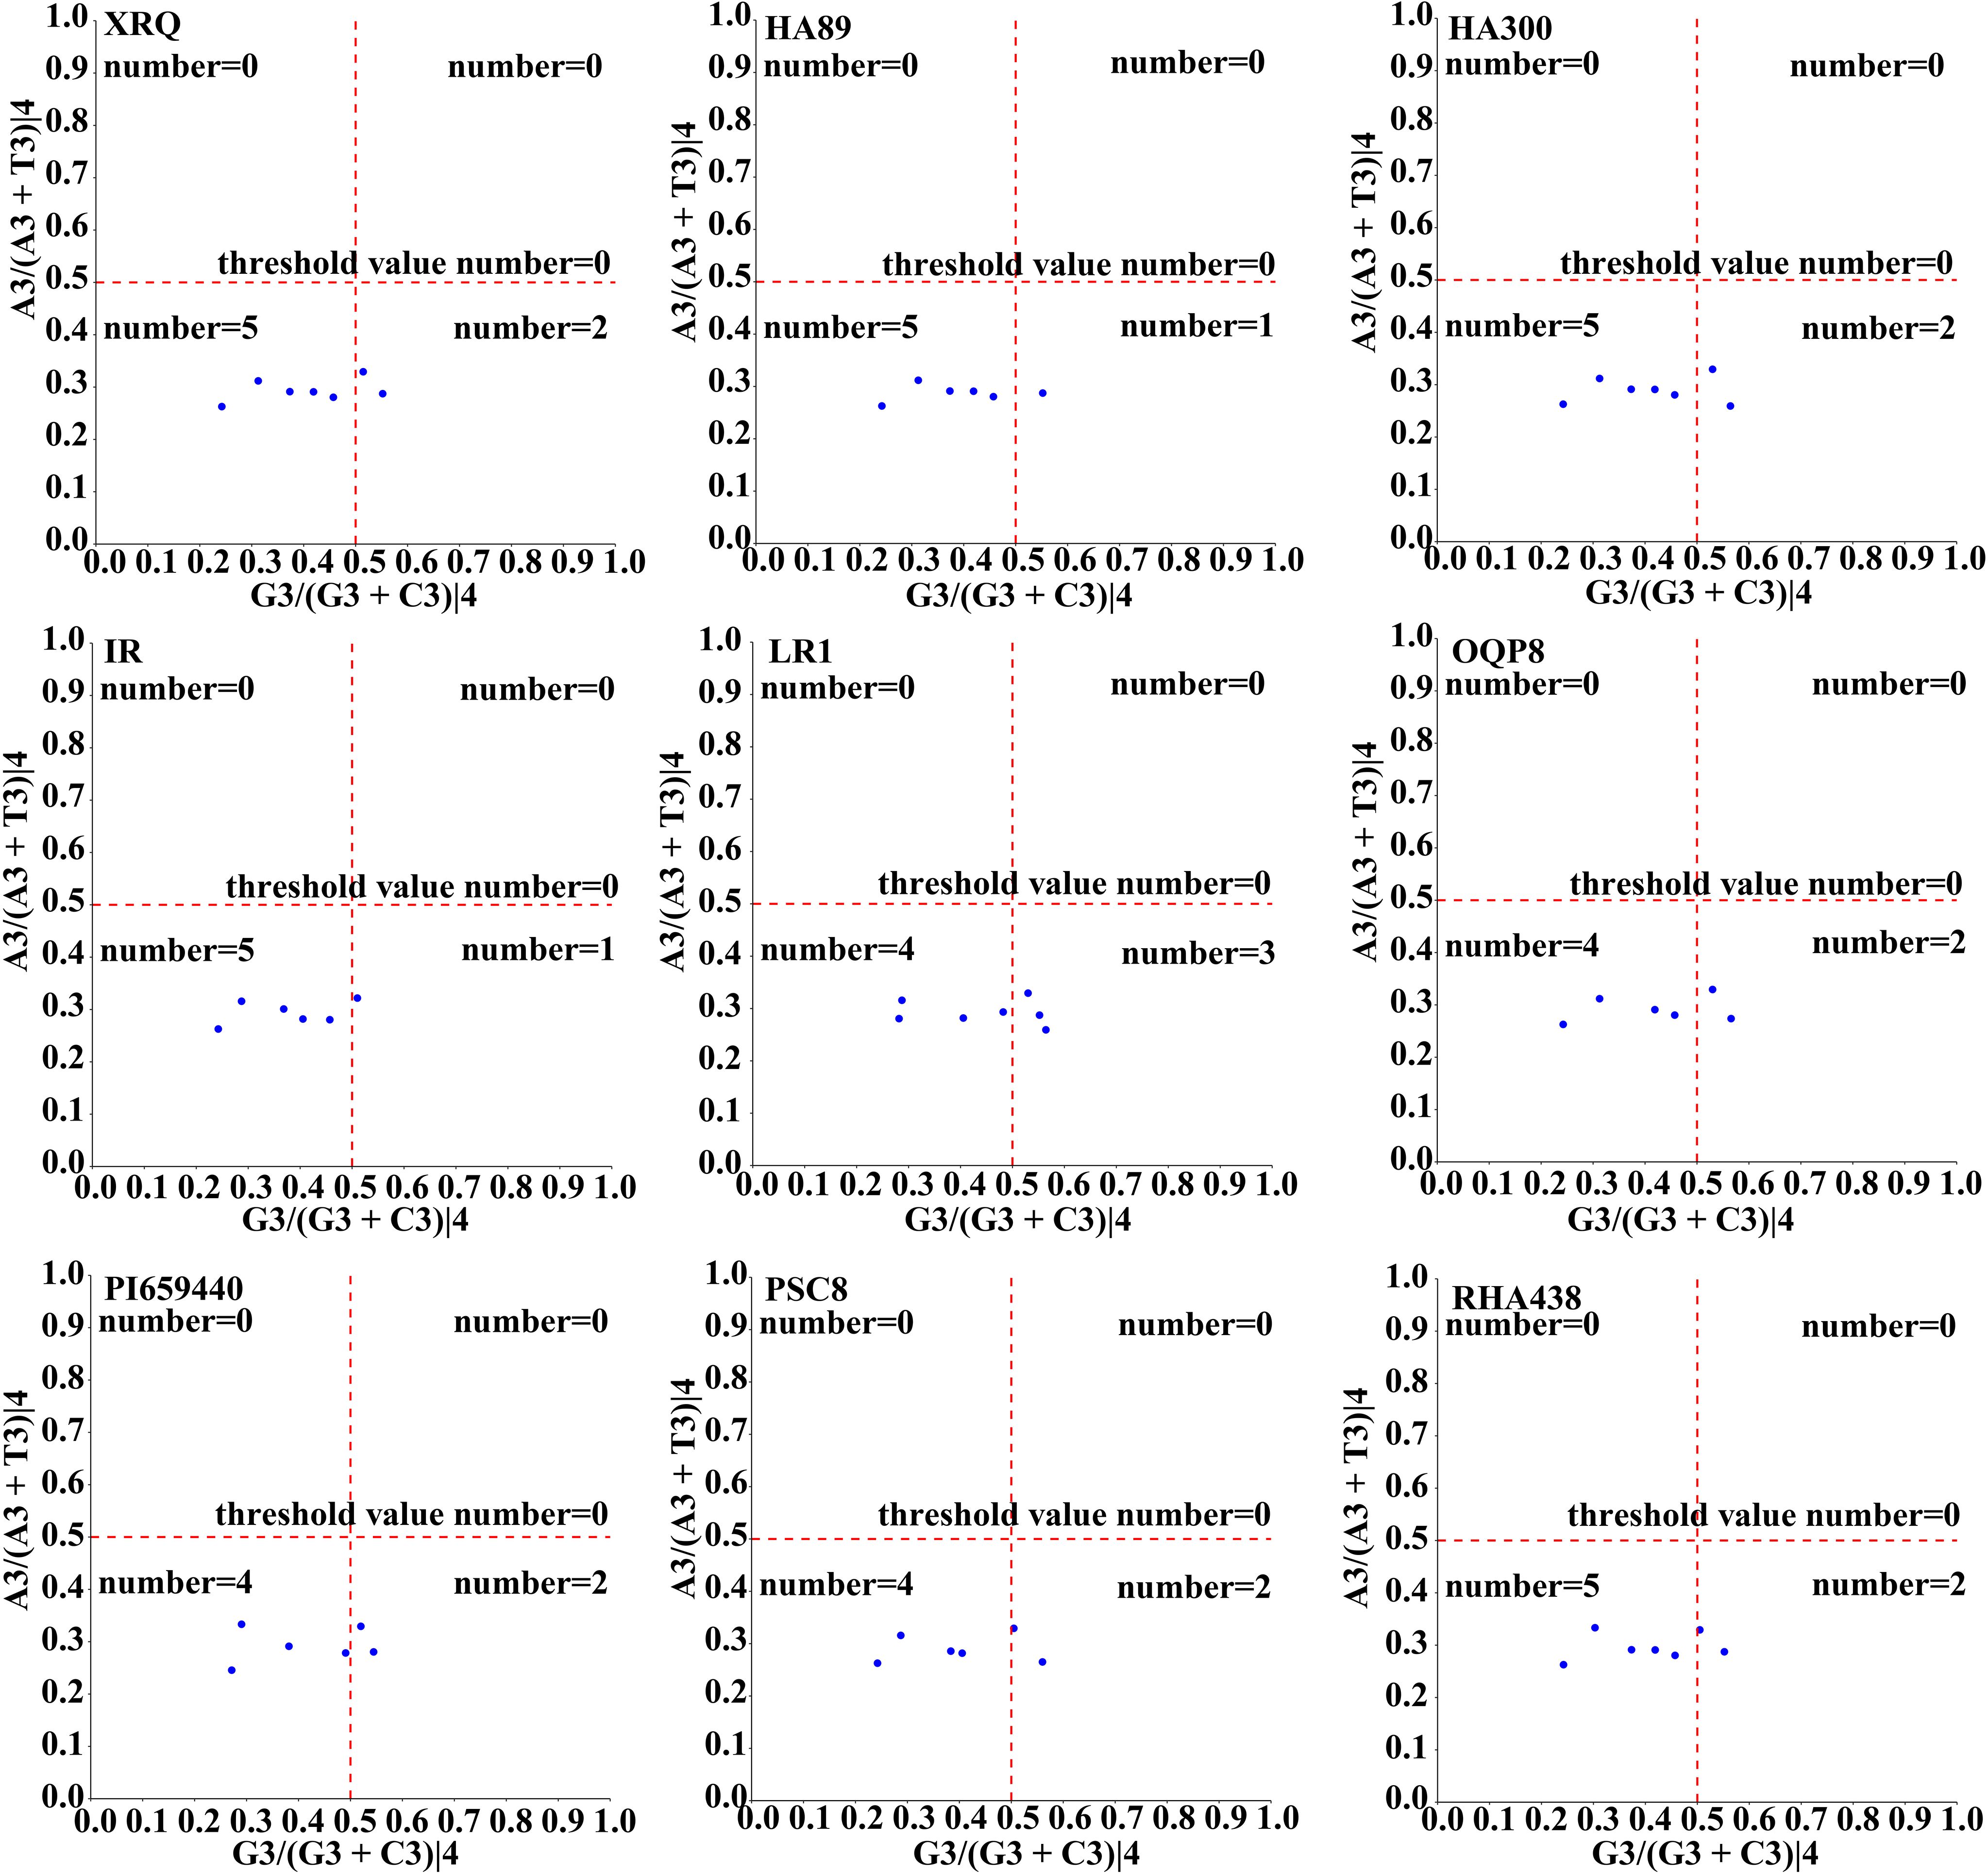
Figure 5. PR2-plot analysis of the HanSAMS gene family in nine sunflowers. A3/(A3+T3)|4 and G3/(G3+C3)|4 represents the four-codon degenerate amino acids.
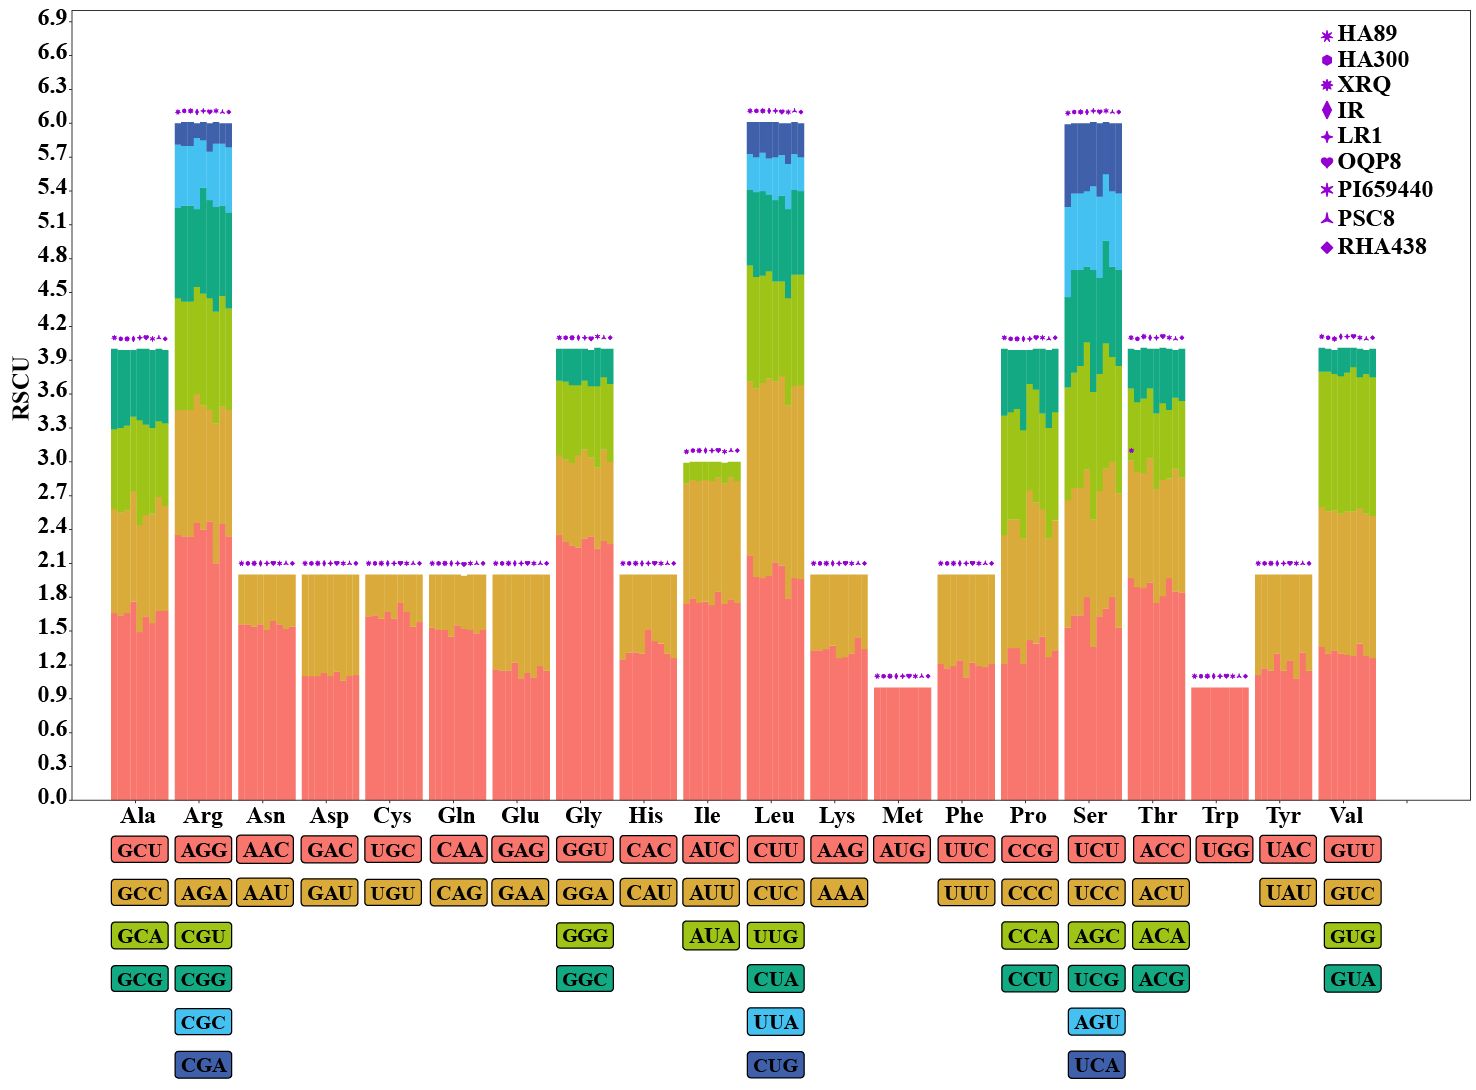
RSCU (relative synonymous codon usage) is a pivotal metric that quantifies CUB by comparing the observed frequency of each synonymous codon to its expected frequency under equal usage. The RSCU values of the HanSAMS genes were calculated and the results showed there were 22 codons shared by all nine sunflower cultivars with RSCU values greater than 1, of which 15 codons end with C/G (Supplementary Table S4; Figure 6). Conversely, low-frequency codons, which end in A/U, were also prevalent (22 of 35), indicating a bias for these codons in the gene family. The top 3 codons with the largest average RSCU value were encode Arg (AGG with RSCU 2.36), Gly (GGU with RSCU 2.29) and Leu (CUU with RSCU 2.00). The RSCU value varied among cultivars but were generally similar, suggesting a consistent pattern of codon usage across the SAMS gene family.
3.5 Cis-element analysis
Promoter cis-acting elements are crucial for regulating gene expression. We utilized PlantCARE to identify cis-acting elements in the promoter regions of 58 HanSAMS genes (Supplementary Table S5, Supplementary Figure S5). Our statistical analysis showed these elements involved in various plant processes, including growth, development, hormone response, light response, and stress response (Figure 7A). Notably, stress response elements predominated in the HanSAMS promoters (Figure 7A). In detail analysis, 302 MYB binding site, 191 anaerobic induction (ARE element),186 MYC binding site and 149 stress response element (STRE element) were predicted with high frequency in the promoter region of HanSAMS genes (Figure 7B; Supplementary Table S5). Additionally, 624 light response-related elements were identified, such as MRE (n=105), GT1-motif (n=103), G-box (n=94), Box 4 (n=87) (Supplementary Table S5). Hormone response-related cis-regulatory elements were also observed, such as 108 salicylic acid responsiveness (TCA, as-1), 92 abscisic acid responsiveness (ABRE), 78 gibberellin-responsiveness, 74 MeJA-responsiveness (CGTCA-motif, TGACG-motif), and 41 ethylene response elements (ERE) (Figure 7B; Supplementary Table S5). We also noted that while most SAMS genes within the same group shared similar element distributions across different cultivars, some cultivars exhibited distinct differences (see marked with black boxes in Figure 7B). For instance, the SAMS3 gene in the IR cultivar contained 12 salicylic acid response elements, which is significantly higher than other cultivars by at least three folds. These differences may be linked to the cultivars’ adaptability to environmental stresses and functional selection during evolution. Collectively, our findings suggest that SAMS genes are likely broadly involved in the regulation of hormones and stress responses.
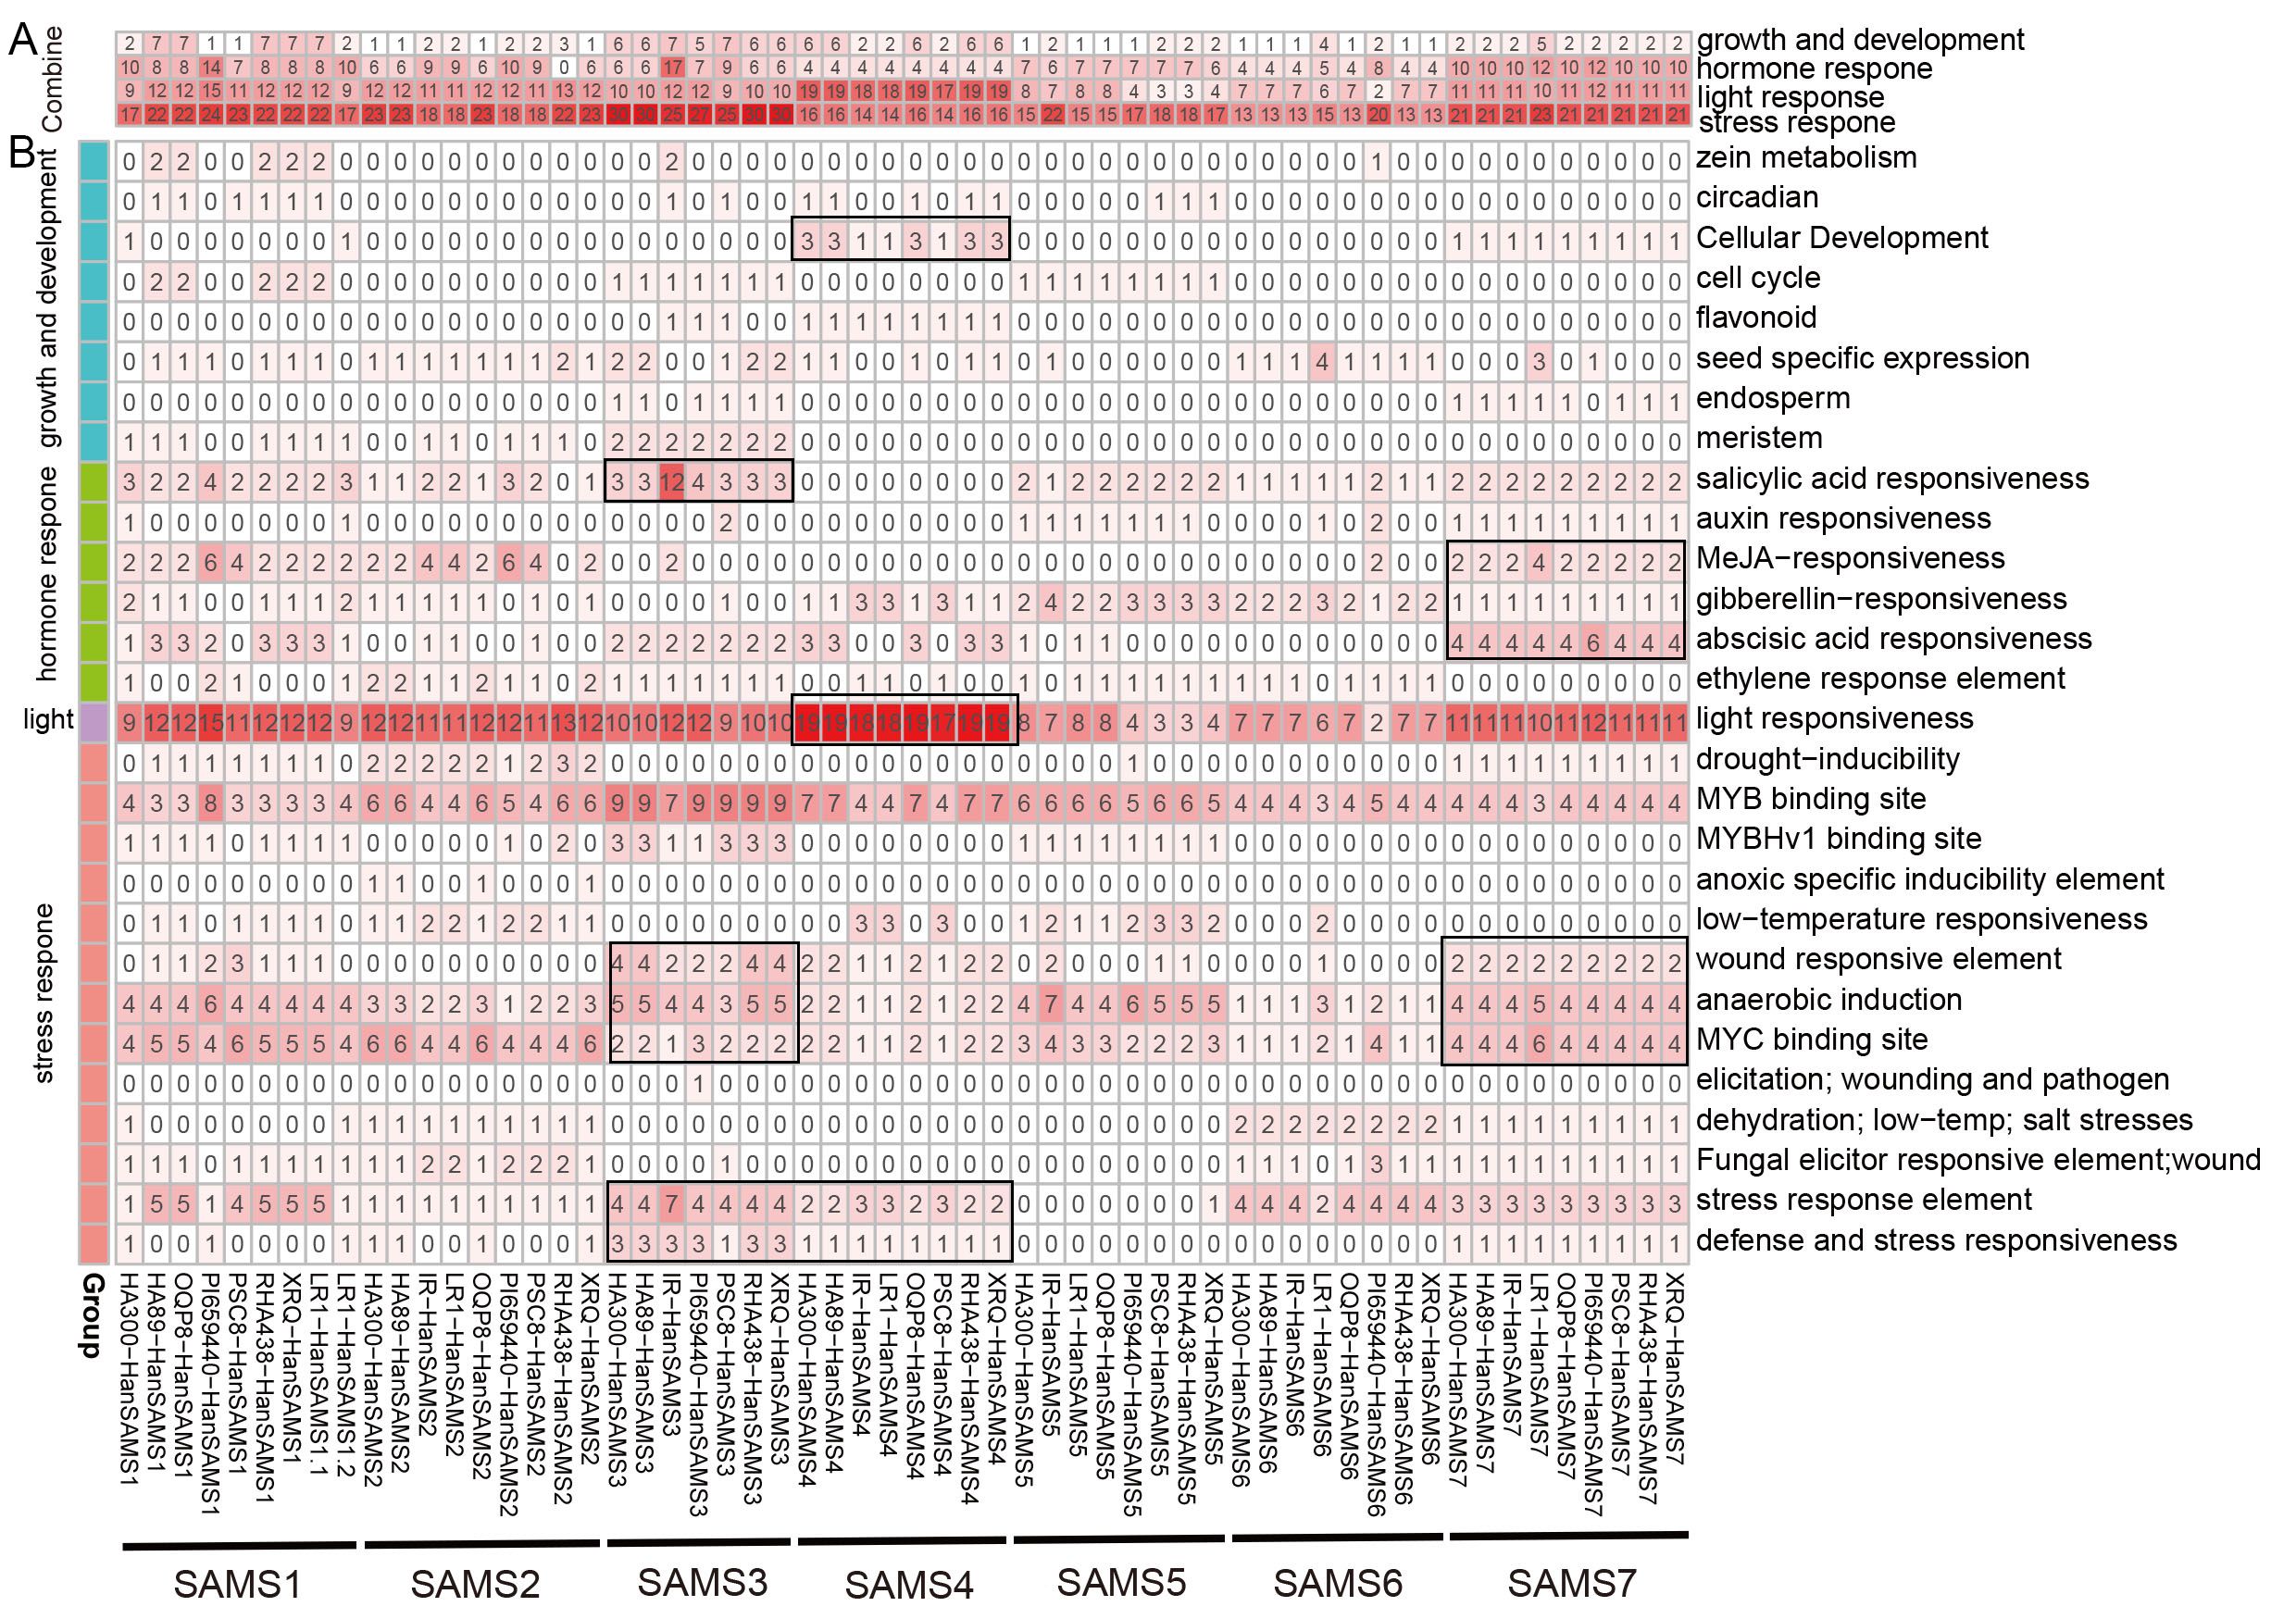
Figure 7. Analysis of the cis-element of HanSAMS genes. (A) Classification of cis-elements of HanSAMS promoters into four main groups: growth and development, hormone response, light responses and stress response. (B) Detail analysis of cis-elements in four groups for each HanSAMS gene promoter. The color intensity and number in each square indicate the number of each type of cis-element in the promoter region of the indicated gene. The distribution patterns of genes within the SAMS group that we are mentioned are marked with black boxes.
3.6 Expression patterns of HanSAMS genes in different tissues
HanSAMS genes may have different functions in the growth and development of sunflowers. To determine the spatial expression pattern of HanSAMS genes in sunflowers, we measured the expression levels of seven XQR-HanSAMS genes from three tissues (roots, stems, leaves) using qRT-PCR. As shown in Figure 8, seven HanSAMS genes were expressed in all the tissues. Among them, HanSAMS1, HanSAMS3 and HanSAMS5 had similar expression patterns and were expressed highest in leaves. Meanwhile, the expression of HanSAMS4 and HanSAMS7 was higher in stems than in the other three tissues. HanSAMS2 and HanSAMS6, exhibited relatively high expression levels in the root. The results suggested that these genes showed a tissue-specific expression pattern and may play different roles in the growth and development of sunflowers.
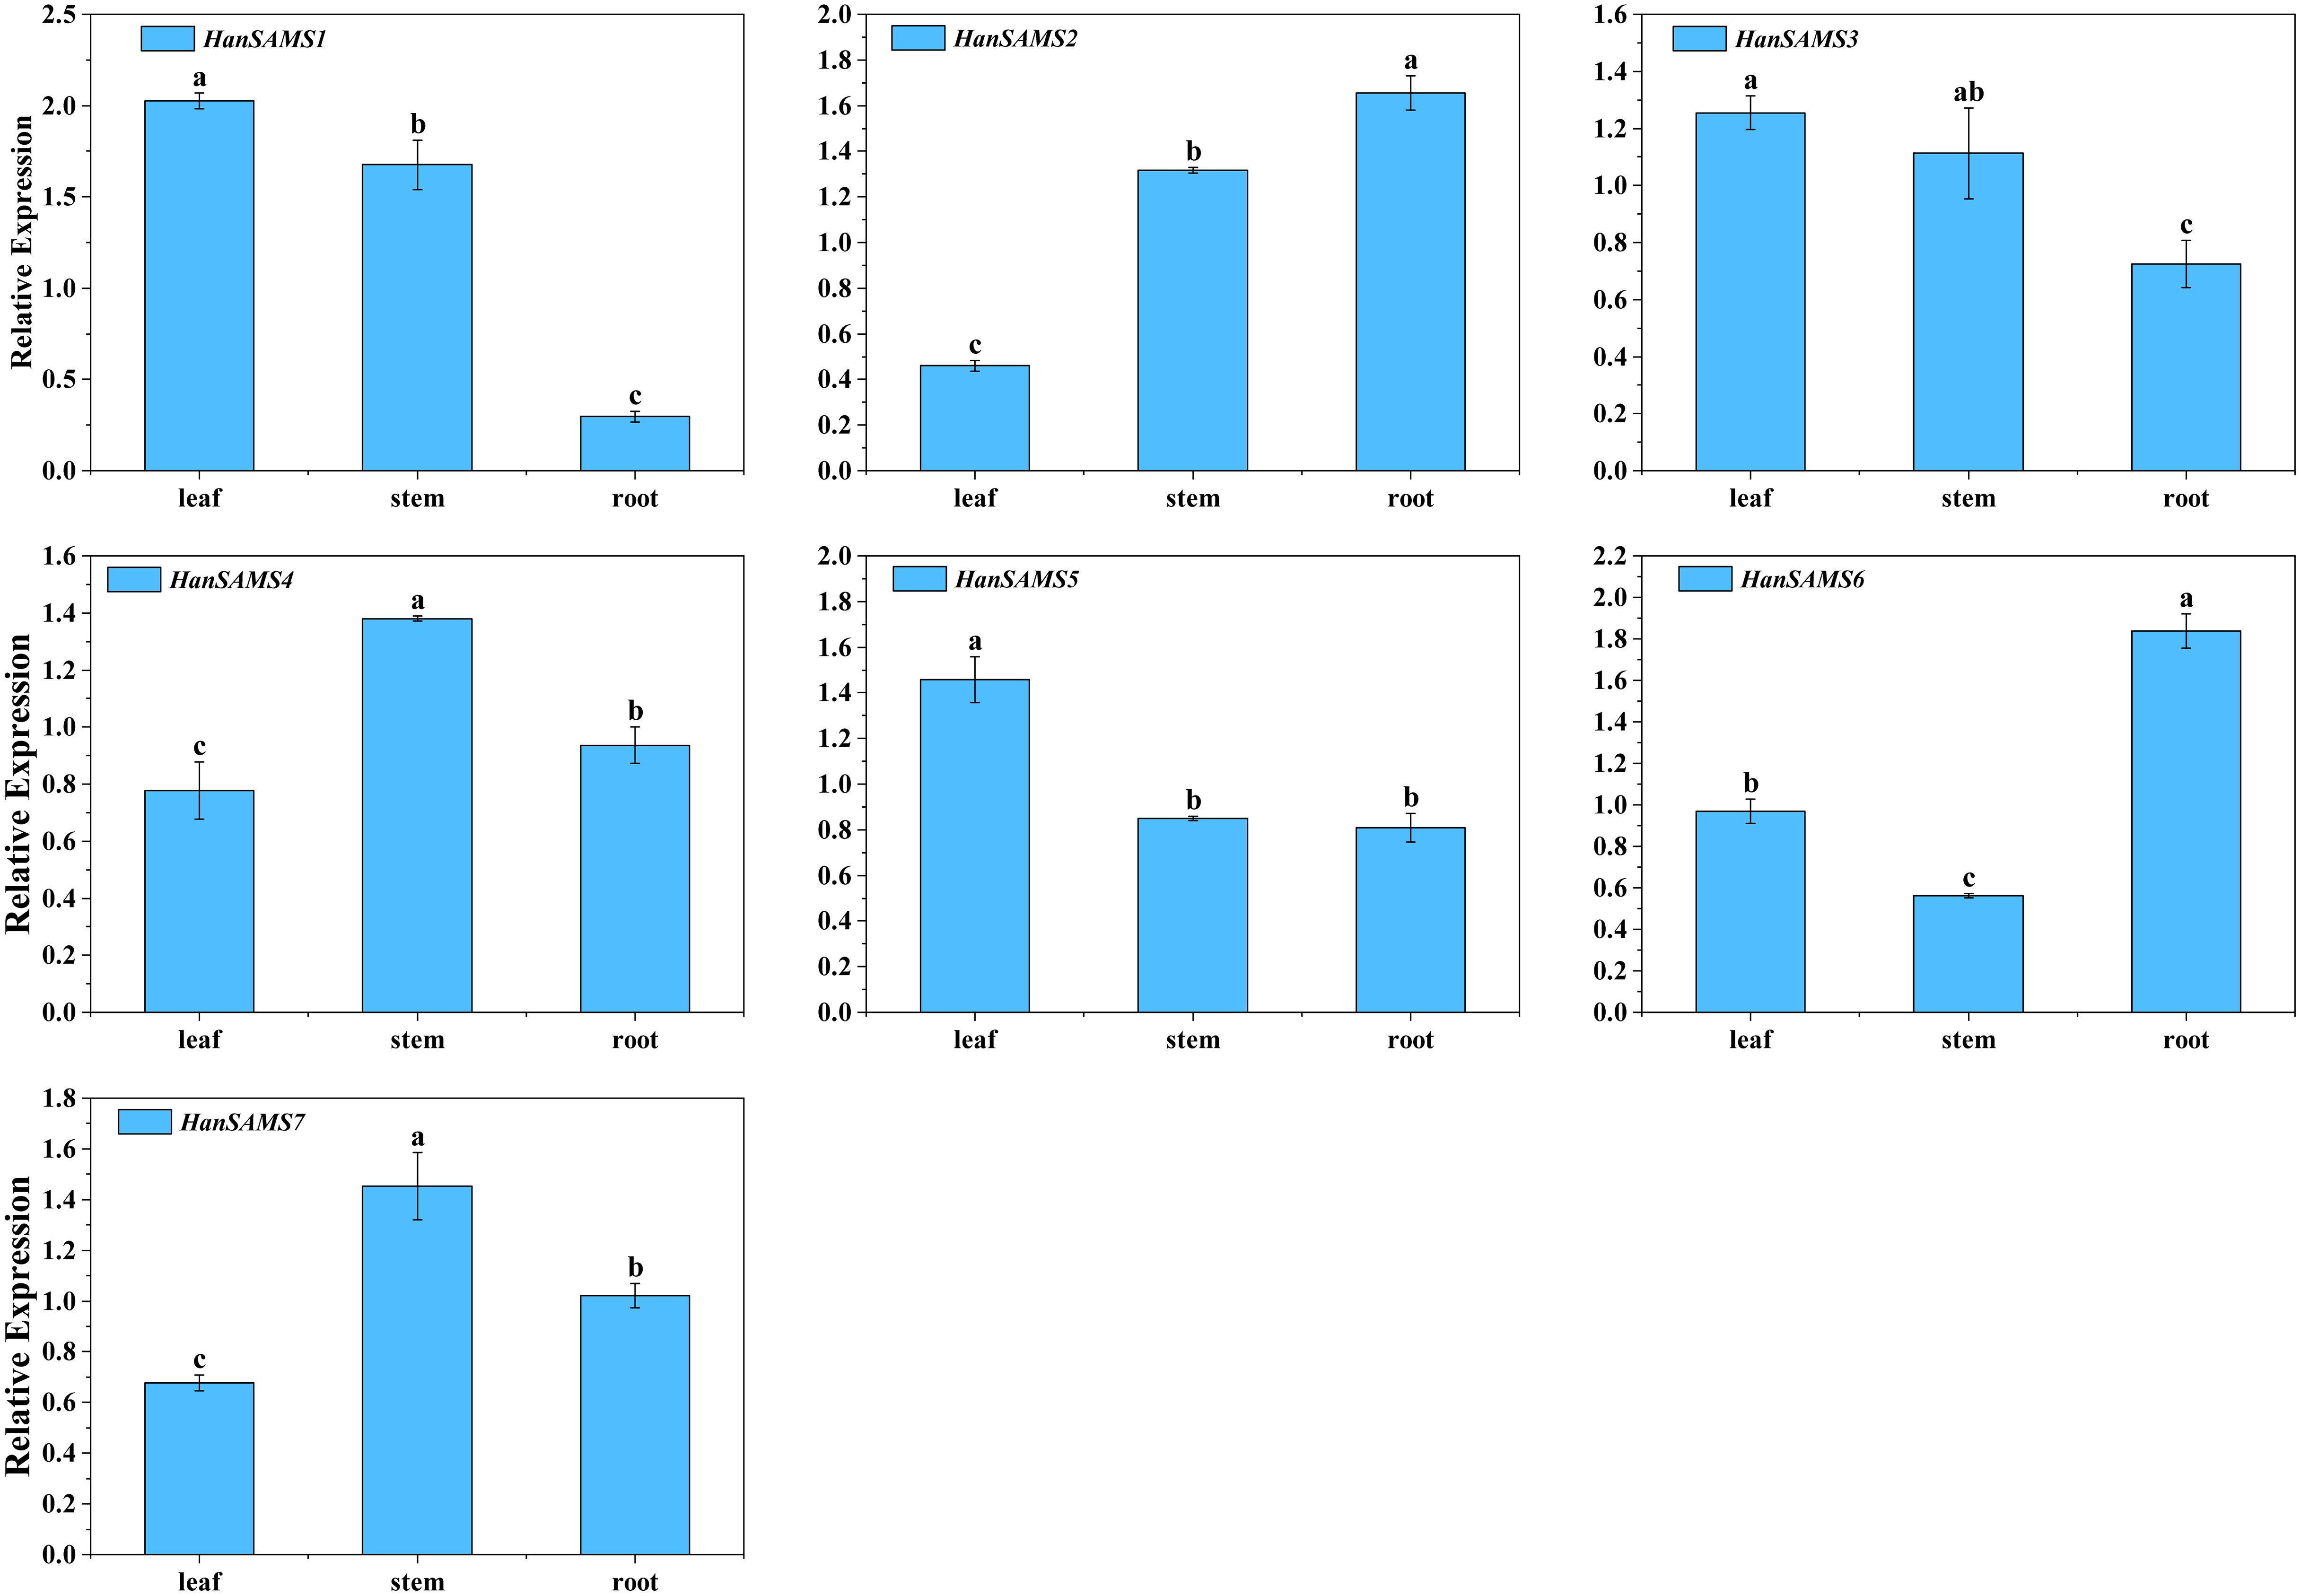
Figure 8. Expression profiles of HanSAMS genes in leaf, stem and root. a, b, c, bar indicates a significant difference among the different tissues (Significant differences were determined using the Duncan’s method of univariate ANOVA with a significance level of P <0.05).
3.7 Expression analysis of HanSAMS genes under different hormonal treatment
Promoter analysis revealed there are many hormonal response elements (Figure 7A) the RNA-seq data available for cultivated sunflower (XRQ) were examined and to elucidate the expression patterns of SAMS genes in response to hormones. A responsive pattern was observed across all HanSAMS genes upon IAA treatment in both leaves and roots (Figure 9), suggesting a pronounced sensitivity to auxin signaling (Song et al., 2024a). In leaf tissues, the HanSAMS gene family—excluding HanSAMS1—demonstrated a significant upregulation in expression following BRA (brassinosteroids) treatment, as depicted in Figure 9A. This underscores their crucial role in the regulatory pathways activated by BRA. However, in root tissues, all HanSAMS genes under BRA treatment conditions did not exhibit a significant increase compared to the control samples (Figure 9B). For other different hormone treatments, we also observed the different expression patterns in different tissues. For instance, HanSAMS3 demonstrates its highest expression levels in leaves following MeJA treatment (Figure 9A), whereas in roots, the ABA treatment elicits its peak expression (Figure 9B). These results indicate that the HanSAMS gene expression is modulated in a tissue-specific manner in response to hormonal signals.
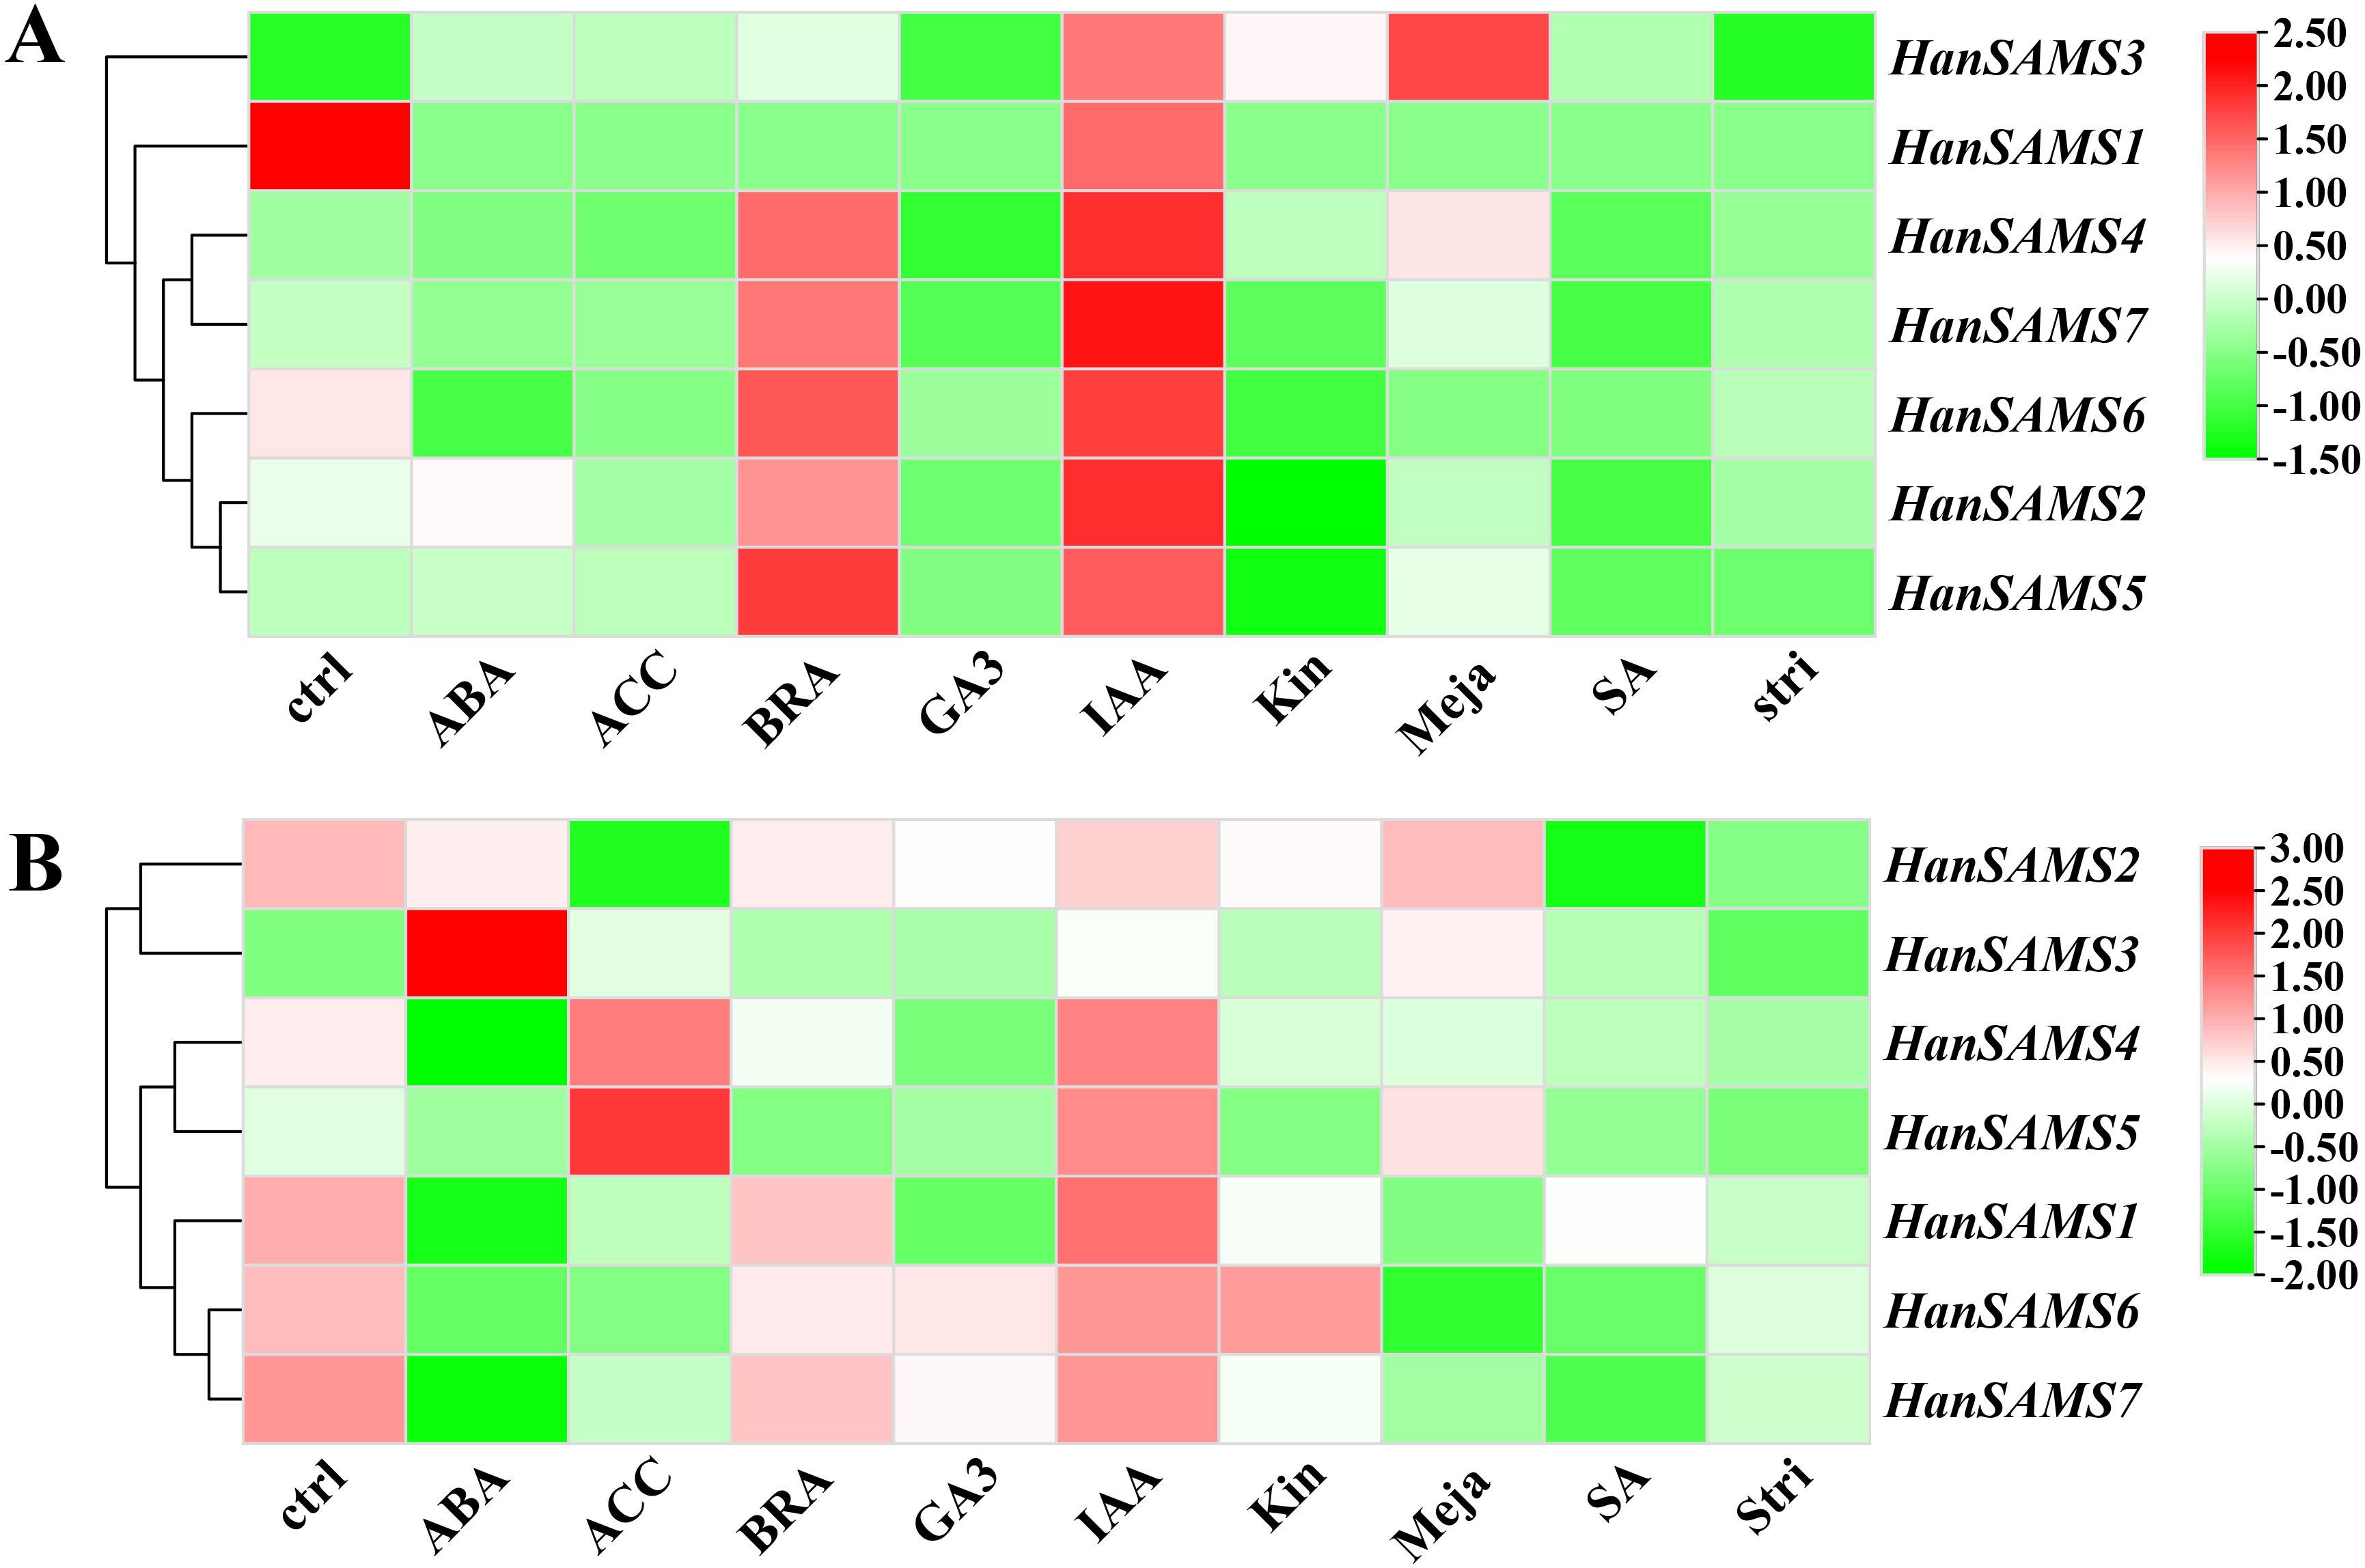
Figure 9. The expression of HanSAMS in different tissues and under different abiotic stresses. (A) HanSAMS gene expression in leaves under exogenous hormone treatment (SRP092742); (B) HanSAMS gene expression in roots under exogenous hormone treatment (SRP092742). ctrl, control; ABA, abscisic acid; ACC, Ethylene; BRA, Brassinosteroids; GA3, Gibberellic Acid 3; IAA, Indole Acetic Acid; Kin, Kinetin; Meja, Methyl-Jasmonate; SA, Salicylic acid; Stri, Strigolactone.
3.8 Expression patterns of HanSAMS genes under drought and salt stresse
Considering that the cis-elements responding to various stress existed in the promoter sequences of HanSAMS genes (Figure 7A), we conducted a quantitative analysis of the HanSAMS gene using qRT-PCR to examine their expression profiles under drought and salt stresses (Figure 10). Our findings revealed that the HanSAMS genes exhibited distinct expression patterns at various time intervals (0 h, 1 h, 3 h, 6 h, 12 h, 24 h) following exposure to drought and salt stresses. All of the HanSAMS genes showed increased expression levels at different times under stresses, and some differences were extremely significant when compared with the untreated group (CK, 0h). In the case of drought treatment, four of the seven HanSAM genes, including HanSAMS3, HanSAMS4, HanSAMS5 and HanSAMS6, showed the highest upregulation at 12th hour, while HanSAMS1 showed the highest upregulation at the 6th hour. Notably, we observed that the expression level of the HanSAMS5 gene under drought stress is the highest among all SAMS genes (exceeding 55-fold at the 12th hour). In the case of salt treatment, five of the seven HanSAM genes, including HanSAMS2, HanSAMS4, HanSAMS5, HanSAMS6 and HanSAMS7, showed the highest upregulation at the 3th hours and gradually downregulated thereafter, while HanSAMS3 was up-regulated to highest point at 6 th of treatment. Notably, we also observed that the expression level of the HanSAMS5 gene under salt stress is the highest among all SAMS genes (exceeding 10-fold at the 3th hour). In summary, most of HanSAMS genes exhibit responsiveness to both salt and drought stress treatments, with a more rapid response observed for salt stress (peak at 3th hour) compared to drought stress (peak at 12th hour).
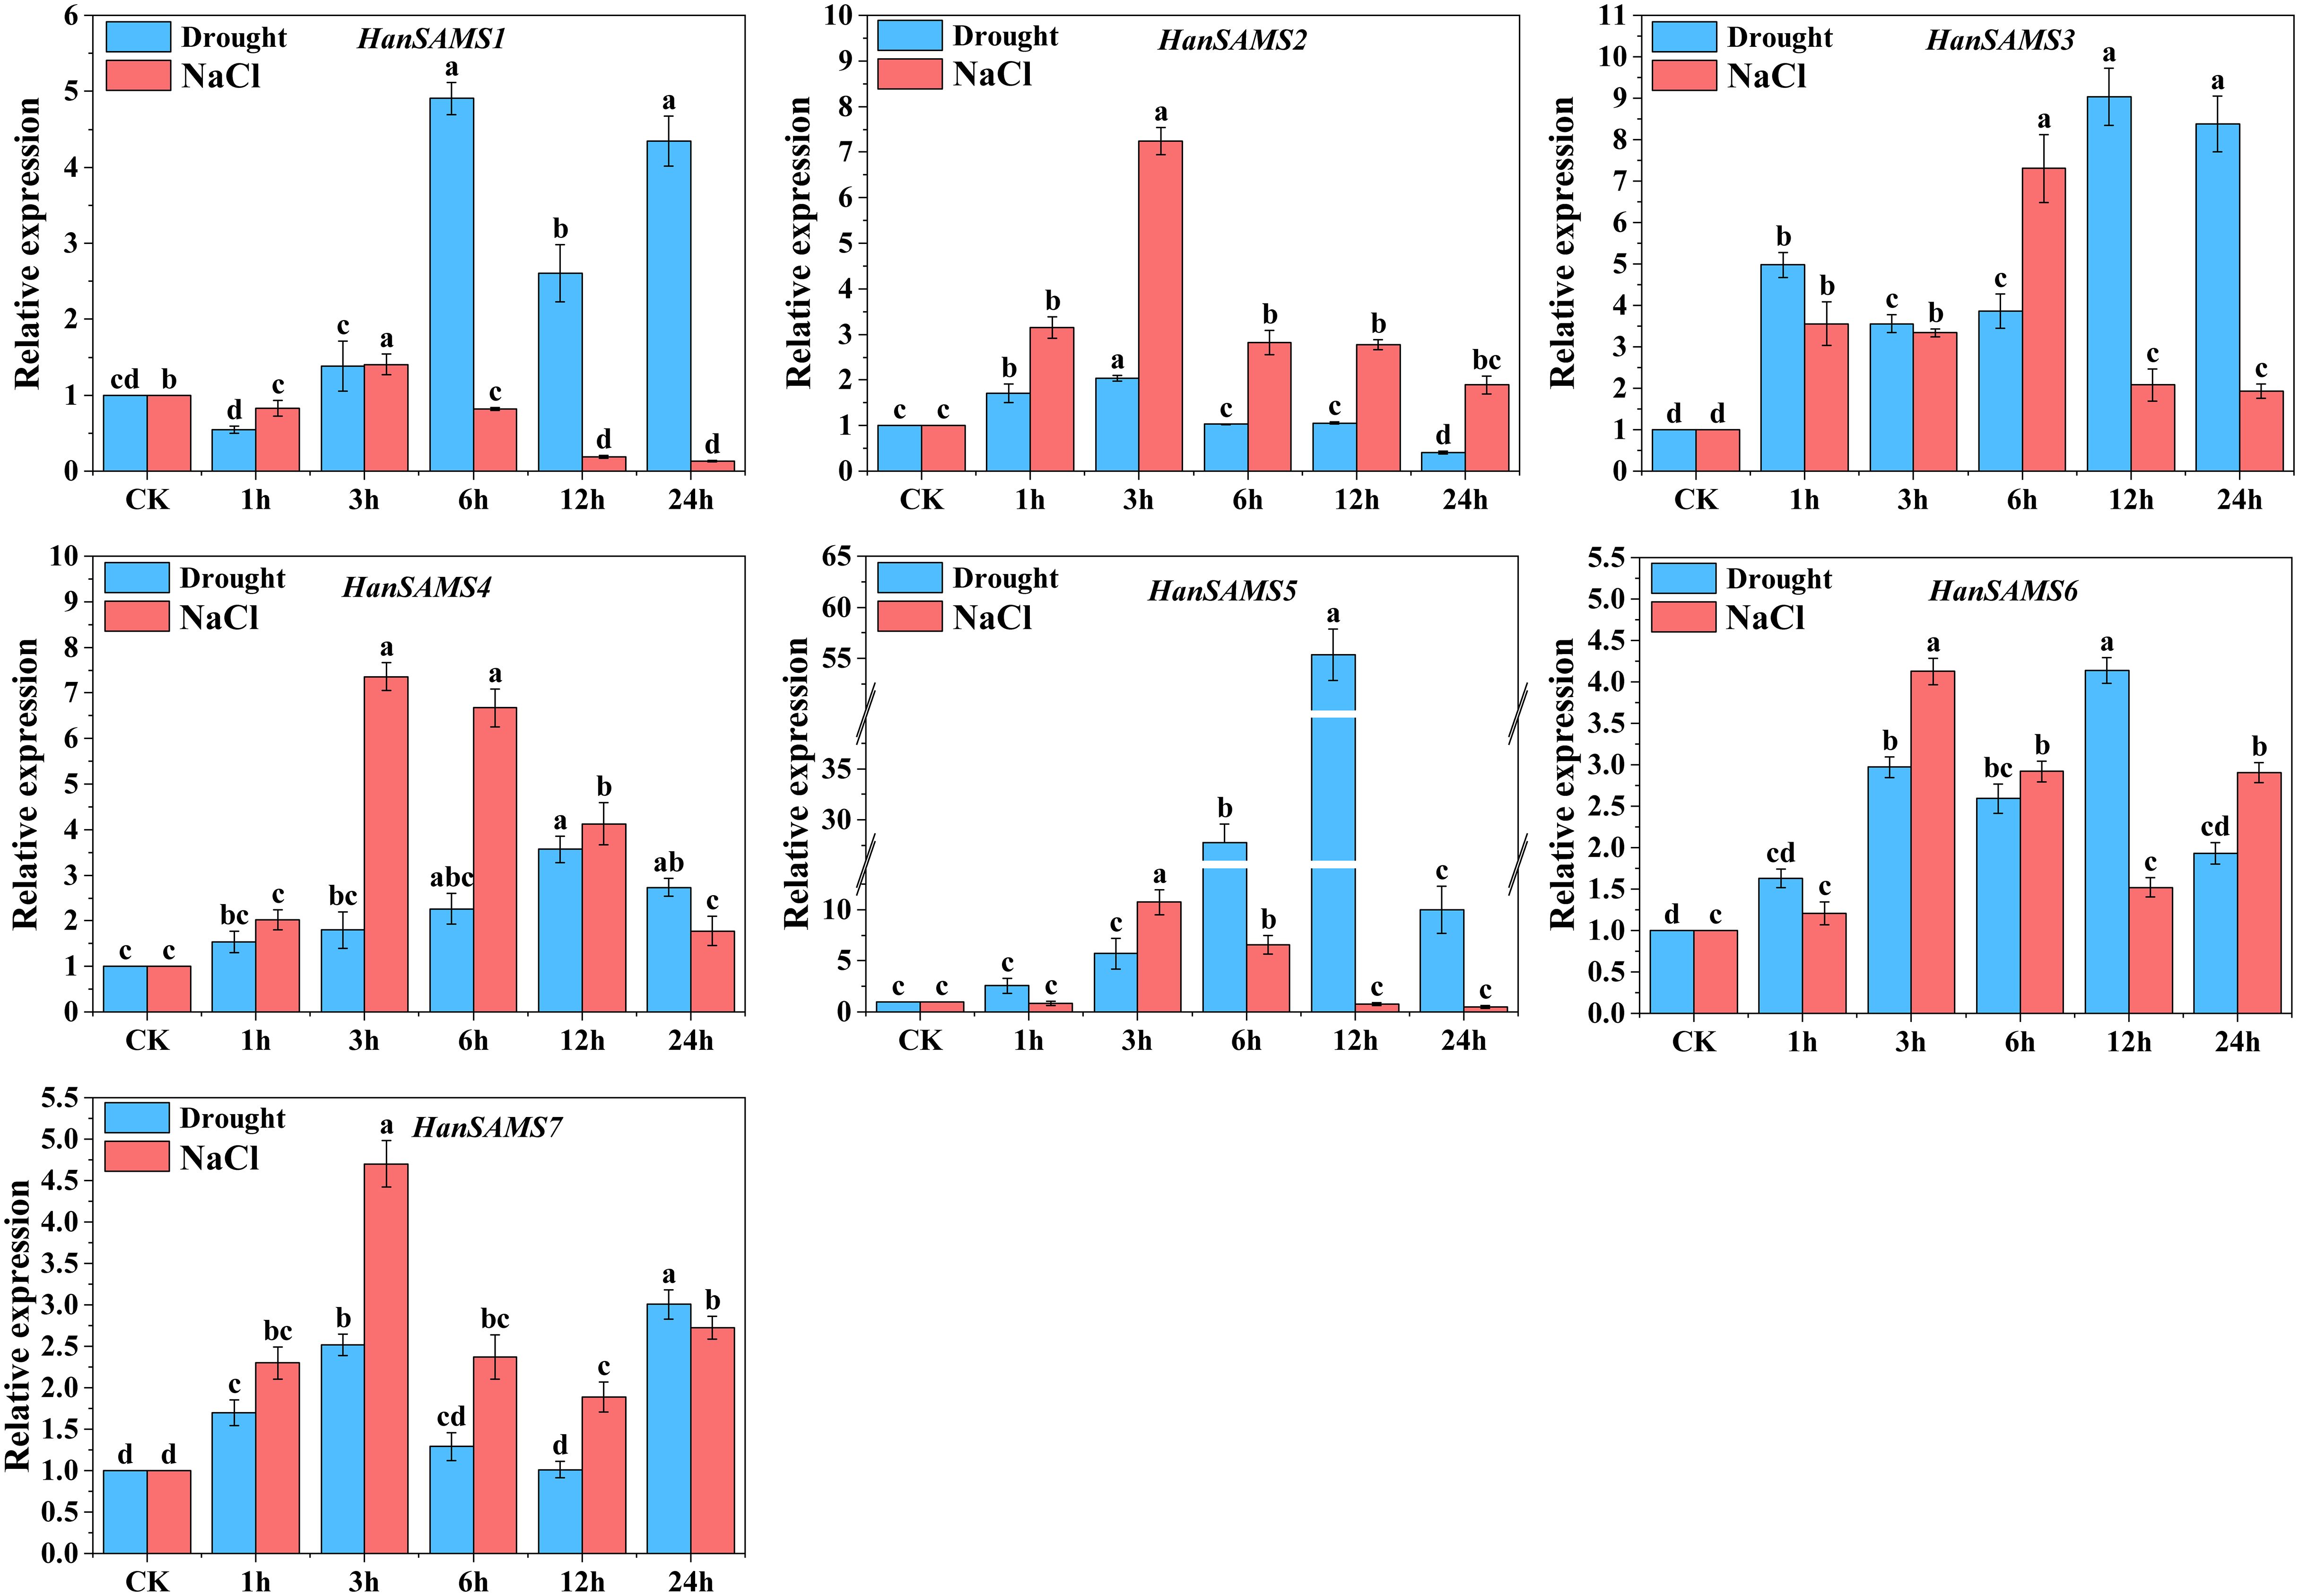
Figure 10. Expression patterns of HanSAMS genes under drought and NaCl stress treatments. a, b, c, d bar indicates a significant difference between the experimental treatments and control (CK) treatment (Significant differences were determined using the Duncan’s method of univariate ANOVA with a significance level of P <0.05).
4 Discussion
S-adenosylmethionine (SAM) is produced through the catalysis of methionine and adenosine triphosphate (ATP) by the enzyme S-adenosylmethionine synthetase (SAMS) (Fontecave et al., 2004). SAM genes play a crucial role in various cellular pathways, including those associated with ethylene and polyamine biosynthesis, methionine metabolism, as well as transmethylation and transsulfuration processes (Chen et al., 2016; Sauter et al., 2013). In the current study, SAMS genes have been analyzed by an extensive use of bioinformatics, such as Arabidopsis (4), rice (3), tomato (4), Eggplant (4), Triticum urartu (3), Barley (4), Sorghum (3), Medicago truncatula (5), Soybean (9) (Heidari et al., 2020). In this study, 7 XRQ-HanSAMS, 6 HA89-HanSAMS, 7 HA300-HanSAMS, 6 IR-HanSAMS, 7 LR1-HanSAMS, 6 PI659440-HanSAMS, 6 PSC8-HanSAMS, 6 OQP8-HanSAMS, and 7 RHA438-HanSAMS genes were identified in nine sunflower genomes, respectively. The phylogenetic analysis of the HanSAMS genes were performed to examine their relationships, the results indicated that they could be divided into seven groups (SAMS1-SAMS7) (Figure 1). It is not the case that every group encompasses all species. Only SAMS1 and SAMS2 are present in all nine varieties, while SAMS3 is found in only seven, suggesting the genetic diversity among different cultivars. The gene structure analysis revealed that all the 58 HanSAMS genes were intron-less and contain only one exon (Figure 4A), which is consistent with the results of previous studies in other species (Sun et al., 2022; Kilwake et al., 2023). Furthermore, the cis-elements analysis in the promoter region of the HanSAMS genes indicated that they might be primarily involved in the plant hormonal signals, light, and abiotic stresses responsiveness (Figure 7), this is similar to the findings of cis-elements in plants such as Arabidopsis and Triticum aestivum (Cheng et al., 2012; Shen et al., 2003). Our findings also suggest that one or two cultivars show a number notably different with other cultivars while most of HanSAMS genes within the same group share similar type and number of regulatory elements across cultivars, The results of the Ka/Ks analysis indicate that the SAMS gene family in nine sunflowers has predominantly experienced purifying selection throughout its evolutionary history.
Codon bias plays a complex role in the formation of gene mutation and the results of selection, but it is also important for the structure, function and expression of genes encoding proteins that are closely linked, and affects evolution (Chen et al., 2004; Hartl et al., 1994; Hershberg and Petrov, 2008). The codon usage bias of sunflower SAMS gene families in nine cultivated species, ENc-plot, PR2-plot and neutrality curve analysis indicated that codon usage bias formation of sunflower SAMS gene families may be the result of base mutations, natural selection and other factors. Through RSCU analysis, it was found that high frequency codons in sunflower SAMS gene families of nine cultivated species preferred G/C ending, and the codon with the largest RSCU value encodes Leucine (Leu, CUU), Glycine (Gly, GGU), and Arginine (Arg, AGG). The codon bias of the plant genome can be analyzed and studied by a correlation index, and the frequency of codon usage between species at the order and family level is different; thus, the genetic relationship between species can be analyzed by a correlation index (Puigbo et al., 2008; Chen et al., 2014; Wang et al., 2011).
Previous research has indicated that SAMS genes are often activated by a variety of hormonal treatments and abiotic stresses. For instance, AtSAMS3 and AtSAMS4 are upregulated under biotic stress and brassinosteroid (BR) treatment, but downregulated in response to abiotic stresses such as salt, heat, and temperature stress, as well as ABA application (Heidari et al., 2020). In this study, we discovered that HanSAMS genes exhibit high expression levels in sunflower leaves when subjected to brassinolide (BRA) and indole-3-acetic acid (IAA) treatments, as revealed by previously published RNA-seq data (Figure 9). BRs are emerging as a plant hormone of significant importance due to their role in stress responses, including extreme temperatures and drought (Brewer et al., 2013; Ha et al., 2014; Nolan et al., 2020). Recent studies have shown that the overexpression of BRL3, a vascular BR receptor, enhances drought responses without hindering growth in Arabidopsis (Fàbregas et al., 2018). ABA and IAA are known as a hormone responsive to abiotic stresses such as drought, heat, low temperature, radiation and salt stress (Vishwakarma et al., 2017). However, in root tissues, all HanSAMS genes exhibiting reduced expression under BRA and IAA treatment conditions (Figure 9), indicating that the HanSAMS gene expression is modulated in a tissue-specific manner in response to hormonal signals.
In our promoter analysis, a multitude of MYB-related elements were identified in HanSAMS genes (Figure 7), Several studies have highlighted MYB as a crucial transcription factor associated with plant drought resistance and a key player in the transcriptional regulatory network governing plant responses to drought and salt stress (Espartero et al., 1994; Baldoni and Genga, 2015; Leng and Zhao, 2020; Sun et al., 2022). The overexpression of the SAMS gene from Lycoris radiata in E. coli has been shown to enhance plant tolerance to salt stress (Li et al., 2013). Given the presence of drought and salt responsive cis-elements in the promoter regions of HanSAMS genes, we performed a qRT-PCR analysis to assess all 7 XQR-HanSAMS expression dynamics under drought and salt stress conditions (Figure 10). Our results indicated that HanSAMS genes displayed unique expression profiles at different time points following stress exposure. Notably, HanSAMS5 showed the most significant upregulation under both stress types, with over 55-fold increase at the 12th hour for drought and over 10-fold at the 3th hour for salt stress. This suggests that HanSAMS5 may play a crucial role in the plant’s response to adverse environmental conditions.
5 Conclusion
The study identified 58 HanSAMS genes in nine sunflowers through whole-genome bioinformatics analysis. The identified HanSAMS genes are distributed across seven chromosomes, exhibiting a conserved exon-intron structure devoid of introns. Phylogenetic analysis has uncovered that the sunflower SAMS genes have expanded due to recent WGT-1 and WGD-2 events, resulting in three homologous branches, each comprising two discrete SAMS groups. The analysis of codon usage bias revealed a pronounced preference for high-frequency codons ending in G or C, notably those encoding glycine, leucine, and arginine, highlighting the significant role of natural selection in shaping the evolution of the HanSAMS genes. A detailed promoter analysis revealed a wealth of stress-responsive cis-elements, suggesting their regulatory roles in stress tolerance. Moreover, expression profiling under hormonal stimuli and abiotic stresses, especially the marked upregulation of HanSAMS5, points to its pivotal role in managing multiple abiotic stresses. Collectively, these findings provide valuable insights into the functional diversity and evolutionary dynamics of the SAMS genes in sunflowers, laying a robust foundation for future research aimed at enhancing sunflower stress resilience through genetic improvement strategies.
Data availability statement
The original contributions presented in the study are included in the article/Supplementary Material. Further inquiries can be directed to the corresponding author.
Author contributions
CZ: Visualization, Data curation, Writing – review & editing, Writing – original draft. HL: Validation, Investigation, Writing – review & editing. JY: Visualization, Data curation, Writing – review & editing. ZH: Writing – original draft, Methodology, Formal analysis. XL: Software, Investigation, Writing – original draft. YC: Writing – review & editing, Validation, Supervision, Writing – original draft.
Funding
The author(s) declare that financial support was received for the research, authorship, and/or publication of this article. This work was supported by the Natural Science Foundation of Inner Mongolia Autonomous Region (2023LHMS03033), Hetao College Talent Fund (HYRC202319), the Science and Technology Research Project of Hetao College (HYHB202302), and the Science and Technology Innovation Research Team Project of Hetao College (HTKCT-A202405).
Acknowledgments
This is a short text to acknowledge the contributions of specific colleagues, institutions, or agencies that aided the efforts of the authors. We also thanks Beijing OmicsGang Technologies Co., LTD. for bioinformatics training and help for this analysis.
Conflict of interest
The authors declare that the research was conducted in the absence of any commercial or financial relationships that could be construed as a potential conflict of interest.
Publisher’s note
All claims expressed in this article are solely those of the authors and do not necessarily represent those of their affiliated organizations, or those of the publisher, the editors and the reviewers. Any product that may be evaluated in this article, or claim that may be made by its manufacturer, is not guaranteed or endorsed by the publisher.
Supplementary material
The Supplementary Material for this article can be found online at: https://www.frontiersin.org/articles/10.3389/fpls.2024.1499024/full#supplementary-material
Abbreviations
SAMS, S-adenosylmethionine synthase; HanSAMS, S-adenosylmethionine synthase in Helianthus annuus L; MW, Molecular weight; pI, Isoelectric points; GRAVY, Grand average of hydropathicity; CDS, Coding sequence; CUB, codon usage bias; GC1, GC2, and GC3, GC content in the base composition of codon 1st, 2nd, and 3rd positions; RSCU, Relative synonymous codon usage; Enc, Effective number of codons; GC12, The average of GC1 and GC2; GC3s, GC content of 3rd synonymous codons; qRT-PCR, quantitative RT-PCR.
References
Ahuja, I., de Vos, R. C. H., Bones, A. M., Hall, R. D. (2010). Plant molecular stress responses face climate change. Trends Plant Science. 15, 664–674. doi: 10.1016/j.tplants.2010.08.002
Badouin, H., Gouzy, J., Grassa, C. J., Murat, F., Staton, S. E., Cottret, L., et al. (2017). The sunflower genome provides insights into oil metabolism, flowering and Asterid evolution. Nature 546, 148–152. doi: 10.1038/nature22380
Baldoni, E., Genga, A. (2015). Plant MYB transcription factors: Their role in drought response mechanisms. Int. J. Mol. Sci. 16, 15811–15851. doi: 10.3390/ijms160715811
Brewer, P. B., Koltai, H., Beveridge, C. A. (2013). Diverse roles of strigolactones in plant development. Mol. Plant 6, 18–28. doi: 10.1093/mp/sss130
Bürstenbinder, K., Rzewuski, G., Wirtz, M., Hell, R., Sauter, M. (2007). The role of methionine recycling for ethylene synthesis in Arabidopsis. Plant J. 49, 238–249. doi: 10.1111/j.1365-313x.2006.02942.x
Chen, S. L., Lee, W., Hottes, A. K., Shapiro, L., McAdams, H. H. (2004). Codon usage between genomes is constrained by genome-wide mutational processes. Proc. Natl. Acad. Sci. United States America. 101, 3480–3485. doi: 10.1073/pnas.0307827100
Chen, H., Sun, S., Norenburg, J. L., Sundberg, P. (2014). Mutation and selection cause codon usage and bias in mitochondrial genomes of ribbon worms (Nemertea). PloS One 9, e85631. doi: 10.1371/journal.pone.0085631
Chen, C., Wu, Y., Li, J., Wang, X., Zeng, Z., Xu, J., et al. (2023). TBtools-II: A “one for all, all for one” bioinformatics platform for biological big-data mining. Mol. Plant 16, 1733–1742. doi: 10.1016/j.molp.2023.09.010
Chen, Y., Zou, T., McCormick, S. (2016). S-adenosylmethionine synthetase 3 is important for pollen tube growth. Plant Physiol. 172, 244–253. doi: 10.1104/pp.16.00774
Cheng, M. C., Hsieh, E. J., Chen, J. H., Chen, H. Y., Lin, T. P. (2012). Arabidopsis RGLG2, functioning as a RING E3 ligase, interacts with AtERF53 and negatively regulates the plant drought stress response. Plant Physiol. 158, 363–375. doi: 10.1104/pp.111.189738
DeLano, W. L. (2002). The PyMOL molecular graphics system. Proteins. Structure Function Bioinf. 30, 442–454.
Espartero, J., Pintor-Toro, J. A., Pardo, J. M. (1994). Differential accumulation of S-adenosylmethionine synthetase transcripts in response to salt stress. Plant Mol. Biol. 25, 217–227. doi: 10.1007/BF00023239
Fàbregas, N., Lozano-Elena, F., Blasco-Escámez, D., Tohge, T., Martínez-Andújar, C., Albacete, A., et al. (2018). Overexpression of the vascular brassinosteroid receptor BRL3 confers drought resistance without penalizing plant growth. Nat. Communication. 9, 4680. doi: 10.1038/s41467-018-06861-3
Fontecave, M., Atta, M., Mulliez, E. (2004). S-adenosylmethionine: Nothing goes to waste. Trends Biochem. Sci. 29, 243–249. doi: 10.1016/j.tibs.2004.03.007
Gao, L., Gonda, I., Sun, H. H., Ma, Q. Y., Bao, K., Tieman, D. M., et al. (2019). The tomato pan-genome uncovers new genes and a rare allele regulating fruit flavor. Nat. Genet. 51, 1044–1051. doi: 10.1038/s41588-019-0410-2
Gasteiger, E., Hoogland, C., Gattiker, A., Duvaud, S., Wilkins, M. R., Appel, R. D., et al. (2005). “Protein identification and analysis tools on the expasy server,” in The Proteomics Protocols Handbook. Ed. Walker, J. M. (Totowa, NJ, USA: Humana Press Inc.), 571–607. doi: 10.1385/1-59259-890-0:571
Guo, Z., Tan, J., Zhuo, C., Wang, C., Xiang, B., Wang, Z. (2014). Abscisic acid, H2O2 and nitric oxide interactions mediated cold-induced S-adenosylmethionine synthetase in Medicago sativa subsp. Falcata that confers cold tolerance through up-regulating polyamine oxidation. Plant Biotechnol. J. 12, 601–612. doi: 10.1111/pbi.12166
Gupta, K., Dey, A., Gupta, B. (2013). Plant polyamines in abiotic stress responses. Acta Physiologiae Plantarum. 35, 2015–2036. doi: 10.1007/s11738-013-1239-4
Ha, C. V., Leyva-Gonzalez, M. A., Osakabe, Y., Tran, U. T., Nishiyama, R., Watanabe, Y., et al. (2014). Positive regulatory role of strigolactone in plant responses to drought and salt stress. Proc. Natl. Acad. Sci. United States America. 111, 851–856. doi: 10.1073/pnas.1322135111
Hartl, D. L., Moriyama, E. N., Sawyer, S. A. (1994). Selection intensity for codon bias. Genetics. 138, 227–234. doi: 10.1093/genetics/138.1.227
He, M. W., Wang, Y., Wu, J. Q., Shu, S., Sun, J., Guo, S. R. (2019). Isolation and characterization of S-Adenosylmethionine synthase gene from cucumber and responsive to abiotic stress. Plant Physiol. Biochem. 141, 431–445. doi: 10.1016/j.plaphy.2019.06.006
Heidari, P., Mazloomi, F., Nussbaumer, T., Barcaccia, G. (2020). Insights into the SAM Synthetase Gene Family and Its Roles in Tomato Seedlings under Abiotic Stresses and Hormone Treatments. Plants. 9, 586. doi: 10.3390/plants9050586
Hershberg, R., Petrov, D. A. (2008). Selection on codon bias. Annu. Rev. Genet. 42, 287–299. doi: 10.1146/annurev.genet.42.110807.091442
Hu, B., Jin, J. P., Guo, A. Y., Hang, H., Luo, J. C., Gao, G. (2015). GSDS 2.0: an upgraded gene feature visualization server. Bioinformatics. 31, 1296–1297. doi: 10.1093/bioinformatics/btu817
Hübner, S., Bercovich, N., Todesco, M., Mandel, J. R., Odenheimer, J., Ziegler, E., et al. (2019). Sunflower pan-genome analysis shows that hybridization altered gene content and disease resistance. Nat. Plants. 5, 54–62. doi: 10.1038/s41477-018-0329-0
Jang, S. J., Wi, S. J., Choi, Y. J., An, G., Park, K. Y. (2012). Increased polyamine biosynthesis enhances stress tolerance by preventing the accumulation of reactive oxygen species: T-DNA mutational analysis of Oryza sativa lysine decarboxylase-like protein 1. Molecules Cells 34, 251–262. doi: 10.1007/s10059-012-0067-5
Keeley, S. C., Cantley, J. T., Gallaher, T. J. (2021). The “evil tribe” spreads across the land: a dated molecular phylogeny provides insight into dispersal, expansion, and biogeographic relationships within one of the largest tribes of the sunflower family (Vernonieae: Compositae). Am. J. Botany. 108, 505–519. doi: 10.1002/ajb2.1614
Kilwake, J. W., Umer, M. J., Wei, Y. Y., Mehari, T. G., Magwanga, R. O., Xu, Y. C., et al. (2023). Genome-wide characterization of the SAMS gene family in cotton unveils the putative role of ghSAMS2 in enhancing abiotic stress tolerance. Agronomy 13, 612. doi: 10.3390/agronomy13020612
Kumar, S., Stecher, G., Tamura, K. (2016). MEGA7: molecular evolutionary genetics analysis version 7.0 for bigger datasets. Mol. Biol. Evolution. 33, 1870–1874. doi: 10.1093/molbev/msw054
Larkin, M. A., lackshields, G., Brown, N. P., Chenna, R., McGettigan, P. A., McWilliam, H., et al. (2007). Clustal W and clustal X version 2.0. Bioinformatics. 23, 2947–2948. doi: 10.1093/bioinformatics/btm404
Leng, P., Zhao, J. (2020). Transcription factors as molecular switches to regulate drought adaptation in maize. Theor. Appl. Genet. 133, 1455–1465. doi: 10.1007/s00122-019-03494-y
Lescot, M., Déhais, P., Thijs, G., Marchal, K., Moreau, Y., Van de Peer, Y., et al. (2002). PlantCARE, a database of plant cis-acting regulatory elements and a portal to tools for in silico analysis of promoter sequences. Nucleic Acids Res. 30, 325–327. doi: 10.1093/nar/30.1.325
Li, R., Li, Y., Zheng, H., Luo, R., Zhu, H., Li, Q., et al. (2010). Building the sequence map of the human pan-genome. Nat. Biotechnol. 28, 57–63. doi: 10.1038/nbt.1596
Li, W., Han, Y., Tao, F., Chong, K. (2011). Knockdown of SAMS genes encoding S-adenosyl-l-methionine synthetases causes methylation alterations of DNAs and histones and leads to late flowering in rice. J. Plant Physiol. 168, 1837–1843. doi: 10.1016/j.jplph.2011.05.020
Li, X. D., Xia, B., Wang, R., Xu, S., Jiang, Y. M., Yu, F. B., et al. (2013). Molecular cloning and characterization of S-adenosylmethionine synthetase gene from Lycoris radiata. Mol. Biol. Rep. 40, 1255–1263. doi: 10.1007/s11033-012-2168-9
Ma, C., Wang, Y., Gu, D., Nan, J., Chen, S., Li, H. (2017). Overexpression of S-adenosyl-L-methionine synthetase 2 from sugar beet M14 increased arabidopsis tolerance to salt and oxidative stress. Int. J. Mol. Sci. 18, 847. doi: 10.3390/ijms18040847
Mantenese, A., Medan, D., Hall, A. (2006). Achene structure, development and lipid accumulation in sunflower cultivars differing in oil content at maturity. Ann. Botany. 97, 999–1010. doi: 10.1093/aob/mcl046
Mehari, T. G., Xu, Y., Umer, M. J., Shiraku, M. L., Hou, Y., Wang, Y., et al. (2021). Multi-omics-based Identification and functional characterization of gh_A06G1257 proves its potential role in drought stress tolerance in gossypium hirsutum. Front. Plant Science. 12. doi: 10.3389/fpls.2021.746771
Mistry, J., Chuguransky, S., Williams, L., Qureshi, M., Salazar, G. A., Sonnhammer, E. L. L., et al. (2021). Pfam: The protein families database in 2021. Nucleic Acids Res. 49, D412–D419. doi: 10.1093/nar/gkaa913
Nolan, T., Vukasinovi, N., Liu, D., Russinova, E., Yina, Y. (2020). Brassinosteroids: multidimensional regulators of plant growth, development, and stress responses. Plant Cell. 32, 295–318. doi: 10.1105/tpc.19.00335
Potter, S. C., Luciani, A., Eddy, S. R., Park, Y., Lopez, R., Finn, R. D. (2018). HMMER web server: 2018 update. Nucleic Acids Res. 46, W200–W204. doi: 10.1093/nar/gky448
Puigbo, P., Bravo, I. G., Garcia-Vallve, S. (2008). E-CAI: a novel server to estimate an expected value of Codon Adaptation Index (eCAI). BMC Bioinf. 9, 65. doi: 10.1186/1471-2105-9-65
Rele, A. S., Mohile, R. B. (2003). Effect of mineral oil, sunflower oil, and coconut oil on prevention of hair damage. J. Cosmetic Science. 54, 175–192.
Roje, S. (2006). S-Adenosyl-l-methionine: Beyond the universal methyl group donor. Phytochemistry. 67, 1686–1698. doi: 10.1016/j.phytochem.2006.04.019
Sauter, M., Moffatt, B., Saechao, M. C., Hell, R., Wirtz, M. (2013). Methionine salvage and S-adenosylmethionine: Essential links between sulfur, ethylene and polyamine biosynthesis. Biochem. J. 451, 145–154. doi: 10.1042/BJ20121744
Shen, Y. G., Zhang, W. K., He, S. J., Zhang, J. S., Liu, Q., Chen, S. Y. (2003). An EREBP/AP2-type protein in Triticum aestivum was a DRE-binding transcription factor induced by cold, dehydration and ABA stress. Theor. Appl. Genet. 106, 923–930. doi: 10.1007/s00122-002-1131-x
Song, H. F., Ji, X. C., Wang, M. Y., Li, J., Wang, X., Meng, L. Y., et al. (2024a). Genome-wide identification and expression analysis of the Dof gene family reveals their involvement in hormone response and abiotic stresses in sunflower (Helianthus annuus L.). Gene. 910, 148336. doi: 10.1016/j.gene.2024.148336
Song, H., Wang, M., Shen, J., Wang, X., Qin, C., Wei, P., et al. (2024b). Physiological and transcriptomic profiles reveal key regulatory pathways involved in cold resistance in sunflower seedlings. Genomics 116, 110926. doi: 10.1016/j.ygeno.2024.110926
Sun, F., Ma, J., Wang, P., Yang, Y. (2022). Genome-wide Identification of the SAMS gene family in upland cotton (Gossypium hirsutum L.) and expression analysis in drought stress treatments. Genes. 13, 860. doi: 10.3390/genes13050860
Tao, Y. F., Luo, H., Xu, J. B., Cruickshank, A., Zhao, X. R., Teng, F., et al. (2021). Extensive variation within the pan-genome of cultivated and wild sorghum. Nat. Plants. 7, 766–773. doi: 10.1038/s41477-021-00925-x
Tettelin, H., Masignani, V., Cieslewicz, M. J., Donati, C., Medini, D., Ward, N. L., et al. (2005). Genome analysis of multiple pathogenic isolates of Streptococcus agalactiae: Implications for the microbial “pan-genome. Proc. Natl. Acad. Sci. United States America. 102, 13950–13955. doi: 10.1073/pnas.0506758102
Vishwakarma, K., Upadhyay, N., Kumar, N., Yadav, G., Singh, J., Mishra, R. K., et al. (2017). Abscisic acid signaling and abiotic stress tolerance in plants: A review on current knowledge and future prospects. Front. Plant Science. 8. doi: 10.3389/fpls.2017.00161
Wang, J., Chitsaz, F., Derbyshire, M. K., Gonzales, N. R., Gwadz, M., Lu, S., et al. (2023). The conserved domain database in 2023. Nucleic Acids Res. 51, D384–D388. doi: 10.1093/nar/gkac1096
Wang, M., Liu, Y. S., Zhou, J. H., Chen, H. T., Ma, L. N., Ding, Y. Z., et al. (2011). Analysis of codon usage in Newcastle disease virus. Virus Genes. 42, 245–253. doi: 10.1007/s11262-011-0574-z
Wang, Y., Tang, H., eBarry, J. D., Tan, X., Li, J., Wang, X., et al. (2012). MCScanX: a toolkit for detection and evolutionary analysis of gene synteny and collinearity. Nucleic Acids Res. 40, e49. doi: 10.1093/nar/gkr1293
Yang, L., Zhang, Y., Zhu, N., Koh, J., Ma, C., Pan, Y., et al. (2013). Proteomic analysis of salt tolerance in sugar beet monosomic addition line M14. J. Proteome Res. 12, 4931–4950. doi: 10.1021/pr400177m
Zhu, H., He, M., Jahan, M. S., Wu, J., Gu, Q., Shu, S., et al. (2021). CsCDPK6, a CsSAMS1-interacting protein, affects polyamine/ethylene biosynthesis in cucumber and enhances salt tolerance by overexpression in tobacco. International journal of molecular sciences 22 (20), 11133. doi: 10.3390/ijms222011133
Keywords: S-adenosylmethionine synthase, pan-genome, sunflowers, abiotic stresses, qRT-PCR
Citation: Zhang C, Li H, Yin J, Han Z, Liu X and Chen Y (2024) Pan-genome wide identification and analysis of the SAMS gene family in sunflowers (Helianthus annuus L.) revealed their intraspecies diversity and potential roles in abiotic stress tolerance. Front. Plant Sci. 15:1499024. doi: 10.3389/fpls.2024.1499024
Received: 20 September 2024; Accepted: 21 October 2024;
Published: 13 November 2024.
Edited by:
Xuming Li, Hugo Biotechnologies Co., Ltd., ChinaReviewed by:
Ake Liu, Changzhi University, ChinaPengbo Xu, Shanghai Jiao Tong University, China
Pingchuan Deng, Northwest A&F University, China
Copyright © 2024 Zhang, Li, Yin, Han, Liu and Chen. This is an open-access article distributed under the terms of the Creative Commons Attribution License (CC BY). The use, distribution or reproduction in other forums is permitted, provided the original author(s) and the copyright owner(s) are credited and that the original publication in this journal is cited, in accordance with accepted academic practice. No use, distribution or reproduction is permitted which does not comply with these terms.
*Correspondence: Yang Chen, Y2hlbnlhbmdyekAxMjYuY29t
 Chun Zhang
 Haoyu Li
 Jiamin Yin
 Zhibin Han
 Xinqi Liu
 Yang Chen