- Cotton Research Institute of Shanxi Agricultural University, Yuncheng, China
The terpene synthase (TPS) plays a pivotal roles in plant growth, development, and enhancing resilience against environmental stresses. Despite this, the bioinformatics analysis of the TPS family gene in soybean (Glycine max) is lacking. In this study, we investigated 36 GmTPS members in soybean, exhibiting a diverse range of protein lengths, spanning from 144 to 835 amino acids. A phylogenetic tree was constructed from these GmTPS genes revealed a classification into five distinct subgroups: Group1, Group2, Group3, Group4 and Group5. Notably, within each subgroup, we identified the motifs of GmTPS proteins were similar, although variations existed among different subfamilies. Gene duplication events analysis demonstrated that TPS genes expand differently in G. max, A. thaliana and O. sativa. Among, both tandem duplication and Whole genome duplication contributive to the expansion of TPS genes in G. max, and Whole genome duplication played a major role. Moreover, the cis-element analysis suggested that TPS is related to hormone signals, plant growth and development and environmental stress. Yeast two-hybrid (Y2H) assay results indicated TPS protein may form heterodimer to function, or may form complex with P450 proteins to function. RNA-seq results revealed a higher expression of most GmTPS genes in flowers, suggesting their potential contribution to flower development. Collectively, these findings offer a provide a holistic knowledge of the TPS gene family in soybean and will facilitate further characterization of TPSs effectively.
1 Introduction
Terpenoids, also referred to as isoprenoids, are abundant natural products, and more than 80,000 terpenoids and their derivatives have been found so far, widely existing in plants, fungi, bacteria and insects (Realdon, 1960). TPS proteins are widely found in algae, bryophytes, ferns, monocotyledons and dicotyledons. Kaul et al. (2000) cloned the first TPS enzymes coding gene AtTPS1 in A. thaliana, with the development of modern sequencing technologies, and more and more TPS genes were identified in plant genomes. For instance, there are 33 TPS genes in Arabidopsis (Aubourg et al., 2002; Yang et al., 2012), 53 in rice (Yang et al., 2012), 12 in populus (Yang et al., 2012), 8 in potato (Xu et al., 2017), 9 in B. distachyon (Wang et al., 2019), 34 in d. officinale (Yu et al., 2020), 80 in camellia (Zhou et al., 2020), 26 in aloes (Li et al., 2021), 58 in l. chinense (Cao et al., 2023) and 16 in A. hypogaea (Zhong et al., 2024). Notably, many TPS genes are also found in bacteria (Jia et al., 2019).
Previous research has categorized TPS proteins into 7 subfamilies: TPS-a–TPS-h. Specifically, TPS-a, TPS-b and TPS-g are present in angiosperms; TPS-c, closely related to TPS-e/f, is related in diterpenoid synthase production and is found in gymnosperms. Meanwhile, TPS-e/f is present in vascular plants (Newman and Chappell, 1999; Chen et al., 2011).
The regulation of TPS gene expression is influenced by various hormonal and environmental stresses. Such as, MeJA treatments upregulate most CsTPS genes expression (Zhou et al., 2020), while osmotic stress and heat stress induce TPS genes upregulation in roses (Yan et al., 2022). Transgenic studies show that TPS overexpression can enhance stress tolerance in crops like rice and Arabidopsis. For instance, OsTPS1 overexpression improves rice low temperature tolerance (Ge et al., 2008) and AhTPS9 overexpression enhances Arabidopsis cold tolerance (Zhong et al., 2024). Similarly, ScTPS1 overexpression in potatoes improves drought tolerance (Yeo et al., 2000). Moreover, OsTPS46 confers natural resistance to bird cherry-oat aphid (Sun et al., 2017), while OsTPS24 showed no significant inhibitory activity against Magnaporthe oryzae (Yoshitomi et al., 2016). In soybeans, GmAFS have defensive effects against nematodes and insects (Lin et al., 2017).
Despite the importance of TPS genes in stress resistance, their functions in soybean remain largely unexplored. Here, we carried out a bioinformatics analysis of the TPS gene family in soybean, examining phylogenetic relationships, gene structures, duplication events, gene collinearity, and protein interaction networks. The tissue expression of GmTPS in the 6 tissues of root, young leaf, pod shell, flower, seed and nodule unravel their key regulational roles during soybean development. This study offers valuable insights and theoretical support for understanding the roles of GmTPS genes in soybean stress resistance.
2 Materials and methods
2.1 Data sources and identification of TPSs in soybean
The genome data were downloaded from the Soybean database (https://www.soybase.org/dlpages/). The AtTPSs and OsTPSs protein sequences were downloaded from TAIR and RGAP, respectively. The hidden Markov Model (HMM) file of PF01397, PF03936 and PF19086 were downloaded from InterPro database (Paysan et al., 2023). Utilizing HMMER 3.0, we screened for TPS proteins within soybean (E-value <= 1e-5, similarity > 50%) (Mistry et al., 2013). Additionally, we employed the BLASTP method (Camacho et al., 2009) to search GmTPS protein sequences using AtTPS and OsTPS proteins as references (E-value <= 1e-5, similarity > 50%). Subsequently, the identified candidate TPS protein sequences underwent domain verification, adopting the analysis approach outlined by Xu et al. (2017). We filtered the longest transcript using the R package seqfinder (https://github.com/yueliu1115/seqfinder).
2.2 Evolutionary trees are constructed of GmTPS, AtTPS and OsTPS
We employed the Muscle software (Edgar, 2004) for multiple sequence alignment of GmTPS, AtTPS and OsTPS proteins, and constructed a phylogenetic tree using IQ-TREE (Nguyen et al., 2015). The tree was visualized using the R package ggtree (Yu et al., 2017).
2.3 The cis-elements analysis of GmTPS genes
The 2 kb promoter region sequences upstream of the GmTPS gene were extracted using a Python program and submitted to the PlantCare (https://bioinformatics.psb.ugent.be/webtools/plantcare/html/) database for cis-element prediction (Lescot et al., 2002). All results were visualized in R software.
2.4 Analysis of chromosome distribution, gene duplication events, and selection pressure
The chromosomal distribution of GmTPS genes was derived from the soybean genome annotation information. MCScanX software (Wang et al., 2012) was utilized for gene duplication and colinearity analysis, identifying duplication types such as tandem (TD), and whole genome (WGD). For interspecies collinearity analysis and visualization, JCVI software (Tang et al., 2008) was employed. JCVI software was used for interspecies collinearity analysis and visualization (Tang et al., 2008). ClustalW software was used to align the protein sequences and CDS sequences of TPS genes with gene duplication (Thompson et al., 2003). KaKs_Calculator software was used to calculate the synonymous substitution rate (synonymous, Ks), nonsynonymous substitution rate (nonsynonymous, Ka) and evolutionary ratio (Ka/Ks) between TPS genes duplicate gene pairs (Zhang, 2022).
2.5 TPS protein interaction network analysis
The GmTPS proteins interaction network were predicted based on the AraNet2 database (Lee et al., 2015).
2.6 Tissue expression pattern analysis of GmTPS genes using RNA-seq
The transcriptome data of soybean under different tissues and development stages from the Soybean database (https://www.soybase.org/dlpages/). The expression data were visualized using the R package Pheatmap (Kolde and Kolde, 2015).
2.7 Yeast two-hybrid assays
The CDS sequence of the Glyma.07G192800 and Glyma.15G263300 were cloned into the pGBKT7 vector (BD-TPS); the CDS sequence of the Glyma.12G140600, Glyma.09G029400, Glyma.20G074400 and Glyma.01G153300 were cloned into the pGADT7 vector (AD-TPSs or AD-p450s). Yeast transformants with empty pGBKT7 and AD-TPSs or AD-P450s; yeast transformants with empty pGADT7 and BD-TPSs were used as the negative control. The positive control: AD-T + BD-53. Yeast transformants with AD-TPSs, BD-TPSs and AD-p450s were used to identify the TPSs interact with other TPS proteins or P450 proteins.
3 Results
3.1 Identification of TPS members in soybean
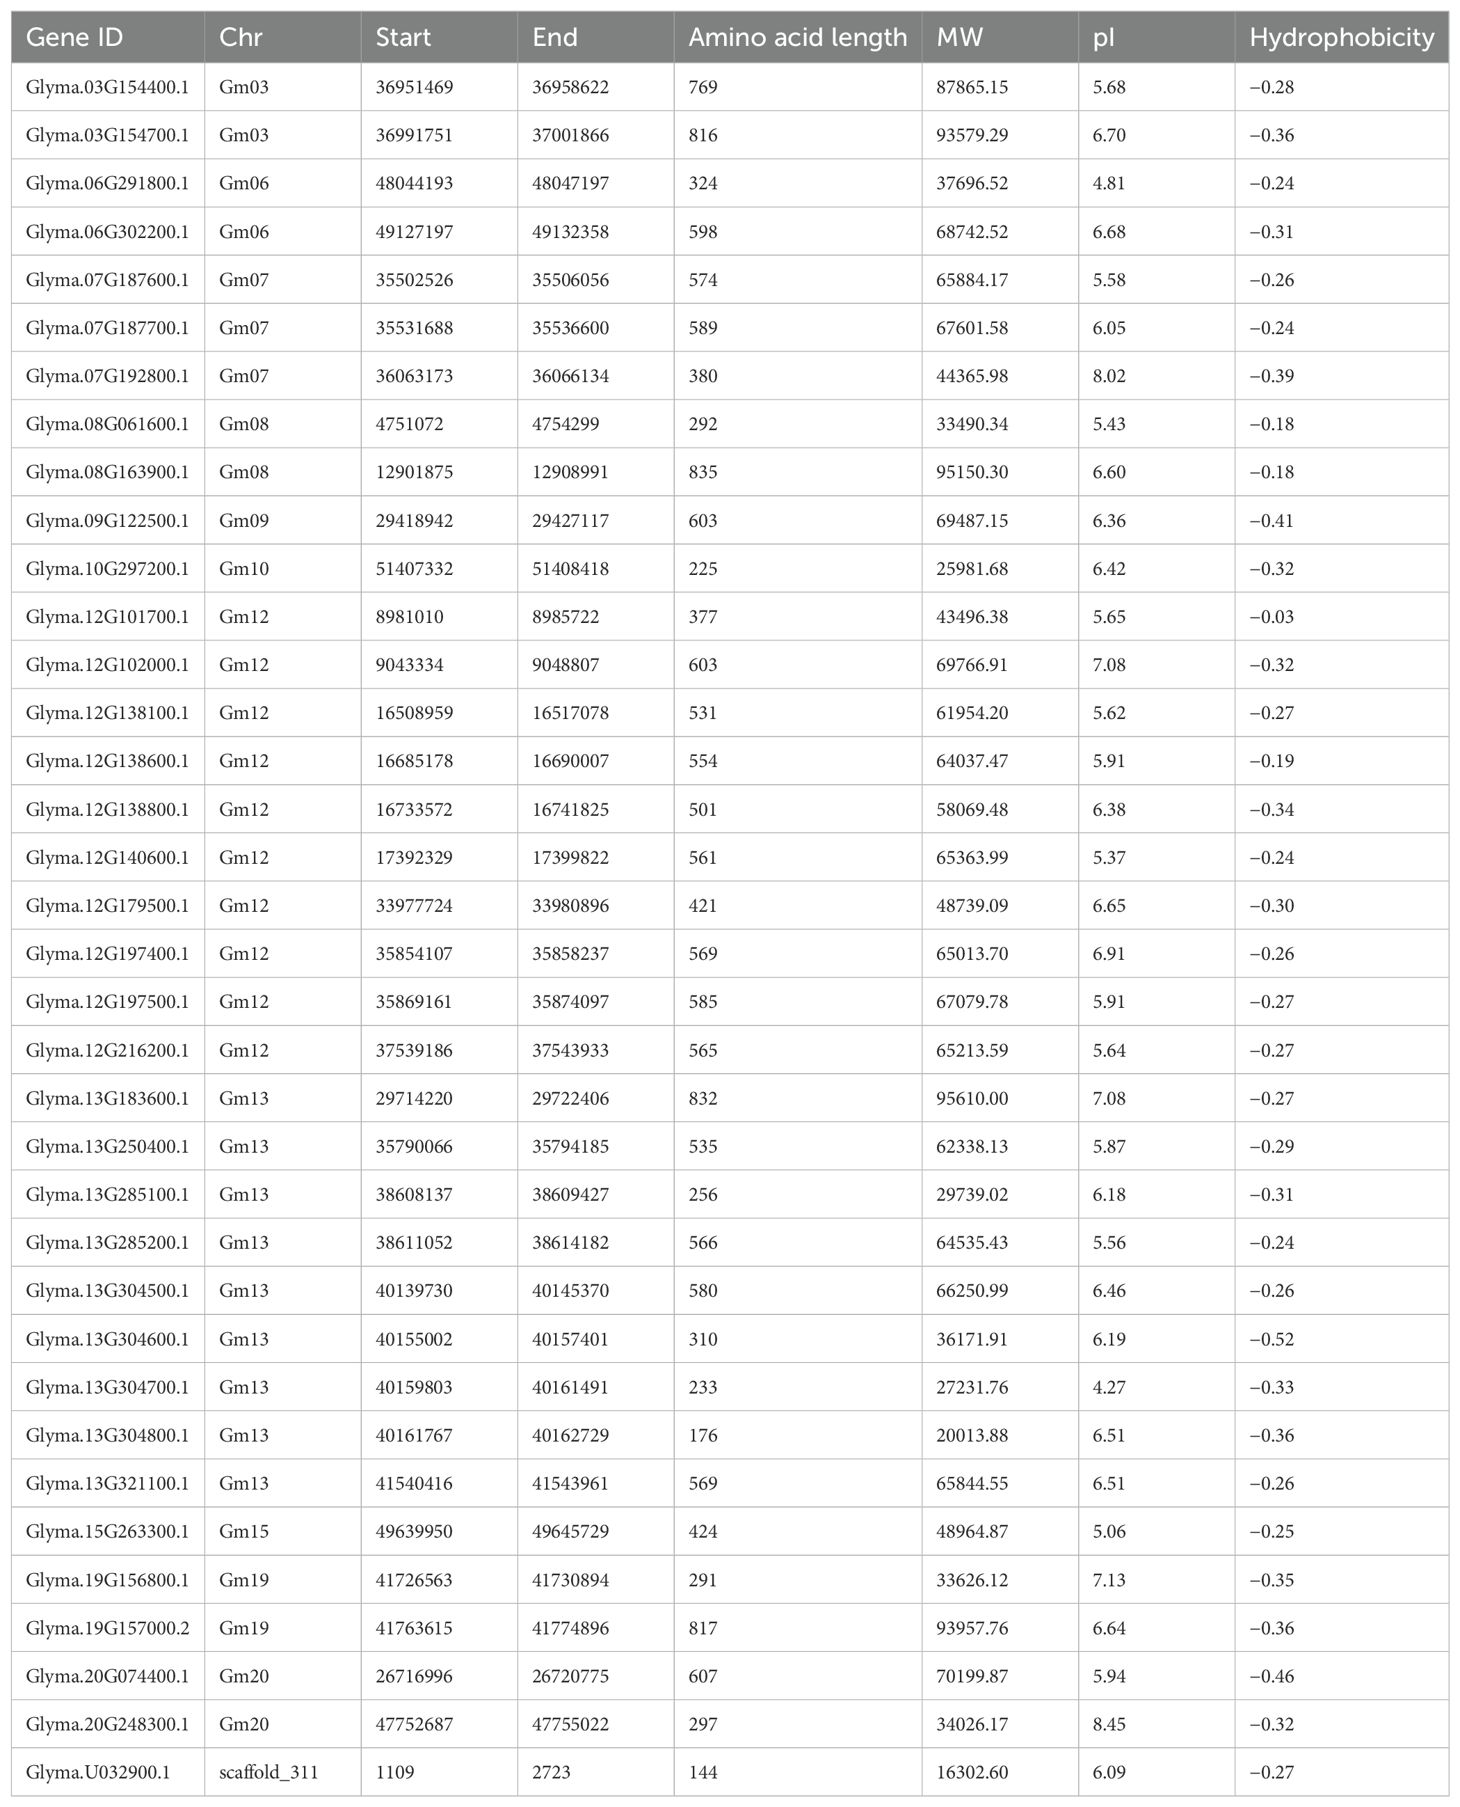
Here, a total of 36 TPS members in soybean were identified by HMMER and BLASTP methods (Table 1). The length of the GmTPSs protein sequence ranged from 144 (scaffold_311) to 835 (Glyma.08G163900.1); the molecular weight ranged from 16.3 (scaffold_311) to 95.6 KDa (Glyma.13G183600.1); the PI ranged from 4.27 (Glyma.13G304700.1) to 8.45 (Glyma.20G248300.1) (Table 1). It’s worth noting that 86% of GmTPS have isoelectric points less than 7 (Table 1), it is suggest that most GmTPS genes may are acidic proteins.
3.2 Phylogenetic analysis of TPSs
To deeper understanding the evolutionary dynamics of GmTPSs, we constructed a phylogenetic tree that comprehensively encompasses 36 GmTPSs, along with 33 AtTPSs and 53 OsTPSs. The TPSs members could be grouped into Group1, Group2, Group3, Group4 and Group5 (Figure 1). Group5 contained the largest number of 35 TPSs, while Group3 contained the smallest number of 10 TPSs. Group1, Group2, and Group4 contained the number of 19, 27 and 32 TPSs, respectively. Interestingly, no GmTPSs and AtTPSs member was found in the subgroup of Group5, and Group1 and Group4 contain only GmTPS and AtTPS members (Figure 1). These observations provide insights into the evolution of the TPS gene family.
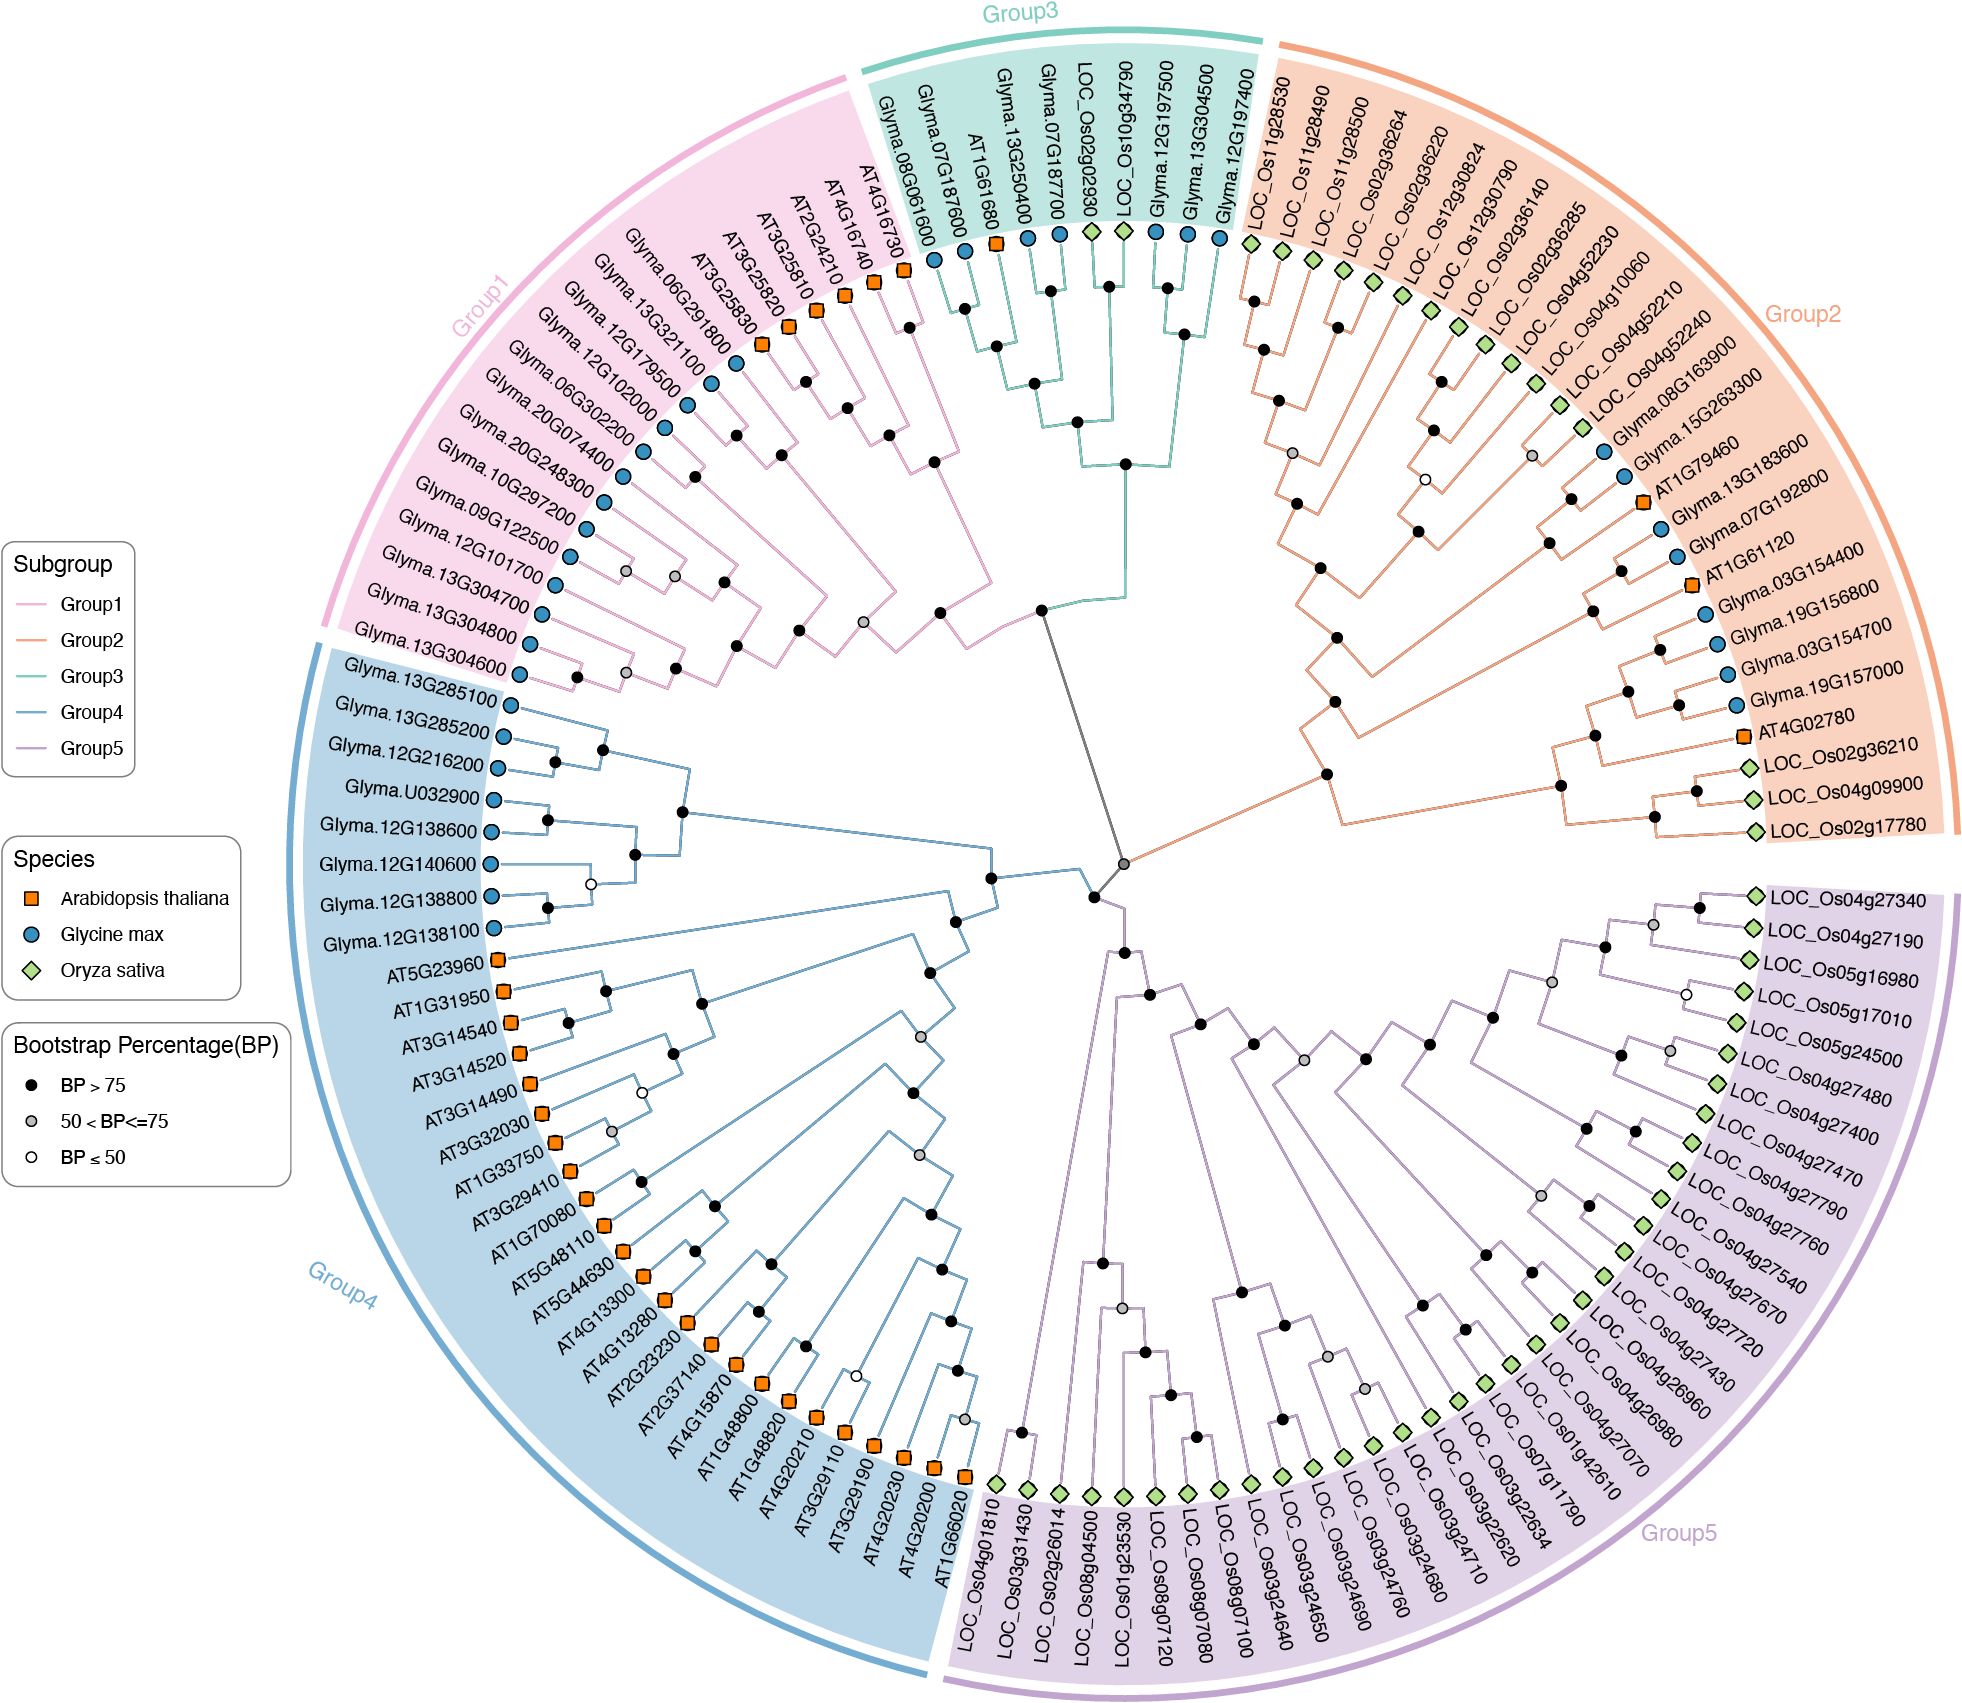
Figure 1. Phylogenetic tree of 36 GmTPSs, 33 AtTPSs and 53 ScTPSs. The evolutionary tree was constructed by the maximum likelihood method. Pink, orange, sky blue, blue and purple represent the subfamily of Group1, Group2, Group3, Group4 and Group5, respectively.
3.3 Gene structure and motifs analysis of GmTPS
To comprehend the diversity of GmTPS genes, we analyzed the gene structures, and conserved domain and conserved motif in GmTPS, the results are presented in Figure 2. Most of the GmTPS members contained two conserved domains, the Terpene_synth domain at the N-terminal and the Terpene_synth_C domain at the C-terminal (Figure 2). It is worth noting that Glyma.U032900 and Glyma.07G192800 consist only of the Terpene_synth_C domain; Glyma.19G156800 consist only of the Terpene_synth domain. Interestingly, Glyma.06G291800 contain two Terpene_synth_C domains (Figure 2). Except for the Terpene_synth_C domains, Glyma.12G179500 also contains Terpene_syn_C_2 domain.
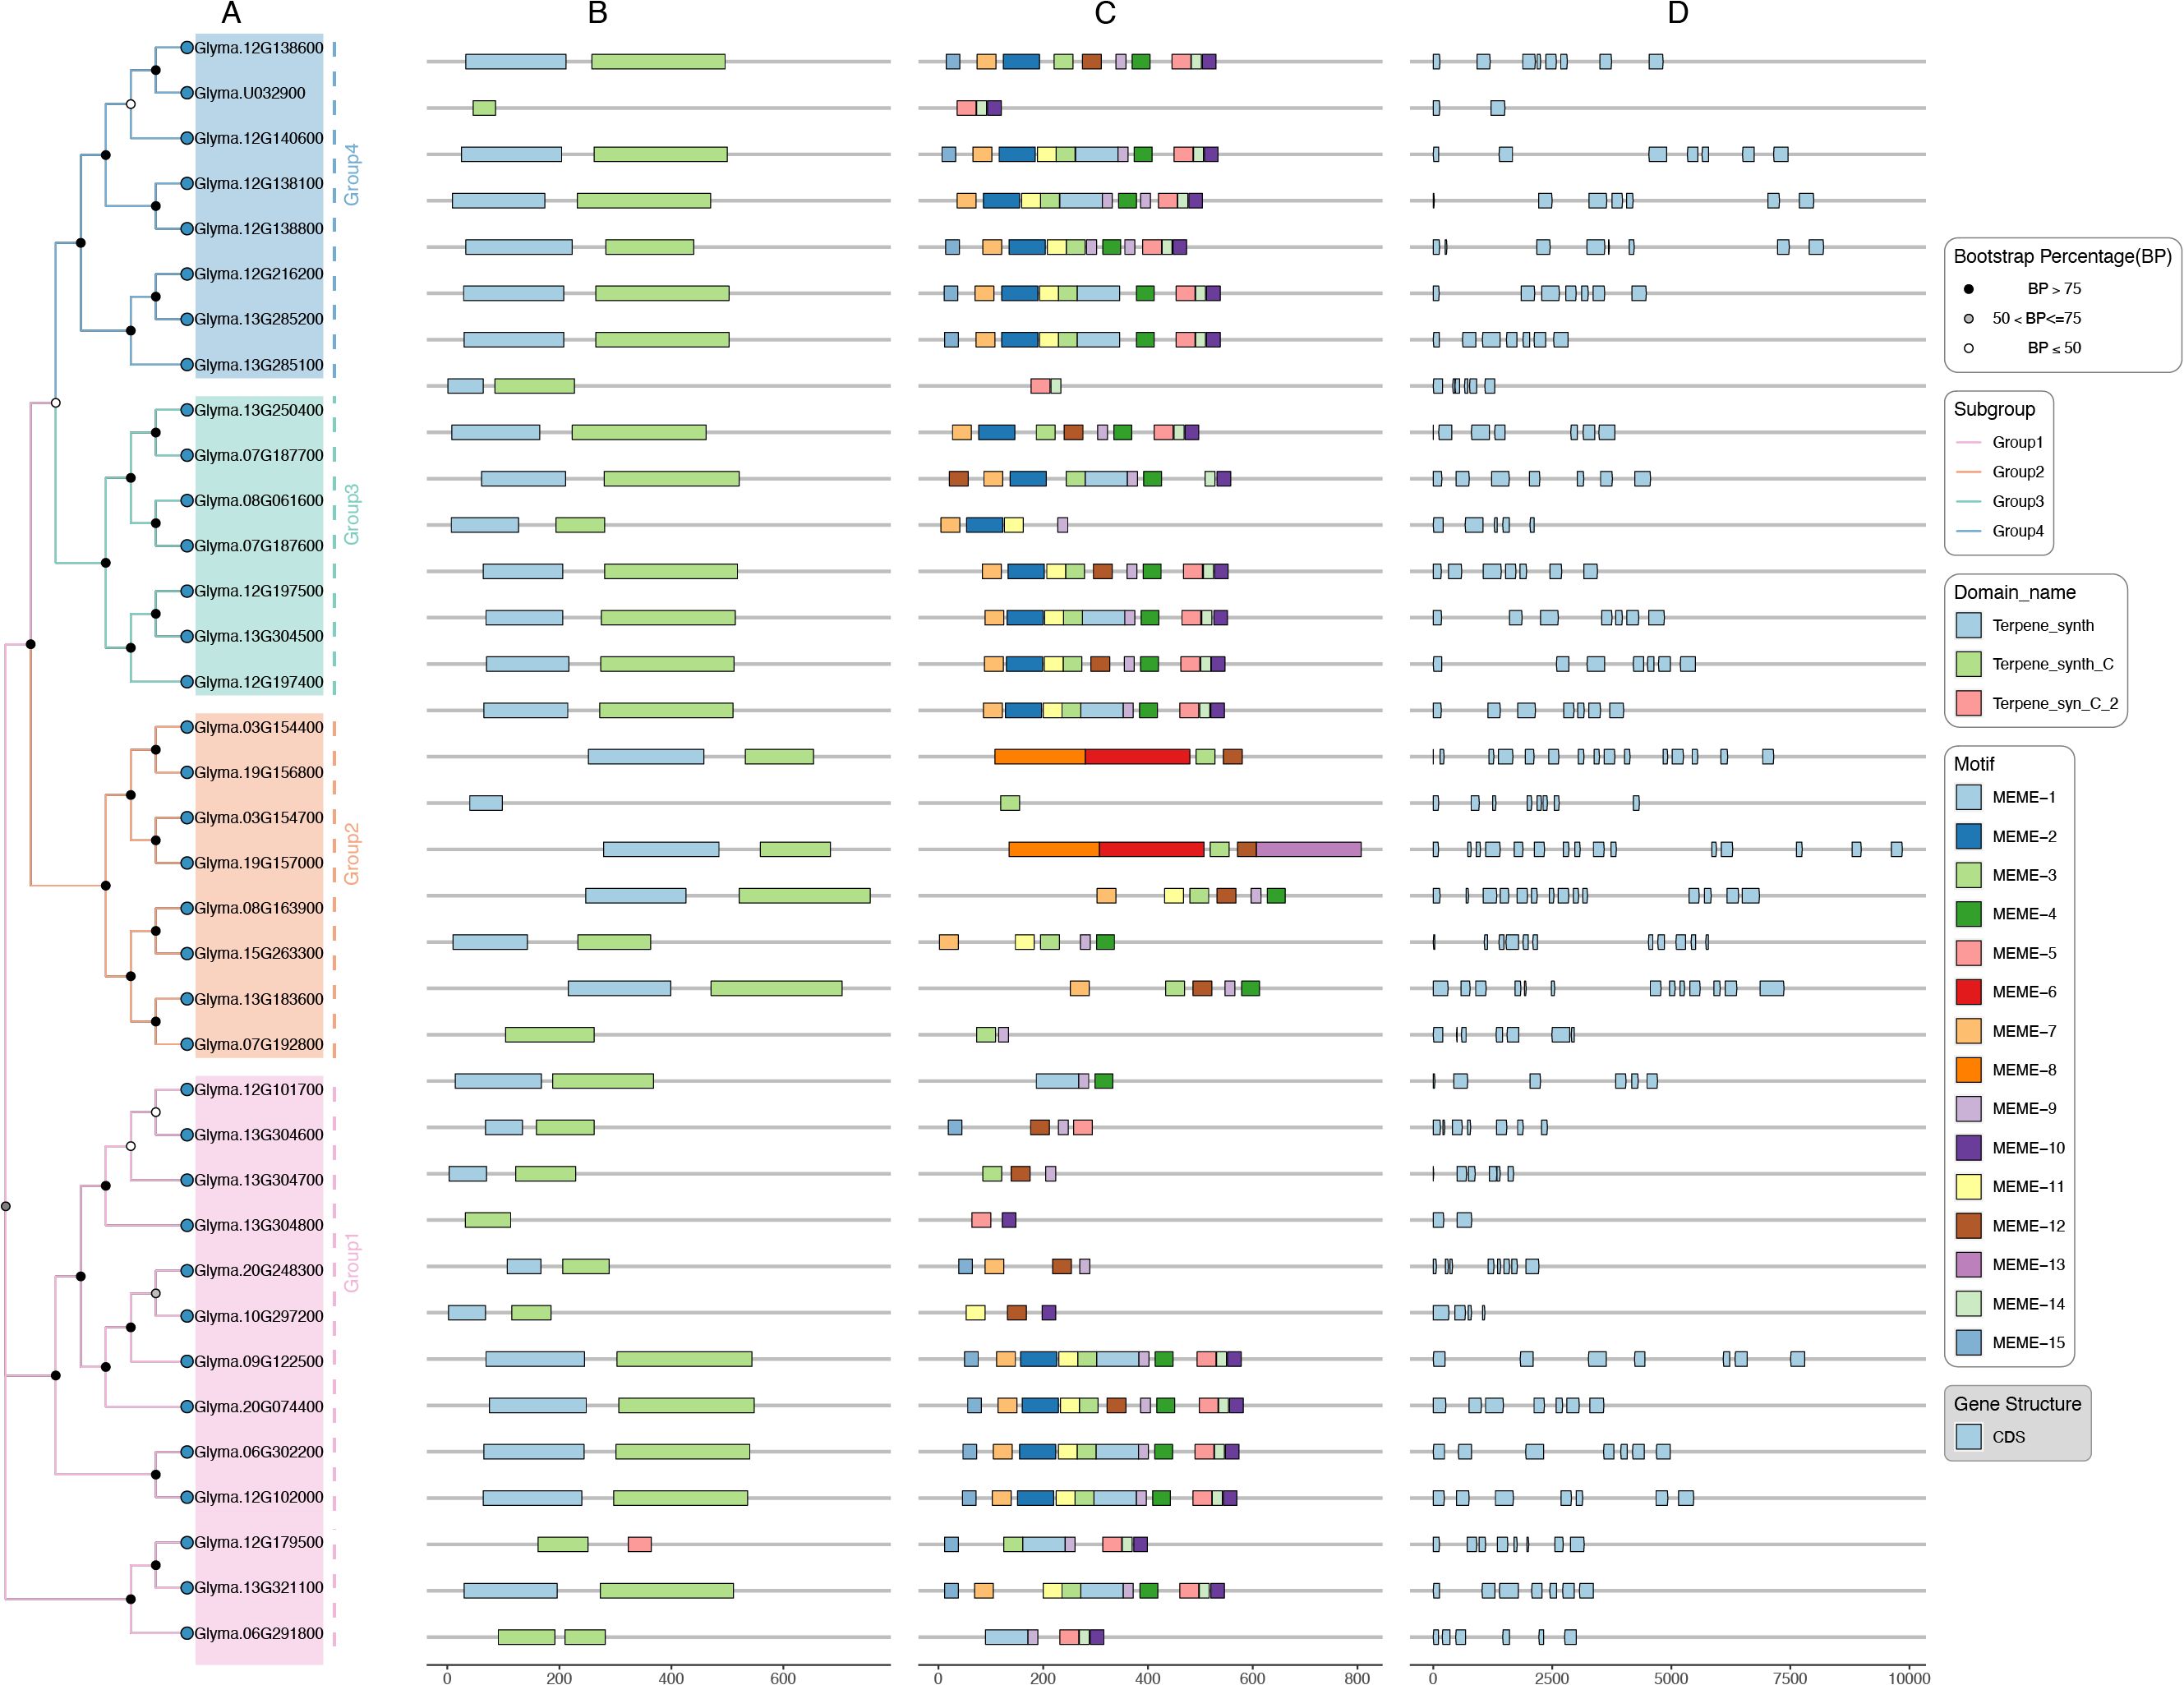
Figure 2. The domains, motifs and gene structure of GmTPSs were analyzed. (A) Phylogenetic tree, (B) The domains were predicted by NCBI-CDD. (C) The motifs of GmTPSs were predicted by MEME. (D) Gene structure of GmTPS.
On the other hand, in the same subgroups, we found the conserved motifs of GmTPS were similar, although variations existed among different subfamilies (Figure 2). For example, Group4 Subgroup members Glyma.12G138600, Glyma.12G140600, Glyma.12G138800, Glyma.12G216200 and Glyma.13G285200 contain conserved motif 1, motif 2, motif 3, motif 5, motif 6, motif 7, motif 10, motif 11, motif 14 and motif 15; Glyma.12G197500 and Glyma.12G197400 contain conserved motif 1, motif 2, motif 3, motif 4, motif 6, motif 7, motif 9, motif 10 motif 11 and motif 14 (Figure 2). These diverse motifs reflect the functional diversity of GmTPS proteins. On the other hand, we found that most TBS genes contain multiple introns, except for Glyma.U032900 and Glyma.13G304800, which contain only one intron (Figure 2). The variations of motifs and gene structure may contribute to the diverse biological functions of GmTPSs.
3.4 Duplication events analysis of GmTPS genes
According to GFF files, we analyzed the gene distribution of 36 GmTPS. The 36 GmTPS genes were distributed on 10 chromosomes, while no GmTPS genes were distributed on chromosomes Chr1, Chr2, Chr4, Chr5, Chr10, Chr11, Chr14, Chr16, Chr17 and Chr18 (Figure 3). Notably, the most GmTPS genes were distributed at chr12 and chr13, with 10 and 19 respectively, forming gene clusters. Both Chr9 and Chr15 contain one GmTPS members, while both Chr3, Chr6, Chr8, Chr19 and Chr20 contain two GmTPS members (Figure 3).
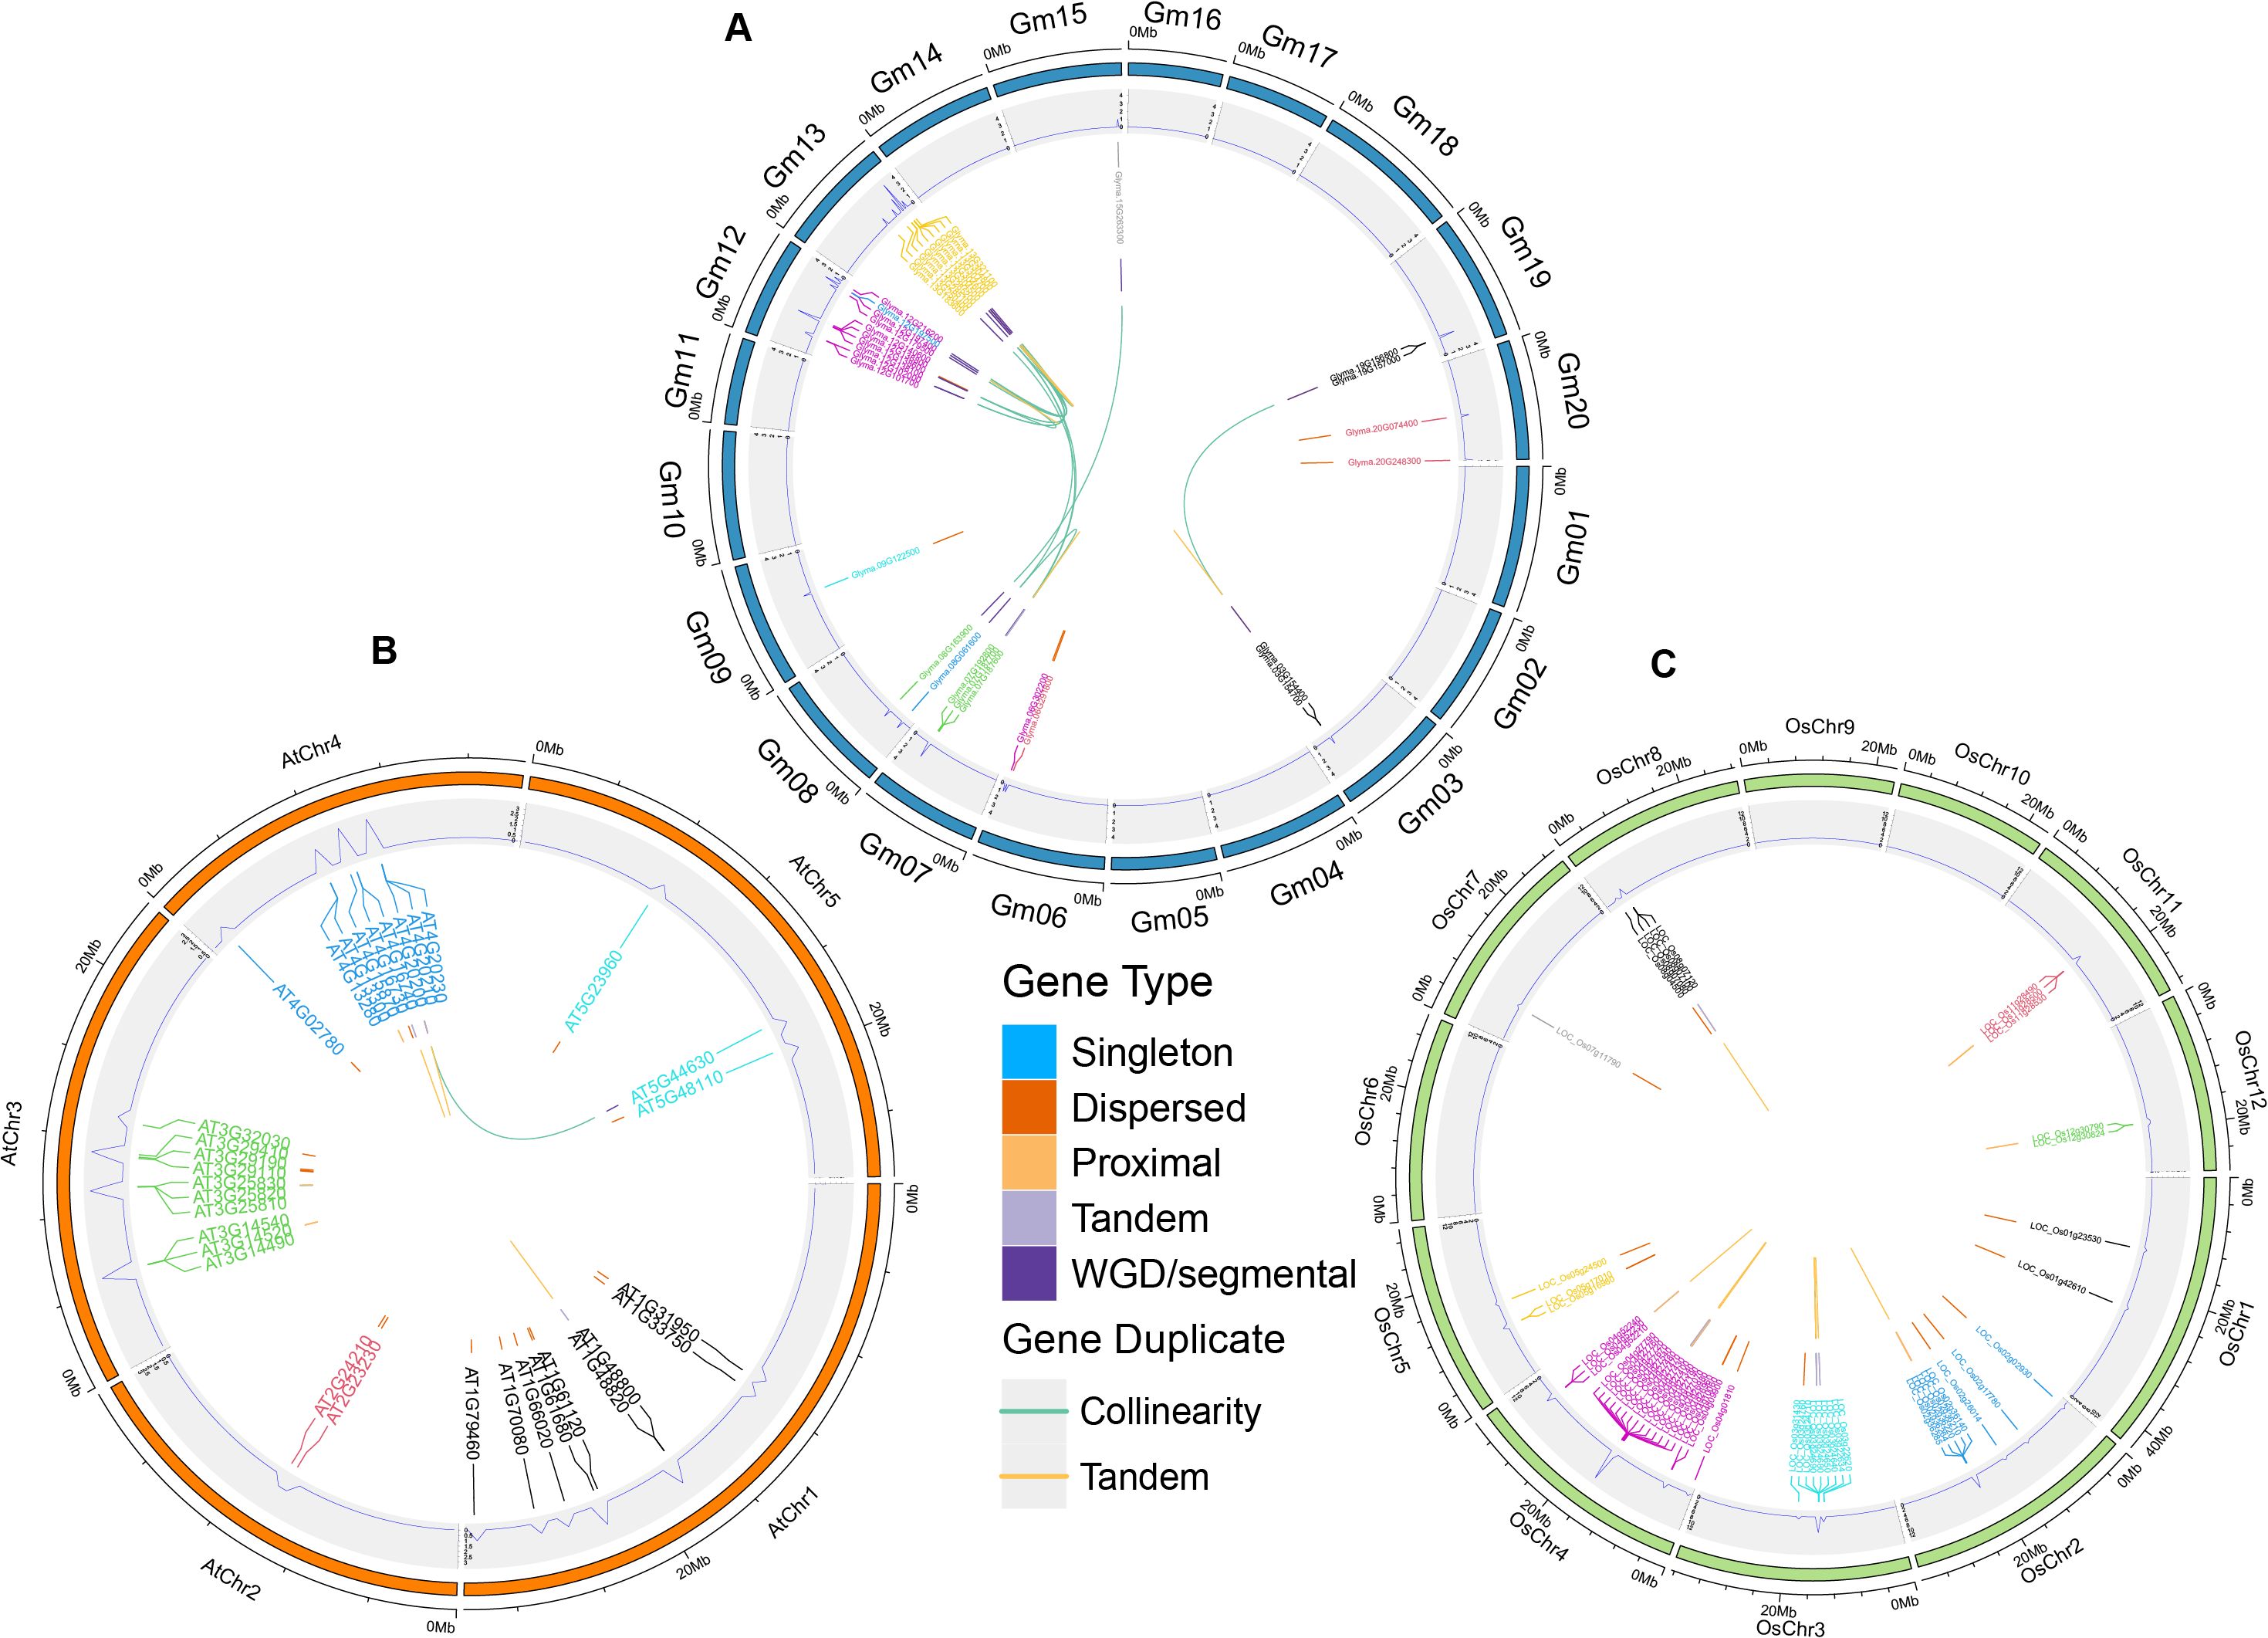
Figure 3. The chromosome location and duplicated gene pair of TPS genes in three species including (A) soybean, (B) Arabidopsis and (C) rice. The duplicate gene types were displayed in different color. WGD and TD events are shown in orange and blue, respectively.
TD and WGD drive the expansion of the gene family (Freeling, 2009; Panchy et al., 2016). Therefore, we explored the duplication events of TPS genes in soybean, Arabidopsis and rice. In this study, 16 WGD gene pairs and 18 TD gene pairs were confirmed in soybean, Arabidopsis and rice (Figures 3A–C; Supplementary Table 1). Overall, in soybean, Arabidopsis and rice, 10 (27.78%), 18 (60%) and 16 (30.19%) TPS genes were confirmed to be TD, and 23 (63.89%), 2 (6%) and 0 (0%) TPS genes were found to be WGD, respectively (Figures 3A–C; Supplementary Table 1). These data show that both TD and WGD contributive to the expansion of TPS genes in soybean, and WGD played a major role. However, in Arabidopsis, TD and WGD both promoted the expansion of TPS genes, and TD plays a leading role. Interestingly, in rice, only TD replication events were found. These data suggest that TPS genes expand differently in soybean, Arabidopsis and rice.
3.5 Collinearity analysis of GmTPS genes
To deeper investigate the homology of the TPS gene family in G. max, we conducted a comparative analysis of TPS gene collinearity between G. max and two model organisms, Arabidopsis and rice. Our findings revealed that 2 AtTPS and 1 OsTPS were homologous gene pairs with GmTPS (Figure 4). To gain insights into the evolutionary pressures of TBS genes in soybean, Arabidopsis and rice, we employed DnaSP software to calculate Ka/Ks ratios. Here, we found that the Ka/Ks value of all TPS duplication gene pairs is less than 1 in soybean, Arabidopsis and rice (Supplementary Table 1). These results suggest that GmTPS, AtTPS and OsTPS genes were under purifying selection.
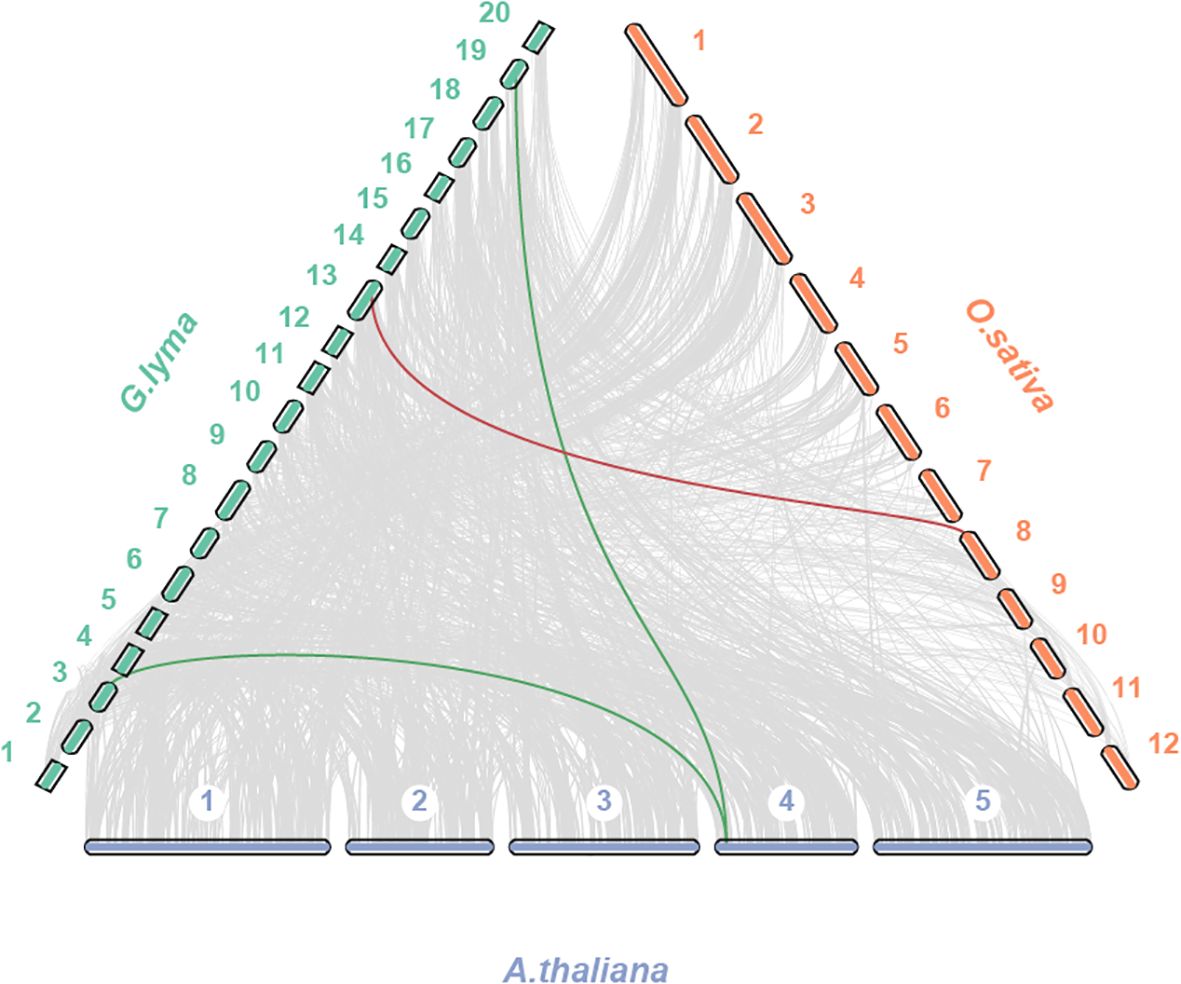
Figure 4. Syntenic analysis of GmTPS genes between and Arabidopsis and rice. The collinear blocks and TPS homologous genes pairs were shown by gray and red lines, respectively.
3.6 Cis-elements analysis of GmTPS
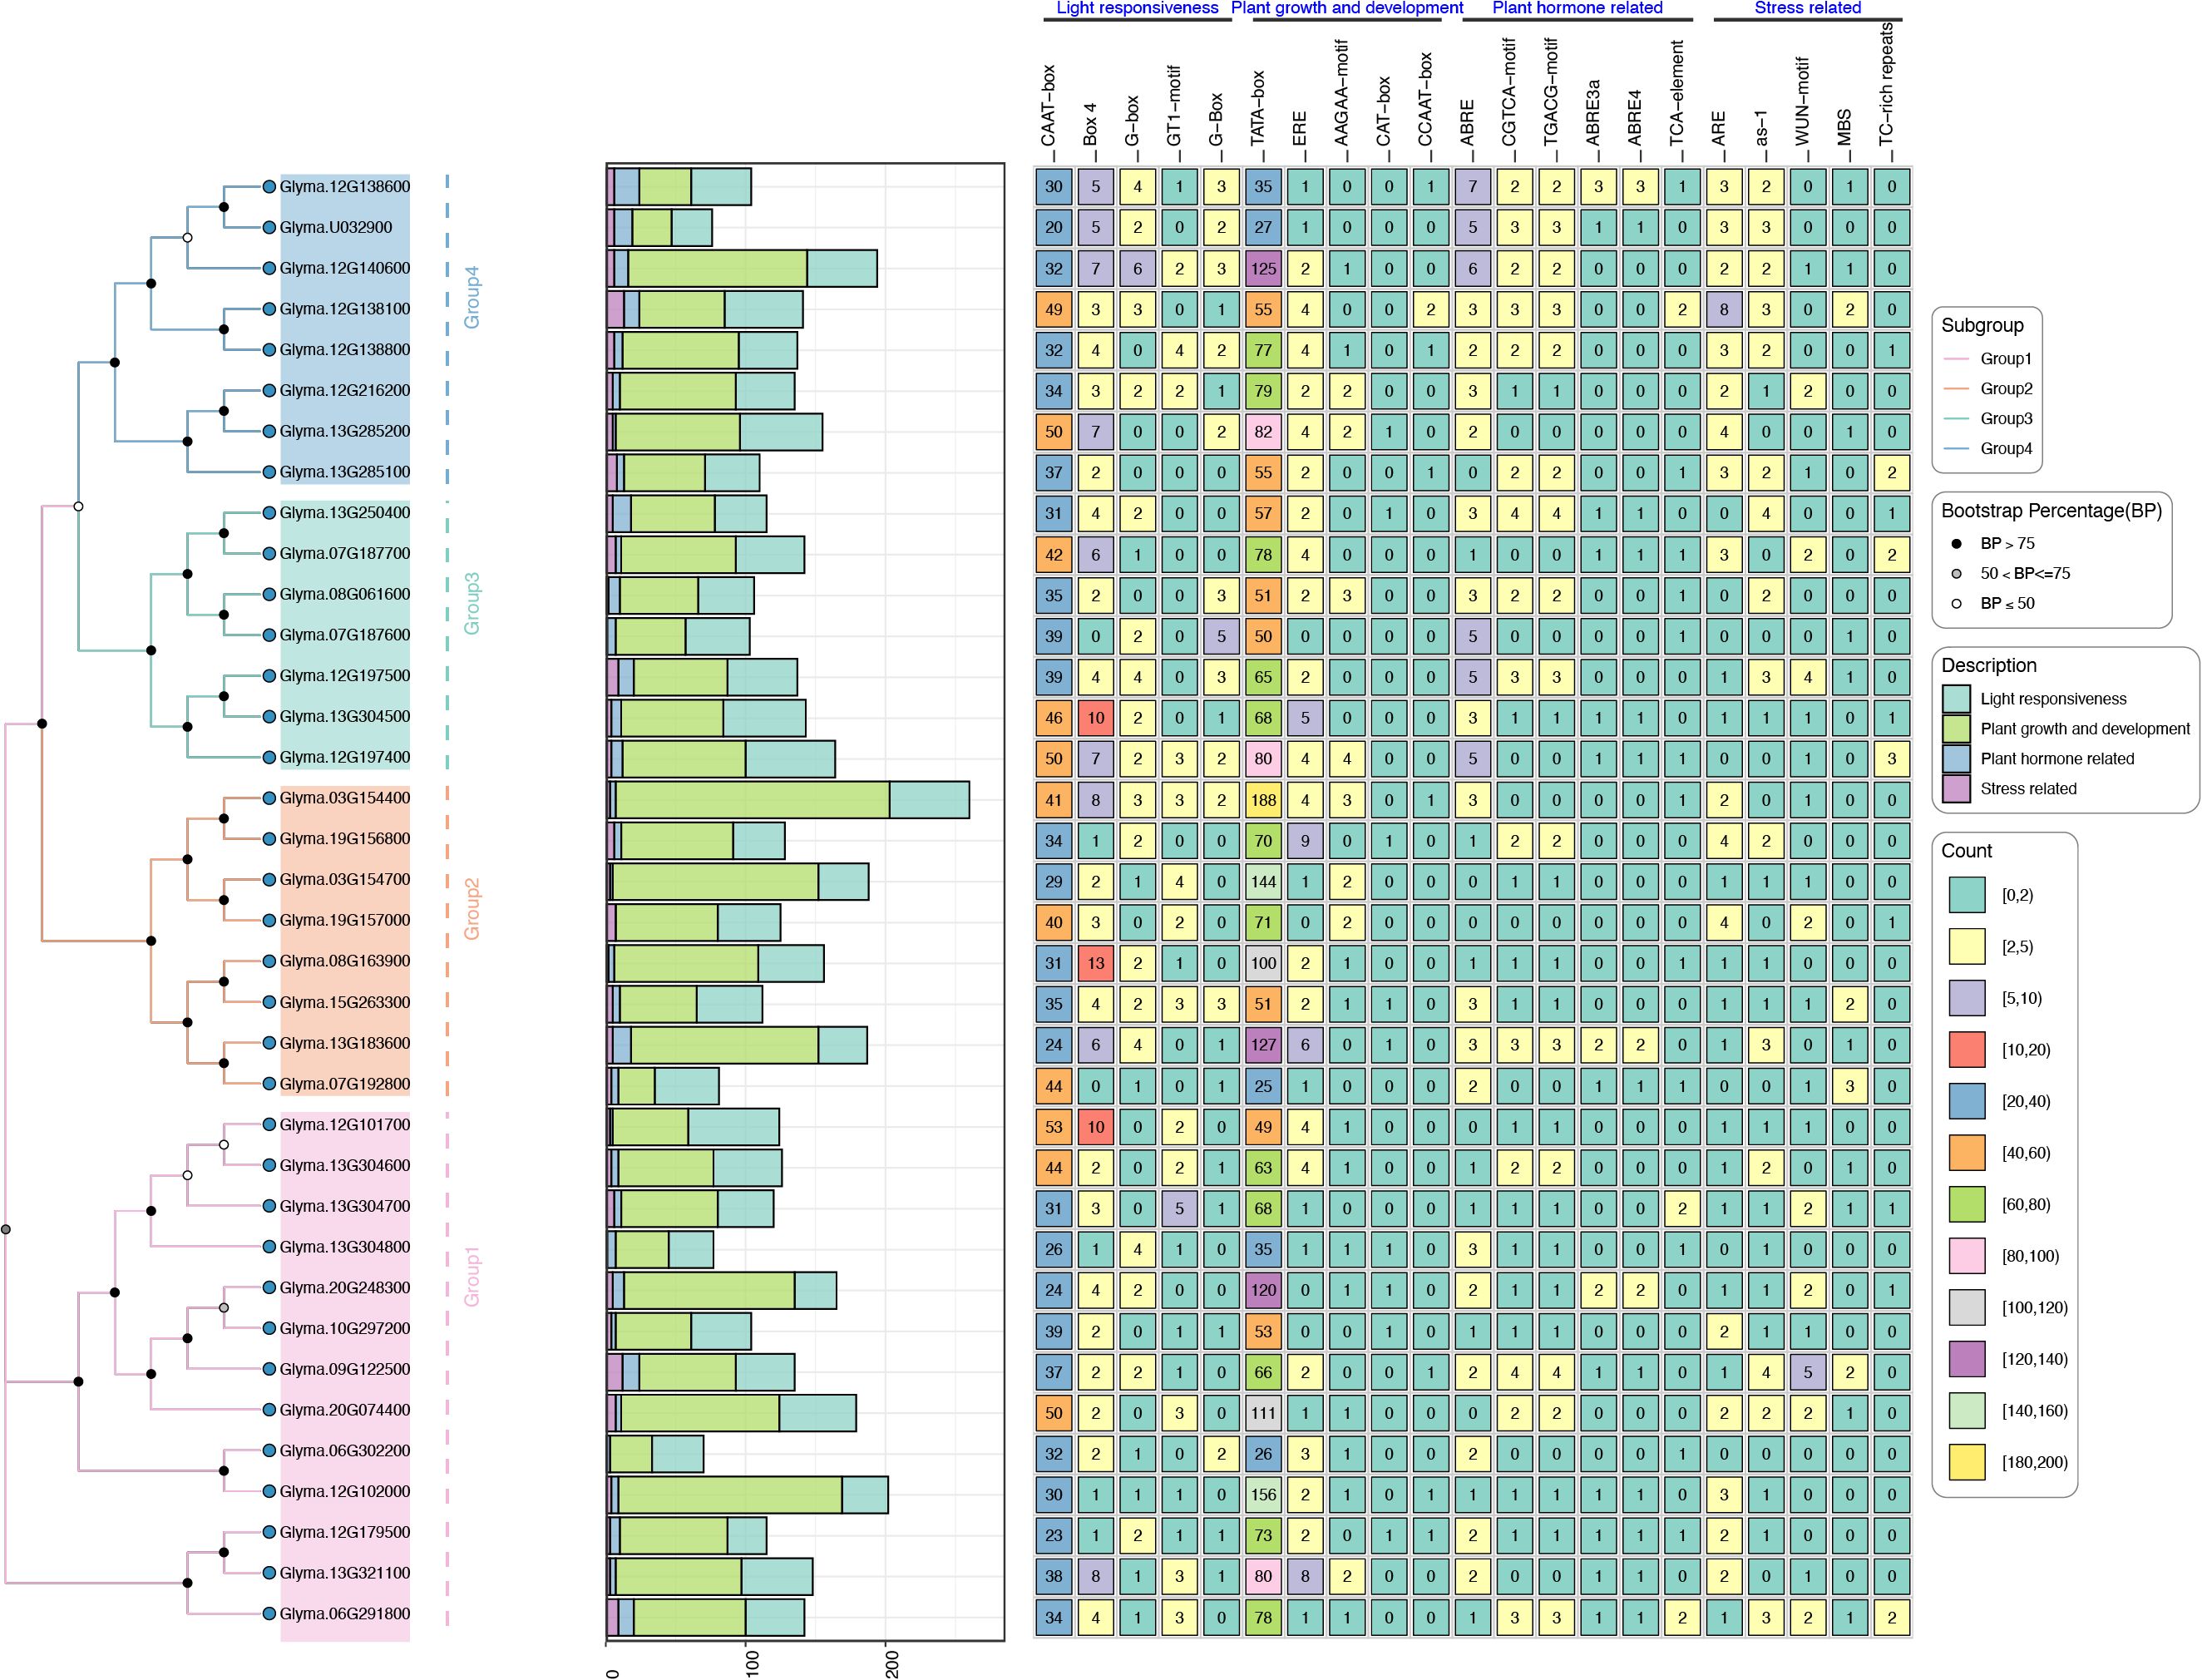
To unravel the may regulatory mechanisms of GmTPS genes, we analyzed their 2k promoter regions, uncovering a diverse array of 21 cis-elements (Figure 5). These elements encompass various functional categories, including light response-related cis-elements (CAAT-box, Box-4, e.g); plant growth and developmental; phytohormone (ABRE, CGTCA-motif, TGACG-motif and TCA-element) and stress response related cis-elements (ARE, as-1, WUN-motif, MBS and TC-rich repeats) (Figure 5). Interestingly, Group4 GmTPS genes contain ABRE, CGTCA-motif and TGACG-motif cis-elements (Figure 5), hinting that GmTPS genes may be involved in ABA and JA signaling pathways. In addition, Glyma.13G285100 contains CGTCA-motif, TGACG-motif and TCA-element, suggesting that it may antagonistically participate in SA and JA signaling pathways (Figure 5). It’s worth noting that Glyma.19G157000 contains a large number of light, plant growth and developmental and stress response cis-elements, while no hormone response cis-elements are found. Furthermore, our analysis revealed that Glyma.07G192800, Glyma.12G138100, Glyma.15G263300, and Glyma.09G122500 contain varying numbers of MBS cis-elements, indicative of potential roles in drought signaling pathways (Figure 5). The above data indicates that GmTPS may have complex regulatory functions.
3.7 Interaction network of GmTPS proteins
To gain deeper insights into the functional roles and regulatory intricacies within the GmTPS gene family, we leveraged the AraNet2 database to analyze and predict a protein-protein interaction network. This analysis revealed extensive interconnectivity among the GmTPS proteins, with nearly all members engaging in interactions (Figure 6). Interestingly, we found that some GmTPS proteins can interact with P450 proteins, suggesting potential functional crosstalk or coordinated activities between these two protein classes (Figure 6).
In addition, we selected Glyma.07G192800 and Glyma.15G263300 proteins to verify whether TPS proteins can interact with other TPS proteins or P450 proteins. To this end, we used the Y2H assay. As data shown in Figure 7, we found that Glyma.07G192800 can interact with Glyma.12G140600, and Glyma.15G263300 can interact with Glyma.20G074400 (Figure 7). Moreover, we found that Glyma.07G192800 can interact with P450 proteins Glyma.09G029400, and Glyma.15G263300 can interact with P450 proteins Glyma.01G153300 (Figure 7). These data indicate that TPS protein may form heterodimer to function, or may form complex with P450 protein to function.
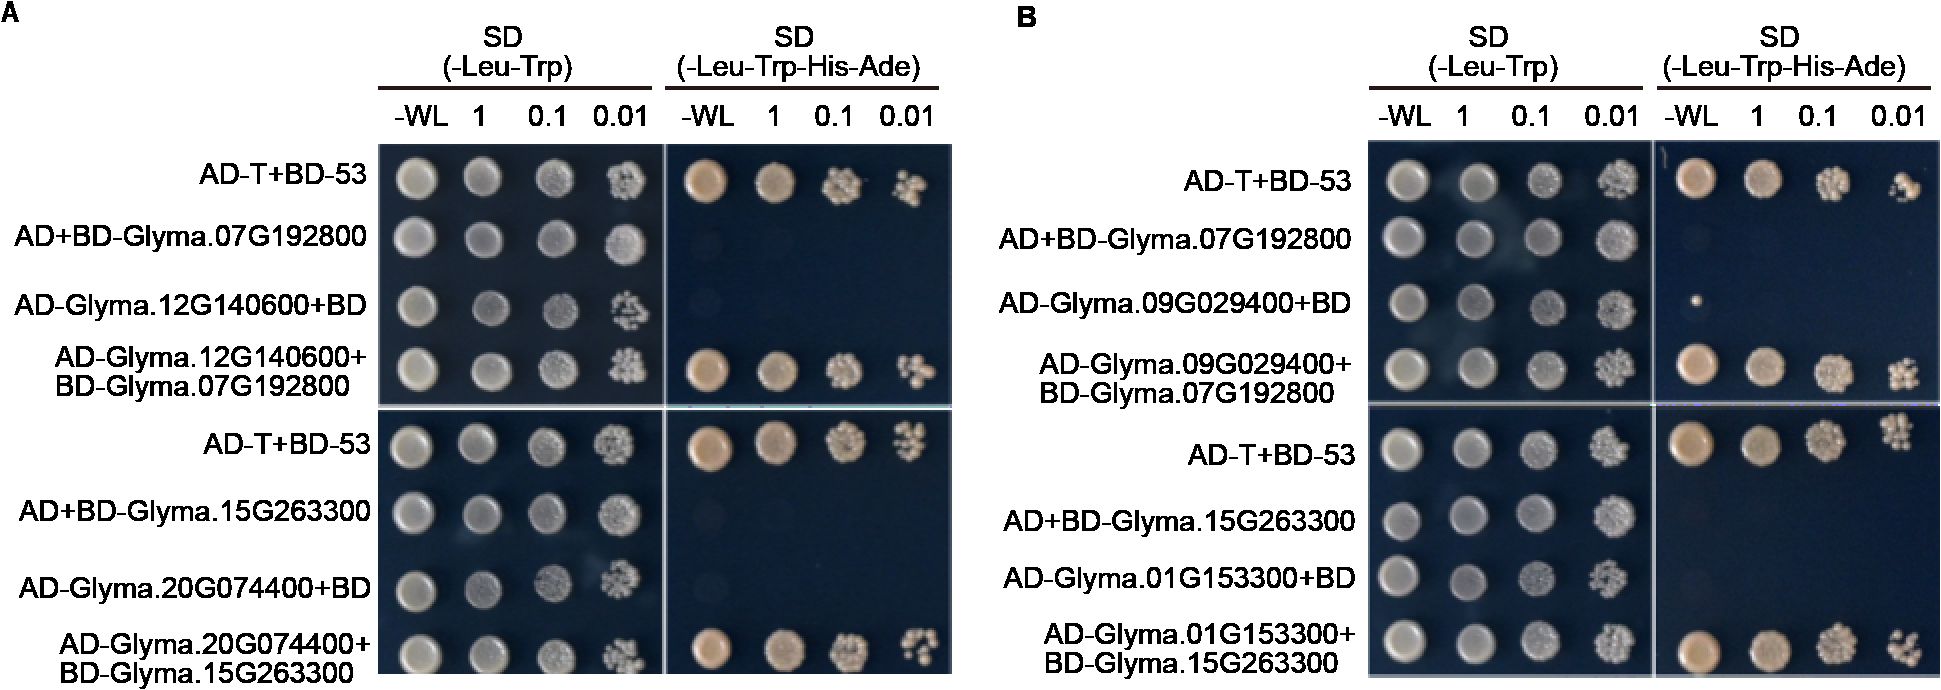
Figure 7. Y2H assays show TPS proteins can interact with other TPS proteins or P450 proteins. (A) The image showed the results of TPS proteins can interact with other TPS proteins. (B) The image showed the results of TPS proteins can interact with P450. The positive control: AD-T + BD-53.
3.8 The tissues expression analysis of GmTPS
To further explore the functions of GmTPS, we analyzed its expression pattern based on RNA-seq data. Glyma.06g45780, Glyma.12g16940, Glyma.12g32370 and Glyma.07g30700, expressed higher in flower than other tissues. We speculate that these GmTPS genes may synergistically regulate soybean growth and development (Figure 8). And Glyma.12g16940 and Glyma.12g32370 are expressed only in flower. Additionally, these GmTPSs no expression of Glyma.13g32380, Glyma.17g05500, Glyma.12g16990, Glyma.13g38050, Glyma.06g45780, Glyma.12g16940, Glyma.12g32370, Glyma.07g30700, Glyma.07g30710 and Glyma.20g18280 are detected in the organs of seed and nodule. On the other hand, Glyma.08g17470 and Glyma.15g41670 are widely expressed in root, young leaf, pod shell, flower, seed and nodule (Figure 8). The result indicate that GmTPS genes may involve in diverse aspects of plant growth and developmental processes.
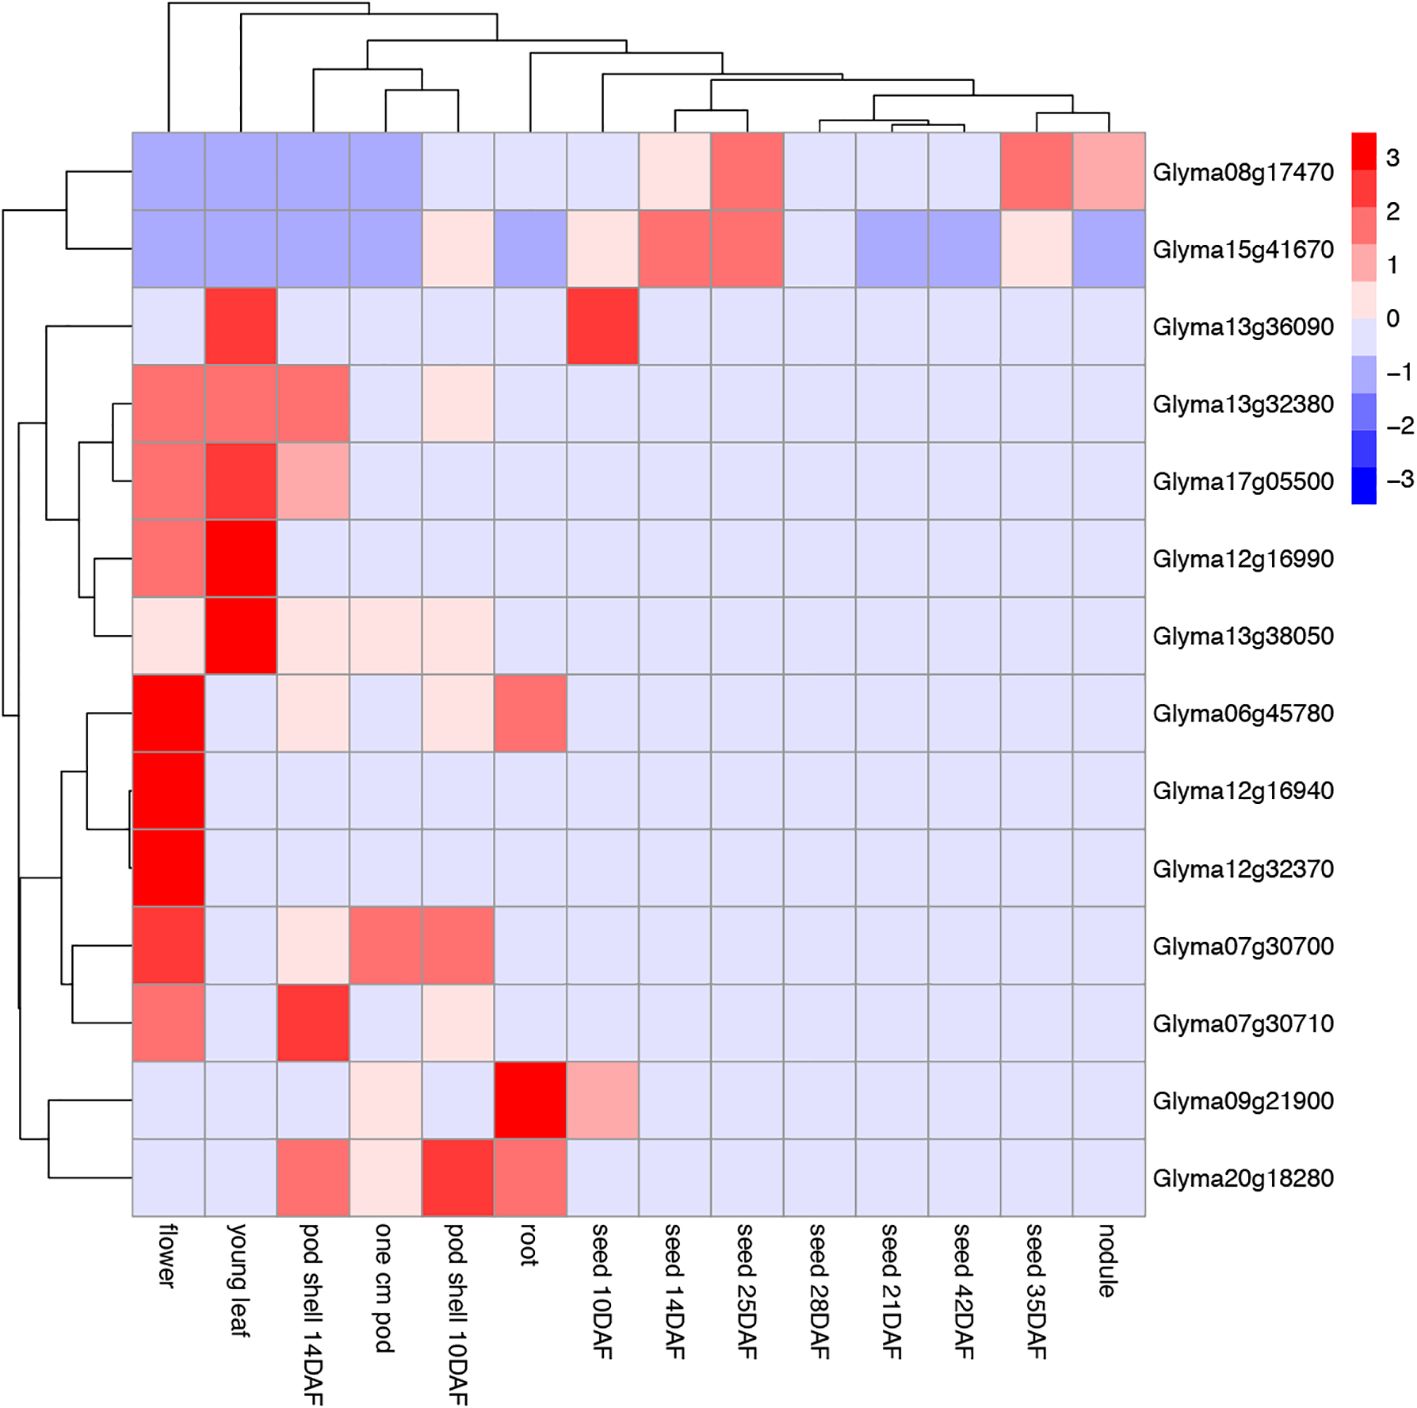
Figure 8. The heat map of the tissue expression of GmTPS genes in different tissues and development stages (flower, young leaf, pod shell 14DAF, one cm pod, pod shell 10DAF, root, seed 10DAF, seed 14DAF, seed 25DAF, seed 28DAF, seed 21DAF, seed 42DAF, seed 35DAF and nodule). The data are shown in a heatmap with gene expression in different tissues and development stages with row-scaled FPKM values.
4 Discussion
Terpenoids, widely existing in plants, fungi, bacteria and insects, and play an pivotal role in enhancing plant resistance. It is worth noting that the TPS proteins are involved in many biological processes, such as low-temperature stress adaptation, drought stress adaptation, salt stress adaptation, and responses to phytohormonal and insect resistance (Yeo et al., 2000; Li et al., 2011; Huang et al., 2018; Ge et al., 2008; Zhou et al., 2020; Yan et al., 2022; Zhong et al., 2024). While the TPS gene family has been found in many species, but, the whole-genome identification and bioinformatics analysis of TPS gene family in soybean is lacking. In this study, we systematically analyzed the TPS gene family in soybean using bioinformatics methods and identified a total of 36 TPS genes (Table 1). TPS genes, which are ubiquitous among plant species, such as 33, 53, 12, 8, 80, 26, 58 and 16 TPS genes were found in Arabidopsis, rice, populus, potato, d. officinale, camellia, aloes, l. chinense and A. hypogaea (Aubourg et al., 2002; Yang et al., 2012; Xu et al., 2017; Zhou et al., 2020; Li et al., 2021; Cao et al., 2023 and Zhong et al., 2024). It is not difficult to see that the member of TPS genes in different plants varies greatly. These results also showed that TPS genes may not only be functionally conserved, but also functionally differentiated in different plants.
Prior research has categorized TPS proteins into seven distinct subfamilies: TPS-a through TPS-h. are predominantly found in angiosperms, while TPS-c is specific to gymnosperms, and TPS-e/f occurs in vascular plants (Newman and Chappell, 1999; Chen et al., 2011). Phylogenetic tree showed that the 122 TPS proteins in GmTPSs, AtTPSs and OsTPSs can be divided into five groups (Figure 1). Interestingly, Group5 only exists in the rice, and Group1 and Group4 only exists in soybean and Arabidopsis. These observations may provide insights into the evolution and diversification of the TPS gene family in monocotyledons and dicotyledons.
During the progress of evolution, TD and WGD events played a key role in the expansion of gene families, new genes and novel functions (Freeling, 2009; Panchy et al., 2016). In our study, we observed rapid expansion of the Group4 subgroup in G. max due to recent TD and WGD, while the Group5 subgroup experienced rapid expansion in O. sativa for the TD. Overall, the number of WGD genes was the largest, indicating that WGD was found to be the predominant mechanism driving the evolution and expansion of the TPS gene family in G. max. This investigation offers profound insights into the evolutionary journey and expansion patterns of the TPS gene family across diverse plant species.
Numerous studies found the important role of TPS genes in mediating plant responses to different hormone signals, and abiotic and biotic stress (Yeo et al., 2000; Li et al., 2011; Huang et al., 2018; Ge et al., 2008; Zhou et al., 2020; Yan et al., 2022; Zhong et al., 2024). For instance, OsTPS1 overexpression in rice boosts trehalose levels, enhancing resilience against low temperatures (Ge et al., 2008). Similarly, TaTPS11 overexpression in Arabidopsis enhances cold tolerance (Liu et al., 2019), while ScTPS1 overexpression in tomato elevates drought tolerance (Cortina and Culiáñez-Macià, 2005). Our cis-acting element analysis revealed that Glyma.07G192800, Glyma.12G138100, Glyma.15G263300 and Glyma.09G122500 contain three, two, two and two MBS cis-elements, respectively (Figure 5). This result implies that these GmTPS genes may be involved in drought signaling pathways, and will be an interesting topic to explore in the future.
On the other hand, MeJA treatment transcriptionally upregulated the expression of most CsTPS genes (Zhou et al., 2020). Our analysis uncovered the prevalence of MYC2, ABRE, CGTCA-motif, TGACG-motif, and WUN-motif in the promoters of GmTPS genes, particularly Glyma.12G138100, Glyma.15G263300, and Glyma.09G122500, which harbor ABRE, CGTCA-motif, TGACG-motif, as-1, WUN-motif, and MBS cis-elements (Figure 5). Despite the scarcity of experimental evidence elucidating the intricate relationships between phytohormone signaling and terpenes biosynthesis, we hypothesize that intricate crosstalks among distinct phytohormone signaling pathways may delicately modulate terpenes biosynthesis through a myriad of transcription factors, and will an interesting topic to explore in the future.
Cytochrome P450s (CYPs) orchestrate an array of essential processes, encompassing growth, development, and the biosynthesis of secondary metabolites (Mizutani and Ohta, 2010 and 2012). For instance, P450 enzymes exhibit remarkable adaptability in modulating plant development through hormone synthesis (Schuler, 1996). Specifically, CYP707A play a key role in the catalytic synthesis of ABA (Saito et al., 2004), while CYP94B3, CYP94C1 and CYP74B were related in JA biosynthesis (Li et al., 2008; Koo et al., 2011; Heitz et al., 2012). Our observations that some TPS proteins can interact with P450 proteins in soybean during the Y2H assays (Figure 7), suggest that TPS proteins likely form complexes with P450 proteins and participate in the growth, development, and the biosynthesis of secondary metabolites in soybean.
5 Conclusions
In this study, we identified 36 TPS members in soybean and systematically grouped them into five distinct subfamilies: Group1, Group2, Group3, Group4 and Group5. Subsequently, we demonstrated that both TD and WGD contributed significantly to the expansion of TPS genes in Glycine max, with WGD playing a pivotal role. Furthermore, our analysis revealed that all GmTPS, AtTPS, and OsTPS genes were subjected to purifying selection. Yeast two-hybrid (Y2H) assay results showed that TPS protein may form a heterodimer to function, or may form a complex with P450 protein to function. RNA-seq data displayed GmTPS genes are involved in soybean growth and development. This exhaustive study establishes a foundational understanding of the pivotal roles played by GmTPS genes in soybean.
Data availability statement
The datasets presented in this study can be found in online repositories. The names of the repository/repositories and accession number(s) can be found in the article/Supplementary Material.
Author contributions
HL: Data curation, Formal analysis, Funding acquisition, Methodology, Writing – original draft, Writing – review & editing. XZ: Funding acquisition, Investigation, Methodology, Software, Writing – review & editing. QY: Methodology, Validation, Writing – review & editing. XS: Data curation, Investigation, Writing – review & editing. YM: Data curation, Formal analysis, Funding acquisition, Writing – review & editing.
Funding
The author(s) declare financial support was received for the research, authorship, and/or publication of this article. This project was supported by Shanxi Province Applied Basic Research Project (202103021224145, 202303021212083), Yuncheng Science and Technology Bureau Basic Research Project (YCKJ-2022073), Shanxi Agricultural University Cotton Research Institute Innovation Development project (SJJCX2023-04), Shanxi Province doctoral graduates, PhD After the researchers to Jin work award funding research project (SXBYKY2023024) support.
Conflict of interest
The authors declare that the research was conducted in the absence of any commercial or financial relationships that could be construed as a potential conflict of interest.
Publisher’s note
All claims expressed in this article are solely those of the authors and do not necessarily represent those of their affiliated organizations, or those of the publisher, the editors and the reviewers. Any product that may be evaluated in this article, or claim that may be made by its manufacturer, is not guaranteed or endorsed by the publisher.
Supplementary material
The Supplementary Material for this article can be found online at: https://www.frontiersin.org/articles/10.3389/fpls.2024.1487092/full#supplementary-material
Supplementary Data Sheet 1 | The information of Ka, Ks and Ka/Ks values of duplicate gene pairs.
Supplementary Data Sheet 2 | The information on primer sequences of genes involved in this study.
References
Aubourg, S., Lecharny, A., Bohlmann, J. (2002). Genomic analysis of the terpenoid synthase (AtTPS) gene family of Arabidopsis thaliana. Mol. Genet. Genomics 267, 730–745. doi: 10.1007/s00438-002-0709-y
Camacho, C., Coulouris, G., Avagyan, V., Ma, N., Papadopoulos, J., Bealer, K., et al. (2009). BLAST+: architecture and applications. BMC Bioinf. 10, 1–9. doi: 10.1186/1471-2105-10-421
Cao, Z. J., Ma, Q. X., Weng, Y. H., Shi, J. S., Chen, J. H., Hao, Z. D. (2023). Genome-wide identification and expression analysis of TPS gene family in Liriodendron chinense. Genes (Basel) 14, 770. doi: 10.3390/genes14030770
Chen, F., Tholl, D., Bohlmann, J., Pichersky, E. (2011). The family of terpene synthases in plants: a mid-size family of genes for specialized metabolism that is highly diversified throughout the kingdom. Plant J. 66, 212–229. doi: 10.1111/j.1365-313X.2011.04520.x
Cortina, C., Culiáñez-Macià, F. A. (2005). Tomato abiotic stress enhanced tolerance by trehalose biosynthesis. Plant Sci. 169, 75–82. doi: 10.1016/j.plantsci.2005.02.026
Edgar, R. C. (2004). MUSCLE: multiple sequence alignment with high accuracy and high throughput. Nucleic Acid Res. 32, 1792–1797. doi: 10.1093/nar/gkh340
Freeling, M. (2009). Bias in plant gene content following different sorts of duplication: tandem, whole-genome, segmental, or by transposition. Annu. Rev. Plant Biol. 60, 433–453. doi: 10.1146/annurev.arplant.043008.092122
Ge, L. F., Chao, D. Y., Shi, M., Zhu, M. Z., Gao, J. P., Lin, H. X. (2008). Overexpression of the trehalose-6-phosphate phosphatase gene OsTPP1confers stress tolerance in rice and results in the activation of stress responsive genes. Planta 228, 191–201. doi: 10.1007/s00425-008-0729-x
Heitz, T., Widemann, E., Lugan, R., Miesch, L., Ullmann, P., Désaubry, L., et al. (2012). Cytochromes P450 CYP94C1 and CYP94B3 catalyze two successive oxidation steps of plant hormone jasmonoyl-isoleucine for catabolic turnover. J. Biol. Chem. 287, 6296–6306. doi: 10.1074/jbc.M111.316364
Huang, X. Z., Xiao, Y. T., Köllner, T. G., Jing, W. H., Kou, J. F., Chen, J. W., et al. (2018). The terpene synthase gene family in Gossypium hirsutum harbors a linalool synthase GhTPS12 implicated in direct defence responses against herbivores. Plant Cell Environ. 41, 261–274. doi: 10.1111/pce.13088
Jia, Q., Chen, X., Kollner, T. G., Rinkel, J., Fu, J., Labbe, J., et al. (2019). Terpene synthase genes originated from bacteria through horizontal gene transfer contribute to terpenoid diversity in Fungi. Sci. Rep. 9, 9223. doi: 10.1038/s41598-019-45532-1
Kaul, S., Koo, H. L., Jenkins, J., Rizzo, M., Rooney, T. (2000). Analysis of the genome sequence of the flowering plant Arabidopsis thaliana. Nature 408, 796–815. doi: 10.1038/35048692
Kolde, R., Kolde, M. R. (2015). PHeatmap: Pretty Heatmaps. R Package. 1, 1. Available online at: https://cran.r-project.org/web/packages/pheatmap/pheatmap.pdf.
Koo, A. J. K., Cooke, T. F., Howe, G. A. (2011). Cytochrome P450 CYP94B3 mediates catabolism and inactivation of the plant hormone jasmonoyl-L-isoleucine. Proc. Natl. Acad. Sci. 108, 9298–9303. doi: 10.1073/pnas.1103542108
Lee, T., Yang, S., Kim, E., Ko, Y., Hwang, S., Shin, J., et al. (2015). AraNet v2: an improved database of co-functional gene networks for the study of Arabidopsis thaliana and 27 other nonmodel plant species. Nucleic Acid Res. 43, D996–D1002. doi: 10.1093/nar/gku1053
Lescot, M., Déhais, P., Thijs, G., Marchal, K., Moreau, Y., Van, de Peer, Y. (2002). PlantCARE, a database of plant cis-acting regulatory elements and a portal to tools for in silico analysis of promoter sequences. Nucleic Acid Res. 30, 325–327. doi: 10.1093/nar/30.1.325
Li, L., Chang, Z., Pan, Z., Fu, Z.-Q., Wang, X. (2008). Modes of heme binding and substrate access for cytochrome P450 CYP74A revealed by crystal structures of allene oxide synthase. Proc. Natl. Acad. Sci. 105, 13883–13888. doi: 10.1073/pnas.0804099105
Li, H. W., Zang, B. S., Deng, X. W., Wang, X. P. (2011). Overexpression of the trehalose-6-phosphate synthase gene OsTPS1 enhances abiotic stress tolerance in rice. Planta 234, 1007–1018. doi: 10.1007/s00425-011-1458-0
Li, R. S., Zhu, J. H., Guo, D., Li, H. L., Wang, Y., Ding, X. P., et al. (2021). Genome-wide identification and expression analysis of terpene synthase gene family in Aquilaria sinensis. Plant Physiol. Biochem. 164, 185–194. doi: 10.1016/j.plaphy.2021.04.028
Lin, J. Y., Wang, D., Chen, X. L., Kollner, T. G., Mazarei, M., Guo, H., et al. (2017). An (E,E)-alpha-farnesene synthase gene of soybean has a role in defence against nematodes and is involved in synthesizing insect-induced volatiles. Plant Biotechnol. J. 15, 510–519. doi: 10.1111/pbi.12649
Liu, X., Fu, L., Qin, P., Sun, Y., Liu, J., Wang, X. (2019). Overexpression of the wheat trehalose 6-phosphate synthase 11 gene enhances cold tolerance in Arabidopsis thaliana. Gene 710, 210–217. doi: 10.1016/j.gene.2019.06.006
Mistry, J., Finn, R. D., Eddy, S. R., Bateman, A., Punta, M. (2013). Challenges in homology search: HMMER3 and convergent evolution of coiled-coil regions. Nucleic Acid Res. 41, e121–e121. doi: 10.1093/nar/gkt263
Mizutani, M. (2012). Impacts of diversification of cytochrome P450 on plant metabolism. Biol. Pharm. Bull. 35, 824–832. doi: 10.1248/bpb.35.824
Mizutani, M., Ohta, D. (2010). Diversification of P450 genes during land plant evolution. Annu. Rev. Plant Biol. 61, 291–315. doi: 10.1146/annurev-arplant-042809-112305
Newman, J. D., Chappell, J. (1999). Isoprenoid biosynthesis in plants: carbon partitioning within the cytoplasmic pathway. Crit. Rev. Biochem. Mol. Biol. 34, 95–106. doi: 10.1080/10409239991209228
Nguyen, L.-T., Schmidt, H. A., Von, Haeseler, A., Minh, B. Q. (2015). IQ-TREE: a fast and effective stochastic algorithm for estimating maximum-likelihood phylogenies. Mol. Biol. Evol. 32, 268–274. doi: 10.1093/molbev/msu300
Panchy, N., Lehti,-Shiu, M., Shiu, S. H. (2016). Evolution of gene duplication in plants. Plant Physiol. 171, 2294–2316. doi: 10.1104/pp.16.00523
Paysan, L. T., Blum, M., Chuguransky, S., Grego, T., Pinto, B. L., Salazar, G. A., et al. (2023). InterPro in 2022. Nucleic Acids Res. 51, D418–D427. doi: 10.1093/nar/gkac993
Saito, S., Hirai, N., Matsumoto, C., Ohigashi, H., Ohta, D., Sakata, K., et al. (2004). Arabidopsis CYP707As encode (+)-abscisic acid 8′-hydroxylase, a key enzyme in the oxidative catabolism of abscisic Acid. Plant Physiol. 134, 1439–1449. doi: 10.1104/pp.103.037614
Schuler, M. A. (1996). Plant cytochrome P450 monooxygenases. Crit. Rev. Plant Sci. 15, 235–284. doi: 10.1080/07352689609701942
Sun, Y., Huang, X., Ning, Y., Jing, W., Bruce, T. J., Qi, F., et al. (2017). TPS46, a rice terpene synthase conferring natural resistance to bird cherry-Oat aphid, rhopalosiphum padi (Linnaeus). Front. Plant Sci. 8. doi: 10.3389/fpls.2017.00110
Tang, H., Bowers, J. E., Wang, X., Ming, R., Alam, M., Paterson, A. H. (2008). Synteny and collinearity in plant genomes. Science 320, 486–488. doi: 10.1126/science.1153917
Thompson, J. D., Gibson, T. J., Higgins, D. G. (2003). Multiple sequence alignment using ClustalW and ClustalX. Curr. Protoc. Bioinf. 2, 312–322. doi: 10.1002/0471250953.bi0203s00
Wang, S., Ouyang, K., Wang, K. (2019). Genome-wide identification, evolution, and expression analysis of TPS and TPP gene families in Brachypodium distachyon. Plants 8, 362. doi: 10.3390/plants8100362
Wang, Y., Tang, H., DeBarry, J. D., Tan, X., Li, J., Wang, X., et al. (2012). MCScanX: a toolkit for detection and evolutionary analysis of gene synteny and collinearity. Nucleic Acids Res. 40, e49–e49. doi: 10.1093/nar/gkr1293
Xu, Y., Wang, Y., Mattson, N., Yang, L., Jin, Q. (2017). Genome-wide analysis of the Solanum tuberosum (potato) trehalose-6-phosphate synthase (TPS) gene family: evolution and differential expression during development and stress. BMC Genomics 18, 1–15. doi: 10.1186/s12864-017-4298-x
Yan, Y., Li, M., Zhang, X., Kong, W., Bendahmane, M., Bao, M., et al. (2022). Tissue-specific expression of the terpene synthase family genes in Rosa chinensis and effect of abiotic stress conditions. Genes 13, 547. doi: 10.3390/genes13030547
Yang, H. L., Liu, Y. J., Wang, C. L., Zeng, Q. Y. (2012). Molecular evolution of trehalose-6-phosphate synthase (TPS) gene family in Populus, Arabidopsis and rice. PloS One 7, e42438. doi: 10.1371/journal.pone.0042438
Yeo, E. T., Kwon, H. B., Han, S. E., Lee, J. T., Ryu, J. C., Byu, M. (2000). Genetic engineering of drought resistant potato plants by introduction of the trehalose-6-phosphate synthase (TPS1) gene from Saccharomyces cerevisiae. Molecules Cells 10, 263–268. doi: 10.1016/S1016-8478(23)17473-5
Yoshitomi, K., Taniguchi, S., Tanaka, K., Uji, Y., Akimitsu, K., Gomi, K. (2016). Rice terpene synthase 24 (OsTPS24) encodes a jasmonate-responsive monoterpene synthase that produces an antibacterial gamma-terpinene against rice pathogen. J. Plant Physiol. 191, 120–126. doi: 10.1016/j.jplph.2015.12.008
Yu, G., Smith, D. K., Zhu, H., Guan, Y., Lam, T. T. Y. (2017). Ggtree: an R package for visualization and annotation of phylogenetic trees with their covariates and other associated data. Methods Ecol. Evol. 8, 28–36. doi: 10.1111/mee3.2017.8.issue-1
Yu, Z., Zhao, C., Zhang, G., Teixeira, da Silva, J. A., Duan, J. (2020). Genome-wide identification and expression profile of TPS gene family in Dendrobium officinale and the role of DoTPS10 in linalool biosynthesis. Int. J. Mol. Sci. 21, 5419. doi: 10.3390/ijms21155419
Zhang, Z. (2022). KaKs_Calculator 3.0: calculating selective pressure on coding and non-coding sequences. Genomics Proteomics Bioinf. 20, 536–540. doi: 10.1016/j.gpb.2021.12.002
Zhong, C., He, Z., Liu, Y., Li, Z., Wang, X., Jiang, C., et al. (2024). ). Genome-wide identification of TPS and TPP genes in cultivated peanut (Arachis hypogaea) and functional characterization of AhTPS9 in response to cold stress. Front. Plant Sci. 14. doi: 10.3389/fpls.2023.1343402
Keywords: Glycine max, TPS gene family, phylogenetic analysis, duplicated events, RNA-seq
Citation: Li H, Zhang X, Yang Q, Shangguan X and Ma Y (2024) Genome-wide identification and tissue expression pattern analysis of TPS gene family in soybean (Glycine max). Front. Plant Sci. 15:1487092. doi: 10.3389/fpls.2024.1487092
Received: 27 August 2024; Accepted: 09 September 2024;
Published: 26 September 2024.
Edited by:
Huatao Chen, Jiangsu Academy of Agricultural Sciences (JAAS), ChinaCopyright © 2024 Li, Zhang, Yang, Shangguan and Ma. This is an open-access article distributed under the terms of the Creative Commons Attribution License (CC BY). The use, distribution or reproduction in other forums is permitted, provided the original author(s) and the copyright owner(s) are credited and that the original publication in this journal is cited, in accordance with accepted academic practice. No use, distribution or reproduction is permitted which does not comply with these terms.
*Correspondence: Huanli Li, bGlodWFubGkxOTg5MDZAMTYzLmNvbQ==
 Huanli Li
 Xiaoling Zhang
 Xiaoxia Shangguan