 Yingxia Liu
 Wencheng Ding
 Ping He
 Xinpeng Xu
 Wei Zhou
- 1Ministry of Agriculture and Rural Affairs Key Laboratory of Plant Nutrition and Fertilizer, State Key Laboratory of Efficient Utilization of Arid and Semi-arid Arable Land in Northern China, Institute of Agricultural Resources and Regional Planning, Chinese Academy of Agricultural Sciences, Beijing, China
- 2State Key Laboratory for Managing Biotic and Chemical Threats to the Quality and Safety of Agro-products/Institute of Environment, Resource, Soil and Fertilizers, Zhejiang Academy of Agricultural Sciences, Hangzhou, China
Determining the fertilization rate plays a pivotal role in agronomic practices as they directly impact yield targets, soil fertility, and environmental risks. In this study, we proposed a method that utilizes allowed ranges of partial nutrient balance and yield to estimate the threshold of nitrogen (N), phosphorus (P), and potassium (K) fertilizer applied to rice (Oryza sativa L.) fields in China. Based on a dataset of 6792 observations from rice fields, we determined the minimum and maximum rates of N, P and K suggested for single (mono-season rice), middle (summer-season rice rotated with winter-season upland crop), early and late (double-season rice cropping system) rice, ranging between 114−146 and 220−292 kg N ha−1 per season, 56−74 and 112−149 kg P2O5 ha−1 per season, and 170−230 and 329−347 kg K2O ha−1 per season, respectively. These values serve as the lower and upper fertilization thresholds, guiding yield goals and environmental protection. Furthermore, if rice straw is returned to fields, the demand for K fertilizer can theoretically decrease by 183 kg K2O ha−1, with corresponding decreases of 50 kg N ha−1 and 26 kg P2O5 ha−1, respectively. A recommended fertilization approach, excluding returned straw nutrients from the upper fertilization thresholds, suggested average application rates of 194 kg N ha−1, 105 kg P2O5 ha−1, and 157 kg K2O ha−1, which align well with the nutrient requirements of rice. Additionally, substituting organic N for chemical N is an effective approach to conserve chemical fertilizer N, potentially reducing chemical N usage by 20%−40%. Utilizing slow-release N is also a favorable option to enhance N use efficiency and optimize N balance. This study offers valuable insights into the development of fertilization restriction indicators, aiming to achieve a delicate balance between environmental impact and agricultural productivity through the adoption of balanced fertilization rates and utilization of organic residues.
1 Introduction
Effective nutrient management is pivotal for achieving high crop yields while minimizing environmental impacts. The precise alignment of nutrient supply with crop requirements is essential to prevent nutrient losses and avoid yield penalties due to the under-application of fertilizer. Conversely, excessive fertilizer use can lead to yield stagnation, nutrient leaching, and environmental degradation (Penuelas et al., 2023). Accurately predicting fertilizer requirements is challenging, often leading to fertilizer misuse where applications exceed plant needs to ensure high yields (Ge et al., 2024). The overuse of chemical fertilizers in China has been a persistent issue, with usage rising from 12.7 million tons in 1980 to 50.2 million tons in 2023 (National Bureau of Statistics of China, 2024). Farmers’ reliance on historical experience for determining fertilizer rates contributes to unbalanced fertilizer applications, particularly the excessive use of nitrogen (N) and phosphorus (P) fertilizers (Cui et al., 2018). In China, the average N application rate is 305 kg N ha–1 yr–1, significantly higher than the global average of 74 kg N ha–1 yr–1 (Cui et al., 2018). Specifically, in rice production, the N fertilizer use of 209 kg ha–1 exceeds the global average by 90% (Chen et al., 2014). This surplus of N has led to various environmental issues, including soil degradation (Guo et al., 2010), nitrate leaching (Diaz and Rosenberg, 2008), and nitrous oxide emission (Zhang et al., 2016). Similarly, the overuse of P fertilizer poses a threat through eutrophication with 69% of P entering watercourses from agricultural sources (MEP, 2010). Given the escalating cost of fertilizers, quantifying incentives to reduce input usage becomes increasingly valuable for addressing potential imbalances faced by farmers. Developing an effective fertilization strategy is among the most critical decisions in agronomy, impacting not only on-farm expenses but also environmental outcomes that may not have been intended.
The trade-off between enhancing crop yield and mitigating environmental risk is a critical concern for researchers and policymakers alike, particularly regarding the optimal fertilization rate. Various methods based on plant or soil tests have been developed and implemented globally to recommend suitable fertilizer application rates (Dermawan et al., 2024; van Doorn et al., 2024; Colaço et al., 2024). However, plant tests, such as those using leaf color charts and chlorophyll meters, are inadequate for making decisions regarding starter fertilizer. Soil sampling to ascertain the amount of mineral N is a widespread approach in Europe and North America for adjusting N fertilization (Valkama et al., 2013). Nevertheless, this method is unreliable for determining the readily available N amount for rice crops due to the dynamic nature of N transformations in submerged soil, complicating sampling and analysis (Xu et al., 2019). Nutrient budgets and balances, principal agro-environmental indicators, provide abundant information on nutrient use efficiency, soil fertility, and the potential environmental impacts (Organization for Economic Co-operation and Development, OECD, 2001; Ju and Zhang, 2017). These tools have been used extensively for optimizing fertilizer recommendations and improving policymaking over the past decades (Buresh et al., 2010). Nutrient balance, the difference between the sum of inputs and outputs within an agricultural system, helps identify whether a soil nutrient is present in surplus or deficit. Compared to a full nutrient balance that considers many additional factors, a partial nutrient balance, determined by the difference between fertilizer input and crop removal, is simpler to implement and more cost-effective. Furthermore, calculating a partial nutrient balance is more precise than a full nutrient balance, which typically involves considerable uncertainty, especially when parameters are used to estimate input and output pathways on a large scale (Eurostat, 2023; Karimi et al., 2020). The partial nutrient balance is also a reliable indicator of some critical components of sustainability and is important for decision support in terms of soil fertility management (Ludemann et al., 2024). Despite its frequent use as a sustainability indicator for agricultural systems, there is scarce reporting on estimating fertilization thresholds based on partial nutrient balance.
The integration of improved mineral fertilizer management and organic residue recycling is pivotal for achieving long-term nutrient balances in agricultural soil (Ingwersen et al., 2024). This approach not only optimizes mineral nutrient input but also enhances nutrient use efficiency, thereby contributing to sustainable agricultural practices. Recycling crop residues like crop straw and applying organic fertilizers to fields is increasingly becoming a common practice globally as an effective form of conservation agriculture (Tang et al., 2024). In China, crop residue management plays a crucial role in maintaining soil health and nutrient cycles. With an estimated production of crop residues is 925 million tons of crop residues annually (Li et al., 2016), the country holds substantial potential for nutrient recycling through straw return to fields. Rice straw constitutes a significant portion of the total nutrient resources, accounting for 33.1% (Song et al., 2018). The importance of potassium (K) in crop straw is noteworthy, as most of the K is sequestered in the straw rather than the grain (Shukla et al., 2024). A negative K balance of up to -362 kg K ha−1 was observed where straw was removed, whereas a surplus of 29 kg K ha−1 was found in treatments where straw was returned to the field (Whitbread et al., 2003). Meta-analyses by Huang et al. (2013) and Ding et al. (2018) indicated that crop residue retention significantly increased rice yield by approximately 5%. Additionally, the application of organic fertilizers, such as farmyard manure, composts, and commercial manure, can further enhance nutrient use efficiency and soil health. Reports indicated that reduced applications of P and K following manure application did not decrease rice yield, and treatments with added manure resulted in more positive nutrient balances (Saha, 2007). Maintaining soil organic matter levels is crucial for sustainability, and organic fertilizers play a significant role in this process. However, the current rates of crop residue and manure return to fields in China are relatively low, with only 15-60% of crop residue (Li and Jin, 2011) and 30–65% of manure recycled (Zhang et al., 2010). Therefore, emphasizing the importance of these practices in sustainable agriculture is necessary to optimize nutrient management and promote environmental stewardship.
Advancing sustainable agricultural production necessitates improved management practices at the field scale and the implementation of effective policies at the regional scale. The announcement of the Chinese government’s policy of “Zero Growth of Chemical Fertilizer Use by 2020” has increased the demand for political decisions that balance agronomic-economic benefits with environmental consequences. Nutrient balance has been employed by policymakers as an agro-environmental indicator to raise awareness about nutrient use efficiency. However, there is a scarcity of studies providing explicit fertilizer recommendation thresholds at the national scale. To bridge this knowledge gap, a comprehensive synthesis of research was performed using existing data from multi-year and multi-site studies. The objectives were to: (1) propose a method for estimating the agro-environmentally allowed ranges of N, P, and K fertilization based on nutrient balance and rice yield results; (2) quantify the potential of straw return to reduce chemical fertilizer input; and (3) investigate the response of N balance to the substitution of conventional N with organic fertilizer and slow-release N fertilizer.
2 Materials and methods
2.1 Database
The database was created using both published and unpublished data from major rice-growing regions in China. The published data were sourced from a comprehensive review of peer-reviewed papers from 2000 to 2018, utilizing the China Knowledge Resource Integrated Database and Web of Science. The unpublished data came from on-farm experiments conducted by the International Plant Nutrient Institute (IPNI) China Program and our research team. The search included terms like rice yield, nutrient uptake, controlled or slow-release fertilizer, organic substitution, and straw return. Papers meeting the following criteria were selected: (1) conducted under field conditions in China; (2) availability of data on fertilizer rate, rice yield, and nutrient uptake data; and (3) estimation of fertilization thresholds using common chemical fertilizers, excluding high-efficiency fertilizers, organic fertilizers, and straw return techniques.
The final database included 580 studies, with 422 from published papers. These studies were categorized into four datasets based on the rice planting season: (i) 99 studies in the single rice dataset (mono-season rice), primarily distributed in Northeast and Northwest China; (ii) 321 studies in the middle rice dataset (summer-season rice rotated with winter-season upland crops, such as winter-wheat or oil rape), primarily distributed in the middle and lower reaches of the Yangtze River and Southwest China; (iii) 123 studies in the early rice dataset (double-season rice cropping systems with early rice rotated with late rice), primarily distributed in the middle and lower reaches of the Yangtze River and South China; and (iv) 137 studies in the late rice dataset (double-season rice cropping systems with early rice rotated with late rice), shares the same distribution area as the early rice. The distribution of the four rice types and experimental sites is depicted in Figure 1.
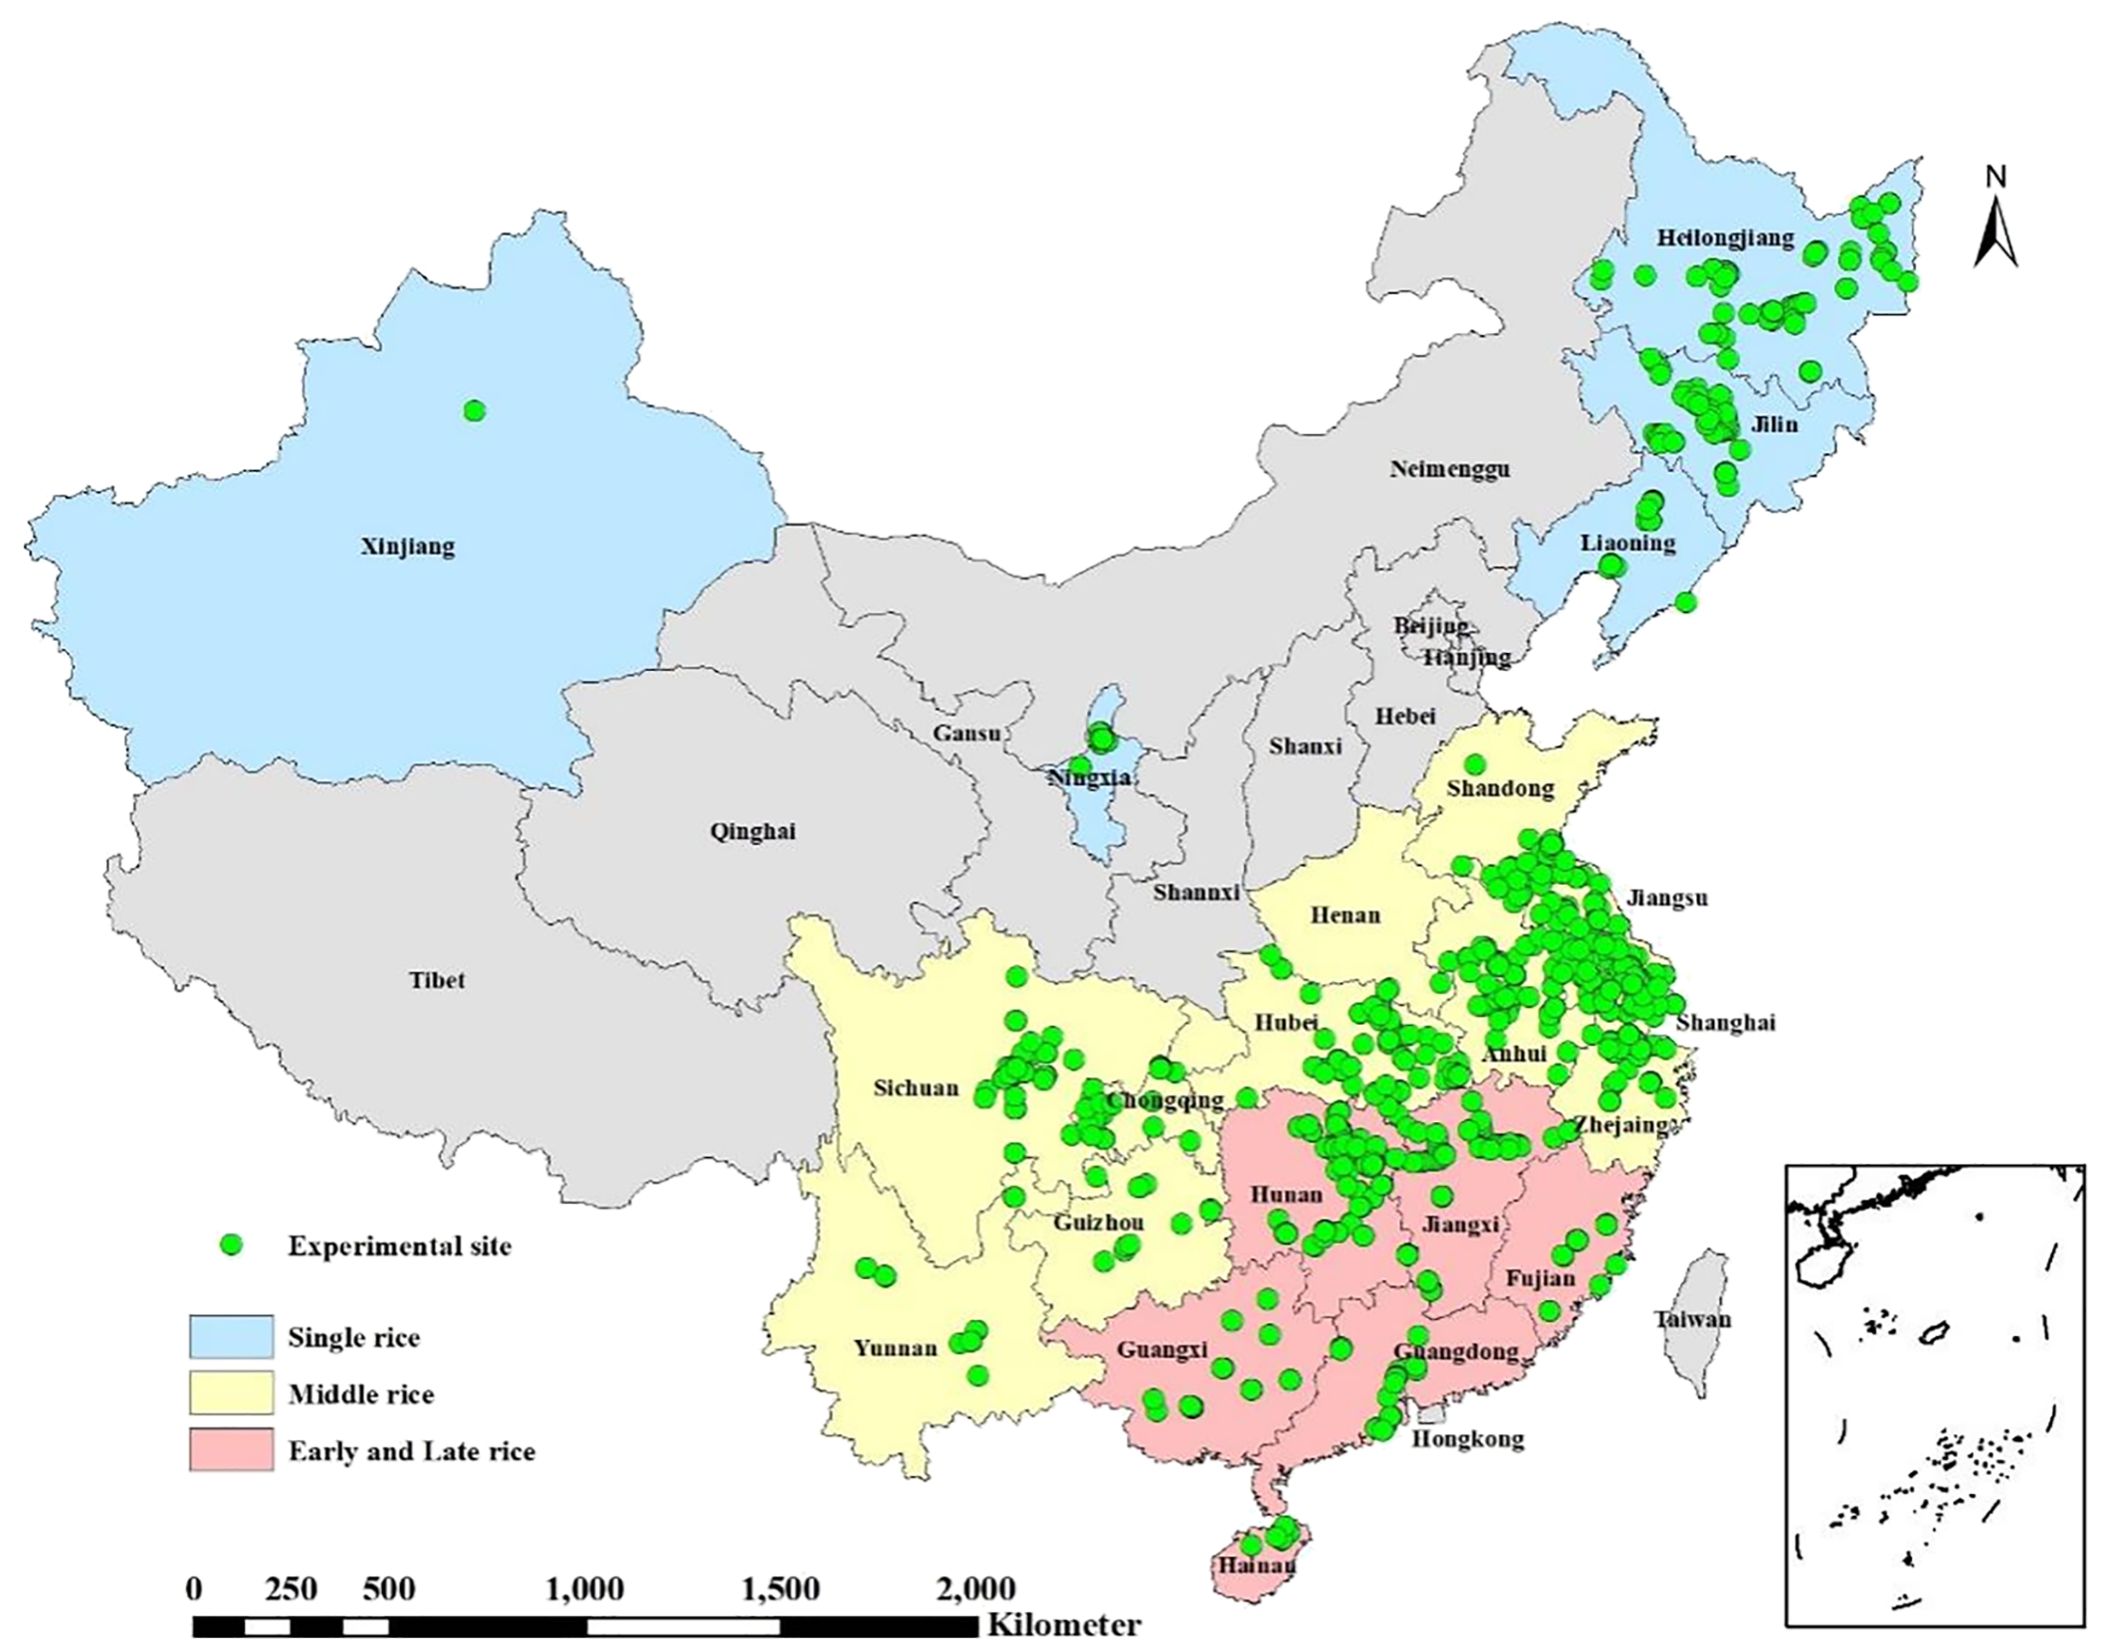
Figure 1. Geographic locations of experiments for four rice types in China.
2.2 Partial nutrient balance
The soil partial N, P and K balance (Nbalance, Pbalance and Kbalance, respectively) was calculated as described by OECD (2001):
where Nurientinput is the nutrients of N/P2O5/K2O applied as fertilizers and manure (kg ha−1), and Nurientoutput is the nutrients of N/P2O5/K2O accumulated in the grain and/or straw (kg ha−1) and removed from fields.
The exclusion of certain nutrient inputs and losses in calculating nutrient balance is crucial for assessing soil health and agricultural sustainability. In our calculation, we deliberately omitted the consideration of nutrients gained through biological N fixation, atmospheric deposition, and irrigation, as well as losses due to ammonia volatilization, denitrification, runoff, and leaching. A negative nutrient balance indicates that the removal of nutrients from the soil exceeds its replenishment, leading to soil nutrient depletion and a subsequent decline in crop productivity. Conversely, a positive balance with low nutrient use efficiency indicates that nutrients are partially accumulating in the soil, potentially posing risks of nutrient loss to the broader environment due to excessive application.
2.3 Statistical analysis
Following the data tests for normal distribution and equal variance, relationships between Nbalance, Pbalance or Kbalance and N, P or K rates were fitted using a least-squares linear regression:
where Y is the soil partial nutrient balance for N, P or K; x is the N, P or K fertilizer rate; a is the fitted constants and b is the corresponding balance value without N, P or K fertilizer application.
The statistical model used to describe relationships between the yield and the N rate was a unitary quadratic model:
where Y is the rice yield; Y0 is the yield at N = 0; a and b are fitted constants; and x is the N rate.
A paired t-test was conducted to compare the Nbalance between the organic substitution group and the conventional fertilization group using SPSS version 21 software. Means of different levels of some explanatory variables within the organic fertilizer groups were compared using the least significant difference test (LSD at 0.05 level of probability) by a one-way ANOVA analysis.
2.4 Principles for the thresholds of fertilization rates
The benchmarks for assessing nutrient balance are indeed intricate and subject to fluctuation, owing to the complex interplay of factors such as agroecosystem type, climate, soil type, and environmental conditions. The overarching goal of fertilization should encompass both the total nutrient demand for food security and the minimization of environmental impacts. To address these challenges, principles based on partial nutrient balance have been proposed to determine the lower and upper threshold of N, P, and K fertilizer application rates. The low limit of threshold, i.e., the minimum rate, is predicated on the principle that fertilizer inputs should at least match the nutrients removed by the crop. This threshold corresponds to the nutrient rate at which the partial nutrient balance is zero (i.e., x value at Y=0 simulated based on Equation 2), meaning that nutrient input is precisely balanced with output (crop uptake). In this case, the least nutrients are possibly lost to the environment according to the positive relationships between partial nutrient balance and nutrient losses (Mclellan et al., 2018). However, the minimum fertilization strategy heavily depends on the indigenous soil stocks, as a significant portion of fertilizer nutrients can be lost from soil-plant systems through mechanisms such as ammonia volatilization and nitrification-denitrification processes. Strategies that solely focus on crop removal without accounting for indigenous soil nutrient supply are inefficient for sustainable high-yield production systems. Though a nutrient surplus is generally discouraged due to the heightened risk of nutrient loss, a certain surplus based on partial nutrient balance is permissible to offset fertilizer losses and the depletion of indigenous soil nutrients. This allowance acknowledges the reality that not all fertilizer nutrients are utilized by the crop and are not accounted for in the partial nutrient balance calculation. The upper limit of the threshold, i.e., the maximum fertilization rate, takes into consideration the issues of nutrient losses, nutrient availability, and the maintenance of soil fertility. It is defined as the fertilizer rate when a partial nutrient balance is equal to nutrient supply from the soil (i.e., the absolute value of the Y-intercept based on Equation 2), as determined from plots without N, P, or K fertilization. The partial nutrient balance principle ensures that fertilizers are applied efficiently, minimizing environmental impacts while maximizing crop productivity.
The N nutrient is pivotal in influencing crop yield. Therefore, the grain yield level serves as another key indicator for determining N fertilizer application rates. The concept of ‘attainable yield’ is central to this approach, representing the highest yield achievable under current farming conditions, modeled through quadratic equations (Equation 3). van Wart et al. (2013) observed that in China, the 5-year average yields of rice tend to stabilize once the average farm yields reach 82% of the attainable yield. Similarly, Laborte et al. (2012) noted that the average rice yields in Southeast Asia can approach 83% of the attainable yield. In this context, our study adopts a practical yield goal range of 85% to 100% of the attainable yield. To operationalize this, the minimum and maximum fertilizer rates are determined by identifying the N rates at which the yield equals 85% and 100% of the attainable yield, respectively, based on Equation 3. When the N rate corresponding to a zero Nbalance is even lower than the N rate under 85% attainable yield, the lower threshold of N rate is adjusted to match the latter; and the N rate under 100% attainable yield becomes the upper threshold if it is less than that the rate calculated with Nbalance at N supply from the soil.
The relationship between rice yield and P or K rate is relatively weak, making it crucial to fine-tune fertilization based on soil nutrient status and crop demand. Therefore, the determination of P and K thresholds in fertilization strategies is grounded in the principle of partial nutrient balance. This principle aims to optimize the use of P and K fertilizers by considering the existing soil nutrient status and the crop’s requirements. The principle of partial P or K balance, akin to that of, determines the lower threshold of P and K rate as the point where the partial nutrient balance is zero, and determines the upper threshold when the partial nutrient balance equals P or K supply from the soil without P or K fertilization. In fertilization practice, the reference level for P and K balance could be adjusted according to the soil P and K status, being larger when soil P and K are low and smaller when they are high (Oenema et al., 2003). By balancing nutrient inputs with outputs and considering soil nutrient status, this method enhances agricultural sustainability, crop yields, and environmental stewardship.
3 Results
3.1 The limited rate of N, P and K fertilizer in rice
Rice yield and Nbalance were individually regressed against the N rate (as depicted in Figure 2), with the associated parameters delineated in Table 1. The results showed a significant positive linear relationship between the N rate and Nbalance, alongside a quadratic relationship linking the N rate and rice yield. Soil inherently supplied 76.4−99.4 kg N ha−1 while the peak attainable yield spanned from 7156 to 9297 kg ha−1 across four rice types. As illustrated in Figure 2, adhering solely to the dual principles of N balance (i.e., Nbalance value is zero, and the N surplus equals the N uptake contributed by the soil) cannot meet the demand of acceptable grain yield (85% of the highest yield to the highest yield) in some cases. Consequently, integrating considerations of N balance and rice yield, the optimal N rate spectrum ranged from 119 to 220, 146 to 292, 114 to 223, and 124 to 242 kg N ha−1 for single, middle, early, and late rice, respectively, corresponding to 85−97%, 88−99%, 92−100%, and 85−96% of the respective highest yields.
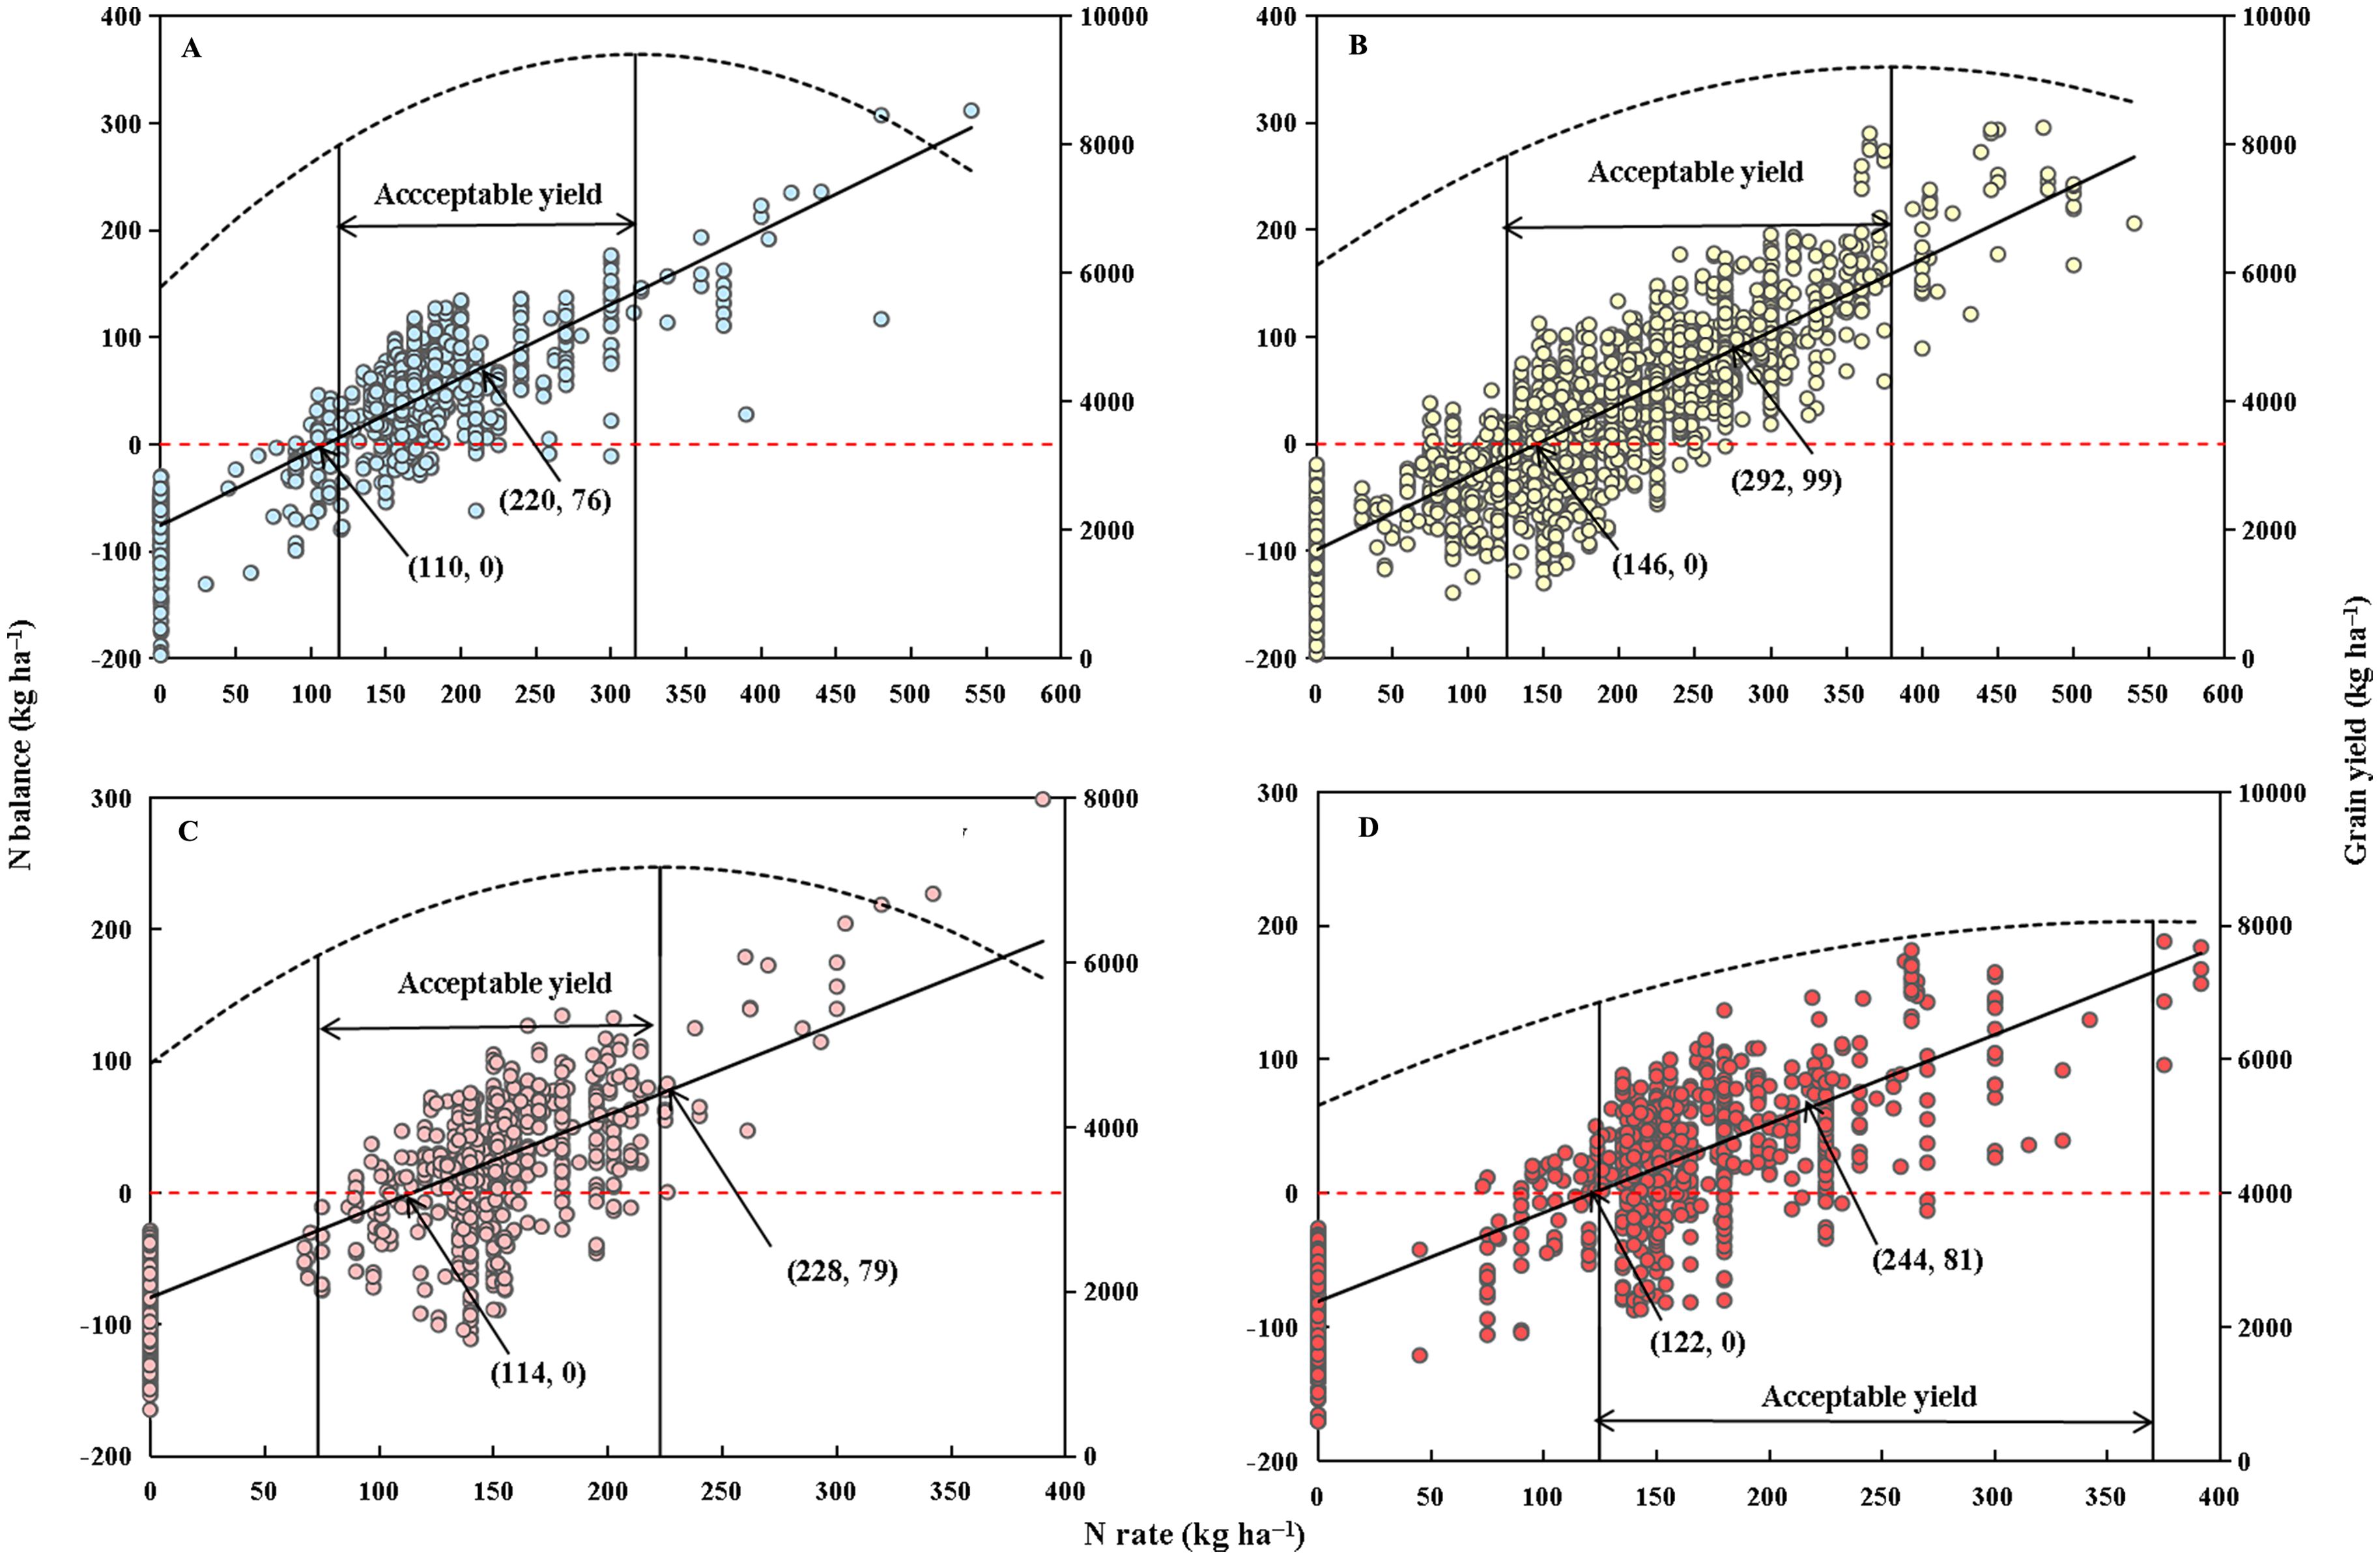
Figure 2. Relationships between N rate and Nbalance and between N rate and grain yield for single- (A), middle- (B), early- (C), and late-season rice (D), respectively. The curve is the yield (data points not shown), and the straight line and data points are the Nbalance. The values in parentheses are the N rates and their corresponding N balance values. The acceptable yield ranges from 85% to the highest yield.
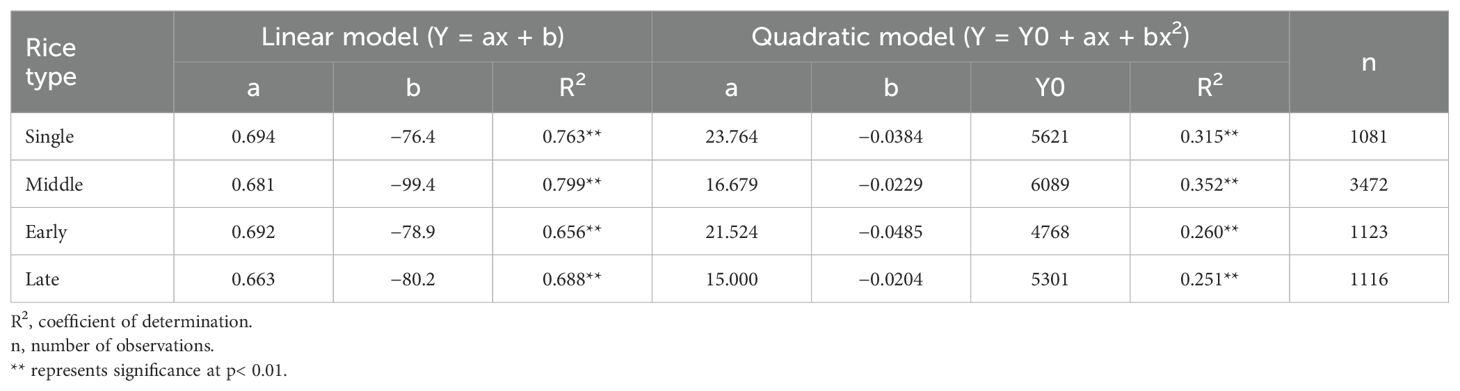
Table 1. Parameters and fittings of the linear and quadratic models that describe the relationship between Nbalance and N rate, and the relationship between rice yield and N rate.
The relationship between P application and Pbalance was fitted using a linear model for each of the four rice types (as depicted in Figure 3). A significant positive correlation was observed, with P application accounting for 66% to 80% of the variability in Pbalance. To minimize Pbalance in the soil while ensuring crop requirements are met, the minimum P input should be in the range of 56−74 kg P2O5 ha−1 across the four rice types, considering crop removal. Given that P losses due to leaching and runoff constitute a relatively small percentage of total P fertilizer, the minimum P input appears sufficient for crop demands. However, the bioavailability of both fertilizer and soil P in the current season remains a concern. According to the linear model, the soil contributes approximately 50−70 kg P2O5 ha−1 P uptake. Consequently, to restore soil P depletion and maintain soil available P at an optimal level, the maximum P input can extend to 112−149 kg P2O5 ha−1, serving as the upper limit for P thresholds.
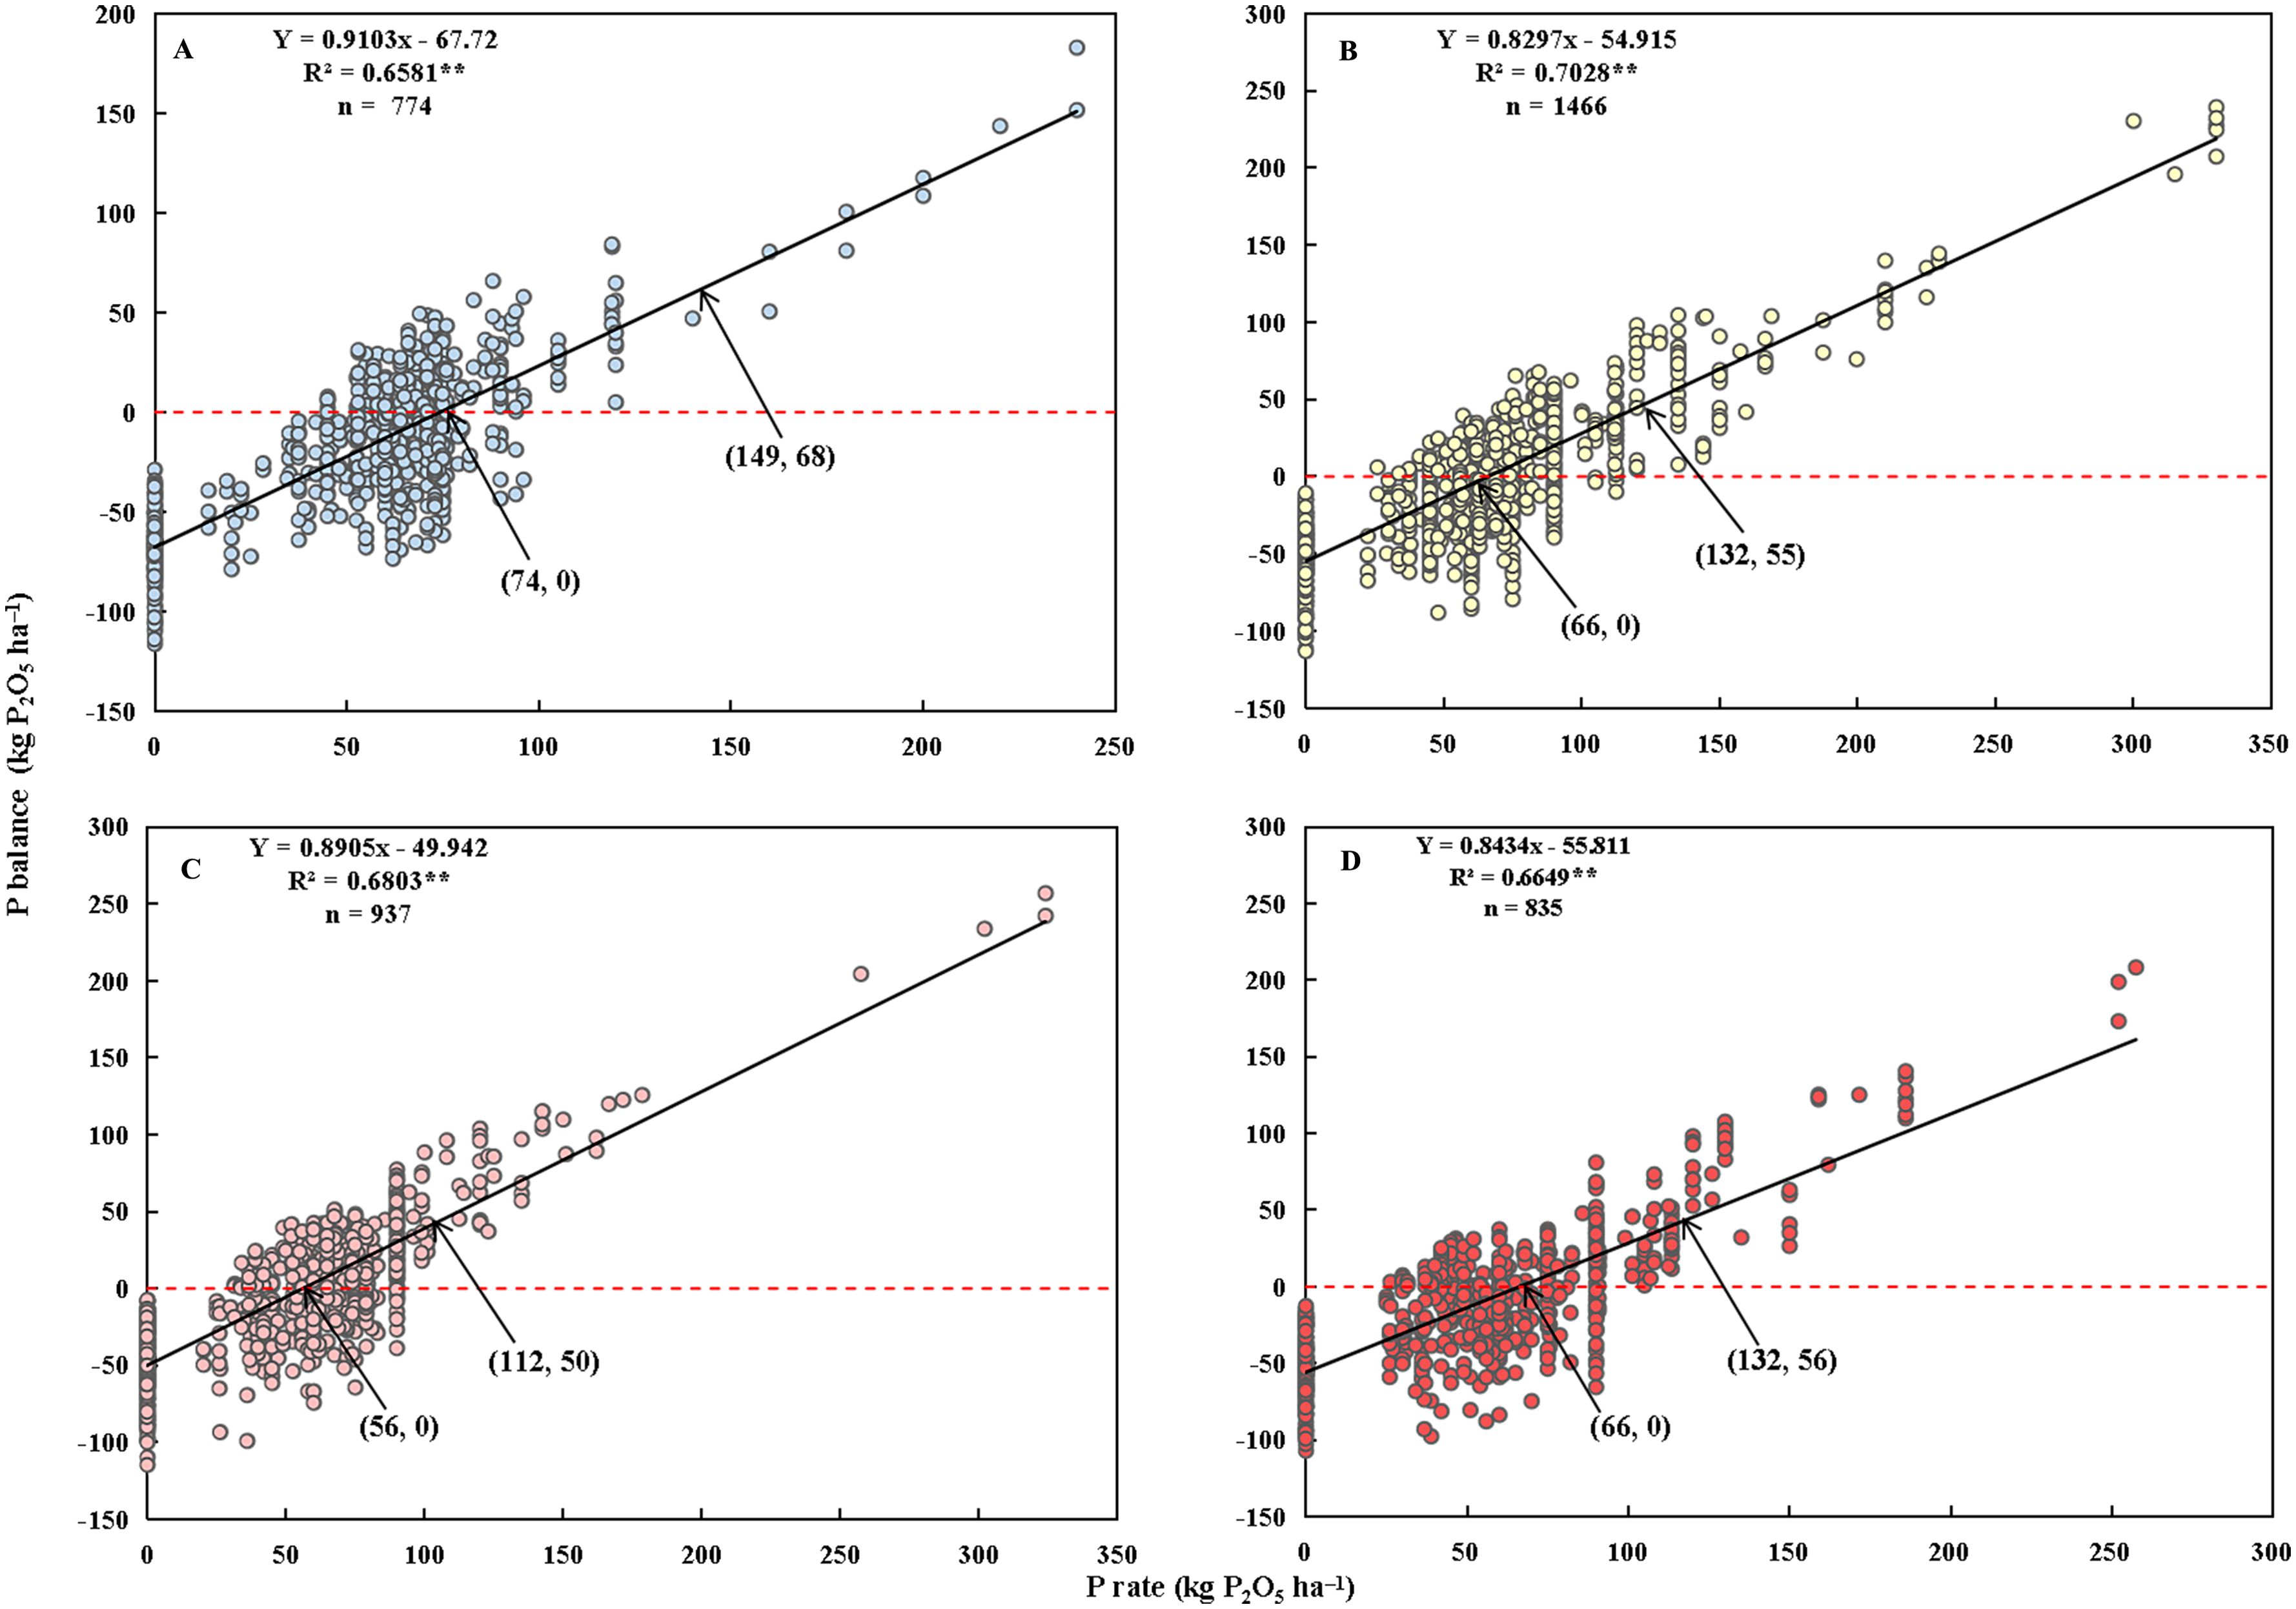
Figure 3. Relationships between P rate and Pbalance for single- (A), middle- (B), early- (C), and late-season rice (D), respectively. The values in parentheses are the P rates and their corresponding P2O5 balance values. R2 is the coefficient of determination. n is the number of observations. ** represents significance at p< 0.01.
Similarly, Kbalance was fitted to the K rate using a linear model for single rice, akin to the process employed for N and P. However, for middle, early, and late rice, the quadratic model provided better fits than the linear model (as shown in Figure 4). Positive associations were identified between the K application and Kbalance, with the K application explaining 23% to 36% of the variation in Kbalance. To sustain an essential K balance, the recommended K fertilizer applications are 170, 230, 209, and 216 kg K2O ha−1 for early, middle, early, and late rice, respectively. Based on the models, the soil contributed roughly 120−180 kg K2O ha−1 towards K uptake. These contributions are utilized as benchmarks for maximum K surplus. Thus, the upper K thresholds were 339, 347, 329, and 344 kg K2O ha−1 for early, middle, early, and late rice, respectively.
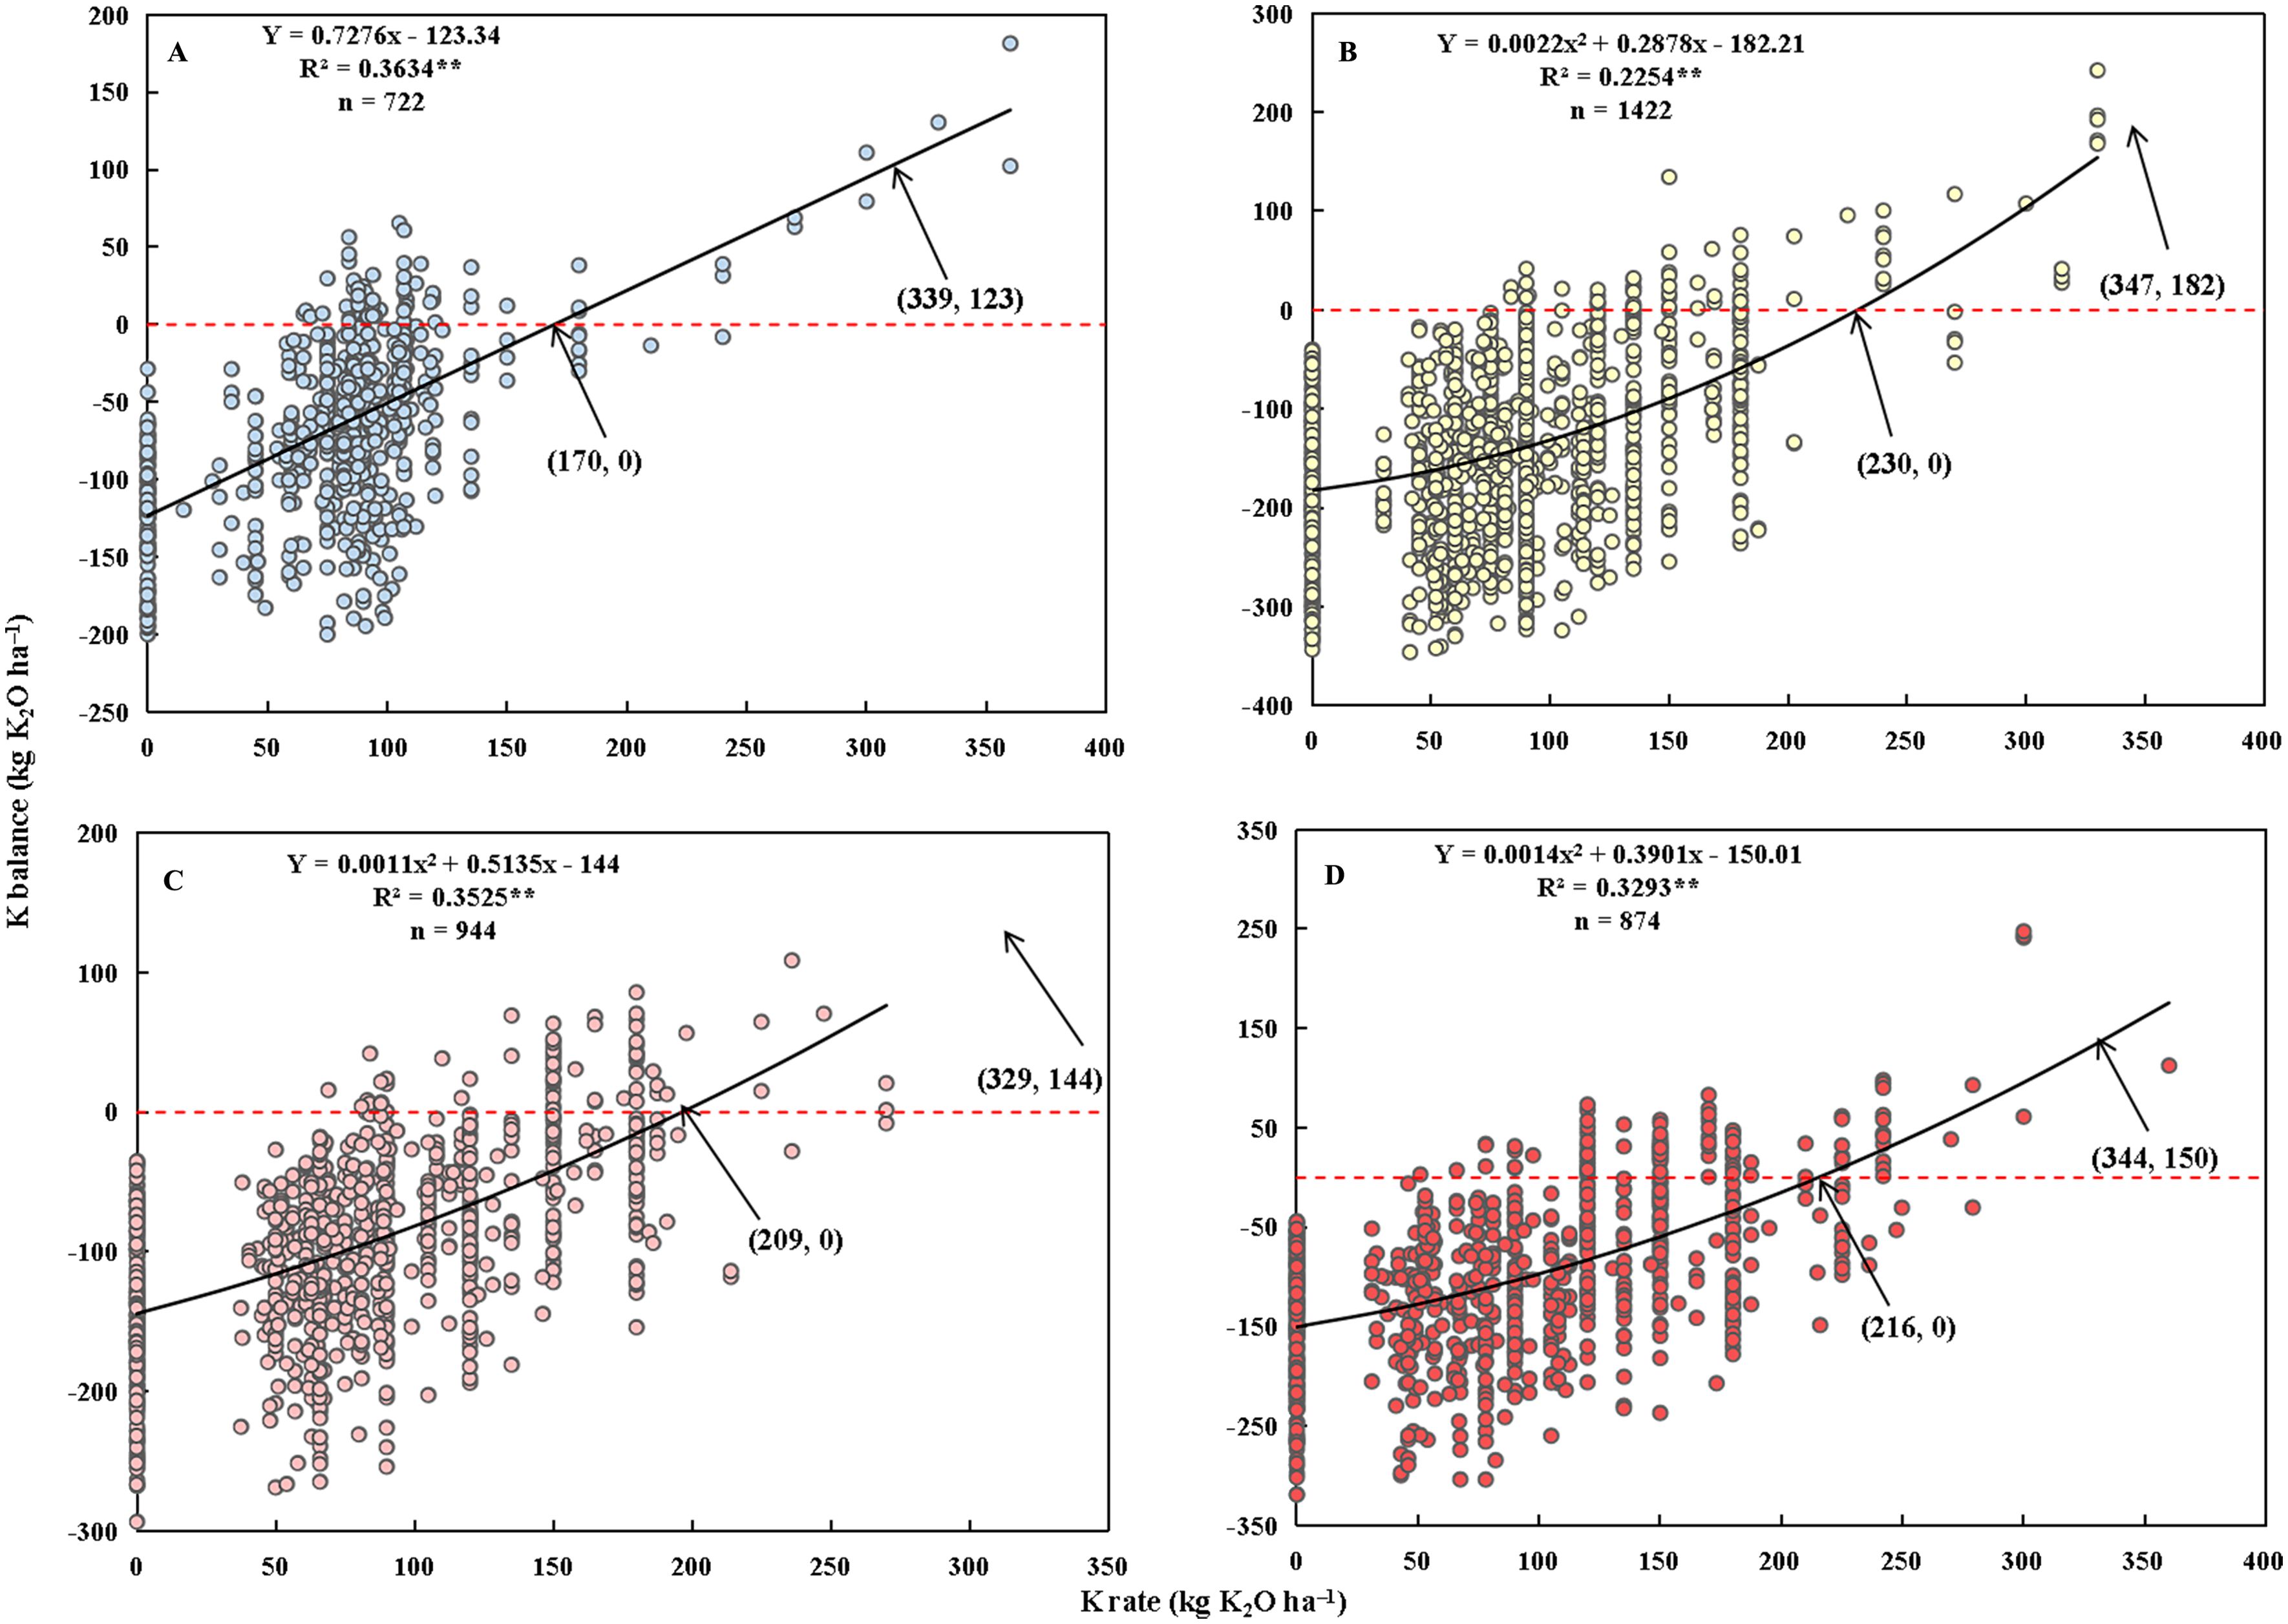
Figure 4. Relationships between K rate and Kbalance for single- (A), middle- (B), early- (C), and late-season rice (D), respectively. The values in parentheses are the K rates and their corresponding K2O balance values. R2 is the coefficient of determination. n is the number of observations. ** represents significance at p< 0.01.
3.2 Effect of straw return on nutrient balances
The analysis presented was indeed based on scenarios involving rice straw removal, leading to estimated ranges of fertilization requirements, particularly for K, that were somewhat elevated compared to expectations. However, under the hypothesis of returning rice straw to the fields, there would be notable enhancements in the soil’s N, P, and K balances. Given the scenario of acceptable grain yield targets ranging from 6082 to 9297 kg ha−1, nutrient balances under straw return were recalculated to gauge the adjustments in fertilization rates relative to straw removal scenarios. Results showed that on average, returning straw to fields can increase N, P, and K balances by 52.0 kg ha−1, 25.8 kg P2O5 ha−1, and 182.6 kg K2O ha−1, respectively. This suggests that fertilizer nutrients can be partially offset by the practice of straw return (Table 2). Specifically, for single, middle, early, and late rice under straw return, Nbalance can be increased by 46.3, 57.0, 42.6, and 53.9 kg ha−1, respectively; Pbalance can be increased by 32.9, 21.8, 20.7, and 27.9 kg P2O5 ha−1, respectively; and Kbalance can be increased by 136.3, 233.3, 172.4, and 188.4 kg K2O ha−1, respectively. This shows that straw return has a considerably more significant impact on K fertilization management than on N and P management.
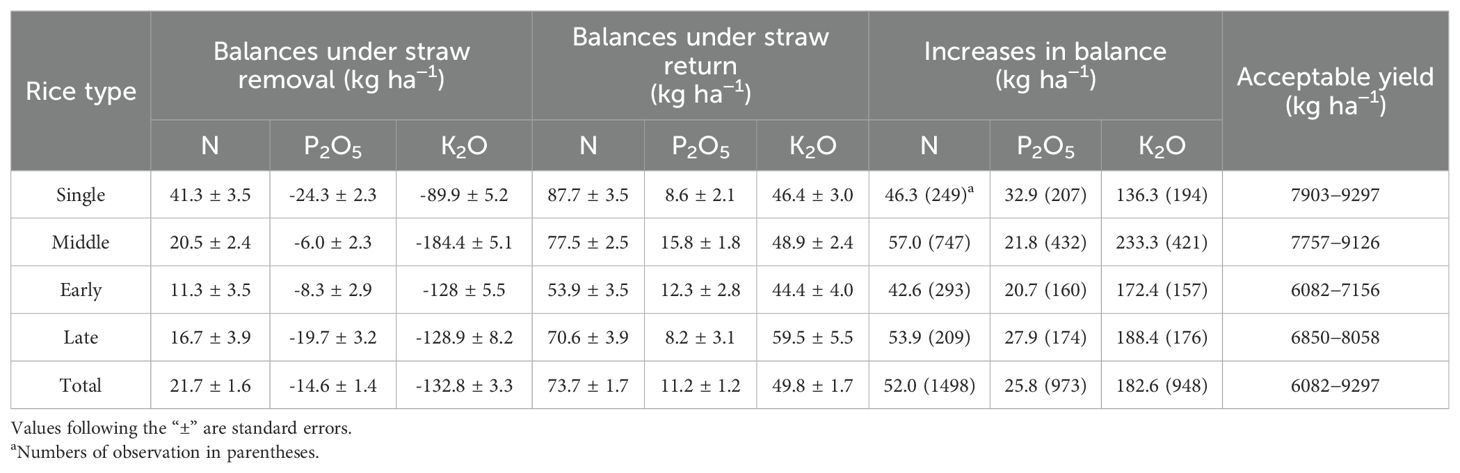
Table 2. Comparisons of nutrient balances between rice straw removal and return under acceptable yield goals.
3.3 Effect of organic substitution on Nbalance
Overall, substituting chemical fertilizer N with organic fertilizer (10−100%) did not result in a significant change in Nbalance when compared to the application of chemical fertilizer alone (Figure 5). However, the changes in Nbalance were statistically different between different rice types and the substituted percentage of organic fertilizer. An increase of 34.5 kg ha−1 in Nbalance was observed under single rice cultivation, while a significant decrease of 20.7 kg ha−1 was noted under middle rice cultivation. This suggests that the substitution of organic fertilizer led to differences in N uptake, given that the total N rates of chemical and organic fertilization were the same. When the percentage of organic substitution ranged from 20 to 40%, the decrease in Nbalance was the lowest, indicating an optimal percentage of organic N. A significantly higher increase of 20.2 kg ha−1 occurred when the percentage of organic N exceeded 60%, implying a negative effect on N uptake or rice yield. Exaggerated percentages of organic N should be avoided.
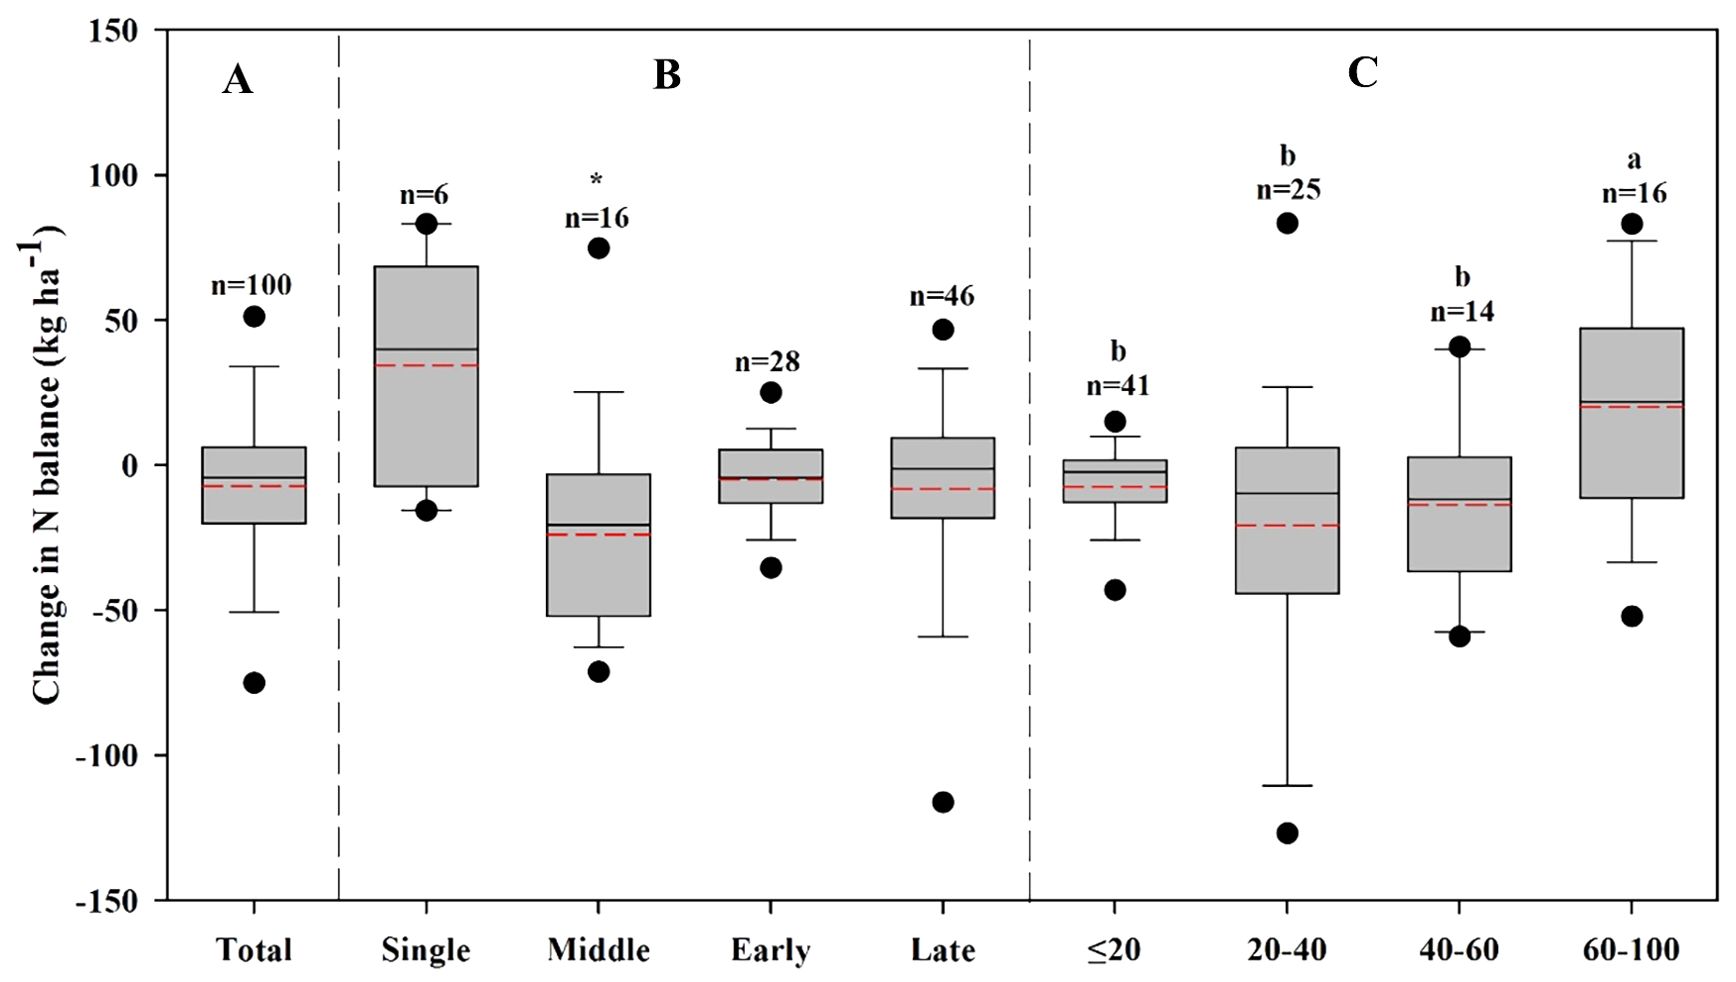
Figure 5. Changes in Nbalance under organic N substituting inorganic N relative to inorganic N alone across the total dataset (A), different rice type (B), and the percentage of organic N in total N (C). “*” represents a significant change in N balance at p< 0.05. Different lowercase letters indicate significant difference (p< 0.05) within the category. n is the number of observations.
3.4 Effect of slow-release N fertilizer on Nbalance
On average, there was a significant decrease (−24.3 kg ha−1) in Nbalance when conventional N was substituted with varying percentages (10−100%) of slow-release N (Figure 6), indicating more N was taken up by the rice plants. This decrease in Nbalance was more pronounced under middle and late rice compared to those under single and early rice. The percentage of slow-release N in total N applications significantly influenced Nbalance. A negative correlation was observed between the percentage of slow-release N in total N and the decrease in Nbalance. Decreases in Nbalance were notably larger when the percentage of slow-release N exceeded 60%. Changes in Nbalance with slow-release N fertilizer primarily depended on changes in rice yield. Applying slow-release N to middle and late rice at a high percentage led to a relatively higher yield.
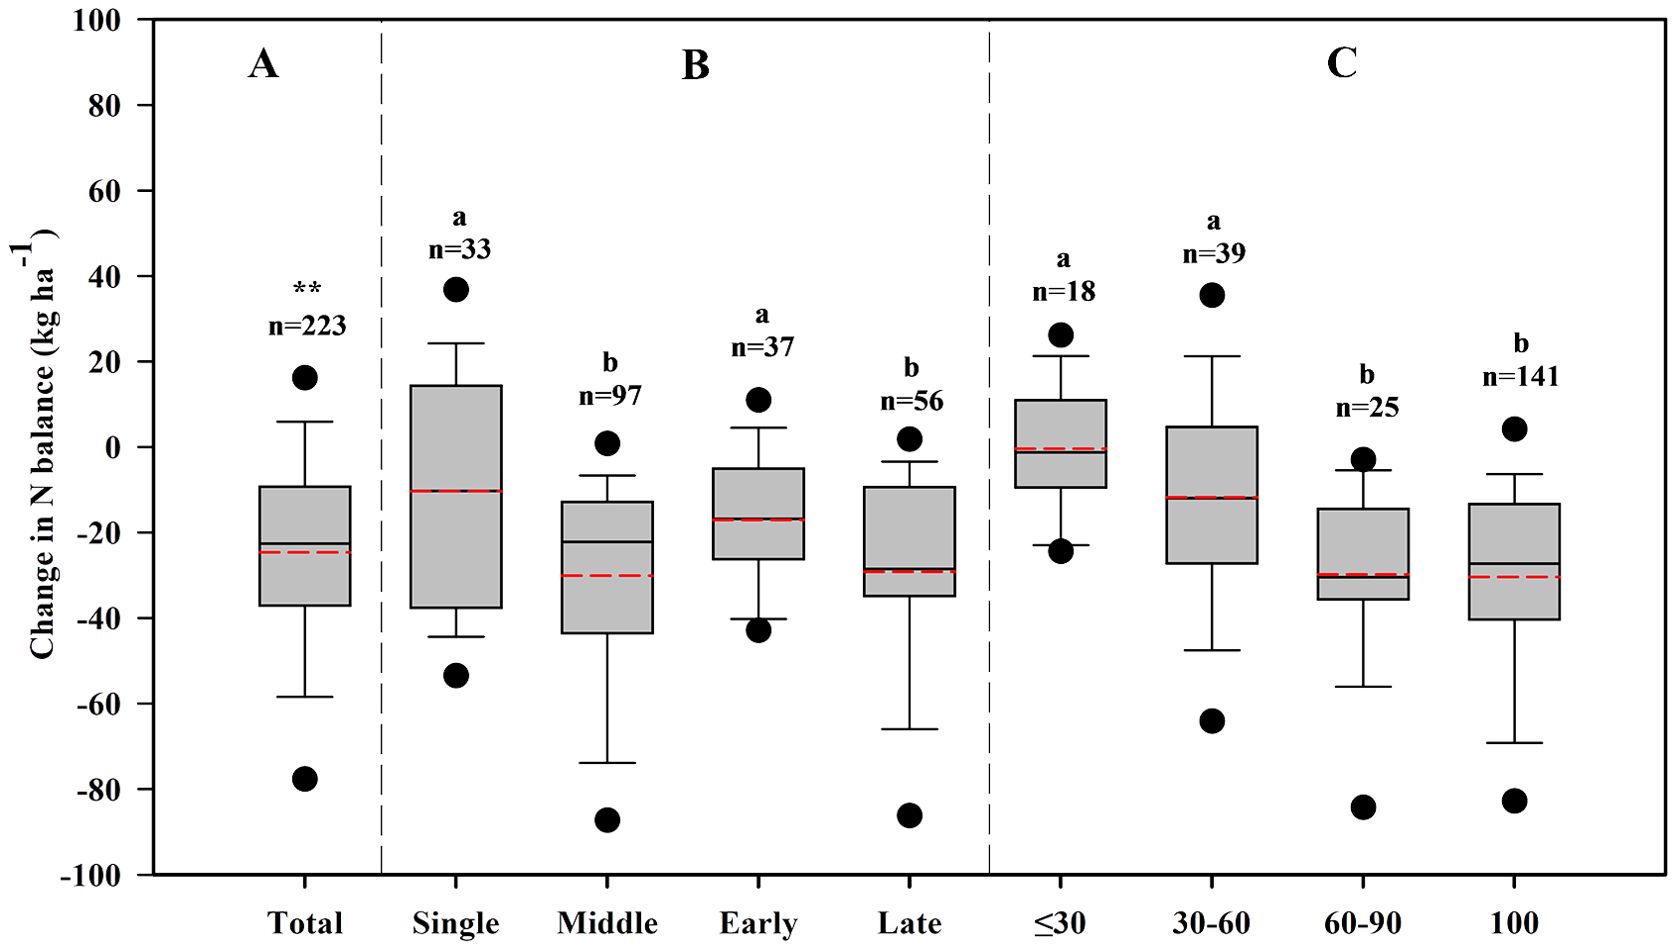
Figure 6. Changes in Nbalance with application of slow-release N fertilizer relative to conventional N fertilizer across the total dataset (A), different rice type (B) and the percentage of slow-release N in total N rate (C). “**” and “*” represent significant changes in N balance at p< 0.01 and p< 0.05, respectively. Different lowercase letters indicate significant differences (p< 0.05) within the category. n is the number of observations.
4 Discussion
4.1 The thresholds of N/P/K fertilization in rice fields
Maintenance of soil fertility by an external source such as commercial fertilizer is essential for continued attainment of high target yields as crop removal depletes finite soil reserves of N, P, and K over time. However, certain fertilizer management practices in intensively managed agriculture systems fail to link soil nutrient balance with yield level, leading to unbalanced applications of N, P, and K, which can cause yield stagnation or declines (Wang et al., 2024). In our study, the estimation of N rates based on N balance meets the requirement of attainable yield goals. The maximum N surplus is set at a value equal to the soil contribution to crop N uptake (averaged 84 kg N ha−1), under which the N rate may serve as a reference of the upper limit of the N threshold. Considering the priority of yield and the current fertilization techniques in China with N losses up to 40−50% (Gu et al., 2015), a N surplus less than soil consumption is essential for building soil fertility and avoiding over-surplus to exacerbate N loss. Zhang et al. (2019) established N surplus benchmarks for single cropping systems ranging from 40 to 100 kg N ha−1 in China. Therefore, on the promise of a high yield level, the lower and upper thresholds of N rates given by the present study accommodate the dual needs of minimizing environmental losses and maintaining crop productivity. Ju et al. (2004) estimated the rational range of N rate for rice in China to be 150−250 kg ha−1 based on yield levels of 6500−8500 kg ha−1. The upper limit they suggested is similar to our result (averaged 244 kg N ha−1), while the lower limit is slightly higher than ours (averaged 126 kg N ha−1) due to their emphasis on yield and disregard for the high indigenous soil nutrient supply. Zhu (2006) proposed a regional mean optimal rate of fertilizer N for rice at the Middle and Lower Reaches of the Yangtze River, recommending a relatively narrow range of 190−200 kg N ha−1, covering partial cultivation areas of middle, early, and late rice. Their recommended rates are encompassed in our findings and may be more suitable in a specific region, but not on a national scale. Differences in N thresholds were observed among different rice types (early, middle, late, and single-season rice) due to variations in soil, climate, rotation crops, and varieties (Xu et al., 2015, 2016). For example, considering higher N losses with alternative drying and wetting, Ju and Gu (2014) suggested an allowed surplus of 100 kg N ha−1 and a maximum N rate of 300 kg N ha−1 for rice in a wheat-rice rotation system, which aligns closely with the upper estimation for middle rice in our study (292 kg N ha−1). Coincidentally, rice growers in the Tai Lake Catchment (dominated by middle rice) applied approximately 300 kg N ha−1 on average (Jiang et al., 2012), implying a substantial potential for N reduction. Current nutrient balance status in different regions serves as another reference when recommending N rates. He et al. (2018) found that the highest and lowest N balance levels were observed in Southwest and Northeast China, respectively. Therefore, in regions with a low N balance level, applying more N, potentially nearing the upper threshold, can be beneficial, while excessive N should be avoided in the regions with a high N balance level. If soil N pools are greatly depleted in one season, maintaining sustainable high yields in the subsequent seasons becomes challenging (Zou et al., 2024). Consequently, the N recommendation should be combined with the soil fertility assessments. Where indigenous N supply is abundant, N rates based on lower thresholds are suggested to maximize N use efficiency and minimize environmental risks. Conversely, in areas with lower soil fertility, N rates based on upper thresholds are suggested to guarantee high yields and replenish soil N consumption. It is crucial to recognize that neither the upper nor the lower threshold constitutes an optimal rate for fertilizer recommendation; instead, they provide an environmentally and agriculturally acceptable range within which site-specific fertilizer recommendations can be implemented. Moreover, careful management practices, such as deep application, spilt application, and high-efficiency N fertilizer, need to be conducted to improve N use efficiency and reduce N loss. Our results demonstrated that conventional N combined with slow-release N significantly decreased Nbalance by increasing N uptake.
A rational application of P fertilizer is notable, given its widespread mismanagement in Chinese farmlands (Gu et al., 2024). According to the statistics conducted by Ma et al. (2018), the average net soil P surplus in China increased from 4.6 kg P ha−1 in 1980 to 42.1 kg P ha−1 in 2012 due to extensive P fertilizer application, and the accumulation of P in agricultural soils could theoretically sustain crop P demands for approximately 4.8–12.0 years. High native P-fixing capacity in acid soils (fixed by Al and Fe oxides) and alkaline soils (fixed by Ca) make P slowly available to plants. Nevertheless, lowland soils exhibit a greater capacity to supply P than upland soils due to reduced Fe (III) compounds under flooded conditions, which implies that excessive P application in rice fields can result in a lower P use efficiency (Dhillon et al., 2017). The present study estimated that the lower threshold of P fertilizer application for rice ranged from 56 to 74 kg P2O5 ha−1, and the upper threshold ranged from 112 to 132 kg P2O5 ha−1 across four rice types. The P uptake by rice was increased by only 9 kg P2O5 ha−1 when P fertilization increased from the lower to the upper limit. The P surplus was tentatively set at 20 kg P2O5 ha−1 per year for arable soils (Oenema et al., 2003), while our upper thresholds were estimated based on P surpluses of 50–68 kg P2O5 ha−1 per season. Furthermore, the P recovery efficiency was only averaged at 13.2% based on our database (data not shown). It has been reported that 100 kg ha−1 P surplus increased soil Olsen-P by 1.4–5.7 mg kg−1 under different soil types, and the risk of P leaching increased rapidly when soil Olsen-P exceeded 40 mg kg−1 (Li et al., 2011). Therefore, unless P is the most limiting factor in the soil, the upper level of P fertilization is not encouraged. Dobermann et al. (1996) suggested applying 46–57 kg P2O5 ha−1 for rice to maintain a good P balance in soil, which essentially matches the lower thresholds we proposed. Based on the condition of P surplus and the greater P-supply in flooded soil, we also recommend rice growers in China use P fertilizer referring to the lower thresholds.
Rice cultivation requires balanced nutrient management, including K, which is often overlooked despite its crucial role in crop yield and quality. The misalignment between the equivalent N and K uptake requirements in farmer’s practices and the actual needs of rice plants has led to widespread deficiencies in soil available K, exacerbated by high crop removal rates and unbalanced fertilization practices (He et al., 2015; Liu et al., 2017). Zhang et al. (2010) determined negative partial K balances in rice-based systems under long-term fertilization, ranging from 17 to 245 kg K ha−1 year−1, underscoring the need for adequate K supplementation. Recent studies demonstrated that applying K fertilizer significantly improved rice yield (Chen et al., 2024; Xu et al., 2023), indicating the importance of K in crop performance. When rice straw is included in K output, our study determined that large amounts of K fertilizer (averaged 206 kg K2O ha−1) need to be input to maintain essential Kbalance, even as high as 340 kg K2O ha−1 to offset K losses and replenish soil K consumption. However, while the lower K threshold precisely reflected the crop requirement, the upper thresholds of K fertilization may be overestimated when solely using soil contribution as the standard of maximum K surplus. The scarcity of research on K loss makes it challenging to establish a definitive standard for Kbalance, suggesting that using partial nutrient balance to estimate upper K thresholds is insufficient. A more refined method to assess K requirements is warranted. In addition, soil available K varies widely across China, with higher levels typically found in middle and early/late regions compared to single-rice regions (He et al., 2015) emphasizing the need for site-specific K fertilizer application. Given the growing recognition of K as a limiting factor in agricultural production, addressing K deficits has become a priority in recent years. Despite an increase in K fertilizer input from 0.4 million tons in 1980 to 9.4 million tons in 2010 (Liu et al., 2017), the vast amounts of K fertilizer needed to fully maintain soil K balance remain economically prohibitive for farmers due to the high cost of K fertilizer. Exploring strategies to enhance K use efficiency is therefore imperative.
4.2 Fertilizer rate changes with the addition of organic residues
The substantial expansion of Chinese agricultural production, characterized by increased crop yields and intensified livestock farming, has generated substantial volumes of animal wastes and crop residues, which are now recognized as significant nutrient reservoirs that can substitute for mineral fertilizers (Mu et al., 2024). The integration of mechanized farming and government-backed initiatives promoting crop straw return and organic fertilizer use has sparked a growing interest in optimizing the use of organic resources to offset mineral fertilizer application. Fertilization strategies are profoundly influenced by the addition of organic residues, such as crop residues and manure. The removal of rice straw from fields necessitates increased fertilizer inputs to maintain soil nutrient balance, particularly for K. Rice straw is distinguished by its high K content relative to other residues, averaging 22.7 g kg−1 in our database. The recycling of rice straw contributes to building a robust soil K pool, crucial for ensuring high rice yields and efficient K use efficiency. Our study showed that Kbalance can be decreased by a large amount (182.6 kg K2O ha−1) with the return of rice straw, with a relatively lower but still significant reduction of 50.3 kg N ha−1 and 25.8 kg P2O5 ha−1. Although substituting substantial quantities of N fertilizer with straw is seldom practiced by farmers due to concerns about the high C/N ratio in straw causing rapid immobilization of soil mineral N, an optimal combination of chemical N and better N-spilt regimes can facilitate the release of straw N (Ding et al., 2019). In contrast, K is released from the straw considerably faster than the straw’s decomposition, primarily because K is predominantly present as K ions in vacuoles, enabling easy mobility and leaching (Chen et al., 2016; Murrell et al., 2021). Li et al. (2014) revealed that the decomposition of rice straw in flooded paddy soil can be divided into two main stages: an initial rapid phase from day 0 to 60, followed by a slower phase from day 60 to 110. The seasonal release of K from rice straw is approximately 85% (Liu and Li, 2017), contributing to an increase in soil exchangeable K supply and reserves (Han et al., 2024). However, straw return alone is insufficient to sustain soil K levels, necessitating supplementation with K fertilizer (Tan et al., 2007; Wang et al., 2010). Therefore, we recommend that rice growers refer to the upper thresholds as total nutrient rates and exclude N and K from returned straw as an optimized fertilization practice (i.e., N rate=244.8-50.3≈194 kg N ha−1; K rate=340.0-182.6≈157 kg K2O ha−1). According to the relationships in Figure 2, 194 kg N ha−1 rate can achieve high yield goals, and it agrees with the fertilization recommendations by other researchers. Technically, these reductions depend on how straw is managed; for example, optimizing management involves straw that needs to be well mechanically crushed before being incorporated into the soil and flooded during the winter. In recent years, with the increase in fertilizer K application combined with straw return, the K deficiency has been widely mitigated, and in some cases, soil K level changed from a deficiency to a surplus (Huang et al., 2007; Liu et al., 2017).
Manure stands out as a critical organic resource for numerous cropping systems, offering a potential avenue to curtail environmental pollution while sustaining crop yields in agricultural production (Ding et al., 2018; Smith et al., 2008). However, the extent to which rice nutrient demands can be met from organic sources remains uncertain. Our findings demonstrated that substituting chemical N fertilizer with manure can achieve almost a comparable Nbalance status as the exclusive use of chemical fertilizers, suggesting that organic substitution does not adversely affect rice yields. Furthermore, the greatest reductions in Nbalance were observed when the proportion of organic substitution ranged from 20-40%. This is attributed to manure not only enhancing crop yield but also increasing total N in the crop (Tirol-Padre et al., 2007; Duan et al., 2011). This aligns with our previous meta-analysis demonstrating that substituting chemical N with organic N maximized rice yield when the substitution proportion was approximately 30% (Ding et al., 2018). Another study corroborates this, showing that combining 30% organic N with 70% mineral N optimizes rice yield (Hou et al., 2011). Hence, it is feasible to decrease N fertilizer input by at least 30% while maintaining high and steady yields. However, a negative effect of organic substitution was observed in single rice cultivation, predominantly in cooler climates (northeastern and northwestern China) (Xu et al., 2016). The slow decomposition and mineralization rates of manure make it challenging to release as many available nutrients as in tropical and subtropical areas in the first season. Therefore, rice growers in single rice cultivation areas should exercise caution regarding the quantity and method of manure application. Beyond reducing fertilizer N input, manure application creates a substantial capacity for immobilizing mineral N applied to the soil, thereby mitigating environmental N loss (Bouwman et al., 2010; Smith et al., 2001; Zhou et al., 2016). Long-term manure application allows for the reduction or elimination of chemical P and K fertilizers while sustaining optimal grain yields (Duan et al., 2011). Although our present study did not involve substituting fertilizer P with manure, we posit that a considerable reduction in P fertilizer usage can be achieved through the addition of manure due to its high P concentration. According to our database (data not shown), the P concentration in manure is as high as 26.4 g P2O5 kg−1, which underscores its potential as a rich source of P. Li et al. (2011) reported that the manure application accelerated the increase of soil Olsen-P at a rate nearly 3 times higher than when an equivalent amount of P was applied solely as chemical fertilizer. This observation supports the notion that manure P can play an increasingly significant role as a substitute for P fertilizer, with an associated increase in P use efficiency. Therefore, determining the optimal proportion of mineral P combined with manure and the readily available P in manure is a critical area deserving of further investigation.
4.3 Study limitations
The complexity and challenges inherent in determining optimal fertilization rates for rice cultivation in China are significant, particularly due to the variability in yield responses to fertilization and the need to consider multiple factors such as the yield potential of rice varieties, climate, location, soil fertility, and management practices. While the method proposed can be used by farmers in practice, the specific thresholds of fertilizer N, P, and K given in the present study are more suitable for providing policymakers with a reference for restrictions on chemical fertilizer usage. The effectiveness of this method on a field scale is contingent upon an accurate assessment of soil nutrient status and an understanding of crop nutrient demands. Evaluating soil nutrient budgets with the partial nutrient balance may cause relatively large errors when great differences exist between ignored inputs and outputs. This mismatch between nutrient surplus and soil depletion underscores the importance of site-specific soil fertility in achieving high fertility levels and avoiding environmental consequences (Janssen and de Willigen, 2006). The current study acknowledges the influence of soil fertility on determining fertilizer rate but calls for more accurate indicators in future studies. Changes in fertilizer distribution and application techniques over time imply that the optimal fertilizer rates will evolve (Ladha et al., 2005). Incorporating increasingly optimized management practices into fertilization strategies was not addressed in the present study. In the case of straw removal, standing stubble remaining in the fields by the harvester can also contribute significant amounts of nutrients, which deserves further quantification. Overall, a systematic field validation based on our established fertilization criteria is deserved in the future.
5 Conclusion
This study proposed a systematic method for estimating the optimum ranges of N, P and K fertilizer for rice cultivation in China, which hinges on dual principles: nutrient balance and rice yield levels. By establishing lower and upper thresholds for N, P and K rates across four rice types, the method aims to delineate a balanced fertilization range beneficial for both farmers and policymakers. The lower fertilization limit, grounded in maintaining crop productivity while minimizing environmental pollution, serves as a baseline for sustainable agricultural practices. On the other hand, the upper limit, though currently lacking legislative backing akin to European Union standards, acts as a benchmark for fertilization regulations. Fertilization exceeding upper thresholds should be avoided as it can significantly escalate environmental costs, including nutrient leaching and greenhouse gas emissions. Optimizing fertilization recommendations involves the strategic application of slow-release N fertilizer, organic substitution, and straw return into the soil can markedly reduce the demand for K fertilizers and substantially decrease N and P requirements. The substitution of chemical N with organic fertilizers or slow-release N fertilizers improves N use efficiency, contributing to a more balanced N management strategy. This methodology is a valuable contribution to fertilization guidelines, not only for rice but also for other crops, fostering sustainable agricultural practices.
Data availability statement
The raw data supporting the conclusions of this article will be made available by the authors, without undue reservation.
Author contributions
YL: Funding acquisition, Methodology, Software, Visualization, Writing – review & editing. WD: Conceptualization, Data curation, Formal analysis, Funding acquisition, Investigation, Methodology, Project administration, Writing – original draft. PH: Conceptualization, Resources, Supervision, Writing – review & editing. XX: Funding acquisition, Investigation, Supervision, Validation, Writing – review & editing. WZ: Funding acquisition, Project administration, Supervision, Writing – review & editing.
Funding
The author(s) declare that financial support was received for the research, authorship, and/or publication of this article. Financial supports from the National Natural Science Foundation of China (32102492), the National Key Research & Development Program of China (2023YFD2300402), the National Agricultural Science and Technology Project (20221805), the China Postdoctoral Science Foundation (No. 2023M743122), and the Earmarked Fund for the China Agriculture Research System (CARS-01-2) are greatly acknowledged.
Acknowledgments
We appreciate Dr. Bruce Linquist and Mr. Telha Relman from University of California, Davis, for their comments and language edition, and thank the authors whose data were included in our analysis.
Conflict of interest
The authors declare that the research was conducted in the absence of any commercial or financial relationships that could be construed as a potential conflict of interest.
Publisher’s note
All claims expressed in this article are solely those of the authors and do not necessarily represent those of their affiliated organizations, or those of the publisher, the editors and the reviewers. Any product that may be evaluated in this article, or claim that may be made by its manufacturer, is not guaranteed or endorsed by the publisher.
References
Bouwman, A., Stehfest, E., van Kessel, C. (2010). “Nitrous Oxide Emissions from the Nitrogen Cycle in Arable Agriculture: Estimation and Mitigation” in Nitrous Oxide and Climate Change, ed. Smith, K. (London: Routledge Press), 85–106. doi: 10.4324/9781849775113-8
Buresh, R. J., Pampolino, M. F., Witt, C. (2010). Field–specific potassium and phosphorus balances and fertilizer requirements for irrigated rice-based cropping systems. Plant Soil 335, 35–64. doi: 10.1007/s11104-010-0441-z
Chen, G., Duan, Q., Wu, C., He, X., Hu, M., Li, C., et al. (2024). Optimizing rice yield, quality and nutrient use efficiency through combined application of nitrogen and potassium. Front. Plant Sci. 15, 1335744. doi: 10.3389/fpls.2024.1335744
Chen, C., Yu, C., Zhang, H., Zhai, X., Luo, Z. (2016). Investigation on K and Cl release and migration in micro-spatial distribution during rice straw pyrolysis. Fuel 167, 180–187. doi: 10.1016/j.fuel.2015.11.030
Chen, X., Cui, Z., Fan, M., Vitousek, P., Zhao, M., Ma, W., et al. (2014). Producing more grain with lower environmental costs. Nature 514, 486–489. doi: 10.1038/nature13609
Colaço, A. F., Whelan, B. M., Bramley, R. G. V., Richetti, J., Fajardo, M., McCarthy, A. C., et al. (2024). Digital strategies for nitrogen management in grain production systems: lessons from multi-method assessment using on-farm experimentation. Precis. Agric. 25, 983–1013. doi: 10.1007/s11119-023-10102-z
Cui, Z., Zhang, H., Chen, X., Zhang, C., Ma, W., Huang, C., et al. (2018). Pursuing sustainable productivity with millions of smallholder farmers. Nature 555, 363–366. doi: 10.1038/nature25785
Dermawan, R., Susila, A. D., Purwono, P., Nugroho, B. (2024). Evaluation of five soil nutrient extraction methods for practical assessment of phosphorus and potassium availability for tomato (Solanum lycopersicum) fertilization in Andisols-Garut, Indonesia. Acta Agrobotanica 77, 1–9. doi: 10.5586/aa/187895
Dhillon, J., Torres, G., Driver, E., Figueiredo, B., Raun, W. R. (2017). World phosphorus use efficiency in cereal crops. Agron. J. 109, 1–8. doi: 10.2134/agronj2016.08.0483
Diaz, R. J., Rosenberg, R. (2008). Spreading dead zones and consequences for marine ecosystems. Science 321, 926–929. doi: 10.1126/science.1156401
Ding, W. C., Li, S. T., He, P., Huang, S. M. (2019). Contribution and fate of maize residue-15N and urea-15N as affected by N fertilization regime. PloS One 14, e0210176. doi: 10.1371/journal.pone.0210176
Ding, W. C., Xu, X. P., He, P., Ullah, S., Zhang, J. J., Cui, Z. L., et al. (2018). Improving yield and nitrogen use efficiency through alternative fertilization options for rice in China: A meta-analysis. Field Crops Res. 227, 11–18. doi: 10.1016/j.fcr.2018.08.001
Dobermann, A., Cassman, K. G., Sta. Cruz, P. C., Adviento, M. A. A., Pampolino, M. F. (1996). Fertilizer inputs, nutrient balance and soil nutrient supplying power in intensive, irrigated rice system. III. Phosphorus. Nutr. Cycl. Agroecosyst. 46, 111–125. doi: 10.1007/BF00704311
Duan, Y., Xu, M., Wang, B., Yang, X., Huang, S., Gao, S. (2011). Long-term evaluation of manure application on maize yield and nitrogen use efficiency in China. Soil Sci. Soc Am. J. 75, 1562. doi: 10.2136/sssaj2010.0315
Eurostat (2023). Agri-environmental indicator - gross nitrogen balance. Available online at: https://ec.europa.eu/eurostat/statistics-explained/index.php/. accessed [March 1, 2024].
Ge, W., Zhou, J., Zheng, P., Yuan, L., Rottok, L. T. (2024). A recommendation model of rice fertilization using knowledge graph and case-based reasoning. Comput. Electron. Agric. 219, 108751. doi: 10.1016/j.compag.2024.108751
Gu, B., Ju, X., Chang, J., Ge, Y., Vitousek, P. M. (2015). Integrated reactive nitrogen budgets and future trends in China. Proc. Natl. Acad. Sci. 112, 8792–8797. doi: 10.1073/pnas.1510211112
Gu, C. M., Li, Y. S., Yang, L., Dai, J., Hu, W., Yu, C. B., et al. (2024). Effects of oilseed rape green manure on phosphorus availability of red soil and rice yield in rice–green manure rotation system. Front. Plant Sci. 15, 1417504. doi: 10.3389/fpls.2024.1417504
Guo, J. H., Liu, X. J., Zhang, Y., Shen, J. L., Han, W. X., Zhang, W. F., et al. (2010). Significant acidification in major Chinese croplands. Science 327, 1008–1010. doi: 10.1126/science.1182570
Han, T., Liu, K., Huang, J., Khan, M. N., Shen, Z., Li, J., et al. (2024). Temporal and spatial characteristics of paddy soil potassium in China and its response to organic amendments: A systematic analysis. Soil Tillage Res. 235, 105894. doi: 10.1016/j.still.2023.105894
He, W., Jiang, R., He, P., Yang, J., Zhou, W., Ma, J., et al. (2018). Estimating soil nitrogen balance at regional scale in China’s croplands from 1984 to 2014. Agr. Syst. 167, 125–135. doi: 10.1016/j.agsy.2018.09.002
He, P., Yang, L., Xu, X., Zhao, S., Chen, F., Li, S., et al. (2015). Temporal and spatial variation of soil available potassium in China, (1990–2012). Field Crops Res. 173, 49–56. doi: 10.1016/j.fcr.2015.01.003
Hou, H., Liu, X., Liu, G., Li, Z., Liu, Y., Huang, Y., et al. (2011). Effect of long-term located organic-inorganic fertilizer application on rice yield and soil fertility in red soil area of China. Scientia Agricultura Sin. 44, 516–523. doi: CNKI:SUN:ZNYK.0.2011-03-012
Huang, S. W., Jin, J. Y., Bai, Y. L., Yang, L. P. (2007). Evaluation of nutrient balance in soil-vegetable system using nutrient permissible surplus or deficit rate. Commun. Soil Sci. Plant Anal. 38, 959–974. doi: 10.1080/00103620701277973
Huang, S., Zeng, Y., Wu, J., Shi, Q., Pan, X. (2013). Effect of crop residue retention on rice yield in China: A meta-analysis. Field Crops Res. 154, 188–194. doi: 10.1016/j.fcr.2013.08.013
Ingwersen, J., Poyda, A., Kremer, P., Streck, T. (2024). Harvest residues: A relevant term in the carbon balance of croplands? Agric. For. Meteorology 349, 109935. doi: 10.1016/j.agrformet.2024.109935
Janssen, B. H., de Willigen, P. (2006). Ideal and saturated soil fertility as bench marks in nutrient management. I Outline of the framework. Agric. Ecosyst. Environ. 116, 132–146. doi: 10.1016/j.agee.2006.03.014
Jiang, X., Liu, C., Sui, B., Dong, C., Guo, S. (2012). Problems and proposals of the current fertilization situation in the rice-wheat rotation system in tai lake basin. Chin. Agric. Sci. Bull. 28, 15–18. doi: 10.3969/j.issn.1000-6850.2012.15.004
Ju, X. T., Gu, B. J. (2014). Status-quo, problem and trend of nitrogen fertilization in China. J. Plant Nutr. Fertilizers 20 (4), 783–795. doi: 10.11674/zwyf.2014.0401
Ju, X. T., Liu, X. J., Zhang, F. S., Roelcke, M. (2004). Nitrogen fertilization, soil nitrate accumulation, and policy recommendations in several agricultural regions of China. Ambio 33, 300–305. doi: 10.1579/0044-7447-33.6.300
Ju, X., Zhang, C. (2017). Nitrogen cycling and environmental impacts in upland agricultural soils in North China: A review. J. Integr. Agr. 16, 2848–2862. doi: 10.1016/S2095-3119(17)61743-X
Karimi, R., Pogue, S. J., Kröbel, R., Beauchemin, K. A., Schwinghamer, T., Janzen, H. H. (2020). An updated nitrogen budget for Canadian agroecosystems. Agriculture Ecosyst. Environ. 304, 107046. doi: 10.1016/j.agee.2020.107046
Laborte, A. G., de Bie, K. C., Smaling, E. M., Moya, P. F., Boling, A. A., Van Ittersum, M. K. (2012). Rice yields and yield gaps in Southeast Asia: past trends and future outlook. Eur. J. Agron. 36, 9–20. doi: 10.1016/j.eja.2011.08.005
Ladha, J. K., Pathak, H., Krupnik, T. J., Six, J., van Kessel, C. (2005). Efficiency of fertilizer nitrogen in cereal production: retrospects and prospects. Adv. Agron. 87, 85–156. doi: 10.1016/S0065-2113(05)87003-8
Li, H., Huang, G., Meng, Q., Ma, L., Yuan, L., Wang, F., et al. (2011). Integrated soil and plant phosphorus management for crop and environment in China. A review. Plant Soil 349, 157–167. doi: 10.1007/s11104-011-0909-5
Li, S. T., Jin, J. Y. (2011). Characteristics of nutrient input/output and nutrient balance in different regions of China. Scientia Agricultura Sin. 44, 4207–4229. doi: 10.3864/j.issn.0578-1752.2011.20.009
Li, S. T., Liu, X. Y., Ding, W. C. (2016). Estimation of organic nutrient sources and availability for land application. Better Crops 100, 4–6.
Li, J., Lu, J., Li, X., Ren, T., Cong, R., Zhou, L. (2014). Dynamics of potassium release and adsorption on rice straw residue. PloS One 9, e90440. doi: 10.1371/journal.pone.0090440
Liu, X. Y., Li, S. T. (2017). Temporal and spatial distribution characteristics of crop straw nutrient resources and returning to farmland in China. Trans. Chin. Soc. Agric. Eng. 33, 1–19. doi: 10.11975/j.issn.1002-6819.2017.21.001
Liu, Y., Yang, J., He, W., Ma, J., Gao, Q., Lei, Q., et al. (2017). Provincial potassium balance of farmland in China between 1980 and 2010. Nutr. Cycl. Agroecosyst. 107, 247–264. doi: 10.1007/s10705-017-9833-2
Ludemann, C. I., Wanner, N., Chivenge, P., Dobermann, A., Einarsson, R., Grassini, P., et al. (2024). A global FAOSTAT reference database of cropland nutrient budgets and nutrient use efficiency, (1961–2020): nitrogen, phosphorus and potassium. Earth System Sci. Data 16, 525–541. doi: 10.5194/essd-16-525-2024
Ma, J., Liu, Y., He, W., He, P., Haygarth, P. M., Surridge, B. W. J., et al. (2018). The long–term soil phosphorus balance across Chinese arable land. Soil Use Mange 34, 306–315. doi: 10.1111/sum.12438
Mclellan, E. L., Cassman, K. G., Eagle, A. J., Woodbury, P. B., Sela, S., Tonitto, C., et al. (2018). The nitrogen balancing act: tracking the environmental performance of food production. BioScience 68, 194–203. doi: 10.1093/biosci/bix164
MEP (2010). Ministry of Environmental Protection, Bulletin of National Environmental Statistics 2009 (Beijing: MEP).
Mu, G., Xu, L., Zhang, J. (2024). Study of the utilization of main crop straw resources in Southern China and its potential as a replacement for chemical fertilizers. Front. Plant Sci. 14, 1172689. doi: 10.3389/fpls.2023.1172689
Murrell, T. S., Mikkelsen, R. L., Sulewski, G., Norton, R., Thompson, M. L. (2021). Improving potassium recommendations for agricultural crops (Cham Switzerland: Springer Nature), 455.
National Bureau of Statistics of China (2024). Available online at: http://data.stats.gov.cn/index.htm (Accessed 26.7.2024).
Oenema, O., Kros, H., de Vries, W. (2003). Approaches and uncertainties in nutrient budgets: implications for nutrient management and environmental policies. Eur. J. Agron. 20, 3–16. doi: 10.1016/S1161-0301(03)00067-4
Organization for Economic Co-operation and Development (OECD) (2001). “Environmental indicators for agriculture, methods and results,” in Organization for economic co-operation and development. (Paris, France: OECD).
Penuelas, J., Coello, F., Sardans, J. (2023). A better use of fertilizers is needed for global food security and environmental sustainability. Agric. Food Secur. 12, 1–9. doi: 10.1186/s40066-023-00409-5
Saha, P. K. (2007). Long-term integrated nutrient management for rice-based cropping pattern: effect on growth, yield, nutrient uptake, nutrient balance sheet, and soil fertility. Commun. Soil Sci. Plan. 38, 579–610. doi: 10.1080/00103620701215718
Shukla, A. K., Singh, R. R., Mishra, T., Tripathi, K. M., Mishra, S., Kumar, D. (2024). Optimizing nutrient uptake in rice crops through integrated organic manure application: A comprehensive analysis of grain and straw composition. Asian J. Soil Sci. Plant Nutr. 10, 167–174. doi: 10.9734/ajsspn/2024/v10i1223
Smith, K. A., Jackson, D. R., Pepper, T. J. (2001). Nutrient losses by surface run–of following the application of organic manures to arable land. 1. Nitrogen. Environ. pollut. 112, 41–51. doi: 10.1016/S0269-7491(00)00097-X
Smith, P., Martino, D., Cai, Z., Gwary, D., Janzen, H., Kumar, P., et al. (2008). Greenhouse gas mitigation in agriculture. Philos. Trans. R. Soc Lond. 363, 789–813. doi: 10.1098/rstb.2007.2184
Song, D. L., Hou, S. P., Wang, X. B., Liang, G. Q., Zhou, W. (2018). Nutrient resource quantity of crop straw and its potential of substituting. J. Plant Nutr. Fertilizers 24 (1), 1–21. doi: 10.11674/zwyf.17348
Tan, D. S., Jin, J. Y., Huang, S. W., Li, S. T., He, P. (2007). Effect of long-term application of k fertilizer and wheat straw to soil on crop yield and soil k under different planting systems. Agr. Sci. China 6, 200–207. doi: 10.1016/S1671-2927(07)60035-2
Tang, H., Li, C., Shi, L., Wen, L., Li, W., Cheng, K., et al. (2024). Tillage with crop residue returning management increases soil microbial biomass turnover in the double-cropping rice fields of southern China. Agronomy 14, 265. doi: 10.3390/agronomy14020265
Tirol-Padre, A., Ladha, J. K., Regmi, A. P., Bhandari, A. L., Inubushi, K. (2007). Organic amendments affect soil parameters in two long-term rice-wheat experiments. Soil Sci. Soc Am. J. 71, 442. doi: 10.2136/sssaj2006.0141
Valkama, E., Salo, T., Esala, M., Turtola, E. (2013). Nitrogen balances and yields of spring cereals as affected by nitrogen fertilization in northern conditions: A meta-analysis. Agric. Ecosyst. Environ. 164, 1–13. doi: 10.1016/j.agee.2012.09.010
van Doorn, M., van Rotterdam, D., Ros, G., Koopmans, G. F., Smolders, E., de Vries, W. (2024). The phosphorus saturation degree as a universal agronomic and environmental soil P test. Crit. Rev. Environ. Sci. Technol. 54, 385–404. doi: 10.1080/10643389.2023.2240211
van Wart, J., Kersebaum, K. C., Peng, S., Milner, M., Cassman, K. G. (2013). Estimating crop yield potential at regional to national scales. Field Crops Res. 143, 34–43. doi: 10.1016/j.fcr.2012.11.018
Wang, M., Ge, A. H., Ma, X., Wang, X., Xie, Q., Wang, L., et al. (2024). Dynamic root microbiome sustains soybean productivity under unbalanced fertilization. Nat. Commun. 15, 1668. doi: 10.1038/s41467-024-45925-5
Wang, H. T., Jin, J. Y., Wang, B., Zhao, P. P. (2010). Effects of long-term potassium application and wheat straw return to cinnamon soil on wheat yields and soil potassium balance in Shanxi. J. Plant Nutr. Fertilizers 16, 801–808. doi: 10.4028/www.scientific.net/AMM.37-38.1549
Whitbread, A., Blair, G., Konboon, Y., Lefroy, R., Naklang, K. (2003). Managing crop residues, fertilizers and leaf litters to improve soil C, nutrient balances, and the grain yield of rice and wheat cropping systems in Thailand and Australia. Agric. Ecosyst. Environ. 100, 251–263. doi: 10.1016/S0167-8809(03)00189-0
Xu, Y., Fan, Y., Zhang, W. F., Meng, Y. D., Jiang, Y. (2019). Status and problems of chemical fertilizer application in crop plantations of China from 2014 to 2016. J. Plant Nutr. Fertilizers 25, 11–21. doi: 10.11674/zwyf.18073
Xu, X., He, P., Zhao, S., Qiu, S., Johnston, A. M., Zhou, W. (2016). Quantification of yield gap and nutrient use efficiency of irrigated rice in China. Field Crops Res. 186, 58–65. doi: 10.1016/j.fcr.2015.11.011
Xu, W., Li, J., Feng, J., Shao, Z., Huang, Y., Hou, W., et al. (2023). Nitrogen and potassium interactions optimized asynchronous spikelet filling and increased grain yield of japonica rice. PeerJ 11, e14710. doi: 10.7717/peerj.14710
Xu, X., Xie, J., Hou, Y., He, P., Pampolino, M. F., Zhao, S., et al. (2015). Estimating nutrient uptake requirements for rice in China. Field Crops Res. 180, 37–45. doi: 10.1016/j.fcr.2015.05.008
Zhang, W., Cao, G., Li, X., Zhang, H., Wang, C., Liu, Q., et al. (2016). Closing yield gaps in China by empowering smallholder farmers. Nature 537, 671–674. doi: 10.1038/nature19368
Zhang, C., Ju, X., Powlson, D., Oenema, O., Smith, P. (2019). Nitrogen surplus benchmarks for controlling N pollution in the main cropping systems of China. Environ. Sci. Technol. 53, 6678–6687. doi: 10.1021/acs.est.8b06383
Zhang, Q., Ju, X. T., Zhang, F. S. (2010). Re-estimation of direct nitrous oxide emission from agricultural soils of China via revised IPCC2006 guideline method. Chin. J. Eco Agric. 18, 7–13. doi: 10.3724/SP.J.1011.2010.00007
Zhou, M. H., Zhu, B., Bruggemann, N., Dannenmann, M., Wang, Y. Q., Butterbach–Bahl, K. (2016). Sustaining crop productivity while reducing environmental nitrogen losses in the subtropical wheat-maize cropping systems: a comprehensive case study of nitrogen cycling and balance. Agric. Ecosyst. Environ. 231, 1–14. doi: 10.1016/j.agee.2016.06.022
Zhu, Z. L. (2006). On the methodology of recommendation for the application rate of chemical fertilizer nitrogen to crops. J. Plant Nutr. Fertilizers 12, 1–4. doi: 10.11674/zwyf.2006.0101
Keywords: fertilization thresholds, method for fertilizer demand, straw return, organic substitution, slow-release N
Citation: Liu Y, Ding W, He P, Xu X and Zhou W (2024) Estimating thresholds of nitrogen, phosphorus and potassium fertilizer rates for rice cropping systems in China. Front. Plant Sci. 15:1470774. doi: 10.3389/fpls.2024.1470774
Received: 26 July 2024; Accepted: 26 August 2024;
Published: 12 September 2024.
Edited by:
Xue Qiang Zhao, Chinese Academy of Sciences (CAS), ChinaCopyright © 2024 Liu, Ding, He, Xu and Zhou. This is an open-access article distributed under the terms of the Creative Commons Attribution License (CC BY). The use, distribution or reproduction in other forums is permitted, provided the original author(s) and the copyright owner(s) are credited and that the original publication in this journal is cited, in accordance with accepted academic practice. No use, distribution or reproduction is permitted which does not comply with these terms.
*Correspondence: Wencheng Ding, ZGluZ3dlbmNoZW5nQGNhYXMuY24=