 Deisiany Ferreira Neres1,2
 Joseph S. Taylor2,3
 John A. Bryant Jr.1,2
 Bastiaan O. R. Bargmann2,3
 R. Clay Wright1,2*
- 1Biological Systems Engineering, Virginia Polytechnic Institute and State University, Blacksburg, VA, United States
- 2Translational Plant Science Center, Virginia Polytechnic Institute and State University, Blacksburg, VA, United States
- 3School of Plant and Environmental Sciences, Virginia Polytechnic Institute and State University, Blacksburg, VA, United States
Introduction: Throughout domestication, crop plants have gone through strong genetic bottlenecks, dramatically reducing the genetic diversity in today’s available germplasm. This has also reduced the diversity in traits necessary for breeders to develop improved varieties. Many strategies have been developed to improve both genetic and trait diversity in crops, from backcrossing with wild relatives, to chemical/radiation mutagenesis, to genetic engineering. However, even with recent advances in genetic engineering we still face the rate limiting step of identifying which genes and mutations we should target to generate diversity in specific traits.
Methods: Here, we apply a comparative evolutionary approach, pairing phylogenetic and expression analyses to identify potential candidate genes for diversifying soybean (Glycine max) canopy cover development via the nuclear auxin signaling gene families, while minimizing pleiotropic effects in other tissues. In soybean, rapid canopy cover development is correlated with yield and also suppresses weeds in organic cultivation.
Results and discussion: We identified genes most specifically expressed during early canopy development from the TIR1/AFB auxin receptor, Aux/IAA auxin co-receptor, and ARF auxin response factor gene families in soybean, using principal component analysis. We defined Arabidopsis thaliana and model legume species orthologs for each soybean gene in these families allowing us to speculate potential soybean phenotypes based on well-characterized mutants in these model species. In future work, we aim to connect genetic and functional diversity in these candidate genes with phenotypic diversity in planta allowing for improvements in soybean rapid canopy cover, yield, and weed suppression. Further development of this and similar algorithms for defining and quantifying tissue- and phenotype-specificity in gene expression may allow expansion of diversity in valuable phenotypes in important crops.
Introduction
Genetic diversity stands as a significant bottleneck in the improvement of long-cultivated varieties of crops. This limitation stems from the reduced genetic diversity resulting from the lengthy domestication process, often involving a limited number of cultivars evolving from a small pool of accessions (Rani et al., 2023). Such diminished genetic diversity presents a formidable challenge for future trait development, especially in the context of climate change and the imperative to dramatically increase crop production to meet the demands of Earth’s growing population (FAO, 2018; van Dijk et al., 2021).
Soybean [Glycine max (L.) Merr.] is among the most cultivated crops worldwide and serves as an example of a crop affected by reduced genetic diversity resulting from a lengthy domestication process (Rani et al., 2023). Soybeans are a chief source of plant-based protein and are commonly used in animal feed, dairy, fuel, and oil production. While significant efforts have been directed towards enhancing soybean production, particularly in developing high-yielding varieties to meet escalating demand for soybean-based products in both traditional and organic agriculture, other crucial traits may have been overlooked. Specifically, demand for organic soy products has increased in recent decades, but weed suppression remains a significant challenge for organic producers (Horn and Burnside, 1985; Wang et al., 2014; Leinonen et al., 2019; Lusk, 2022). Crop-weed interference studies highlight the importance of weeds in agriculture as soybean yield loss can reach up to 90% if necessary management practices aren’t in place. Soybean grain yield is impacted by weed species and density (Horn and Burnside, 1985; Silva et al., 2009).
Rapid canopy cover development, or rapid canopy closure, (RCC) is a highly valuable trait for soybean, as it is both strongly associated with yield and enables early-season weed suppression by outcompeting and shading weeds (Peters et al., 1965; Horn and Burnside, 1985; Xavier et al., 2017). Several studies have found that RCC has a positive effect on soybean yields. For example, Xavier et al., (2017) investigated the genetic architecture of RCC and found that this trait is associated with higher grain yields in soybeans (r = 0.87). Additionally, Peters et al., (1965) observed that RCC reduced weed biomass and increased soybean yields in a row spacing experiment. These findings suggest that RCC is an important trait for improving soybean yields and may be particularly advantageous in organic production where weed competition is a challenge.
RCC is primarily related to plant aerial architecture, which encompasses a range of structures including hypocotyl, cotyledon, apical and axillary meristems, and leaves. By providing greater available leaf area sooner after planting, plants with improved RCC can increase solar radiation interception, which is crucial for photosynthesis and ultimately dictates crop growth and yield (Stewart et al., 2003; Edwards and Purcell, 2005; Hatfield and Dold, 2019). Additionally, increased radiation interception by the desired crop plant will shade weeds, potentially inhibiting their germination and growth. Soybean plants that exhibit RCC also benefit from improved water-use efficiency by minimizing water evaporation and enhancing soil moisture retention (Peters et al., 1965). RCC can help increase yields and improve weed management, making this an important area of research for improving sustainability of agricultural systems. Despite the potential advantages of RCC, few causal mechanisms for this developmental trait have been explored (Clark et al., 2022).
Soybean Genome-Wide Association Studies (GWAS) have shown that auxin is important in early establishment of canopy cover (Xavier et al., 2017; Kaler et al., 2018; Li and Chen, 2023). For instance, among seven SNPs significantly associated with RCC, two are found in a locus that contains three auxin related genes (Xavier et al., 2017). Additionally, Kaler et al., (2018) identified 92 RCC-correlated SNPs, at least two of which are directly auxin related, and several more which are auxin responsive. Li and Chen, (2023) hypothesized that a soybean orthology of AtARF7 is involved in RCC. Therefore, auxin related genes are a potential RCC breeding target and worth exploring further.
Auxin is a phytohormone involved in numerous aspects of plant growth and development, including response to biotic and abiotic stresses (Padmanabhan et al., 2005; Sun et al., 2016), root and seed development, apical dominance (Tatematsu et al., 2004; Prigge et al., 2020), leaf longevity and expansion, and plant architecture (Davies, 1995; Lim et al., 2010). The auxin signaling pathway comprises three main gene families that act in concert to modulate transcription of numerous response genes. When auxin levels in a plant cell are low, transcriptional repressors AUXIN/INDOLE-3-ACETIC ACID INDUCIBLE (Aux/IAA) are bound to transcription factors AUXIN RESPONSE FACTOR (ARF) proteins repressing auxin-responsive gene expression through Aux/IAA interaction with TOPLESS/TOPLESS-RELATED (TPL/TPR) co-repressor proteins (Abel and Theologis, 1996; Tiwari et al., 2001; Overvoorde et al., 2005; Weijers et al., 2005; Szemenyei et al., 2008). When auxin accumulates, it acts as a molecular glue increasing the affinity between the members of the TRANSPORT INHIBITOR RESPONSE 1/AUXIN SIGNALING F-BOX (TIR1/AFB) auxin receptors and Aux/IAA repressors, which form auxin co-receptor complexes (Tan et al., 2007). Ultimately, as most TIR1/AFB proteins associate with SKP1-CULLIN-F-box ubiquitin ligase complexes, the Aux/IAAs bound to these complexes are subjected to polyubiquitination, targeting them for proteolysis through the 26S proteasome. Degradation of the Aux/IAAs leads to de-repression of activator ARFs and expression of auxin responsive genes (Gray et al., 2001; Ramos et al., 2001; Zenser et al., 2001; Chapman and Estelle, 2009). Additionally, ARF family proteins which repress instead of activate transcription modulate the strength and specificity of auxin responsive gene expression through several potential mechanisms (Cancé et al., 2022). Based on the expression of a network of upstream transcription factors, the interplay between these three auxin gene families varies in a time- and tissue-dependent manner and is responsible for orchestrating different plant fate and agronomic traits (Cancé et al., 2022).
Auxin signaling genes in soybean have previously been associated with root nodulation and development, as well as flowering (Sun et al., 2016; Cai et al., 2017; Li and Chen, 2023). Moreover, auxin genes have been linked to shoot height in soybean plants, such as up-regulation of GmIAA9 and GmIAA29 leading to internode elongation, GmARF9 promoting first pod height, and a dwarf phenotype being associated with GmIAA27 (Jiang et al., 2018; Su et al., 2022; Zhang et al., 2022). Tuning the function of auxin signaling components in Arabidopsis thaliana has generated predictable alterations in root and shoot growth (Guseman et al., 2015; Moss et al., 2015; Wright et al., 2017; Khakhar et al., 2018). However, perhaps due to the complexity of the auxin signaling network, its interaction with other signaling pathways, and its pleiotropic nature (Davies, 1995; Swarup et al., 2002; Vernoux et al., 2011; Calderón Villalobos et al., 2012; Lavy and Estelle, 2016; Prigge et al., 2020), identification of candidate genes in the auxin signaling pathway governing soybean aerial architecture is still a limiting step to rationally tuning soybean RCC.
Auxin signaling genes are known to play many important roles in Arabidopsis apical meristem development that point to auxin’s involvement in RCC. Perhaps the most notable are the ARF1/2 and ARF3/4 clades of repressor ARFs. Mutants in ARF2 have enlarged rosette leaves and seeds as well as elongated hypocotyls, but at the cost of reduced fertility (Okushima et al., 2005a). arf1/arf2 double mutants have even stronger developmental phenotypes (Okushima et al., 2005b). Variants affecting ARF3/ETTIN yield pleiotropic effects on leaf and flower development as well as abnormal phyllotaxy (Nishimura et al., 2005; Pekker et al., 2005). ARF3 and ARF4 are regulated by trans-acting siRNAs which, when disrupted, lead to changes in the progressive leaf shape from round, flat juvenile leaves to oblong, downward curling (epinastic) adult leaves, also known as heteroblasty (Hunter et al., 2006). Consistent with this association between relief of auxin response gene repression and increased growth of aerial tissues, mutants in the activators ARF6 and ARF8 result in dwarfing of aerial tissues (Nagpal et al., 2005; Okushima et al., 2005b). These ARFs are similarly small-RNA-regulated, in this case by miRNA167. Additionally, arf7/arf19 double mutant plants are of small stature, but also have several detrimental root phenotypes, exhibiting pleiotropy (Okushima et al., 2005b).
In Arabidopsis, auxin perception via TIR1/AFB–auxin–Aux/IAA interaction is less clearly associated with RCC related traits than some arf phenotypes noted above. TIR1/AFB and Aux/IAA mutants are more commonly associated with root traits, such as formation of lateral roots, but still there is evidence for their regulation of apical dominance and meristematic tissues, as well as leaf longevity and other above-ground developmental processes (Dharmasiri et al., 2005; Parry et al., 2009; Lim et al., 2010; Salehin et al., 2015). The six TIR1/AFB auxin receptor F-box genes have overlapping functions and are expressed and accumulated in growing organs related to RCC in Arabidopsis, such as shoot apical meristem (SAM) and leaf primordia (Parry et al., 2009). Mutants in two or more of the TIR1/AFB genes of Arabidopsis become increasingly dwarfed (Prigge et al., 2020). In the Arabidopsis Aux/IAA family there is more evidence for tissue-specificity in expression and function (Overvoorde et al., 2005). For instance, IAA3 preferentially regulates ARF7 and ARF19 during root development, whereas during leaf expansion and hypocotyl tropic responses these same ARFs are modulated by IAA19 and IAA28 (Wilmoth et al., 2005). However, loss-of-function mutants in Aux/IAA genes show subtle or no phenotypes, likely due to redundancy or compensation within this large gene family (Nagpal et al., 2000; Tian et al., 2002; Overvoorde et al., 2005).
We propose to leverage the existing knowledge of auxin signaling and associated traits in Arabidopsis and other model species as a foundation for trait engineering in soybean. Through transcriptomic analysis we identify the auxin-signaling genes which are most specifically expressed in tissues involved in early canopy development, RCC-specific genes. Using a Bayesian phylogenetics approach we identified orthology groups of auxin signaling genes, and examined comparative evolutionary evidence that these RCC-specific genes shape the aerial architecture of soybeans. As soybeans have undergone several additional genome duplications relative to Arabidopsis, we expect that some soybean paralogs will exhibit more tissue specificity in expression and less pleiotropy. A similar approach to ours was used to examine the evolutionary developmental relationships between Arabidopsis and Zea mays auxin signaling components (Matthes et al., 2019).
This method allowed us to identify which of the numerous orthologues of the auxin gene families in soybeans are likely involved in RCC and are minimally expressed in other tissues. We identified orthologous groups of TIR1/AFB, Aux/IAA, and ARF genes from Arabidopsis and several Fabaceae species, and defined an ortholog-based naming system for these Glycine max genes to help facilitate evolutionary comparisons. We then performed an expression analysis based on our hypothesis that these auxin signaling genes that are highly and specifically expressed in apical tissues and early development will have the greatest effect on RCC development (RCC-related tissues). Auxin signaling genes are responsible for many developmental processes in plants, thus engineering RCC through manipulation of auxin signaling may result in pleiotropic effects on plant growth and development. To avoid this pitfall, we propose to target genes associated specifically with RCC tissues, as identified via principal component analysis. As a result of phylogenetic and transcriptomic analyses, we identified several candidate auxin-signaling genes that potentially affect RCC. Several soybean orthologs of Arabidopsis ARF2, ARF8, and ARF9 were found to be expressed with high specificity in RCC-related tissues. We also identified a selection of Aux/IAA and TIR1/AFB candidate genes. Aux/IAA genes have the highest tissue specificity in soybeans of the auxin signaling gene families, corroborating the existing body of literature of spatial expression analysis in other species. These findings suggest promising RCC candidate genes for further exploration at both the molecular and organismal levels. Future experiments will be necessary to assess the phenotypic variation in RCC, yield, and other traits associated with allelic variation in these candidate genes. Additionally, further development of this and other algorithms for identifying candidate genes involved in valuable phenotypic traits that may be paired with gene editing techniques to rationally increase phenotypic diversity and accelerate crop breeding.
Methods
Sequence collection
Seven A. thaliana AFB, twenty-three ARF, and twenty-nine Aux/IAA amino acid sequences from (Hamm et al., 2019) were used in sequence retrieval through the BSgenome.Athaliana.TAIR.TAIR9 and r1001genomes R packages (Hamm et al., 2019; R Core Team, 2023). The peptide sequences were used in the initial Basic Local Alignment Search Tool (BLAST) against the Glycine max (assembly Wm82.a4.v1), Glycine soja (assembly Gsoja_v1_1), Medicago truncatula (assembly Mtruncatula_Mt4_0v1), Lotus japonicus (assembly Ljaponicus_Lj1_0v1), as well as Arabidopsis thaliana (assembly Athaliana_Araport11) genome databases in Phytozome V13 (Goodstein et al., 2012). Peptide sequences with an E-value less than or equal to 1E–50 were used for analysis. ARF and Aux/IAA sequences were manually separated in some cases according to their length, and the presence of a “QVVGWPPv/i” canonical Aux/IAA degron or B3 ARF DNA binding domain. Retrieved peptide sequences in the ARF search containing less than 400 base pairs (bp) or containing auxin canonical degron were removed from the fasta file.
Sequence alignment
Amino acid (AA) sequence alignment was performed using the function AlignSeqs from DECIPHER 2.24.0 R package (Wright, 2015) following default parameters. The alignment was built according to a similarity tree based on pairwise distinction of shared AA sequences. Two iterations followed the three built in which sequences were re-aligned to the three until convergence was reached. Finally, there was a refinement step in which portions of the alignment were re-aligned to the remnant of the alignment where two alignments were generated and the one that reached convergence with the best sum-of-pairs score was kept (Wright, 2015). Ultimately, we accounted for low information portions of the alignment due to highly variable and/or gap regions by applying the MaskAlignment function in order to remove those regions. All settings, except for windowSize equals to 6 in MaskAlignment, followed default recommendations.
Phylogenetic analysis
A nexus file was written from masked sequences using write.nexus.data function from ape’s R package version 5.6-2 (Maddison et al., 1997) for building the phylogeny trees. We then built phylogenies on MrBayes v3.2 software (Ronquist et al., 2012) based on the provided peptide sequences in the nexus file of the homologous proteins of AtAFB, AtARF, and AtAux/IAA family members for G. max, G. soja, M. truncatula, and L. japonicus. We defined AtCOI1, AtARF17, and AtIAA33 as outgroups to build AFB, ARF, and IAA Bayesian Markov chain Monte Carlo (MCMC) phylogenies, respectively. The likelihood model was defined using lset command with nucleotide substitution model set to protein and rates considered a gamma distribution. The prior probability for the evolutionary model was defined using a fixed protein model (Jones model) and the proposal probability set to zero. The posterior probabilities of the phylogenetic trees were calculated based on the MCMC parameters: for TIR1/AFBs we used a critical value for topological convergence diagnostic of 0.01, 6 chains, and the Markov chain was sampled at every 100 cycles, additionally one quarter of the total samples were discarded when convergence diagnostic was calculated. To explore the possible model parameter space more efficiently and enable model convergence the following parameters were changed for ARF and Aux/IAA phylogenies. For the ARFs, the sample frequency was increased to 10000 cycles, number of runs set to 2, minimum frequency partition set to 0.05 and number of chains equal to 8. Finally, for Aux/IAAs we followed the same parameters as for ARFs, except that we increased the number of chains to 12. Ultimately, phylogeny visualizations and annotations were drawn using ggtree and ggplot2 R packages (Wickham, 2016). Ortholog analysis based on the resulting phylogenies was used to assign A. thaliana ortholog names for each G. max gene. Supplementary Table S1 provides a correspondence table of ortholog names to Wm82.a4.v1 gene IDs.
Expression analysis data
RNA-seq raw data from NCBI project PRJNA241144, containing eleven soybean tissues, were downloaded from http://www.ncbi.nlm.nih.gov/sra/?term=SRP040057 and three other tissues were downloaded from Soybase (https://soybase.org/soyseq/tables_lists/index.php). Soybean open flower (OF), inflorescence before and after meiosis (IBM and IAM), callus, hypocotyl, cotyledon, root tip, axillary meristem (AM), as well as shoot apical meristem at 6, 17, and 38 days (SAM6D, SAM17D, and SAM38D) were obtained from NCBI, whereas root, young leaf and nodule tissues raw data in Soybase. RNA-seq data was used for tissue-specific analysis using Galaxy (https://usegalaxy.org/) Salmon quant tool. The raw gene expression counts were normalized to Transcripts Per Million (TPM), allowing the comparison of gene expression between samples. The normalized data from Salmon quant was then plotted in R using the pheatmap function from ggtree version 3.4.1 (Yu, 2022). The heatmap was built using median expression across all tissues equal or greater than 2, and normalized gene expression. Normalization was performed according to the following formula:
where, z is the standard score, x is the observed gene expression, μ is the mean gene expression, and σ is standard deviation of gene expression.
To further analyze and identify which genes contribute to rapid canopy cover related tissues we used the principal component analysis (PCA) unsupervised method. PCA of the gene expression were calculated using the prcomp function of the stats R package version 4.2.C (R Core Team, 2023). Parameters used for prcomp included center and scale set to true, meaning that the result is a correlation-based PCA. PCA retrieves loading segments through the linear combination of the gene expression values, thus reducing the dimensions of the data set. Additionally, PCA can be used to identify similarities and dissimilarities between genes and their contribution to each principal component and its respective loadings or eigenvectors. The dataset used in the PCA were all transcripts for which the median expression value for the fourteen tissues in question were equal or greater than 2, resulting in a total of 133 transcripts well expressed. PCA presented in this study show the predicted genes for the fourteen tissues, yet we show in supplemental data a PCA pertinent to the seven tissues important in aerial growth. PCA plots were built using the ggbiplot function of the ggbiplot R package version 0.55 (Vu and Friendly, 2024). Parameters used for ggbiplot included an ellipse set to true and ellipse.prob set to 70% confidence interval. Ellipses were used as a visual representation of gene expression (data points) dispersion within each group in the PCA. Additionally, ellipses are drawn based on the covariance structure of gene expression for each group, meaning that size and orientation of the ellipses are determined by the covariance matrix.
To further validate our analysis and provide additional information, we also calculated the tissue specificity index (tau) (Yanai et al., 2005; Kryuchkova-Mostacci and Robinson-Rechavi, 2017), using normalized gene expression data of the 133 transcripts:
Here, n represents the number of tissues, is the normalized expression of a gene in tissue i relative to the maximal expression values across all i tissues, and is the expression of a gene for each individual tissue, i.
Finally, we also tested for differences between gene family groups using the Kruskal-Wallis test with the R function kruskal.test. We tested the following hypotheses:
● H0: The three families are equal in terms of tau.
● H1: At least one gene family is different from the other two families in terms of tau.
Based on the Kruskal-Wallis test results, we conducted further analysis using pairwise post hoc tests to identify which groups were significantly different from one another. Specifically, we used the Wilcoxon test (with the pairwise.wilcox.test function) and the Dunn test (using the ggbetweenstats function from the ggstatsplot package (Patil, 2021).
Results
Phylogenetic analysis of TIR1/AFB co-receptors and proposed orthology based on A. thaliana classification
To facilitate discussion of comparative evolutionary and developmental roles of the nuclear auxin signaling gene families, we propose a nomenclature for G. max auxin signaling genes using a comparative phylogenetic approach with A. thaliana. This nomenclature aims to enhance the prediction of gene and protein functions in G. max by leveraging the extensive gene function knowledge available in A. thaliana. Several evolutionary and developmental comparative studies have shown that genes that share sequence similarity, and therefore fall within the same clade in a phylogeny, are broadly predicted to have similar function (Zhou et al., 2013; Hyung et al., 2014; Husbands et al., 2015; Damodharan et al., 2018; Zhang et al., 2021). Although comparative approaches have been used to identify and predict G. max gene function, little is known about the role of auxin signaling in G. max aerial architecture. In A. thaliana several auxin signaling genes are associated with unique aerial phenotypes of their mutants (Dharmasiri et al., 2005; Parry et al., 2009; Zhou et al., 2013; Husbands et al., 2015; Damodharan et al., 2018; Zhang et al., 2021). Therefore, we have assigned ortholog names for each G. max auxin signaling gene based on their phylogenetic placement in clades with A. thaliana genes, e.g. GmTIR1/AFB1_A is more closely related to (shares more sequence similarity with) AtTIR1 and AtAFB1 than other members of the A. thaliana TIR1/AFB family.
G. max has undergone two whole-genome duplications. The first corresponds to the early legume-duplication, which occurred approximately 59 million years (Myr) ago. The second duplication is Glycine-specific and happened around 13 Myr ago (Schmutz et al., 2010). As a result, G. max typically possesses more than one copy of each A. thaliana ortholog (Figures 1–3). Because of this, we have assigned letters to differentiate between G. max orthologs for each clade. Additionally, to strengthen our classifications of these G. max gene families and provide some additional context of these clades in the Fabaceae, we have also included other well studied legume species G. soja, M. truncatula, and L. japonicus.
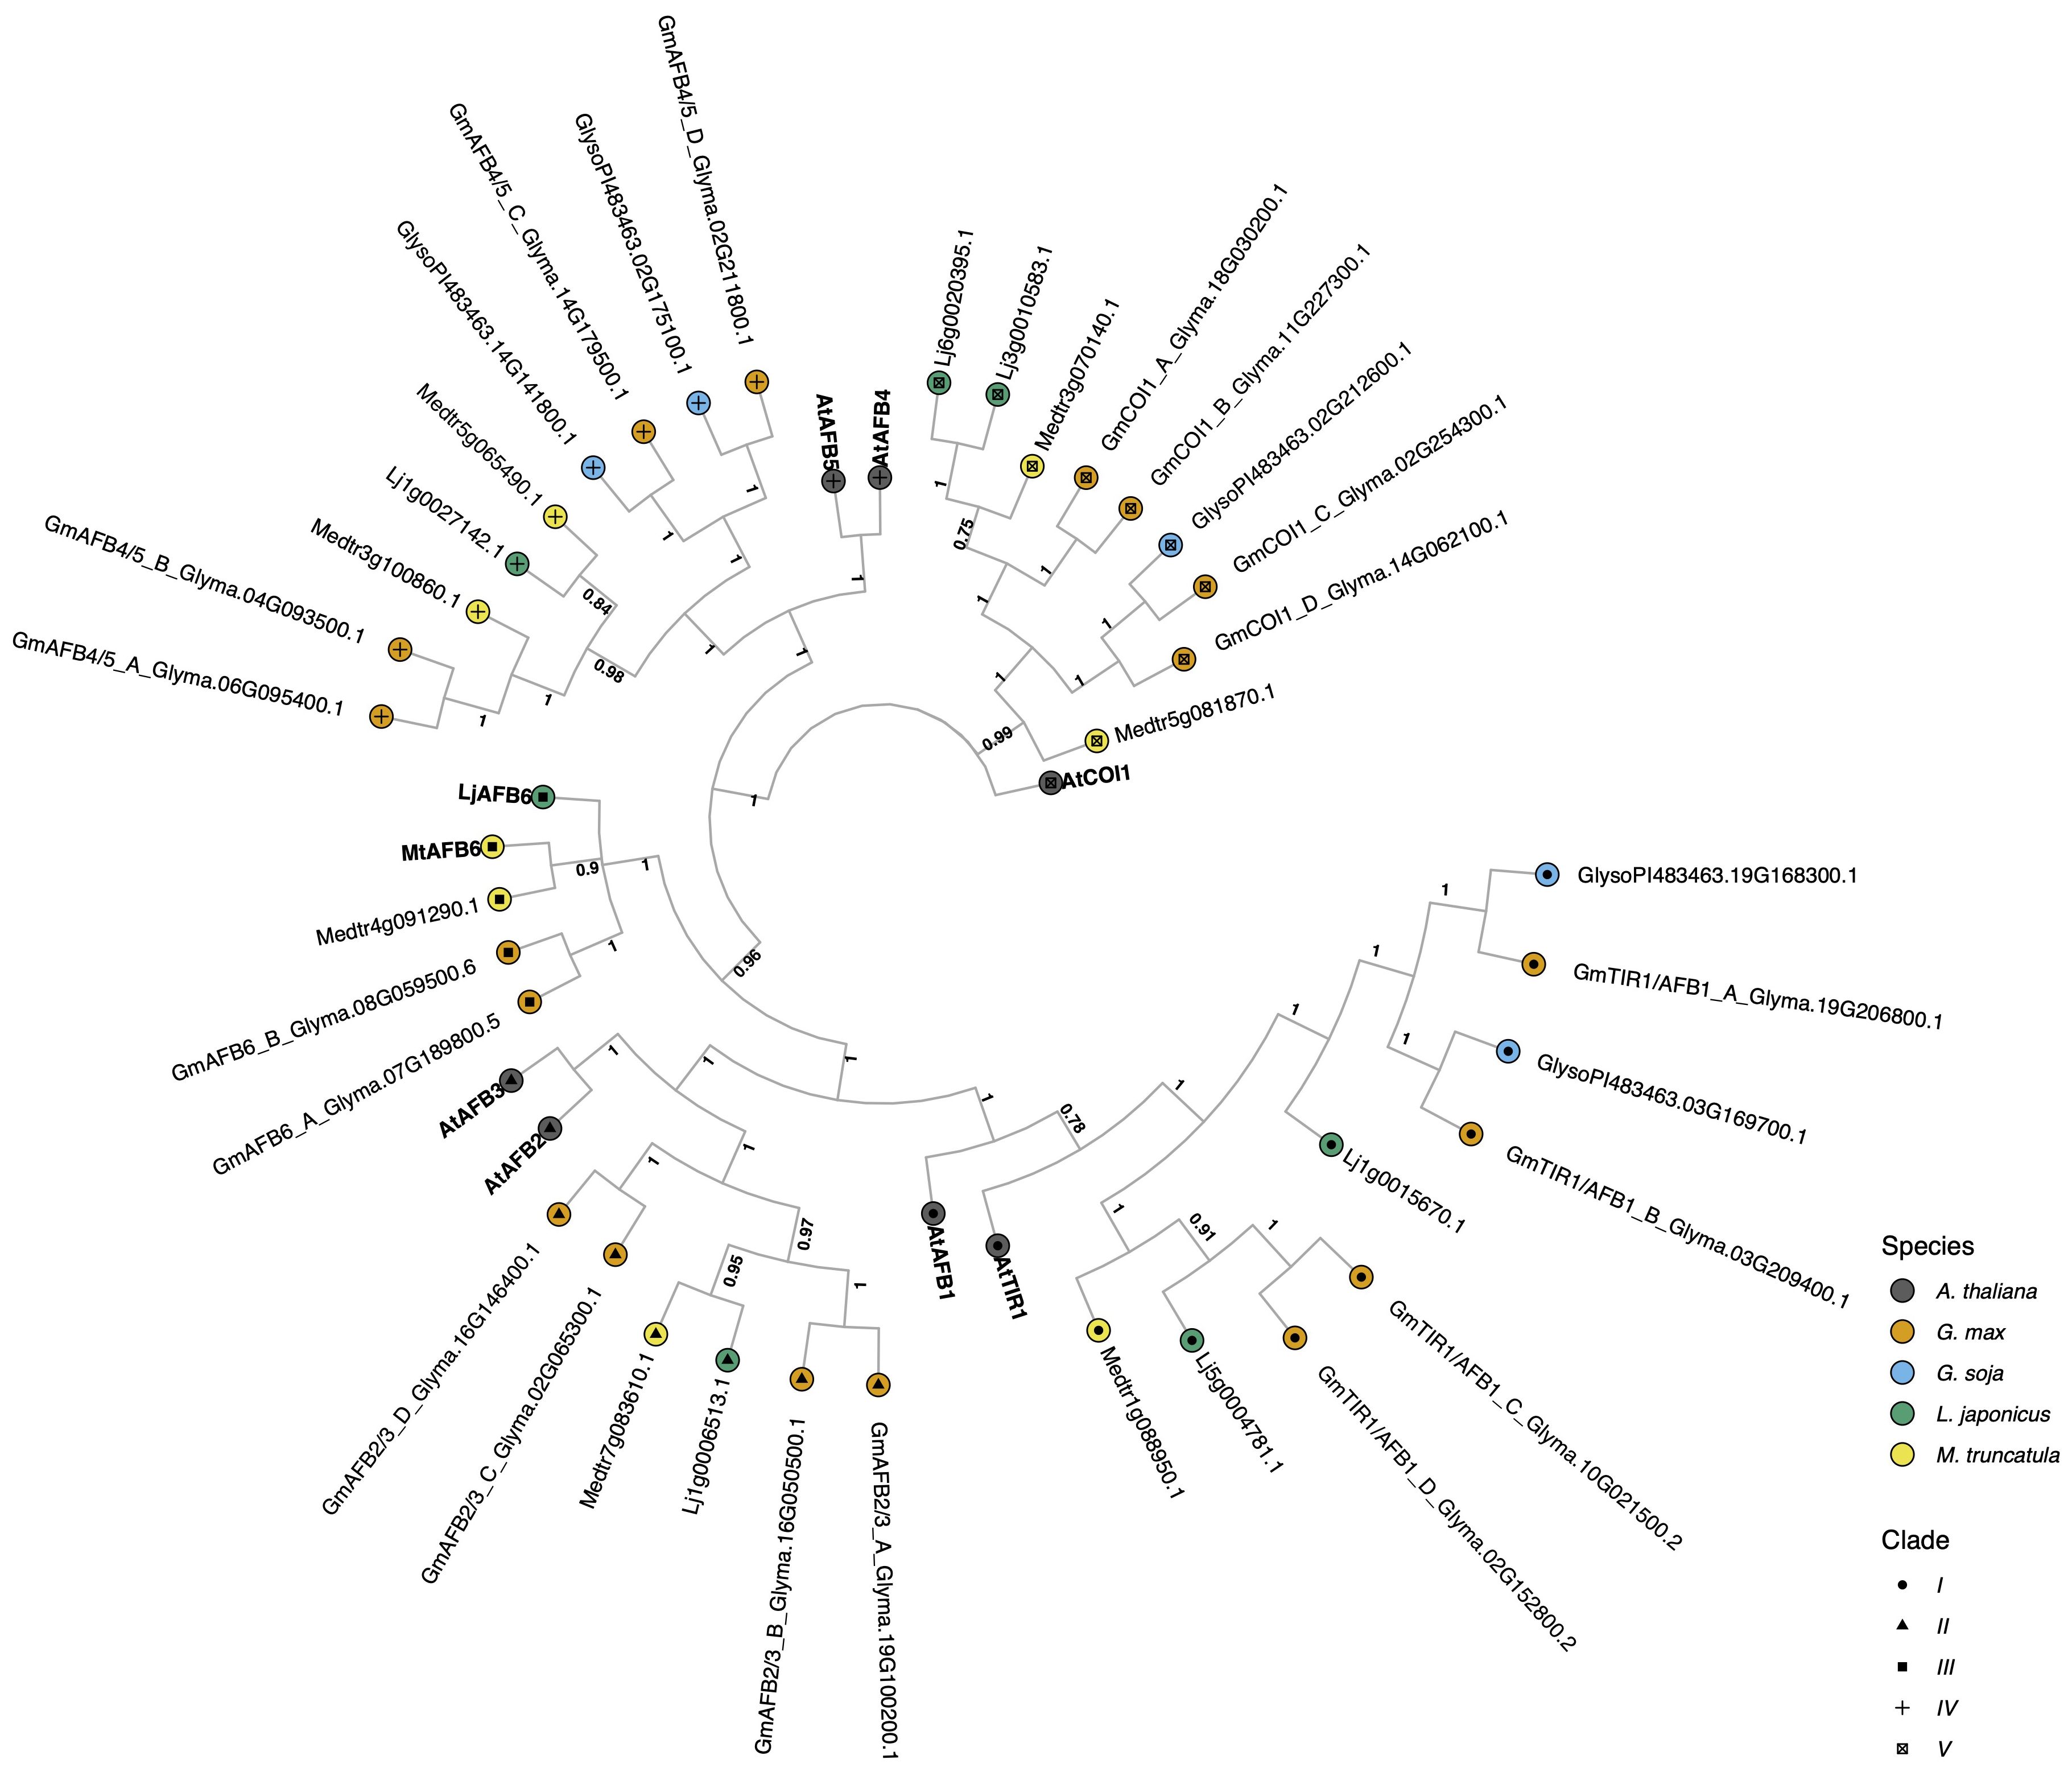
Figure 1. The evolutionary relationships between G. max TIR1/AFB proteins, and A. thaliana and other legume species orthologs. The historical relationship was inferred using MrBayes (Ronquist et al., 2012). The optimal tree was drawn according to the posterior probability of the evolutionary distances. The posterior probability of each node is labeled. Each tip is colored according to species, with A. thaliana in black, G. max in orange, G. soja in light blue, L. japonicus in green, and M. truncatula in yellow. A. thaliana gene symbols are displayed in bold to better visualize clade separation. Clades are also defined by the symbols inside the tips, with clade I as a circle, clade II as a triangle, clade III as a square, clade IV is a ‘+’ sign, and clade V as a boxed x. G. max genes were named according to their orthology to A. thaliana and gene ID.
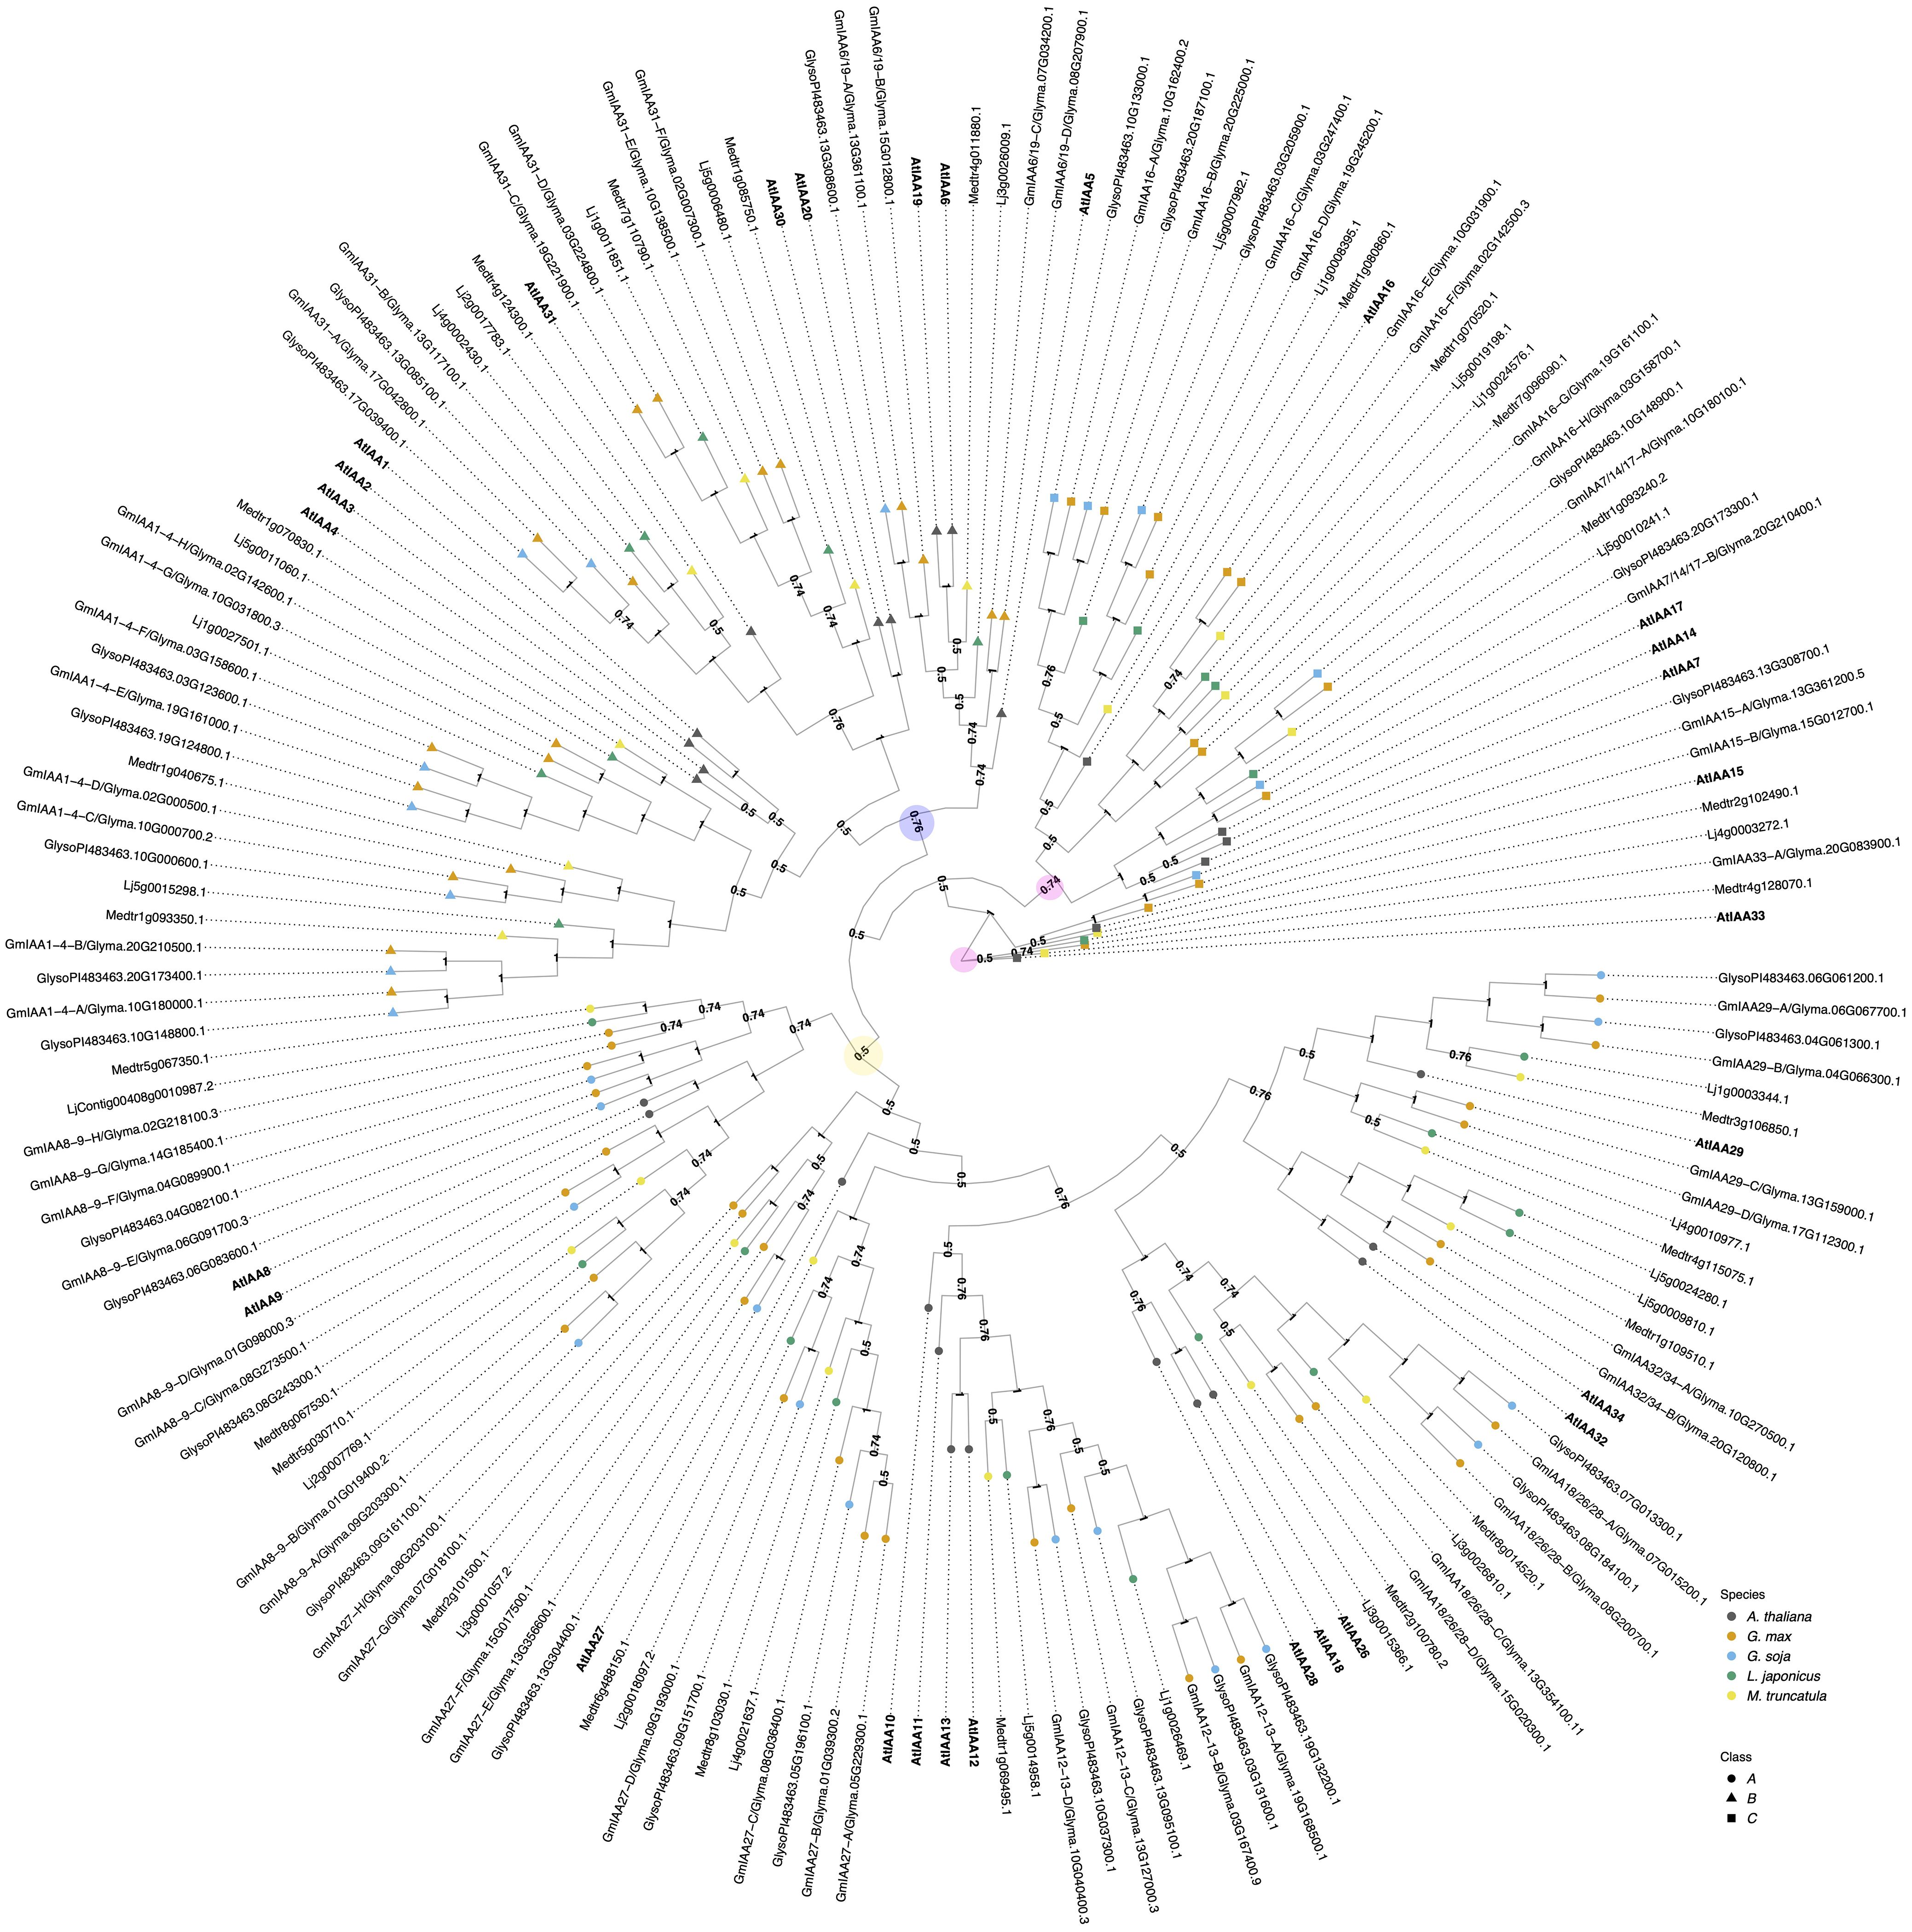
Figure 2. The evolutionary relationships between G. max Aux/IAA proteins, A. thaliana and other legume species orthologs. The historical relationship was inferred using the MrBayes (Ronquist et al., 2012). The optimal tree is drawn according to the posterior probability of the evolutionary distances. The posterior probability of each node is labeled. Each tip is colored according to species, with A. thaliana in black, G. max in orange, G. soja in light blue, L. japonicus in green, and M. truncatula in yellow. A. thaliana gene symbols are displayed in bold to better visualize assigned orthology. Aux/IAAs co-receptors are divided here into three classes: class A, represented as a circle; Class B, represented as a triangle, and class C, represented as a square. G. max genes were named according to both their orthology to A. thaliana and gene ID. Nodes are labeled with their supporting probabilities in the center. There are three defined clades, each highlighted with a colored circle. Clade I is marked in yellow, Clade II in blue, and Clade III in light pink. The light pink circles indicate the start of the root and the second defining point, showing that the remaining groups of genes belong to Clade III.
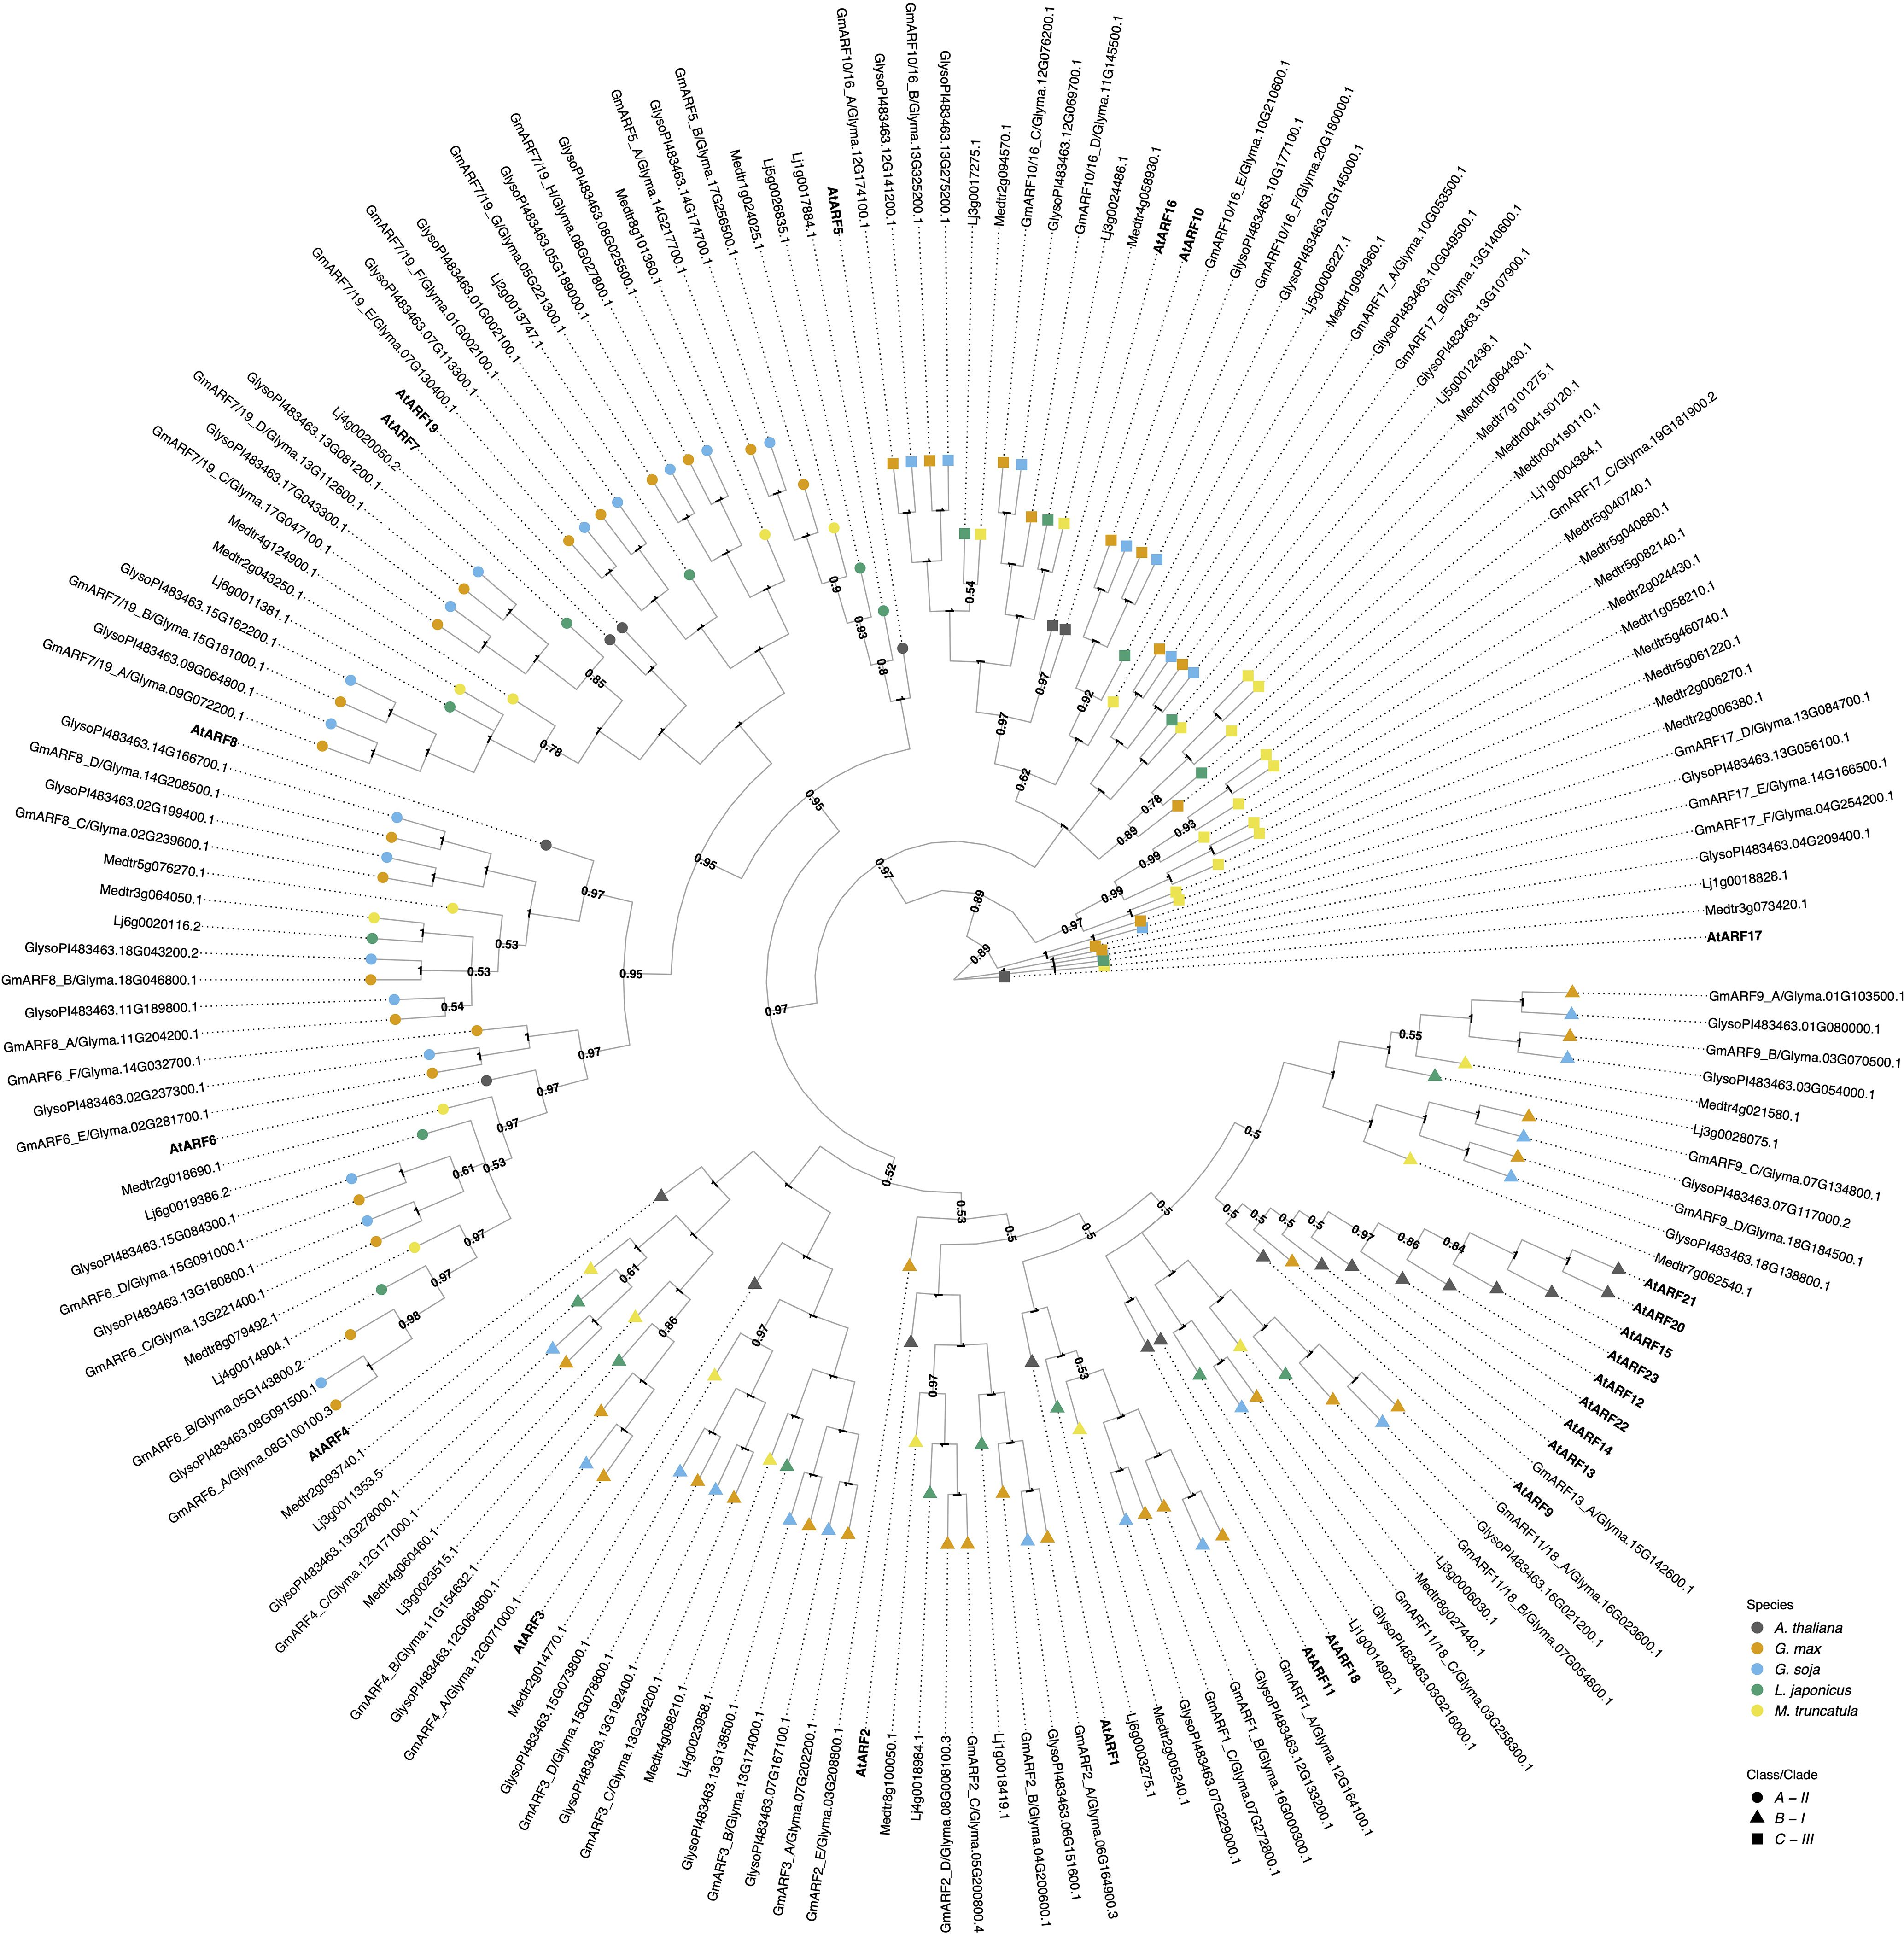
Figure 3. The evolutionary relationships between G. max ARFs proteins, A. thaliana and other legume species orthologs. The historical relationship was inferred using Bayesian Inference (Ronquist et al., 2012). The optimal tree is drawn according to the posterior probability of the evolutionary distances. The posterior probability of each node is labeled. Each tip is colored according to species, with A. thaliana in dark grey, G. max in orange, G. soja in light blue, L. japonicus in green, and M. truncatula in yellow. A. thaliana gene symbols are displayed in bold to better visualize assigned orthology. ARFs are divided here into three classes/clades (Ulmasov et al., 1999; Finet et al., 2013): Class A - II, represented as a circle; Class B - I, represented as a triangle, and class C - III, represented as a square. G. max orthologs were named according to both their orthology to A. thaliana and gene ID.
The fourteen G. max TIR1/AFB auxin receptors identified were grouped into five main clades. Clade I, which has the least similarity to the COI1 (Coronatine Insensitive 1) jasmonate receptor outgroup, comprises A. thaliana TIR1-like proteins, with a posterior probability of 0.78 (the lowest probability found in the resulting tree) to its G. soja, M. truncatula, L. japonicus, and G. max orthologs. This clade consists of four G. max proteins GmTIR1/AFB1_A–D, of which only two (GmTIR1/AFB1_A and B) have a G. soja sister taxa, the other sister taxa were lost in G. soja (Figure 1). Interestingly this A/B subclade contains a L. japonicus taxa but is missing a M. truncatula taxa, suggesting a complex pattern of recent gene loss events in this clade. Clade II, consists of AFB2/AFB3-like proteins and also contains four G. max representatives but does not contain any G. soja and only one representative each from M. truncatula and L. japonicus (Figure 1). Clade III, is comprised by the AFB6-like proteins, Medtr8g098695.2 and Lj4g0012889.1 defined in (Rogato et al., 2021) and, according to (Parry et al., 2009) this clade was lost during the evolution of the Brassicaceae (A. thaliana family) and Poaceae families. We identified two G. max AFB6 orthologs. Interestingly, G. soja, G. max’s wild relative, lacks orthologs for both clades II and III, whereas M. truncatula and L. japonicus are both represented. Clade IV, AFB4/AFB5-like proteins, contains four G. max proteins, of which again only two have a corresponding G. soja sister as with TIR1/AFB1-like clade I. Lastly, clade V, comprises COI1-like F-box proteins, with four G. max homologs and only one representative sister in G. soja. The difference in number of genes between cultivated soybean, G. max, and its wild relative, G. soja is also in accordance with comparative genomics published data in which cultivated soybean has many unique genes that are unavailable in its wild relative (Joshi et al., 2013 and references therein). All the G. max orthologs here identified contain all the necessary functional domains to perceive auxin and associate with the SCF E3 ligase complex necessary for the turnover of Aux/IAA transcriptional repressors and auxin-mediated transcriptional response (Supplementary Figure S4; Appendix A in Supplementary Data Sheet 2).
Phylogenetic analysis of Aux/IAA co-receptors and proposed orthology based on A. thaliana classification
Relative to the TIR1/AFB family, both the Aux/IAA and ARF families are far more numerous in all plants. Additionally, both have been more broadly studied in previous phylogenetic analyses. However, the names assigned to G. max genes/proteins are often not defined by orthology, making comparative inference difficult. To facilitate such analysis here and in the future, we have assigned G. max gene names for these families according to their orthology to A. thaliana (Supplementary Table S1).
The G. max Aux/IAA gene family contains sixty-one members. According to our inferred phylogeny, they are classified into three main groups: I, II, and III. This structure differs from the two main clades observed by (Hamm et al., 2019), while largely maintaining the same branch sister structure. Additionally, they are classified into three previously defined classes: A, B, and C. Classes A and B are paraphyletic when aligning A. thaliana genes alone and have conserved structural domains such as PB1, EAR motif, and degron domains. In contrast, class C genes lack one or more of these functional domains in their protein-coding sequences (Remington et al., 2004; Hamm et al., 2019) (Figure 2; Appendix B in Supplementary Data Sheet 2).
Clade I is composed of orthologs of AtIAA8/9/10/11/12/13/18/26/27/28/32/34, with at least two representatives in G. max. In contrast, its wild relative, G. soja, has one representative sister for each GmIAA10-13 but lacks at least one sister in the remaining G. max orthologous groups. AtIAA8/9/27 belong to class A, AtIAA10/11/12/13/28 to class B, and AtIAA32/34 to class C (Figure 2).
Clade II, which consists of orthologs of AtIAA1/2/3/4/5/6/19/20/30/31, is distributed similarly to Clade I. However, all orthologous groups are missing at least one sister in G. soja. AtIAA1/2/3/4/5/6/19 are classified as class A Aux/IAAs, AtIAA20/30 belong to class B, and AtIAA31 belongs to class C. Classes A and B are structured within the same clade as observed by (Hamm et al., 2019). AtIAA31, along with AtIAA20/30 previously mentioned as part of Clade I, are clustered in our results within Clade II (Figure 2). This clustering shows slight differences compared to (Hamm et al., 2019) and (Remington et al., 2004). These differences are likely due to the complexity of our multi-species phylogeny.
Clade III is composed by AtIAA7/14/15/16/17/33 orthologs (Figure 2). AtIAA33 was defined as the root of our phylogeny. AtIAA7/14/15/16/17 belongs to class A, and AtIAA33 to class C. There are two G. max orthologs of AtIAA7/14/17, and each of them has an ortholog in G. soja. In contrast, orthologs of AtIAA15 and 33, have only one G. max ortholog. The GmIAA15 has one G. soja ortholog, but GmIAA33 does not have a G. soja ortholog. Although most species do have a representative, due to its paleopolyploidy, G. max has the most abundant number of Aux/IAAs when compared to other species analyzed here. In particular, the IAA16 orthology group contains eight G. max orthologs in two subclades of four, one sharing a more recent common ancestor with AtIAA16.
Phylogenetic analysis of ARFs transcriptional factors and proposed orthology based on A. thaliana classification
The ARF gene family in G. max includes fifty-five members which can be separated into three functional classes, based on previous work with the Arabidopsis (Ulmasov et al., 1999; Tiwari et al., 2003; Finet et al., 2013; Le et al., 2016). Class A ARFs are likely transcriptional activators and orthologous to AtARF5/6/7/8/19 (Figure 3). The protein sequences of activator ARFs contain a glutamine-rich middle region that is associated with their transcriptional activation properties (Appendix C). Class A activator ARFs can be found under clade II.
Class B ARFs are traditionally defined as transcriptional repressors having a serine-rich middle region and comprise a large clade containing AtARF1/2/3/4/9/11/12/13/14/15/18/20/21/22/23. They are found under clade I. Finally, class C, also traditionally classified as transcriptional repressors, contains AtARF10/16/17 and is nearest the root of the tree (Figure 3) (Ulmasov et al., 1999; Finet et al., 2013). This is likely as the split between class C ARFs and A/B ARFs existed before the evolution of land plants (Ulmasov et al., 1999; Finet et al., 2013; Flores-Sandoval et al., 2018; Mutte et al., 2018). Class C repressor ARFs can be found under clade III.
As a result of G. max paleopolyploidy the majority of orthology groups have at least three G. max genes per corresponding A. thaliana ortholog (Figure 3). Additionally, all orthologs of ARF3, 8, 9, 10, 16, 7, and 19 G. max proteins have G. soja sisters, whereas the others lack at least one sister taxa in the wild relative. Interestingly, M. truncatula has ten orthologs of the class C AtARF17, which is the outgroup in our analysis. Five of these orthologs are on chromosome 5, suggesting this expansion is perhaps due to tandem duplications. Similarly in A. thaliana ARF9, 12, 13, 14, 15, 20, 21, 22, and 23 likely resulted from tandem duplication events, and the legumes have many fewer genes in this clade, following the more typical pattern of whole genome duplication events (Remington et al., 2004).
Expression analysis and identification of auxin signaling targets for RCC development in G. max
First, we present our expression analysis using principal component analysis (PCA) with gene names presented as ortholog names from our phylogenetic analysis, below. Tissue-level gene expression data was retrieved from both (Wang et al., 2014; van Dijk et al., 2021) and SoyBase (further defined in the “Expression analysis data” section in methodology). A total of 133 of the 221 total transcripts for the combined TIR1/AFB, Aux/IAA, and ARF gene families displayed median expression equal to or greater than 2 TPM across all tissues (including open flower (OF), inflorescence before and after meiosis (IBM and IAM), callus, hypocotyl, cotyledon, root tip, axillary meristem (AM), shoot apical meristem at 6, 17, and 38 days (SAM6D, SAM17D, and SAM38D), root, young leaf and nodule tissues). The 133 transcripts were further evaluated through PCA (using the R built in function prcomp from stats package) and tissue specificity index analysis (tau) (Yanai et al., 2005) in order to identify which auxin regulatory genes are most specifically associated with certain RCC tissues. The first two principal components (PCs) account for 51.1% and 18.7%, respectively, of the total variation in gene expression (Figure 4). Therefore, the two-dimensional scatter-plot of the 133 given transcripts shown in Figure 4 represents 69.8% of total variation.
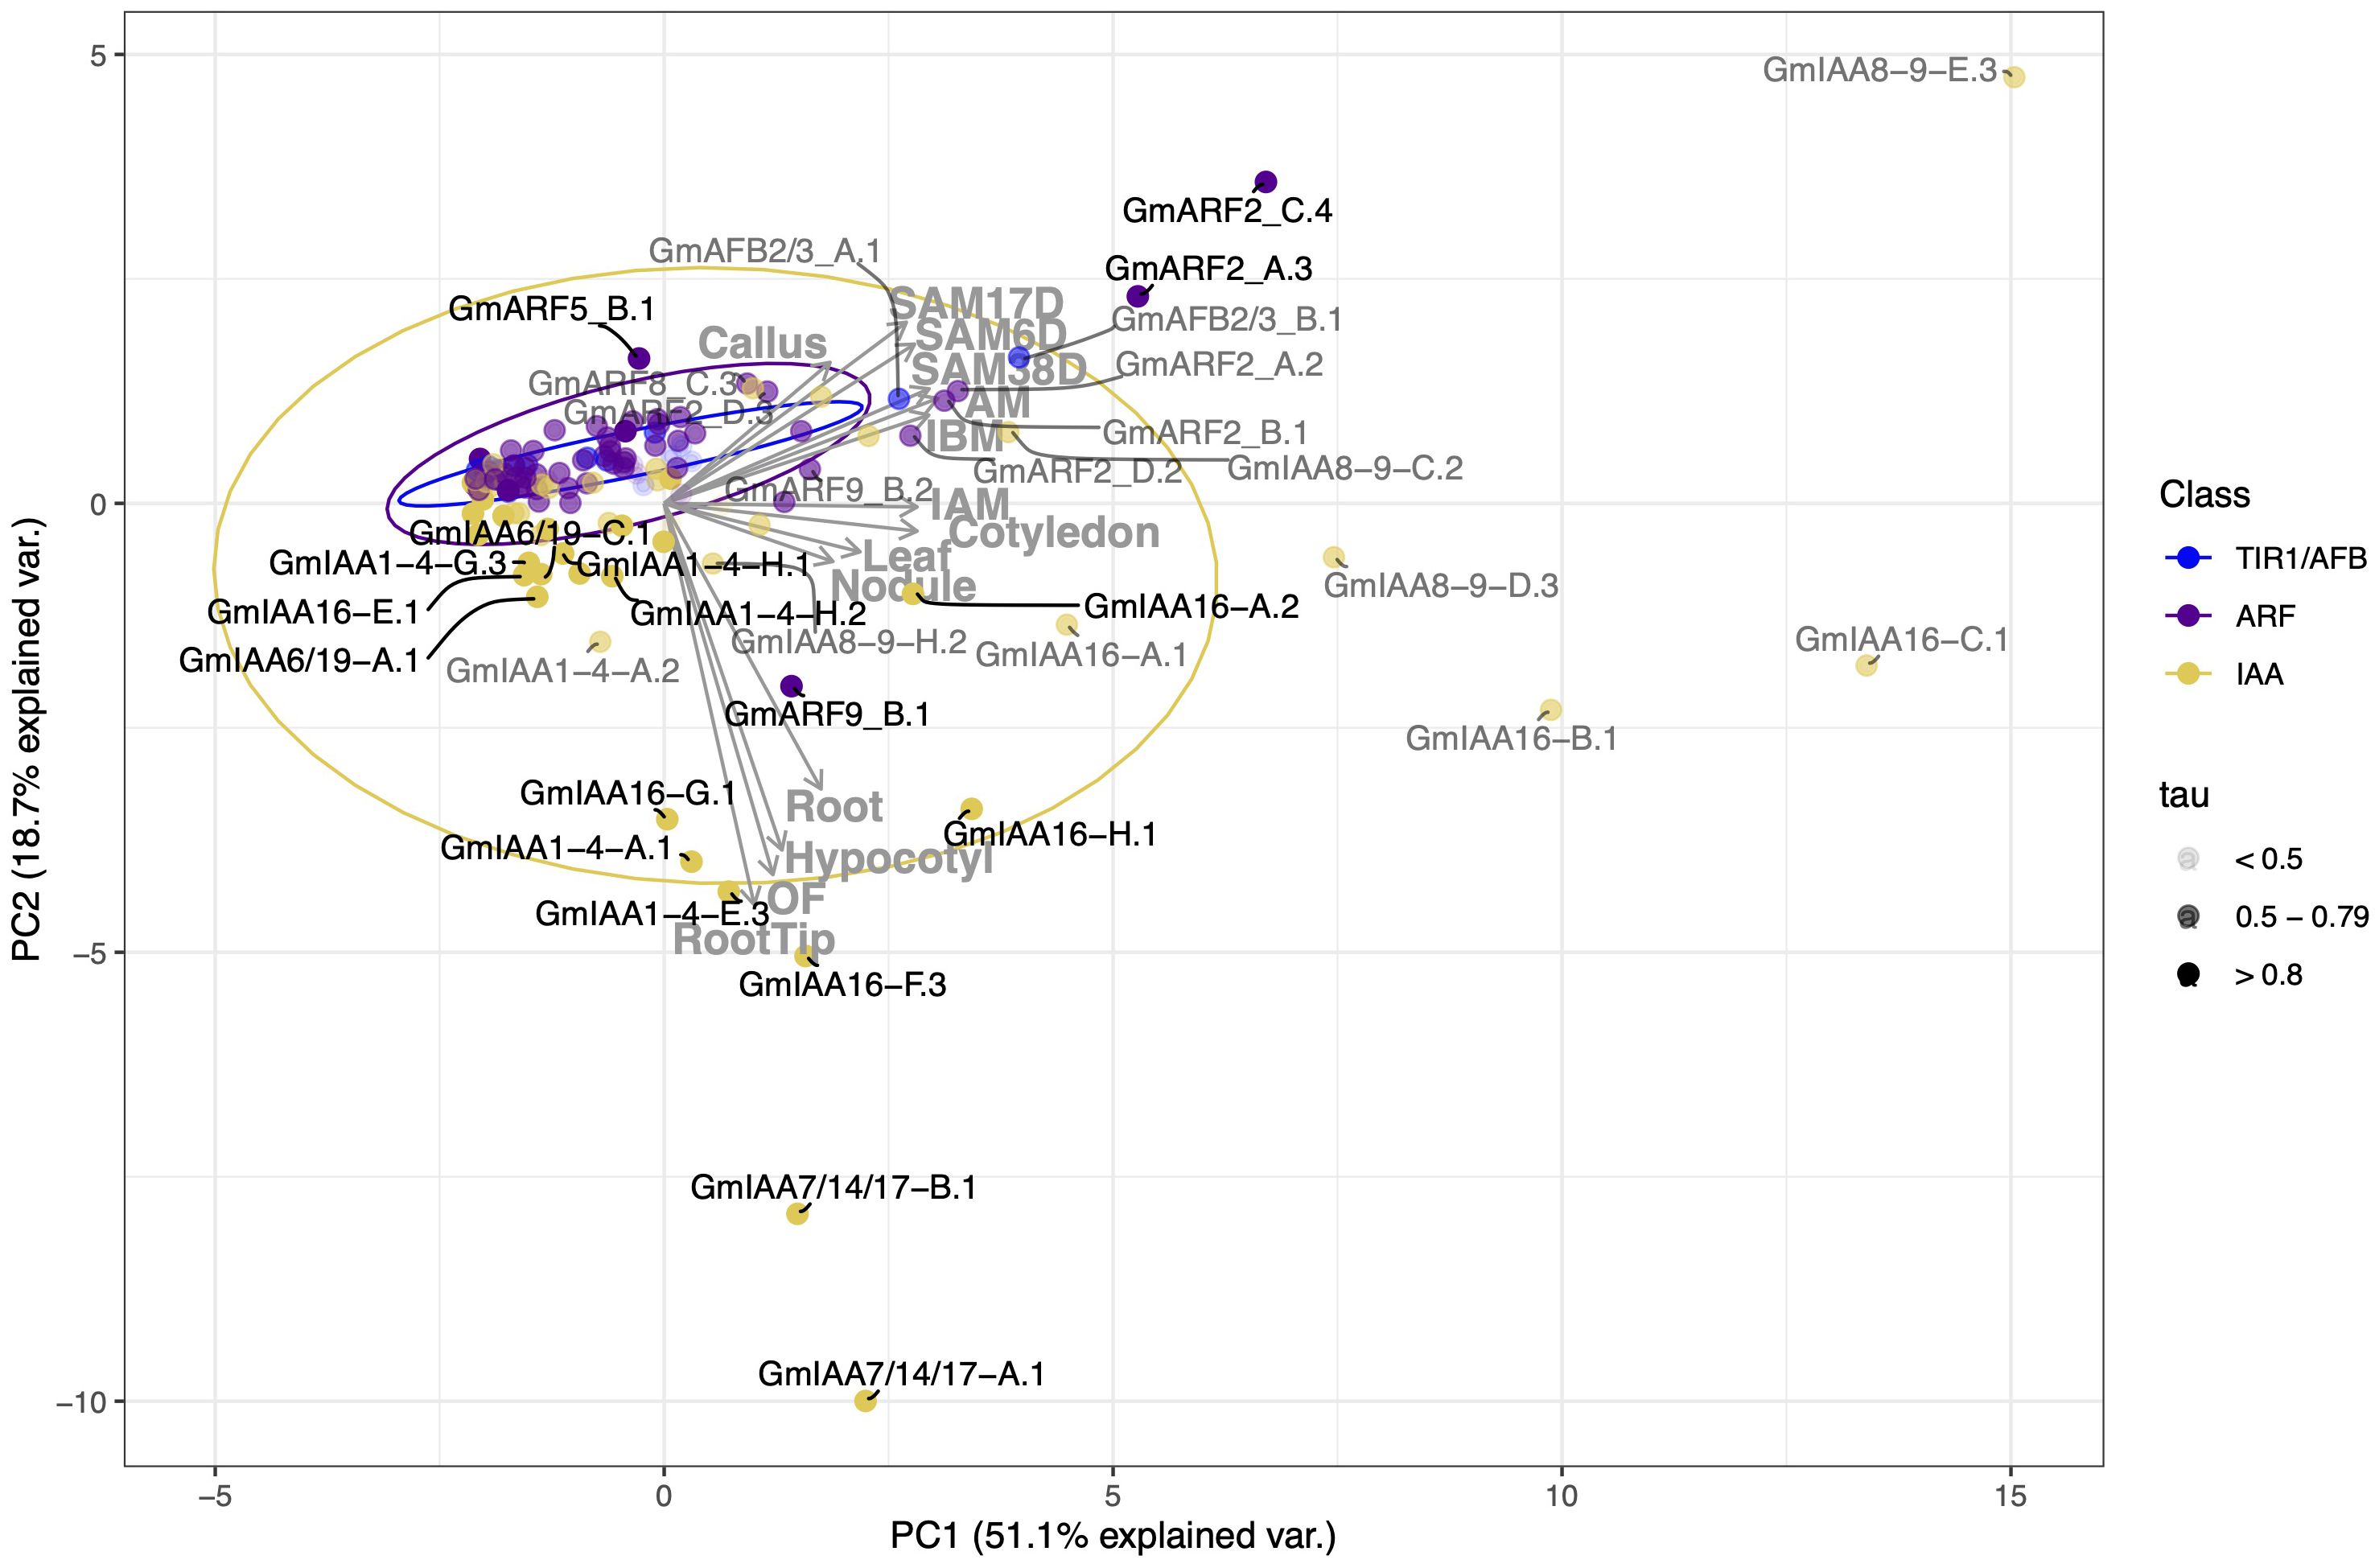
Figure 4. Correlation-based Principal Component Analysis (PCA): biplot of gene transcript expression and explanatory tissues involved in plant aerial architecture as eigenvectors (grey arrows, n = 14). Principal components 1 and 2 account for 69.8% of the total inertia. Ellipses are used here as a visual representation of dispersion of data points within each group (TIR1/AFB, ARF, and Aux/IAA (IAA)) with a 70% confidence interval. TIR1/AFB genes are colored cyan, ARF genes are colored purple, and Aux/IAA (IAA) genes are colored yellow. Some labels are connected to their respective points with curved solid lines. Color opacity of both data points and labels are determined by the gene tissue specificity index (tau), with tau < 0.5 represented in light grey, tau between 0.5 and 0.79 appearing as grey, and those with tau > 0.8 in black. Genes clustering together inside the ellipses, and/or having smaller tau values, are hypothesized to have more pleiotropic effects on plant growth and development. Conversely, genes associated with a specific RCC tissue (genes that fall along an eigenvector, outside of the respectively colored ellipse, and/or having intermediate to high tau) are hypothesized to have narrower effects and be more amenable to engineering RCC traits through gene editing.
Correlation between gene expression patterns in different tissues can be qualitatively assessed based on the angle and distance between their eigenvectors (grey arrows in Figure 4). Expression levels across meristematic tissues were strongly correlated and primary contributors to PC1 (Figure 4). Gene expression levels in leaf and cotyledon were strongly correlated and contributed weakly to PC2 and PC1 as denoted by its smaller eigenvectors. Expression levels in hypocotyl, root, and open flower tissues were also positively correlated with one another and contribute more to PC2. The relationship between hypocotyl and meristematic tissues ranges from no correlation to a weak negative correlation, probably due to tissue specificity of the Aux/IAAs. We observe a 90-degree angle between hypocotyl and axillary meristem (AM) tissues, representing no correlation between gene expression in these tissues.
To assess the variance and outliers in expression for each of these gene families, we drew ellipses representing 70% confidence intervals, assuming a Student’s T-distribution, in each PC for each gene family (in yellow, purple, and blue). Genes within these ellipses show weaker and perhaps less tissue-specificity in their expression. Variation in gene expression specificity across different gene families can be inferred from the area and shape of their respective ellipses. Our observations reveal that Aux/IAAs (yellow) exhibit a larger ellipse with approximately equal width along both PC1 and PC2 axes. This configuration signifies higher variability in expression between tissues within the Aux/IAA gene family. In contrast, ARFs (purple) and TIR1/AFBs (blue) display smaller, more elongated ellipses, particularly towards meristematic tissues. This suggests that these genes are less variable in expression and possibly share more functional overlap.
Genes clustered within ellipses, and close to the origin are more likely to display pleiotropic effects. This is suggested by the ellipses’ overlap in PCA space, as overlapping ellipses imply a high similarity between the expression of these genes and the tissues under analysis. Additionally, genes positioned closer to the origin make minor contributions to the variance explained by a principal component. While this could result from low expression levels, which reduces their impact on the analysis, it is not always the case. For example, GmIAA7/14/17-A.1 has a median expression of 7.48 TPM and is highly expressed in root (94 TPM), root tip (214 TPM), hypocotyl (350 TPM), and open flower (536 TPM) but shows comparatively low expression in other tissues (30 TPM or less). Similarly, GmARF9-B.2 has a median expression of 35 TPM and is located closer to the origin compared to ARF9-B.1, which has a median expression of 11 TPM. Thus, their proximity to the origin does not imply lower average expression levels.
To further substantiate these observations, we examined the tissue specificity index, tau, a metric for evaluating tissue specificity in gene expression. This index ranges from 0 to 1, where 0 denotes no specificity and 1 indicates high specificity of a gene to a particular tissue (Yanai et al., 2005; Kryuchkova-Mostacci and Robinson-Rechavi, 2017). Similarly to the PCA results, we observed higher tau values for IAA transcripts, indicating greater specificity for these auxin repressors, followed by ARF and TIR1/AFB transcripts (Figures 4, 5; Supplementary Table S2). The tau index median differs between groups based on the nonparametric Kruskal-Wallis test, which yielded a χ2 value of 32.4, a p-value of 9.20e-8, an effect size w of 0.25, and a 95% confidence interval of [0.16, 1.00] for the 133 observed transcripts. The Dunn post hoc test results indicate that the median tau index for IAAs differs significantly from those of ARFs and TIR1/AFB gene families (Figure 5). These findings align with the existing body of literature as well as with our PCA results, underscoring the idea that the regulation of auxin response may be tissue-dependent, primarily influenced by Aux/IAA repressor proteins.
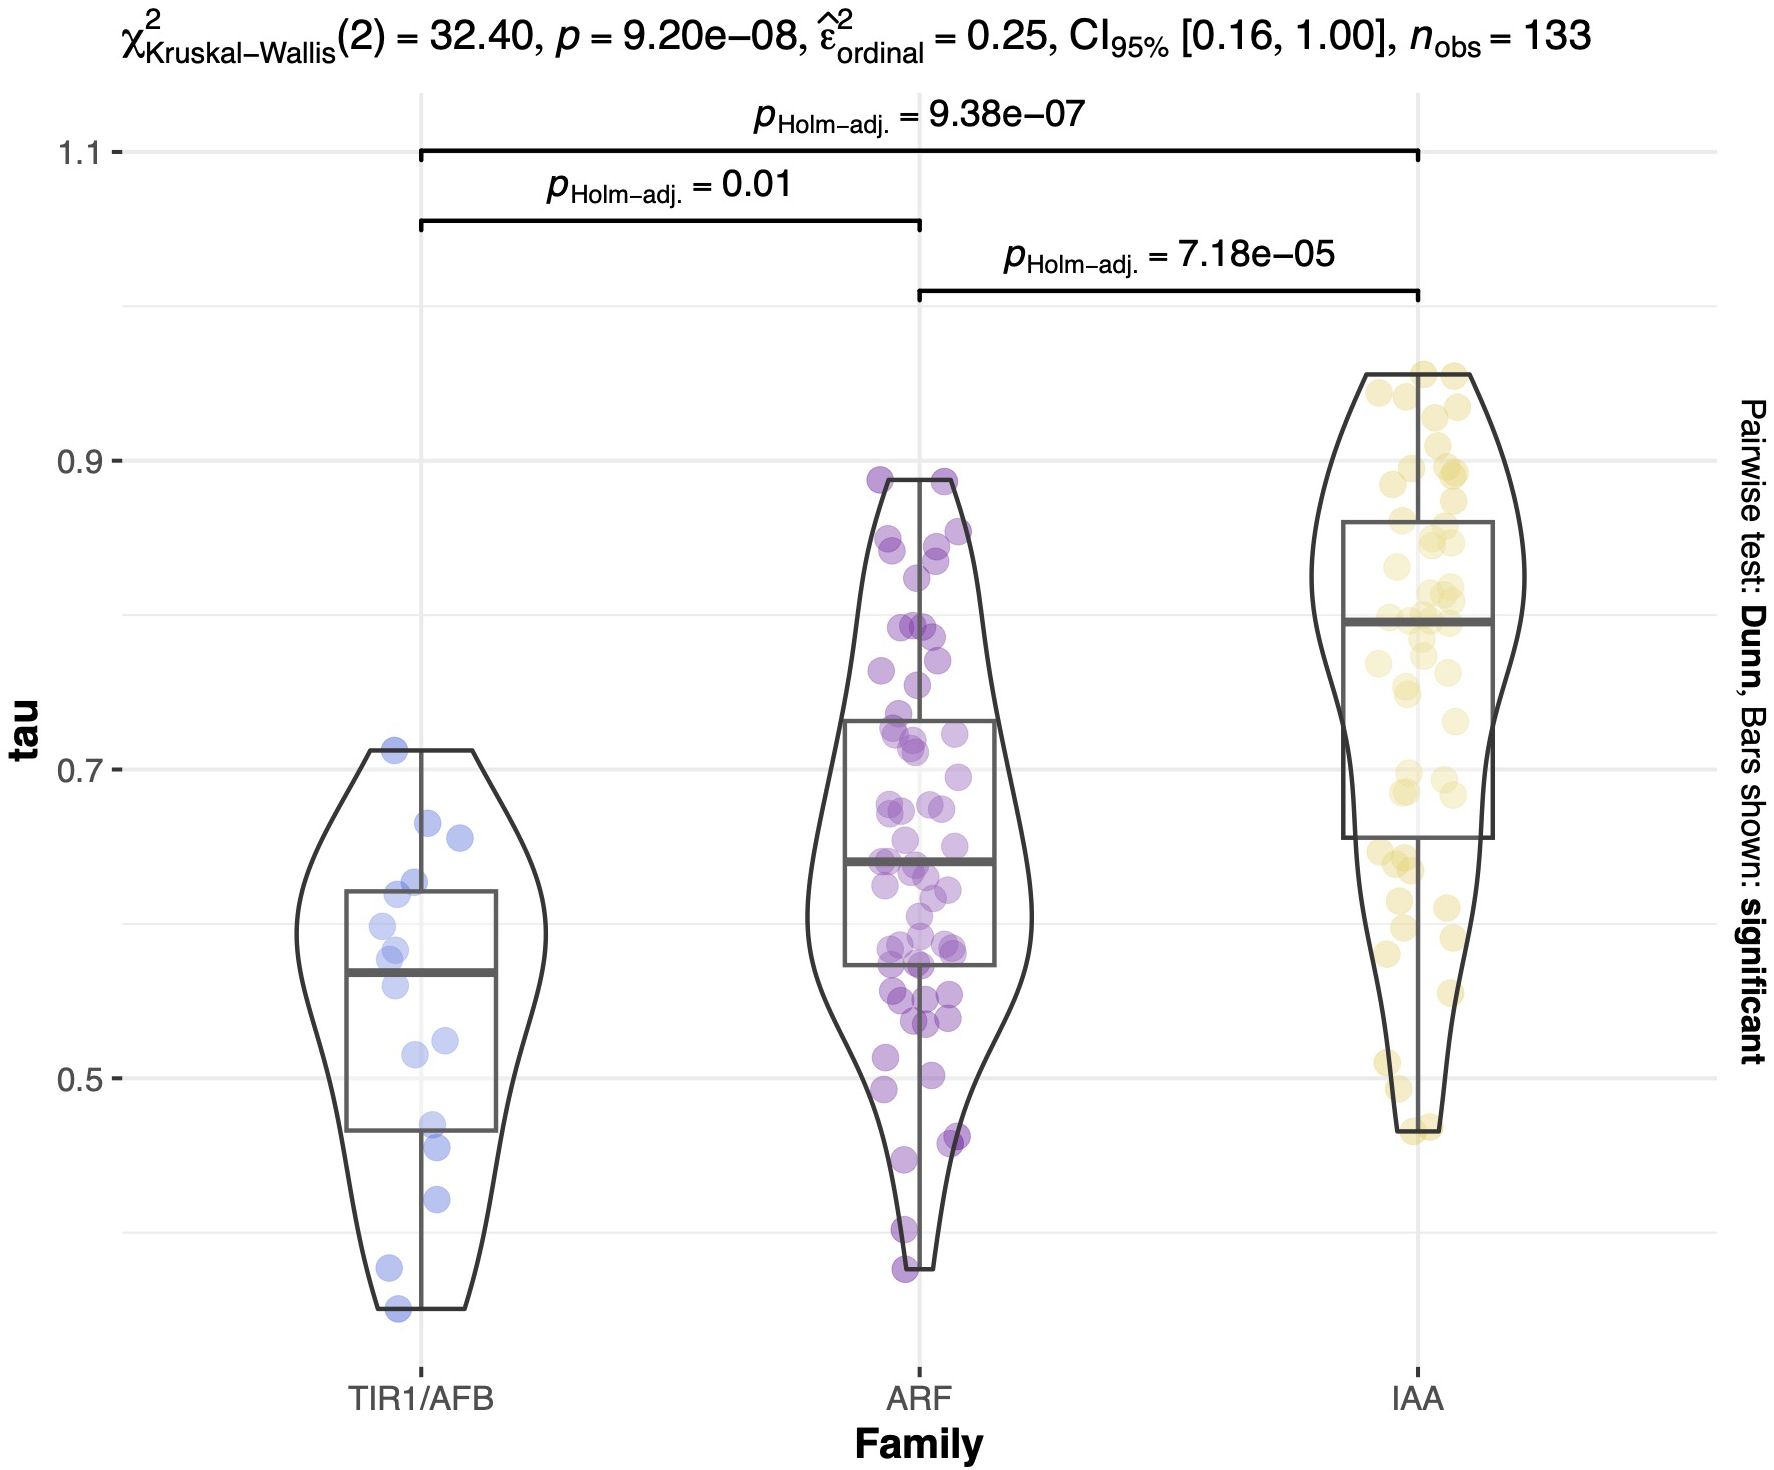
Figure 5. Distribution of tau values across auxin regulatory gene families. Kruskal-Wallis test of the 133 transcripts. The violin boxplots show the data distribution for TIR1/AFB represented in light blue, ARF in purple, and IAA in yellow. χ2Kruskal-Wallis(2) = 32.40, p = 9.20e-08, effect size = 0.25, and CI95%[0.18, 1.00]. Post-hoc test results between each gene family are indicated above each group with brackets. Tau values are displayed in the y-axis.
Tissue specificity can also be qualitatively assessed based on the placement of genes with respect to the PCA eigenvectors and tau index. We defined genes falling outside the ellipses and having tau ≥ 0.8 as strongly associated with one or more tissues, as indicated by the eigenvectors of tissue expression also shown on the PC biplots. It is important to note that intermediate expression can also be a result of strong association in several tissues of interest and was oftentimes considered in a case-by-case basis depending on their position in PCA and what tissues impacted the overall index (refer to Supplementary Table S2).
Auxin regulatory genes associated with meristematic tissues were GmARF2_A.3 (tau value of 0.82), GmARF2_C.4 (tau of 0.84), GmARF8_C.3 (tau of 0.71), GmARF9_B.2 (tau of 0.55), GmARF11/18_A.2 (tau of 0.72), GmARF11/18_B.1 (tau of 0.63), GmARF11/18_B.4 (tau of 0.79), IAA8-9_D.3 (tau of 0.64), GmIAA8-9_E.3 (tau of 0.76), GmIAA16_B.1 (tau of 0.69), and GmIAA16_C.1 (tau of 0.51) (Figure 4; Supplementary Table S2). There were four Aux/IAAs (GmIAA7/14/17_A.1 (tau of 0.89), GmIAA7/14/17_B.1 (tau of 0.93), GmIAA16_G.1 (tau of 0.94), GmIAA16_H.1 (tau of 0.87)), three ARFs (GmARF2_C.1 (tau of 0.55), GmARF8_C.1 (tau of 0.49), and GmARF11/18_C.1 (tau of 0.69)), associated with at least one of the following hypocotyl, leaf, and cotyledon RCC-related tissues (Figures 4, 6; Supplementary Figure S1). IAA8-9_D.3, IAA16_C.1, and ARF2_C1 are examples of transcripts that display intermediate tau values, yet influence development in either or both, leaf, cotyledon and meristematic tissues. These transcripts fall between their respective tissue eigenvectors and can be found outside their respective ellipses. GmARF11/18_A.2 and its paralogs are also examples of transcripts with intermediate tau values that influence one or more of leaf, cotyledon and/or meristematic tissues (Supplementary Figure S1; Supplementary Table S2). However, due to intermediate contributions to uncorrelated tissues, they are likely to fall close to the origin of our PCA, except for GmARF11/18_A.2 observed in Supplementary Figure S1. Transcripts mentioned above were observed outside of the 70% confidence ellipses not only in the PC1 and PC2 biplot, but also in the PC2 and PC3 biplot (35% (n=7, tissues related to RCC) and 26.7% (n=14, all tissues) explained variance) as they provide additional information of possible candidate gene contributions to these aerial tissues (Supplementary Figure S1, Figure 6, respectively).
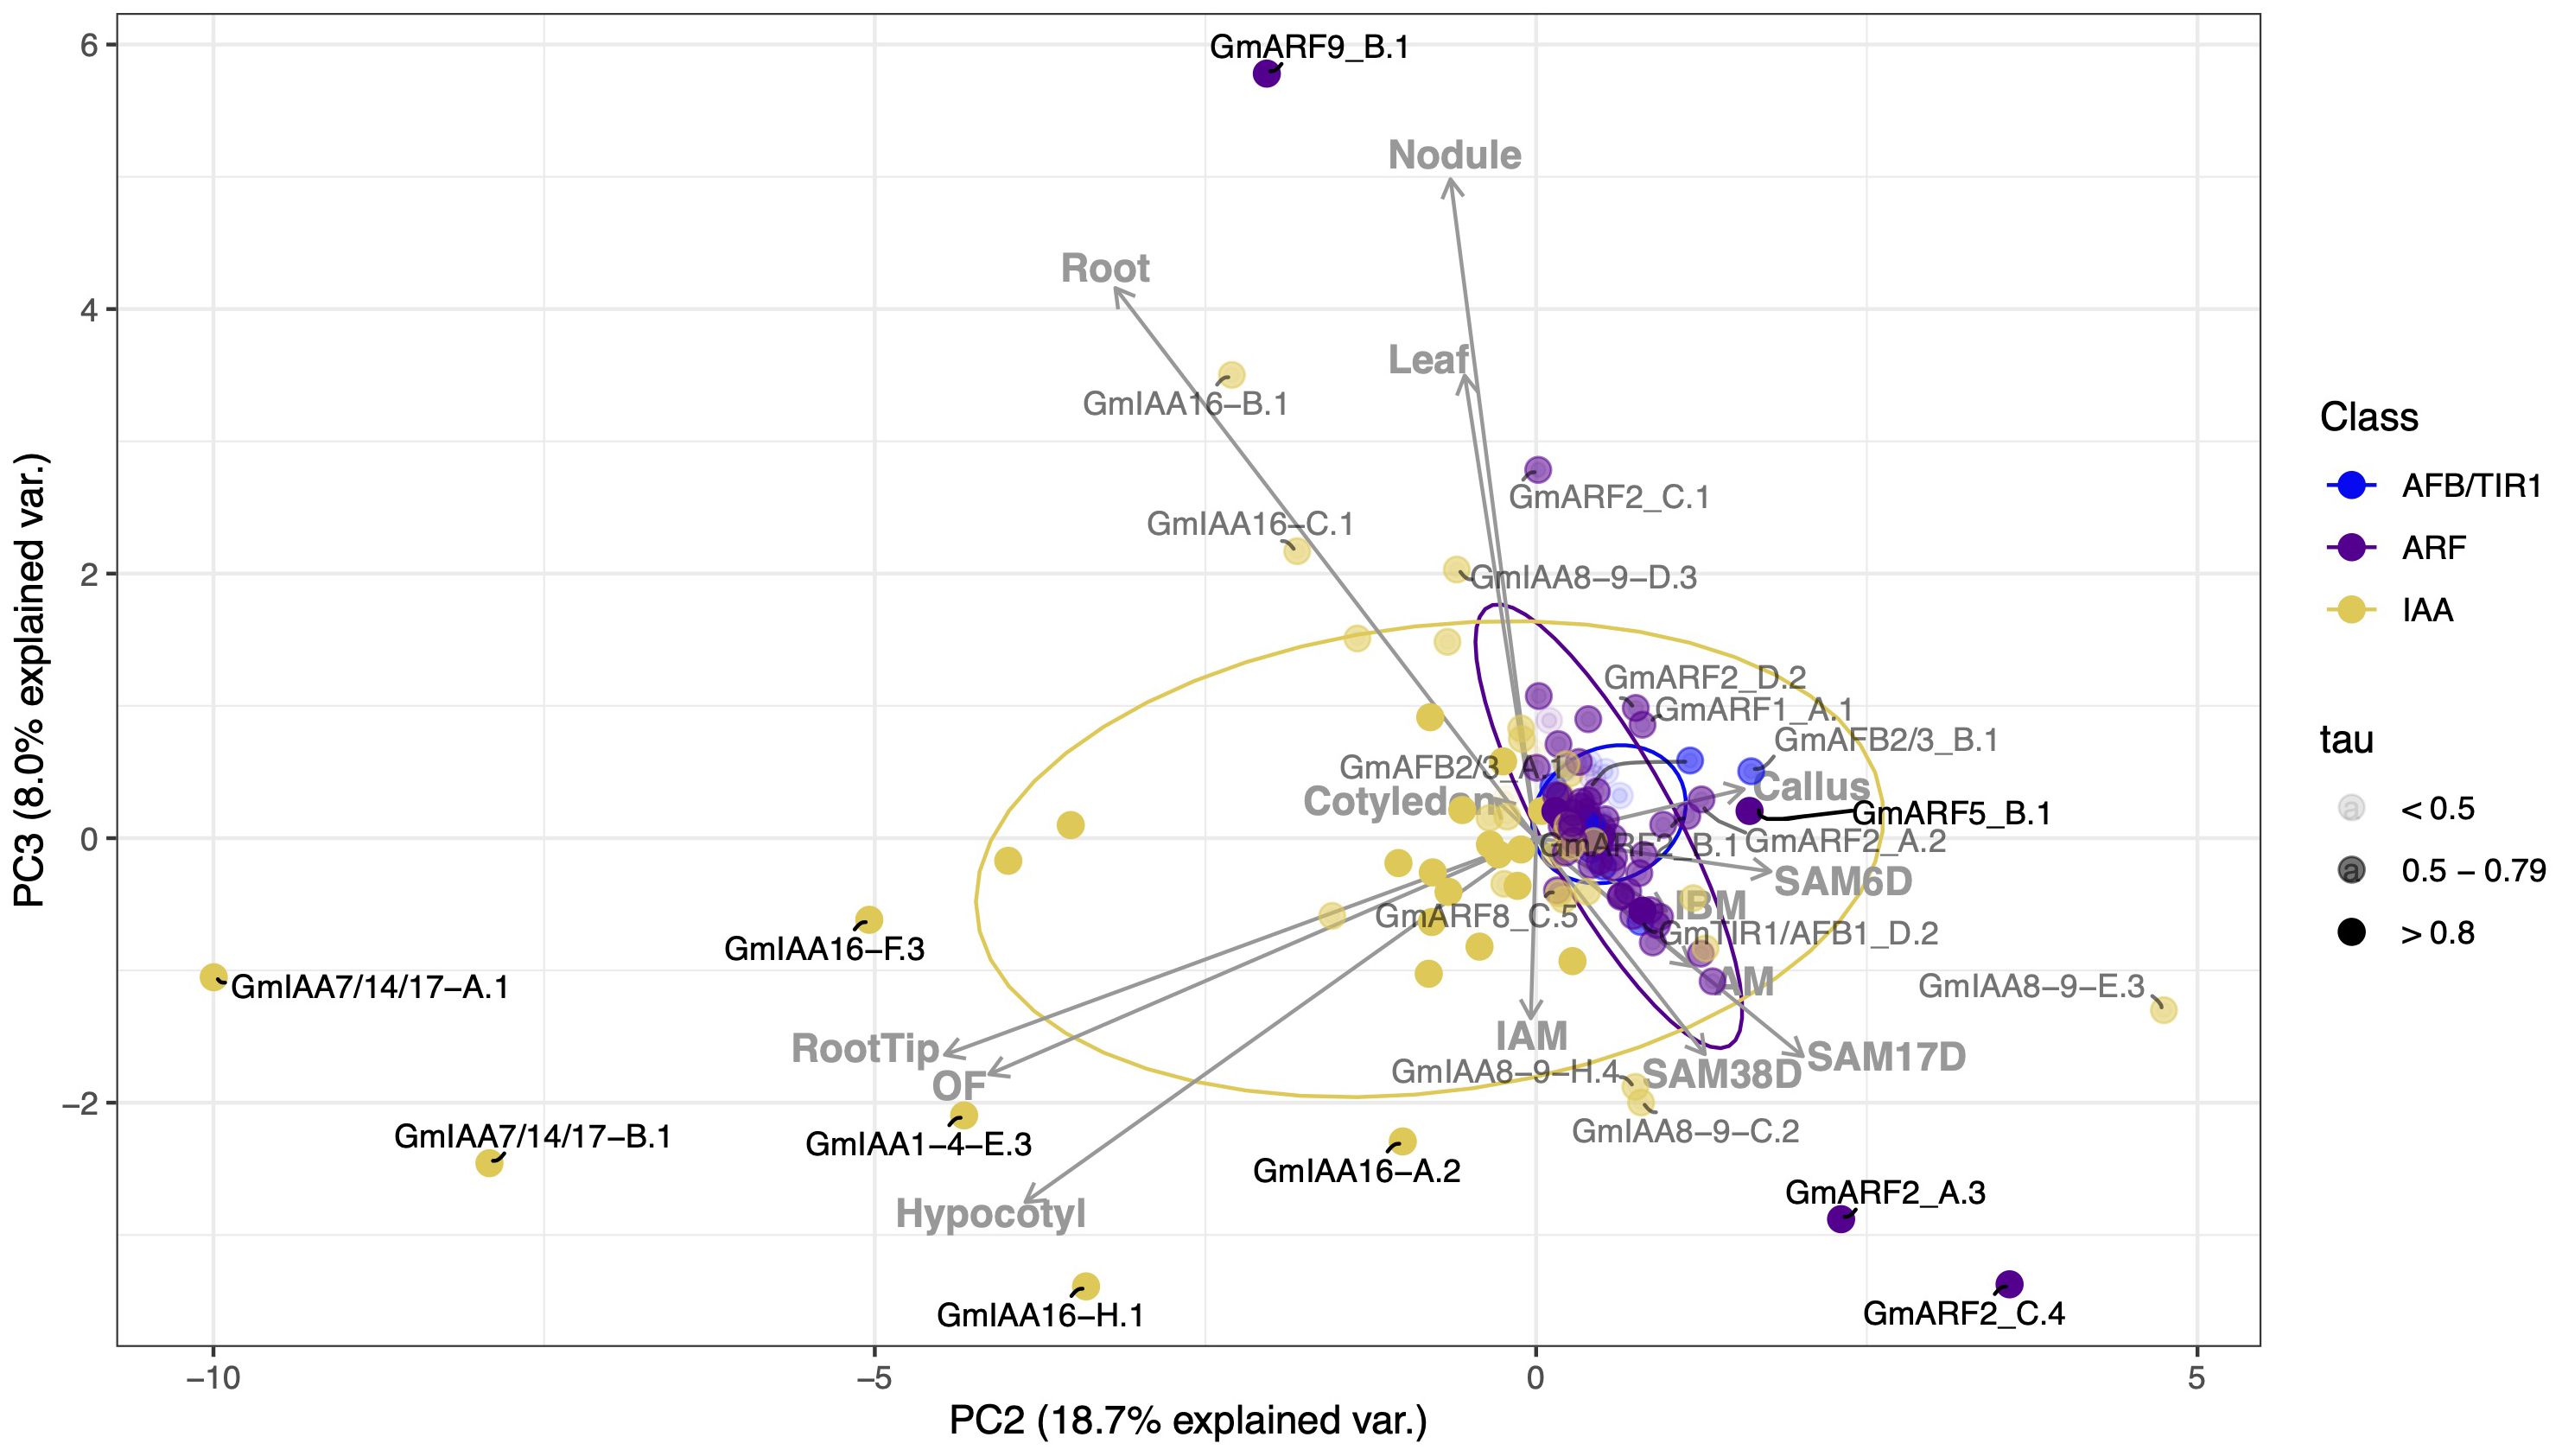
Figure 6. Correlation-based Principal Component Analysis (PCA): biplot of gene transcript expression and explanatory tissues involved in plant growth as eigenvectors (grey arrows), n = 14). Principal components 2 and 3 account for 26.7% of the total inertia. Both data points and label are also determined by the gene tissue specificity index (tau), with tau < 0.5 represented in light grey, tau between 0.5 and 0.79 appearing as grey, and those with tau > 0.8 in black.
We observed fewer candidates from the TIR1/AFB family outside the corresponding ellipses, and tau values ranged from 0.3 to 0.72 (Figure 4; Supplementary Table S2). This aligns with their documented overlapping expression and function in Arabidopsis (Prigge et al., 2020). Despite somewhat overlapping expression across all tissues, GmAFB2/3_A.1 (tau of 0.59), GmAFB2/3_B.1 (tau of 0.58), and GmAFB2/3_C.1 (tau of 0.61), displayed maximal component values ranging from 0.52 to 0.63 in AM, and 0.80 to 1 in SAM, have greater specificity to shoot apical meristem tissues than GmTIR1/AFB1 orthologs. GmTIR1/AFB1_A.1 (tau of 0.47), GmTIR1/AFB1_B.1 (tau of 0.38), GmTIR1/AFB1_C.1 (tau of 0.66), GmTIR1/AFB1_C.2 (tau of 0.42), GmTIR1/AFB1_C.3 (tau of 0.67), and GmTIR1/AFB1_D.2 (tau of 0.55), displayed maximal component values ranged from 0.50 to 1 in AM, and 0.32 to 1 in SAM, however it shares relatively high and overlapping expression across other tissues when compared to GmAFB2/3 paralogs (Figure 4; Supplementary Figure S2; Figure 6; Supplementary Table S2). GmTIR1/AFB1 paralogs are also key regulators of leaf tissue, with component values ranging from as low as 0.16 to a maximum of 1. Although we observe paralogs of GmAFB2/3 and GmTIR1/AFB1 (Figures 4, 6; Supplementary Figure S2) outside their corresponding ellipses, it remains unclear which receptors would be the best candidate genes due to their low tissue specificity (Supplementary Table S2) and likely pleiotropic nature. One possibility is that these auxin receptors may function in concert to control Aux/IAA levels freeing ARFs to mediate auxin signaling responsiveness. This idea is rather speculatory as to this point only receptor oligomerization to the SCF and dimerization of TIR1 receptors have been proposed (Dezfulian et al., 2016; Prigge et al., 2020). Further phenotypic characterization of mutants in these receptors is needed to understand how their extensive overlap in tissue expression in both soybean and Arabidopsis influences overall auxin signaling.
We have also compared our principal component analysis results using only the subset of 7 tissues that make up vegetative plant aerial architecture. We observe that excluding root, callus, and later developmental tissues did not alter the genes we found associated with RCC-related tissues. However, this exclusion did affect our ability to distinguish between genes that impact the tissues of interest and those that contribute to the aforementioned tissues (Supplementary Figure S2; Supplementary Table S2). Alternatively, we can delve into principal components that explain smaller variations that provide discrimination in the correlation between root, nodule, and hypocotyl tissues (Figure 6; Supplementary Figure S3). This provides further differentiation of the variance not explained by genes closer to the origin of PC1 and PC2, such as GmTIR1/AFB1_D.2, which show overlapping expression across various tissues (tau = 0.55) but are also significant contributors to meristems (with component values of AM = 0.65, SAM6D = 0.86, SAM17D = 1, SAM38D = 0.5). GmTIR1/AFB1_C.2 is another example with an extremely low tau (0.21) due its broad and overlapping expression across tissues, but that also shows strong relationship with leaf (Rani et al., 2023), and meristems (AM = 0.75, SAM17D = 0.85, SAM38D = 0.59) (Supplementary Figure S3). This allows us to narrow down targets that might otherwise be considered only as broadly expressed and not contributors to the variance explained in PC1 and PC2.
Discussion
Although the auxin signaling pathway is well studied and known to play an important role in plant growth, development, and architecture in A. thaliana, relatively little is known about auxin’s roles in legumes (Salehin et al., 2015; Li and Chen, 2023) outside root and nodule development and shoot height/dwarfing (Breakspear et al., 2014; Wang et al., 2015; Cai et al., 2017; Nadzieja et al., 2018; Schiessl et al., 2019; Wang et al., 2019; Gao, 2021; Rogato et al., 2021; Goto et al., 2022; Li and Chen, 2023). The extensive auxin regulatory gene families work together in a tissue-dependent manner (Piya et al., 2014) conducting shoot development and rosette area (Vernoux et al., 2011; Salehin et al., 2015; Prigge et al., 2020), organ primordia, as well as cell fate (Parry et al., 2009; Salehin et al., 2015; Rogato et al., 2021) in plants. Therefore, auxin’s mechanism of regulation is a great candidate for plant breeding programs (Li and Chen, 2023). However, what novel complexity and/or functional redundancy contained in each of these gene families remains a largely open question, especially outside of A. thaliana.
We have identified 14 TIR1/AFB, 4 COI1-like F-box, 55 ARF, and 61 Aux/IAA gene family members in G. max based on their similarity and evolutionary history relative to A. thaliana genes. The evolutionary history of the TIR1/AFB proteins exhibited 5 clades in for the G. max genes which were clustered equivalently to results reported for most A. thaliana, L. japonicus and M. truncatula in previous literature (Dharmasiri et al., 2005; Parry et al., 2009; Shen et al., 2015; Hamm et al., 2019; Rogato et al., 2021). To our knowledge, phylogenetic analysis of these TIR1/AFB auxin receptors found in the G. max genome has not yet been explored. We identified 61 Aux/IAA genes in G. max, which largely followed the clade structure of previous analyses (Remington et al., 2004; Liu et al., 2021; Ali et al., 2022). Similarly, we identified 55 ARFs in the G. max genome which also fell into orthology groups largely as expected based on previous analyses (Le et al., 2016). Our orthology naming convention, which has not to our knowledge been established before for soybean, facilitated comparative evolutionary analysis of these families with that of A. thaliana, providing some additional support for the genes we have identified as RCC-specific in our expression analysis.
Auxin transcriptional responses are governed by the degradation of Aux/IAAs in an auxin-dependent manner through interaction with SCFTIR1/AFB ubiquitin ligases and proteasomal degradation that releases class A activator ARFs from Aux/IAAs repression (Gray et al., 2001; Ramos et al., 2001; Zenser et al., 2001; Chapman and Estelle, 2009). Subsequently, different TIR1/AFB-Aux/IAA-ARF modules have been shown to regulate plant growth and development in a tissue-specific fashion in A. thaliana (Tatematsu et al., 2004; Vernoux et al., 2011; Piya et al., 2014; Krogan and Berleth, 2015; Galvan-Ampudia et al., 2020). We expected that the larger gene families in soybean would likely have more tissue specificity among members than A. thaliana and would therefore be less likely to result in pleiotropic phenotypes if mutated. In our expression analysis PC biplots, the proximity of ARFs and TIR1/AFBs to the origin along with smaller tau values (Figure 4) suggests their overlap in overall expression and involvement in diverse tissue processes. However, we did identify several members of these families with moderate to high tissue specificity. The Aux/IAAs exhibited greater dispersion and higher median tau values than the other families, implying greater tissue specificity, and possibly distinct auxin responses in different tissues. These differences in tau values are significant between groups (Figure 5), highlighting the overlap in the expression of auxin receptors and transcription factors compared to auxin repressors. This outcome is in-line with the expectation that larger gene families have a higher propensity for genetic drift and sub- and/or neo-functionalization (Birchler and Yang, 2022). However, much work remains in ascribing specific biological functions to modules composed of these auxin signaling gene families (Ori, 2019). Below, we discuss the functions and phenotypes associated with A. thaliana and legume orthologues of the G. max auxin signaling genes identified as potentially affecting RCC development.
TIR1/AFB receptor genes important in G. max aerial architecture
In A. thaliana, the TIR1/AFB family members TIR1, AFB1, AFB2 and AFB3 are all shown to be expressed in rosette leaves and meristematic regions, however expression of AFB2 and AFB3 transcript were the highest observed (Dharmasiri et al., 2005; Vernoux et al., 2011; Prigge et al., 2020). Additionally, AtAFB4 levels were nearly negligible whereas AtAFB5 is involved in Aux/IAAs turnover in shoot apical meristems (Vernoux et al., 2011). AFB5 orthologues in A. thaliana and Pisum sativum are involved in shoot branching and height (Prigge et al., 2016; Ligerot et al., 2017; Prigge et al., 2020). In G. max, GmTIR1/AFB1, GmAFB2/3, and GmAFB4/5 orthologs are highly expressed in meristematic regions and leaves (Supplementary Figure S5; Supplementary Table S2). High maximal component values of GmAFB4/5 orthologs are observed in meristems. However, these orthologs exhibit significant redundancy in expression domains (Supplementary Table S2; Figures 4, 6). While additional research is required to comprehend the distinct roles of GmTIR1/AFB1 and GmAFB2/3 in soybean shoot architecture, speculation based on both PCA and tau values suggests that GmAFB2/3 may be more conducive to engineering compared to GmTIR1/AFB1, due to higher tissue specificity specially in shoot apical meristem. GmTIR1/AFB1 is expressed later in developmental stages and flower tissue, which may introduce undesirable effects on yield (Figure 4, Supplementary Figure S2; Supplementary Table S2). Given the extensive overlap in expression, we speculate the possibility of these receptors working cooperatively to regulate auxin response. This idea comes from known importance of ARFs and Aux/IAAs dimerization and oligomerization is modulating auxin signaling (Korasick et al., 2014). It may be possible that auxin receptors also dimerize or even form heterodimers to effectively control auxin responses.
Aux/IAAs repressors important in G. max aerial architecture
As the largest gene family in the auxin signaling pathway, the Aux/IAAs contain the highest number of orthologs for each A. thaliana representative. We observed 10 soybean orthologs of AtIAA16, several of them highly and specifically expressed in hypocotyl, leaf, cotyledon, axillary and shoot apical meristems (Figure 4). Korasick et al. (Korasick et al., 2014) demonstrated that overexpression of the Atiaa16-1 gain-of-function mutant stunts vegetative growth, which can then be rescued by knocking out a binding face of the Atiaa16-1 PB1 domain. Rinaldi et al. (Rinaldi et al., 2012) noted a dominant trait in Atiaa16 gain-of-function mutants, which led to limited vegetative growth in adult plants. The high expression of soybean AtIAA16 orthologs in hypocotyl, leaf, cotyledon, axillary and shoot apical meristems may regulate apical growth. In addition, AtIAA16 is predicted to interact with AtARF8, which is also closely related to ARF6 and therefore likely to share similar interaction patterns (Piya et al., 2014). Orthologs of AtARF6 and AtARF8 were also expressed highly in canopy cover associated soybean tissues, such as GmARF6_C.2, GmARF8_A.1, GmARF8_A.2, GmARF8_C.3, GmARF8_C.5 (Figures 4, 6; Supplementary Figures S1, S6). Thus, we postulate that AtIAA16 orthologs may also play a role in soybean auxin signaling and the associated phenotypes (Figure 4; Supplementary Figure S1; Supplementary Table S2). Examples of these AtIAA16 orthologs are: GmIAA16-A.1, GmIAA16-A.2, GmIAA16-A.3, GmIAA16-C.1. Importantly, smaller PC values do not signify the absence of these genes’ influence on a phenotype. Particularly for auxin regulatory genes, which form complex dominance relationships have been previously described to form heterodimers and oligomerize, playing a crucial role in driving plant phenotype (Vernoux et al., 2011; Shen et al., 2015). Similarly, AtIAA7/14/17 orthologs are closely related to AtIAA16 and interact with activator ARFs (Korasick et al., 2014; Piya et al., 2014). Several soybean orthologs of AtIAA7/14/17 are predicted to be important in hypocotyl development in soybean based on their high expression levels (Figure 4). AtIAA17 and AtARF1 are predicted to affect hypocotyl development in A. thaliana (Piya et al., 2014). Similarly, we observe that soybean orthologs, such as GmIAA7/14/17_A.1 and GmIAA7/14/17_B.1, are highly expressed in hypocotyl development in soybean. Although we did not identify GmIAA29 as RCC specific through PCA, likely due to its high expression in many tissues, its upregulation has been associated with internode elongation in soybean. Notably, one ortholog, GmIAA29_D.1, has an intermediate tau of 0.72, with contributions to hypocotyl and open flower (maximum component values of 0.99 and 1, respectively). Additionally, it displays low to intermediate contributions, ranging from 0.34 to 0.72, across meristematic tissues. While this supports our algorithm for predicting pleiotropy, further development of this approach to the rational identification of candidate genes is still needed.
Atiaa28 gain-of-function mutants show a strong phenotype for reducing apical dominance and plant size in A. thaliana (Rogg et al., 2001). Similarly, gain-of-function mutants of Gmiaa27 are known to influence apical dominance and branching in soybean plants (Su et al., 2022). While we did not identify any orthologs of AtIAA27 as strongly RCC related, again probably due to its redundancy in expression across several of the tissues analyzed, we observe that GmIAA27-C.1, and GmIAA27-C.2 are highly expressed in meristems and hypocotyl (Supplementary Figure S5; Supplementary Table S2). Notably, there were seven GmIAA27 orthologs, one with low tau (<0.5), four with intermediate tau (0.5 - 0.79), and two with high tau (>0.8). However, even orthologs with higher tau values, such as GmIAA27-D.1 and GmIAA27-F.1, exhibit redundant expression across tissues that are not correlated with each other, resulting in their placement near the origin in our PCA.
SlIAA19 has been linked to multiple auxin signaling processes, such as apical dominance (Sun et al., 2013). It is possible that orthologs of these genes may serve as interesting targets as well. AtIAA26 (PAP1) in A. thaliana has also been linked to apical dominance due to loss of the trait after RNA silencing (Padmanabhan et al., 2005). Our expression analysis and heatmap (Supplementary Figure S5; Supplementary Table S2) show that soybean orthologs of AtIAA18/26/28 are highly expressed in RCC related tissues. For instance, GmIAA18/26/28_C.8 is strongly expressed in leaf tissue and GmIAA18/26/28_C.6/C.11/D.1 in the shoot apical meristem. However, they also exhibit overlapping expression across at least one or more tissues such as IAM, IBM, and OF tissues and have intermediate tau values (0.5 - 0.79), thus placing them closer to the origin in the PCA. This underscores the importance of using tau for enhanced discrimination of tissue specificity in conjunction with PCA. It also highlights the need for developing better algorithms to handle ubiquitously expressed and potentially highly pleiotropic genes, as their discrimination remains imperfect and requires significant follow-up analyses as demonstrated here to further narrow down specific candidates. Moreover, intermediate expression profiles may contain important information about tissue-specific enhancement and suppression, as described by Yanai et al (Yanai et al., 2005). Perhaps binning by some summary statistic of phenotype-relevant tissue expression values prior to PCA and tau calculation would identify some additional candidates. Increasing sample size of transcriptome data in a spatial-temporal contest is also needed in order to precisely train new models and increase our power in identifying candidate genes.
Interestingly, most orthologs mentioned above are phylogenetically-related, reaffirming what was discussed by Piya et al. (Piya et al., 2014) that closely related proteins are prone to display similar modes of action. Most ARF family members can form complexes with most Aux/IAA family members interchangeably (Guilfoyle et al., 1998; Vernoux et al., 2011; Piya et al., 2014). The numerous paralogs stemming from soybean whole-genome duplication could also potentially play a role in interactions between and within ARFs, Aux/IAAs, as well as TIR1/AFBs (Shen et al., 2015). These interactions could potentially impact auxin response in different ways, perhaps even facilitating adaptation of these crop through neofunctionalization of these paralogs. Negative feedback in the greater auxin signaling network also prevents quantification of molecular function in planta. However, further investigation of transcriptome and molecular data on the interaction of these paralogs are needed to clarify the mechanism of specific ARF and Aux/IAA family members on transcriptional dynamics. Due to these confounding factors, exploring many Aux/IAA and ARF orthologs will be crucial for finding combinations that can be harnessed for rational engineering of plant growth.
ARFs transcription factors important in G. max aerial architecture
AtARF2, AtARF8, and AtARF9 orthologs stand out in our analyses as being highly and specifically expressed in RCC tissues in G. max. As stated above GmARF2_A.3/C.4 and GmARF9_B.2 were associated with meristematic tissues. ARF8_C.3 also contributes to meristematic tissues, however with intermediate expression in IBM tissue. ARF8_C.5 plays a major role in hypocotyl development, but due to its marginal intermediate (0.4 maximum component) contributions to several tissues it can only be further distinguished by its tissue specificity analysis and PC explaining smaller variances (Supplementary Table S2; Figure 6). ARF8_C.1, and ARF2_C.1 are strongly associated with hypocotyl, leaf and cotyledon tissues. Described below, many of our findings are corroborated by existing literature by means of phenotypic and genomic analyses in Arabidopsis, G. max, and other related species. However, our analysis suggests that seemingly redundant ARF paralogs may have also evolved unique roles in G. max. Additionally, despite extensive genetic analyses of the ARF family (Okushima et al., 2005b), the delineation of ARF functionality in the SAM has been primarily limited to ARF5, while the involvement of other ARF genes is mostly supported by indirect evidence (Hardtke et al., 2004; Mallory et al., 2005). AtARF2, a class B ARF, is thought to serve as a negative regulator of cell proliferation and enlargement. In seedlings, HOOKLESS1 (HLS1) negatively regulates AtARF2 protein accumulation in the presence of ethylene, acting as a bridge between ethylene and auxin signaling. Ultimately, AtARF2 plays a key role in apical hook formation (Li et al., 2004), supporting our data that suggest the association of GmARF2_C.1 with hypocotyl tissues. Furthermore, AtARF2 orthologs serve as a regulator of leaf senescence in both G. max and Arabidopsis (Lim et al., 2010; La et al., 2022). Mutations in AtARF2 result in delayed leaf senescence by reducing the repression of auxin signaling and increasing auxin sensitivity (Lim et al., 2010). Mutations in AtARF2, akin to loss-of-function achieved through gene silencing, lead to elongated hypocotyls, darker green rosette leaves, and enlarged cotyledons, but do not impact global expression of auxin regulated genes in A. thaliana seedlings (Okushima et al., 2005a). GmARF2_A.2/A.3 expression is upregulated in shaded G. max plants, contributing to leaf enlargement inhibition (Wu et al., 2017). While we do not observe high expression of GmARF2_A.2/A.3 in leaf (Supplementary Table S2), that could be due to differences in experimental conditions through which samples analyzed here were collected. Expanding on transcriptome data from different environmental conditions could further help us to better understand the role of each of these orthologues. AtARF2 has also been cited as playing a role in the SAM. For example, in Arabidopsis, SAM cells are maintained during embryogenesis by down-regulating AtARF2 activity (Roodbarkelari et al., 2015). This corresponds with the SAM tissue association of GmARF2_A.2/A.3/B.1/C.4/D.2 in our PC analysis.
AtARF6/8 orthologs were the only class A ARFs that were strongly associated with any of the tissues in our analysis (Supplementary Figures S1, S6; Supplementary Table S2). Regulated by photoreceptors, CRY1 and phyB in A. thaliana, AtARF6 and AtARF8 in turn are associated with regulation of hypocotyl elongation under blue and red light. AtARF8/ARF6 double null mutants also have reduced responses to environmental conditions. Far red light and elevated temperature exposure stunt hypocotyl elongation (Mao et al., 2020). AtARF8, in conjunction with AtARF6, indirectly mediates the expression of a key brassinosteroid biosynthetic enzyme in A. thaliana, which ultimately directs proximodistal cell expansion (Xiong et al., 2021). Leaf shape is primarily determined by proximodistal growth. Brassinosteroids also promote cell wall loosening which has been shown in simulations to lead to cell and organ growth, and thus modulate leaf roundness (Xiong et al., 2021). AtARF8 operates redundantly with AtARF6 to repress phloem proliferation and induce cambium senescence during the xylem expansion phase in the hypocotyl by interacting with DELLA proteins from the gibberellin signaling pathway. AtARF8 and AtARF6 also play essential roles in cambium establishment and maintenance (Ben-Targem et al., 2021). In M. truncatula, the AtARF8 ortholog exhibits slightly elevated expression in the petiole and stem, but not the leaf (Liu et al., 2021). Similarly, our analysis found expression of GmARF8_C.1 specific to hypocotyl, leaf and cotyledon tissues. We also discovered a strong association of GmARF8_C.3 with the SAM, along with GmARF6_C.2 and GmARF8_A.1 with the meristem and leaf, respectively (Supplementary Figure S6; Supplementary Table S2). AtARF6 and AtARF8 are typically cited together due to their redundant expression domain and functionality, which is observed to some extent in our analysis of G. max.
One ortholog of AtARF9, GmARF9_B.2, another class B repressor, stood out in our analysis as potentially playing a role in shoot architecture. GmARF9, here GmARF9_C.1 variant, is associated with promoting first pod height (Jiang et al., 2018). In M. truncatula, MtARF9 has elevated expression levels in the leaves, shoots, and petioles among other tissues in the roots and seeds (Liu et al., 2021). There is otherwise a notable lack of literature that draws any meaningful connection between AtARF9 orthologs and shoot architecture. Nonetheless, our PC analysis suggests that several of the GmARF9 paralogs may serve distinct roles in the SAM and AM tissues. Importantly, they also exhibit marginal effects in inflorescence, with intermediate tissue contribution values often lower than those observed for the meristems. However (Vernoux et al., 2011), found that AtARF9 has a fairly weak homogenous expression pattern in the Arabidopsis SAM, postulating that AtARF9 likely does not play a significant role in that tissue at the time point examined. This discrepancy between the literature and our results could be explained by divergent roles of gene paralogs. Our analysis may also point to previously unknown functions of GmARF9_B.2 and its role in regulating shoot architecture.
The above AtARF2, AtARF8, and AtARF9 orthologs in G. max may serve as key targets in future studies exploring the developmental regulation of RCC. Further investigation is needed to clarify the roles of specific ARF-mediated transcriptional dynamics which is further confounded by the complex network of interactions with the large family of Aux/IAA proteins which play a key role in modulating unique transcriptional responses.
In conclusion, the findings presented in this study pinpoint potential auxin candidate genes that hold promise for improving RCC development in soybean. Specifically, diversifying the function of genes involved in early apical dominance such as those regulating meristematic tissues and hypocotyl, may enhance rapid canopy development. While we are enthusiastic about these results, we recognize the constraints of our analysis, primarily stemming from the limited available data. Increased resolution of single cell analysis or smaller bulk tissues as well as across developmental time would improve the conclusions of our analysis. It is clear from our results that the combined PCA and tau approach should be considered before drawing any conclusions as distance from the origin of PCA biplots and tau are not correlated. Thus, the addition of better suited datasets as well as development of a new machine learning model for predicting candidate genes may fast-forward this process. Additionally, synthetic biology approaches for functional characterization of soybean RCC-related TIR1/AFB-Aux/IAA-ARFs modules could be used to finely tune auxin responses and gain deeper insights into its intricate interaction network. Subsequently, functional variation in the candidate genes identified here could be studied in planta to the correlation of phenotypes with function in tissue specific auxin signaling modules.
Data availability statement
Publicly available datasets were analyzed in this study. This data can be found here: https://github.com/PlantSynBioLab/SoyARC_manuscript_public/releases/tag/Auxin.
Author contributions
DF: Conceptualization, Data curation, Formal analysis, Investigation, Methodology, Project administration, Resources, Software, Supervision, Validation, Visualization, Writing – original draft, Writing – review & editing. JT: Conceptualization, Investigation, Writing – review & editing. JB: Conceptualization, Data curation, Investigation, Writing – review & editing. BB: Conceptualization, Writing – review & editing, Investigation. RW: Conceptualization, Data curation, Formal analysis, Funding acquisition, Investigation, Methodology, Project administration, Resources, Software, Supervision, Validation, Visualization, Writing – original draft, Writing – review & editing.
Funding
The author(s) declare financial support was received for the research, authorship, and/or publication of this article. This work was supported by the National Institute of General Medical Sciences of the National Institutes of Health under award number R35GM150856, the United States Department of Agriculture National Institute of Food and Agriculture (USDA-NIFA), Agriculture and Food Research Initiative (AFRI) Plant Breeding for Agricultural Production Grant No. 2022-67013-36293 and Hatch Project (VA-1021738); Virginia Space Grant Consortium; Virginia Tech Institute for Critical Technologies and Sciences Junior Faculty Award; and Virginia Tech College of Agriculture and Life Sciences Strategic Plan Advancement 2021 Integrated Internal Competitive Grants through the Center for Advanced Innovation in Agriculture. The content is solely the responsibility of the authors and does not necessarily represent the official views of the National Institutes of Health.
Conflict of interest
DF and RW have filed an invention disclosure related to the algorithm developed in this work.
The remaining authors declare that the research was conducted in the absence of any commercial or financial relationships that could be construed as a potential conflict of interest.
Publisher’s note
All claims expressed in this article are solely those of the authors and do not necessarily represent those of their affiliated organizations, or those of the publisher, the editors and the reviewers. Any product that may be evaluated in this article, or claim that may be made by its manufacturer, is not guaranteed or endorsed by the publisher.
Supplementary material
The Supplementary Material for this article can be found online at: https://www.frontiersin.org/articles/10.3389/fpls.2024.1463438/full#supplementary-material
References
Abel, S., Theologis, A. (1996). Early genes and auxin action. Plant Physiol. 111, 9–17. Available at: https://www.ncbi.nlm.nih.gov/pmc/articles/PMC157808/.
Ali, S., Wang, W., Zhang, Z., Xie, L., Boer, D. R., Khan, N. (2022). Genome-wide identification, expression and interaction analysis of ARF and AUX/IAA gene family in soybean. Front. Biosci. (Landmark Ed). 27, 251. doi: 10.31083/j.fbl2708251
Ben-Targem, M., Ripper, D., Bayer, M., Ragni, L. (2021). Auxin and gibberellin signaling cross-talk promotes hypocotyl xylem expansion and cambium homeostasis. J. Exp. Bot. 72, 3647–3660. doi: 10.1093/jxb/erab089
Birchler, J. A., Yang, H. (2022). The multiple fates of gene duplications: Deletion, hypofunctionalization, subfunctionalization, neofunctionalization, dosage balance constraints, and neutral variation. Plant Cell 34, 2466–2474. Available at: https://www.ncbi.nlm.nih.gov/pmc/articles/PMC9252495/.
Breakspear, A., Liu, C., Roy, S., Stacey, N., Rogers, C., Trick, M., et al. (2014). The root hair “infectome” of Medicago truncatula uncovers changes in cell cycle genes and reveals a requirement for Auxin signaling in rhizobial infection. Plant Cell. 26, 4680–4701. doi: 10.1105/tpc.114.133496
Cai, Z., Wang, Y., Zhu, L., Tian, Y., Chen, L., Sun, Z., et al. (2017). GmTIR1/GmAFB3-based auxin perception regulated by miR393 modulates soybean nodulation. New Phytol. 215, 672–686. doi: 10.1111/nph.14632
Calderón Villalobos, L. I. A., Lee, S., De Oliveira, C., Ivetac, A., Brandt, W., Armitage, L., et al. (2012). A combinatorial TIR1/AFB–Aux/IAA co-receptor system for differential sensing of auxin. Nat. Chem. Biol. 8, 477–485. Available at: https://www.nature.com/articles/nchembio.926.
Cancé, C., Martin-Arevalillo, R., Boubekeur, K., Dumas, R. (2022). Auxin response factors are keys to the many auxin doors. New Phytol. 235, 402–419. doi: 10.1111/nph.18159
Chapman, E. J., Estelle, M. (2009). Mechanism of auxin-regulated gene expression in plants. Annu. Rev. Genet. 43, 265–285. doi: 10.1146/annurev-genet-102108-134148
Clark, N. M., Elmore, J. M., Walley, J. W. (2022). To the proteome and beyond: advances in single-cell omics profiling for plant systems. Plant Physiol. 188, 726–737. doi: 10.1093/plphys/kiab429
Damodharan, S., Corem, S., Gupta, S. K., Arazi, T. (2018). Tuning of SlARF10A dosage by sly-miR160a is critical for auxin-mediated compound leaf and flower development. Plant J. 96, 855–868. doi: 10.1111/tpj.14073
Davies, P. J. (1995). “The plant hormones: their nature, occurrence, and functions,” in Plant Hormones: Physiology, Biochemistry and Molecular Biology. Ed. Davies, P. J. (Springer Netherlands, Dordrecht), 1–12. doi: 10.1007/978-94-011-0473-9_1
Dezfulian, M. H., Jalili, E., Roberto, D. K. A., Moss, B. L., Khoo, K., Nemhauser, J. L., et al. (2016). Oligomerization of SCFTIR1 is essential for aux/IAA degradation and auxin signaling in arabidopsis. PloS Genet. 12, e1006301. doi: 10.1371/journal.pgen.1006301
Dharmasiri, N., Dharmasiri, S., Weijers, D., Lechner, E., Yamada, M., Hobbie, L., et al. (2005). Plant development is regulated by a family of auxin receptor F box proteins. Dev. Cell. 9, 109–119. doi: 10.1016/j.devcel.2005.05.014
Edwards, J. T., Purcell, L. C. (2005). Soybean yield and biomass responses to increasing plant population among diverse maturity groups: I. Agronomic characteristics. Crop Sci. 45, 1770–1777. doi: 10.2135/cropsci2004.0564
FAO (2018). The future of food and agriculture – Alternative pathways to 2050 | Global Perspectives Studies | Food and Agriculture Organization of the United Nations. Available online at: https://www.fao.org/global-perspectives-studies/resources/detail/en/c/1157074 (Accessed September, 23 2024).
Finet, C., Berne-Dedieu, A., Scutt, C. P., Marlétaz, F. (2013). Evolution of the ARF gene family in land plants: old domains, new tricks. Mol. Biol. Evol. 30, 45–56. doi: 10.1093/molbev/mss220
Flores-Sandoval, E., Eklund, D. M., Hong, S. F., Alvarez, J. P., Fisher, T. J., Lampugnani, E. R., et al. (2018). Class C ARFs evolved before the origin of land plants and antagonize differentiation and developmental transitions in Marchantia polymorpha. New Phytol. 218, 1612–1630. doi: 10.1111/nph.15090
Galvan-Ampudia, C. S., Cerutti, G., Legrand, J., Brunoud, G., Martin-Arevalillo, R., Azais, R., et al. (2020). Temporal integration of auxin information for the regulation of patterning. Elife 9, e55832. doi: 10.7554/eLife.55832.sa2
Gao, C. (2021). Genome engineering for crop improvement and future agriculture. Cell 184, 1621–1635. Available at: https://linkinghub.elsevier.com/retrieve/pii/S0092867421000052.
Goodstein, D. M., Shu, S., Howson, R., Neupane, R., Hayes, R. D., Fazo, J., et al. (2012). Phytozome: a comparative platform for green plant genomics. Nucleic Acids Res. 40, D1178–D1186. doi: 10.1093/nar/gkr944
Goto, T., Soyano, T., Liu, M., Mori, T., Kawaguchi, M. (2022). Auxin methylation by IAMT1, duplicated in the legume lineage, promotes root nodule development in Lotus japonicus. Proc. Natl. Acad. Sci. 119, e2116549119. doi: 10.1073/pnas.2116549119
Gray, W. M., Kepinski, S., Rouse, D., Leyser, O., Estelle, M. (2001). Auxin regulates SCFTIR1-dependent degradation of AUX/IAA proteins. Nature 414, 271–276. Available at: https://www.nature.com/articles/35104500.
Guilfoyle, T. J., Ulmasov, T., Hagen, G. (1998). The ARF family of transcription factors and their role in plant hormone-responsive transcription. CMLS Cell Mol. Life Sci. 54, 619–627. doi: 10.1007/s000180050190
Guseman, J. M., Hellmuth, A., Lanctot, A., Feldman, T. P., Moss, B. L., Klavins, E., et al. (2015). Auxin-induced degradation dynamics set the pace for lateral root development. Development 142, 905–909. Available at: https://www.ncbi.nlm.nih.gov/pmc/articles/PMC4352979/.
Hamm, M. O., Moss, B. L., Leydon, A. R., Gala, H. P., Lanctot, A., Ramos, R., et al. (2019). Accelerating structure-function mapping using the ViVa webtool to mine natural variation. Plant Direct 3, e00147. doi: 10.1002/pld3.147
Hardtke, C. S., Ckurshumova, W., Vidaurre, D. P., Singh, S. A., Stamatiou, G., Tiwari, S. B., et al. (2004). Overlapping and non-redundant functions of the Arabidopsis auxin response factors MONOPTEROS and NONPHOTOTROPIC HYPOCOTYL 4. Development 131, 1089–1100. doi: 10.1242/dev.00925
Hatfield, J. L., Dold, C. (2019). Water-use efficiency: advances and challenges in a changing climate. Front. Plant Sci. 10. doi: 10.3389/fpls.2019.00103
Horn, P. W., Burnside, O. C. (1985). Soybean growth as influenced by planting date, cultivation, and weed removal1. Agron. J. 77, 793–795. doi: 10.2134/agronj1985.00021962007700050029x
Hunter, C., Willmann, M. R., Wu, G., Yoshikawa, M., de la Luz Gutiérrez-Nava, M., Poethig, S. R. (2006). Trans-acting siRNA-mediated repression of ETTIN and ARF4 regulates heteroblasty in Arabidopsis. Development 133, 2973–2981. doi: 10.1242/dev.02491
Husbands, A. Y., Benkovics, A. H., Nogueira, F. T. S., Lodha, M., Timmermans, M. C. P. (2015). The ASYMMETRIC LEAVES complex employs multiple modes of regulation to affect adaxial-abaxial patterning and leaf complexity. Plant Cell 27, 3321–3335. doi: 10.1105/tpc.15.00454
Hyung, D., Lee, C., Kim, J. H., Yoo, D., Seo, Y. S., Jeong, S. C., et al. (2014). Cross-family translational genomics of abiotic stress-responsive genes between arabidopsis and medicago truncatula. PloS One 9, e91721. doi: 10.1371/journal.pone.0091721
Jiang, H., Li, Y., Qin, H., Li, Y., Qi, H., Li, C., et al. (2018). Identification of major QTLs associated with first pod height and candidate gene mining in soybean. Front. Plant Sci. 9. doi: 10.3389/fpls.2018.01280/full
Joshi, T., Valliyodan, B., Wu, J. H., Lee, S. H., Xu, D., Nguyen, H. T. (2013). Genomic differences between cultivated soybean, G. max and its wild relative G. soja. BMC Genomics 14, S5. doi: 10.1186/1471-2164-14-S1-S5
Kaler, A. S., Ray, J. D., Schapaugh, W. T., Davies, M. K., King, C. A., Purcell, L. C. (2018). Association mapping identifies loci for canopy coverage in diverse soybean genotypes. Mol. Breed. 38, 50. doi: 10.1007/s11032-018-0810-5
Khakhar, A., Leydon, A. R., Lemmex, A. C., Klavins, E., Nemhauser, J. L. (2018). Synthetic hormone-responsive transcription factors can monitor and re-program plant development. eLife 7, e34702. doi: 10.7554/eLife.34702
Korasick, D. A., Westfall, C. S., Lee, S. G., Nanao, M. H., Dumas, R., Hagen, G., et al. (2014). Molecular basis for AUXIN RESPONSE FACTOR protein interaction and the control of auxin response repression. Proc. Natl. Acad. Sci. U. S. A. 111, 5427–5432. Available at: https://www.ncbi.nlm.nih.gov/pmc/articles/PMC3986151/.
Krogan, N. T., Berleth, T. (2015). The identification and characterization of specific ARF-Aux/IAA regulatory modules in plant growth and development. Plant Signal Behav. 10, e992748. doi: 10.4161/15592324.2014.992748
Kryuchkova-Mostacci, N., Robinson-Rechavi, M. (2017). A benchmark of gene expression tissue-specificity metrics. Briefings Bioinf. 18, 205–214. doi: 10.1093/bib/bbw008
La, V. H., Nguyen, T. H. A., Ngo, X. B., Tran, V. D., Khuat, H. T., Bui, T. T., et al. (2022). At-ore1 Gene Induces Distinct Novel H2O2-NACs Signaling in Regulating the Leaf Senescence in Soybeans (Glycine max L.). Agronomy 12, 2110. Available at: https://www.mdpi.com/2073-4395/12/9/2110.
Lavy, M., Estelle, M. (2016). Mechanisms of auxin signaling. Development 143, 3226–3229. doi: 10.1242/dev.131870
Le, B., Nawaz, M. A., Rehman, H. M., Le, T., Yang, S. H., Golokhvast, K. S., et al. (2016). Genome-wide characterization and expression pattern of auxin response factor (ARF) gene family in soybean and common bean. Genes Genom. 38, 1165–1178. doi: 10.1007/s13258-016-0462-y
Leinonen, I., Iannetta, P. P. M., Rees, R. M., Russell, W., Watson, C., Barnes, A. P. (2019). Lysine supply is a critical factor in achieving sustainable global protein economy. Front. Sustain. Food Syst. 3. doi: 10.3389/fsufs.2019.00027
Li, H., Johnson, P., Stepanova, A., Alonso, J. M., Ecker, J. R. (2004). Convergence of signaling pathways in the control of differential cell growth in Arabidopsis. Dev. Cell. 7, 193–204. doi: 10.1016/j.devcel.2004.07.002
Li, L., Chen, X. (2023). Auxin regulation on crop: from mechanisms to opportunities in soybean breeding. Mol. Breed. 43, 16. doi: 10.1007/s11032-023-01361-9
Ligerot, Y., de Saint Germain, A., Waldie, T., Troadec, C., Citerne, S., Kadakia, N., et al. (2017). The pea branching RMS2 gene encodes the PsAFB4/5 auxin receptor and is involved in an auxin-strigolactone regulation loop. PloS Genet. 13, e1007089. Available at: https://www.ncbi.nlm.nih.gov/pmc/articles/PMC5738142/.
Lim, P. O., Lee, I. C., Kim, J., Kim, H. J., Ryu, J. S., Woo, H. R., et al. (2010). Auxin response factor 2 (ARF2) plays a major role in regulating auxin-mediated leaf longevity. J. Exp. Bot. 61, 1419–1430. doi: 10.1093/jxb/erq010
Liu, Q., Wu, K., Harberd, N. P., Fu, X. (2021). Green Revolution DELLAs: From translational reinitiation to future sustainable agriculture. Mol. Plant 14, 547–549. Available at: https://linkinghub.elsevier.com/retrieve/pii/S1674205221000903.
Lusk, J. L. (2022). Food and Fuel: Modeling Food System Wide Impacts of Increase in Demand for Soybean Oil. (United Soybean Board). Available online at: https://ag.purdue.edu/cfdas/wp-content/uploads/2022/12/report_soymodel_revised13.pdf (Accessed September 23, 2024).
Maddison, D. R., Swofford, D. L., Maddison, W. P. (1997). Nexus: an extensible file format for systematic information. Sys. Biol. 46, 590–621. doi: 10.1093/sysbio/46.4.590
Mallory, A. C., Bartel, D. P., Bartel, B. (2005). MicroRNA-directed regulation of Arabidopsis AUXIN RESPONSE FACTOR17 is essential for proper development and modulates expression of early auxin response genes. Plant Cell. 17, 1360–1375. doi: 10.1105/tpc.105.031716
Mao, Z., He, S., Xu, F., Wei, X., Jiang, L., Liu, Y., et al. (2020). Photoexcited CRY1 and phyB interact directly with ARF6 and ARF8 to regulate their DNA-binding activity and auxin-induced hypocotyl elongation in Arabidopsis. New Phytol. 225, 848–865. doi: 10.1111/nph.v225.2
Matthes, M. S., Best, N. B., Robil, J. M., Malcomber, S., Gallavotti, A., McSteen, P. (2019). Auxin evoDevo: conservation and diversification of genes regulating auxin biosynthesis, transport, and signaling. Mol. Plant 12, 298–320. Available at: https://www.sciencedirect.com/science/article/pii/S1674205218303794.
Moss, B. L., Mao, H., Guseman, J. M., Hinds, T. R., Hellmuth, A., Kovenock, M., et al. (2015). Rate motifs tune auxin/indole-3-acetic acid degradation dynamics. Plant Physiol. 169, 803–813. doi: 10.1104/pp.15.00587
Mutte, S. K., Kato, H., Rothfels, C., Melkonian, M., Wong, G. K. S., Weijers, D. (2018). Origin and evolution of the nuclear auxin response system. eLife 7, e33399. doi: 10.7554/eLife.33399
Nadzieja, M., Kelly, S., Stougaard, J., Reid, D. (2018). Epidermal auxin biosynthesis facilitates rhizobial infection in Lotus japonicus. Plant J. 95, 101–111. doi: 10.1111/tpj.2018.95.issue-1
Nagpal, P., Ellis, C. M., Weber, H., Ploense, S. E., Barkawi, L. S., Guilfoyle, T. J., et al. (2005). Auxin response factors ARF6 and ARF8 promote jasmonic acid production and flower maturation. Development 132, 4107–4118. doi: 10.1242/dev.01955
Nagpal, P., Walker, L. M., Young, J. C., Sonawala, A., Timpte, C., Estelle, M., et al. (2000). AXR2 encodes a member of the Aux/IAA protein family. Plant Physiol. 123, 563–574. doi: 10.1104/pp.123.2.563
Nishimura, T., Wada, T., Yamamoto, K. T., Okada, K. (2005). The Arabidopsis STV1 protein, responsible for translation reinitiation, is required for auxin-mediated gynoecium patterning. Plant Cell. 17, 2940–2953. doi: 10.1105/tpc.105.036533
Okushima, Y., Mitina, I., Quach, H. L., Theologis, A. (2005a). AUXIN RESPONSE FACTOR 2 (ARF2): a pleiotropic developmental regulator. Plant J. 43, 29–46. doi: 10.1111/j.1365-313X.2005.02426.x
Okushima, Y., Overvoorde, P. J., Arima, K., Alonso, J. M., Chan, A., Chang, C., et al. (2005b). Functional genomic analysis of the AUXIN RESPONSE FACTOR gene family members in Arabidopsis thaliana: unique and overlapping functions of ARF7 and ARF19. Plant Cell 17, 444–463. doi: 10.1105/tpc.104.028316
Ori, N. (2019). Dissecting the biological functions of ARF and aux/IAA genes. Plant Cell 31, 1210–1211. Available at: https://www.ncbi.nlm.nih.gov/pmc/articles/PMC6588303/.
Overvoorde, P. J., Okushima, Y., Alonso, J. M., Chan, A., Chang, C., Ecker, J. R., et al. (2005). Functional Genomic Analysis of the AUXIN/INDOLE-3-ACETIC ACID Gene Family Members in Arabidopsis thaliana. Plant Cell 17, 3282–3300. Available at: https://www.ncbi.nlm.nih.gov/pmc/articles/PMC1315369/.
Padmanabhan, M. S., Goregaoker, S. P., Golem, S., Shiferaw, H., Culver, J. N. (2005). Interaction of the tobacco mosaic virus replicase protein with the aux/IAA protein PAP1/IAA26 is associated with disease development. J. Virol. 79, 2549–2558. Available at: https://www.ncbi.nlm.nih.gov/pmc/articles/PMC546588/.
Parry, G., Calderon-Villalobos, L. I., Prigge, M., Peret, B., Dharmasiri, S., Itoh, H., et al. (2009). Complex regulation of the TIR1/AFB family of auxin receptors. Proc. Natl. Acad. Sci. 106, 22540–22545. doi: 10.1073/pnas.0911967106
Patil, I. (2021). Visualizations with statistical details: The “ggstatsplot” approach. J. Open Source Softw. 6, 3167. doi: 10.21105/joss.03167
Pekker, I., Alvarez, J. P., Eshed, Y. (2005). Auxin response factors mediate Arabidopsis organ asymmetry via modulation of KANADI activity. Plant Cell. 17, 2899–2910. doi: 10.1105/tpc.105.034876
Peters, E. J., Gebhardt, M. R., Stritzke, J. F. (1965). Interrelations of row spacings, cultivations and herbicides for weed control in soybeans. Weeds 13, 285–289. Available at: https://www.jstor.org/stable/4040876.
Piya, S., Shrestha, S. K., Binder, B., Stewart, C. N., Hewezi, T. (2014). Protein-protein interaction and gene co-expression maps of ARFs and Aux/IAAs in Arabidopsis. Front. Plant Sci. 5, 744. Available at: https://www.ncbi.nlm.nih.gov/pmc/articles/PMC4274898/.
Prigge, M. J., Greenham, K., Zhang, Y., Santner, A., Castillejo, C., Mutka, A. M., et al. (2016). The arabidopsis auxin receptor F-box proteins AFB4 and AFB5 are required for response to the synthetic auxin picloram. G3 (Bethesda) 6, 1383–1390. Available at: https://www.ncbi.nlm.nih.gov/pmc/articles/PMC4856089/.
Prigge, M. J., Platre, M., Kadakia, N., Zhang, Y., Greenham, K., Szutu, W., et al. (2020). Genetic analysis of the Arabidopsis TIR1/AFB auxin receptors reveals both overlapping and specialized functions. eLife 9, e54740. doi: 10.7554/eLife.54740
Ramos, J. A., Zenser, N., Leyser, O., Callis, J. (2001). Rapid degradation of auxin/indoleacetic acid proteins requires conserved amino acids of domain II and is proteasome dependent. Plant Cell 13, 2349–2360. doi: 10.1105/tpc.010244
Rani, R., Raza, G., Tung, M. H., Rizwan, M., Ashfaq, H., Shimelis, H., et al. (2023). Genetic diversity and population structure analysis in cultivated soybean (Glycine max [L.] Merr.) using SSR and EST-SSR markers. PloS One 18, e0286099. Available at: https://www.ncbi.nlm.nih.gov/pmc/articles/PMC10231820/.
R Core Team (2023). R: A Language and Environment for Statistical Computing (Vienna, Austria: R Foundation for Statistical Computing). Available at: https://www.R-project.org/.
Remington, D. L., Vision, T. J., Guilfoyle, T. J., Reed, J. W. (2004). Contrasting modes of diversification in the aux/IAA and ARF gene families. Plant Physiol. 135, 1738–1752. doi: 10.1104/pp.104.039669
Rinaldi, M. A., Liu, J., Enders, T. A., Bartel, B., Strader, L. C. (2012). A gain-of-function mutation in IAA16 confers reduced responses to auxin and abscisic acid and impedes plant growth and fertility. Plant Mol. Biol. 79, 359–373. doi: 10.1007/s11103-012-9917-y
Rogato, A., Valkov, V. T., Nadzieja, M., Stougaard, J., Chiurazzi, M. (2021). The Lotus japonicus AFB6 Gene Is Involved in the Auxin Dependent Root Developmental Program. Int. J. Mol. Sci. 22, 8495. Available at: https://www.mdpi.com/1422-0067/22/16/8495.
Rogg, L. E., Lasswell, J., Bartel, B. (2001). A gain-of-function mutation in IAA28 suppresses lateral root development. Plant Cell. 13, 465–480. doi: 10.1105/tpc.13.3.465
Ronquist, F., Teslenko, M., van der Mark, P., Ayres, D. L., Darling, A., Höhna, S., et al. (2012). MrBayes 3.2: efficient Bayesian phylogenetic inference and model choice across a large model space. Syst. Biol. 61, 539–542. doi: 10.1093/sysbio/sys029
Roodbarkelari, F., Du, F., Truernit, E., Laux, T. (2015). ZLL/AGO10 maintains shoot meristem stem cells during Arabidopsis embryogenesis by down-regulating ARF2-mediated auxin response. BMC Biol. 13, 74. doi: 10.1186/s12915-015-0180-y
Salehin, M., Bagchi, R., Estelle, M. (2015). SCFTIR1/AFB-based auxin perception: mechanism and role in plant growth and development. Plant Cell. 27, 9–19. doi: 10.1105/tpc.114.133744
Schiessl, K., Lilley, J. L. S., Lee, T., Tamvakis, I., Kohlen, W., Bailey, P. C., et al. (2019). NODULE INCEPTION recruits the lateral root developmental program for symbiotic nodule organogenesis in medicago truncatula. Curr. Biol. 29, 3657–3668.e5. doi: 10.1016/j.cub.2019.09.005
Schmutz, J., Cannon, S. B., Schlueter, J., Ma, J., Mitros, T., Nelson, W., et al. (2010). Genome sequence of the palaeopolyploid soybean. Nature 463 (7278), 178–183.
Shen, C., Yue, R., Sun, T., Zhang, L., Xu, L., Tie, S., et al. (2015). Genome-wide identification and expression analysis of auxin response factor gene family in Medicago truncatula. Front. Plant Sci. 6. doi: 10.3389/fpls.2015.00073
Silva, A. F., Concenço, G., Aspiazú, I., Ferreira, E. A., Galon, L., Freitas M a., M., et al. (2009). Período anterior à interferência na cultura da soja-RR em condições de baixa, média e alta infestação. Planta daninha 27, 57–66. Available at: https://www.scielo.br/j/pd/a/BBHnkvPVDYTZ7BhqN3WxgFv/?lang=pt.
Stewart, D. W., Costa, C., Dwyer, L. M., Smith, D. L., Hamilton, R. I., Ma, B. L. (2003). Canopy structure, light interception, and photosynthesis in maize. Agron. J. 95, 1465–1474. doi: 10.2134/agronj2003.1465
Su, B., Wu, H., Guo, Y., Gao, H., Wei, Z., Zhao, Y., et al. (2022). GmIAA27 encodes an AUX/IAA protein involved in dwarfing and multi-branching in soybean. Int. J. Mol. Sci. 23, 8643. Available at: https://www.ncbi.nlm.nih.gov/pmc/articles/PMC9368862/.
Sun, J., Qi, L., Li, Y., Zhai, Q., Li, C. (2013). PIF4 and PIF5 transcription factors link blue light and auxin to regulate the phototropic response in Arabidopsis. Plant Cell. 25, 2102–2114. doi: 10.1105/tpc.113.112417
Sun, Z., Wang, Y., Mou, F., Tian, Y., Chen, L., Zhang, S., et al. (2016). Genome-wide small RNA analysis of soybean reveals auxin-responsive microRNAs that are differentially expressed in response to salt stress in root apex. Front. Plant Sci. 6. doi: 10.3389/fpls.2015.01273
Swarup, R., Parry, G., Graham, N., Allen, T., Bennett, M. (2002). Auxin cross-talk: integration of signalling pathways to control plant development. Plant Mol. Biol. 49, 411–426. doi: 10.1023/A:1015250929138
Szemenyei, H., Hannon, M., Long, J. A. (2008). TOPLESS mediates auxin-dependent transcriptional repression during arabidopsis embryogenesis. Science 319, 1384–1386. doi: 10.1126/science.1151461
Tan, X., Calderon-Villalobos, L. I. A., Sharon, M., Zheng, C., Robinson, C. V., Estelle, M., et al. (2007). Mechanism of auxin perception by the TIR1 ubiquitin ligase. Nature 446, 640–645. Available at: https://www.nature.com/articles/nature05731.
Tatematsu, K., Kumagai, S., Muto, H., Sato, A., Watahiki, M. K., Harper, R. M., et al. (2004). MASSUGU2 encodes aux/IAA19, an auxin-regulated protein that functions together with the transcriptional activator NPH4/ARF7 to regulate differential growth responses of hypocotyl and formation of lateral roots in Arabidopsis thaliana. Plant Cell. 16, 379–393. doi: 10.1105/tpc.018630
Tian, Q., Uhlir, N. J., Reed, J. W. (2002). Arabidopsis SHY2/IAA3 inhibits auxin-regulated gene expression. Plant Cell. 14, 301–319. doi: 10.1105/tpc.010283
Tiwari, S. B., Hagen, G., Guilfoyle, T. (2003). The roles of auxin response factor domains in auxin-responsive transcription. Plant Cell. 15, 533–543. Available at: https://www.ncbi.nlm.nih.gov/pmc/articles/PMC141219/.
Tiwari, S. B., Wang, X. J., Hagen, G., Guilfoyle, T. J. (2001). AUX/IAA proteins are active repressors, and their stability and activity are modulated by auxin. Plant Cell 13, 2809–2822. doi: 10.1105/tpc.010289
Ulmasov, T., Hagen, G., Guilfoyle, T. J. (1999). Activation and repression of transcription by auxin-response factors. Proc. Natl. Acad. Sci. U. S. A. 96, 5844–5849. Available at: https://www.ncbi.nlm.nih.gov/pmc/articles/PMC21948/.
van Dijk, M., Morley, T., Rau, M. L., Saghai, Y. (2021). A meta-analysis of projected global food demand and population at risk of hunger for the period 2010–2050. Nat. Food 2, 494–501. Available at: https://www.nature.com/articles/s43016-021-00322-9.
Vernoux, T., Brunoud, G., Farcot, E., Morin, V., Van den Daele, H., Legrand, J., et al. (2011). The auxin signalling network translates dynamic input into robust patterning at the shoot apex. Mol. Syst. Biol. 7, 508. doi: 10.1038/msb.2011.39
Vu, V. Q., Friendly, M. (2024). ggbiplot: A Grammar of Graphics Implementation of Biplots. Available online at: https://github.com/friendly/ggbiplot, https://friendly.github.io/ggbiplot/ (Accessed September 23, 2024).
Wang, L., Cao, C., Ma, Q., Zeng, Q., Wang, H., Cheng, Z., et al. (2014). RNA-seq analyses of multiple meristems of soybean: novel and alternative transcripts, evolutionary and functional implications. BMC Plant Biol. 14, 169. doi: 10.1186/1471-2229-14-169
Wang, Y., Li, K., Chen, L., Zou, Y., Liu, H., Tian, Y., et al. (2015). MicroRNA167-directed regulation of the auxin response factors gmARF8a and gmARF8b is required for soybean nodulation and lateral root development. Plant Physiol. 168, 984–999. doi: 10.1104/pp.15.00265
Wang, Y., Yang, W., Zuo, Y., Zhu, L., Hastwell, A. H., Chen, L., et al. (2019). GmYUC2a mediates auxin biosynthesis during root development and nodulation in soybean. J. Exp. Bot. 70, 3165–3176. doi: 10.1093/jxb/erz144
Weijers, D., Benkova, E., Jäger, K. E., Schlereth, A., Hamann, T., Kientz, M., et al. (2005). Developmental specificity of auxin response by pairs of ARF and Aux/IAA transcriptional regulators. EMBO J. 24, 1874–1885. doi: 10.1038/sj.emboj.7600659
Wickham, H. (2016). ggplot2: Elegant Graphics for Data Analysis (New York: Springer-Verlag). Available at: https://ggplot2.tidyverse.org.
Wilmoth, J. C., Wang, S., Tiwari, S. B., Joshi, A. D., Hagen, G., Guilfoyle, T. J., et al. (2005). NPH4/ARF7 and ARF19 promote leaf expansion and auxin-induced lateral root formation. Plant J. 43, 118–130. doi: 10.1111/j.1365-313X.2005.02432.x
Wright, E. S. (2015). DECIPHER: harnessing local sequence context to improve protein multiple sequence alignment. BMC Bioinf. 16, 322. doi: 10.1186/s12859-015-0749-z
Wright, R. C., Zahler, M. L., Gerben, S. R., Nemhauser, J. L. (2017). Insights into the Evolution and Function of Auxin Signaling F-Box Proteins in Arabidopsis thaliana Through Synthetic Analysis of Natural Variants. Genetics 207, 583–591. Available at: https://www.ncbi.nlm.nih.gov/pmc/articles/PMC5629325/.
Wu, Y., Gong, W., Yang, W. (2017). Shade inhibits leaf size by controlling cell proliferation and enlargement in soybean. Sci. Rep. 7, 9259. Available at: https://www.nature.com/articles/s41598-017-10026-5.
Xavier, A., Hall, B., Hearst, A. A., Cherkauer, K. A., Rainey, K. M. (2017). Genetic Architecture of Phenomic-Enabled Canopy Coverage in Glycine max. Genetics 206, 1081. Available at: https://www.ncbi.nlm.nih.gov/pmc/articles/PMC5499164/.
Xiong, Y., Wu, B., Du, F., Guo, X., Tian, C., Hu, J., et al. (2021). A crosstalk between auxin and brassinosteroid regulates leaf shape by modulating growth anisotropy. Mol. Plant 14, 949–962. doi: 10.1016/j.molp.2021.03.011
Yanai, I., Benjamin, H., Shmoish, M., Chalifa-Caspi, V., Shklar, M., Ophir, R., et al. (2005). Genome-wide midrange transcription profiles reveal expression level relationships in human tissue specification. Bioinformatics 21, 650–659. doi: 10.1093/bioinformatics/bti042
Yu, G. (2022). Data Integration, Manipulation and Visualization of Phylogenetic Trees (New York: Chapman and Hall/CRC), 276 p.
Zenser, N., Ellsmore, A., Leasure, C., Callis, J. (2001). Auxin modulates the degradation rate of Aux/IAA proteins. Proc. Natl. Acad. Sci. 98, 11795–11800. doi: 10.1073/pnas.211312798
Zhang, R., Wang, Y., Li, S., Yang, L., Liang, Z. (2021). ABA signaling pathway genes and function during abiotic stress and berry ripening in Vitis vinifera. Gene 769, 145226. Available at: https://www.sciencedirect.com/science/article/pii/S0378111920308957.
Zhang, Z., Yang, S., Wang, Q., Yu, H., Zhao, B., Wu, T., et al. (2022). Soybean GmHY2a encodes a phytochromobilin synthase that regulates internode length and flowering time. J. Exp. Bot. 73, 6646–6662. doi: 10.1093/jxb/erac318
Zhou, C., Han, L., Fu, C., Wen, J., Cheng, X., Nakashima, J., et al. (2013). The Trans-Acting Short Interfering RNA3 Pathway and NO APICAL MERISTEM Antagonistically Regulate Leaf Margin Development and Lateral Organ Separation, as Revealed by Analysis of an argonaute7/lobed leaflet1 Mutant in Medicago truncatula. Plant Cell 25, 4845–4862. doi: 10.1105/tpc.113.117788
Keywords: auxin, crop trait improvement, canopy development, phylogenetics, comparative evolutionary analysis, pleiotropy, soybeans (Glycine max)
Citation: Ferreira Neres D, Taylor JS, Bryant JA Jr., Bargmann BOR and Wright RC (2024) Identification of potential auxin response candidate genes for soybean rapid canopy coverage through comparative evolution and expression analysis. Front. Plant Sci. 15:1463438. doi: 10.3389/fpls.2024.1463438
Received: 11 July 2024; Accepted: 12 September 2024;
Published: 03 October 2024.
Edited by:
Nunzio D’Agostino, University of Naples Federico II, ItalyReviewed by:
Akira Nagatani, Kyoto University, JapanMengran Yang, University of Missouri, United States
Copyright © 2024 Ferreira Neres, Taylor, Bryant, Bargmann and Wright. This is an open-access article distributed under the terms of the Creative Commons Attribution License (CC BY). The use, distribution or reproduction in other forums is permitted, provided the original author(s) and the copyright owner(s) are credited and that the original publication in this journal is cited, in accordance with accepted academic practice. No use, distribution or reproduction is permitted which does not comply with these terms.
*Correspondence: R. Clay Wright, d3JpZ2h0cmNAdnQuZWR1