 Yixiao Wang
 Rudolph Fredua-Agyeman
 Zhiyu Yu
 Sheau-Fang Hwang
 Stephen E. Strelkov
- Department of Agricultural, Food and Nutritional Science, University of Alberta, Edmonton, AB, Canada
Verticillium stripe, caused by Verticillium longisporum, presents an emerging threat to Canadian canola (Brassica napus). Initially detected in Manitoba in 2014, the presence of this pathogen has since been confirmed across western Canada. Infections by V. longisporum can result in yield losses of up to 50%, which is a cause for concern given the susceptibility of most commercial Canadian canola cultivars. The objective of this study was to screen a collection of 211 Brassica genotypes for their reactions to V. longisporum, and to use genome-wide association study (GWAS) to identify single nucleotide polymorphism (SNP) markers for resistance. The plant material consisted of 110 rutabaga (B. napus ssp. napobrassica), 35 canola, 40 Brassica rapa, and 15 Brassica oleracea accessions or cultivars, alongside 11 hosts of the European Clubroot Differential (ECD) set. These materials were screened for resistance under greenhouse conditions and were genotyped using a 19K Brassica SNP array. Three general linear models (GLM), four mixed linear models (MLM), and three GWAS methods were employed to evaluate the markers. Eleven non-commercial Brassica accessions and 9 out of 35 commercial canola cultivars displayed a low normalized area under the disease progress curve (AUDPCnorm.). The non-commercial accessions could prove valuable as potential sources of resistance against V. longisporum. Forty-five SNP markers were identified to be significantly associated with V. longisporum resistance using single-SNP based GWAS analysis. In comparison, haplotype-based GWAS analyses identified 10 to 25 haplotype blocks to be significantly associated with V. longisporum resistance. Between 20% and 56% of QTLs identified by the more conventional single-SNP based GWAS analysis were also detected by the haplotype-based GWAS analysis. The overlapping genomic regions identified by the two GWAS methods present promising hotspots for marker-assisted selection in the future development of Verticillium stripe-resistant canola.
Introduction
Verticillium stripe, caused by the fungal pathogen Verticillium longisporum (C. Stark) Karapapa, Bainbridge and Heale, is an important soilborne disease of canola (Brassica napus L.) in Canada. The first case of Verticillium stripe in this country was identified in a canola field in Manitoba in 2014 (Canadian Food Inspection Agency, 2018). Subsequently, V. longisporum has been detected in other Canadian provinces, including British Columbia, Alberta, Saskatchewan, Ontario, and Quebec (Canadian Food Inspection Agency, 2018). Yield losses due to V. longisporum infection were reported to range from approximately 10% to 50% on canola, although they could exceed 80% on a single plant (Dunker et al., 2008). Since the survival structures (microsclerotia) of V. longisporum can persist in the soil for up to 10 years (Schnathorst, 1981), strategies such as minimizing soil movement, implementing longer rotations out of host crops, and good weed management can potentially reduce V. longisporum inoculum levels (Johansson et al., 2006). However, these strategies may not be practical for growers due to economic concerns. Moreover, there are currently no registered fungicides available for controlling this disease (Dunker et al., 2008). Therefore, genetic resistance stands out as the most effective and environmentally friendly approach for managing Verticillium stripe. Unfortunately, no commercial canola varieties in Canada have been registered as resistant to V. longisporum (Norman, 2023).
Verticillium longisporum mainly attacks hosts in the Brassicaceae family, such as B. napus (canola/oilseed rape and rutabaga), Brassica rapa L. (including pak choy, Chinese cabbage, and turnip), Brassica oleracea L. (including broccoli, cauliflower, cabbage, and kale), and Brassica juncea L. (including brown and leaf mustard) (Zeise and Von Tiedemann, 2002; Depotter et al., 2016). Some progenitor species of B. napus (AACC, n = 19), including B. rapa (AA, n = 10) and B. oleracea (CC, n = 9) (Nagaharu, 1935), have been reported to exhibit higher levels of resistance to several significant canola diseases such as blackleg (Zou and Fernando, 2024), clubroot (Fredua-Agyeman et al., 2020), and Sclerotinia stem rot (Khan et al., 2023). Consequently, the screening of various Brassica species for genetic resistance to V. longisporum is an important breeding objective. Rygulla et al. (2007) identified two major quantitative trait loci (QTL) for V. longisporum resistance on chromosomes C04 and C05. Additionally, Obermeier et al. (2013) found a major QTL on chromosome C05 and a minor QTL on C01, both correlated with V. longisporum resistance, whereas Gabur et al. (2020) reported a QTL for resistance on chromosome C09. In a recent study, Su et al. (2023) demonstrated that the MYB transcription factor BrMYB108 in B. rapa directly targets genes encoding respiratory burst oxidase homologues, leading to resistance against V. longisporum through the regulation of reactive oxygen species (ROS) generation (Su et al., 2023).
However, to the best of our knowledge, no screening or resistance gene/QTL detection studies have been conducted in Canada for the identification of Brassica germplasm suitable for breeding V. longisporum resistance in commercial canola cultivars. Therefore, the objective of this study was to screen a large collection of rutabaga (B. napus ssp. napobrassica) accessions and commercial canola cultivars from Canada, as well as B. rapa and B. oleracea genotypes from China, for resistance to this fungus. Additionally, a genome-wide association study (GWAS) was utilized to identify accessions and genomic regions associated with V. longisporum resistance.
Materials and methods
Plant materials
Two-hundred eleven Brassica accessions, commercial cultivars, and differential hosts were evaluated for their reaction to V. longisporum. Among these were 110 rutabaga (B. napus spp. napobrassica) accessions previously screened for clubroot resistance by Fredua-Agyeman et al. (2020), and utilized in genetic diversity studies by Yu et al. (2021). In addition, the evaluation included 35 Canadian canola cultivars, 40 B. rapa vegetable cultivars, and 15 B. oleracea vegetable cultivars from China. Furthermore, 11 hosts of the European Clubroot Differential set (ECD; Buczacki et al., 1975) were tested, including ECD 06, ECD 08, ECD 09, ECD 10 (B. napus), ECD 01, ECD 02, ECD 03, ECD 04, ECD 05 (‘Granaat’) (B. rapa), ECD 11, and ECD 13 (B. oleracea). Among these 211 Brassica genotypes, the Canadian canola cultivar ‘Westar’ was included as a susceptible check, while B. rapa var. pekinensis ‘Granaat’ (ECD 05) served as a moderately resistant check (Rygulla et al., 2007). The details of the plant materials used are presented in Supplementary Table S1.
Resistance phenotyping
The single-spore isolate VL 43 of V. longisporum, collected from an infected canola plant sampled near Edmonton, Alberta (Cui et al., 2022), was cultured in Petri dishes (9-cm diameter) filled with potato dextrose agar (PDA). The multiplex PCR method described by Inderbitzin et al. (2013) was employed to identify isolate VL 43 as V. longisporum lineage A1/D1. Cultures were incubated in darkness at room temperature for 28 days before harvesting the conidia. Briefly, 10 mL of sterile distilled water was added to each Petri dish, and a sterile inoculating loop was used to gently dislodge the spores. The resulting conidial suspension was filtered through four layers of sterile cheesecloth to remove mycelial fragments. The spore concentration was then estimated using a haemocytometer (Hausser Scientific, Horsham, Pennsylvania, USA), and adjusted to 1 × 10⁶ spores mL−1 with sterile distilled water.
Seven-day old seedlings of the 211 Brassica genotypes were inoculated using the root-dip method as described by Cui et al. (2022). Non-inoculated controls were dipped in sterile distilled water instead. The experimental setup consisted of 32 L plastic tubs filled with Sunshine Mix #4 growing mix (Sun Gro Horticulture, Vilna, Alberta, Canada). Each tub accommodated five seedlings of the same genotype, with four Brassica genotypes per tub, totaling 20 plants (5 plants × 4 genotypes) per tub and each genotype had 4 replicates. The plants were maintained in a greenhouse under an 18-h photoperiod (22°C day/16°C night).
Disease severity assessments were conducted weekly for each plant over a 4-week period. The assessment utilized a 1–9 rating scale as described by Eynck et al. (2009), where a rating of 1 = no symptoms, while 9 = the plant is dead. The experiment was arranged in a randomized completely block design with four replicates, and was independently repeated.
Statistical analysis of the disease data
The area under the disease progress curve (AUDPC) was calculated for each host genotype based on Verticillium stripe severity using the formula described by Campbell and Madden (1990): AUDPC = , where is the disease severity for each observation number i, is the number of days after inoculation at the time of observation number i, and n is the number of observations. Non-inoculated plants were also assessed on the same scale at the same times. A net AUDPC value (AUDPCnet) was calculated following Eynck et al. (2009): AUDPCnet = AUDPC(Xinoc.) – AUDPC(Xcontr.), where Xinoc. is the inoculated plants and Xcontr. is non-inoculated controls.
The AUDPC values were normalized for each genotype relative to the susceptible check ‘Westar’ and moderately resistant check ‘Granaat’ to account for fluctuating disease severity between trials. The normalized AUDPC (AUDPCnorm.) was calculated according to Eynck et al. (2009):
The phenotype data was analyzed statistically using R: A Language and Environment for Statistical Computing (R Core Team, 2013). Brassica genotypes with significantly lower AUDPCnorm. (P ≤ 0.05) compared to the moderately resistant cultivar ‘Granaat’ were considered resistant (Rygulla et al., 2007; Eynck et al., 2009). If 0.05 < P ≤ 0.1, the genotypes were regarded as moderately resistant. In addition, for those not assigned as resistant or moderately resistant, the susceptible check ‘Westar’ was also used for comparison. Brassica genotypes with P ≤ 0.05 were regarded as susceptible and P > 0.05 were considered as moderately susceptible.
SNP genotyping
SNP genotyping was performed on all 211 Brassica genotypes using a Brassica 19K SNP array from TraitGenetics GmbH (Gatersleben. Germany). This array included 9,966 SNP markers on the A-genome, 7,740 SNP markers on the C-genome, and 1,146 SNP markers on scaffolds. After filtering monomorphic, low-coverage site markers, as well as markers with minor allele frequency (MAF) ≤ 0.05 and those missing data for >10%, 4,972 A-genome markers and 4,621 C-genome markers were retained for the GWAS. The GWAS was conducted separately on the 45 B. rapa (AA) and 149 B. napus (AACC) accessions using the A-genome markers, and on the 17 B. oleracea (CC) and 149 B. napus accessions using the C-genome markers. Additionally, the average inter-SNP marker distance was determined for each combination and each chromosome (Table 1).
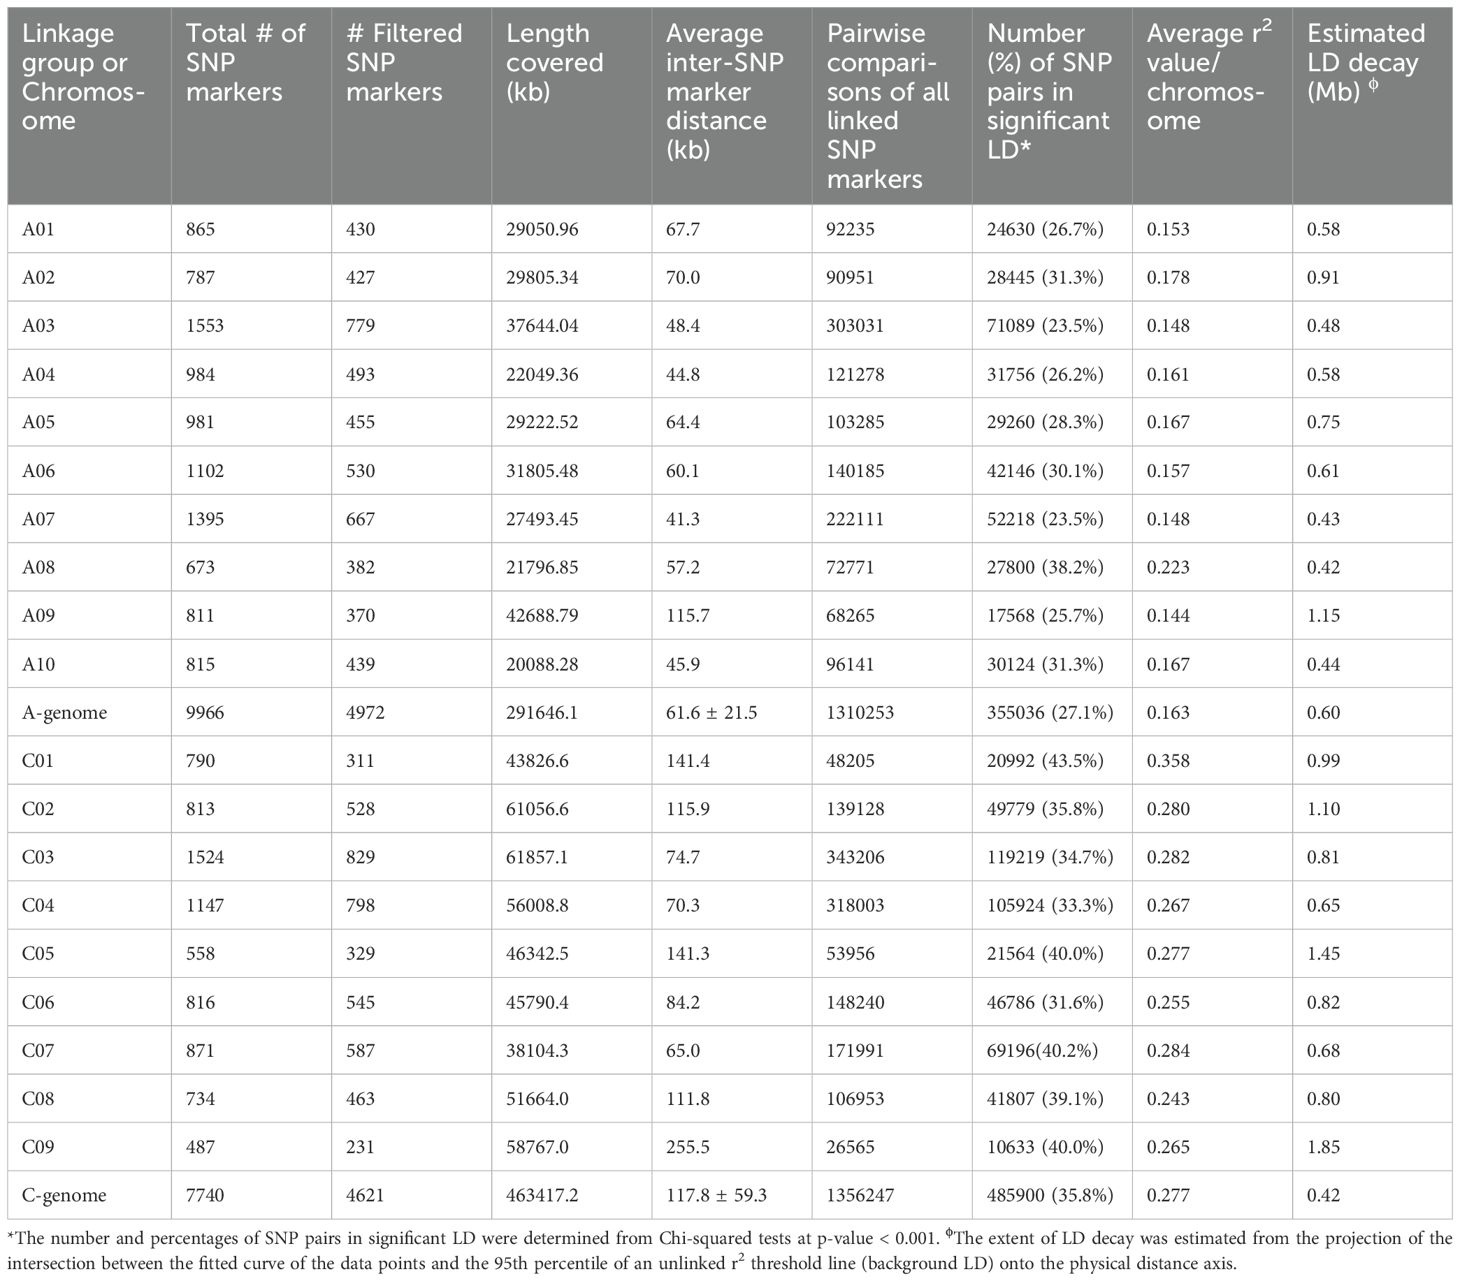
Table 1. Single nucleotide polymorphism (SNP) marker density and extent of intrachromosomal linkage disequilibrium (LD) in Brassica rapa, Brassica napus and Brassica oleracea genotypes included in a genome-wide association study of resistance to Verticillium longisporum.
Linkage disequilibrium estimation
Intra-chromosomal linkage disequilibrium (LD) between allelic values at two loci was estimated using Pearson’s squared correlation coefficient (r2) statistic with TASSEL 5.0 (Bradbury et al., 2007). To determine the significance of pairwise marker r2-values, P < 0.001 of the Chi-square (χ2) statistic for each SNP pair was used according to Fredua-Agyeman et al. (2020). The LD decay curves were determined by calculating the Chi-square (χ2) statistic for each SNP pair in relation to physical map distance (in Mb) using R v. 4.3.2 (R Core Team, 2013). The extent of LD was estimated based on the interaction of the fitted LD decay curve and r2-threshold lines for each chromosome (Breseghello and Sorrells, 2006; Bellucci et al., 2015).
Population structure analysis
To determine the population structure (Θ) of the Brassica accessions used in this study, a Bayesian clustering approach was employed. Burn-in periods ranged from 5,000 to 100,000 iterations, and Markov Chain Monte Carlo (MCMC) analyses ranged from 5,000 to 100,000 permutations through the population-genetic software STRUCTURE v. 2.3.4 (Pritchard et al., 2000). The Brassica rapa + B. napus genotypes and B. oleracea + B. napus genotypes were analyzed separately to determine the number of genetically homogeneous clusters (K) based on 4,972 and 4,621 SNP markers, respectively. Runs for each K=1–10 were replicated 10 times. The number of clusters and average log-likelihood plots were determined according to Evanno et al. (2005) through STRUCTURE HARVESTER (Earl and vonHoldt, 2012).
The genetic diversity of B. rapa + B. napus genotypes and B. oleracea + B. napus genotypes was determined separately. This analysis was based on 4,972 A-genome markers and 4,621 C-genome markers. The unweighted pair group method with arithmetic mean (UPGMA) and the neighbor joining (NJ) method implemented in TASSEL v. 5.0 were used to generate phylogenetic trees.
SNP-based genome-wide association analyses
Three general linear models (GLM) and four mixed linear models (MLM) implemented in TASSEL v. 5.0 (Bradbury et al., 2007) were tested for the SNP-based marker-trait association studies. The GLM tested consisted of the population structure (Q)-only, Kinship (K)-only, and Principal Coordinate Analysis (PCA)-only models. The MLM models comprised Q+K, PCA+K, Q+PCA and PCA+D (Distance matrices) (Fredua-Agyeman et al., 2020). Furthermore, three additional GWAS methods were employed using the GAPIT v. 3 (Wang and Zhang, 2021) package in R. These included the Bayesian-information and Linkage-disequilibrium Iteratively Nested Keyway (BLINK) (Huang et al., 2019), the Fixed and random model Circulating Probability Unification (FarmCPU) (Liu et al., 2016), and the Multiple Locus Mixed Linear Model (MLMM) (Segura et al., 2012).
The SNP-based GWAS was conducted for the B. rapa + B. napus accessions using the 4,972 A-genome SNP marker data. Two independent AUDPC measurements and the average of two sets of AUDPC phenotype data were utilized. This analysis was performed using the seven models and three methods noted above. Similarly, the 4,621 C-genome SNP marker data and two independent measurements of AUDPC, along with the average of two sets of AUDPC data for each genotype, were used for the GWAS of the B. oleracea + B. napus genotypes. For each model/method and genotype combination, Quantile-Quantile (Q-Q) plots were examined to identify which plot showed the least amount of deviation from the expected –log10 P-value. Significant markers associated with Verticillium stripe resistance were identified by examining the best-fitted Q-Q plots and Manhattan plots. These plots were generated using the CMplot package in R. To establish the significance cut-off (-log10 (0.05/n), n = number of markers), the Bonferroni correction was applied (Benjamini and Hochberg, 1995). A slightly lower threshold of -log10 P = 3.0 was employed for association. Significant SNP markers associated with Verticillium stripe resistance were identified using the various models and methods.
Construction of haplotype blocks
Haplotype association tests were performed using three different algorithms (Confidence Interval [CI], Four Gamete Rule [FGR], and Solid Spine of LD [SS]) implemented in the software Haploview v 4.2 (Barrett et al., 2005). Haplotype blocks were constructed for each chromosome separately to identify SNPs in the same haploblock and to investigate the combined effect of the linked significant SNPs. Each analysis was carried out using the default settings and the standardized disequilibrium coefficient (D’) was used to determine the LD between SNP markers and to generate halpoview LD plots. Blocks were formed if ≥ 95% of the comparisons exhibited strong LD. The haplotype blocks were transformed into multiallelic markers and used for haplotype-trait association analyses (Abed and Belzile, 2019; Bajgain and Anderson, 2021).
Candidate gene prediction
The probe sequences of SNP markers significantly associated with VL resistance were utilized in BlastN searches of the B. rapa (AA) genome assembly CAAS_Brap_v3.01, B. oleracea (CC) genome assembly BOL, and B. napus (AACC) genome assembly Da-Ae in the EnsemblPlants (plants.ensembl.org) and National Centre for Biotechnology Information (www.ncbi.nlm.nih.gov) databases. Using a threshold of ≥ 90% identity and an E-value ≤ 1e-20, candidate genes were mapped to the reference genomes. The physical locations of these genes were determined based on the significant SNPs and haploblocks in strong LD.
Results
Verticillium stripe phenotyping
Excluding the susceptible and moderately resistant checks, 20 (9.6%) of the remaining 209 Brassica genotypes tested were classified as resistant (R), 13 (6.2%) as moderately resistant (MR), 89 (42.6%) as moderately susceptible (MS), and 87 (41.6%) as susceptible (S) (Figure 1A).
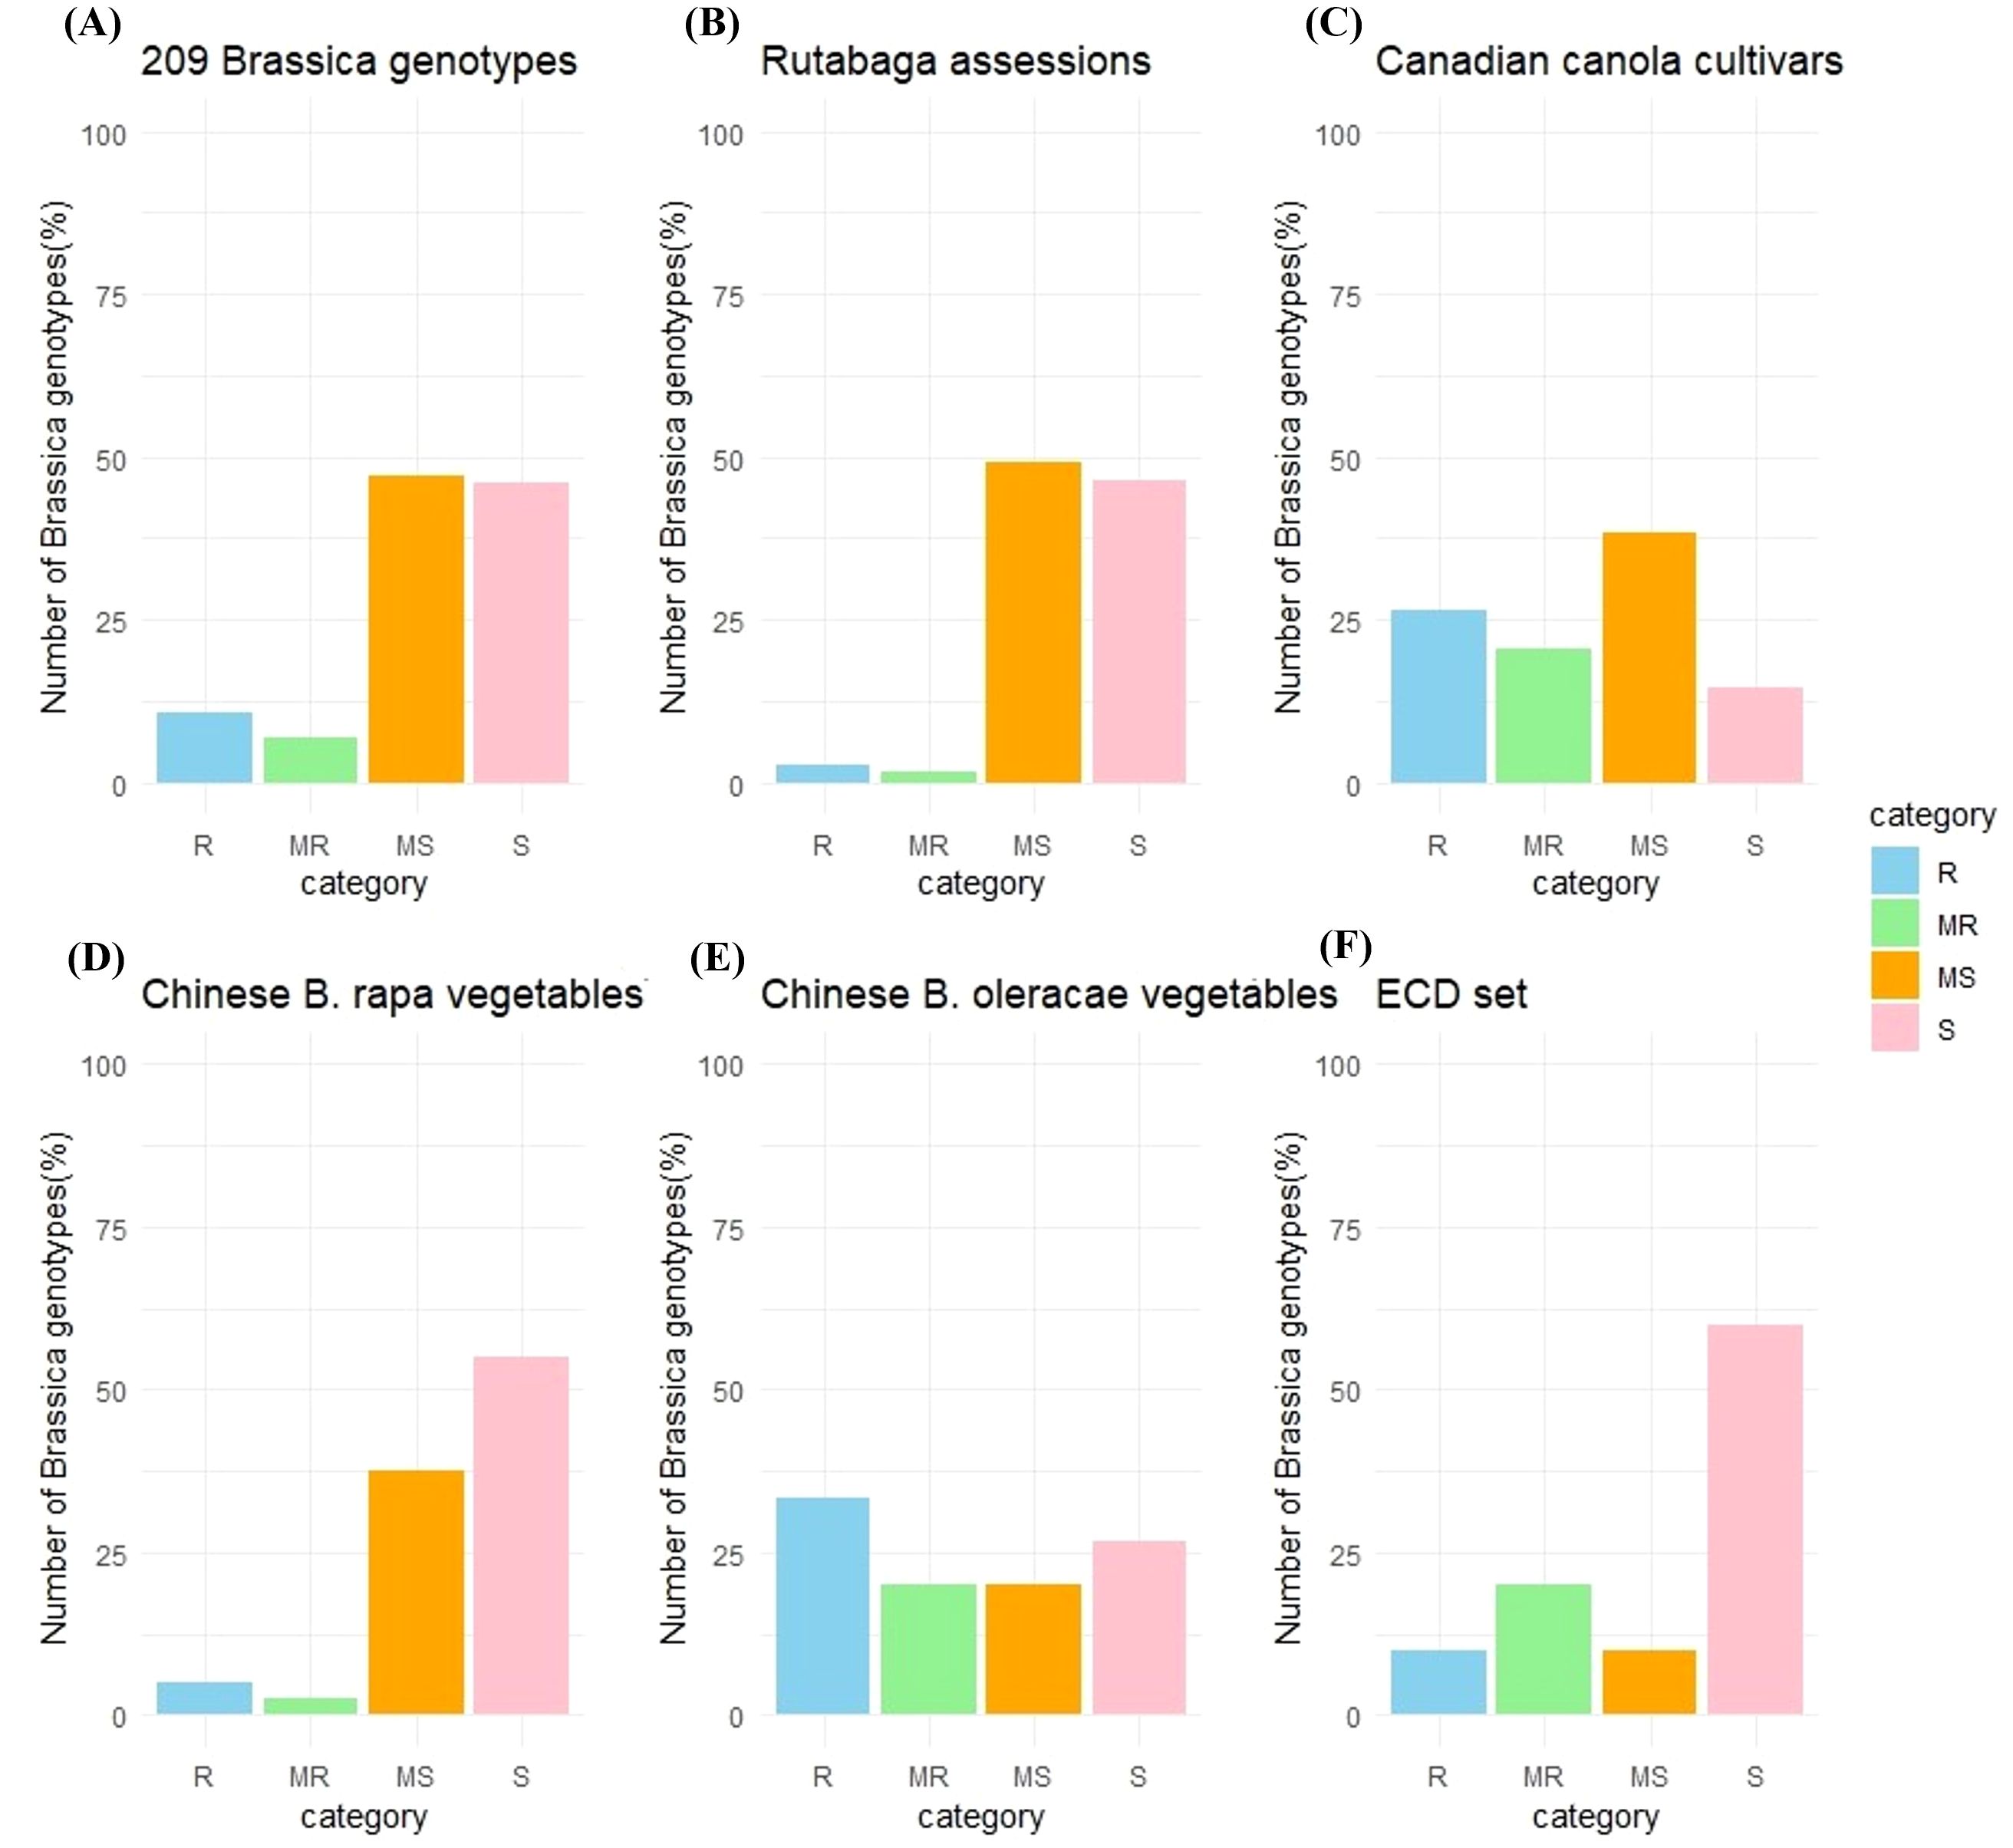
Figure 1. Reaction of Brassica genotypes to inoculation with Verticillium longisporum. Genotypes were rated as susceptible (S), moderately susceptible (MS), moderately resistant (MR), or resistant (R) to the fungus based on disease severity. Frequency distributions for host reactions are shown for (A) the entire collection of 209 genotypes excluding the susceptible and moderately resistant checks; (B) 110 rutabagas (B. napus ssp. napobrassica); (C) 34 canola (B. napus) cultivars; (D) 39 vegetable-type B. rapa; (E) 15 vegetable-type B. oleracea; and (F) 10 selected hosts of the European Clubroot Differential (ECD) set, excluding the moderately resistant-check ECD 05.
Among the 110 rutabaga accessions screened, three (2.7%) were R, two (1.8%) were MR, 54 (49.1%) were MS, and 51 (46.4%) were S (Figure 1B). The AUDPCnorm. scores from the first and second rounds of screening ranged from 0.295 ± 0.181 to 2.741 ± 0.717, and from 0.242 ± 0.095 to 4.497 ± 2.051, respectively, while the average AUDPCnorm. score of the two rounds ranged from 0.269 ± 0.137 to 3.533 ± 1.690 (Supplementary Figure S1A).
The AUDPCnorm. values for 34 of the 35 Canadian commercial canola cultivars, excluding the susceptible check ‘Westar’, showed that nine (26.5%) were classified as R, seven (14.7%) as MR, 13 (47.1%) as MS, and five (11.8%) as S (Figure 1C). The first round of AUDPCnorm. scores ranged from 0.016 ± 0.028 to 3.448 ± 0.442, the second round ranged from 0.177 ± 0.037 to 2.541 ± 0.836, and the average AUDPCnorm. scores from the two rounds ranged from 0.101 ± 0.188 to 2.994 ± 0.786 (Supplementary Figure S1B).
Among the 40 B. rapa vegetable cultivars from China, two (5.0%) were classified as R, one (2.5%) as MR, 15 (37.5%) as MS, and 22 (55.0%) as S (Figure 1D). The AUDPCnorm. scores from the first and second rounds ranged from 0.120 ± 0.034 to 3.370 ± 0.012, and from 0.138 ± 0.037 to 3.040 ± 0.421, respectively, while the average AUDPCnorm. scores from the two rounds ranged from 0.129 ± 0.034 to 3.202 ± 0.084 (Supplementary Figure S1C).
In the case of the 15 B. oleracea vegetable cultivars from China, five (33.3%) were classified as R, three (20.0%) as MR, three (20.0%) as MS, and four (26.7%) as S (Figure 1E). The first round of AUDPCnorm. scores ranged from 0.158 ± 0.026 to 0.918 ± 0.411, the second round ranged from 0.159 ± 0.063 to 1.718 ± 0.928, and the average AUDPCnorm. score from the two rounds ranged from 0.168 ± 0.058 to 1.315 ± 0.709 (Supplementary Figure S1D).
Besides the moderately resistant check ECD 05 (‘Grannat’), among the other 10 selected hosts of the ECD set, one (10.0%) (ECD 11) was classified as R, two (20.0%) (ECD 08 and ECD13) as MR, one (10.0%) as MS (ECD 09), and six (60.0%) (ECD 01, ECD 02, ECD 03, ECD 04, ECD 06 and ECD10) as susceptible (S) (Figure 1F). The AUDPCnorm. scores from the first and second rounds of screening ranged from 0.064 ± 0.051 to 3.599 ± 0.232, and from 0.208 ± 0.134 to 2.989 ± 0.338, respectively. The average AUDPCnorm. scores from the two rounds ranged from 0.186 ± 0.161 to 3.294 ± 0.473 (Supplementary Figure S1E).
Based on the average AUDPCnorm. scores, 20 Brassica genotypes showing a strong level of resistance to V. longisporum were identified. These included the rutabagas FGRA043, FGRA053, and FGRA063; canola cultivars CC2, CC4, CC5, CC7, CC10 and CC15; B. rapa cultivars ‘Jingyan Zikuaicai’, and ‘Jingjian No.70’; B. oleracea cultivars ‘Zigan2’, ‘Zhongqing 18’, ‘Zhongqing 12’, ‘Zhonggan 11’, and ‘8398’; and ECD 11 (Figure 2).
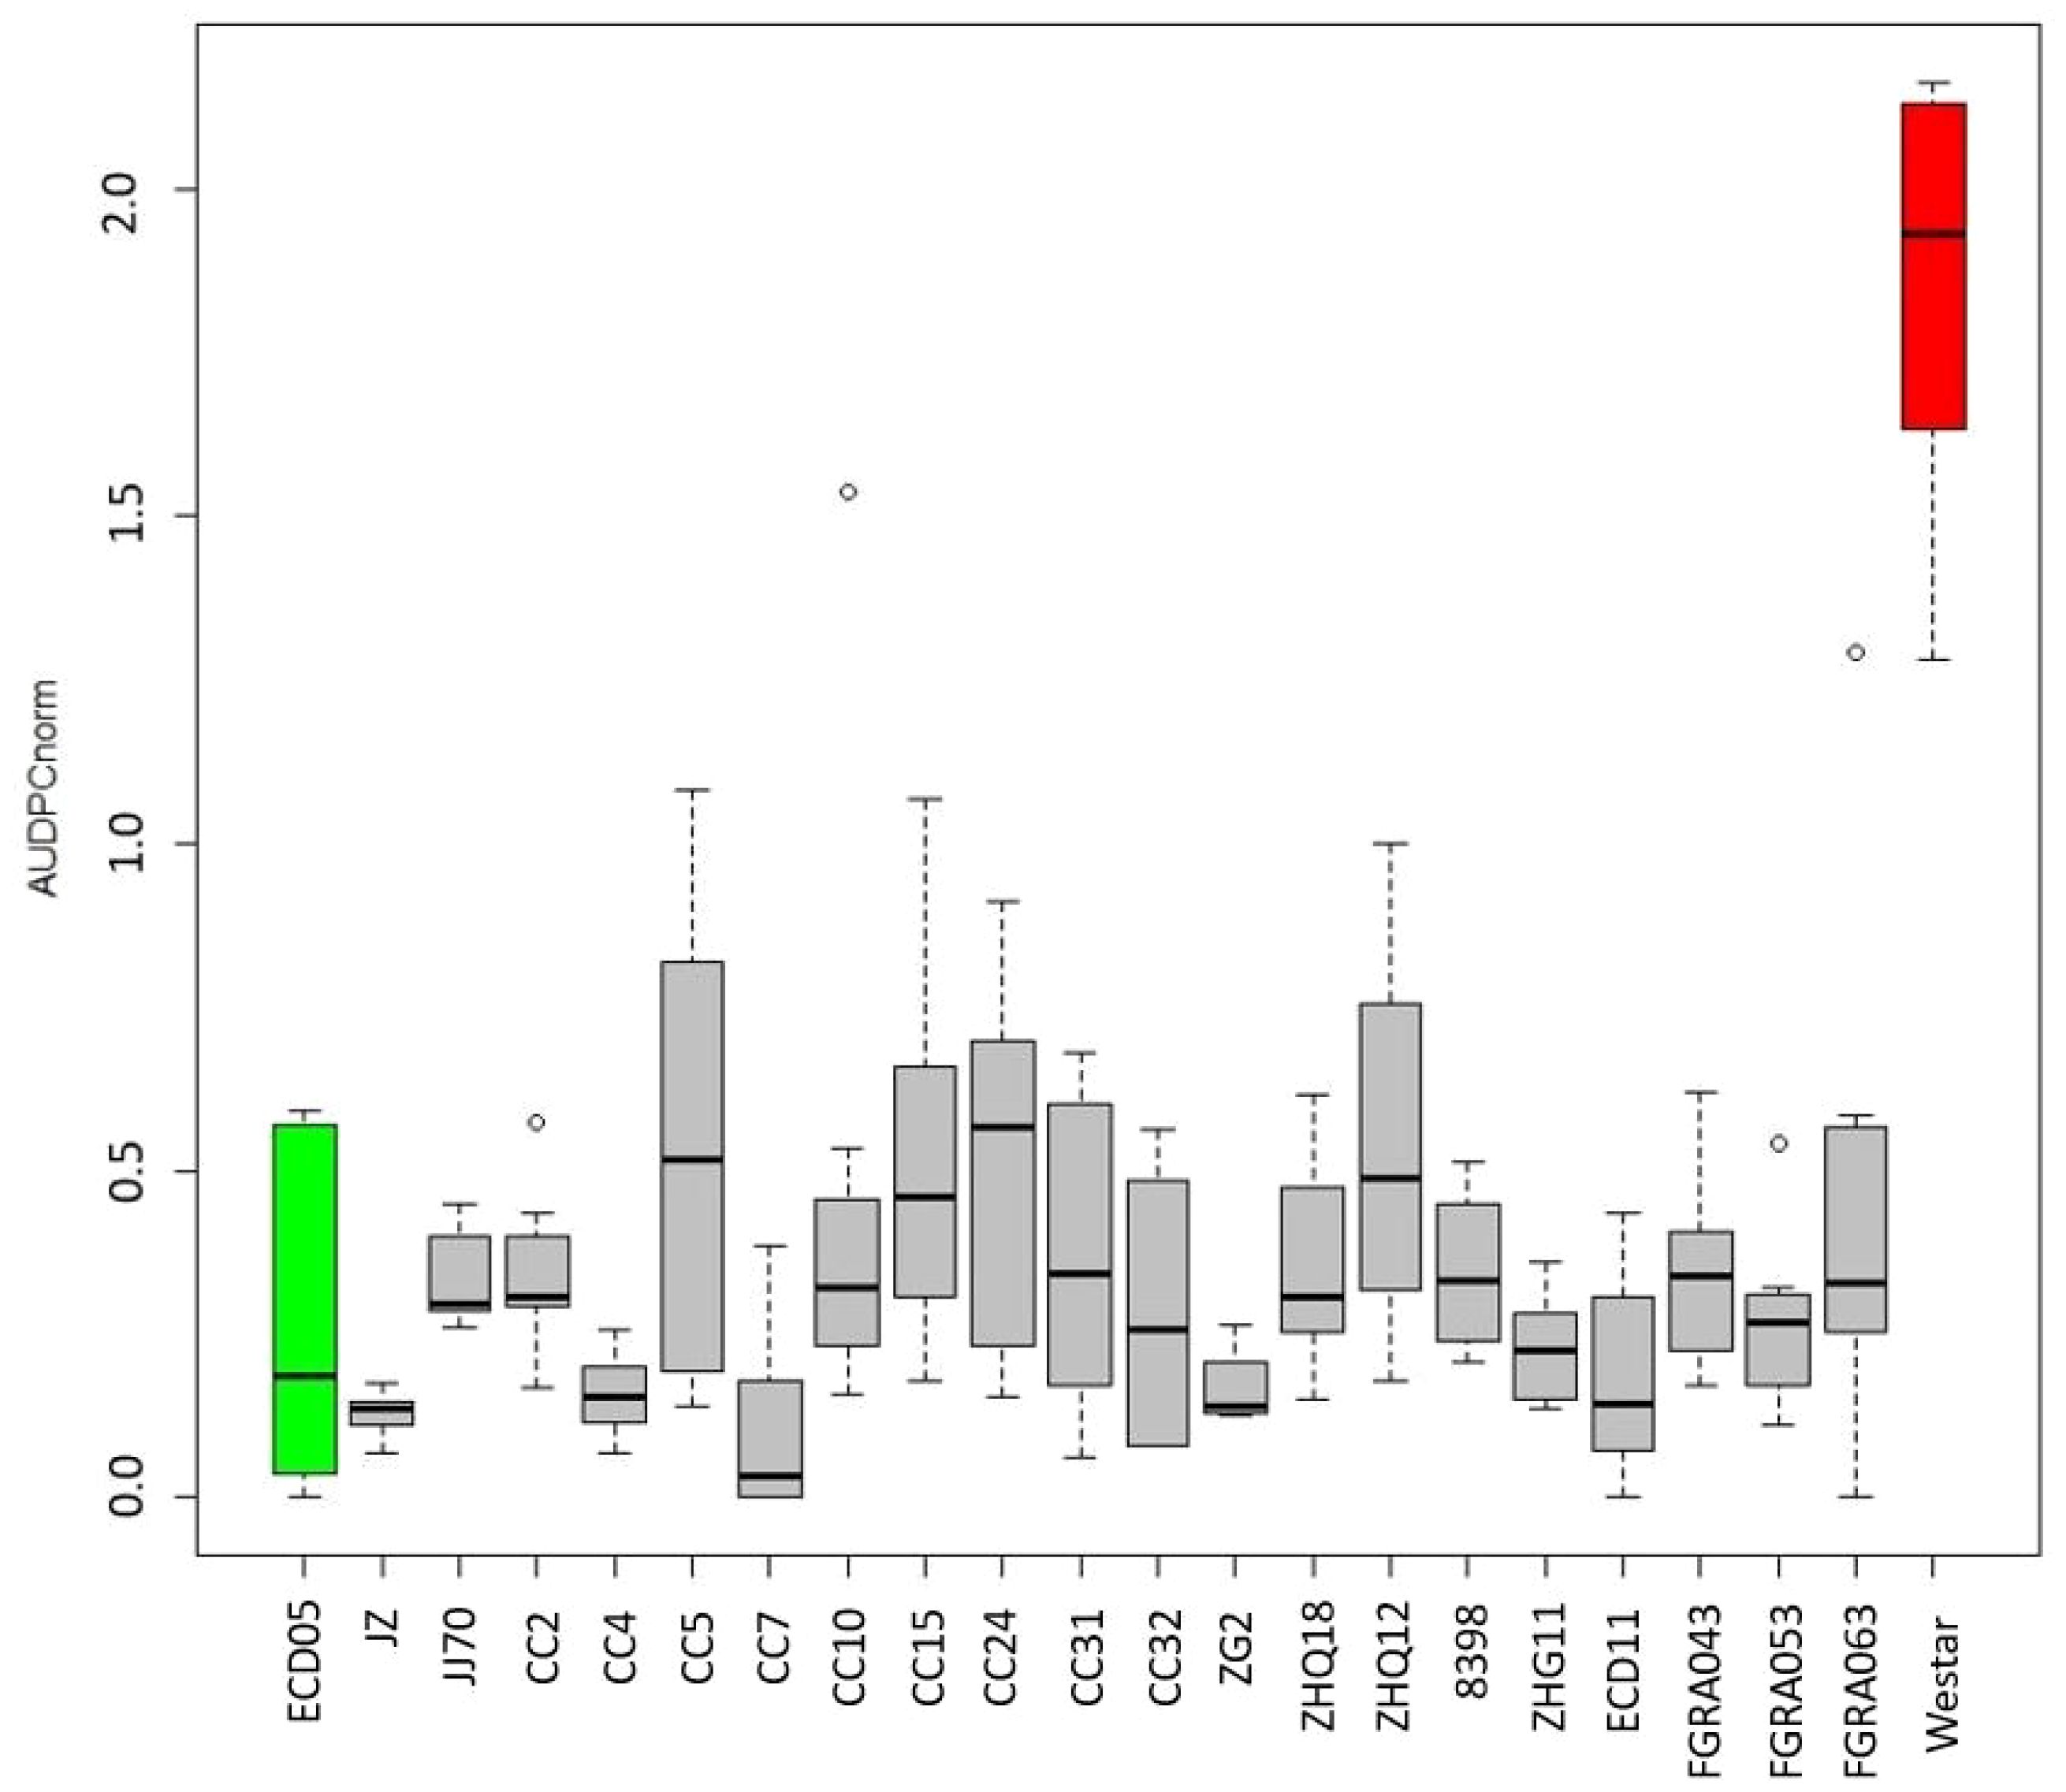
Figure 2. Normalized area under the disease progress curve (AUDPCnorm.) for 20 Brassica genotypes showing resistance to Verticillium longisporum. The AUDPCnorm. was calculated from disease severities rated from 1–9 following Eynck et al. (2009), where 1 = no symptoms and 9 = the plant is dead. The grey bars show the range of the maximum and minimum AUDPCnorm., and the black lines in each box indicate the mean of AUDPCnorm. values among eight replicates in two independent repeats. The green bar denotes the moderately resistant check B. rapa var. pekinensis ‘Granaat’ (ECD 05), while the red bar denotes the susceptible check B. napus ‘Westar’. The other genotypes shown include the rutabagas (B. napus ssp. napobrassica) FGRA043, FGRA053, and FGRA063; canola (B. napus) cultivars CC2, CC4, CC5, CC7, CC10 and CC15; B. rapa cultivars ‘Jingyan Zikuaicai’ (JZ), and ‘Jingjian No.70’ (JJ70); B. oleracea cultivars ‘Zigan2’ (ZG2), ‘Zhongqing 18’ (ZHQ18), ‘Zhongqing 12’ (ZHQ12), ‘Zhonggan 11’ (ZHQ11), and ‘8398’; and ECD 11.
Distribution of polymorphic SNP markers
Table 1 presents the number and distribution of SNP markers retained in the GWAS to determine resistance to V. longisporum. In the GWAS of the B. rapa and B. napus accessions, the mean number of filtered SNP markers was 497.2 ± 130.6, ranging from 370 on chromosome A09 to 779 on chromosome A03 (Table 1). The filtered set of 4,972 markers covered 291.6 Mb of the A-genome in B. rapa and B. napus (Table 1). The mean inter-SNP marker distance or density for the A-genome was 61.6 ± 21.5 Kb, ranging from 41.3 on chromosome A07 to 115.7 on chromosome A09 (Table 1). In the GWAS of the B. oleracea and B. napus accessions, the mean number of filtered SNP markers was 513.4 ± 207.5, ranging from 231 on chromosome C09 to 829 on chromosome C03 (Table 1). The filtered set of 4,621 markers covered 463.4 Mb of the C-genome in B. oleracea and B. napus (Table 1). The mean inter-SNP marker distance or density for the C-genome was 117.8 ± 59.3 Kb, ranging from 65.0 on chromosome C07 to chromosome C09 255.5 (Table 1).
Linkage disequilibrium
The average of the squared allele correlation LD (r2) for all chromosomes is presented in Table 1 and the plots of correlation coefficient (r2) and physical distance (in Mb) for SNP markers on chromosomes A and C are presented in Supplementary Figure S2. The mean r2 value for the A-genome of B. rapa and B. napus was calculated to be 0.163, ranging from 0.144 on chromosome A09 to 0.223 on chromosome A08 (Table 1). The average extent of LD decay for the 10 A-genome chromosomes (A1-A10) ranged from 0.42 Mb on chromosome A08 to 1.15 Mb on chromosome A09, with an estimated mean of 0.60 Mb (Table 1). The mean r2 for the C-genome of B. oleracea and B. napus was 0.277, ranging from 0.243 on chromosome C08 to 0.358 on chromosome C01 (Table 1). The estimated mean LD decay for the nine C-genome chromosomes (C1 to C9) ranged from 0.68 Mb on chromosome C07 to 1.85 Mb on chromosome C09, with an estimated mean of 0.42 Mb (Table 1). Therefore, the extent of LD for the C-genome chromosomes was slightly greater than for the A-genome chromosomes.
Population structure analyses
Two clusters (K=2) were determined at all runs (10,000, 50,000 and 100,000 burn-in iterations and MCMC lengths) by the method of Evanno et al. (2005) using STRUCTURE for the analyses of both B. rapa + B. napus (Figure 3A) and B. napus + B. oleracea (Figure 3B). At a probability of 70%, 77 (39.7%) of the B. rapa and B. napus genotypes were placed in group 1, 108 (55.7%) were placed in group 2, while 9 (4.6%) were classified as admixtures (Figure 3C). In group 1, there were 45 B. rapa genotypes, including 40 vegetable cultivars from China and the ECD lines 01–05, along with 32 Canadian canola cultivars. In Group 2, there were 106 rutabagas, along with ECD 10 and one Canadian canola cultivar. Additionally, there were two Canadian canola cultivars, along with ECD 06–09 and four rutabagas classified as admixtures.
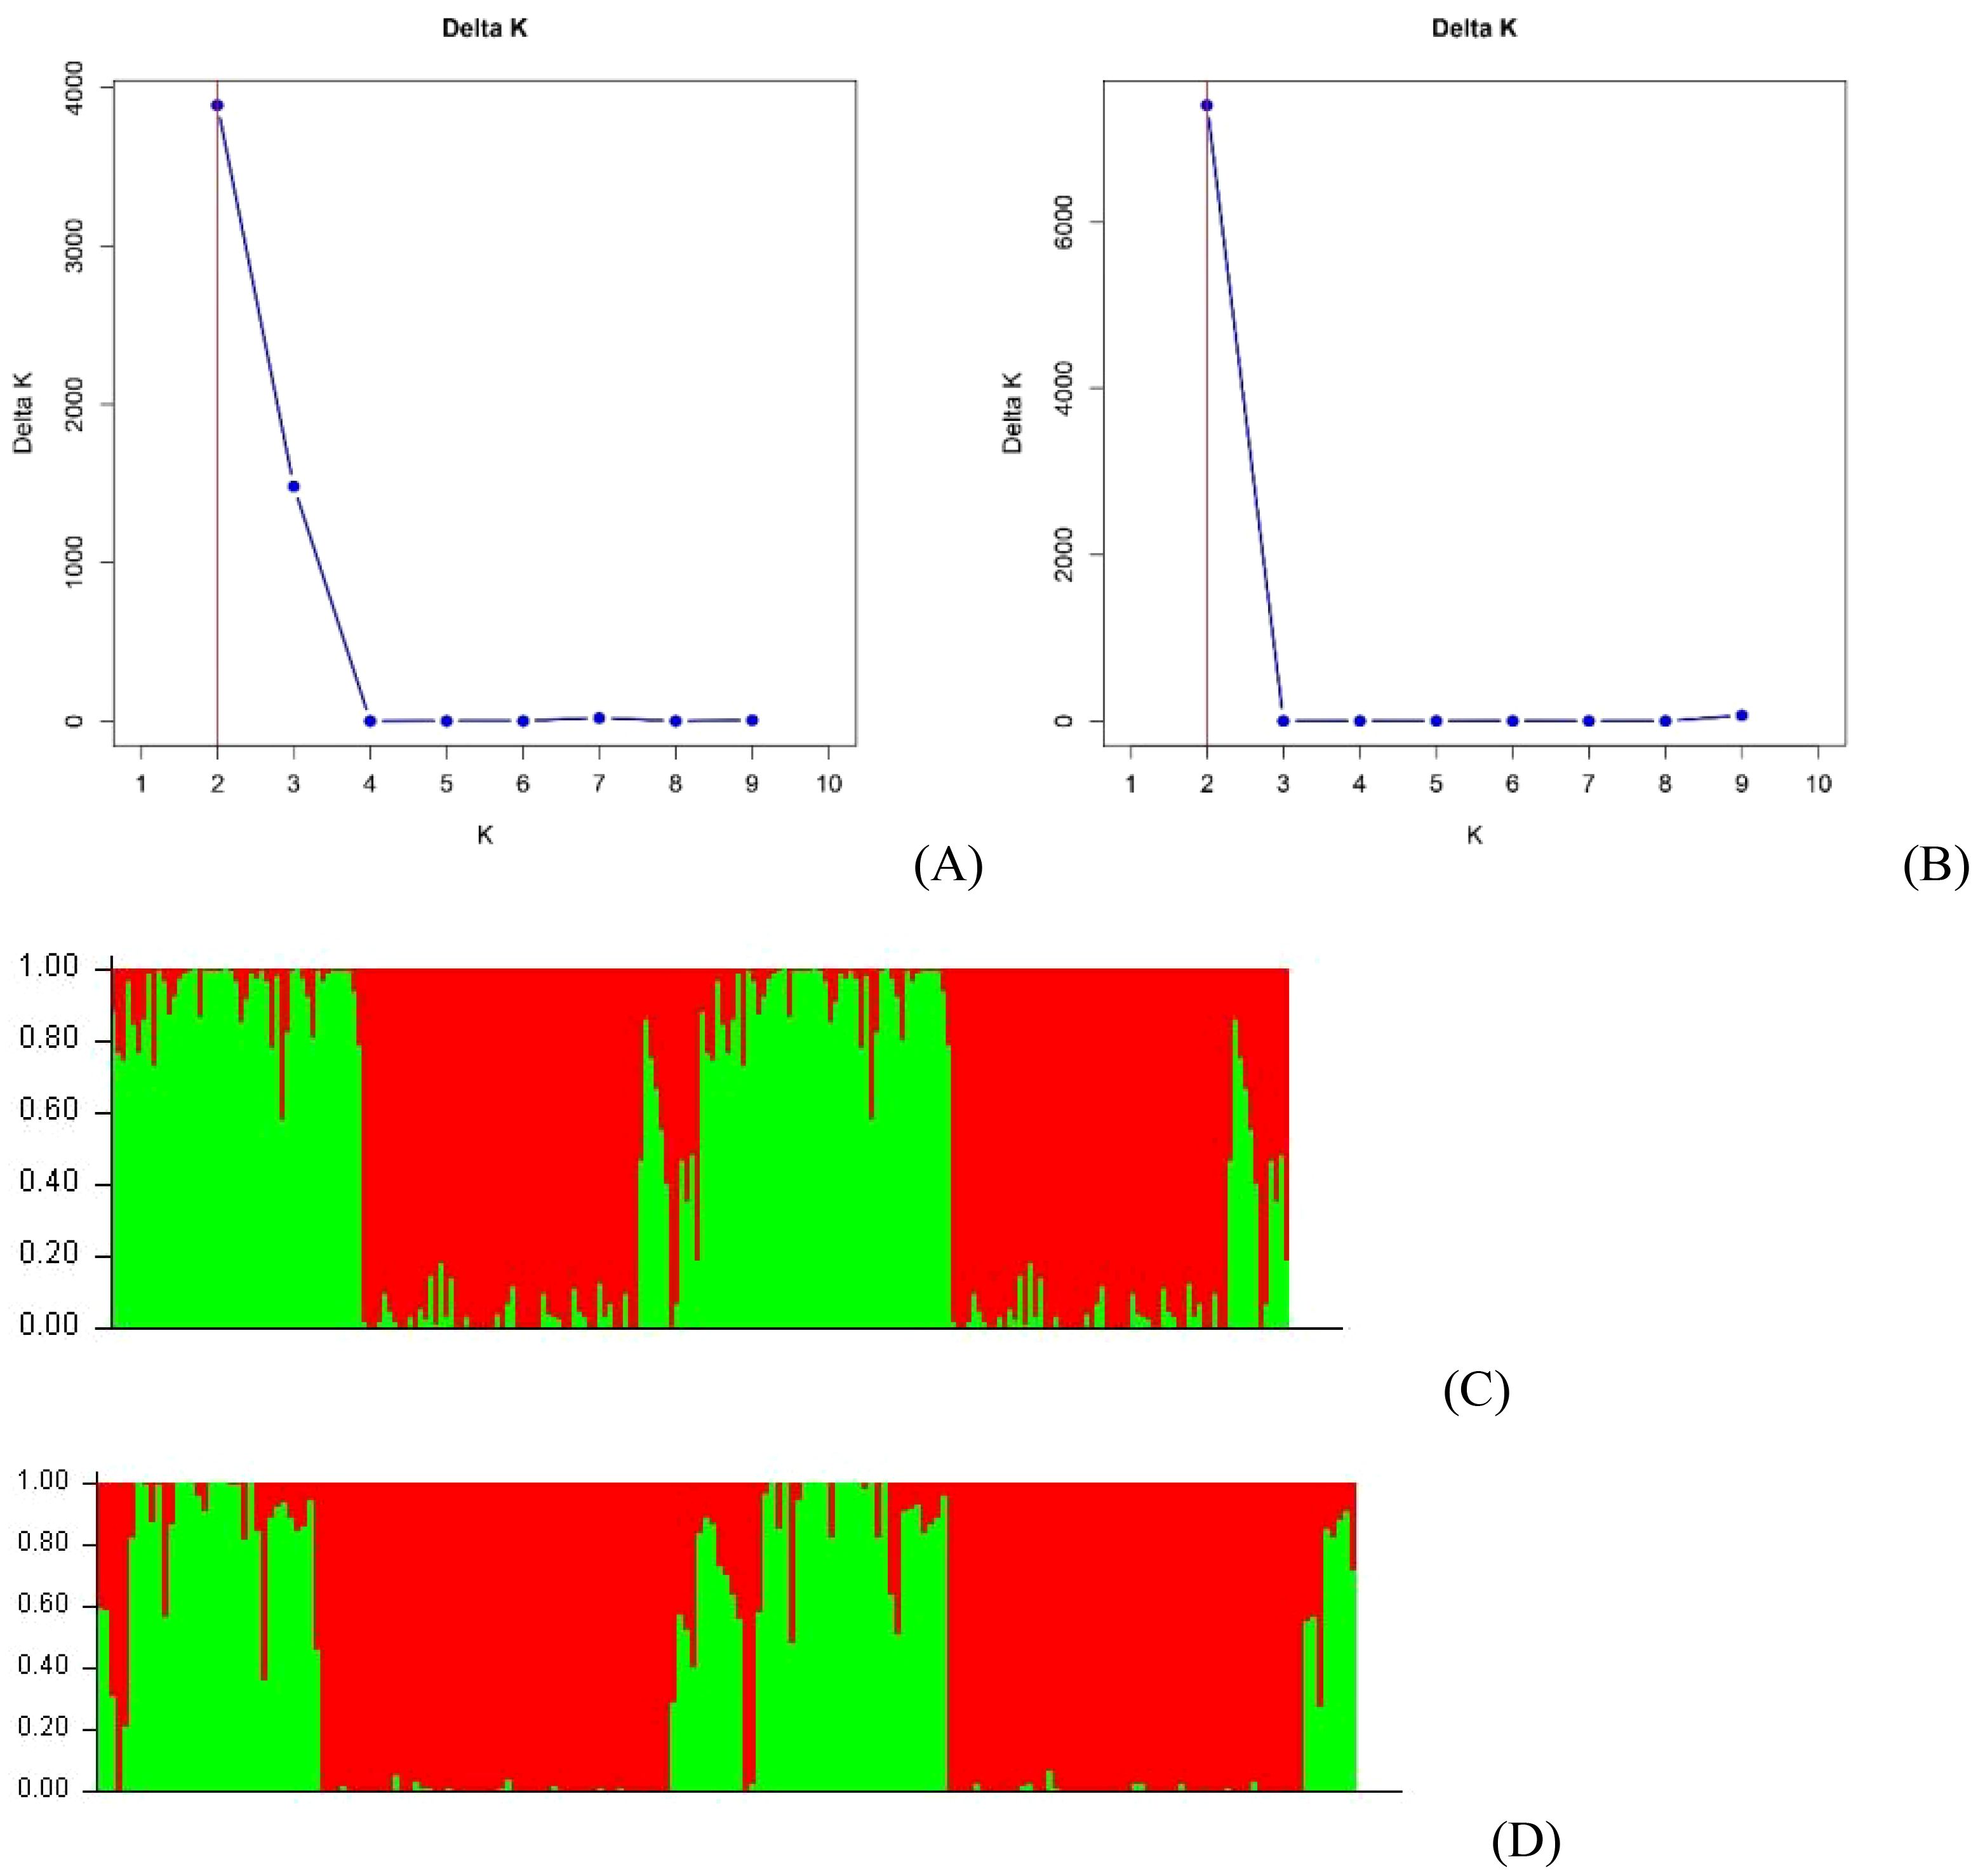
Figure 3. Bayesian cluster analysis of 211 Brassica accessions including B. napus, B. oleracea and B. rapa estimated with STRUCTURE using 50,000 burn-in iterations and Markov Chain Monte Carlo (MCMC) lengths. The value of K, determined following Evanno et al. (2005), indicated two clusters for the B. rapa and B. napus genotypes (A), and for the B. oleracea and B. napus genotypes (B), in all runs. Detailed Bayesian clustering of the B. rapa and B. napus genotypes (C), and of the B. oleracea and B. napus genotypes (D), is also shown, with each color representing one ancestry component. The simplified view suggests two ancestral populations.
Among the B. oleracea and B. napus genotypes, 51 (30.7%) were placed in group 1, 110 (66.3%) in group 2, while five (3.0%) were classified as admixtures based on a probability of 70% (Figure 3D). In group 1, there were 17 B. oleracea genotypes, including 15 vegetable cultivars, ECD 11, and ECD 13, as well as 34 Canadian canola cultivars. Group 2 consisted of 108 rutabagas, ECD 10, and one Canadian canola cultivar. The admixtures included ECD 06–09 and two rutabagas.
NJ and UPGMA cluster analyses
The NJ and UPGMA clustering was performed using 4,972 A-genome SNP markers for 194 B. rapa (45) and B. napus (149) genotypes, and 4,621 C-genome SNP markers for 166 B. oleracea (17) and B. napus (149) genotypes.
The cluster analyses of B. rapa and B. napus, using both the NJ and UPGMA methods, grouped them into five major branches. These comprised 4, 40, 34, 6, and 110 accessions in clusters 1, 2, 3, 4, and 5, respectively (Figures 4A, B). Cluster 1 (N1 and U1) included ECD 01–04 (B. rapa). Cluster 2 (N2 and U2) included 39 B. rapa vegetable cultivars and ECD 05. Cluster 3 (N3 and U3) encompassed ECD 06–09, two rutabagas, and one Canadian canola cultivar. Cluster 4 (N4 and U4) consisted of 34 Canadian canola cultivars and one B. rapa vegetable cultivar. The remaining 108 rutabagas, along with ECD 10 and one Canadian canola cultivar, were grouped into cluster 5 (N5 and U5) (Figures 4A, B).
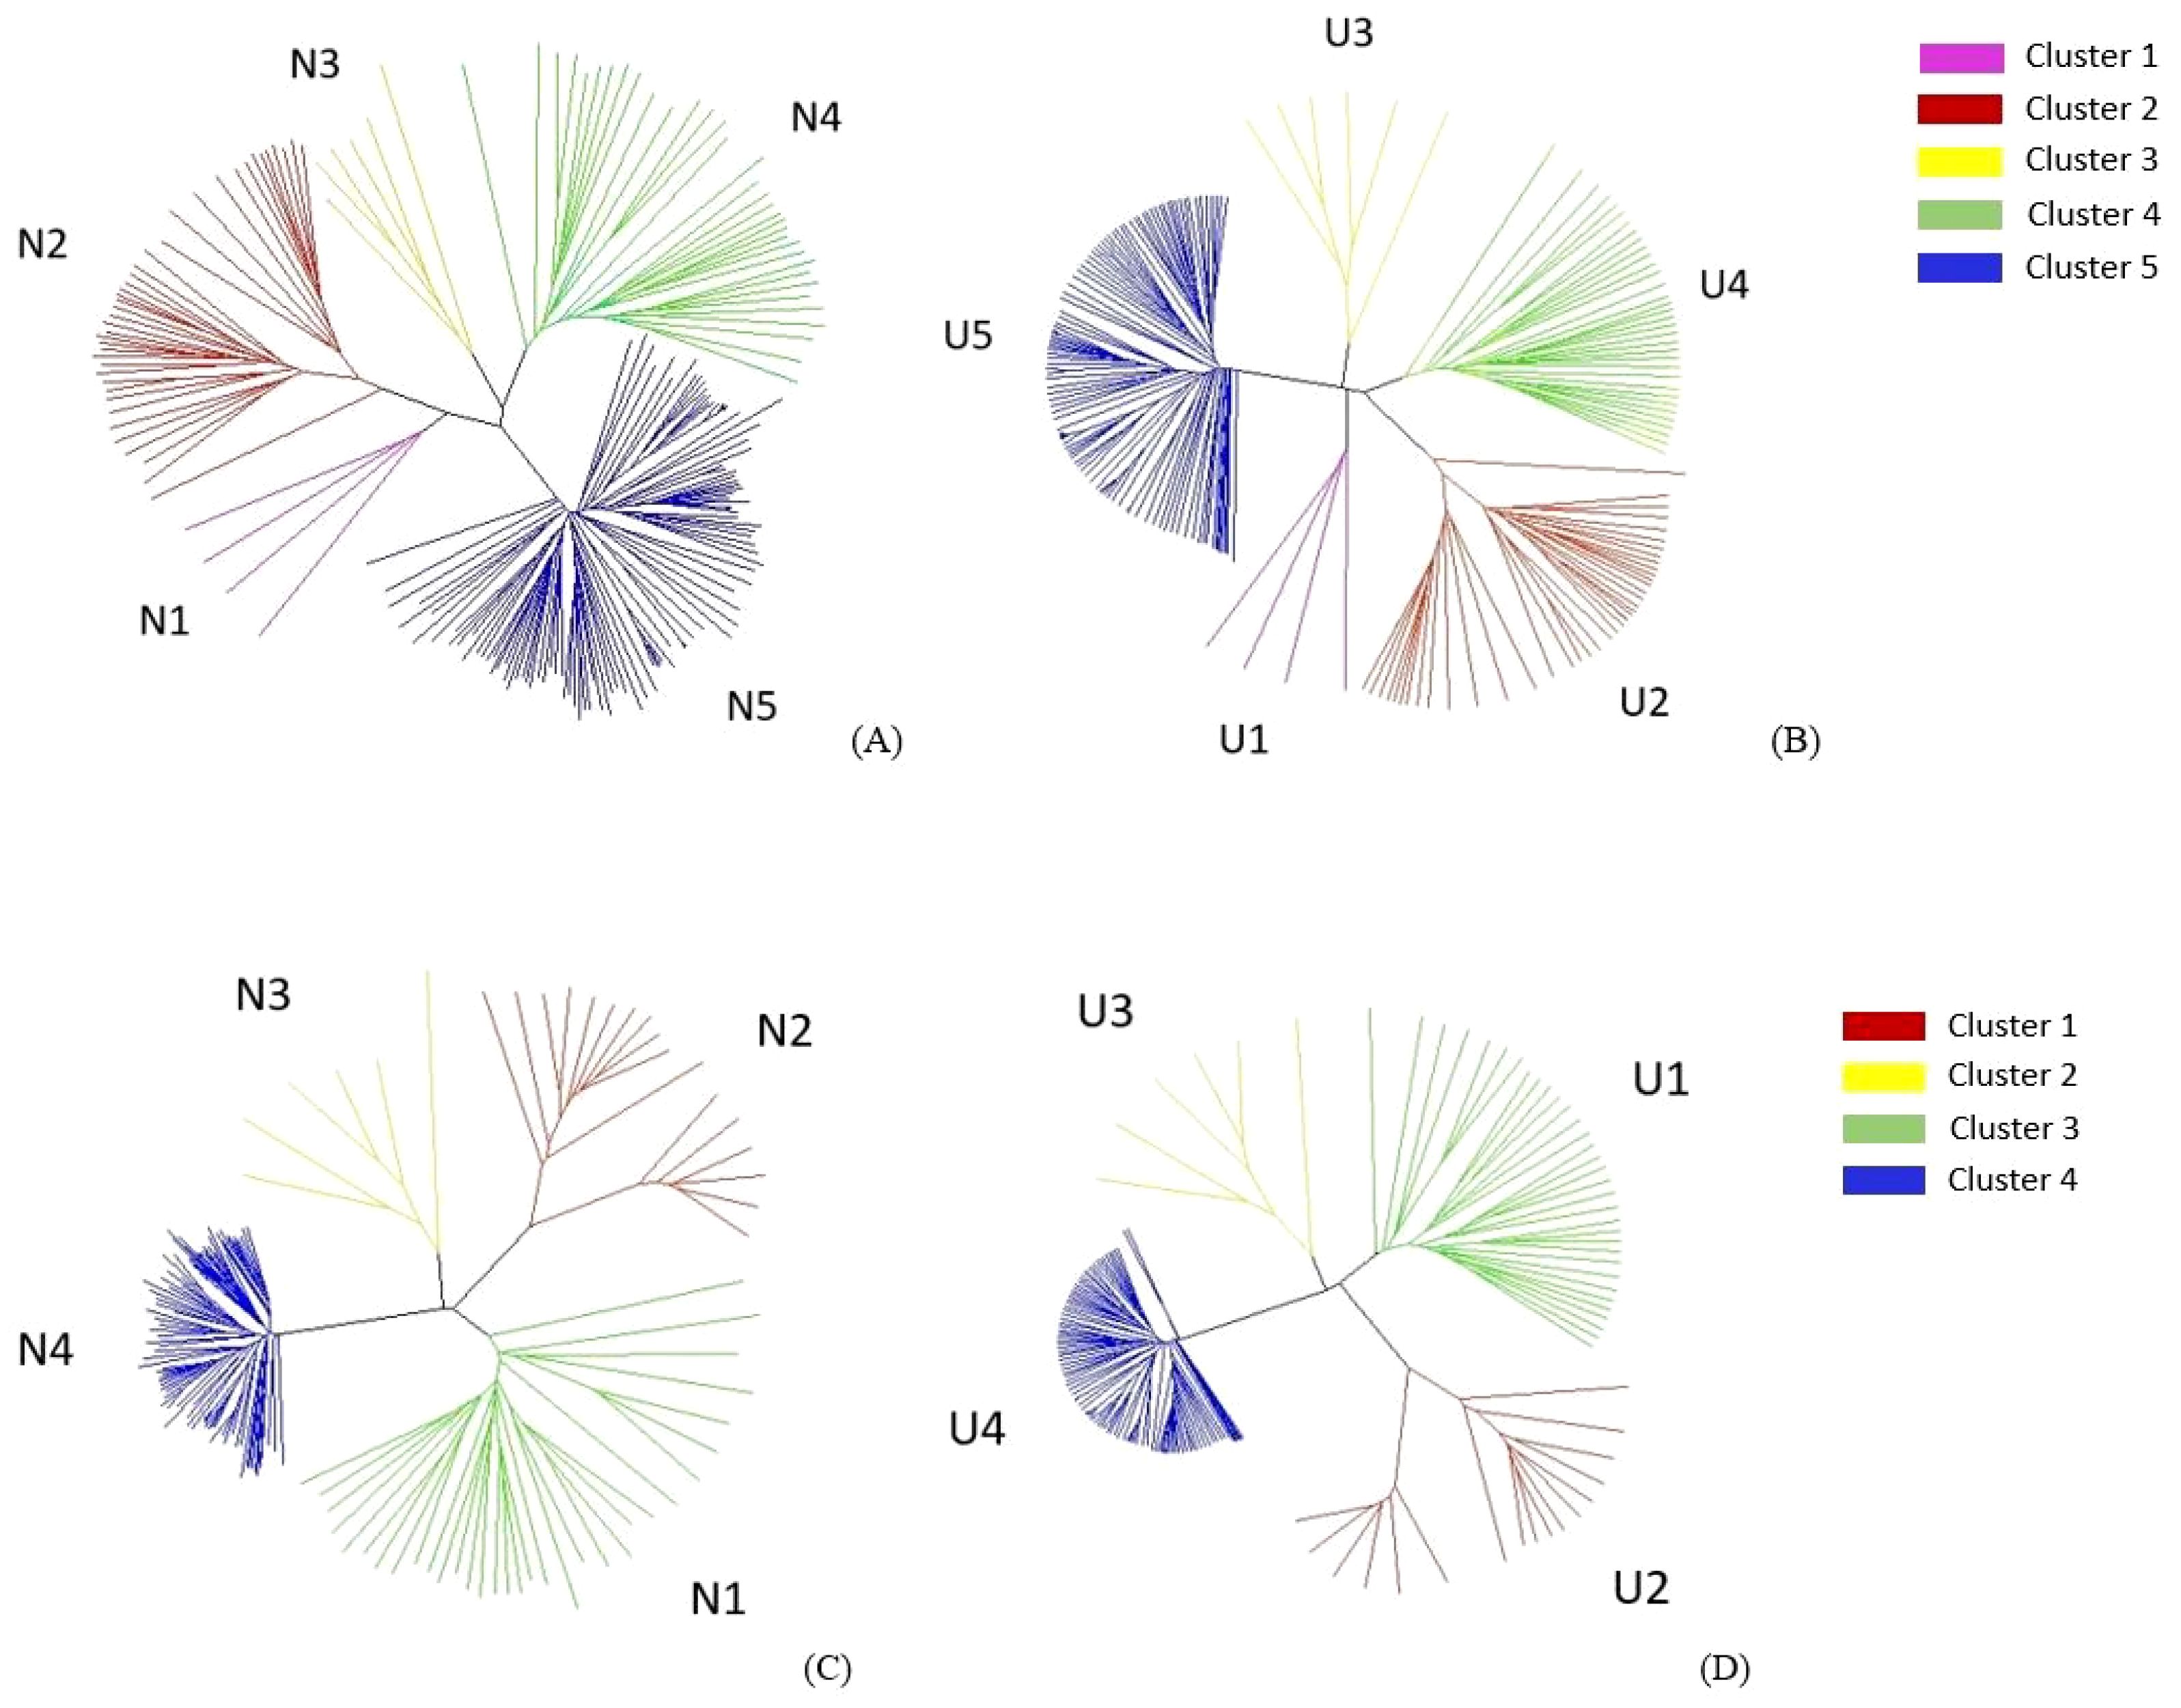
Figure 4. Neighbor joining (NJ) (A) and unweighted pair group method with arithmetic mean (UPGMA) (B) analysis with 4,972 A-genome markers grouped 194 Brassica rapa and Brasscia napus genotypes into five clusters. NJ (C) and UPGMA (D) analysis with 4,621 C-genome markers grouped 166 Brassica oleracea and B. napus genotypes into four clusters.
In the B. oleracea and B. napus cluster analyses, both the NJ and UPGMA methods grouped the genotypes into four major clusters, where clusters 1, 2, 3, and 4 comprised 33, 17, 6, and 110 accessions, respectively (Figures 4C, D). Cluster 1 (N1 and U1) consisted of 33 Canadian canola cultivars. Cluster 2 (N2 and U2) included 15 B. oleracea vegetable cultivars, ECD 11, and ECD 13. Cluster 3 (N3 and U3) comprised ECD 06–09, one Canadian canola cultivar, and two rutabagas. The remaining 108 rutabagas, along with ECD 10 and one Canadian canola cultivar, were grouped as cluster 4 (Figures 4C, D).
SNP-based association mapping of Verticillium stripe resistance loci
In the two GWAS, the observed -log10 P distribution showed greater deviation from the expected distribution in the Q-Q plots of the three GLMs than in the four MLMs. Among the four MLMs, the observed -log10 P distribution of the PCA + K and Q + K models deviated the least from the expected distribution compared with the Q + D and PCA + D models (Supplementary Figures S3A–G, K–Q). The observed -log10 P distribution of three other GWAS methods, namely BLINK, FarmCPU and MMLM, also exhibited minimal deviation from the expected distribution (Supplementary Figures S3H–J, R–T). Therefore, among the 10 models and methods tested, the PCA + K and Q+K models, along with the BLINK, FarmCPU, and MLMM methods, generated the best Q-Q plots. Consequently, Manhattan plots for these five methods were utilized to identify significant SNPs for Verticillium stripe resistance (Figures 5A–E, 6A–E). Based on the Manhattan plots, 45 SNP markers were found to be associated with resistance to this disease (Table 2). Among these significant markers, 38 SNPs were identified on the A-genome, while seven SNPs were on the C-genome (Table 2). The significant SNPs were distributed across all chromosomes except for chromosomes C01, C04, C07, and C09 (Table 2). Markers identified on chromosome A and chromosome C explained 1.7% to 34.2% and 7.7% to 58.2% of variation, respectively (Table 2). Marker Bn_A03_p2130281 on chromosome A03 and Bn_scaff_18181_1_p572911 on chromosome C05 explained the highest percentage of variation of 34.2% and 58.2% respectively (Table 2). The markers effect size ranged from -0.33 to 0.35 and -0.19 to 0.43 for chromosome A and chromosome C, respectively (Table 2). The allelic effects of 45 SNP markers were listed in Supplementary Table S2.
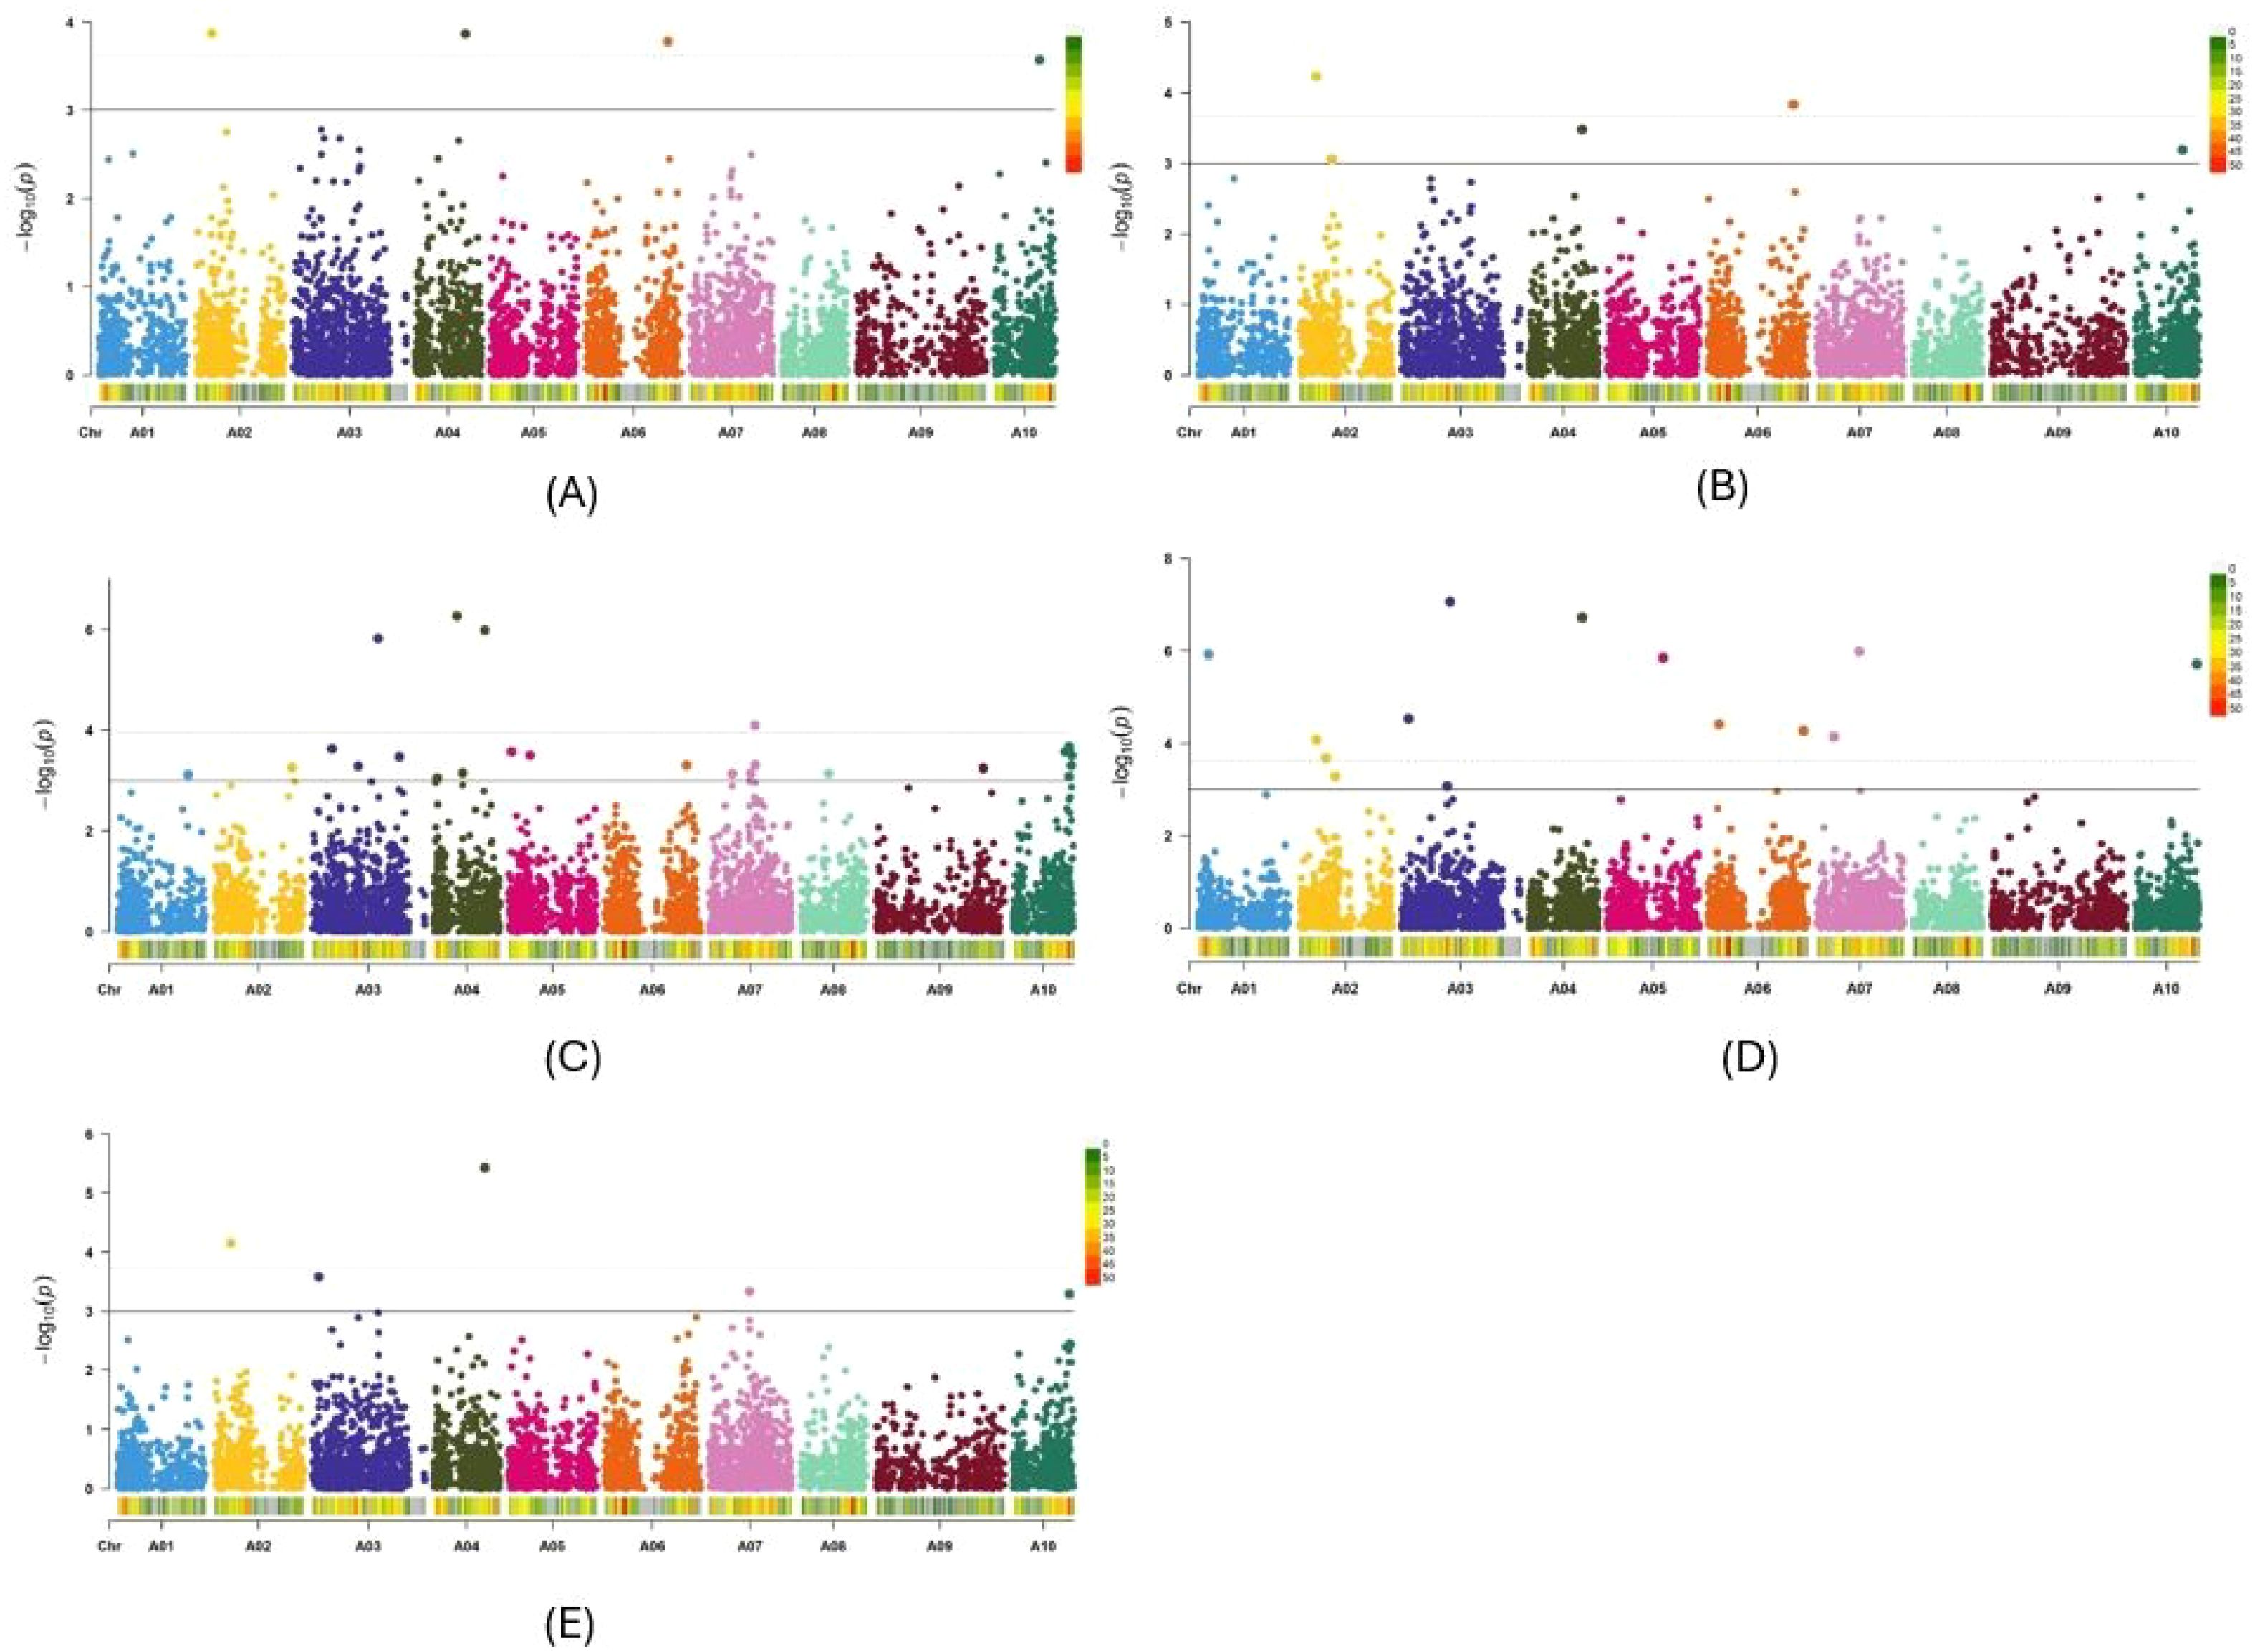
Figure 5. Manhattan plots of the PCA+K (A), Q+K (B), BLINK (C), FarmCPU (D) and MLMM (E) models for identifying Verticillium longisporum resistance in Brassica rapa + Brassica napus genotypes. The dashed horizontal lines indicate the Bonferroni-adjusted significance threshold known as “logarithm-of-odds” (LOD score). The solid lines indicate a slightly lower threshold of -log10 P = 3.0. The dots above the significance threshold indicate single-nucleotide polymorphisms (SNPs) associated with resistance to V. longisporum.
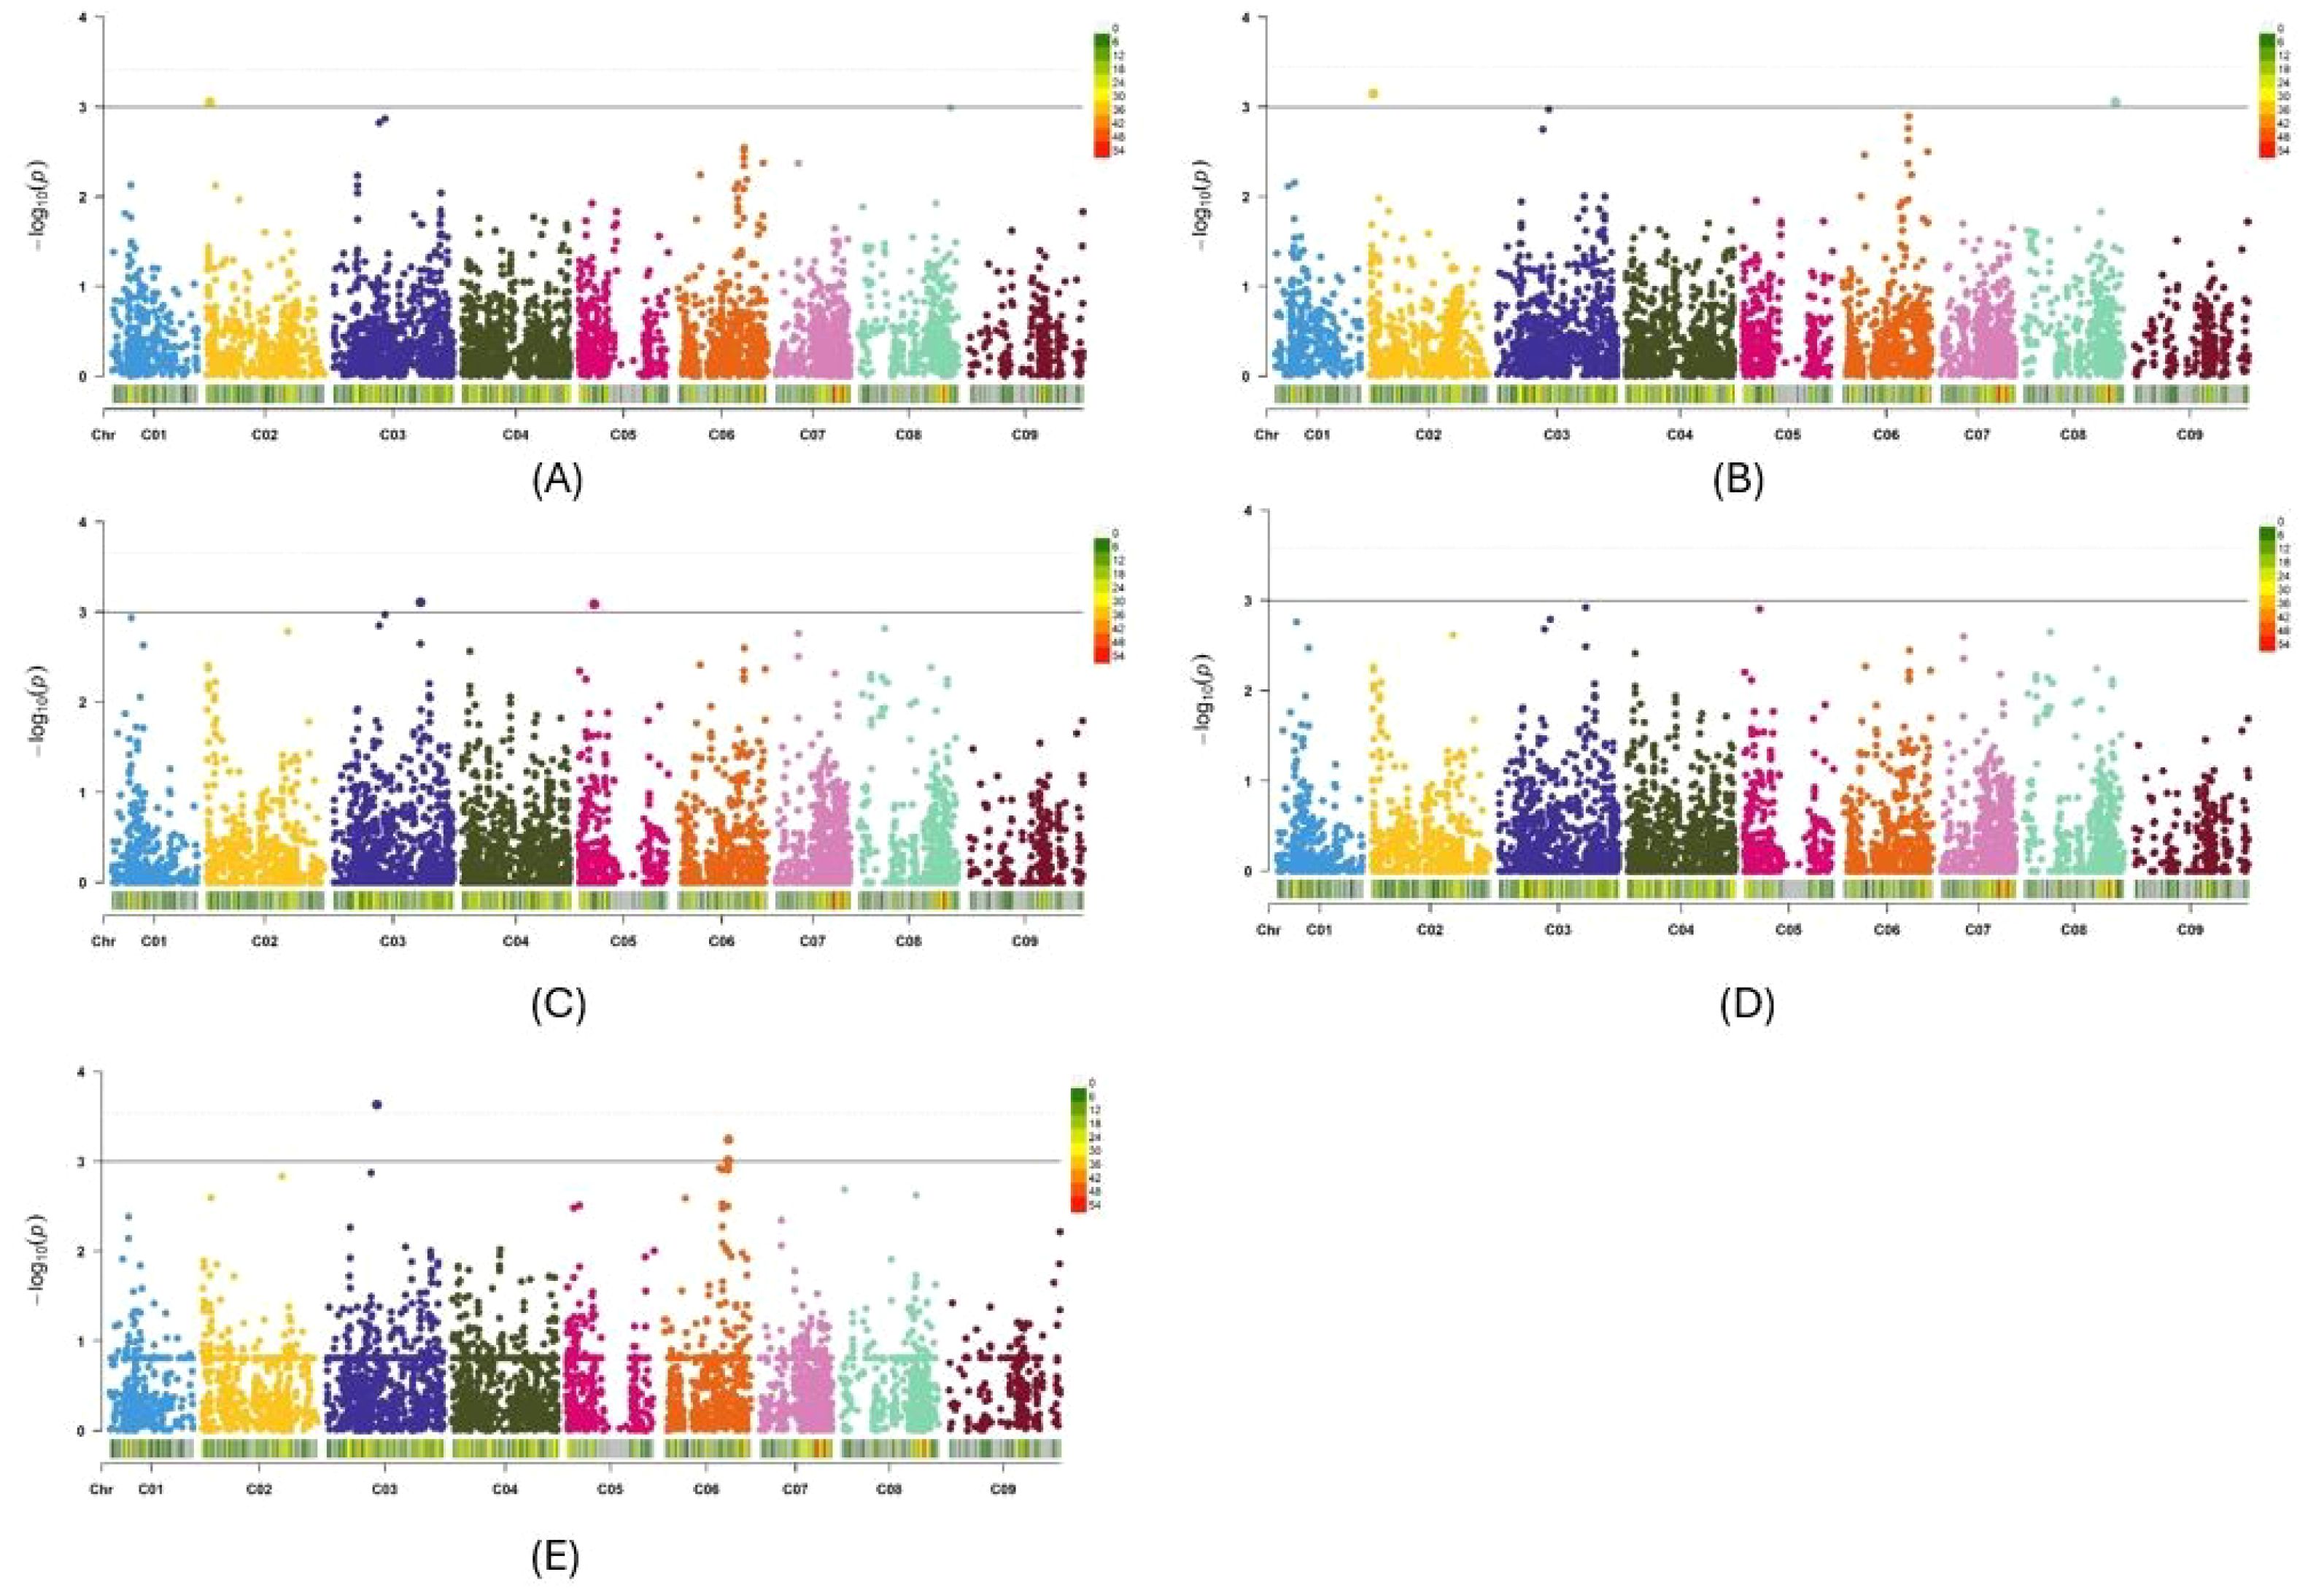
Figure 6. Manhattan plots of the PCA+K (A), Q+K (B), BLINK (C), FarmCPU (D) and MLMM (E) models for identifying Verticillium longisporum resistance in Brassica oleracea + Brassica napus genotypes. The dashed horizontal lines indicate the Bonferroni-adjusted significance threshold known as “logarithm-of-odds” (LOD score). The solid lines indicate a slightly lower threshold of -log10 P = 3.0. The dots above the significance threshold indicate single-nucleotide polymorphisms (SNPs) associated with resistance to V. longisporum.
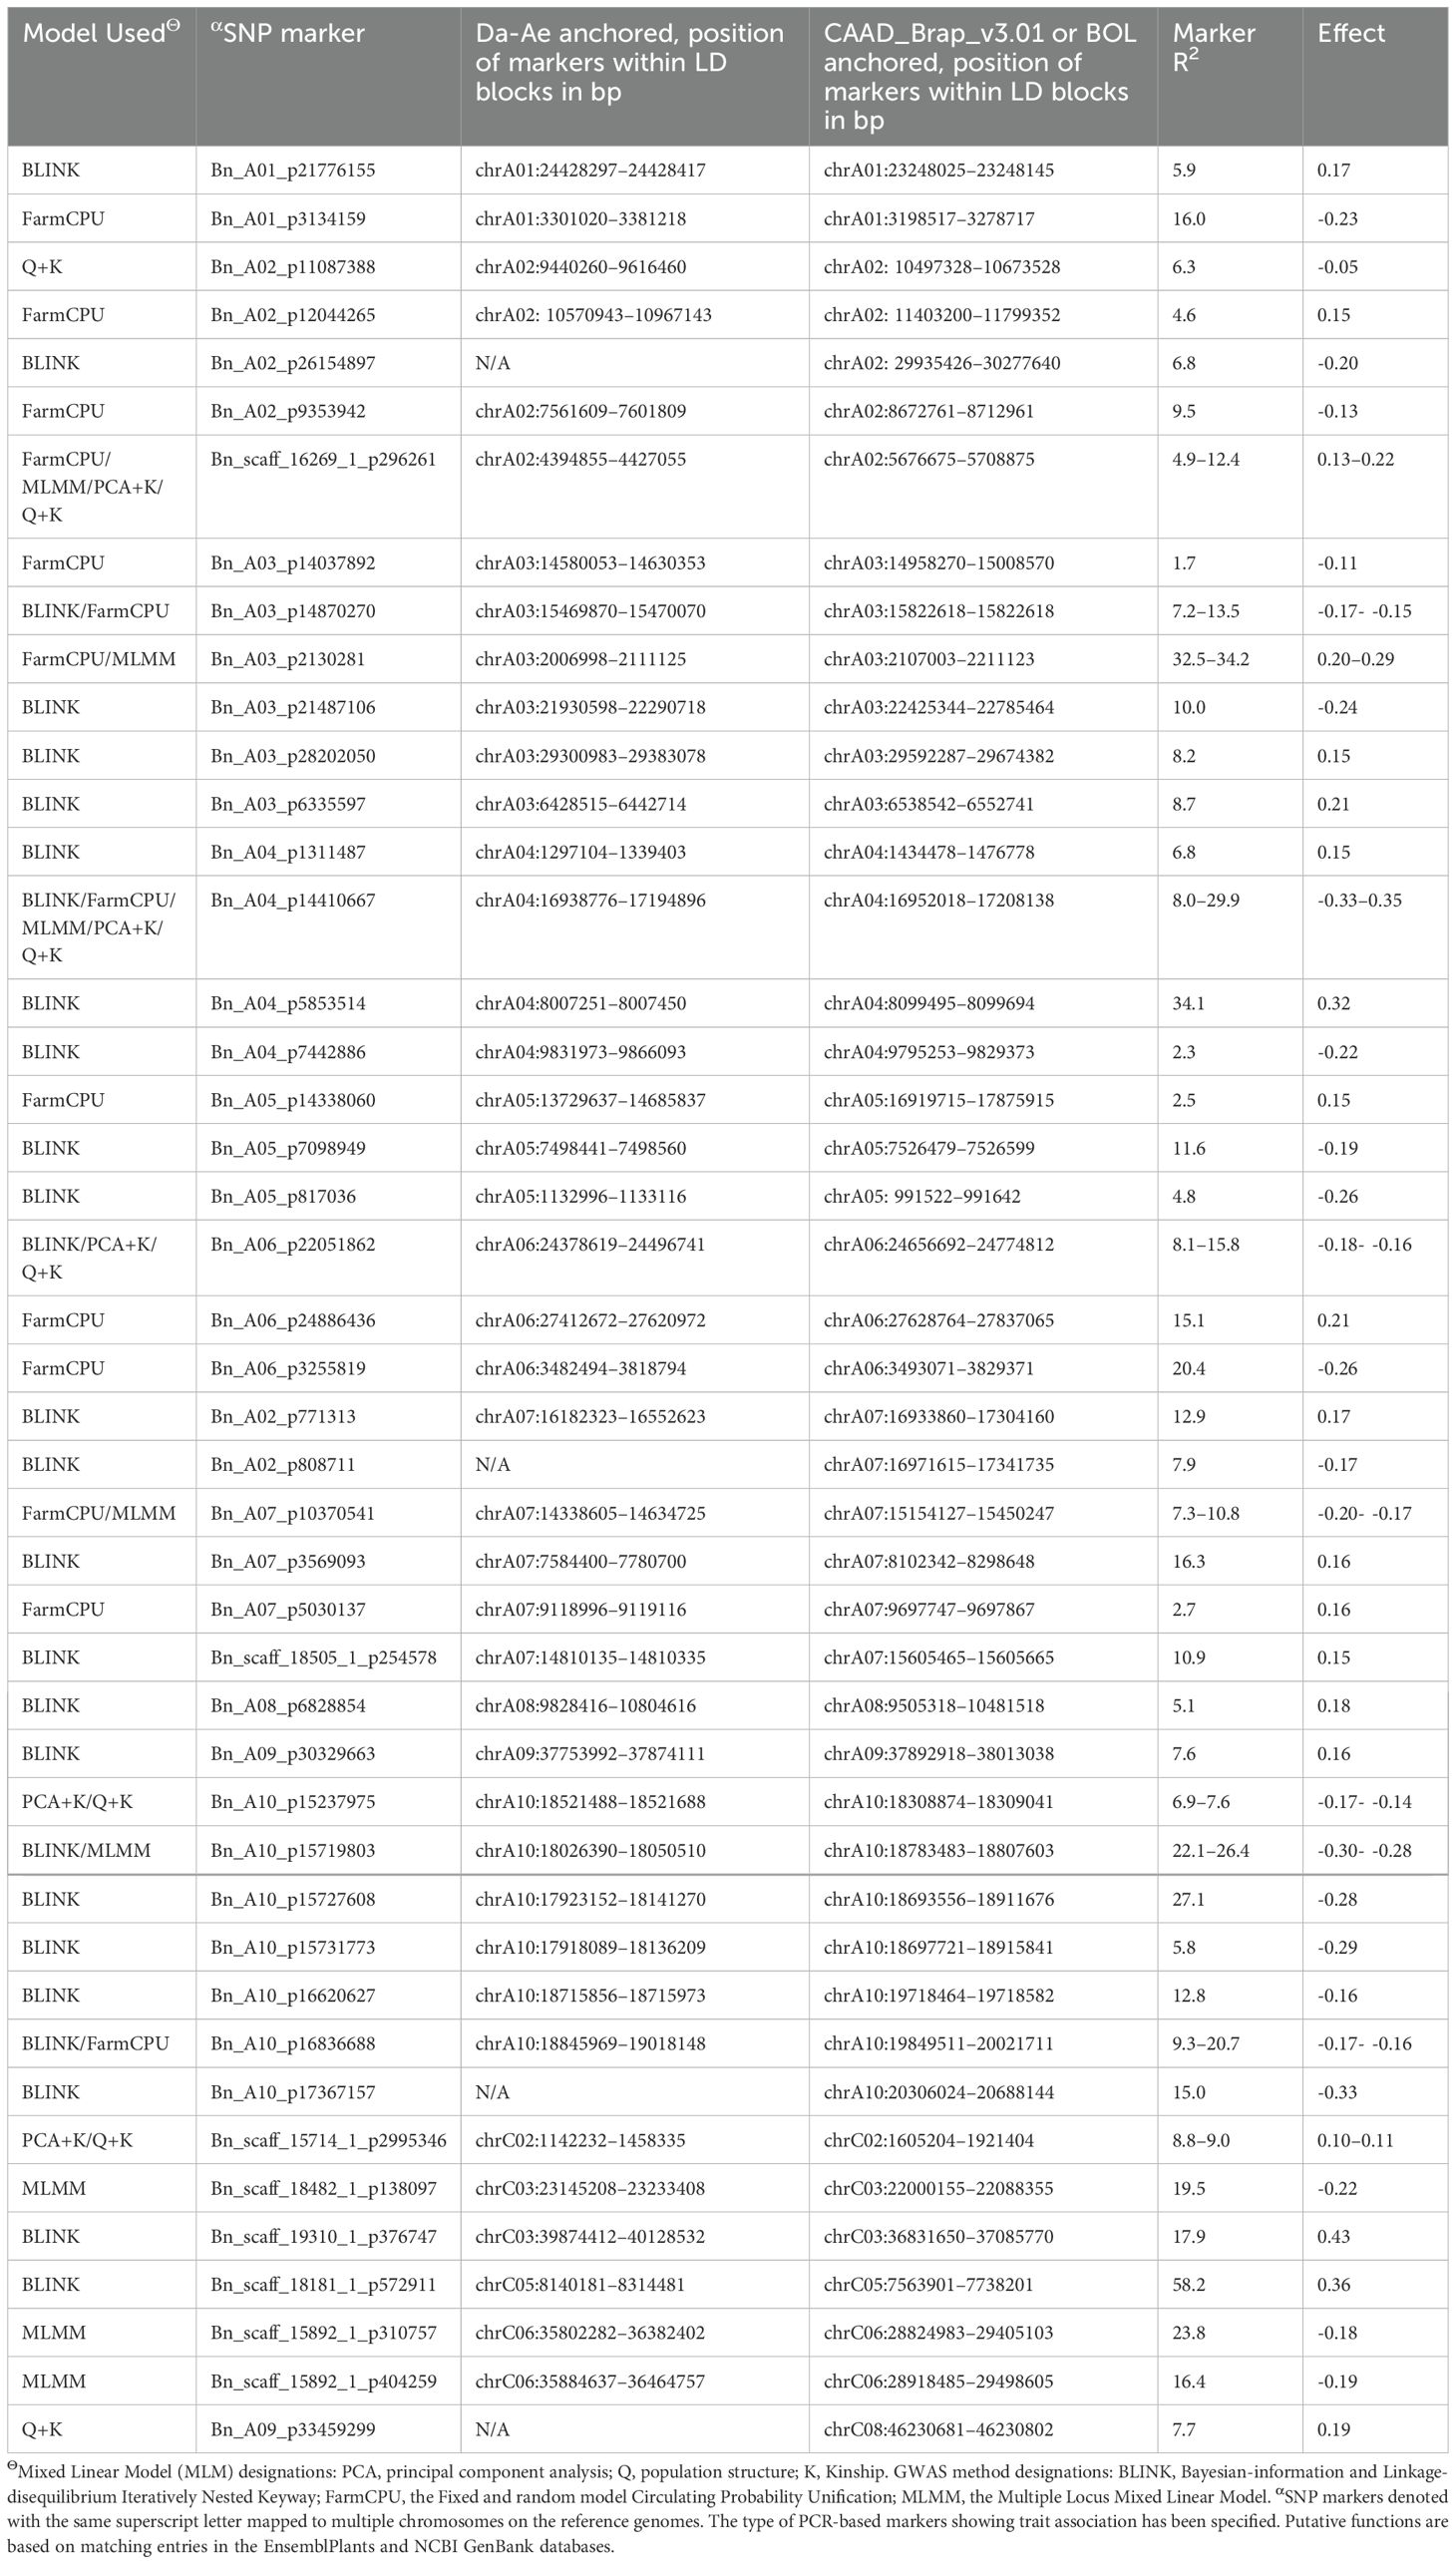
Table 2. Single nucleotide polymorphism (SNP) markers identified in two genotype combinations, Brassica rapa + Brassica napus and Brassica oleracea + B. napus, including their chromosomal locations and linkage association with resistance to Verticillium longisporum.
Haplotype associated with verticillium resistance
The 9,593 (4,972 A-genome + 4,621 C-genome) SNP markers formed a mean of 2283 (1345 A-genome + 938 C-genome) blocks in the haplotype analyses. The haplotypes from the A-genome contained between 2 and 10 SNPs while the mean size of the haplotype blocks ranged from 47 to 90 kilobases (mean 65 kb). In the case of the C-genome, the number of SNPs in the haplotypes ranged from 2 to 24 while the mean size of the haplotype blocks ranged from 109 to 207 kb (mean 152 kb). The SS, FGR and CI genome association analyses yielded 25, 23 and 9 haplotype blocks, that were significantly associated with V. longisporum resistance, respectively (Table 3). Therefore, the SS and FGR methods significantly outperformed the CI method in identifying haplotype blocks. Twenty of the haplotype blocks were detected by both the SS and FGR methods whiles the SS and FGR methods independently detected 5 and 3 haplotype blocks, respectively (Table 3). Nine haplotype blocks were identified by the three methods. Altogether, a total of 28 haplotype blocks determined by the three methods (SS, GR FGR and CI) were used in the BlastN searches to determine the structural and functional genomic information. Our results showed that the haplotype-based GWAS analysis allowed the detection of more candidate genes than if only the SNP-based GWAS had been used. The haplotype-trait associations were located on 13 different chromosomes, with the LOD scores ranging from 1.8 to 69.7 (Table 3).
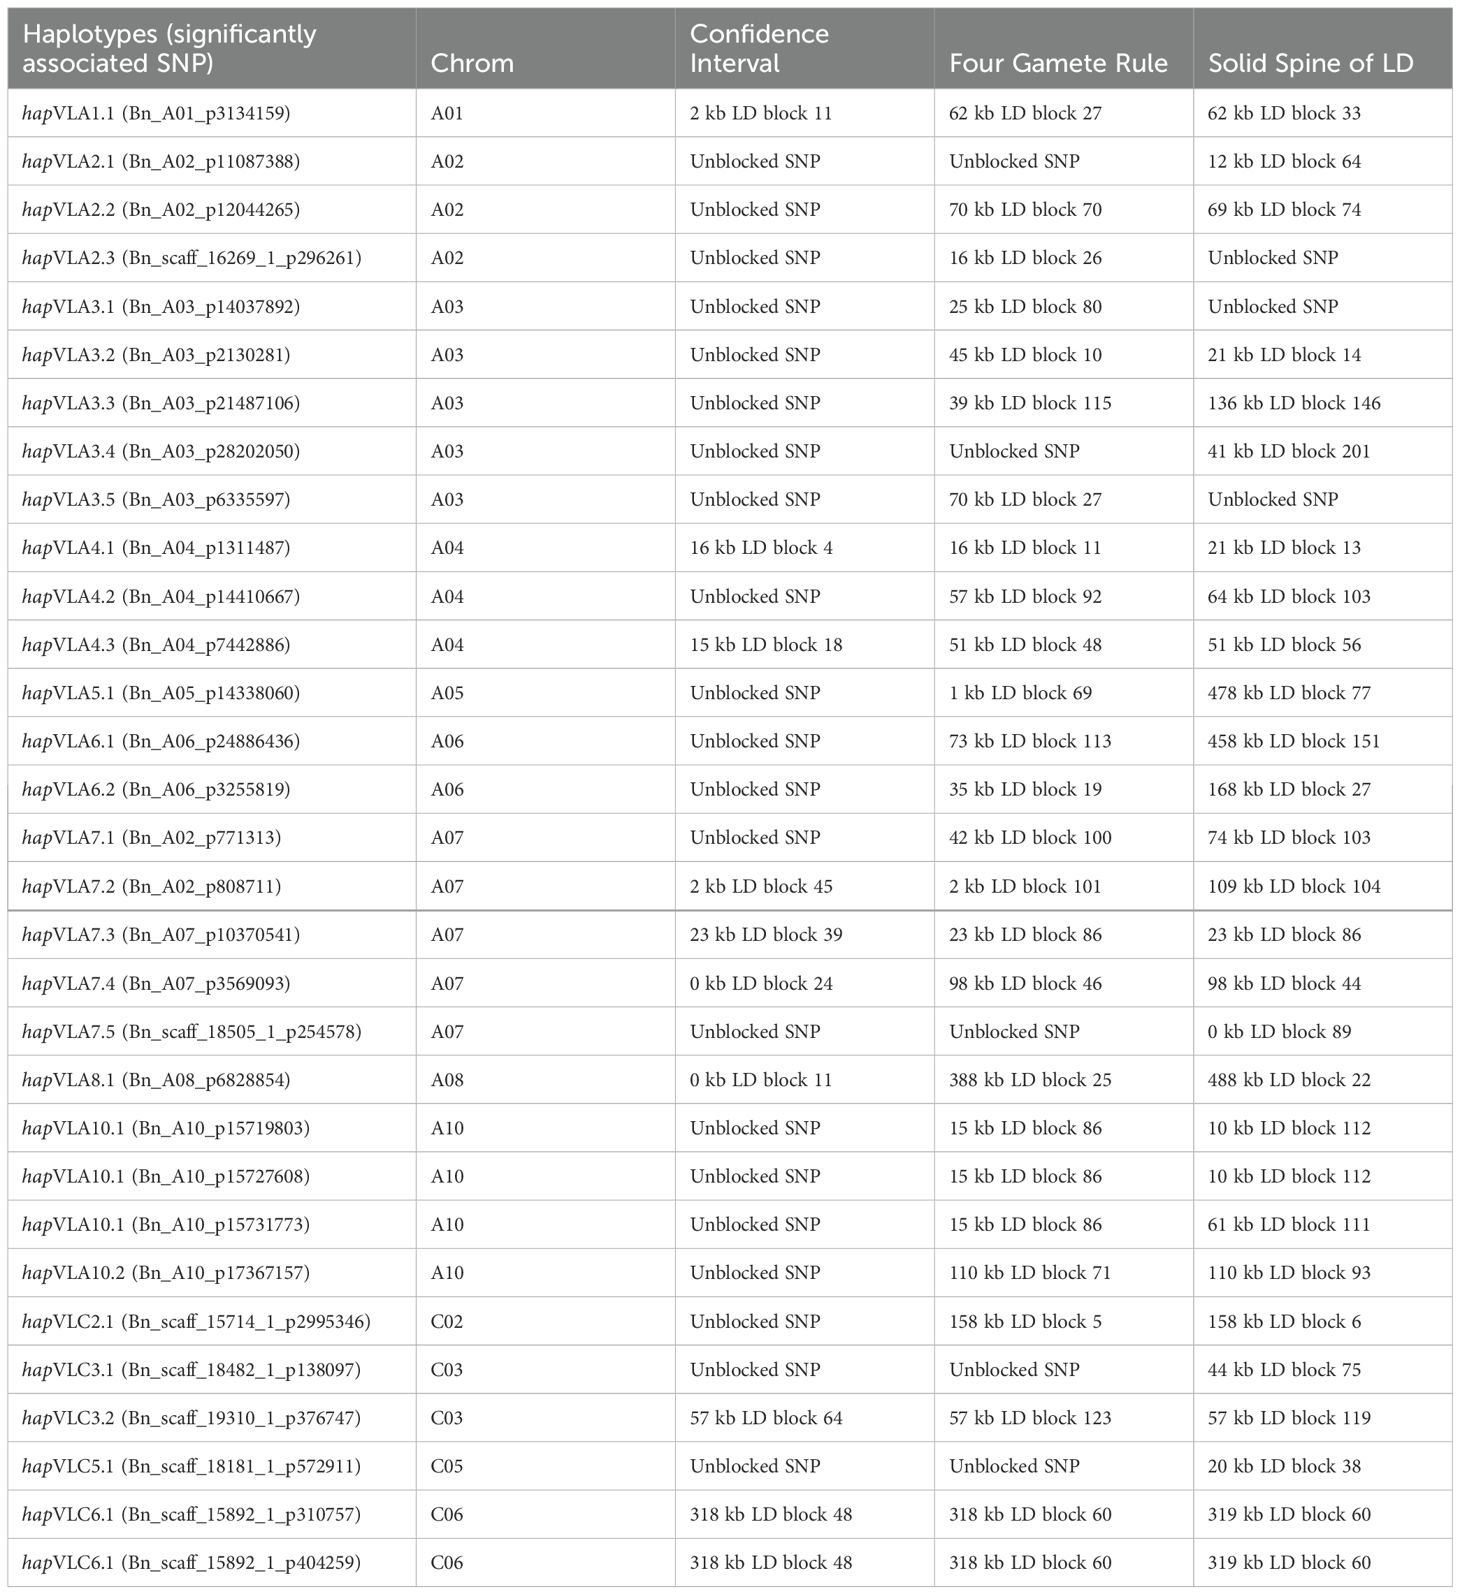
Table 3. Determination of haplotype blocks associated with Verticillium stripe resistance in canola determined using the confidence interval, four gamete rule, and solid spine of LD methods.
Candidate genes based on SNP markers significantly associated with VL resistance
Based on the significant 38 SNP markers (Table 2) and 23 haplotype blocks on the A-genome (Table 3), a total of 962 genes on Da-Ae anchored genome assembly and 1143 genes on CAAS_Brap_v3.01 anchored genome assembly (Supplementary Table S3). Similarly, a total of 261 genes on Da-Ae anchored genome assembly and 242 genes (Supplementary Table S3) on BOL anchored genome assembly were detected for 7 SNP markers (Table 2) and 5 haplotype blocks (Table 3) identified on chromosome C. Among total of 2608 candidate genes, some of genes encode proteins such as disease resistance protein RML 1B-like, multisubstrate pseudouridine synthase 7, leucine-rich repeat receptor-like serine, L-type lectin-domain containing receptor kinase S.5, F-box protein family, ethylene-responsive transcription factor ERF106-like and serine/threonine-protein kinase 16-like that were reported to be associated with plant disease response (Supplementary Table S3). Other genes encoded functional proteins include formin-like protein, NAD-dependent protein, ATPase 1, plasma membrane-type-like, internal metabolism, and biosynthesis, which are associated with cellular and biochemical processes (Supplementary Table S3). Additionally, genes that encoded zinc transporter 12, COP1-interactive protein 1, transcription factor PIF3, and transcription factor DIVARICATA, play an important role in basic plant biological and physiological processes (Supplementary Table S3). Proteins of unknown molecular function were also detected (Supplementary Table S3).
Discussion
As an emerging canola disease, Verticillium stripe continues to spread across the Canadian prairies (Oosterhuis, 2022), and has recently been detected in North Dakota (Chapara et al., 2023). However, no V. longisporum resistant canola cultivars have been registered in Canada, resulting in increased yield losses (Norman, 2023). Therefore, the identification of germplasm for breeding resistant cultivars and identifying molecular makers tightly linked with V. longisporum resistance for marker-assisted selection is critical. Association mapping, based on linkage disequilibrium of markers with QTLs, is a powerful tool for marker-assisted selection, enabling the exploitation of variation in plant materials (Jestin et al., 2011). GWAS is one of the most popular approaches for association mapping, offering significant advantages over linkage analysis. It provides higher resolution, incorporates a greater number of alleles, and allows for the simultaneous analysis of various traits of interest (Zhu et al., 2008). Currently, single nucleotide polymorphism (SNP) markers are widely utilized for GWAS (Ben-Ari and Lavi, 2012). These markers are co-dominant and suitable for high-throughput genotyping (Ben-Ari and Lavi, 2012). Their biallelic and high heritability contribute to increased genotyping accuracy (Zhu et al., 2008). In this study, GWAS was employed to find significant SNP markers associated with V. longisporum resistance in a large collection of B. napus, B. rapa, and B. oleracea genotypes.
The Brassica 15K SNP array used by Fredua-Agyeman et al. (2020) had a total of 13,714 SNP markers which comprised 7,214 A-genome markers and 6,500 C-genome markers which were mostly on scaffolds, while the 19K array had 9,966 A-genome markers and 8,886 C-genome markers which were mostly mapped to specific chromosomes. To minimize missing data, the B. rapa and B. napus accessions were analyzed separately using only the A-genome markers, while the B. oleracea and B. napus accessions were analyzed separately using only the C-genome markers. The filtered set of 4,972 SNP markers obtained from the Brassica 19K SNP array were uniformly distributed on the A1-A10 chromosomes and covered 291.6 Mb of the A-genome of B. rapa and B. napus. For the GWAS of the B. oleracea and B. napus accessions, the filtered set of 4,621 SNPs were also uniformly distributed on the C1-C9 chromosomes and covered 463.4 Mb of the C-genome. The two GWAS conducted in this study had approximately the same A-genome coverage and close to 1.5× more coverage of the C-genome compared to a previous study that utilized a Brassica 15K SNP array from SGS TraitGenetics (Fredua-Agyeman et al., 2020). In the current study, the mean maker density was 61.6 ± 21.5 Kb on the A-genome, and 117.8 ± 59.3 Kb on the C-genome. In contrast, Fredua-Agyeman et al. (2020) reported mean marker densities using the Brassica 15K SNP assay of approximately 63.4 ± 21.9 Kb and 15.0 ± 8.4 Kb for the A- and C-genomes, respectively. Therefore, the marker density on the A-genome was similar, but on the C-genome, the density was almost 9× lower with the 19K SNP array used in this study. While the 19K SNP array provided increased coverage, more C-genome markers need to be developed.
Linkage disequilibrium refers to the association and linkage of alleles among SNPs within a genomic sequence, which is important in GWAS for identification of genetic markers (Joiret et al., 2022). Wang et al. (2017) observed that the extent of LD decay ranged from 0.15 to 3.3 Mb for the A-genome and from 0.4 to 8.3 Mb for the C-genome. Using a Brassica 60K Illumina Infinium SNP array, Xu et al. (2015), reported LD decay for the A-genome ranging from 0.6 to 5.6 Mb and from 1.2 to 8.5 Mb for the C-genome. In another study, Fredua-Agyeman et al. (2020) estimated LD decay ranging from 1.1 to 2.3 Mb for the A-genome and from 0.20 to 1.5 Mb for the C-genome using the Brassica 13.2K SNP array. The extent of LD decay found in this study ranged from 0.42 to 1.15 Mb for the A-genome and from 0.68 to 1.85 Mb for the C-genome, which was similar to the values reported in these earlier studies.
In the present study, GWAS was conducted using three GLMs (Q-only, K-only, and PCA-only) and four MLMs (PCA+D, PCA+K, Q+K, and Q+D), in addition to three methods (BLINK, FarmCPU, and MLMM). Mixed linear models are versatile and widely used in GWAS. They offer a balance between complexity and computational efficiency by incorporating population structure and kinship to adjust associations on markers (Yang et al., 2014). However, MLMs can lead to increased false positive rates due to overfitting (Kaler et al., 2020). Therefore, other GWAS algorithms were also employed in this study. To reduce false positive or false negative associations, BLINK considers both main effects and interactions among genetic variants (Huang et al., 2019). FarmCPU integrates fixed and random effects and adjusts for population structure and relatedness using a kinship matrix (Kaler et al., 2020), while MLMM simultaneously considers multiple loci, accommodating polygenic effects (Kaler et al., 2020). By employing multiple GWAS methods, SNP markers could be identified more consistently, thereby increasing the accuracy and efficiency of QTL detection.
In this study, SNP-based GWAS identified 45 significant SNP markers (38 were A-genome + 7 C-genome) to be associated with Verticillium stripe resistance. The distribution of the significant SNP markers were 2, 5, 6, 4, 3, 3, 6, 1, 1, 7, 1, 2, 1, 2 and 1 and these were found on chromosomes A01, A02, A03, A04, A05, A06, A07, A08, A09, A10, C02, C03, C05, C06 and C08, respectively. In comparison, haplotype-based GWAS identified 9 to 25 haploblocks. The use of haplotypes in GWAS provides additional information for genomic prediction, resulting in higher accuracies (Liu et al., 2019). Consequently, these significant SNP markers were further analyzed to identify haploblocks, which are associated with extended genomic regions containing candidate genes. Multiple markers identified within the same haploblock were considered to be within a single QTL region. In total, the 45 significant SNP markers and the 9 to 25 haploblocks identified 42 QTLs. These QTLs contained 1,223, 1,143, and 242 candidate genes when aligned to the genomes of B. napus, B. rapa and B. oleracea, respectively.
Six SNPs, each corresponding to a distinct QTL, were identified on chromosome A03 based on the SNP-based association and haplotype block analysis. Gabur et al. (2020) mapped the major QTLs for VL resistance to the A03 chromosome using a biparental DH population. In this GWAS study, the significant SNPs on A03 seem to be distal from the SNPs bordering the QTL for V. longisporum resistance previously reported by Gabur et al. (2020) on chromosome A03 (physical position 7,963,059 to 11,419,476). Therefore, the QTL regions on chromosome A03 identified in this study appear to be different from the QTLs reported by Gabur et al. (2020). One of the SNP markers identified in this study, Bn_A03_p14870270, was found in a genomic region reported to be a hotspot for clubroot resistance (Fredua-Agyeman et al., 2021). This region contains the clubroot resistance gene(s)/QTLs Bn.A3P2F, Crr3, CRk, and CRd. However, this SNP did not form a haploblock but was found to be in the genomic region encoding multisubstrate pseudouridine synthase. The haplotype hapVLA10.1 was associated with three significant SNP markers: Bn_A10_p15719803, Bn_A10_p15727608, and Bn_A10_p15731773. The haplotype hapVLC6.1 was associated with two significant SNP markers, Bn_scaff_15892_1_p310757 and Bn_scaff_15892_1_p404259.
The rutabaga accessions used in this study were also screened for clubroot resistance by Fredua-Agyeman et al. (2020). Unfortunately, accessions previously classified as resistant or moderately resistant to clubroot (FGRA036, FGRA037, FGRA044, FGRA072, FGRA106, FGRA108, FGRA109 and FGRA112) were found to be susceptible or moderately susceptible to V. longisporum. Hirani et al. (2018) reported that ECD 01, ECD 02, ECD 03 and ECD 04 (B. rapa), as well as ECD 11 (B. oleracea), were resistant to Canadian field isolates of the clubroot pathogen, while ECD 05 (B. rapa) was susceptible. In the current study, ECD 01, ECD 02, ECD 03 and ECD 04 were all susceptible to V. longisporum isolate VL 43. Among all of the ECD hosts screened, only ECD 11 exhibited resistance to this fungus, while ECD 05 was moderately resistant. Similarly, ECD 08 (B. napus) and ECD 13 (B. oleracea) were moderately resistant to V. longisporum, but they were susceptible and segregated in response to clubroot (Hirani et al., 2018). Consequently, the present findings suggest a negative relationship between resistance to Verticillium stripe and clubroot.
Of the 20 Verticillium stripe-resistant Brassica genotypes identified in this study, eight were B. rapa and B. oleracea vegetable types, three were rutabagas, and nine were canola. Gabur et al. (2020); Rygulla et al. (2007), and Su et al. (2023) identified QTLs/genes for Verticillium stripe resistance in vegetable-type Brassica germplasm. This indicates that B. rapa and B. oleracea might be potential donors for resistance breeding programs in canola/oilseed rape. Nine or about a quarter of the Canadian canola cultivars in this study were found to be resistant to V. longisporum, suggesting that the deployment of resistant hosts holds promise for the management of Verticillium stripe.
In the current GWAS, genes located within the QTLs were identified that were associated with plant disease resistance and immunity mechanisms. The gene identified in the QTL region on chromosome A04 encoded disease resistance protein RML1B-like. It was reported to be related to Leptosphaeria maculans resistance in A. thaliana (Staal et al., 2006). Similarly, genes encoding disease resistance protein RML1A-like on chromosome A07 were identified as involved in resistance to powdery mildew (Bhattarai et al., 2020). In one of the QTL regions on chromosome A06, the gene encoded disease resistance protein RPV1-like was identified which confers resistance to Plasmopara viticola (Feechan et al., 2013). In the other QTL region on chromosome A06, genes encoding disease resistance protein RBA1-like and TMV resistance protein N were identified, which were associated with cell death for disease resistance in Arabidopsis (Nishimura et al., 2017) and resistance to tobacco mosaic virus (Marathe et al., 2002). Additionally, the gene encoding protein PYRICULARIA ORYZAE RESISTANCE 21 was identified in the QTL region on chromosome A08 which confers resistance to Magnaporthe oryzae (Nawaz et al., 2020). Unlike QTL regions on the A-genome, only one of the regions on chromosome C08 identified a gene encoding a probable disease resistance protein At1g15890, which was reported as an Arabidopsis-resistance gene related to cell death (Huang et al., 2024). Other genes encoded proteins that were associated with disease resistance responses such as the ethylene-responsive transcription factor ERF106 (Yang et al., 2022), a probable leucine-rich repeat receptor-like protein kinase which modulates the development of Phytophthora sojae on soybean (Si et al., 2021), and an L-type lectin-domain containing receptor kinase that was found to positively regulate disease resistance against Phytophthora in pepper (Woo et al., 2020). It is possible that these QTL regions habour genes controlling V. longisporum resistance.
In conclusion, screening 211 Brassica genotypes for resistance to V. longisporum identified 20 resistant accessions/cultivars, including representatives from B. rapa, B. oleracea, and B. napus. Additionally, significant SNP markers on chromosome A03 may be important for Verticillium stripe resistance breeding.
Data availability statement
The original contributions presented in the study are included in the article/Supplementary Material. Further inquiries can be directed to the corresponding authors.
Author contributions
YW: Conceptualization, Data curation, Formal analysis, Methodology, Software, Writing – original draft. RF-A: Conceptualization, Data curation, Writing – review & editing. ZY: Data curation, Writing – review & editing. S-FH: Funding acquisition, Supervision, Writing – review & editing. SS: Writing – review & editing, Funding acquisition, Supervision.
Funding
The author(s) declare financial support was received for the research, authorship, and/or publication of this article. This research was made possible by support from the Canola Agronomic Research Program (Project No. 2024.43), funded by SaskCanola, Alberta Canola, the Manitoba Canola Growers Association, and the Western Grains Research Foundation (WGRF). In-kind support from the University of Alberta is also gratefully acknowledged.
Acknowledgments
We thank Dr. Hui Zhang of the Institute of Vegetables and Flowers, Chinese Academy of Agricultural Sciences for providing the Chinese vegetable collections.
Conflict of interest
The authors declare that the research was conducted in the absence of any commercial or financial relationships that could be construed as a potential conflict of interest.
Publisher’s note
All claims expressed in this article are solely those of the authors and do not necessarily represent those of their affiliated organizations, or those of the publisher, the editors and the reviewers. Any product that may be evaluated in this article, or claim that may be made by its manufacturer, is not guaranteed or endorsed by the publisher.
Supplementary material
The Supplementary Material for this article can be found online at: https://www.frontiersin.org/articles/10.3389/fpls.2024.1436982/full#supplementary-material
References
Abed, A., Belzile, F. (2019). Comparing single-SNP, multi-SNP, and haplotype-based approaches in association studies for major traits in barley. Plant Genome 12, 190036. doi: 10.3835/plantgenome2019.05.0036
Bajgain, P., Anderson, J. A. (2021). Multi-allelic haplotype-based association analysis identifies genomic regions controlling domestication traits in intermediate wheatgrass. Agriculture 11, 667. doi: 10.3390/agriculture11070667
Barrett, J. C., Fry, B., Maller, J., Daly, M. J. (2005). Haploview: analysis and visualization of LD and haplotype maps. Bioinformatics 21, 263–265. doi: 10.1093/bioinformatics/bth457
Bellucci, A., Torp, A. M., Bruun, S., Magid, J., Andersen, S. B., Rasmussen, S. K. (2015). Association mapping in Scandinavian winter wheat for yield, plant height, and traits important for second-generation bioethanol production. Front. Plant Sci. 6. doi: 10.3389/fpls.2015.01046
Ben-Ari, G., Lavi, U. (2012). “Marker-assisted selection in plant breeding,” in Plant biotechnology and agriculture: Prospects for the 21st century (Cambridge, Massachusetts, U.S.A: Academic Press), 163–184.
Benjamini, Y., Hochberg, Y. (1995). Controlling the false discovery rate: a practical and powerful approach to multiple testing. J. R. Stat. Society: Ser. B (Methodological) 57, 289–300. doi: 10.1111/j.2517-6161.1995.tb02031.x
Bhattarai, K., Conesa, A., Xiao, S., Peres, N. A., Clark, D. G., Parajuli, S., et al. (2020). Sequencing and analysis of gerbera daisy leaf transcriptomes reveal disease resistance and susceptibility genes differentially expressed and associated with powdery mildew resistance. BMC Plant Biol. 20, 539. doi: 10.1186/s12870-020-02742-4
Bradbury, P. J., Zhang, Z., Kroon, D. E., Casstevens, T. M., Ramdoss, Y., Buckler, E. S. (2007). TASSEL: software for association mapping of complex traits in diverse samples. Bioinformatics 23, 2633–2635. doi: 10.1093/bioinformatics/btm308
Breseghello, F., Sorrells, M. E. (2006). Association mapping of kernel size and milling quality in wheat (Triticum aestivum L.) cultivars. Genetics 172, 1165–1177. doi: 10.1534/genetics.105.044586
Buczacki, S. T., Toxopeus, H., Mattusch, P., Johnston, T. D., Dixon, G. R., Hobolth, L. A. (1975). Study of physiologic specialization in Plasmodiophora brassicae: Proposals for attempted rationalization through an international approach. Trans. Br. Mycological Soc. 65, 295–303. doi: 10.1016/S0007-1536(75)80013-1
Campbell, C. L., Madden, L. V. (1990). Introduction to Plant Disease Epidemiology (New York, USA: John Wiley).
Canadian Food Inspection Agency (2018). Verticillium stripe – Verticillium longisporum. Available online at: https://inspection.Canada.ca/plant-health/invasive-species/plant-diseases/verticillium-stripe/eng/1420746212959/1420746213803 (Accessed September 17, 2023).
Chapara, V., Al Salman, D., Azizi, A., Del Río Mendoza, L. E. (2023). First report of Verticillium stripe of canola caused by Verticillium longisporum in North Dakota. Plant Dis. 107, PDIS–06-23-1089-PDN. doi: 10.1094/PDIS-06-23-1089-PDN
Cui, J., Strelkov, S. E., Fredua-Agyeman, R., Hwang, S. F. (2022). Development of optimized Verticillium longisporum inoculation techniques for canola (Brassica napus). Can. J. Plant Pathol. 45, 92–102. doi: 10.1080/07060661.2022.2120913
Depotter, J. R. L., Deketelaere, S., Inderbitzin, P., Tiedemann, A. V., Höfte, M., Subbarao, K. V., et al. (2016). Verticillium longisporum, the invisible threat to oilseed rape and other brassicaceous plant hosts. Mol. Plant Pathol. 17, 1004–1016. doi: 10.1111/mpp.12350
Dunker, S., Keunecke, H., Steinbach, P., Von Tiedemann, A. (2008). Impact of Verticillium longisporum on yield and morphology of winter oilseed rape (Brassica napus) in relation to systemic spread in the plant. J. Phytopathol. 156, 698–707. doi: 10.1111/j.1439-0434.2008.01429.x
Earl, D. A., vonHoldt, B. M. (2012). STRUCTURE HARVESTER: a website and program for visualizing STRUCTURE output and implementing the Evanno method. Conserv. Genet. Resour 4, 359–361. doi: 10.1007/s12686-011-9548-7
Evanno, G., Regnaut, S., Goudet, J. (2005). Detecting the number of clusters of individuals using the software STRUCTURE: a simulation study. Mol. Ecol. 14, 2611–2620. doi: 10.1111/j.1365-294X.2005.02553.x
Eynck, C., Koopmann, B., Von Tiedemann, A. (2009). Identification of Brassica accessions with enhanced resistance to Verticillium longisporum under controlled and field conditions. J. Plant Dis. Prot 116, 63–72. doi: 10.1007/BF03356288
Feechan, A., Anderson, C., Torregrosa, L., Jermakow, A., Mestre, P., Wiedemann-Merdinoglu, S., et al. (2013). Genetic dissection of a TIR - NB - LRR locus from the wild North American grapevine species Muscadinia rotundifolia identifies paralogous genes conferring resistance to major fungal and oomycete pathogens in cultivated grapevine. Plant J. 76, 661–674. doi: 10.1111/tpj.12327
Fredua-Agyeman, R., Hwang, S.-F., Zhang, H., Falak, I., Huang, X., Strelkov, S. E. (2021). Clubroot resistance derived from the European Brassica napus cv. ‘Tosca’ is not effective against virulent Plasmodiophora brassicae isolates from Alberta, Canada. Sci. Rep. 11, 14472. doi: 10.1038/s41598-021-93327-0
Fredua-Agyeman, R., Yu, Z., Hwang, S.-F., Strelkov, S. E. (2020). Genome-wide mapping of loci associated with resistance to clubroot in Brassica napus ssp. napobrassica (Rutabaga) accessions rrom Nordic countries. Front. Plant Sci. 11. doi: 10.3389/fpls.2020.00742
Gabur, I., Chawla, H. S., Lopisso, D. T., Von Tiedemann, A., Snowdon, R. J., Obermeier, C. (2020). Gene presence-absence variation associates with quantitative Verticillium longisporum disease resistance in Brassica napus. Sci. Rep. 10, 4131. doi: 10.1038/s41598-020-61228-3
Hirani, A. H., Gao, F., Liu, J., Fu, G., Wu, C., McVetty, P. B. E., et al. (2018). Combinations of independent dominant loci conferring clubroot resistance in all four turnip accessions (Brassica rapa) from the European Clubroot Differential set. Front. Plant Sci. 9. doi: 10.3389/fpls.2018.01628
Huang, J., Jia, P., Zhong, X., Guan, X., Zhang, H., Gao, Z. (2024). Ectopic expression of the Arabidopsis mutant L3 NB-LRR receptor gene in Nicotiana benthamiana cells leads to cell death. Gene 906, 148256. doi: 10.1016/j.gene.2024.148256
Huang, M., Liu, X., Zhou, Y., Summers, R. M., Zhang, Z. (2019). BLINK: a package for the next level of genome-wide association studies with both individuals and markers in the millions. GigaScience 8, 1–12. doi: 10.1093/gigascience/giy154
Inderbitzin, P., Davis, R. M., Bostock, R. M., Subbarao, K. V. (2013). Identification and differentiation of Verticillium species and V. longisporum lineages by simplex and multiplex PCR assays. PloS One 8, e65990. doi: 10.1371/journal.pone.0065990
Jestin, C., Lodé, M., Vallée, P., Domin, C., Falentin, C., Horvais, R., et al. (2011). Association mapping of quantitative resistance for Leptosphaeria maculans in oilseed rape (Brassica napus L.). Mol. Breed. 27, 271–287. doi: 10.1007/s11032-010-9429-x
Johansson, A., Goud, J.-K. C., Dixelius, C. (2006). Plant host range of Verticillium longisporum and microsclerotia density in Swedish soils. Eur. J. Plant Pathol. 114, 139–149. doi: 10.1007/s10658-005-2333-2
Joiret, M., Mahachie John, J. M., Gusareva, E. S., Van Steen, K. (2022). Confounding of linkage disequilibrium patterns in large scale DNA based gene-gene interaction studies. BioData Min. 15, 11. doi: 10.1186/s13040-022-00296-9
Kaler, A. S., Gillman, J. D., Beissinger, T., Purcell, L. C. (2020). Comparing different statistical models and multiple testing corrections for association mapping in soybean and maize. Front. Plant Sci. 10. doi: 10.3389/fpls.2019.01794
Khan, M. A., Cowling, W. A., Banga, S. S., Barbetti, M. J., Cantila, A. Y., Amas, J. C., et al. (2023). Genetic and molecular analysis of stem rot (Sclerotinia sclerotiorum) resistance in Brassica napus (canola type). Heliyon 9, e19237. doi: 10.1016/j.heliyon.2023.e19237
Liu, X., Huang, M., Fan, B., Buckler, E. S., Zhang, Z. (2016). Iterative usage of fixed and random effect models for powerful and efficient genome-wide association studies. PloS Genet. 12, e1005957. doi: 10.1371/journal.pgen.1005957
Liu, F., Schmidt, R. H., Reif, J. C., Jiang, Y. (2019). Selecting closely-linked SNPs based on local epistatic effects for haplotype construction improves power of association mapping. G3 Genes|Genomes|Genetics 9, 4115–4126. doi: 10.1534/g3.119.400451
Marathe, R., Anandalakshmi, R., Liu, Y., Dinesh-Kumar, S. P. (2002). The tobacco mosaic virus resistance gene, N. Mol. Plant Pathol. 3, 167–172. doi: 10.1046/j.1364-3703.2002.00110.x
Nagaharu, U. (1935). Genome analysis in Brassica with special reference to the experimental formation of B. napus and peculiar mode of fertilization. Japanese J. Bot. 7, 389–452.
Nawaz, G., Usman, B., Peng, H., Zhao, N., Yuan, R., Liu, Y., et al. (2020). Knockout of Pi21 by CRISPR/Cas9 and iTRAQ-Based Proteomic Analysis of Mutants Revealed New Insights into M. oryzae Resistance in Elite Rice Line. Genes 11, 735. doi: 10.3390/genes11070735
Nishimura, M. T., Anderson, R. G., Cherkis, K. A., Law, T. F., Liu, Q. L., Machius, M., et al. (2017). TIR-only protein RBA1 recognizes a pathogen effector to regulate cell death in Arabidopsis. Proc. Natl. Acad. Sci. U.S.A. 114, E2053–E2062. doi: 10.1073/pnas.1620973114
Norman, D. (2023). Raising the profile of Verticillium stripe. AlbertaFarmer. Available online at: https://www.albertafarmexpress.ca/crops/raising-the-profile-of-verticillium-stripe/. (Accessed January 10, 2024).
Obermeier, C., Hossain, M. A., Snowdon, R., Knüfer, J., Von Tiedemann, A., Friedt, W. (2013). Genetic analysis of phenylpropanoid metabolites associated with resistance against Verticillium longisporum in Brassica napus. Mol. Breed. 31, 347–361. doi: 10.1007/s11032-012-9794-8
Oosterhuis, K. (2022). Canola School: Verticillium stripe continues to widen its path across the Prairies. Realagriculture. Available online at: https://www.realagriculture.com/2022/11/canola-school-verticillium-stripe-continues-to-widen-its-path-across-the-prairies/. (Accessed September 17, 2023).
Pritchard, J. K., Stephens, M., Donnelly, P. (2000). Inference of population structure using multilocus genotype data. Genetics 155, 945–959. doi: 10.1093/genetics/155.2.945
R Core Team. (2013). R: A Language and Environment for Statistical Computing. R Foundation for Statistical Computing, Vienna. Available at: https://www.R-project.org/.
Rygulla, W., Friedt, W., Seyis, F., Lühs, W., Eynck, C., Von Tiedemann, A., et al. (2007). Combination of resistance to Verticillium longisporum from zero erucic acid Brassica oleracea and oilseed Brassica rapa genotypes in resynthesized rapeseed (Brassica napus) lines. Plant Breed. 126, 596–602. doi: 10.1111/j.1439-0523.2007.01414.x
Schnathorst, W. C. (1981). “Life cycle and epidemiology of Verticillium,” in Fungal Wilt Diseases of Plants (Academic Press, New York, USA), 81–111. doi: 10.1016/B978-0-12-464450-2.50009-7
Segura, V., Vilhjálmsson, B. J., Platt, A., Korte, A., Seren, Ü., Long, Q., et al. (2012). An efficient multi-locus mixed-model approach for genome-wide association studies in structured populations. Nat. Genet. 44, 825–830. doi: 10.1038/ng.2314
Si, J., Pei, Y., Shen, D., Ji, P., Xu, R., Xue, X., et al. (2021). Phytophthora sojae leucine-rich repeat receptor-like kinases: diverse and essential roles in development and pathogenicity. iScience 24, 102725. doi: 10.1016/j.isci.2021.102725
Staal, J., Kaliff, M., Bohman, S., Dixelius, C. (2006). Transgressive segregation reveals two Arabidopsis TIR-NB-LRR resistance genes effective against Leptosphaeria maculans, causal agent of blackleg disease. Plant J. 46, 218–230. doi: 10.1111/j.1365-313X.2006.02688.x
Su, T., Wang, W., Wang, Z., Li, P., Xin, X., Yu, Y., et al. (2023). BrMYB108 confers resistance to Verticillium wilt by activating ROS generation in Brassica rapa. Cell Rep. 42, 112938. doi: 10.1016/j.celrep.2023.112938
Wang, X., Chen, Y., Thomas, C. L., Ding, G., Xu, P., Shi, D., et al. (2017). Genetic variants associated with the root system architecture of oilseed rape (Brassica napus L.) under contrasting phosphate supply. DNA Res. 24, 407–417. doi: 10.1093/dnares/dsx013
Wang, J., Zhang, Z. (2021). GAPIT version 3: boosting power and accuracy for genomic association and prediction. Genomics Proteomics Bioinf. 19, 629–640. doi: 10.1016/j.gpb.2021.08.005
Woo, J. Y., Kim, Y. J., Paek, K.-H. (2020). CaLecRK-S.5, a pepper L-type lectin receptor kinase gene, accelerates Phytophthora elicitin-mediated defense response. Biochem. Biophys. Res. Commun. 524, 951–956. doi: 10.1016/j.bbrc.2020.02.014
Xu, L., Hu, K., Zhang, Z., Guan, C., Chen, S., Hua, W., et al. (2015). Genome-wide association study reveals the genetic architecture of flowering time in rapeseed (Brassica napus L.). DNA Res. 23, dsv035. doi: 10.1093/dnares/dsv035
Yang, C.-L., Huang, Y.-T., Schmidt, W., Klein, P., Chan, M.-T., Pan, I.-C. (2022). Ethylene response factor109 attunes immunity, photosynthesis, and iron homeostasis in Arabidopsis leaves. Front. Plant Sci. 13. doi: 10.3389/fpls.2022.841366
Yang, J., Zaitlen, N. A., Goddard, M. E., Visscher, P. M., Price, A. L. (2014). Advantages and pitfalls in the application of mixed-model association methods. Nat. Genet. 46, 100–106. doi: 10.1038/ng.2876
Yu, Z., Fredua-Agyeman, R., Hwang, S.-F., Strelkov, S. E. (2021). Molecular genetic diversity and population structure analyses of rutabaga accessions from Nordic countries as revealed by single nucleotide polymorphism markers. BMC Genomics 22, 442. doi: 10.1186/s12864-021-07762-4
Zeise, K., Von Tiedemann, A. (2002). Host specialization among vegetative compatibility groups of Verticillium dahliae in relation to Verticillium longisporum. Phytopathology 150, 112–119. doi: 10.1046/j.1439-0434.2002.00730.x
Zhu, C., Gore, M., Buckler, E. S., Yu, J. (2008). Status and prospects of association mapping in plants. Plant Genome 1, plantgenome2008.02.0089. doi: 10.3835/plantgenome2008.02.0089
Keywords: Brassica, genomic hotspots, genotypes, markers, resistance, Verticillium longisporum, Verticillium stripe
Citation: Wang Y, Fredua-Agyeman R, Yu Z, Hwang S-F and Strelkov SE (2024) Genome-wide association study of Verticillium longisporum resistance in Brassica genotypes. Front. Plant Sci. 15:1436982. doi: 10.3389/fpls.2024.1436982
Received: 22 May 2024; Accepted: 02 August 2024;
Published: 27 August 2024.
Edited by:
Chunyu Zhang, Huazhong Agricultural University, ChinaReviewed by:
Umesh K. Reddy, West Virginia State University, United StatesChristian Obermeier, Justus Liebig University, Germany
Copyright © 2024 Wang, Fredua-Agyeman, Yu, Hwang and Strelkov. This is an open-access article distributed under the terms of the Creative Commons Attribution License (CC BY). The use, distribution or reproduction in other forums is permitted, provided the original author(s) and the copyright owner(s) are credited and that the original publication in this journal is cited, in accordance with accepted academic practice. No use, distribution or reproduction is permitted which does not comply with these terms.
*Correspondence: Sheau-Fang Hwang, c2hlYXUuZmFuZy5od2FuZ0B1YWxiZXJ0YS5jYQ==; Stephen E. Strelkov, c3RyZWxrb3ZAdWFsYmVydGEuY2E=