
94% of researchers rate our articles as excellent or good
Learn more about the work of our research integrity team to safeguard the quality of each article we publish.
Find out more
ORIGINAL RESEARCH article
Front. Plant Sci., 04 July 2024
Sec. Plant Breeding
Volume 15 - 2024 | https://doi.org/10.3389/fpls.2024.1423586
 Feifei Wang1
 Huarong Miao1
 Shengzhong Zhang1Xiaohui Hu1Chunjuan Li1
 Ye Chu2
 Charles Chen3Wen Zhong4Tianyu Zhang4
 Heng Wang5Linying Xu6Weiqiang Yang1Jing Chen1*
High sugar content in peanut seeds is one of the major breeding objectives for peanut flavor improvement. In order to explore the genetic control of sugar accumulation in peanut kernels, we constructed a recombinant inbred line population of 256 F2:6-7 lines derived from the Luhua11 × 06B16 cross. A high-resolution genetic map was constructed with 3692 bin markers through whole genome re-sequencing. The total map distance was 981.65 cM and the average bin marker distance was 0.27cM. A major stable QTL region (qSCB09/qSSCB09) was identified on linkage group (LG) B09 associated with both sucrose content (SC) and soluble sugar content (SSC) explaining 21.51-33.58% phenotypic variations. This major QTL region was consistently detected in three environments and mapped within a physical interval of 1.56 Mb on chromosome B09, and six candidate genes were identified. These results provide valuable information for further map-based cloning of favorable allele for sugar content in peanut.
Peanuts (Arachis hypogaea L.) are widely cultivated worldwide as food and oil crops. Peanuts are not only used as a rich source for vegetable oil extraction, and are also rich in protein and micronutrients (Toomer, 2018). In recent years, the increase in both production and consumption of fresh roasted peanuts has resulted in demands for improved sweetness in peanut kernels, which is highly correlated with flavor (Pattee et al., 1998; Guo et al., 2023b). The content of soluble sugars in the kernels will directly determine peanut sweetness (Guo et al., 2023b). The color and flavor of roasted peanut depends on peanut sugar content and its interaction with other components under heating conditions (McDaniel et al., 2012). Soluble sugars in peanut include sucrose, fructose, and glucose, with sucrose being for the highest proportion (McDaniel et al., 2012).
Sucrose, a key product of photosynthesis, serves as a primary long-distance translocated carbon for sink metabolism in higher plants (John Farrar and Gallagher, 2000; Li et al., 2021). Numerous candidate genes related to sucrose metabolism and accumulation, such as those sucrose synthase (SUS), sucrose phosphate synthase (SPS), sucrose phosphate phosphatase (SPP), invertase (INV), seed expressed water-soluble sugar transport protein (SWEET) family, and sucrose transporter (SUT) genes, have been reported in soybean and other species (Chen et al., 2015; Zhen et al., 2018; Wang et al., 2019). Additionally, raffinose synthase (RS), protein kinase (PK) and several transcription factors (TFs), including WRKY, MYB and bZIP (basic leucine zipper) have been implicated in regulating sucrose accumulation (Dierking and Bilyeu, 2008; Kumar et al., 2010; Wei et al., 2018; Chen et al., 2020; Li et al., 2020; Yu et al., 2021). In peanut, the transcriptome analysis identified 28 DEGs involved in sucrose metabolism, including the genes encoding seed expressed water-soluble sugar transport protein (SWEETs), cell wall invertase (CWIN), vacuolar invertase (VIN), cytoplasmic invertase (CIN), Sucrose synthase (SUS), hexokinase (HK), and sucrose-phosphate phosphatse (SPP) (Li et al., 2021).
Genetic analysis suggested that sucrose content in peanut kernels is controlled by two additive–dominance–epistasis major genes plus an additive–dominance–epistasis polygene (Qin et al., 2021). However, a lack of favorable alleles or genes has hindered breeding progress, given that the sugar content of seeds is influenced by various factors, including abiotic and biotic stresses, environmental conditions such as temperature, soil moisture, freezing, seed maturity, growth conditions, and genotype (Maughan et al., 2000; Pattee et al., 2000; Knizia et al., 2023; Guo et al., 2023b). Quantitative trait locus (QTL) mapping is a powerful method to identify alleles or genes controlling complex traits. Over the past few decades, increasing number of peanut QTLs associated with sucrose content have been reported by BSA-seq, GWAS, and genetic mapping (Li et al., 2023; Guo et al., 2023a, 2023b; Zhang et al., 2023b; Huai et al., 2024; Wang et al., 2024). Although these studies made advances in dissecting the genetic mechanism of sucrose content, these is still much to be learned about this trait in peanut. In particular, it is still difficult to identify the most promising QTL for genetic cloning.
In this study, a population of 256 recombinant inbred lines (RILs) was utilized to map the QTLs for sucrose content and soluble sugar content in peanut kernel via high throughput sequencing. The objectives of this study were: (1) to construct a high-density genetic map (HDGM) according to the whole genome re-sequencing protocol; (2) to determine genomic regions that are associated with the sucrose content and soluble sugar content for kernels; (3) to identify the candidate genes for the major stable QTLs.
An F2:6 populations of 256 RIL lines derived from a cross between ‘Luhua11’ and ‘06B16’ was developed at the experimental station of Shandong Peanut Research Institute, Qingdao, China. ‘Luhua11’ cultivar is large-seeded with low sugar content. The genotype ‘06B16’ is small-seeded with high sugar content. The RIL population and its parental lines were planted in experimental fields in Laixi (N 36.86°, E 120.53°), Shandong Province (planted in May and harvested in September of 2021 and 2022); in Greenhouse of Laixi (N 36.86°, E 120.53°), Shandong Province (planted in May and harvested in September of 2022); and Weihai (N 37.24°, E 122.37°), Shandong Province (planted in May and harvested in September of 2023). The field and greenhouse experiments both followed a randomized block design with three replicates. For each plot, 10 plants from each RIL line were grown 15-cm apart within a row, with an 85-cm gap between RILs. Standard agricultural practices were applied for field management. Each plant was harvested individually at its maturity to prevent loss from over-ripening. Only eight plants in the middle of each row were used for trait measurement. About 20 seeds from each line were used to calculate seed sugar concentration using near-infrared reflectance (NIR) spectroscopy following the manufacturer’s protocol (Spectra Star XL, Unity, USA) (Tang et al., 2018).
The mean value and standard deviation of each trait for the parents and each RIL line were analyzed, and Student’s t-tests were conducted using IBM® SPSS® statistics 19. The normality of the population data was analyzed using Kolmogorov-Smirnov tests. Using the equation h2=σg2/(σg2+σge2/n+σϵ2/nr), the broad-sense of heritability(h2) for traits was calculated using ANOVA analysis with QTL IciMapping V4.2 (Meng et al., 2015).
At the seedling stage, young leaf tissue from recombinant inbred lines (RIL) lines and both parental plants were collected for DNA isolation. Genomic DNA was sheared to 350 bp fragments using a Covaris® disruptor. Subsequently, the DNA fragments underwent a series of steps in the library preparation process, including end repair, addition of polyA tails, addition of sequencing adapters, purification, and PCR amplification, culminating in the completion of the entire library preparation process (Illumina Inc., San Diego, CA, USA). High-throughput sequencing was performed on an Illumina Nova6000 platform at Lianchuan Biotechnology Corporation (Hangzhou, China), to generate 150-bp paired-end reads. The sequencing depths for the two parents and the RILs were approximately 20× and 3×, respectively. After filtering the reads to eliminate adapters and low-quality reads, the remaining clean reads were aligned to the reference genome (https://data.legumeinfo.org/Arachis/hypogaea/genomes/Tifrunner. gnm2.J5K5/) (Bertioli et al., 2019) using the BWA-0.7.10. The uniquely mapped reads were used to call SNPs with SAMtools v0.1.19 and GATK v3.3.0. Homozygous and polymorphic SNPs between the two parents were selectively retained for analysis within the RIL population. SNPs meeting the criteria of a missing rate and heterozygosity rate both less than 10%, along with a sequencing depth exceeding 3×, were employed for subsequent analyses and the construction of the genetic map.
SNPs were consolidated through binning using the genotype information of the parents. SNPBinner software (Gonda et al., 2019), which employs a Hidden Markov model (HMM) to determine recombination breakpoints and construct co-separation bins, was utilized in this study. To build a high-quality linkage map, bins with over 50% of samples with missing genotypes and severe partial separation were discarded. QTL IciMapping V4.2 software was applied to construct the linkage map, employing the 2-opt algorithm and performing rippling local optimization with a window size of 5 (Meng et al., 2015). The genetic positions of markers on each linkage group (LG) are presented in Supplementary Table 4. In addition, a co-linearity map was generated to evaluate the map quality. The linkage group number corresponds to the chromosome number assigned by the Tifrunner reference genome, indicating a high degree of consistency between genetic and physical maps.
The R/qtl package (Broman et al., 2003) was used to detect QTL and confirm the relationship between different markers around each QTL with the composite interval mapping method (CIM). The permutation test was conducted 1000 times with probability larger than 1% as the cutoff value. A logarithm of the odds (LOD) threshold value of 2.5 was employed to declare the presence of a QTL at a significance level of 99%. The positive and negative additive effect that represented the favorable alleles were from ‘Lu11’and ‘06B16’, respectively.
All the genes in the QTL region were annotated in four databases (NR, Swiss-Prot, GO, KEGG). Transcription data of genes in different tissues were obtained from the PeanutBase and used to graph a heatmap at https://software.broadinstitute.org/morpheus/ (Clevenger et al., 2016). A heatmap indicating the relative expression levels of candidate genes was constructed at https://www.omicstudio.cn/tool. Secondary structure prediction for candidate protein was performed with an online tool (PSIPRED) at http://bioinf.cs.ucl.ac.uk/psipred.
The mature peanut kernels of ‘06B16’ had higher sucrose and soluble sugar content (5.91 ± 0.61% and 7.75 ± 0.32% on average, respectively) than those of ‘Lu11’ (5.49 ± 1.00% and 7.47 ± 0.95%, respectively) across four environments (Table 1). Phenotypic data of the RIL population demonstrated skewed distribution (Figure 1; Table 1), indicating polygenic inheritance of these two traits. Transgressive segregation was observed in most environments (Figure 1). Sucrose content in the RIL population ranged from 3.33% to 7.55% in the 2021 Laixi, 3.81% to 8.08% in the 2022 Laixi, 2.35% to 6.54% in the 2022 Greenhouse, 3.46% to 7.88% in 2023 Weihai. The soluble sugar content of the RIL population ranged from 3.80% to 8.76% in the 2021 Laixi, 6.08% to 10.98% in the 2022 Laixi, 3.60% to 9.35% in the 2022 Greenhouse, 4.98% to 9.82% in the 2023 Weihai. ANOVA (analysis of variance) results indicated that the effects of genotype (G), environments (E), and interaction of G and E (G ×E) were all significant (Table 2). The sucrose content and soluble sugar content exhibited relatively high broad-sense heritability (h2), ranging from 0.78 to 0.71 (Table 2).
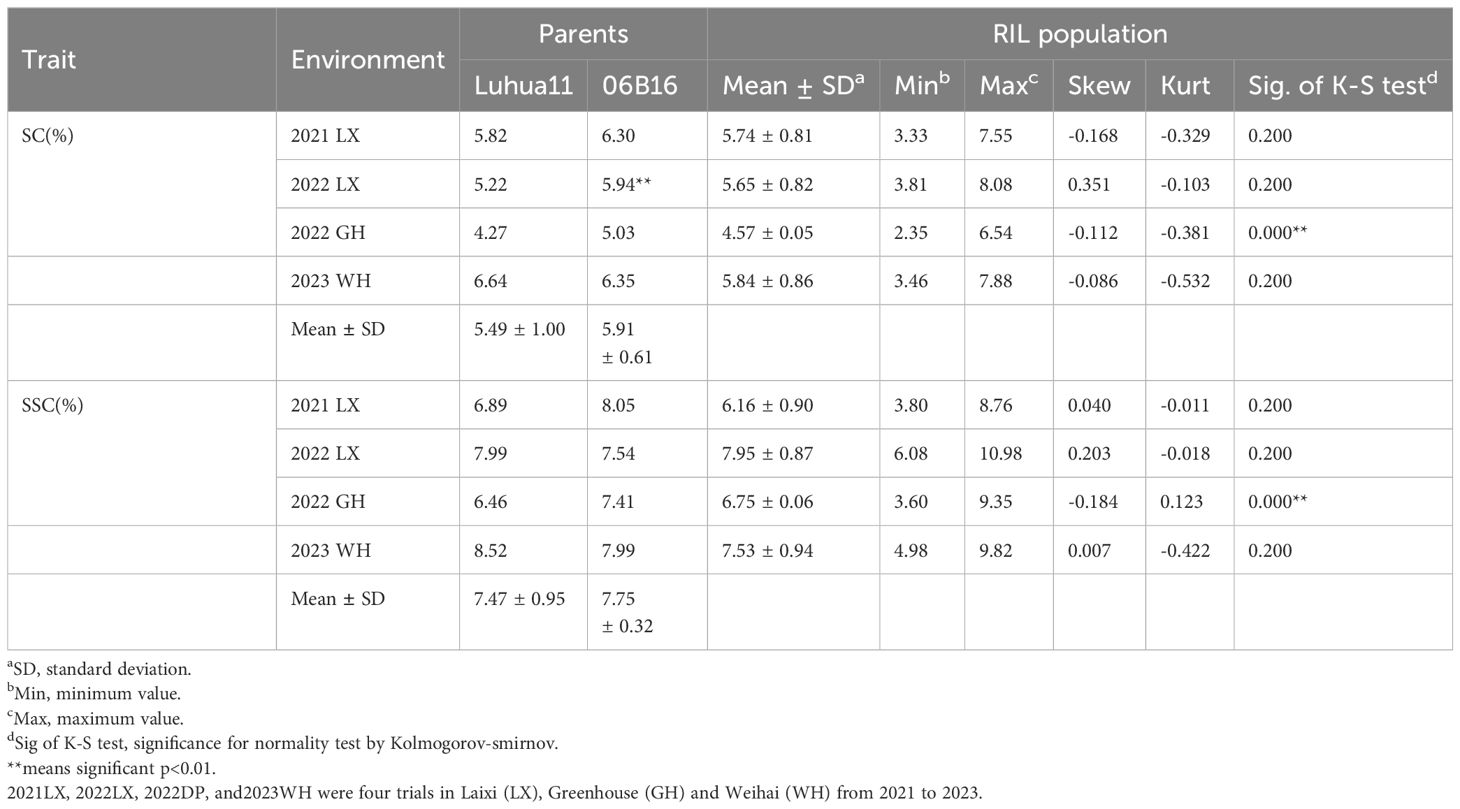
Table 1 Phenotypic variation of Soluble sugar content and Sucrose content among the RIL population of four environments.
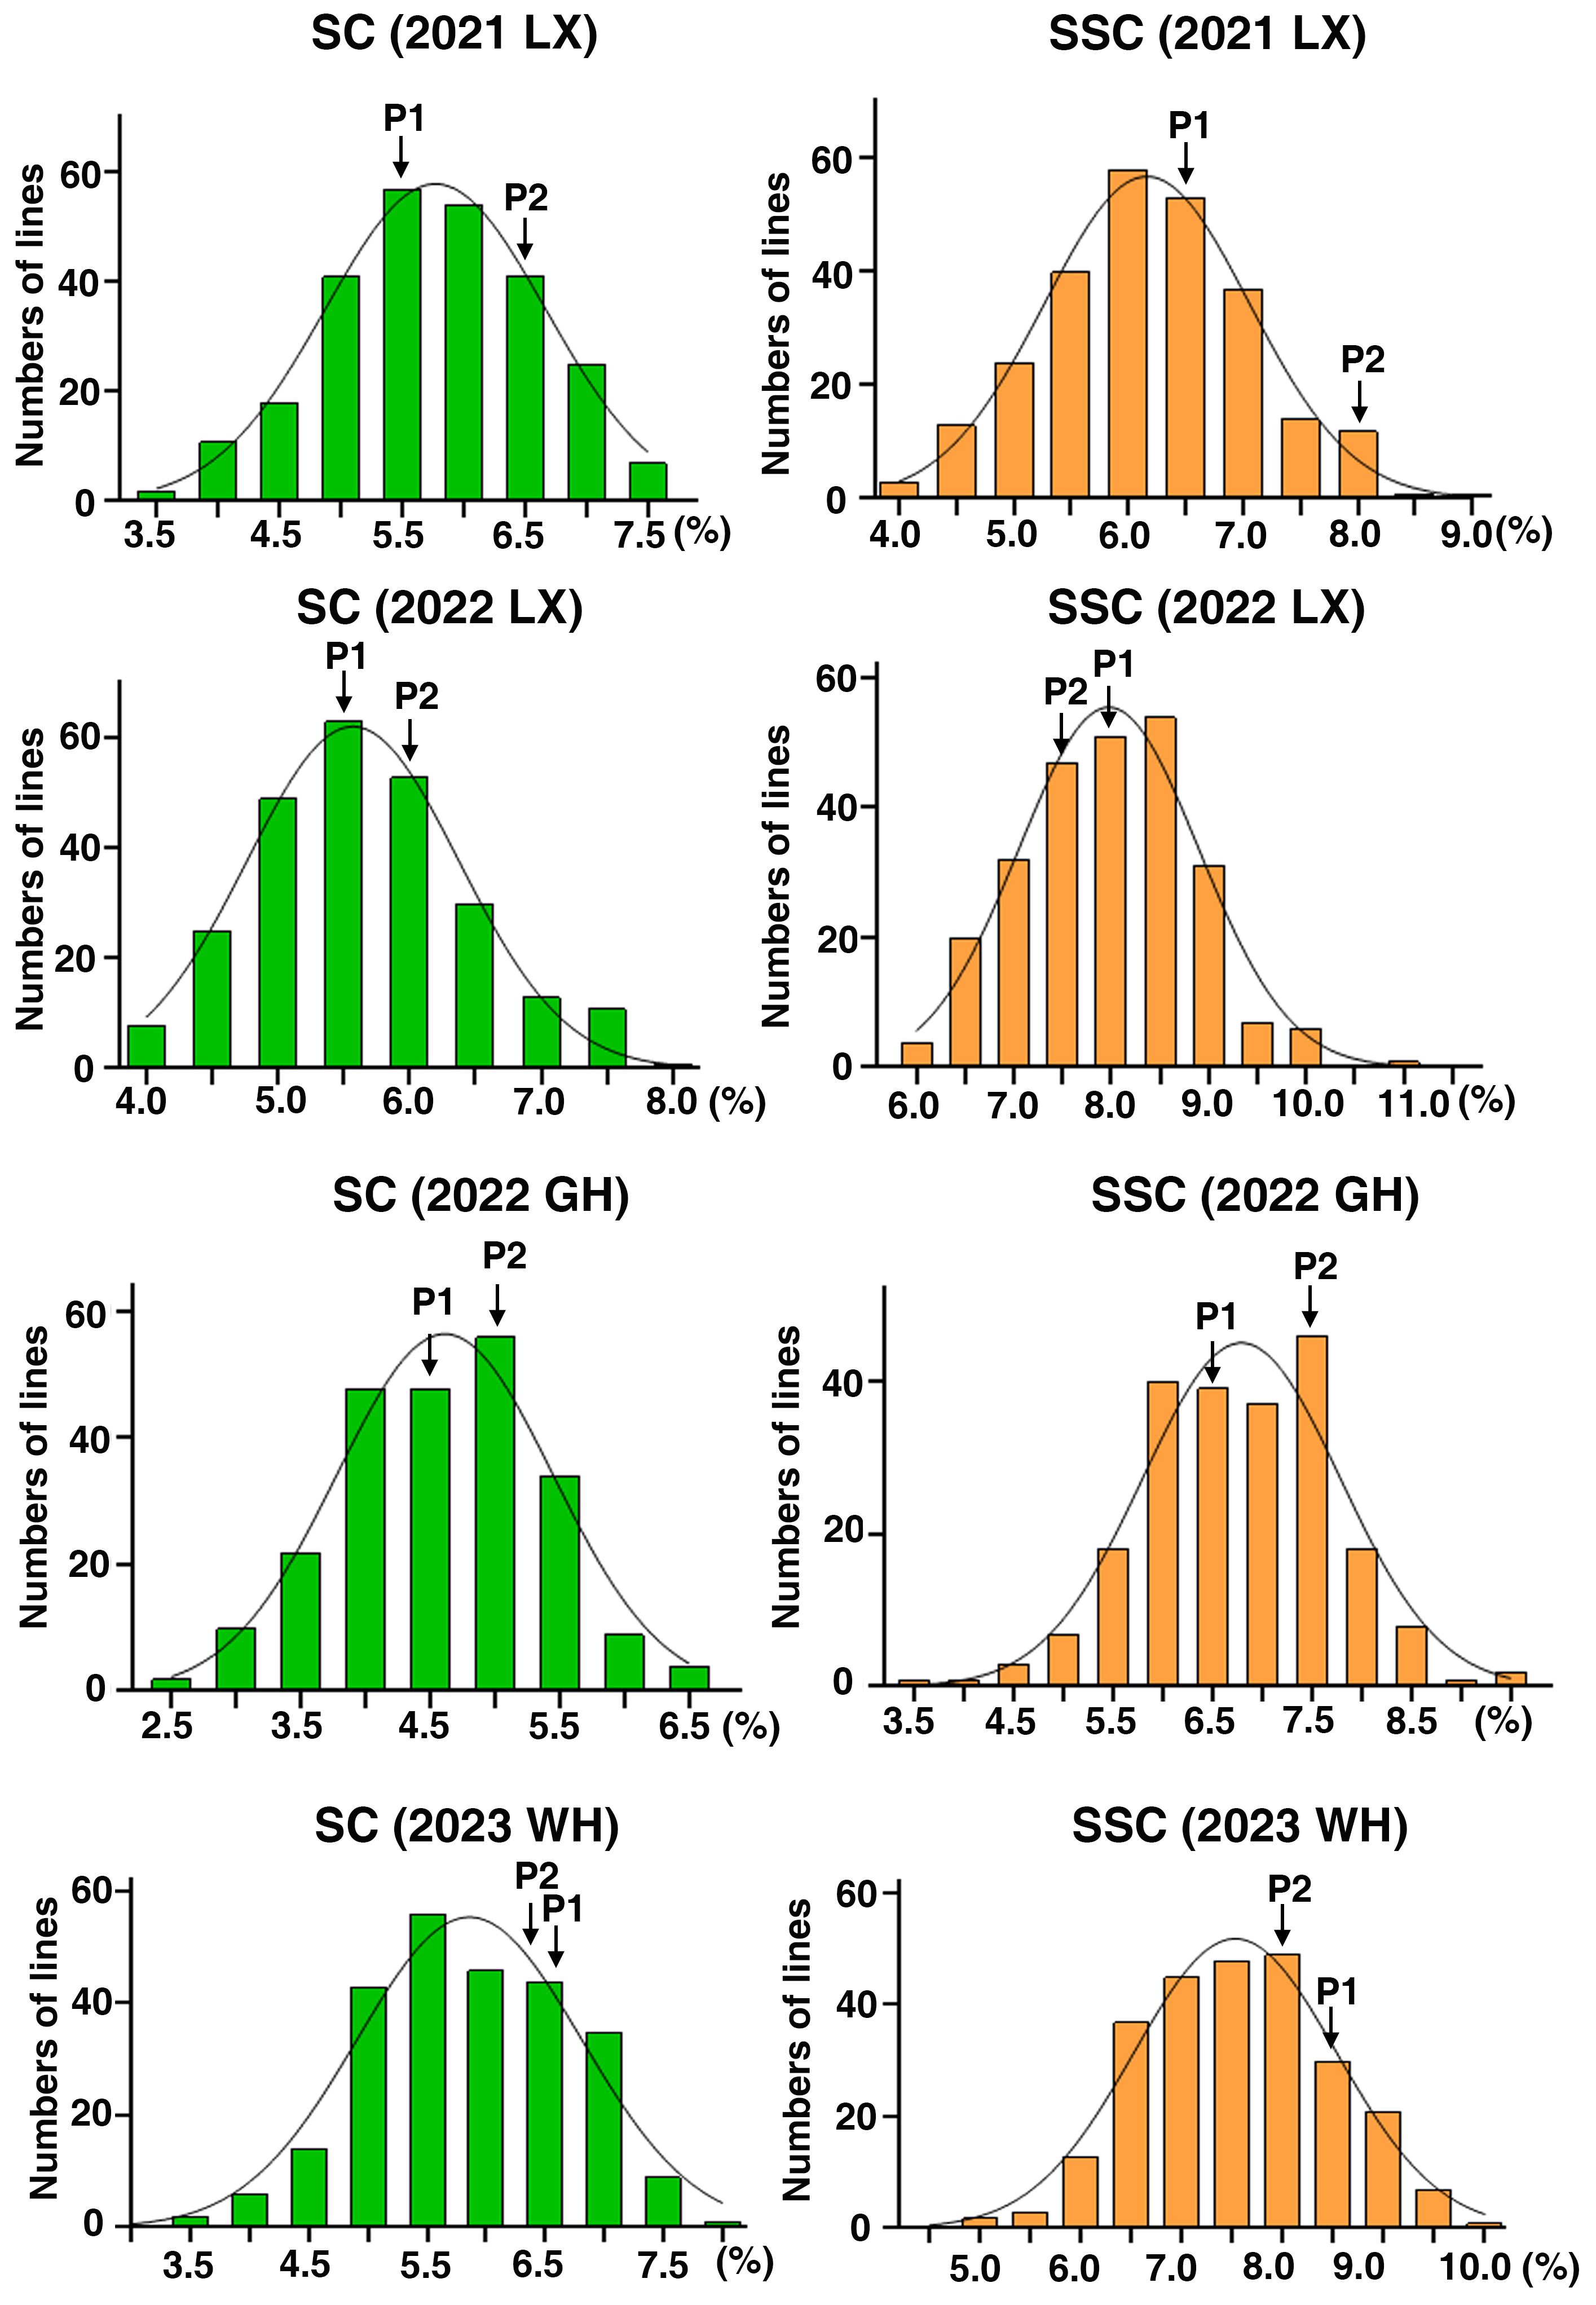
Figure 1 Phenotypic distribution of SC and SSC in the RIL population across four environments. The y-axis represents the number of lines and the x-axis represents the values of sugar content (SC) and Soluble sugar content (SSC). 2021LX, 2022LX, 2022GH, and 2023WH were four trials in Laixi (LX), Weihai (WH) and Greenhouse (GH) from 2021 to 2023. P1 and P2 denote the parents ‘Luhua 11’ and ‘06B16’, respectively.
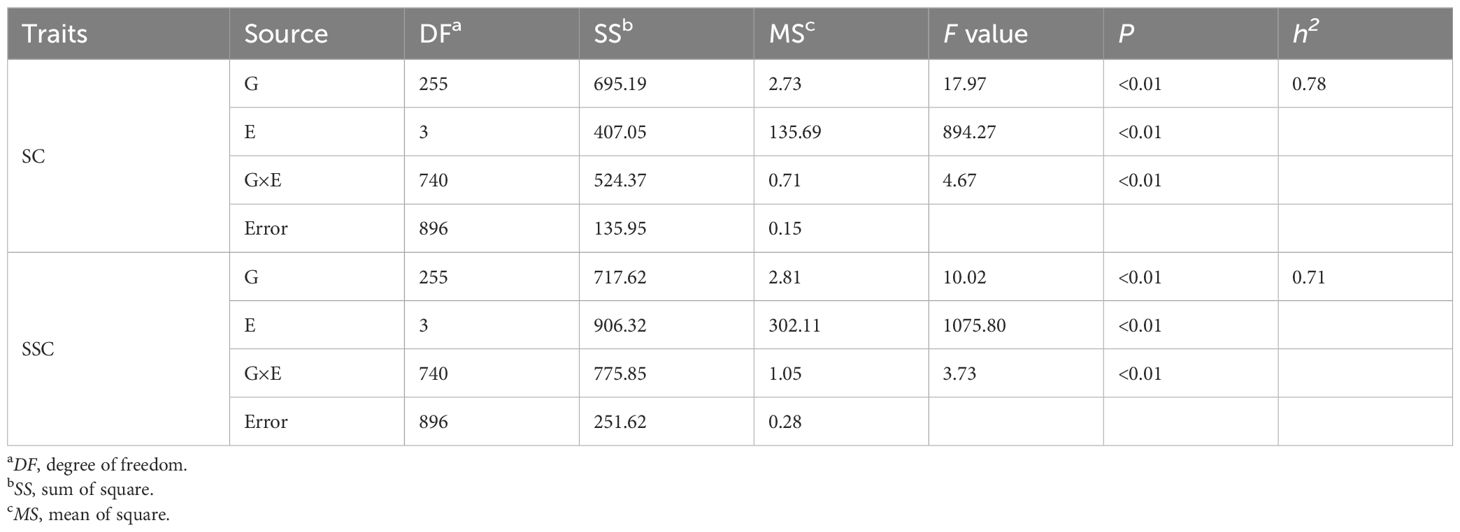
Table 2 Analysis of the broad-sense of heritability of sucrose content and soluble sugar content.
Approximately 2362.75 G cleaned data (Q20 > 94%) were generated, including 15.75 billion reads (Supplementary Table 1). About 368.86 and 304.57 million reads were obtained for the female and male parents, respectively, whereas 40.58–200.37 million reads were obtained for the RILs (Supplementary Table 1). More than 99% of the reads were mapped to the reference genome (Supplementary Table 2). A total of 924,882 polymorphic SNPs were identified for the two parents, of which 286,582 were homologous and used to screen for SNPs in the RILs. GATK software was also used to detect variation, the uniformly output SNPs were retained as reliable and used for the following analysis (Supplementary Table 3).
Redundant markers were removed from the filtered SNP set using SNPBinner (Gonda et al., 2019). In total, 3,875 bin markers (83,642 SNPs) were detected. After filtering the low quality bin markers, 3692 bin markers (82,292 SNPs) were used to construct the high density genetic map (HDGM) and were assigned to 20 linkage groups (LGs) (Figure 2; Supplementary Table 4). The whole map length was 981.65cM, with the genetic distance ranging from 26.18 cM to 82.74 cM for each LG with an average marker distance of 0.27cM (Figure 2; Table 3). LG B03 was the longest group covering a distance of 82.74 cM with 401 loci, while LG A10 was the shortest group spanning 26.18 cM with 91 loci (Table 3). Subsequently, the degree of map uniformity and inter-marker linkage were evaluated by the percentage of ‘Gaps ≤ 5 cM’, which ranged from 98.80% to 100% with an average value of 99.94%. The largest gap existed on LG B01 which was 12.77 cM. In order to evaluate the precision of the high density genetic map, we performed collinearity analysis by comparing the genetic positions of markers on each LG with their corresponding physical positions. The collinearity between the genetic and genomic positions was remarkably high, with all values surpassing 99.99% (Supplementary Table 5; Supplementary Figure 1), providing strong evidence of a thoroughly organized marker assignment.
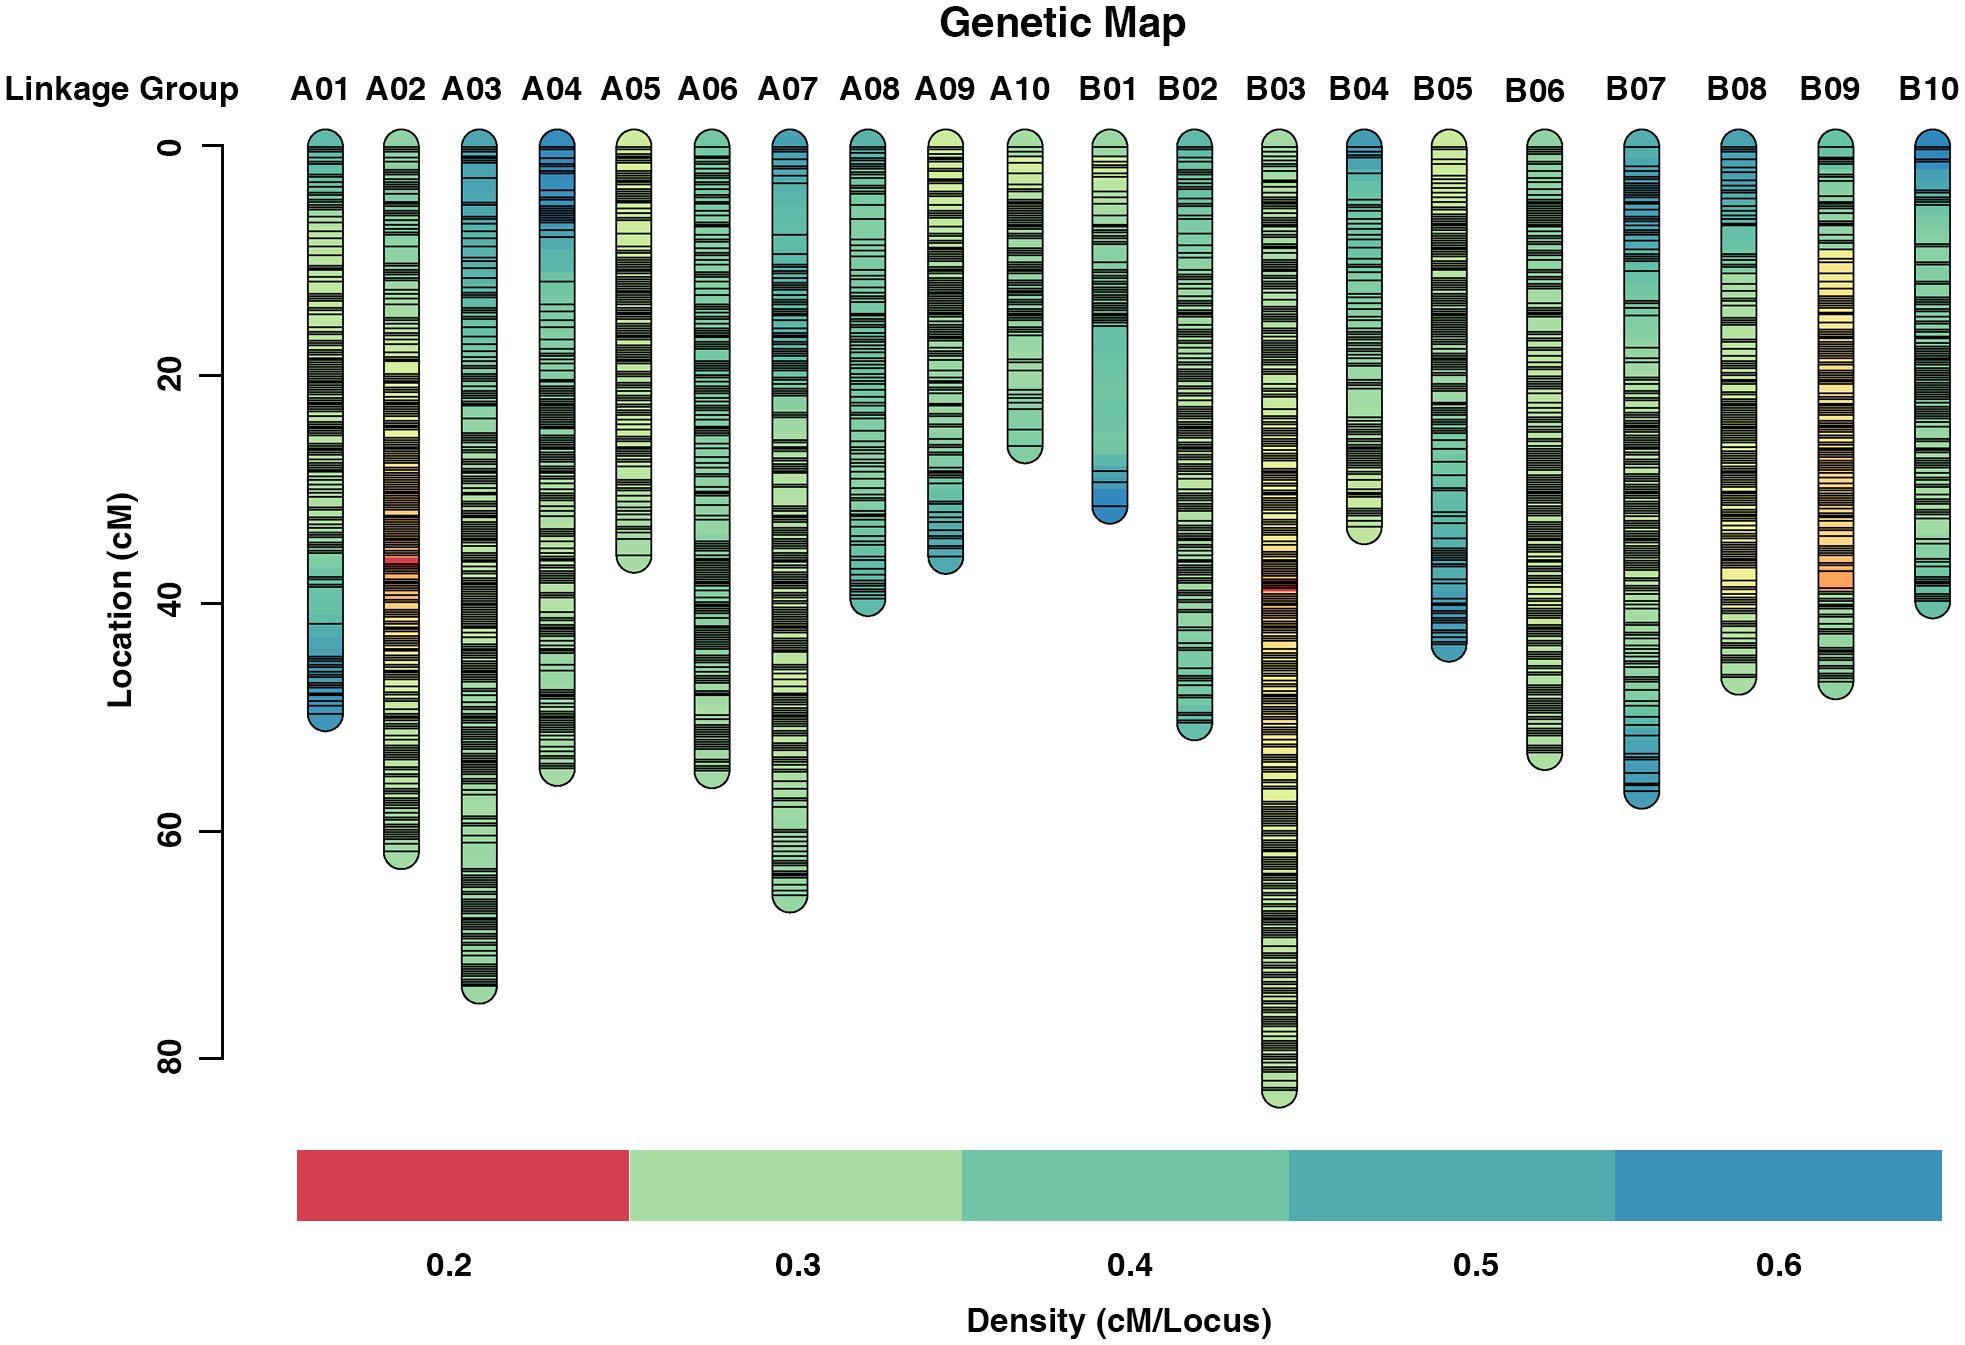
Figure 2 High density genetic map of the RIL population using Bin markers, the markers were indicated by black bars.
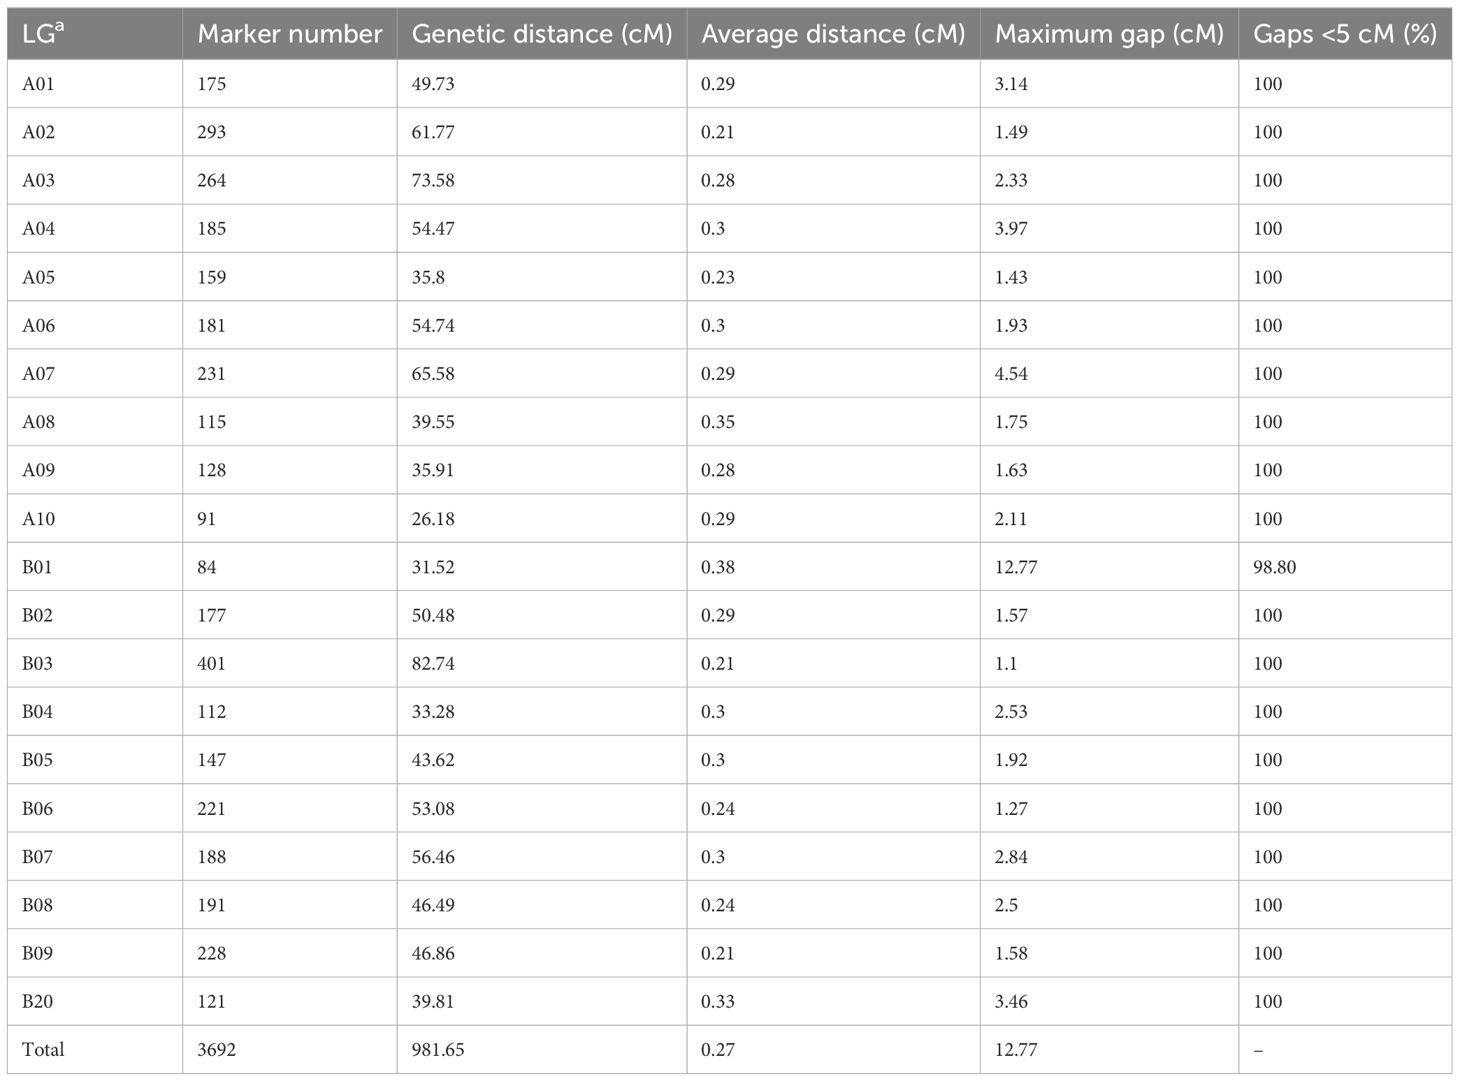
Table 3 Summary of the high-density genetic map.
A total of five QTLs for sucrose content with 4.61-33.58% phenotypic variation explained (PVE) were mapped on 3 chromosomes including LG A07, B06, and B09 based on the HDGM with LOD values of 2.59-22.75 (Figure 3; Table 4). Among them, a major QTL region on LG B09 (qSCB09.1, and qSCB09.2) was stably expressed across three environments with 21.51%-33.58% PVE. Donor alleles for qSCB09.1, and qSCB09.2 were from ‘06B16’. The remaining two QTLs were identified in single environment.
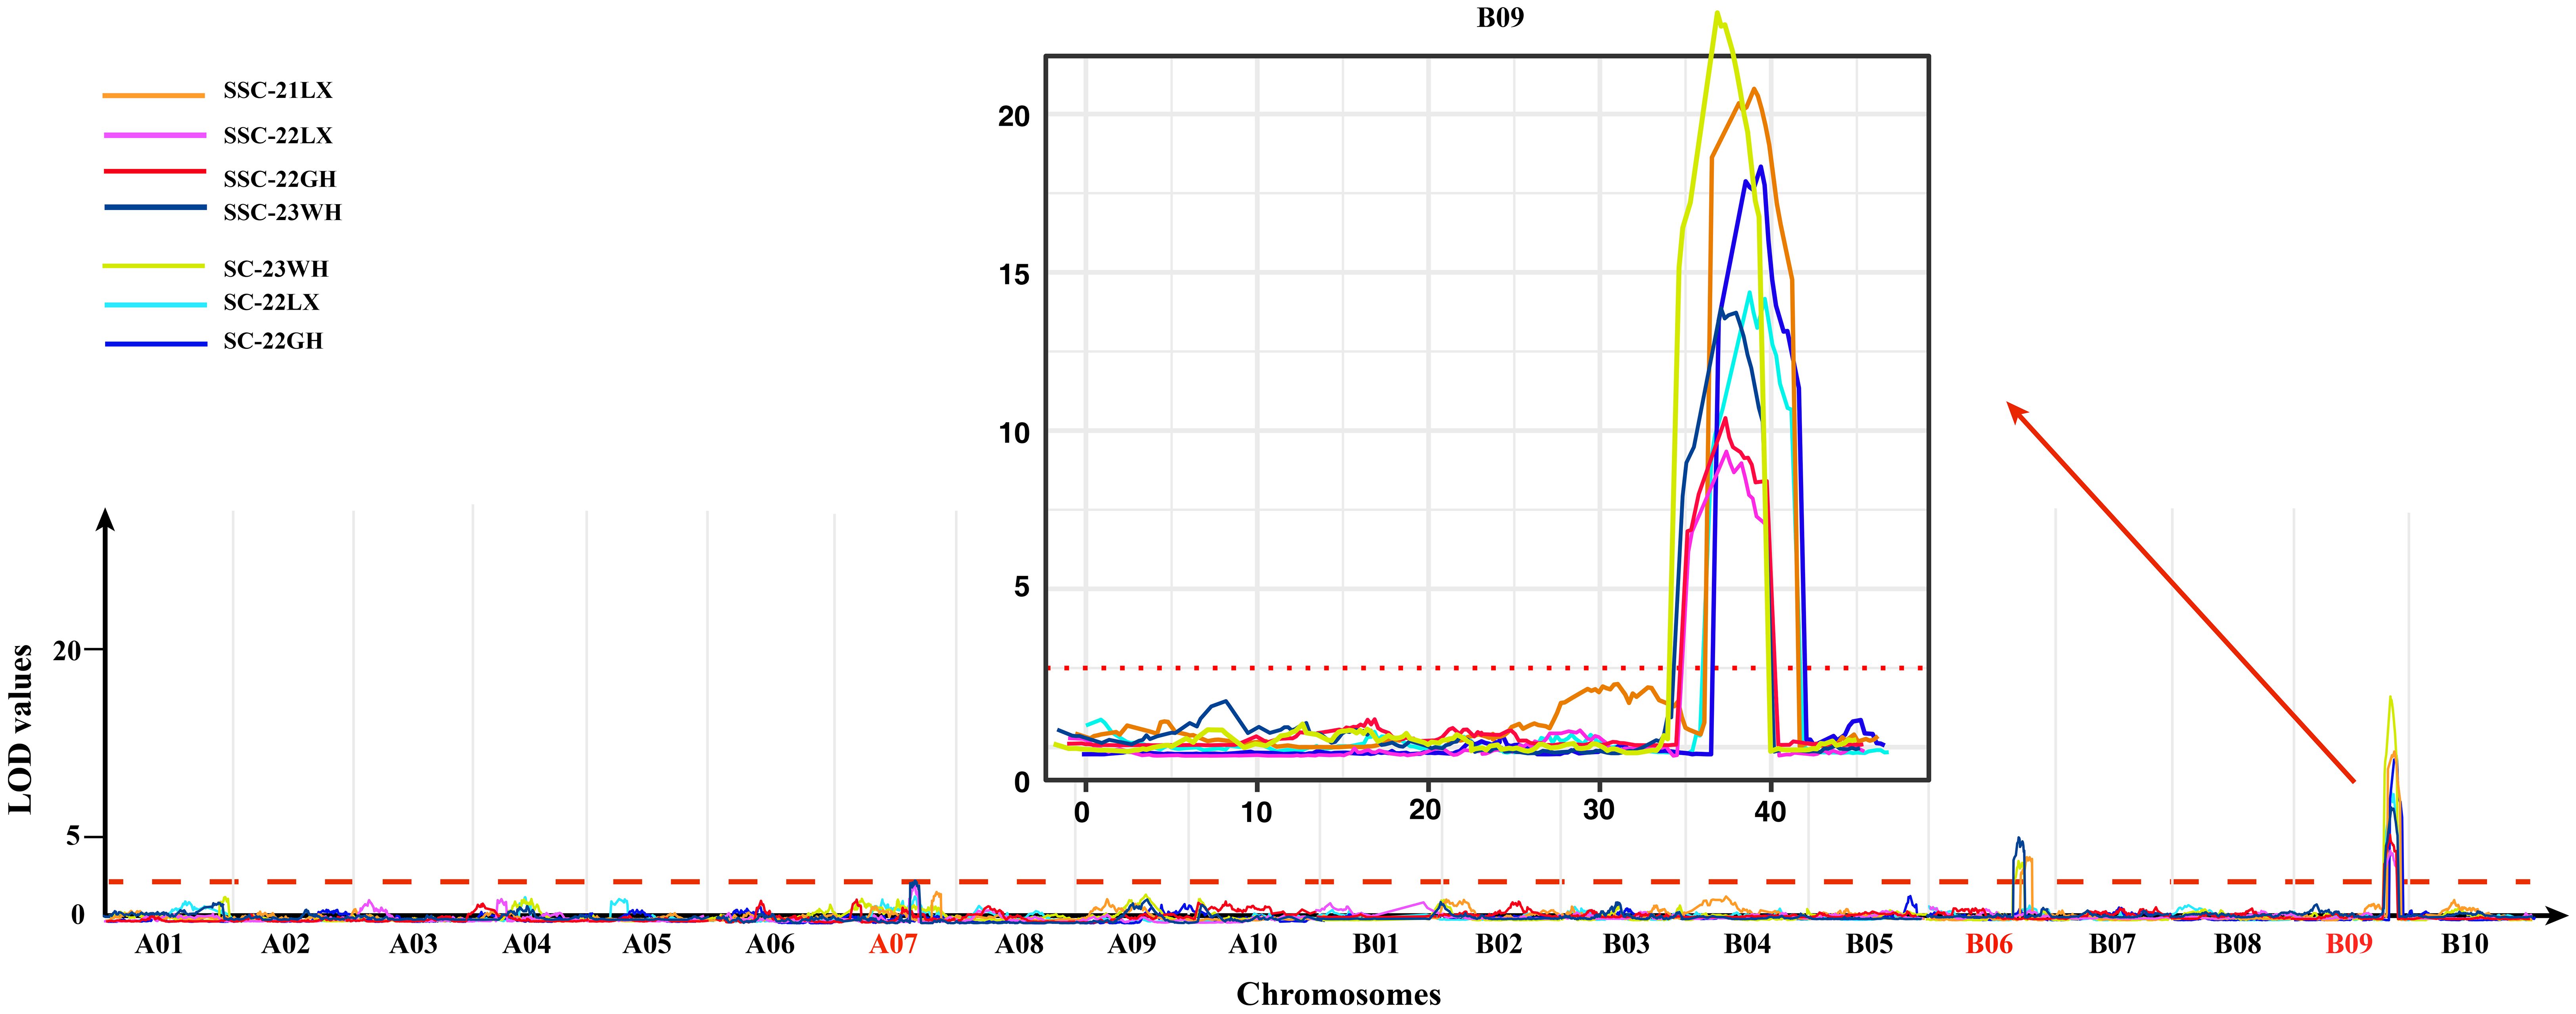
Figure 3 LOD curves of SC and SSC on the whole genome across four environments. The chromosomes of QTLs identified were denoted in red, and the major QTL region in chromosome B09 was showed in details.
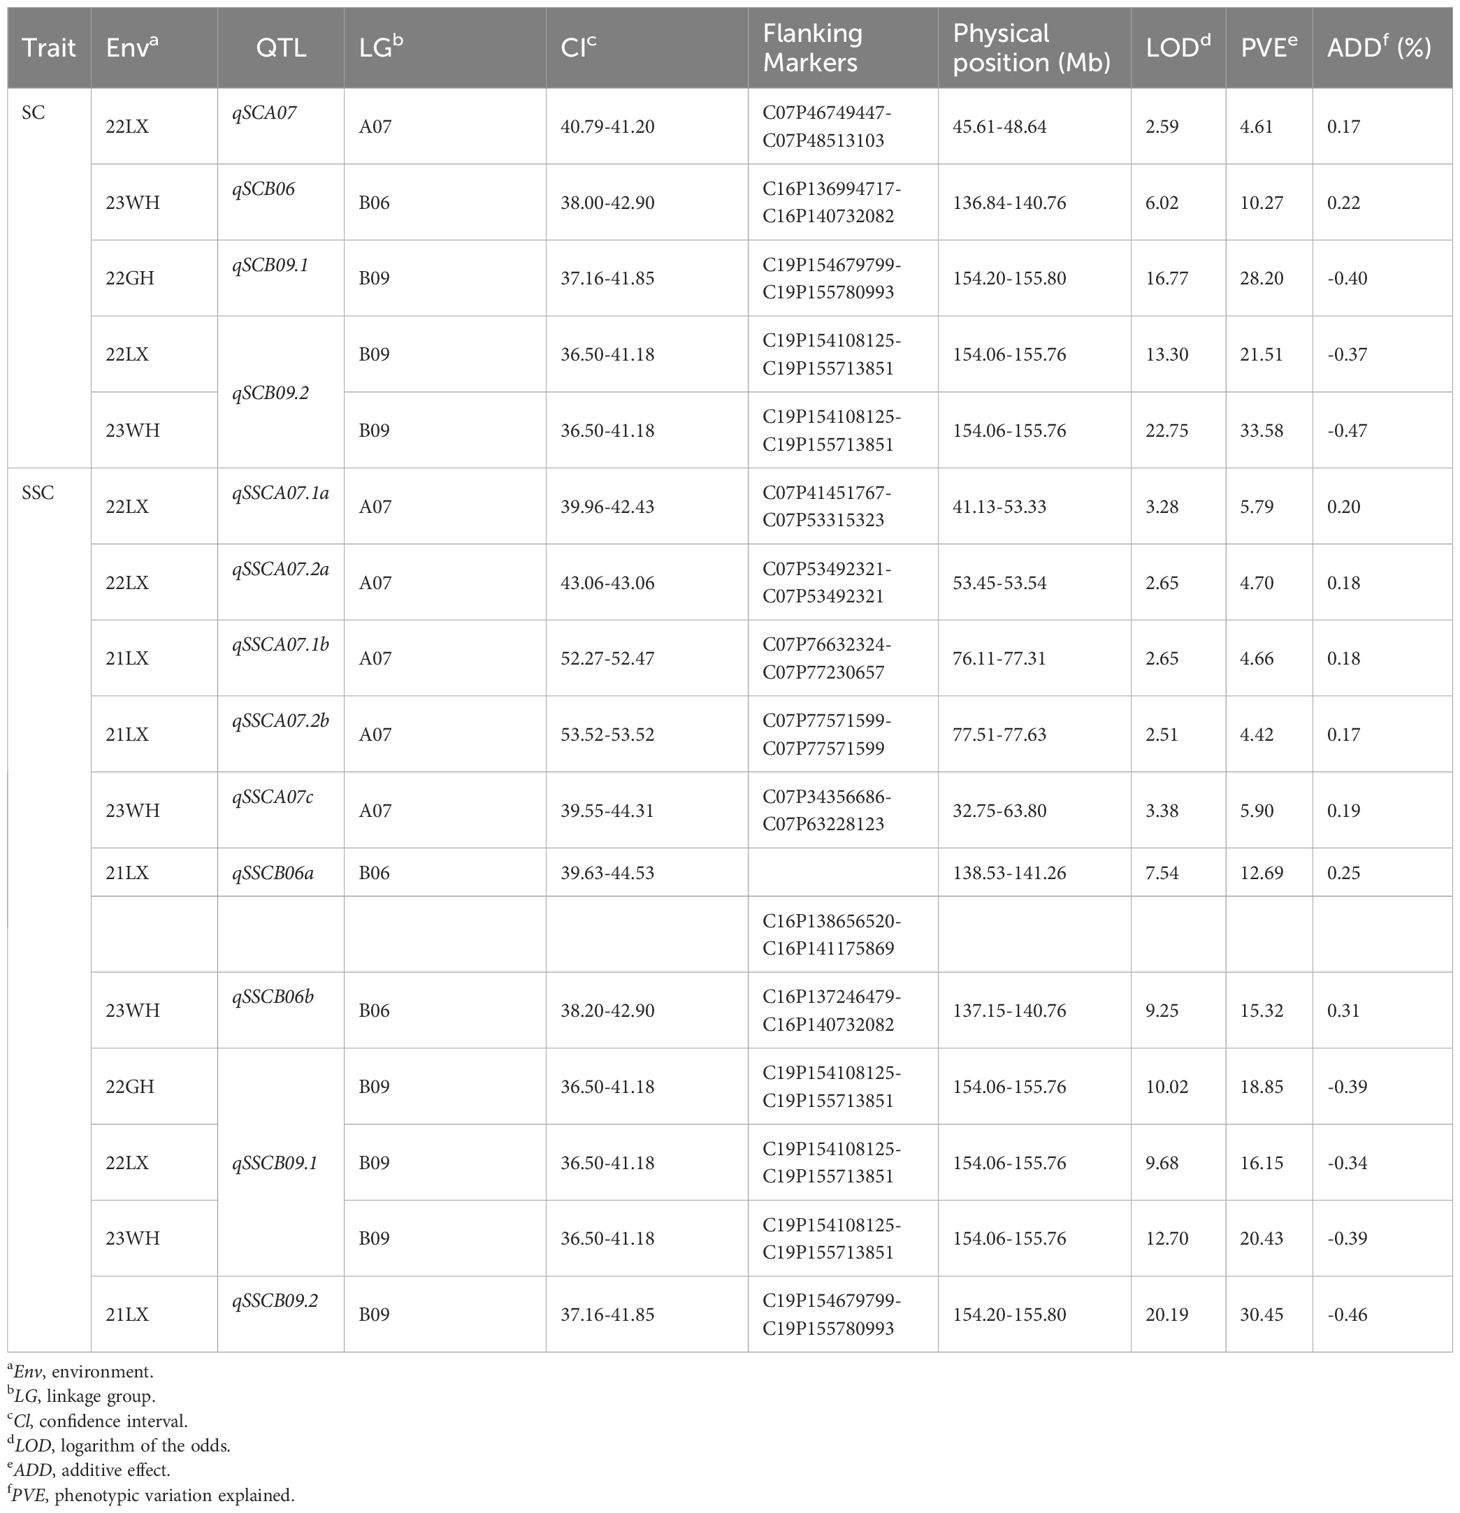
Table 4 QTL analysis for sucrose content and soluble sugar content.
QTL mapping identified 11 QTLs for soluble sugar content with 4.42%-30.45% PVE. These were distributed on LG07, B06, and B09 (Figure 3; Table 4). The major QTL region was on LG19 (qSSCB09.1, and qSSCB09.2) was consistently detected at all four environments, with LOD scores of 9.68–20.19 (Table 4). The additive effect was between -0.46 and -0.34, implying the high soluble sugar content allele was derived from the male parent ‘06B16’. The other seven QTLs were detected in single environment.
It is interesting that qSCB09 and qSSCB09 were co-localized to a 4.02 cM interval (37.16–41.18 cM, the corresponding physical interval is 154.20-155.76 Mb) with flanking markers of C19P154679799- C19P155713851 (Table 4). To determine phenotypic contributions of this QTL region, flanking marker profile was used to selected and group RIL into two homozygous genotypes (Figure 4; Supplementary Table 6). Student t-test revealed significant differences (P < 0.01) between the two genotypic groups (Figure 4). The RILs with the A1A1 genotype (representing the ‘06B16’ allele in qSCB09 and qSSCB09) had a higher sucrose content and soluble sugar content than those with aa genotype (representing the ‘Lu11’ allele in qSCB09 and qSSCB09) (Figure 4). The elite allele of qSSC/SCA07 and qSSC/SCB06 from the elite ‘06B16’ was defined as the ‘B1B1’ and ‘C1C1’ genotype, respectively, while another allele from ‘Lu11’ was defined as the ‘B2B2’ and ‘C2C2’ genotype, respectively. We noticed that some RILs exhibited higher sucrose and soluble sugar contents compared to both parents. Therefore, we further examined the distribution of allele from all three QTLs, qSSC/SCB09, qSSC/SCA07 and qSSC/SCB06. The genotype of three QTLs was ‘A1A1B1B1C1C1’ for parent ‘06B16’ and ‘A2A2B2B2C2C2’ for parent ‘Lu11’. There were eight different genotypes, ‘A1A1B1B1C1C1’, ‘A1A1B1B1C2C2’, ‘A1A1B2B2C2C2’, ‘A2A2B1B1C2C2’, ‘A2A2B2B2C2C2’, ‘A2A2B1B1C1C1’, ‘A2A2B2B2C1C1’, and ‘A1A1B2B2C1C1’, from the lines in the RIL population. Obviously, the lines with ‘A1A1B2B2C2C2’ genotype by combining three elite alleles of qSSC/SCB09, qSSC/SCA07 and qSSC/SCB06 showed an over-dominant phenotype with 6.19% of sucrose content, and 7.89% of soluble sugar content, which is significantly higher than that of lines with other genotypes (Figure 5; Supplementary Table 6). These results showed that the combination of three elite alleles from three QTLs, qSSC/SCB09, qSSC/SCA07 and qSSC/SCB06, produced an over-dominant phenotype with significantly increased sucrose content and soluble sugar content.
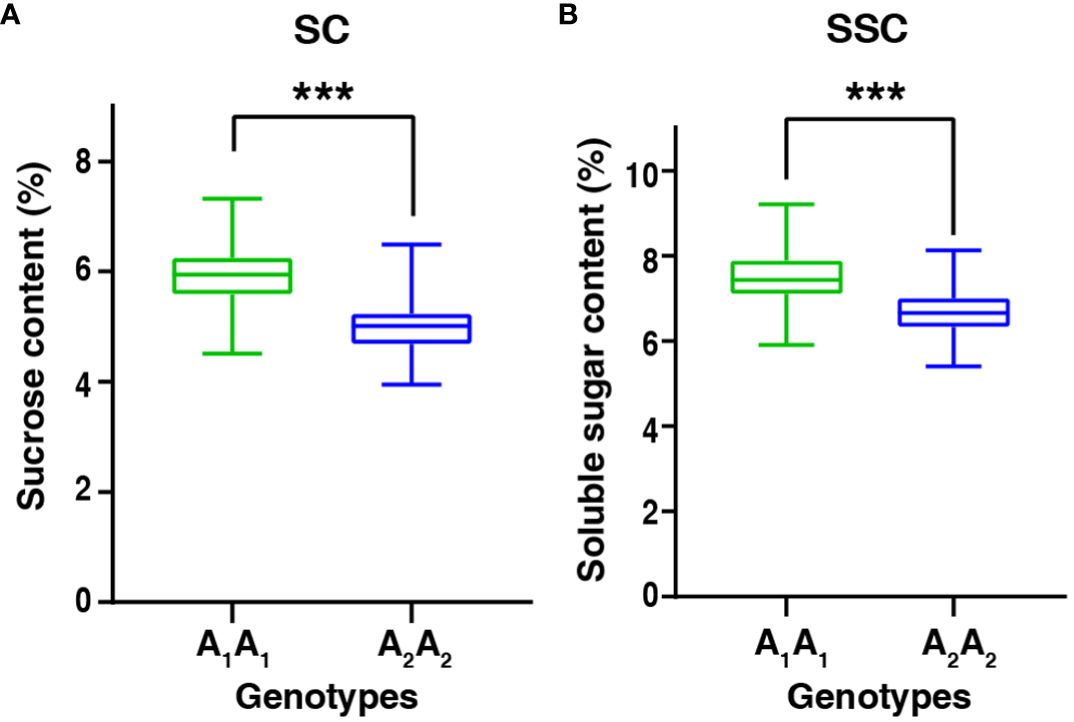
Figure 4 The boxplot of sucrose content and soluble sugar content between two genotypic groups in the RIL population. A1A1 and A2A2 represented the elite allele in qSCB09 and qSSCB09 were from 06B16 and Lu11, respectively. ***represent significant difference at P=0.001 level by t-test.
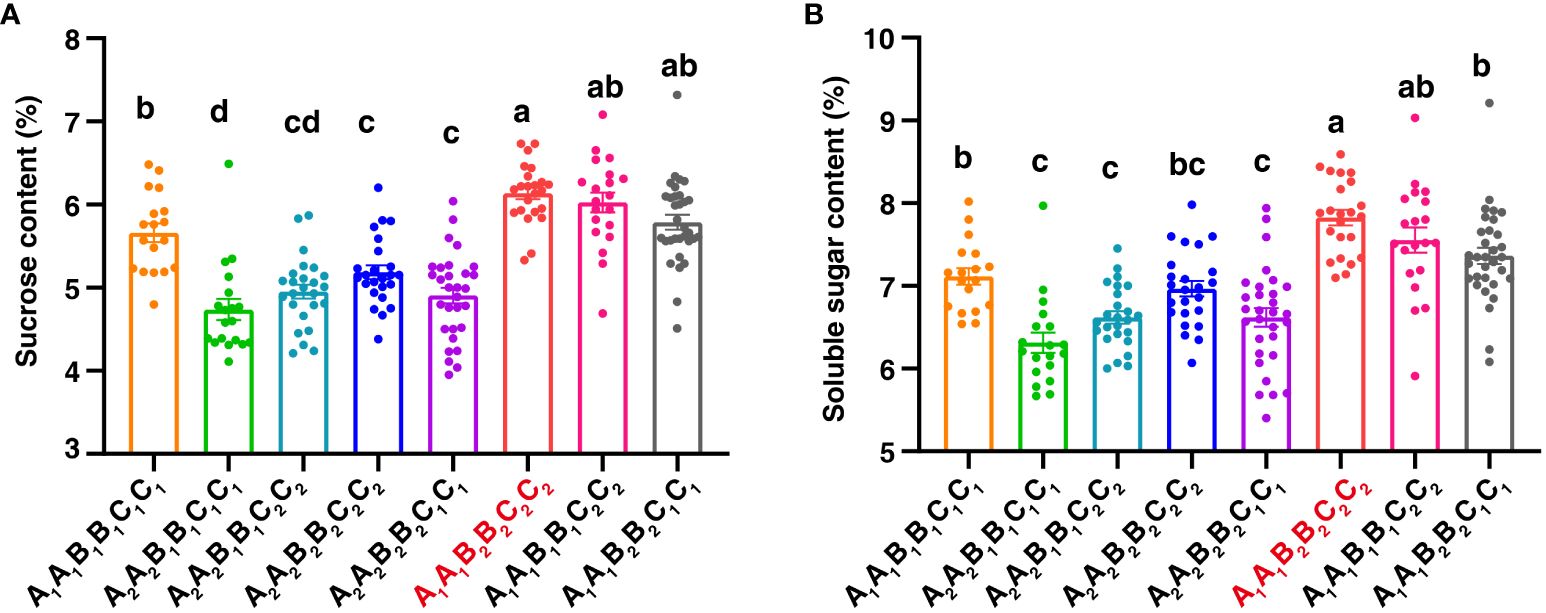
Figure 5 The combinatorial effects of QTLs on B09, A07, and B06 with sucrose content (A) and soluble sugar content (B). The letters A, B, C represented QTL regions on B09, A07, and B06, respectively. A1A1 and A2A2 represented the homozygous alleles in qSCB09 and qSSCB09 were from 06B16 and Lu11, respectively. Different letters indicate significant (p < 0.05) differences between means, based on a one-way ANOVA test.
The stable major QTL region qSCB09/qSSCB09 was mapped in the cultivated peanut genome between 154,057,090 and 155,797,391 bp on chromosome B09 with 118 annotated genes located in this interval. There were 84 functional genes related to maltose metabolism, signal transduction, response to stress, lipid metabolism, secondary metabolite biosynthesis, oxidation-reduction, transcription, sucrose metabolism, and starch biosynthesis (Supplementary Table 7).
To investigate expression pattern of annotated genes in the stable major QTL region qSCB09/qSSCB09, we surveyed the transcript abundance of these genes in leaf, root, and seed at different developmental stages. Interestingly, most of the genes in the confidence interval were highly expressed in seeds (Figure 6). The expression pattern of Arahy.MS9EFZ, Arahy.11CPHY, and Arahy.AY8I6Y were all first increased and then decreased, which is in line with the trend of sucrose accumulation, indicating they may be candidate genes for sucrose content and soluble sugar content in peanut kernels.
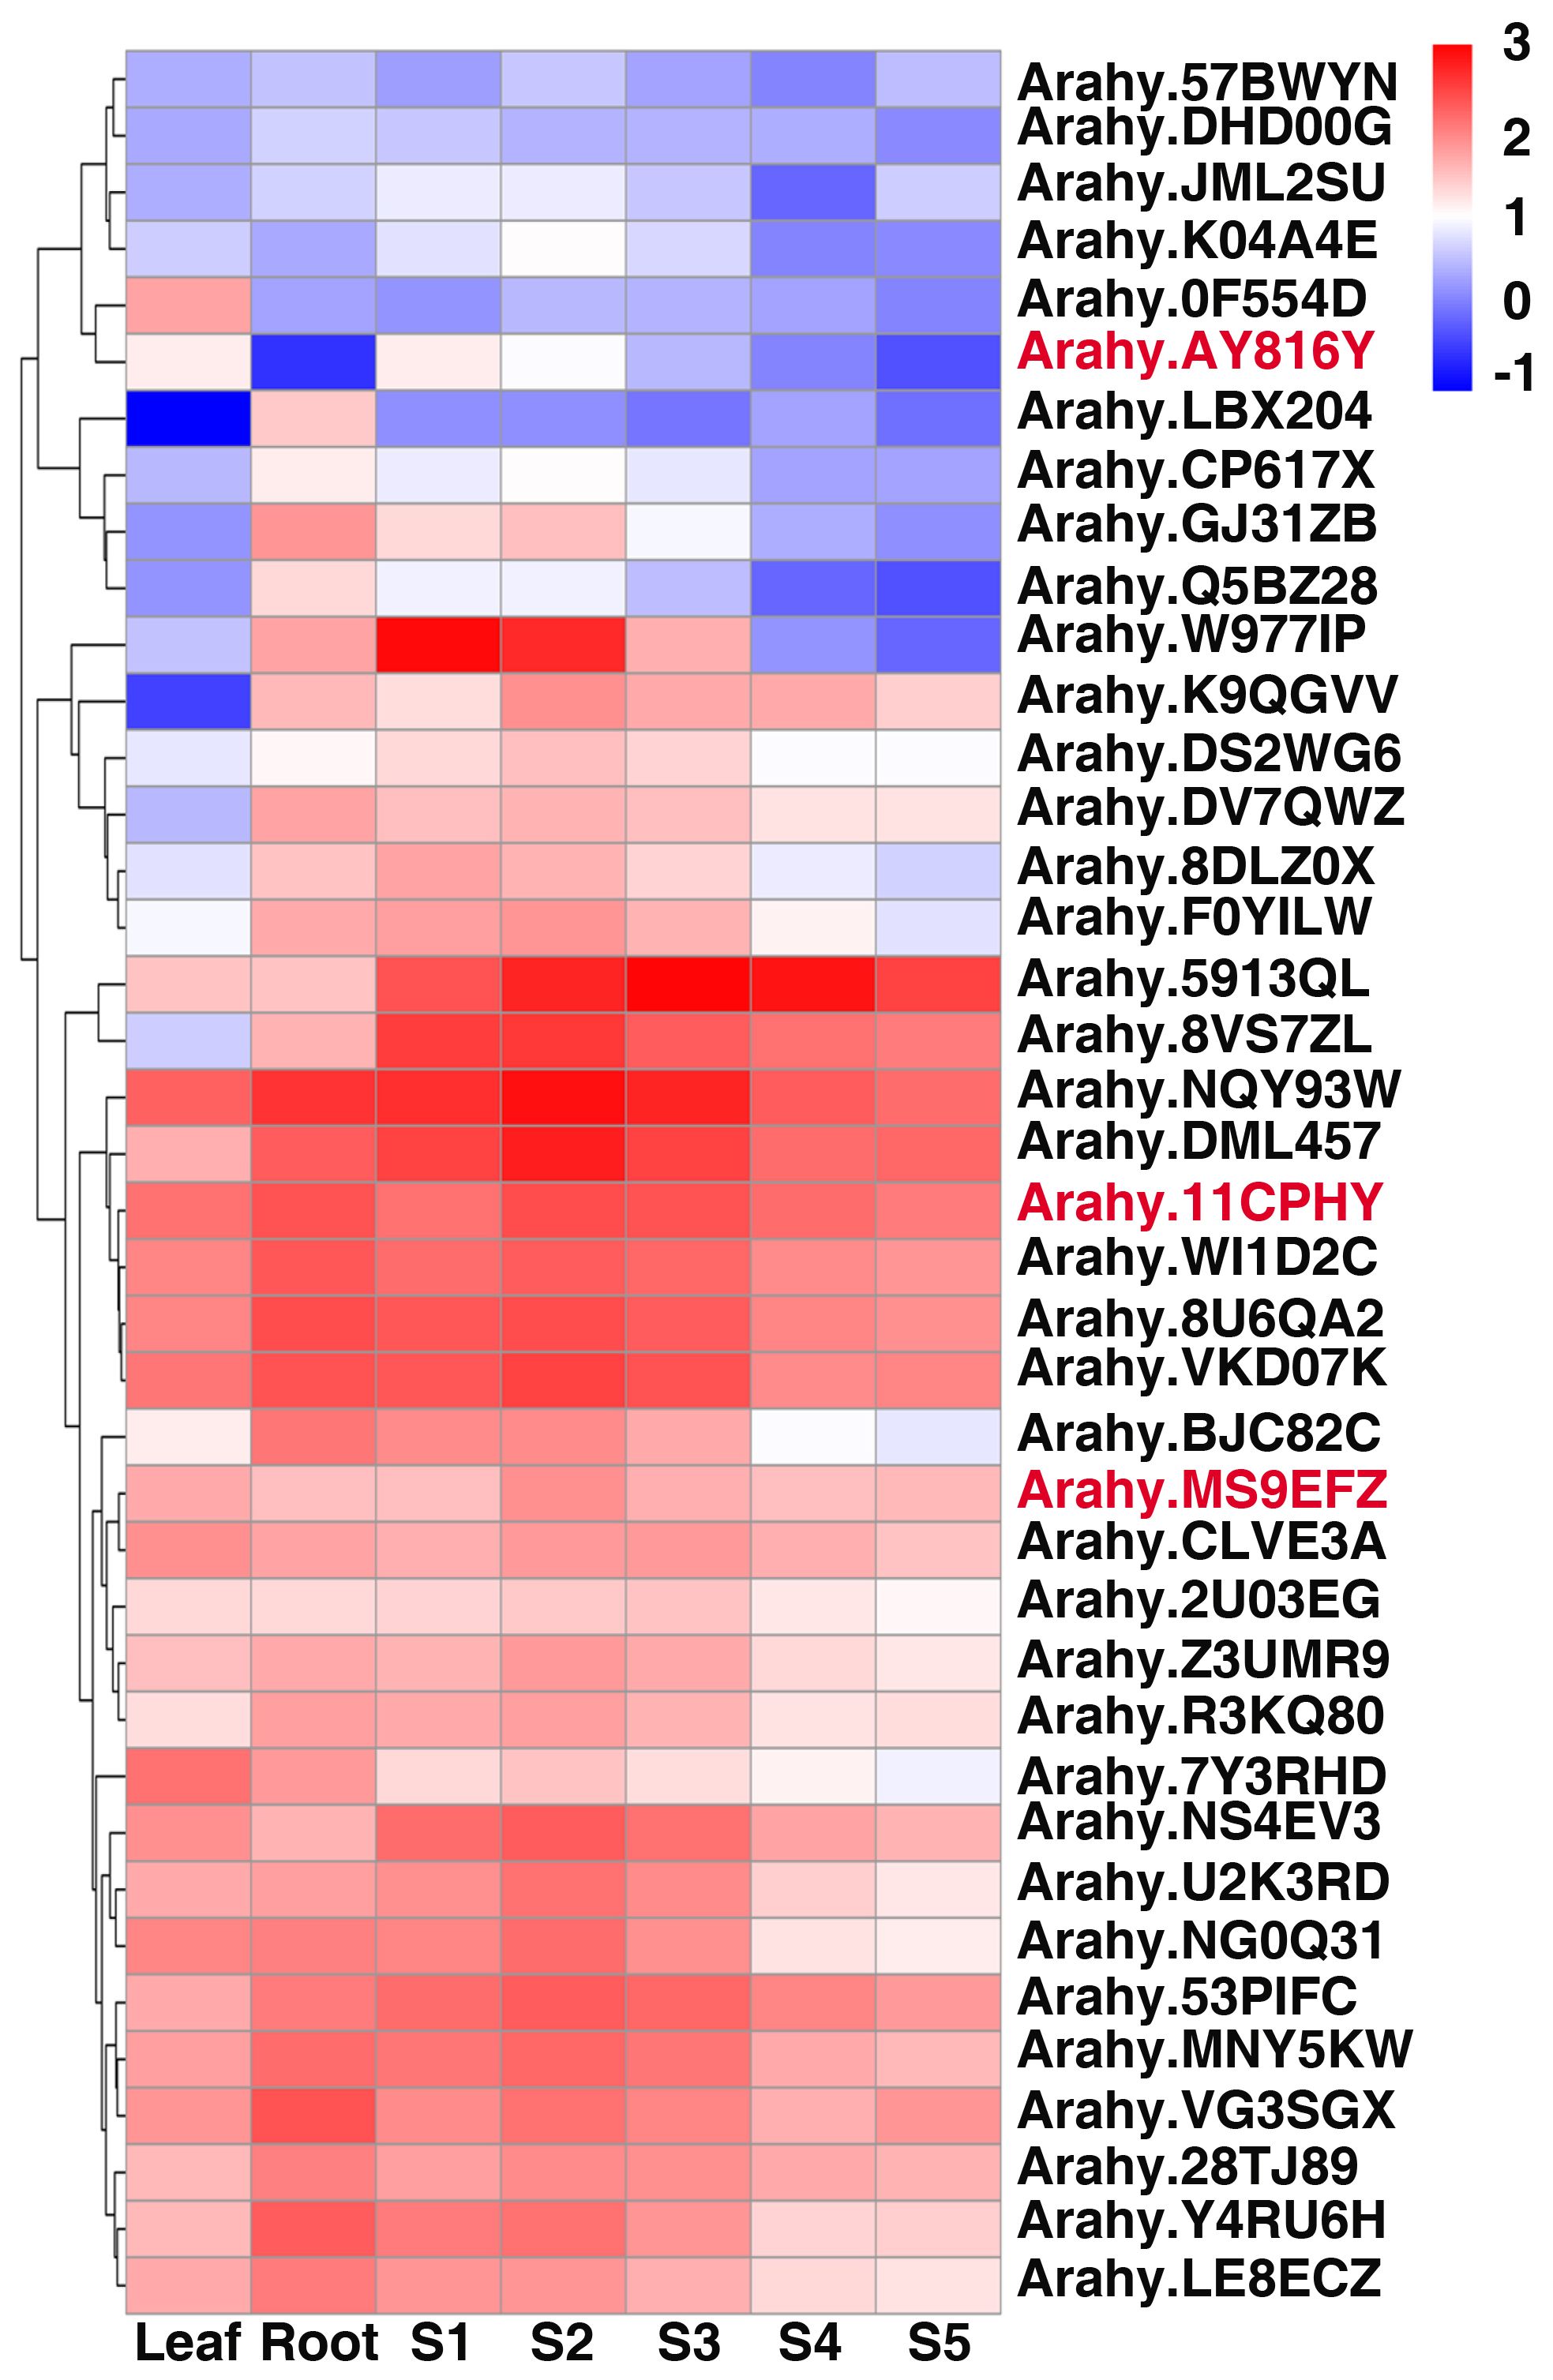
Figure 6 Heatmap analysis of candidate genes of peanut SSC and SC in different developmental stages. S1 to S5 indicated the fruit Pattee 1 to 5 stages. The values of transcript abundances were taken from Clevenger et al. (2016).
Meanwhile, a total of 38 SNP variants were identified in the interval based on the whole genome resequencing data in the parental lines (Supplementary Table 8). Among these variants, seven SNP variants which affected six genes were detected (Supplementary Table 8), including two intron variants in Arahy.JI97RZ and Arahy.KA4332, a premature start codon gain variant in the 5’-UTR of Arahy.MS9EFZ, three downstream gene variants in Arahy.11CPHY, Arahy.LC7X94, and Arahy.AY8I6Y, and a missense variant in Arahy.AY8I6Y. This SNP (G/C) caused an amino acid substitution (Ser toThr) of Arahy.AY8I6Y and might result in secondary structure (strand, helix and coil) variations (Supplementary Figure 2).
In this study, we successfully identified a novel major and stable QTL region, along with candidate genes associated with sugar content in peanut seeds. The QTL region qSCB09/qSSCB09 is the major and stable locus controlling sugar content, explaining phenotypic variance of 21.51% to 33.58%.
The parental lines did not significantly differ for sucrose content and soluble sugar content in this study, but showed transgressive segregation, indicated that much of the broad-sense heritability was contributed by dominant and epistatic gene actions, which can be exploited via hybrid breeding (Ayalew et al., 2022). This phenomenon is often encountered in studies of complex traits in crops, where multiple genetic factors contribute to variations in quantitative traits (Ren et al., 2020; Mackay et al., 2021; Ayalew et al., 2022; Zhang et al., 2023c). It has implications for crop improvement, as it introduces genetic diversity that may lead to enhanced traits. Notably, the absence of extreme phenotypes in the parent lines underscores the dynamic nature of genetic interactions. In this study, the board-sense heritability (h2) of sucrose and soluble sugars was 78% and 71%, respectively (Table 2), The higher broad-sense heritability (92% and 86%) of sucrose content in peanut have been reported (Li et al., 2023; Wang et al., 2024), indicating a potential for sucrose and soluble sugars improvement. However, the concentration of sucrose and soluble sugars were also influenced by environmental factors, such as soil, water, climate, etc. The minimum content of sucrose and soluble sugars in the RIL population varied greatly across different environments, the content of SC and SSC were 2.35%-3.81% and 3.60%-6.08%, respectively, and the highest sucrose and soluble sugars concentrations were found in 22LX (Table 1).
Construction of a high density genetic map (HDGM) is a traditional way of mapping QTL for agronomic traits. The whole genome re-sequence (WGRS) strategy has advantages in HDGM and favorable QTL identification (Kumar et al., 2020; Zhao et al., 2020; An et al., 2021; Wu et al., 2023). Currently, several HDGMs based on WGRS have been published in cultivated peanut, and resulted in yield and oil quality related QTLs detection in cultivated peanut (Li et al., 2019; Liu et al., 2020; Wang et al., 2020; Sun et al., 2022; Li et al., 2023; Yang et al., 2023). In our present study, a high-density genetic map was constructed with 3692 bin markers, the whole length was about 981.65 cM and the average marker distance was 0.27cM (Figure 2; Table 3), the density of which was higher than the previous studies (Li et al., 2023; Wang et al., 2024). Collinearity analysis validated the high quality of this map (Supplementary Table 5). In view of the HDGM and the phenotypic data of multiple environments, the QTLs identified in our study were reliable.
There were increasing numbers of quantitative trait loci (QTLs) associated with sucrose content in peanut have been reported. BSA-seq technology was employed to map four QTLs were located on chromosomes A03 and A06. Furthermore, a stable QTL qSUCA06 (112.37-112.66 Mb) located on chromosome A06 was finely mapped, accounting for 31.95%-41.05% of the phenotypic variance explained (PVE) (Guo et al., 2023b). Two other genomic regions associated with sucrose content, qSUCA08a and qSUCB06a on chromosomes A08 and B06 respectively, were identified by QTL-seq, a major QTL, qSUCA08.2, explained 5.43%-17.84% of phenotypic variation across five environments (Li et al., 2023). Based on whole genome re-sequencing and construction of a high density genetic map, two major stable QTLs for sucrose content, qSCA06.2 and qSCB06.2 were mapped on chromosomes A06 (115.0-116.1 Mb) and B06 (147.9-148.6 Mb) (Lei et al., 2022; Wang et al., 2024). Furthermore, Guo et al. (2023a) mapped 10 QTLs located on A01, A07, A10, B01, B03 and B10, accounting for 4.56%-12.25% of PVE, and qSUCA07 was detected in three environments (Guo et al., 2023a). A genome-wide association study (GWAS) with principal component analysis identified seven significant QTLs associated with total sugars and 22 significant QTLs associated with sucrose content (Zhang et al., 2023b).
In our study, a total of five sucrose-associated QTLs were detected in this study on four chromosomes (LGs A07, B06 and B09). Furthermore, a novel major stable QTL-qSCB09 was identified, which explained 21.51-33.58% of the phenotypic variation for sucrose across three environments. We identified a QTL on LG B06, the physical interval was 136.84-140.76 Mb, which is different with qSUCB06.1 (12.33-20.76 Mb), qSUCB06.2 (20.60-30.22 Mb), qSCB06.2 (147.9-148.6 Mb) (Li et al., 2023; Wang et al., 2024). qSUCA07 was found across three environments which explained 7.05%-12.25% of the phenotypic variation for sucrose (Guo et al., 2023a), which was different to qSCA07 in our study. Few studies have sought to identify soluble sugar-related QTL in peanut, except a QTL on B06 by BSA-seq which was only a 0.7 Mb (149.47-152.28 Mb) physical interval (Zhang et al., 2020), and is close with qSSCB06 in our study (137.15-141.26 Mb) (Table 4). The qSSCB06 in our study was stable detected in two environments, explaining 12.69%-15.32% PVE (Table 4). Interestingly, our results showed that qSCB09 and qSSCB09 were co-localized to a 4.02 cM interval (37.16-41.18 cM), indicating a potential simultaneous impact on the contents of sucrose and soluble sugar. Sucrose is the main component of soluble sugar in peanut (Li et al., 2023), thus the main point in breeding high sweetness peanut have been focused on increasing sucrose content. The qSSCB06 identified in our study suggested that it is possible to increase other soluble sugars (such as fructose and glucose) content in the future. Moreover, this study reveals that the sucrose content and soluble sugar content are controlled by three QTLs or genes. The highest sucrose content and soluble sugar content phenotype can only be achieved when the elite allelic genotype of the three genes is combined.
Several candidate genes related to sucrose content in peanut have been reported. Arahy. I1MI1E, a DEG in qSUCA08.2, encoding receptor-like protein kinase, was more likely candidate gene responsible for sucrose content. It may control sucrose content via regulating these genes related to sucrose metabolism and transport (Li et al., 2023). Arahy.Y2LWD9, which encodes acyl-CoA-binding domain 3 (ACBD), is a candidate gene in qSUCA06 for sucrose content accumulation (Guo et al., 2023b). Arahy.42CAD1 was identified as the most likely candidate gene in qSucA06, being co-expressed with genes involved in vesicle transport and oil body assembly. This indicates that sucrose accumulation may be due to disruptions in TAG transport or storage mechanisms (Huai et al., 2024).
Protein kinases were proven to play key roles in sugar accumulation (Lu et al., 2007; Lecourieux et al., 2010; Huang et al., 2014; Li et al., 2023). The candidate gene Arahy.11CPHY encoded serine/threonine-protein kinase PRP4, the expression of which increased in S2 and S3 stages and decreased in S4 and S5 stages (Figure 6), in accordance with the sucrose accumulation pattern (Li et al., 2021). Notably, Ah.W977IP and Ah.NG0Q3I which have higher expression in early developmental stages of peanut seed (Figure 6), also matched with sucrose accumulation pattern (Li et al., 2021). Ah.W977IP and Ah.NG0Q3I both encoded alpha-xylosidase 1 which is a Glycosyl Hydrolase 31 (GH31) family member and related to starch and sucrose metabolism (Cuebas-Irizarry et al., 2017; Xu et al., 2023). Thus, they may also be the candidate genes for sucrose content and soluble content in peanut kernels. In our study, Arahy.AY8I6Y was most likely the candidate gene for qSC/SSCB09. Arahy.AY8I6Y encodes a Zinc finger protein CONSTANS-LIKE 16 (COL16), which belongs to zinc finger protein transcription factor family. COL genes have been reported to be involved in many molecular regulation processes and plant growth development, including regulation of flowering time, photoperiodic responses and photomorphogenesis, stigma color and key roles in banana (Musa nana) fruit ripening (Hassidim et al., 2009; Chen et al., 2012; Ordoñez-Herrera et al., 2018; Zhang et al., 2023a). COL genes also involved in abiotic stress tolerance response, anthocyanin accumulation and plants carotenoid metabolism regulation (Bai et al., 2019; Zhang et al., 2023a). Besides, a zinc finger protein AdDof3 has been reported to interacted physically with the AdBAM3L promoter, regulating starch degradation in Kiwiruit (Zhang et al., 2018), indicating a potential role in sugar metabolism. Arahy.AY8I6Y was identified as the most likely candidate gene due to a nonsynonymous SNP causing amino acid substitution (Ser to Thr). The predicted structural change associated with missense variation may affect its molecular and biological functions, however, further study is needed to verify the function of Arahy.AY8I6Y and its role of regulating sugar accumulation.
Besides, the correlation analysis of sugar content with protein content and oil content were investigated, the result showed that sucrose content and soluble sugar content were all significantly negatively correlated with oil content, but were no correlation with protein content (Supplementary Table 9), which is consistent with the reports in soybean (Jiang et al., 2018; Huai et al., 2024). So, we can hypothesis that some genes associated with transformation between sugar and oil may also affect sugar content in peanut.
In summary, we identified a new major stable QTL region qSCB09/qSSCB09 for both sucrose content and soluble sugar content of peanut kernels based on whole genome resequencing and QTL mapping. Within this confidence interval, six non-synonymous mutation genes were identified as candidate genes, and Arahy.AY8I6Y was the most likely candidate gene for sucrose accumulation in peanut kernel. These findings will contribute to an enhanced understanding of sugar accumulation in peanut kernels, and the candidate genes will be useful for breeding of high sugar content peanut varieties.
The original contributions presented in the study are included in the article/Supplementary Material. Further inquiries can be directed to the corresponding author.
FW: Funding acquisition, Investigation, Software, Supervision, Writing – original draft, Writing – review & editing. HM: Formal analysis, Investigation, Writing – review & editing. SZ: Formal analysis, Investigation, Software, Writing – review & editing. XH: Project administration, Resources, Supervision, Writing – review & editing. CL: Data curation, Formal analysis, Writing – review & editing. YC: Conceptualization, Writing – review & editing. CC: Project administration, Writing – review & editing. WZ: Formal analysis, Writing – review & editing. TZ: Data curation, Methodology, Writing – review & editing. HW: Conceptualization, Writing – review & editing. LX: Investigation, Writing – review & editing. WY: Investigation, Validation, Writing – review & editing. JC: Writing – review & editing, Conceptualization, Funding acquisition, Project administration, Resources, Supervision.
The author(s) declare financial support was received for the research, authorship, and/or publication of this article. This research was supported by the National Natural Science Foundation of China (32201876), Natural Science Foundation of Shandong Province (ZR2022MC045), Breeding Project from Department Science & Technology of Shandong Province (2022LZGC007).
The authors declare that the research was conducted in the absence of any commercial or financial relationships that could be construed as a potential conflict of interest.
All claims expressed in this article are solely those of the authors and do not necessarily represent those of their affiliated organizations, or those of the publisher, the editors and the reviewers. Any product that may be evaluated in this article, or claim that may be made by its manufacturer, is not guaranteed or endorsed by the publisher.
The Supplementary Material for this article can be found online at: https://www.frontiersin.org/articles/10.3389/fpls.2024.1423586/full#supplementary-material
An, Y., Chen, L., Tao, L., Liu, S., Wei, C. (2021). QTL mapping for leaf area of tea plants (Camellia sinensis) based on a high-quality genetic map constructed by whole genome resequencing. Front. Plant Sci. 12, 705285. doi: 10.3389/fpls.2021.705285
Ayalew, H., Peiris, S., Chiluwal, A., Kumar, R., Tiwari, M., Ostmeyer, T., et al. (2022). Stable sorghum grain quality QTL were identified using SC35 x RTx430 mapping population. Plant Genome 15, e20227. doi: 10.1002/tpg2.20227
Bai, S., Tao, R., Tang, Y., Yin, L., Ma, Y., Ni, J., et al. (2019). BBX16, a B-box protein, positively regulates light-induced anthocyanin accumulation by activating MYB10 in red pear. Plant Biotechnol J. 17, 1985–1997. doi: 10.1111/pbi.13114
Bertioli, D. J., Jenkins, J., Clevenger, J., Dudchenko, O., Gao, D., Seijo, G., et al. (2019). The genome sequence of segmental allotetraploid peanut Arachis hypogaea. Nat. Genet. 51, 877–884. doi: 10.1038/s41588-019-0405-z
Broman, K. W., Wu, H., Sen, Ś., Churchill, G. A. (2003). R/qtl: QTL mapping in experimental crosses. bioinformatics 19, 889–890. doi: 10.1093/bioinformatics/btg112
Chen, J., Chen, J.-y., Wang, J.-n., Kuang, J.-f., Shan, W., Lu, W-j. (2012). Molecular characterization and expression profiles of MaCOL1, a CONSTANS-like gene in banana fruit. Gene. 496, 110–117. doi: 10.1016/j.gene.2012.01.008
Chen, L. Q., Lin, I. W., Qu, X. Q., Sosso, D., McFarlane, H. E., Londono, A., et al. (2015). A cascade of sequentially expressed sucrose transporters in the seed coat and endosperm provides nutrition for the Arabidopsis embryo. Plant Cell 27, 607–619. doi: 10.1105/tpc.114.134585
Chen, Q., Tang, Y.-M., Wang, Y., Sun, B., Chen, T., Lei, D.-Y., et al. (2020). Enhance sucrose accumulation in strawberry fruits by eliminating the translational repression of FabZIPs1.1. Scientia Hortic. 259. doi: 10.1016/j.scienta.2019.108850
Clevenger, J., Chu, Y., Scheffler, B., Ozias-Akins, P. (2016). A developmental transcriptome map for allotetraploid arachis hypogaea. Front. Plant Sci. 7, 1446. doi: 10.3389/fpls.2016.01446
Cuebas-Irizarry, M. F., Irizarry-Caro, R. A., López-Morales, C., Badillo-Rivera, K. M., Rodríguez-Minguela, C. M., Montalvo-Rodríguez, R. (2017). Cloning and molecular characterization of an alpha-glucosidase (MalH) from the halophilic archaeon Haloquadratum walsbyi. Life 7, 46. doi: 10.3390/life7040046
Dierking, E. C., Bilyeu, K. D. (2008). Association of a soybean raffinose synthase gene with low raffinose and stachyose seed phenotype. Plant Genome 1. doi: 10.3835/plantgenome2008.06.0321
Gonda, I., Ashrafi, H., Lyon, D. A., Strickler, S. R., Hulse-Kemp, A. M., Ma, Q., et al. (2019). Sequencing-based bin map construction of a tomato mapping population, facilitating high-resolution quantitative trait loci detection. Plant Genome 12. doi: 10.3835/plantgenome2018.02.0010
Guo, J., Cheng, L., Li, W., Liu, N., Luo, H., Ding, Y., et al. (2023a). Correlation analysis of sucrose content with protein and oil content and QTL mapping of sucrose content in peanut. Crop Sci. 49. doi: 10.3724/SP.J.1006.2023.24251
Guo, J., Qi, F., Qin, L., Zhang, M., Sun, Z., Li, H., et al. (2023b). Mapping of a QTL associated with sucrose content in peanut kernels using BSA-seq. Front. Genet. 105115. doi: 10.3389/fgene.2022.1089389
Hassidim, M., Harir, Y., Yakir, E., Kron, I., Green, R. M. J. P. (2009). Over-expression of CONSTANS-LIKE 5 can induce flowering in short-day grown Arabidopsis. Planta. 230, 481–491. doi: 10.1007/s00425-009-0958-7
Huai, D., Zhi, C., Wu, J., Xue, X., Hu, M., Zhang, J., et al. (2024). Unveiling the molecular regulatory mechanisms underlying sucrose accumulation and oil reduction in peanut kernels through genetic mapping and transcriptome analysis. Plant Physiol. Biochem. 208, 108448. doi: 10.1016/j.plaphy.2024.108448
Huang, Y., Li, C. Y., Qi, Y., Park, S., Gibson, S. (2014). SIS 8, a putative mitogen-activated protein kinase kinase kinase, regulates sugar-resistant seedling development in Arabidopsis. Plant J. 77, 577–588. doi: 10.1111/tpj.12404
Jiang, G.-L., Chen, P., Zhang, J., Florez-Palacios, L., Zeng, A., Wang, X., et al. (2018). Genetic analysis of sugar composition and its relationship with protein, oil, and fiber in soybean. Crop Sci. 58, 2413–2421. doi: 10.2135/cropsci2018.03.0173
John Farrar, C. P. B., Gallagher, J. (2000). Sucrose and the integration of metabolism in vascular plants. Plant Sci. 154, 1–11. doi: 10.1016/S0168-9452(99)00260-5
Knizia, D., Bellaloui, N., Yuan, J., Lakhssasi, N., Anil, E., Vuong, T., et al. (2023). Quantitative trait loci and candidate genes that control seed sugars contents in the soybean ‘Forrest’ by ‘Williams 82’ Recombinant inbred line population. Plants (Basel) 12. doi: 10.3390/plants12193498
Kumar, R., Janila, P., Vishwakarma, M. K., Khan, A. W., Manohar, S. S., Gangurde, S. S., et al. (2020). Whole-genome resequencing-based QTL-seq identified candidate genes and molecular markers for fresh seed dormancy in groundnut. Plant Biotechnol. J. 18, 992–1003. doi: 10.1111/pbi.13266
Kumar, V., Rani, A., Goyal, L., Dixit, A. K., Manjaya, J. G., Dev, J., et al. (2010). Sucrose and raffinose family oligosaccharides (RFOs) in soybean seeds as influenced by genotype and growing location. J. Agric. Food Chem. 58, 5081–5085. doi: 10.1021/jf903141s
Lecourieux, F., Lecourieux, D., Vignault, C., Delrot, S. (2010). A sugar-inducible protein kinase, VvSK1, regulates hexose transport and sugar accumulation in grapevine cells. Plant Physio 152, 1096–1106. doi: 10.1104/pp.109.149138
Lei, Y., Liao, B., Wang, Z., Yan, L., Chen, Y., Huai, D., et al. (2022). China Patent No. CN114438247B.
Li, L., Yang, X., Cui, S., Meng, X., Mu, G., Hou, M., et al. (2019). Construction of high-density genetic map and mapping quantitative trait loci for growth habit-related traits of peanut (Arachis hypogaea L.). Front. Plant Sci. 10, 745. doi: 10.3389/fpls.2019.00745
Li, W., Huang, L., Liu, N., Chen, Y., Guo, J., Yu, B., et al. (2023). Identification of a stable major sucrose-related QTL and diagnostic marker for flavor improvement in peanut. Theor. Appl. Genet. 136, 78. doi: 10.1007/s00122-023-04306-0
Li, W., Huang, L., Liu, N., Pandey, M. K., Chen, Y., Cheng, L., et al. (2021). Key regulators of sucrose metabolism identified through comprehensive comparative transcriptome analysis in peanuts. Int. J. Mol. Sci. 22. doi: 10.3390/ijms22147266
Li, X., Guo, W., Li, J., Yue, P., Bu, H., Jiang, J., et al. (2020). Histone acetylation at the promoter for the transcription factor PuWRKY31 affects sucrose accumulation in pear fruit. Plant Physiol. 18, 2035–2046. doi: 10.1104/pp.20.00002
Liu, N., Guo, J., Zhou, X., Wu, B., Huang, L., Luo, H., et al. (2020). High-resolution mapping of a major and consensus quantitative trait locus for oil content to a~ 0.8-Mb region on chromosome A08 in peanut (Arachis hypogaea L.). Theor. Appl. Genet. 133, 37–49. doi: 10.1007/s00122-019-03438-6
Lu, C.-A., Lin, C.-C., Lee, K.-W., Chen, J.-L., Huang, L.-F., Ho, S.-L., et al. (2007). The SnRK1A protein kinase plays a key role in sugar signaling during germination and seedling growth of rice. Plant Cell 19, 2484–2499. doi: 10.1105/tpc.105.037887
Mackay, I. J., Cockram, J., Howell, P., Powell, W. (2021). Understanding the classics: the unifying concepts of transgressive segregation, inbreeding depression and heterosis and their central relevance for crop breeding. Plant Biotechnol. J. 19, 26–34. doi: 10.1111/pbi.13481
Maughan, P. J., Saghai Maroof, M. A., Buss, G. R. (2000). Identification of quantitative trait loci controlling sucrose content in soybean (Glycine max). Mol. Breed. 6, 105–111. doi: 10.1023/A:1009628614988
McDaniel, K. A., White, B. L., Dean, L. L., Sanders, T. H., Davis, J. P. (2012). Compositional and mechanical properties of peanuts roasted to equivalent colors using different time/temperature combinations. J. Food Sci. 77, C1293–C1299. doi: 10.1111/j.1750-3841.2012.02979.x
Meng, L., Li, H., Zhang, L., Wang, J. (2015). QTL IciMapping: Integrated software for genetic linkage map construction and quantitative trait locus mapping in biparental populations. Crop J. 3, 269–283. doi: 10.1016/j.cj.2015.01.001
Ordoñez-Herrera, N., Trimborn, L., Menje, M., Henschel, M., Robers, L., Kaufholdt, D., et al. (2018). The transcription factor COL12 is a substrate of the COP1/SPA E3 ligase and regulates flowering time and plant architecture. Plant Physiol. 176, 1327–1340. doi: 10.1104/pp.17.01207
Pattee, H. E., Isleib, T. G., Giesbrecht, F. G. (1998). Variation in intensity of sweet and bitter sensory attributes across peanut genotypes. Peanut Sci. 25, 63–69. doi: 10.3146/i0095-3679-25-2-2
Pattee, H. E., Isleib, T. G., Giesbrecht, F. G., McFeeters, R. F. (2000). Investigations into genotypic variations of peanut carbohydrates. J. Agric. Food Chem. 48, 763–756. doi: 10.1021/jf9910739
Qin, L., Liu, H., Zhang, X.-y., Du, P., Dai, X.-d., Sun, Z.-q., et al. (2021). Genetic analysis of sugar content in peanut kernel via mixed major gene plus polygene inheritance model in multi-generation combined population. Chin. J. Oil Crop Sci. 43, 590. doi: 10.19802/j.issn.1007-9084.2020185
Ren, H., Han, J., Wang, X., Zhang, B., Yu, L., Gao, H., et al. (2020). QTL mapping of drought tolerance traits in soybean with SLAF sequencing. Crop J. 8, 977–989. doi: 10.1016/j.cj.2020.04.004
Sun, Z., Qi, F., Liu, H., Qin, L., Xu, J., Shi, L., et al. (2022). QTL mapping of quality traits in peanut using whole-genome resequencing. Crop J. 10, 177–184. doi: 10.1016/j.cj.2021.04.008
Tang, Y., Wang, X., Liu, T., Wu, Q., Sun, Q., Wang, Z., et al. (2018). A near infrared spectroscopy model for predicting sucrose content of sun-dried peanut seeds. Shandong Agric. Sci. 50, 159–162. doi: 10.14083/j.issn.1001-4942.2018.06.029
Toomer, O. T. (2018). Nutritional chemistry of the peanut (Arachis hypogaea). Crit. Rev. Food Sci. Nutr. 58, 3042–3053. doi: 10.1080/10408398.2017.1339015
Wang, L., Yang, X., Cui, S., Zhao, N., Li, L., Hou, M., et al. (2020). High-density genetic map development and QTL mapping for concentration degree of floret flowering date in cultivated peanut (Arachis hypogaea L.). Mol. Breed. 40, 1–14. doi: 10.1007/s11032-019-1083-3
Wang, S., Yokosho, K., Guo, R., Whelan, J., Ruan, Y. L., Ma, J. F., et al. (2019). The soybean sugar transporter GmSWEET15 mediates sucrose export from endosperm to early embryo. Plant Physiol. 180, 2133–2141. doi: 10.1104/pp.19.00641
Wang, Z., Zhang, Y., Huai, D., Chen, Y., Wang, X., Kang, Y., et al. (2024). Detection of two homologous major QTLs and development of diagnostic molecular markers for sucrose content in peanut. Theor. Appl. Genet. 137. doi: 10.1007/s00122-024-04549-5
Wei, L., Mao, W., Jia, M., Xing, S., Ali, U., Zhao, Y., et al. (2018). FaMYB44.2, a transcriptional repressor, negatively regulates sucrose accumulation in strawberry receptacles through interplay with FaMYB10. J. Exp. Bot. 69, 4805–4820. doi: 10.1093/jxb/ery249
Wu, Y., Wang, Y., Fan, X., Zhang, Y., Jiang, J., Sun, L., et al. (2023). QTL mapping for berry shape based on a high-density genetic map constructed by whole-genome resequencing in grape. Hortic. Plant J. 9, 729–742. doi: 10.1016/j.hpj.2022.11.005
Xu, H., Wang, Y., Chen, Z., Huang, R., Yang, N., Pan, M., et al. (2023). Integrated multi-omics approach to reveal the molecular networks underlying the seed germination of Polygonatum cyrtonema. doi: 10.21203/rs.3.rs-3447626/v1
Yang, Y., Su, Q., Li, Y., Cheng, Z., Song, Y., Jin, X., et al. (2023). Fine mapping of a major QTL qHYF_B06 for peanut yield. Crop J. 11, 1533–1540. doi: 10.1016/j.cj.2023.04.004
Yu, W., Peng, F., Wang, W., Liang, J., Xiao, Y., Yuan, X. (2021). SnRK1 phosphorylation of SDH positively regulates sorbitol metabolism and promotes sugar accumulation in peach fruit. Tree Physiol. 41, 1077–1086. doi: 10.1093/treephys/tpaa163
Zhang, A.-d., Wang, W.-q., Tong, Y., Li, M.-j., Grierson, D., Ferguson, I., et al. (2018). Transcriptome analysis identifies a zinc finger protein regulating starch degradation in kiwifruit. Plant Physiol. 178, 850–863. doi: 10.1104/pp.18.00427
Zhang, B., Feng, M., Zhang, J., Song, Z. (2023a). Involvement of CONSTANS-like proteins in plant flowering and abiotic stress response. Int J Mol Sci. 24, 16585. doi: 10.3390/ijms242316585
Zhang, H., Dean, L., Wang, M. L., Dang, P., Lamb, M., Chen, C. (2023b). GWAS with principal component analysis identify QTLs associated with main peanut flavor-related traits. Front. Plant Sci. 14. doi: 10.3389/fpls.2023.1204415
Zhang, S. Z., Hu, X. H., Wang, F. F., Ye, C., Yang, W. Q., Xu, S., et al. (2023c). A stable and major QTL region on chromosome 2 conditions pod shape in cultivated peanut (Arachis hyopgaea L.). J. Integr. Agric. 22, 2323–2334. doi: 10.1016/j.jia.2023.02.005
Zhang, X., Zhao, R., Yu, X., Si, T., Zou, X., Wang, Y., et al. (2020). China Patent No. CN111334606B.
Zhao, Y., Ma, J., Li, M., Deng, L., Li, G., Xia, H., et al. (2020). Whole-genome resequencing-based QTL-seq identified AhTc1 gene encoding a R2R3-MYB transcription factor controlling peanut purple testa colour. Plant Biotechnol. J. 1, 96–105. doi: 10.1111/pbi.13175
Keywords: peanut, whole genome re-sequence, sucrose, soluble sugar, QTL
Citation: Wang F, Miao H, Zhang S, Hu X, Li C, Chu Y, Chen C, Zhong W, Zhang T, Wang H, Xu L, Yang W and Chen J (2024) Identification of a major QTL underlying sugar content in peanut kernels based on the RIL mapping population. Front. Plant Sci. 15:1423586. doi: 10.3389/fpls.2024.1423586
Received: 26 April 2024; Accepted: 17 June 2024;
Published: 04 July 2024.
Edited by:
Jose Miguel Soriano, Universitat de Lleida, SpainReviewed by:
Dongxin Huai, Chinese Academy of Agricultural Sciences, ChinaCopyright © 2024 Wang, Miao, Zhang, Hu, Li, Chu, Chen, Zhong, Zhang, Wang, Xu, Yang and Chen. This is an open-access article distributed under the terms of the Creative Commons Attribution License (CC BY). The use, distribution or reproduction in other forums is permitted, provided the original author(s) and the copyright owner(s) are credited and that the original publication in this journal is cited, in accordance with accepted academic practice. No use, distribution or reproduction is permitted which does not comply with these terms.
*Correspondence: Jing Chen, bWlhbmJhb2h1YTIwMDhAMTI2LmNvbQ==
Disclaimer: All claims expressed in this article are solely those of the authors and do not necessarily represent those of their affiliated organizations, or those of the publisher, the editors and the reviewers. Any product that may be evaluated in this article or claim that may be made by its manufacturer is not guaranteed or endorsed by the publisher.
Research integrity at Frontiers
Learn more about the work of our research integrity team to safeguard the quality of each article we publish.