 Lei Huang1,2
 Zihao Huang1,2
 Weilong Zhou3Sumei Wu3
 Xuejian Li1,2
 Fangjie Mao1,2
 Meixuan Song1,2
 Yinyin Zhao1,2
 Lujin Lv1,2
 Jiacong Yu1,2
 Huaqiang Du1,2*
- 1State Key Laboratory of Subtropical Silviculture, Zhejiang A & F University, Hangzhou, China
- 2Key Laboratory of Carbon Cycling in Forest Ecosystems and Carbon Sequestration of Zhejiang Province, Zhejiang A & F University, Hangzhou, China
- 3Qianjiangyuan-Baishanzu National Park, Lishui, Zhejiang, China
Introduction: The aboveground carbon storage (AGC) in forests serves as a crucial metric for evaluating both the composition of the forest ecosystem and the quality of the forest. It also plays a significant role in assessing the quality of regional ecosystems. However, current technical limitations introduce a degree of uncertainty in estimating forest AGC at a regional scale. Despite these challenges, remote sensing technology provides an accurate means of monitoring forest AGC. Furthermore, the implementation of machine learning algorithms can enhance the precision of AGC estimates. Lishui City, with its rich forest resources and an approximate forest coverage rate of 80%, serves as a representative example of the typical subtropical forest distribution in Zhejiang Province.
Methods: Therefore, this study uses Landsat remote sensing images, employing backpropagation neural network (BPNN), random forest (RF), and categorical boosting (CatBoost) to model the forest AGC of Lishui City, selecting the best model to estimate and analyze its forest AGC spatiotemporal dynamics over the past 30 years (1989–2019).
Results: The study shows that: (1) The texture information calculated based on 9×9 and 11×11 windows is an important variable in constructing the remote sensing estimation model of the forest AGC in Lishui City; (2) All three machine learning techniques are capable of estimating forest AGC in Lishui City with high precision. Notably, the CatBoost algorithm outperforms the others in terms of accuracy, achieving a model training accuracy and testing accuracy R2 of 0.95 and 0.83, and RMSE of 2.98 Mg C ha-1 and 4.93 Mg C ha-1, respectively. (3) Spatially, the central and southwestern regions of Lishui City exhibit high levels of forest AGC, whereas the eastern and northeastern regions display comparatively lower levels. Over time, there has been a consistent increase in the total forest AGC in Lishui City over the past three decades, escalating from 1.36×10⁷ Mg C in 1989 to 6.16×10⁷ Mg C in 2019.
Discussion: This study provided a set of effective hyperparameters and model of machine learning suitable for subtropical forests and a reference data for improving carbon sequestration capacity of subtropical forests in Lishui City.
1 Introduction
The aboveground carbon storage (AGC) in forests is one of the important indicators for evaluating the structure of forest ecosystems and the quality of forests. It also serves as a significant measure for evaluating the quality of the regional ecological environment (Diao et al., 2022). Accurately quantifying forest carbon storage and monitoring its spatial distribution is beneficial for a more concrete understanding of the terrestrial carbon cycle process and understanding the carbon sink patterns in different regions. It also allows for a more accurate assessment of the potential of forest carbon sinks. This has significant implications for the formulation of carbon sequestration and emission reduction policies (Liu and Wu, 2017; Su et al., 2016).
Currently, the estimation of forest AGC mainly falls into three methods: field survey, model simulation, and remote sensing estimation (Gomez and Gumersindo, 2017; Mngadi et al., 2021). The traditional field survey method is the most intuitive and accurate, but it is difficult to reflect the situation of the entire forest area. This approach necessitates substantial human and material resources and is inherently damaging. Model simulation methods such as Biome-BioGeochemical Cycles (BIOME-BGC) require a variety of vegetation parameters to estimate the forest AGC. A lack of sufficient input data or the presence of missing data can notably influence the accuracy of the prediction outcomes (Liu et al., 2019). With the gradual development of forest AGC estimation research technology and the continuous optimization of research methods, remote sensing estimation methods have gradually replaced field survey methods as the main research methods for estimating forest AGC (Stovall et al., 2017). This method infers and estimates the carbon storage on the Earth’s surface by acquiring remote sensing data of the Earth’s surface and combining it with ground monitoring data and model algorithms (Li et al., 2022). Since its launch, the Landsat series of satellites has demonstrated advantages such as a good performance-price ratio, rich spectral information, and a quick image update cycle. As a result, Landsat has become the most widely used remote sensing data source in many applications, including estimation of AGC, land use/cover surveys, agricultural yield estimation, regional planning, and forest fire monitoring (Wang and Gao, 2019; Li H, et al., 2023; Lu, 2006; Xu et al., 2011; Du et al., 2008; Li et al., 2018).
However, remote sensing data cannot directly reveal the forest AGC and its changes. It is necessary to establish a complete mathematical model between the information received by the satellite and the ground-measured AGC to realize the spatiotemporal estimation of forest AGC (Du et al., 2012; Zhang et al., 2019). Among the many AGC estimation models, machine learning algorithms such as backpropagation neural network (BPNN), support vector regression (SVR), random forest (RF), and ensemble learning (EL) are widely used for forest AGC estimation. For example, Wu (Wu et al., 2016) compared stepwise linear regression, k-nearest neighbors (KNN), SVR, RF, and stochastic gradient boosting (SGB) methods, and used Landsat imagery to estimate the forest biomass in the northwest region of Zhejiang, China. The results found that the RF method performed the best. Xu (Xu et al., 2018) utilized QuickBird imagery to gather data from the Houbaisha forest region in Fujian Province and established a BP artificial neural network to estimate forest biomass. Zhang (Zhang et al., 2020) conducted an assessment of eight machine learning methodologies, which included multivariate adaptive regression splines (MARS), SVR, RF, categorical boosting (CatBoost), multilayer perceptron (MLP), etc., by estimating forest biomass for performance comparison. The results indicated that the CatBoost algorithm outperformed the other algorithms in terms of performance.
Numerous researches have demonstrated that BPNN is a commonly utilized conventional machine learning methodology (Xu et al., 2018). RF stands out as one of the superior algorithms when it comes to incorporating learning Bagging strategies (Ma et al., 2023). And CatBoost is a high-performance algorithm in the ensemble learning Boosting strategy (Zhai et al., 2023). However, for a certain research area, there will be significant differences between different machine learning algorithms. Therefore, it is necessary to select three types of machine learning algorithms, attempt to construct various machine learning models for the same research area, and carry out forest AGC estimation. Simultaneously, setting appropriate hyperparameters can enable a model to achieve better generalization capability and optimal performance. However, there is currently a lack of uniform and effective hyperparameters that are particularly suitable for estimating the forest AGC of different regions and scales (Dong et al., 2020a). Consequently, for the regional scale, obtaining the best machine learning algorithm and its best effective hyperparameters will improve the accuracy of forest carbon storage estimation.
Lishui City is the ‘ecological green heart’ of Zhejiang Province. The city boasts a wealth of forest resources, with approximately 80% of its area covered by forests. It has built the Baishanzu National Forest Park which is an important distribution area of subtropical typical forests in Zhejiang Province. Therefore, accurately estimating the forest AGC in Lishui City and analyzing its spatiotemporal dynamics is of great significance for evaluating the contribution of forests in Lishui City to the regional ecosystem carbon and serving the national carbon neutrality strategy. Currently, there is an urgent need for a set of machine learning models and corresponding optimized hyperparameters for the AGC estimation of subtropical forest in Lishui City. Based on this requirement, this study aims to obtain a set of machine learning hyperparameters suitable for subtropical forests in Lishui City and invert the spatiotemporal distribution of the forest AGC in Lishui City. The specific objectives include: (1) selecting appropriate remote sensing variables using the Boruta algorithm, (2) tuning hyperparameters and compaing three kinds of machine learning: BPNN, RF and Catboost, (3) selecting the best hyperparameters and machine learning model to invert the forest AGC distributions, (4) analyzing the spatiotemporal dynamics of the forest AGC in Lishui City. This study offers methodological insights for accurately monitoring subtropical forest carbon storage. Additionally, the results will furnish invaluable data support for comprehending the spatiotemporal distribution of forest AGC in Lishui City and augmenting the forest’s carbon sequestration capacity.
2 Materials and methods
2.1 Study area
Lishui City (Figures 1A, B) is situated in the southwestern part of Zhejiang Province, China, at the conjunction of Zhejiang and Fujian provinces (27°25′N~28°57′N, 118°41′E~120°26′E). The total area reaches 1.73×10⁶ ha (Diao et al., 2022; Xiong et al., 2021). The terrain of Lishui City is mainly characterized by hills and mountains. The climate in the region exhibits characteristics of a subtropical maritime monsoon. Lishui is the first ecological city in Zhejiang Province, known as the “ forest sea of southern Zhejiang “. The forest area of Lishui accounts for 21.98% of the total forest area in Zhejiang Province. Lishui has a forested area of 5.8×10⁵ ha, accounting for 80.13% of the city area, with a total volume of 103.82 million m3 of standing trees and a forest coverage rate of 81.70% (Xiong et al., 2020). Lishui City is abundant in forest resources, housing a diverse array of plant species. The predominant types of forests in the area are coniferous forests, broad-leaved forests, and bamboo forests. According to the Zhejiang Province Forest Land Protection and Utilisation Plan (2017–2020) and the National Forest Plan (2016–2050) (Huang et al., 2020; Li et al., 2018; Zhang et al., 2019), land-use types in Lishui City were classified into six categories, including urban land, water body, cultivated land, broad-leaved forest, needle-leaved forest and bamboo forest. In 2019, the area of coniferous forests accounted for 43.99%, broad-leaved forests accounted for 31.59%, and bamboo forests accounted for 8.90%.
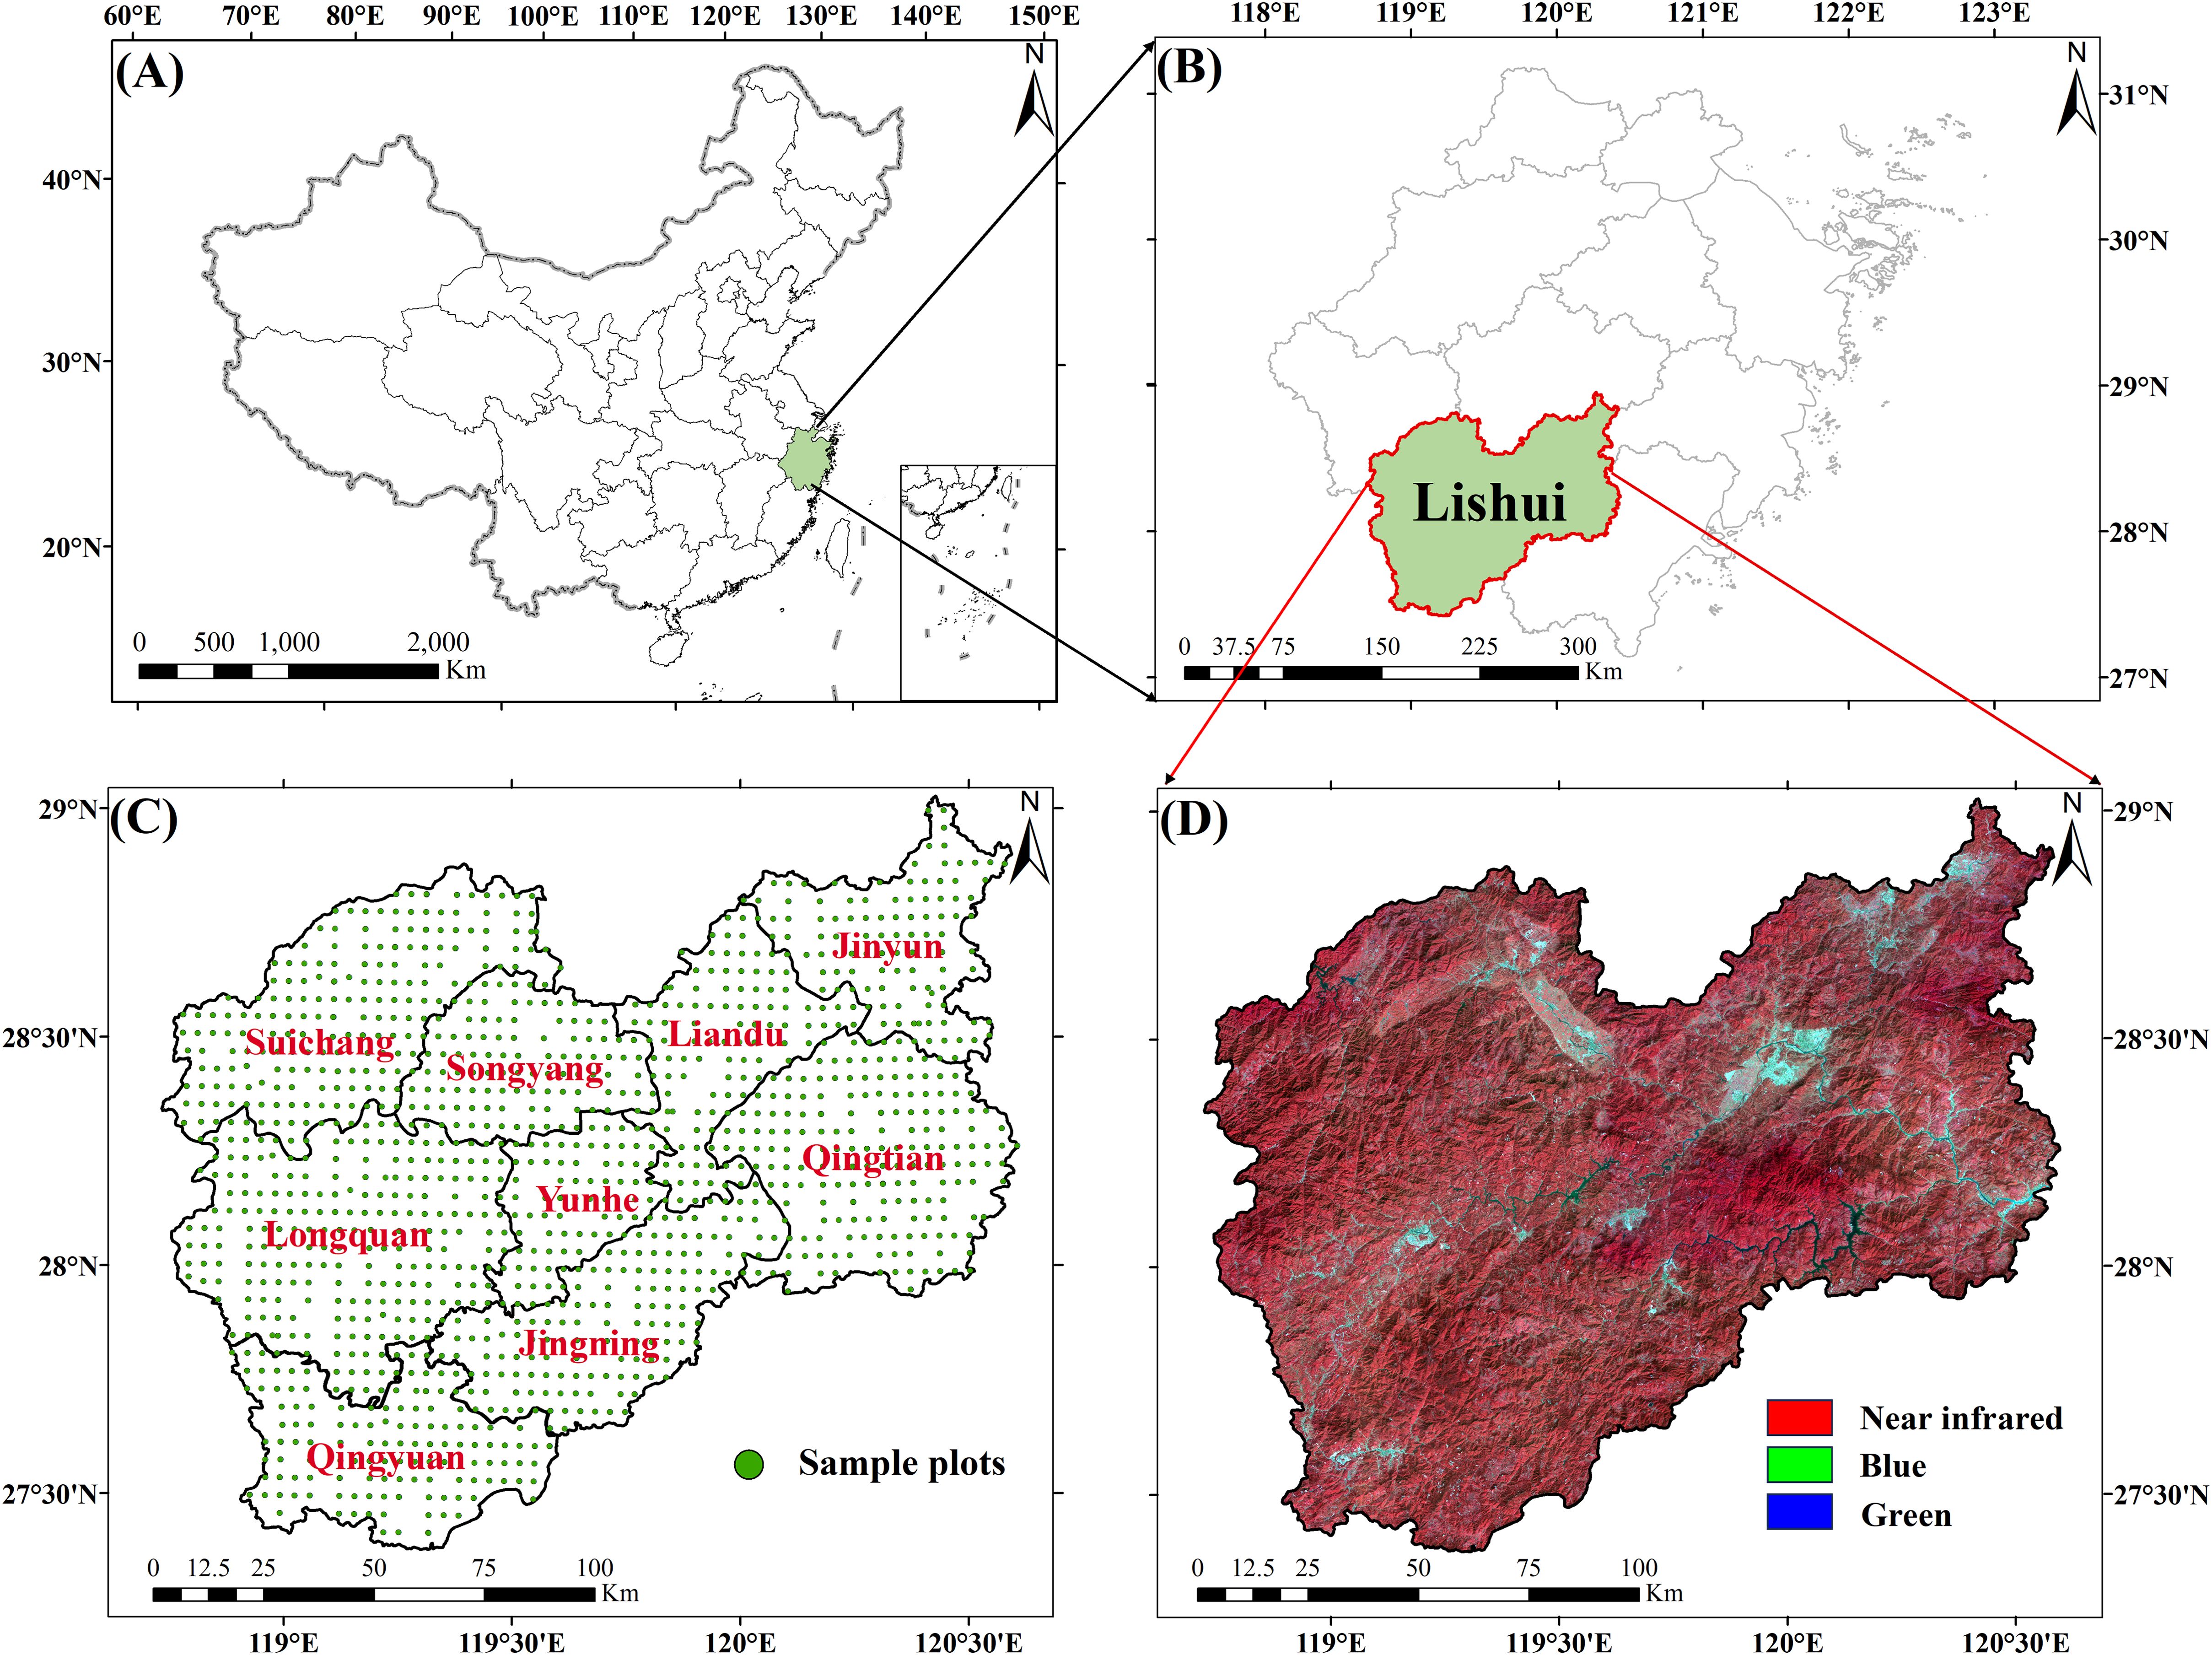
Figure 1. Study area: (A, B) Location of Lishui City; (C) Spatial distribution of sample plots for continuous forest inventory in Lishui City from 1989 to 2019; (D) Landsat remote sensing imagery of Lishui City in 2019.
2.2 Datasets and processing
2.2.1 Remote sensing data
This study uses Landsat5 TM data from 1989 to 2009 (every 5 years) and Landsat8 OLI data from 2014 and 2019 (Figure 1D) to quantitatively estimate the forest carbon storage in Lishui City. GEE possesses an extensive collection of remote sensing data and robust parallel processing abilities (Li and Xu, 2021). The use of GEE greatly saves data processing time and improves data processing accuracy. Therefore, this study extracts the required remote sensing images based on the GEE cloud platform. The GEE platform performs radiometric calibration and atmospheric correction on image data from various sensors to enhance consistency and minimize the impact of different sensors on inversion results (Gorelick et al., 2017; Xie et al., 2020). Additionally, GEE harmonizes the wavebands of these sensors by selecting similar bands for analysis, further reducing sensor-related discrepancies and improving overall data consistency (Wang et al., 2020). The criteria for image selection are cloud cover less than 10% and image acquisition time in summer (June to September). The main Landsat orbit numbers covering Lishui City are 119/040 and 119/041. To mitigate the pseudo-changes in spectral features caused by cloud cover, all clouds and cloud shadows in the images are eliminated using the CFMask algorithm. Clear observations from nearby months are used to fill in the gaps. After processing, a total of 192 Landsat TM and OLI images were collected. These images were then synthesized into 7 periods of 14 scenes of remote sensing images through annual median values and were stitched and cropped according to administrative regions. This resulted in 7 clear, cloud-free Landsat remote-sensing images of Lishui City. These remote sensing images are used for land use remote sensing classification in Lishui City, construction of AGC remote sensing estimation models, and more.
2.2.2 Processing observed data
This study uses the continuous forest resource survey data of Zhejiang Province from seven periods: 1989, 1994, 1999, 2004, 2009, 2014, and 2019 as the measured data. The continuous survey of forest resources in Zhejiang began in 1979, using a systematic sampling method to set up sample plots (Figure 1C). Plots are set up at the intersections of a grid with a north-south interval of 4 km and an east-west interval of 6 km. The plot area is 0.08 ha (28.28 m × 28.28 m). In the process of conducting a forest resource assessment, data such as the height of the trees, the diameter at chest level, and the breadth of the tree canopy are documented. By integrating the allometric growth formulas specific to various tree species, the AGC for each tree is computed. Subsequently, the AGC density for every plot is determined (Yang et al., 2022). This study uses the method of three times the standard deviation (Ribal and Young, 2020) to eliminate outliers. A total of 1616 plot data were finally obtained. The number of plots used to build the model each year and the statistics are shown in Table 1. The annual plot data is randomly segregated into training and testing subsets in a 7:3 ratio. The training subset is used to train the AGC prediction model, whereas the testing subset is employed to validate the accuracy of the model.
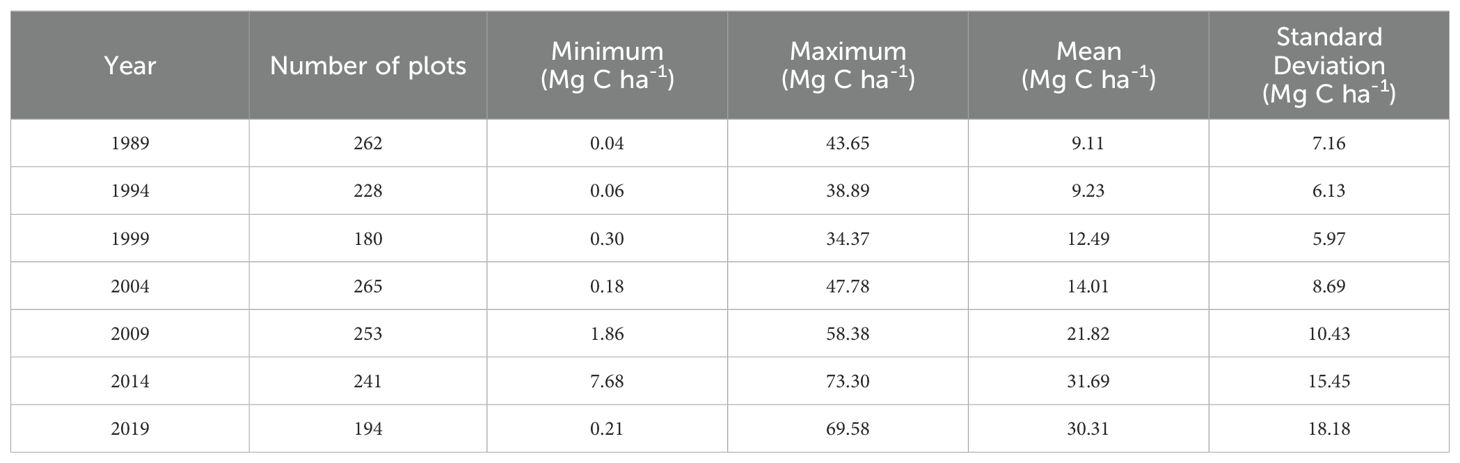
Table 1. Statistical information of forest in sample plots in Lishui City.
3 Research methodology
3.1 Remote sensing variable settings
The remote sensing parameters gathered in this research encompass distinctive variables like original bands, tassel cap transformation, vegetation index, and texture information, as shown in Table 2. The tasseled cap transformation is capable of effectively segregating spectral information associated with vegetation growth and senescence (Hadi et al., 2016; Mostafiz and Chang, 2018). Vegetation indices, which quantify vegetation cover and health status by integrating reflectance from distinct spectral bands, are indicative metrics (Macintyre et al., 2020). These indices demonstrate a strong correlation with vegetation biomass. Analyzing the GLCM can lead to a more precise identification of vegetation structure (Chrysafis et al., 2019), thus assisting in the estimation of forest AGC. These four types of features are key parameters in estimating forest AGC. The original bands are six spectral bands: blue (B, 0.45–0.52 μm), green (G, 0.52–0.60 μm), red (R, 0.63–0.69 μm), near-infrared (NIR, 0.77–0.90 μm), short-wave infrared 1 (SWIR1, 1.55–1.75 μm), and short-wave infrared 2 (SWIR2, 2.08–2.35 μm). The tasseled cap transformations include tasseled cap blue (TCB), tasseled cap green (TCG), tasseled cap wetness (TCW), and tasseled cap angle transformation (TCA). Vegetation indices include the commonly used difference vegetation index (DVI), normalized difference vegetation index (NDVI), enhanced vegetation index (EVI) ratio vegetation index (RVI), enhanced vegetation index (EVI), and ratio vegetation index (RVI), and 11 other indices. The texture information contains nine pieces of information such as variance, contrast, dissimilarity, correlation, etc., in which the texture features are extracted from five windows of size 3×3, 5×5, 7×7, 9×9 and 11×11. Based on the four original waveforms acquired under the five windows, we obtained 180 texture features. In summary, the feature variables acquired were 6 raw bands, 11 vegetation indices, 4 tassel cap transformations, and 180 texture features, totaling 201 remotely sensed variables.
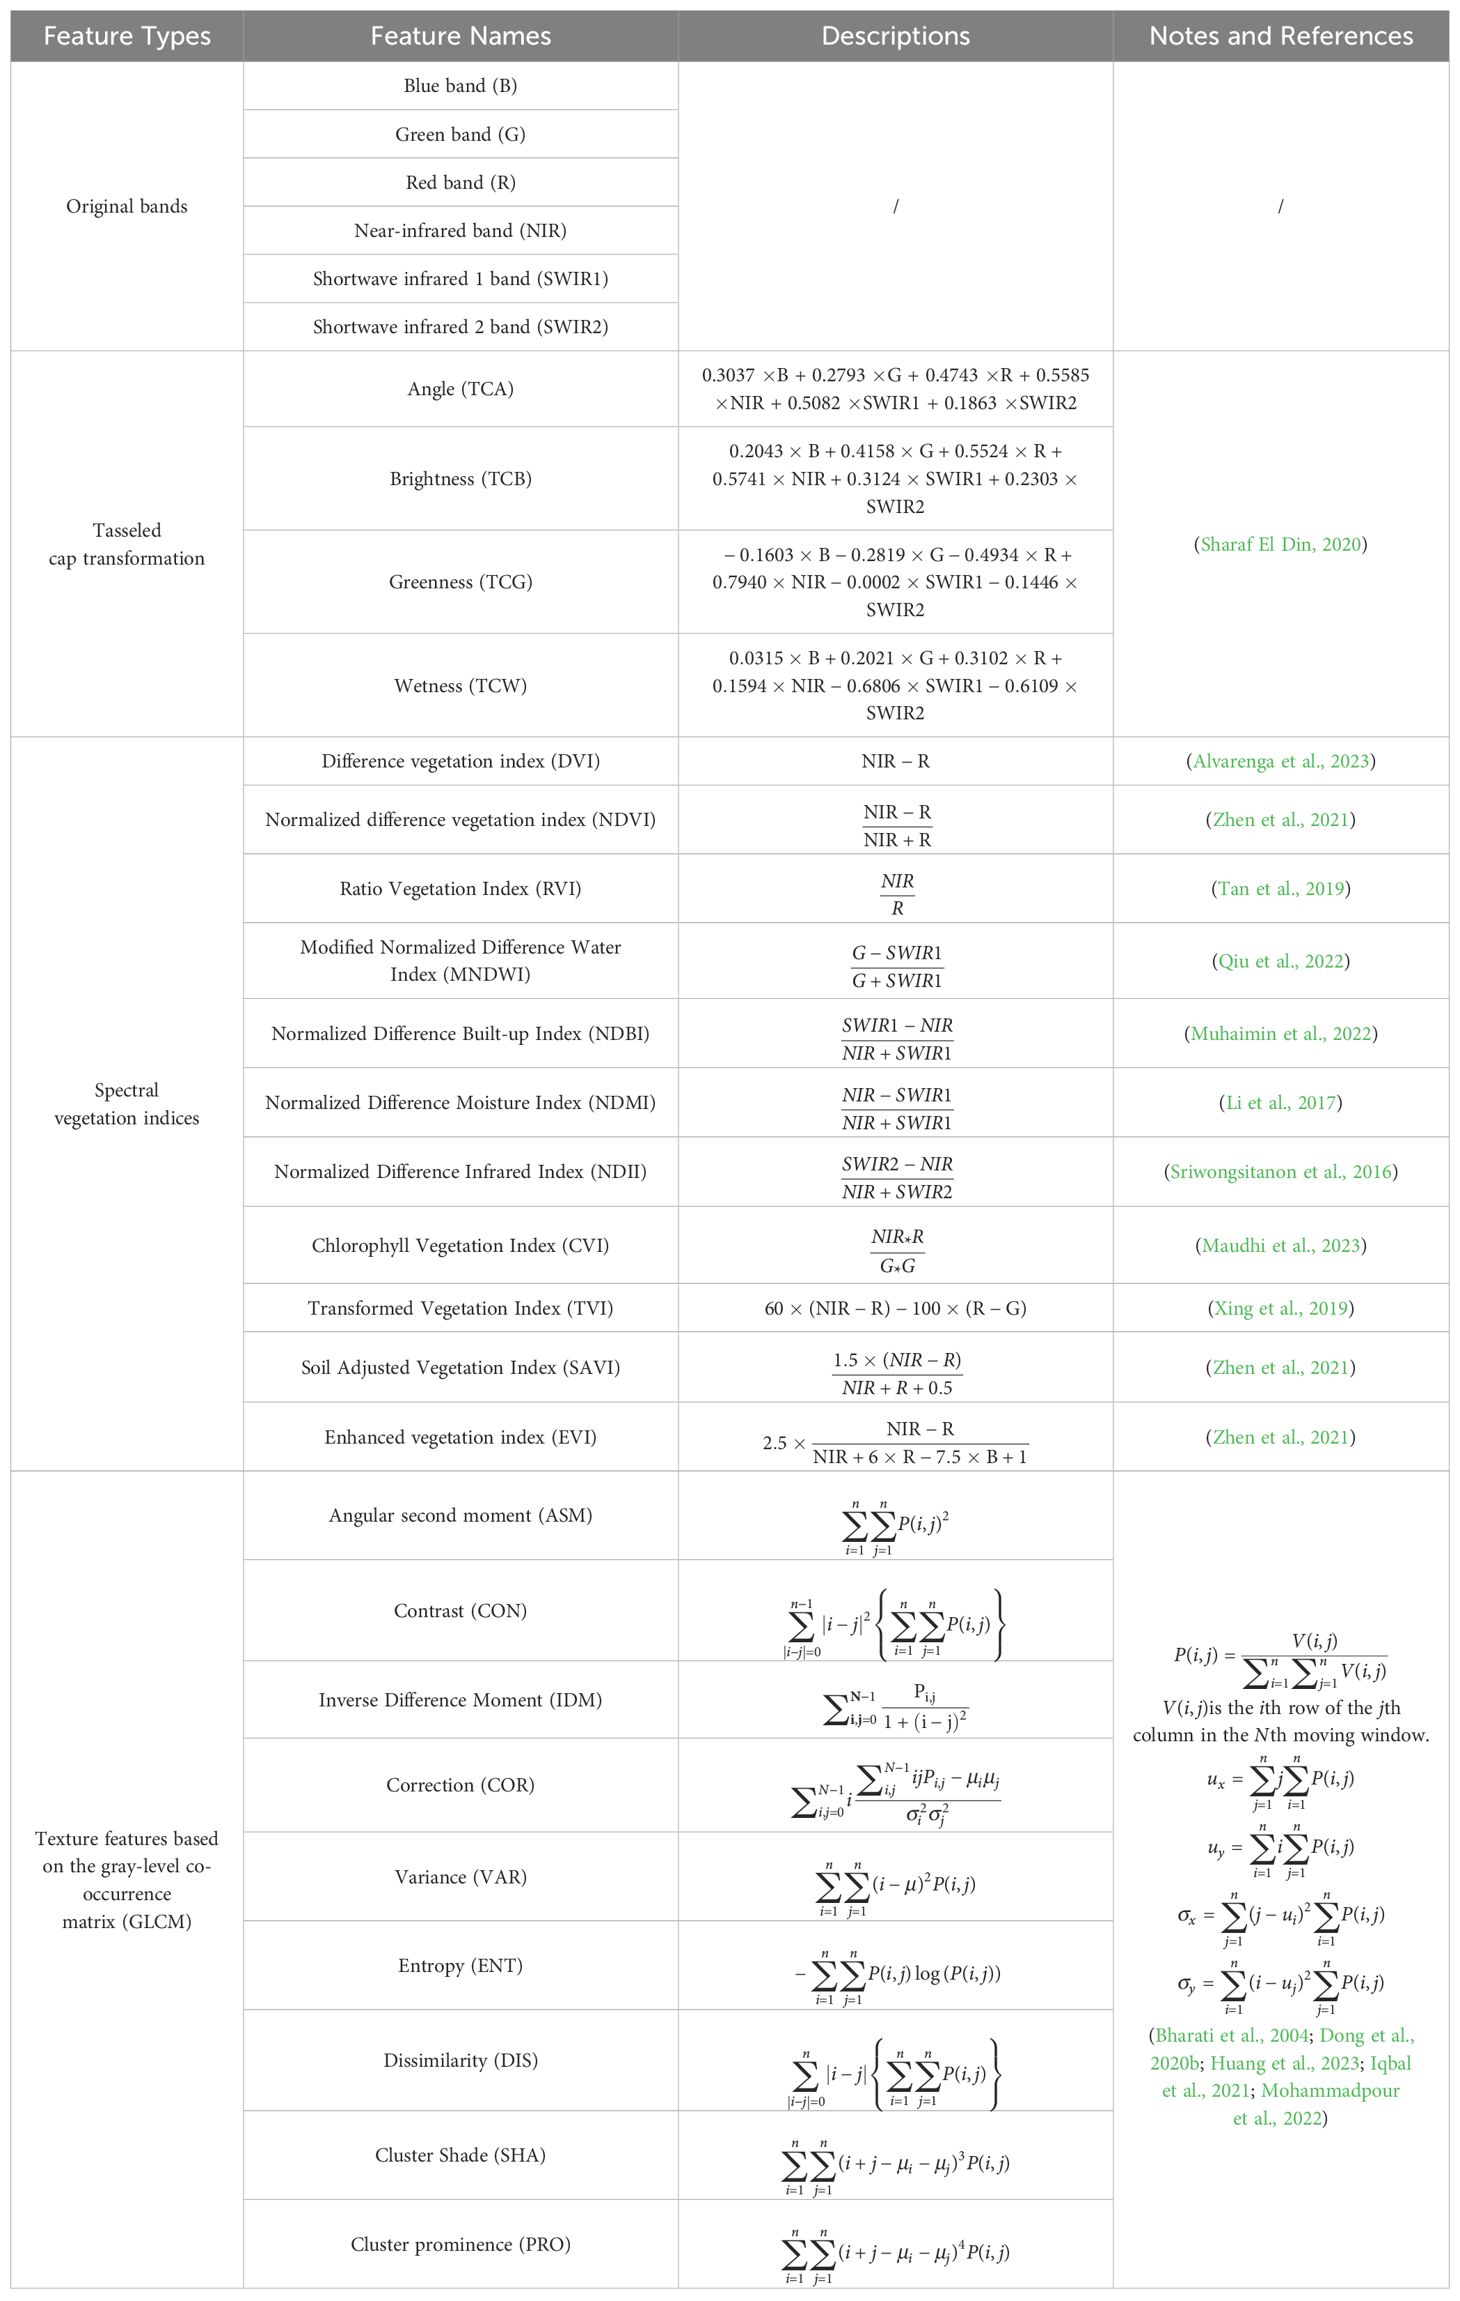
Table 2. Remote sensing variables used for estimating forest AGC density.
3.2 Feature variable selection
Feature selection refers to the procedure of choosing the most impactful attributes from a collection of attributes to diminish the dimensionality of the attribute space (Wan et al., 2020). The main purpose of feature selection is to remove redundant or prediction-irrelevant features (Jamei et al., 2023). The Boruta feature variable selection method obtains shadow features by reordering the original features (Liu et al., 2021), and ensures that the quantity of shadow attributes remains equivalent to the original attributes. The RF model is subsequently employed to train both the original and shadow attributes and to compute the significance score for each attribute. After multiple iterations, the Boruta algorithm compares the importance scores of the original features and shadow features to achieve importance evaluation (Habibi et al., 2023; Prasad et al., 2019). If the significance score of the original attribute surpasses that of the shadow attribute, the attribute is deemed significant. Conversely, if not, the attribute is deemed unimportant. All original features are marked as important or not important. The output is the dataset of all important features calculated. This dataset is the result of variable selection. This study uses the Boruta algorithm to reduce the dimensionality of 201 remote sensing variables for each year. The features marked as important by Boruta are selected as the variables for building different machine-learning algorithms each year.
3.3 AGC model construction scheme and method
Following the outcomes of variable selection, three machine learning methodologies, namely BPNN, RF and CatBoost, are employed to formulate the forest AGC prediction model and fine-tune the parameters. The precision of the three models is assessed and juxtaposed in light of the annual results. Ultimately, a model that exhibits superior performance and robust generalization capabilities is chosen. It is used as the final model for estimating and inverting the spatiotemporal distribution of the forest AGC in Lishui City.
3.3.1 BPNN algorithm
BPNN is a multi-layer feedforward neural network. It boasts benefits such as elevated precision, potent generalization capabilities, commendable adaptability, and minimal computational intricacy. It is highly applicable for estimating forest AGC. Its fundamental concept is gradient descent, which employs gradient search techniques to minimize the mean squared discrepancy between the network’s actual output value and the anticipated output value (Eshraghian et al., 2023). First, the network parameters are initialized, and the network model is constructed. Subsequently, the training sample collection is fed into the network. By calculating the loss function, the optimization of each node and weight of the neural network is carried out. If the mean squared discrepancy between the real output value and the anticipated output value is excessively large, the weights are adjusted sequentially from the output layer back to the input layer utilizing the backpropagation algorithm. By perpetually fine-tuning the connection weights among layers and the node thresholds, the network’s output is brought nearer to the projected output (Huang et al., 2019). This study uses the Python Keras library to build the BPNN model, with the main hyperparameters including alpha and max_iter.
3.3.2 RF algorithm
The RF algorithm is a non-parametric combinatorial algorithm based on classification and regression decision trees (Su et al., 2020). It can handle the complex non-linear relationship between forest AGC and remote sensing variables (Samadianfard et al., 2022). At the same time, it has a low sensitivity to noise present in the training samples, can effectively deal with the accuracy reduction problem caused by data missing, and can also identify the importance of prediction variables (Cai et al., 2020). This model builds a series of base learners through resampling, and finally outputs the prediction results of these base learners through voting, thus taking into account the ability to solve regression and classification problems (Elbeltagi et al., 2023; Li X, et al., 2023; Zhang C, et al., 2023). This study uses the Python Scikit-learn library to build the RF model to estimate AGC, with the main hyperparameters considered including n_estimators, max_depth, min_samples_split, min_samples_leaf.
3.3.3 CatBoost algorithm
CatBoost is a gradient-boosting algorithm library and is one of the mainstream models of gradient-boosting regression trees (GBRT) (Joo et al., 2023). The advantage of the CatBoost algorithm is that it overcomes gradient bias and effectively solves the problem of prediction offset, improves the accuracy of the algorithm, enhances generalization ability, and can prevent the occurrence of overfitting (Zhang Y, et al., 2023). It employs algorithm amalgamation with symmetric decision trees as foundational learners. It utilizes identical features for bifurcation at every layer during the operational process and computes the leaf node value by minimizing the sample loss on the leaf nodes (Zhong et al., 2023). This study uses the Python catboost to build the CatBoost model, with the key hyperparameters including depth, learning_rate, and l2_leaf_reg.
3.3.4 Parameter optimization of machine learning algorithms
The parameters of an algorithm can influence the effectiveness of the constructed model, so optimizing the parameters of each algorithm is crucial. For different models, this study optimized their key hyperparameters. The key hyperparameters and optimization configurations of each algorithm are shown in Table 3. The original data is partitioned into a training dataset (70%) and a testing dataset (30%). The GridSearchCV function, in conjunction with 5-fold cross-validation (Hajihosseinlou et al., 2023), is employed for the optimization of hyperparameters. The ideal combination of hyperparameters for the AGC modeling algorithm is ascertained based on the scoring criterion of the smallest value of the root mean square error (RMSE). The training dataset is utilized to educate the AGC model, while the testing dataset serves to validate its AGC prediction performance. To guarantee that the outcomes of various AGC modeling algorithms are not influenced by the partitioning of the training and testing datasets, the procedure of AGC model hyperparameter adjustment and model performance appraisal is reiterated 1000 times for training (Zhang et al., 2020).
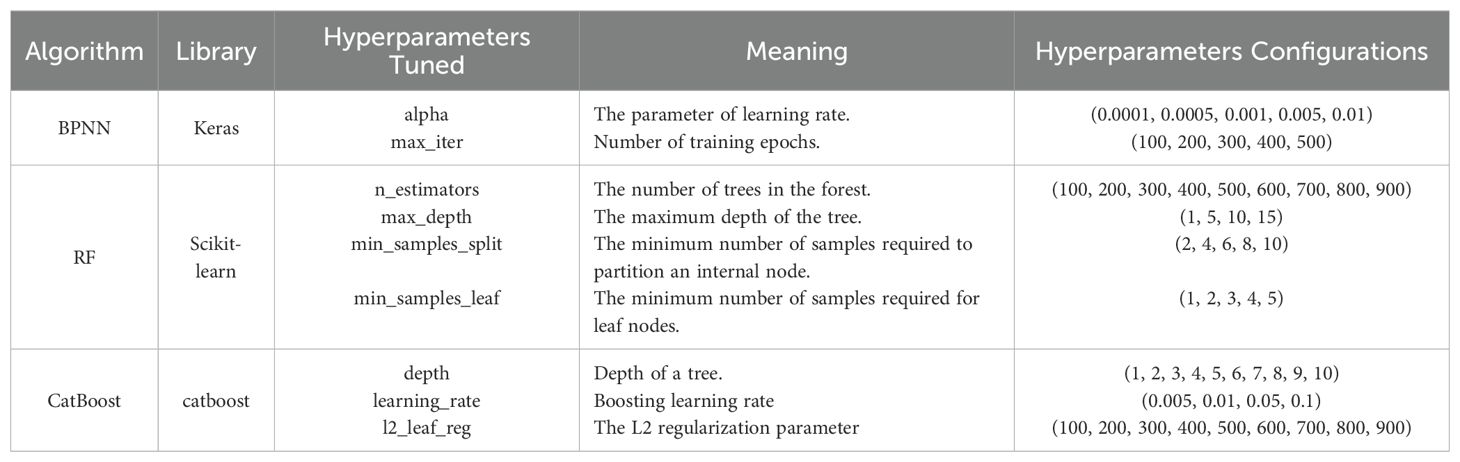
Table 3. Hyperparameters tuned and their configurations for each algorithm.
3.4 Model accuracy evaluation method
In this study, the accuracy of the model was evaluated using three metrics: coefficient of determination (R2) and RMSE (Aslami et al., 2019). Typically, elevated values of R2 coupled with diminished values of RMSE signify superior model performance.
In this context, , and represent the observed AGC, the average AGC, and the AGC predicted by the model, respectively, with n being the total number of samples. During the evaluation, an R2 value closer to 1 indicates a better fit of the model; a smaller RMSE value signifies a lesser degree of scatter between the actual value and the value predicted by the model (Li H, et al., 2023).
3.5 Technical route
The workflow diagram for estimating the spatial-temporal distribution of forest AGC by integrating land use classification and machine learning algorithms in this study is illustrated in Figure 2, primarily comprising three components: (1) Based on the Landsat images from 1989–2019, the RF classifier is used to obtain the land use classification map of Lishui City from 1989–2019. (2) Combining the Landsat image feature variables from 1989–2019 and the continuous forest resource survey data of Zhejiang Province, the Boruta algorithm is used for remote sensing variable selection. This results in variables that are highly related to forest AGC each year. (3) The filtered remote sensing parameters are fed into the BPNN, RF, and CatBoost machine learning algorithms for AGC estimation. The accuracy of the three models is compared, and the optimal model is selected for regional inversion. The corresponding land use classification map is used for masking each year. The final result is the spatio-temporal distribution map of forest AGC in Lishui City.
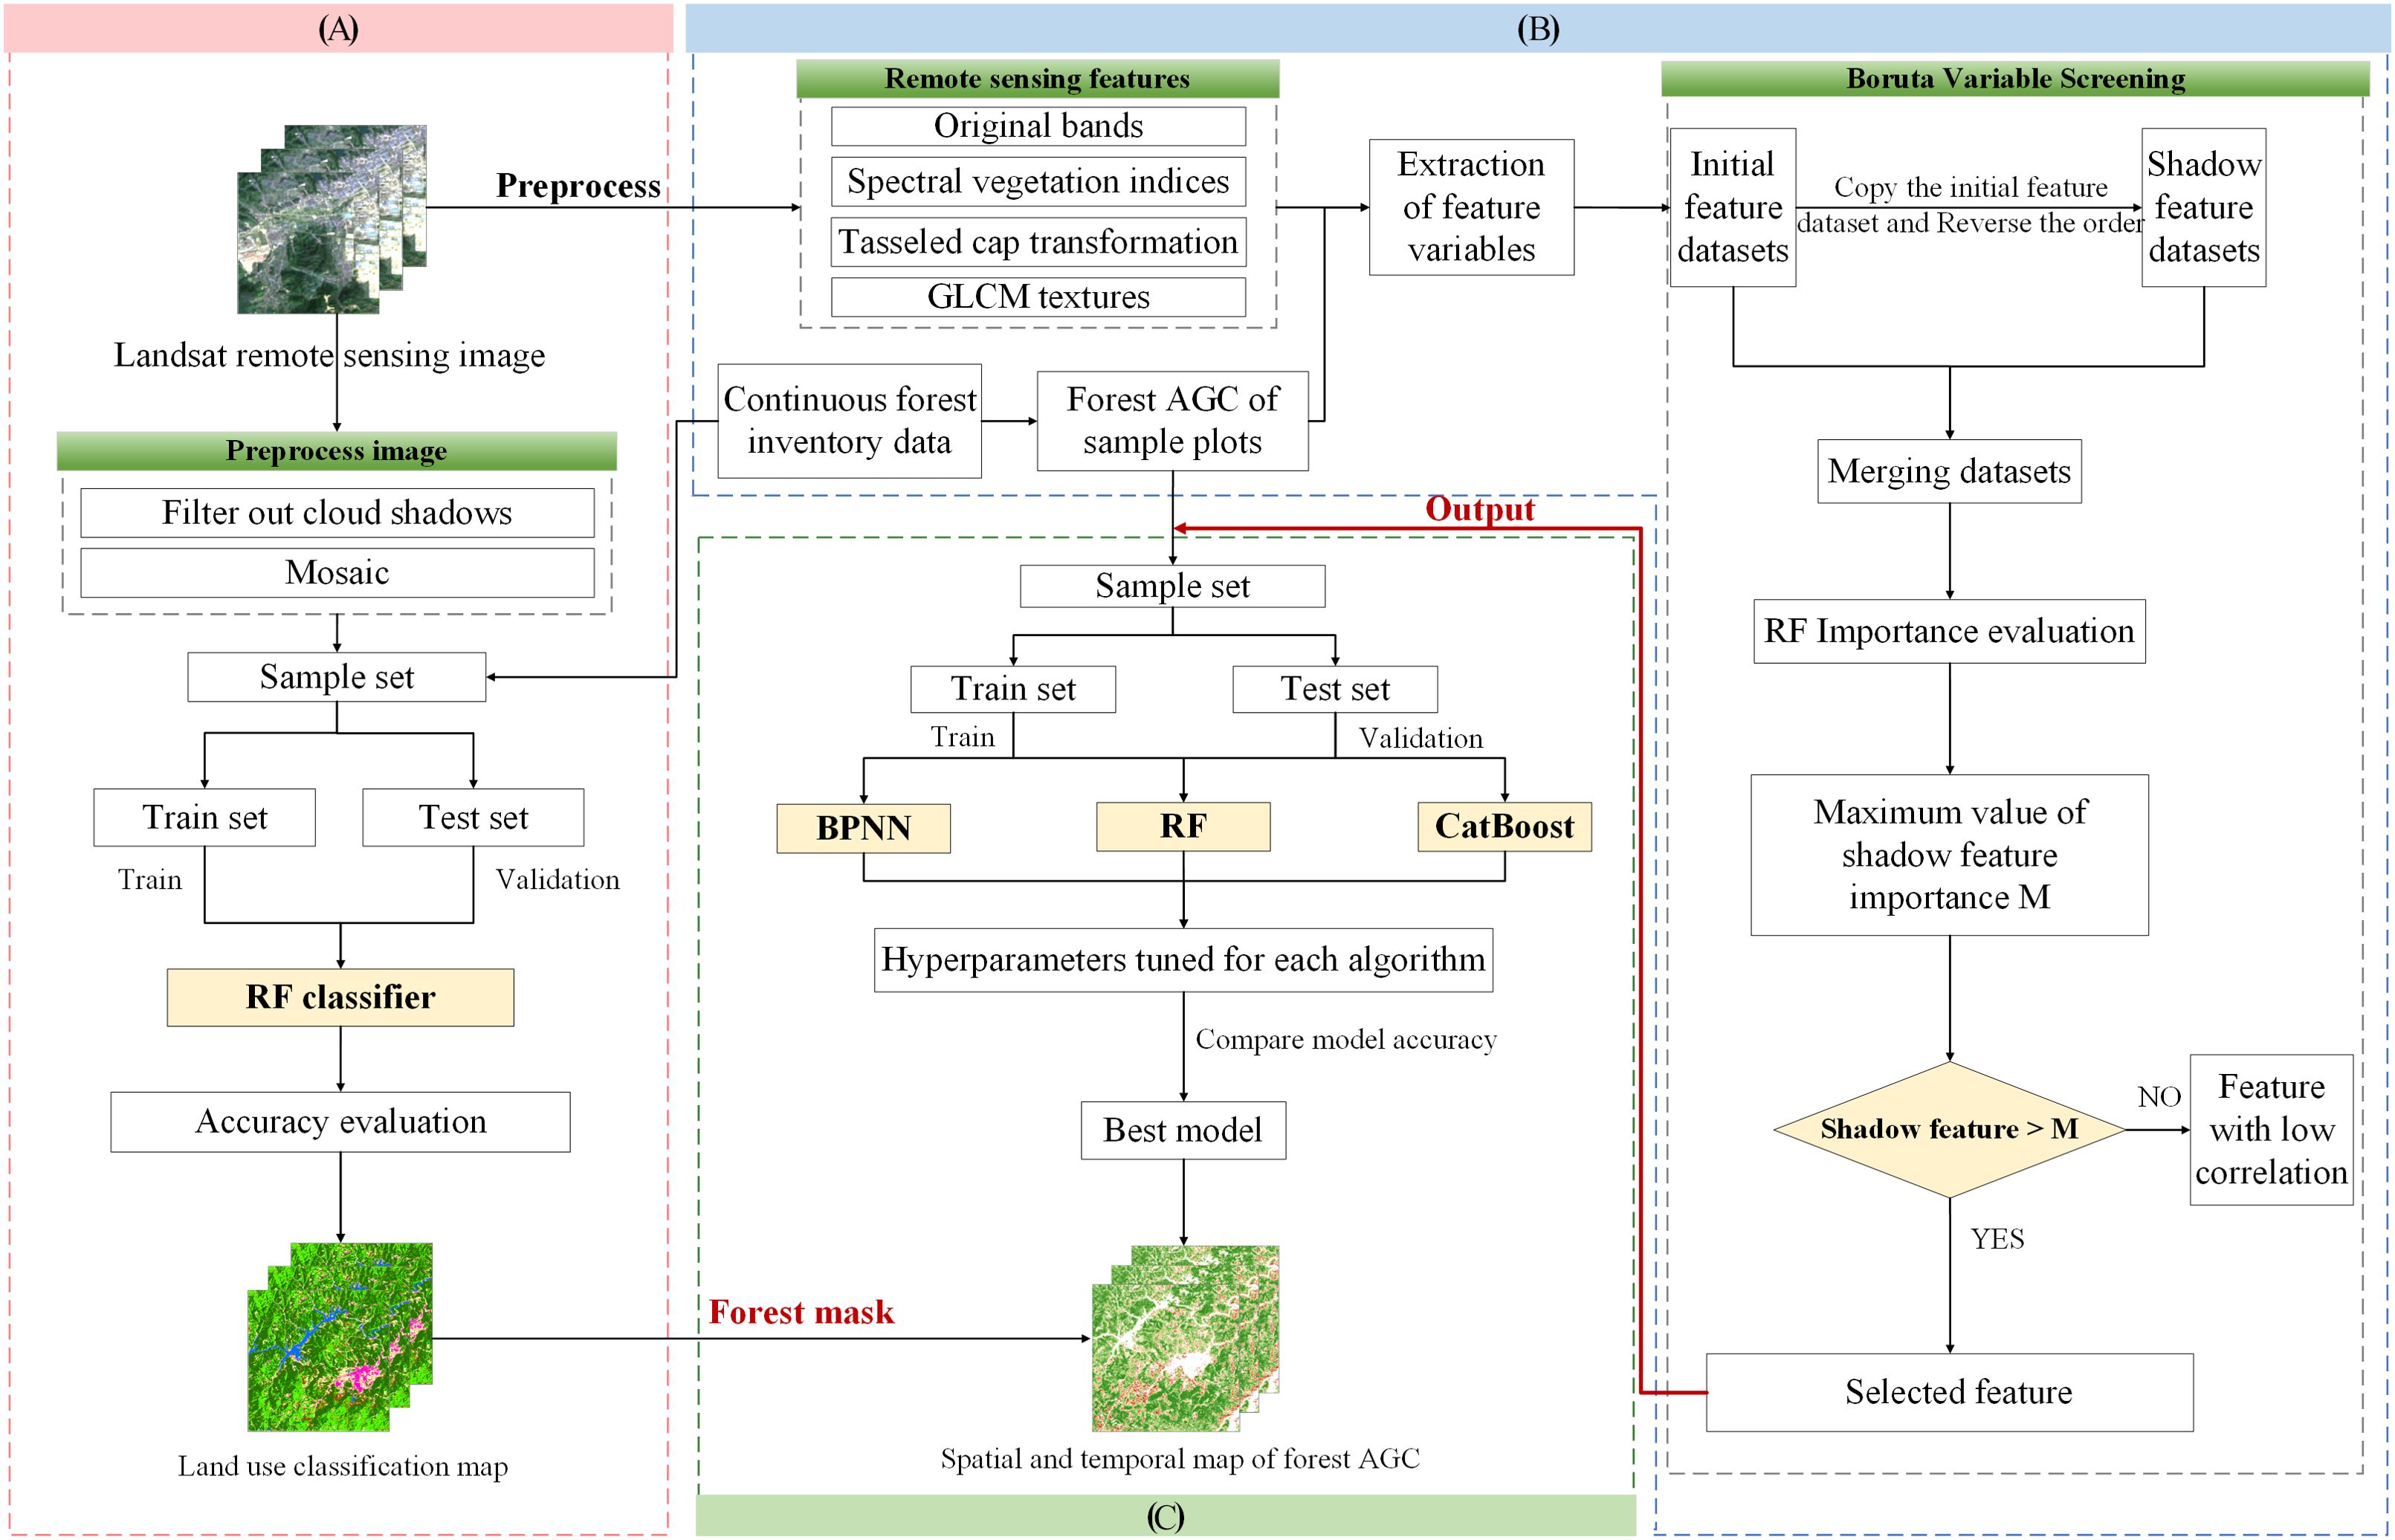
Figure 2. Research technology roadmap: (A) land use classification map, (B) extraction of remote sensing image information for feature variable selection, (C) analyzing the three models, the optimal one was used for the inversion of forest AGC, resulting in a map depicting the spatial and temporal distribution of AGC.
4 Results and analyses
4.1 Information on forest distribution in Lishui City
Based on the GEE platform, the RF classifier is used to classify the land use in Lishui City, the categorization outcomes from seven intervals are displayed in Figure 3. Lishui City has rich forest resources, and the proportion of forest area is large. Broad-leaved forests are predominantly found in the southern, western, and central-eastern areas of Lishui City. The western region primarily hosts coniferous forests. Bamboo forests are typically found in proximity to coniferous forests and agricultural areas. Comparing the seven-period classification map (Figure 3), it can be seen that from 1989 to 2019, the area of broad-leaved forests in the northwestern and eastern regions increased significantly, while the area of coniferous forests and cultivated land decreased. The area of cultivated land in the northeastern region decreased significantly, urban land increased, and the expanses of broad-leaved forests, coniferous forests, and bamboo forests have seen growth. The area of bamboo forests and broad-leaved forests in the southwestern region increased, while the area of cultivated land and coniferous forests decreased.
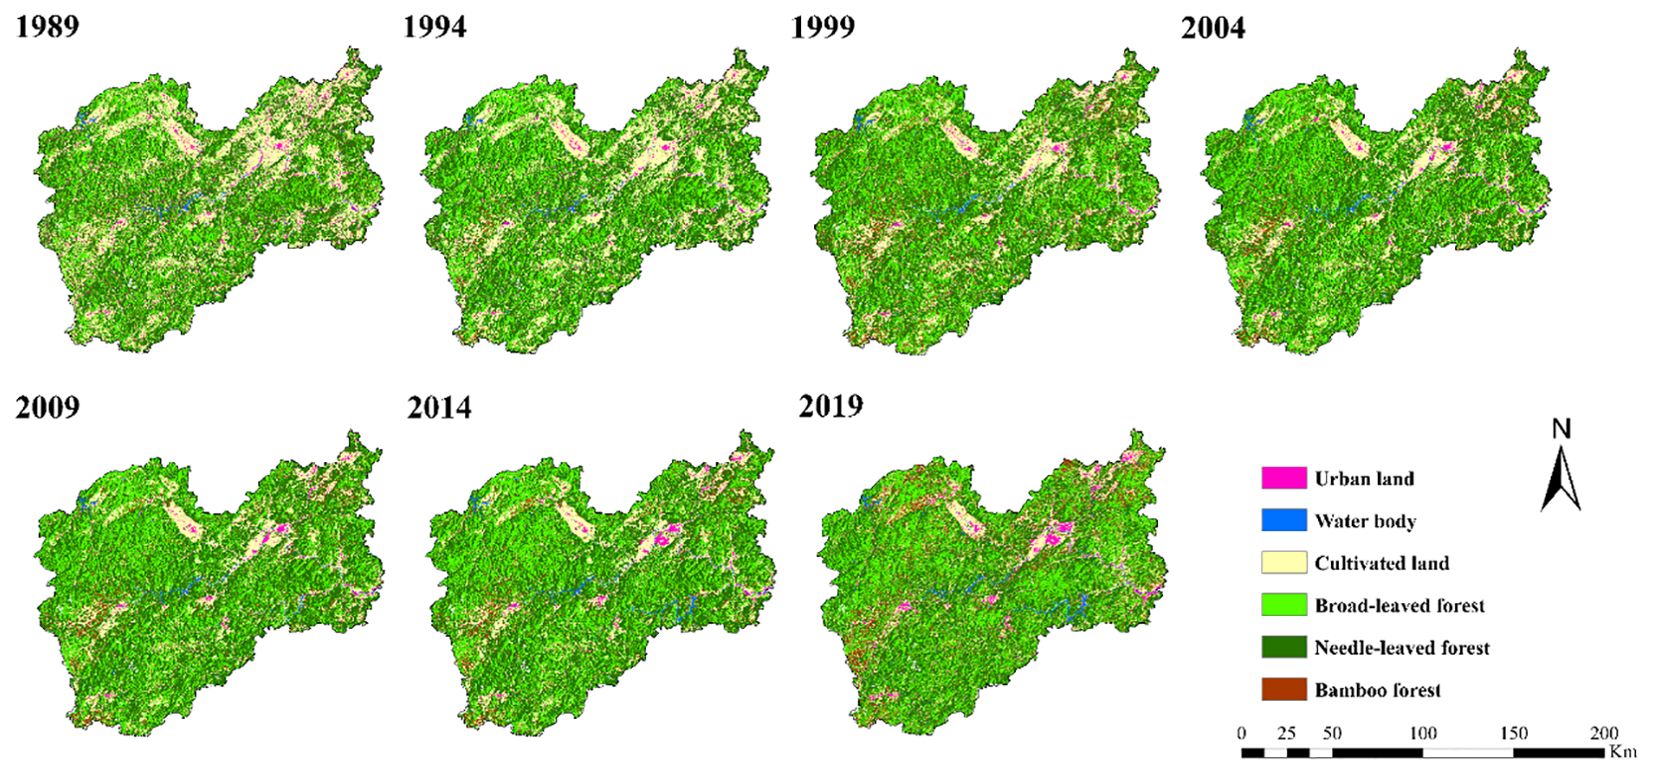
Figure 3. Land use classification map of Lishui from 1989 to 2019.
The classification results are evaluated for accuracy through forest resource inventory data and manual visual interpretation (Table 4). The overall accuracy (OA) of the seven stages is all above 85%. The classification of broad-leaved forests, coniferous forests, and bamboo forests all have a user accuracy (UA) and producer accuracy (PA) exceeding 70%. This indicates that the classification results of each year are relatively accurate. The spatiotemporal distribution information of broad-leaved forests, coniferous forests, and bamboo forests is extracted from it. They are combined into the forest distribution information of seven periods. It is used for the extraction of the forest AGC spatial distribution mask in the later stage.
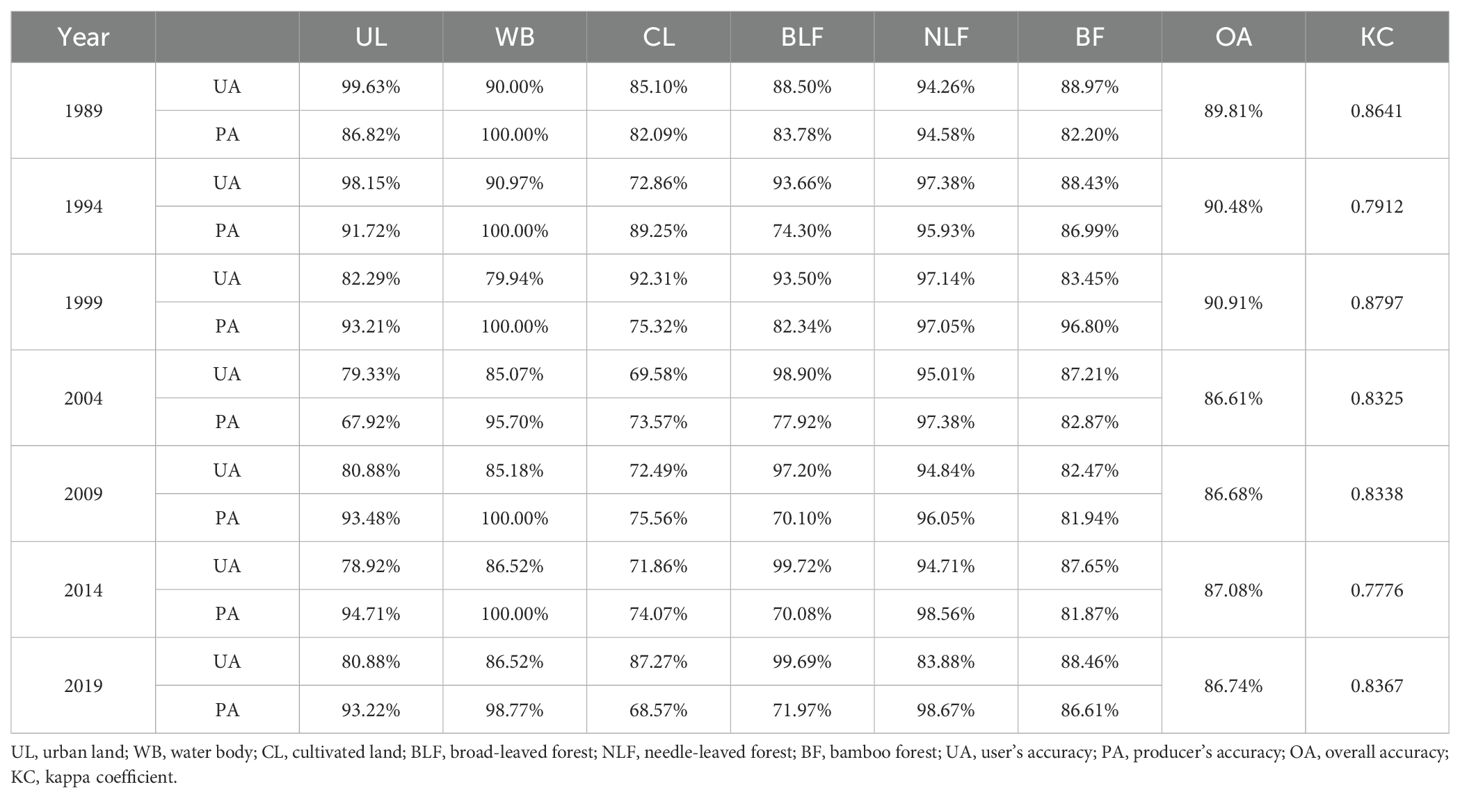
Table 4. Evaluation of land use accuracy over 7 periods.
4.2 Variable selection results
Based on the Boruta algorithm, the best combination of remote sensing feature variables selected for each year is shown in Table 5. Among them, 21 variables were selected in 1989, 26 variables in 1994, 41 variables in 2004, 47 variables in 2009, 37 variables in 2014, and 45 variables in 2019.
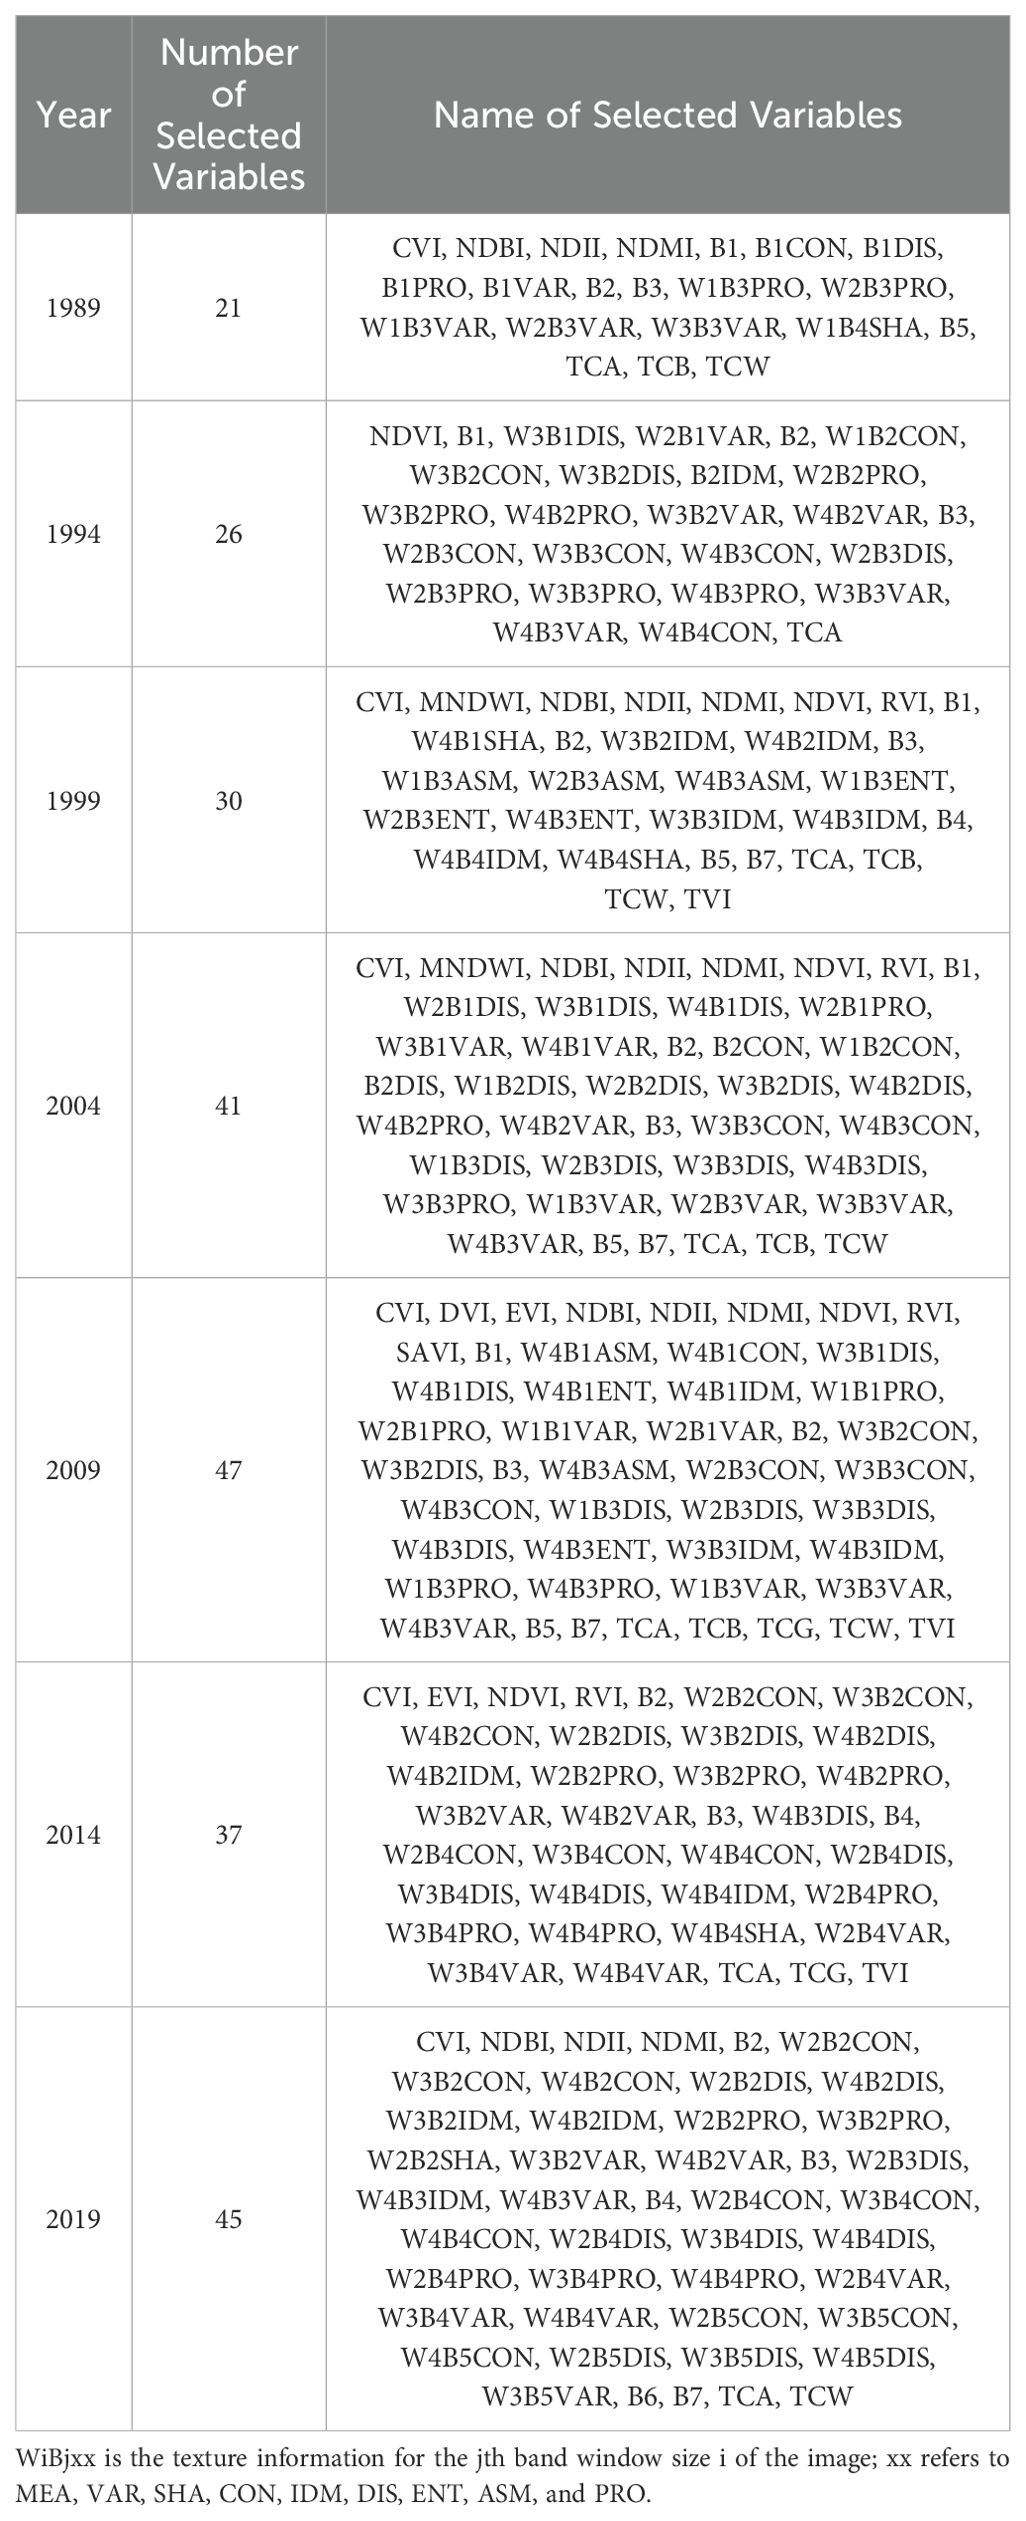
Table 5. Characteristic variables were selected based on the Boruta method.
4.3 AGC model construction and prediction results
According to the three machine learning hyperparameter configurations shown in Table 3, parameter optimization was performed on the seven-period data (5 years per period) of the three machine learning models respectively. The optimal hyperparameter combination for each AGC estimation model was determined through a cross-validation grid search. Using the minimum root mean square value as the scoring criterion, a total of 1000 trainings were conducted (Table 6). After determining the best hyperparameter combination, the forest AGC estimation model was constructed.
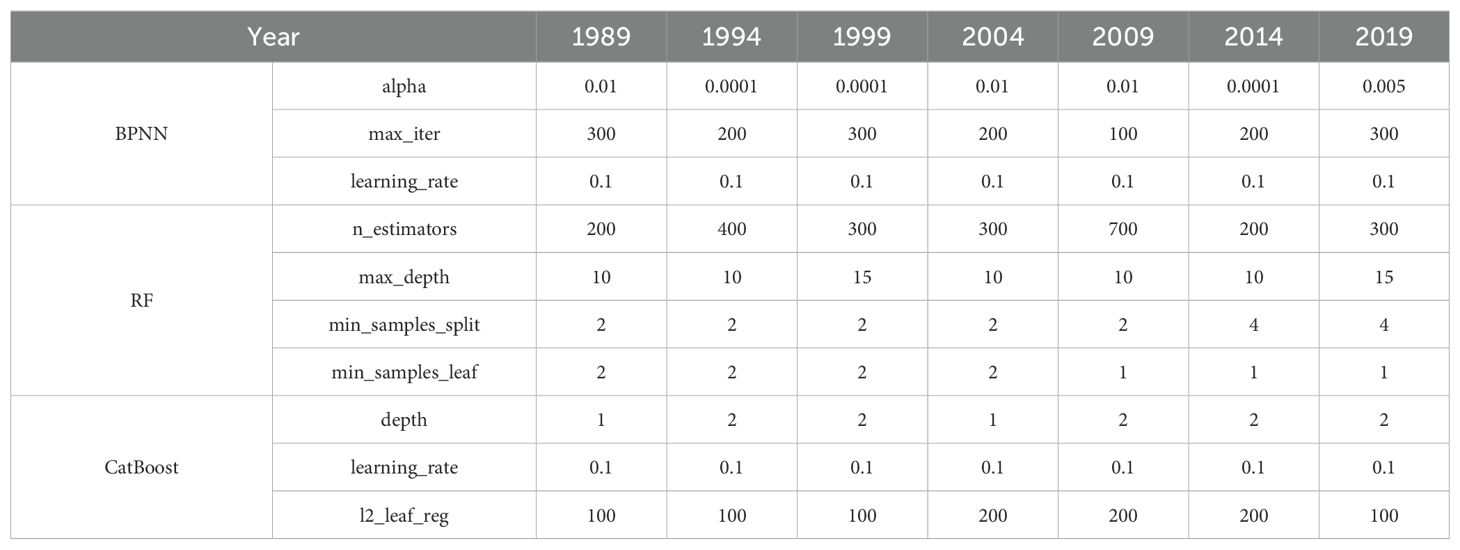
Table 6. Optimal values for each hyperparameter for each year.
This study employs three machine learning algorithms, namely BPNN, RF, and CatBoost, to develop three predictive models for forest AGC spanning the years 1989–2019. The correlation between the AGC densities of each year estimated by the three models and the measured AGC densities of the sample plots is shown in Figure 4. During 1989–2019, the BPNN model training accuracy R2 ranged from 0.64–0.92 with a training RMSE of 1.97–7.42 Mg C ha-1, and the testing accuracy R2 ranged from 0.55–0.67 with a testing RMSE of 2.93–10.23 Mg C ha-1. The RF model training accuracy R2 was between 0.85–0.95 and the training RMSE was 1.36–3.59 Mg C ha-1, and the testing accuracy R2 was between 0.62–0.76 and the RMSE was 2.27–6.77 Mg C ha-1. The CatBoost model had a training accuracy R2 of between 0.82–0.95 a training phase RMSE of 1.17–4.05 Mg C ha-1, and a testing accuracy R2 of between 0.64–0.79, and a testing phase RMSE of 2.32–6.73 Mg C ha-1. Meanwhile, observing the extent to which the three model fit curves deviate from the 1:1 line reveals that overestimation and underestimation are not prominent when the AGC is in the 0–40 Mg C ha-1 range; underestimation generally occurs when the AGC is greater than 40 Mg C ha-1. In addition, from 1989 onwards, the AGC density in the sample site showed an increasing trend from year to year.
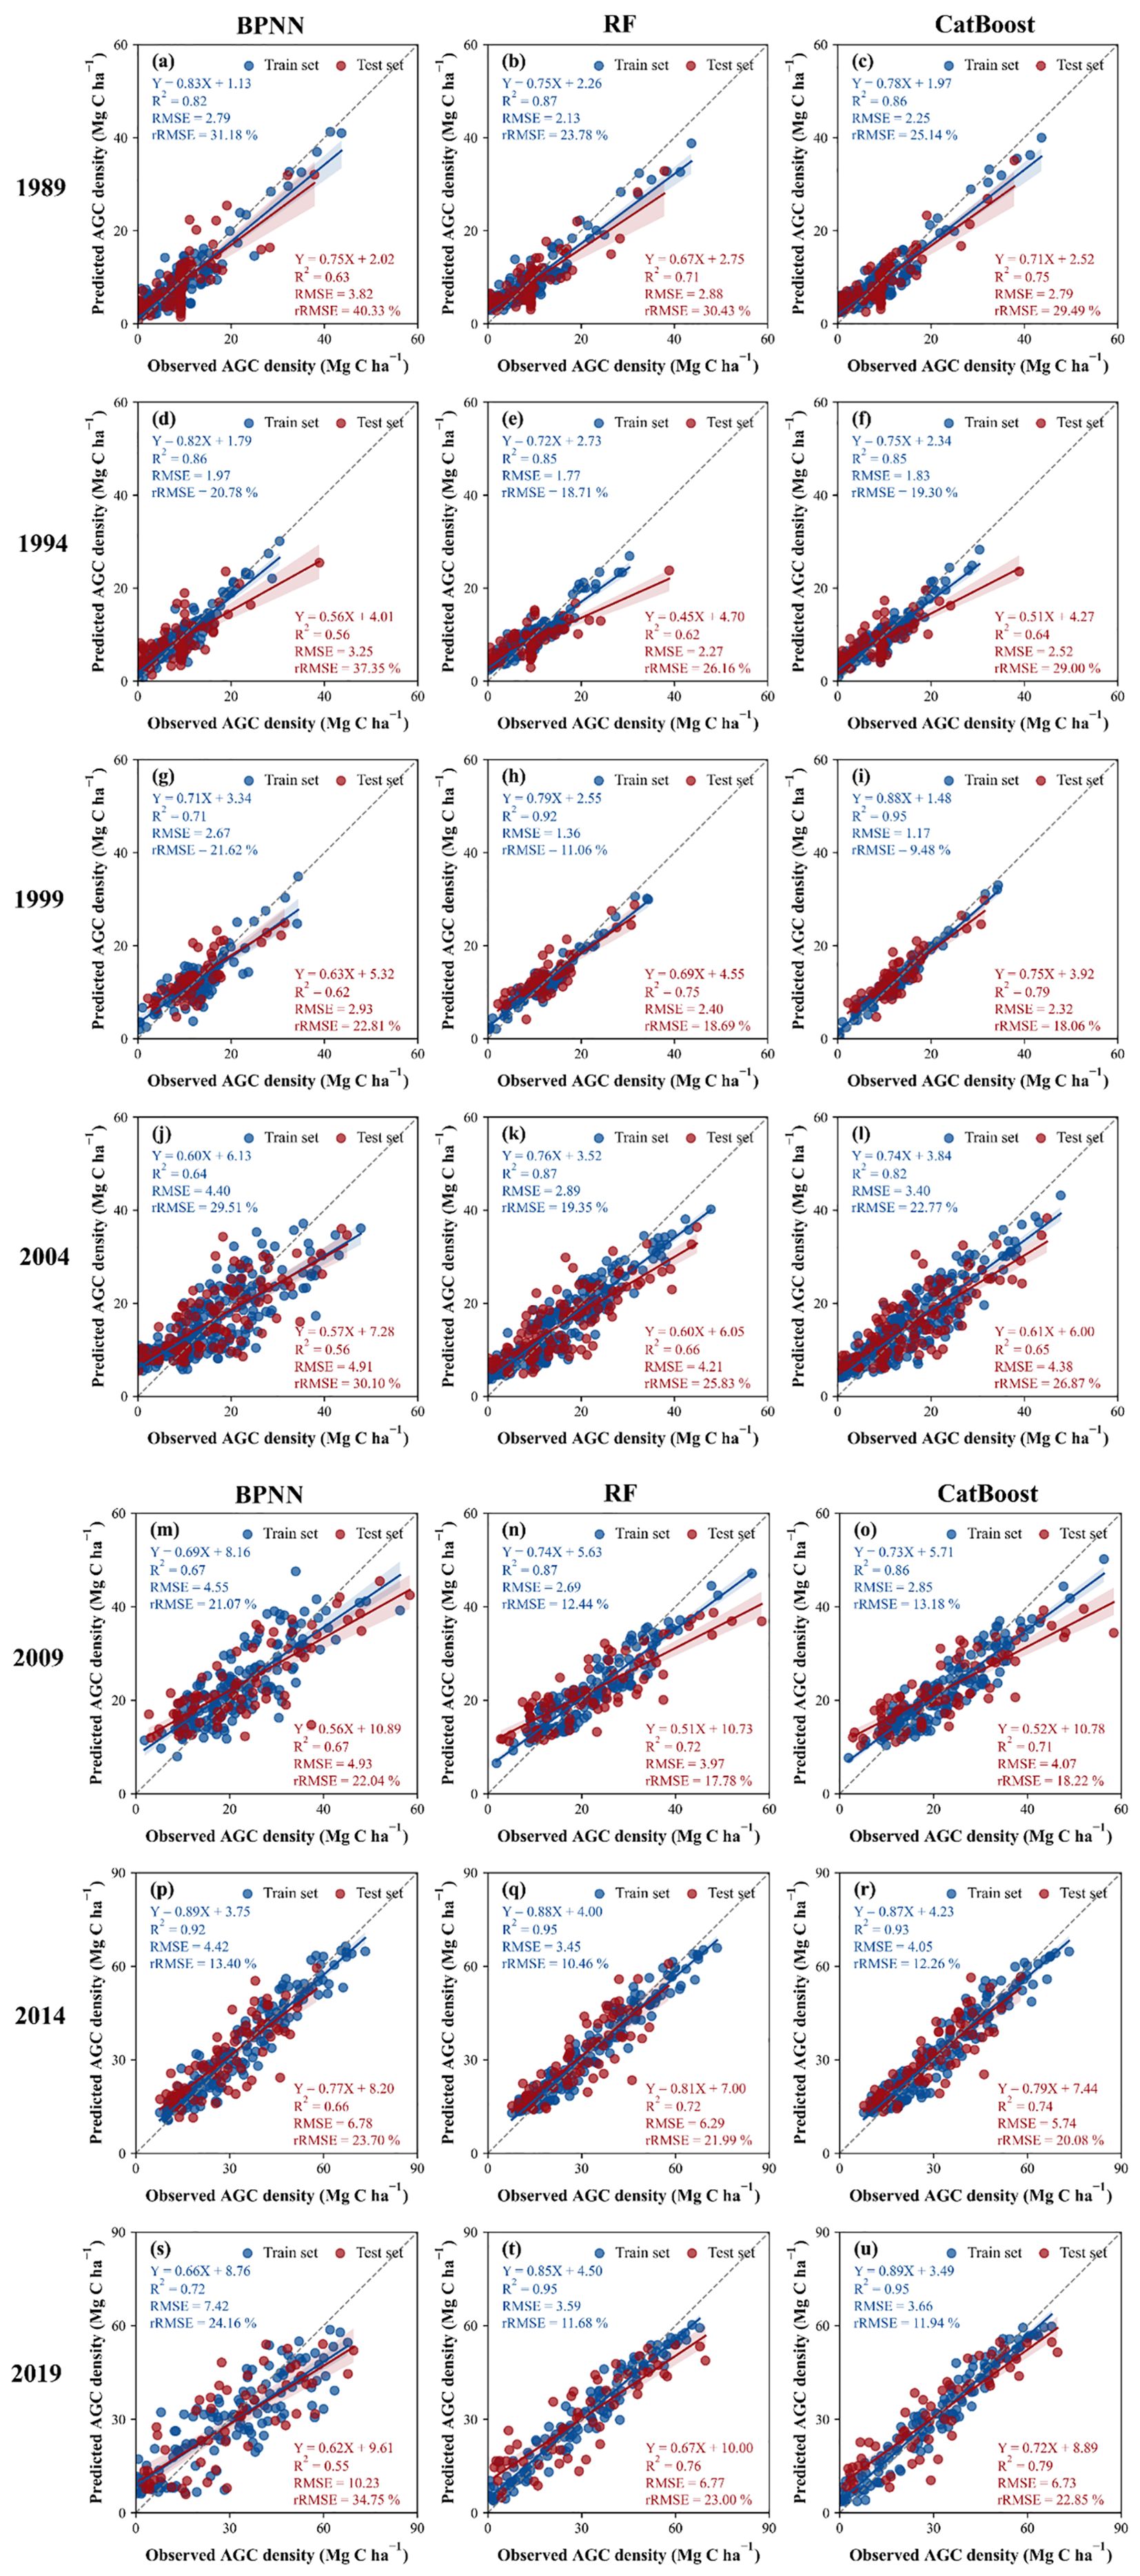
Figure 4. (A–U) Accuracy assessment of three Landsat-based AGC prediction models per year.
Figure 5 shows the accuracy (R2) and error (RMSE) of the three models in the training set and test set for each year. The comparison revealed that the CatBoost model had the highest average accuracy R2 (R2 = mean ± standard deviation) in the test set of all years. The second highest is the RF model (R2 = mean ± standard deviation). The average accuracy R2 (R2 = mean ± standard deviation) of the BPNN model’s test set is the lowest. At the same time, the average RMSE (RMSE=mean ± standard deviation) of the BPNN model’s test set is the highest. The average RMSE of the CatBoost model (RMSE=mean ± standard deviation) and the RF model (RMSE=mean ± standard deviation) is much lower than the average RMSE of BPNN. Therefore, the estimates of CatBoost and RF are superior to BPNN in all years, and the estimates of the CatBoost model are slightly superior to the RF model.
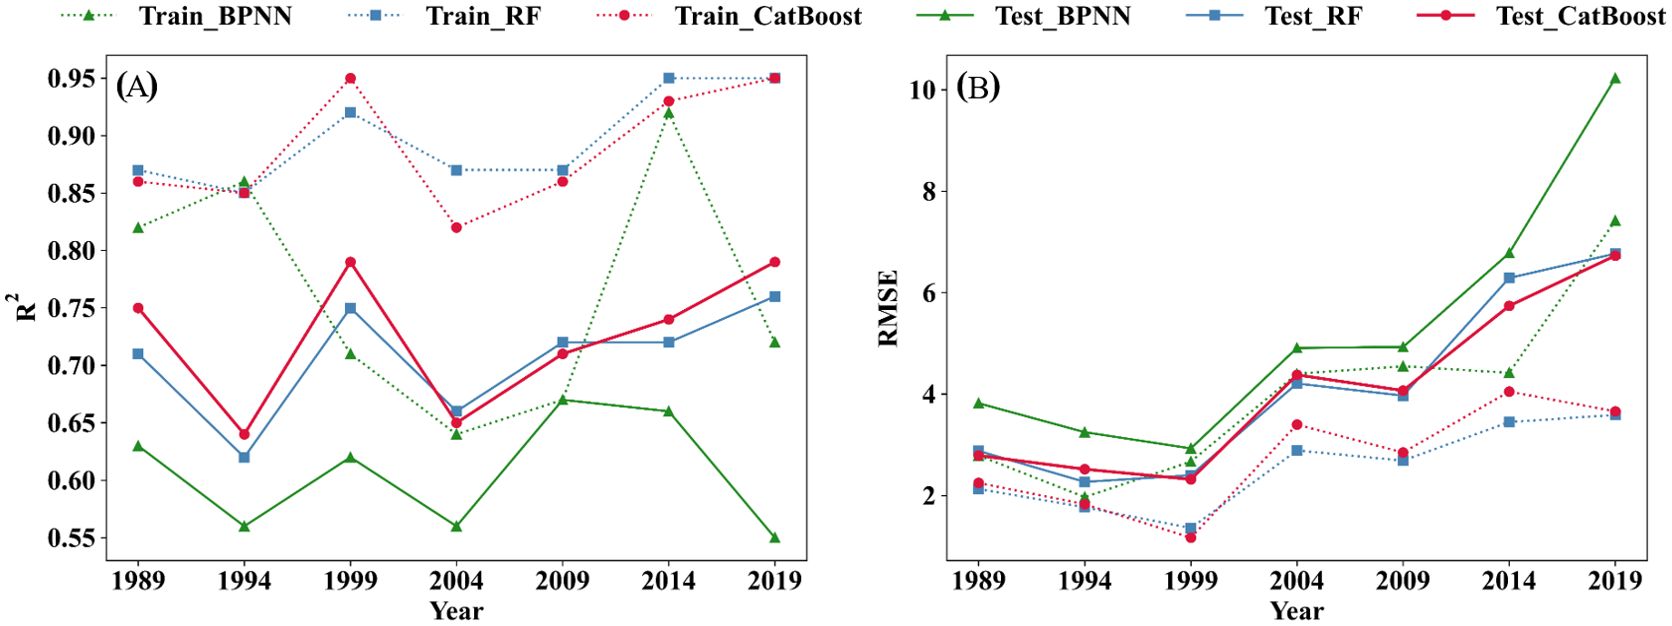
Figure 5. Comparison of the accuracy of the three models. (A) the values of the R2 for three models. (B) the values of the RMSE for three models.
The training and testing results of all sample plots over the years are evaluated, resulting in a scatter plot (Figure 6). It can be seen that the training R2 of the RF model is the same as the training R2 of the CatBoost model, which is 9.2% higher than BPNN. The test R2 of the CatBoost model is 2.5% higher than the test R2 of the RF model, and 12.16% higher than the test R2 of the BPNN model. Among the three models, the RMSE of the CatBoost model in the testing phase is the lowest. It is 3.65% lower than the RF model and 25.96% lower than the BPNN model. The RMSE of the BPNN model in the testing phase is the lowest, 3.65% lower than the RF model, and 25.96% lower than the BPNN model. The range of overestimation and underestimation of the BPNN model is greater than that of the RF model and the CatBoost model.
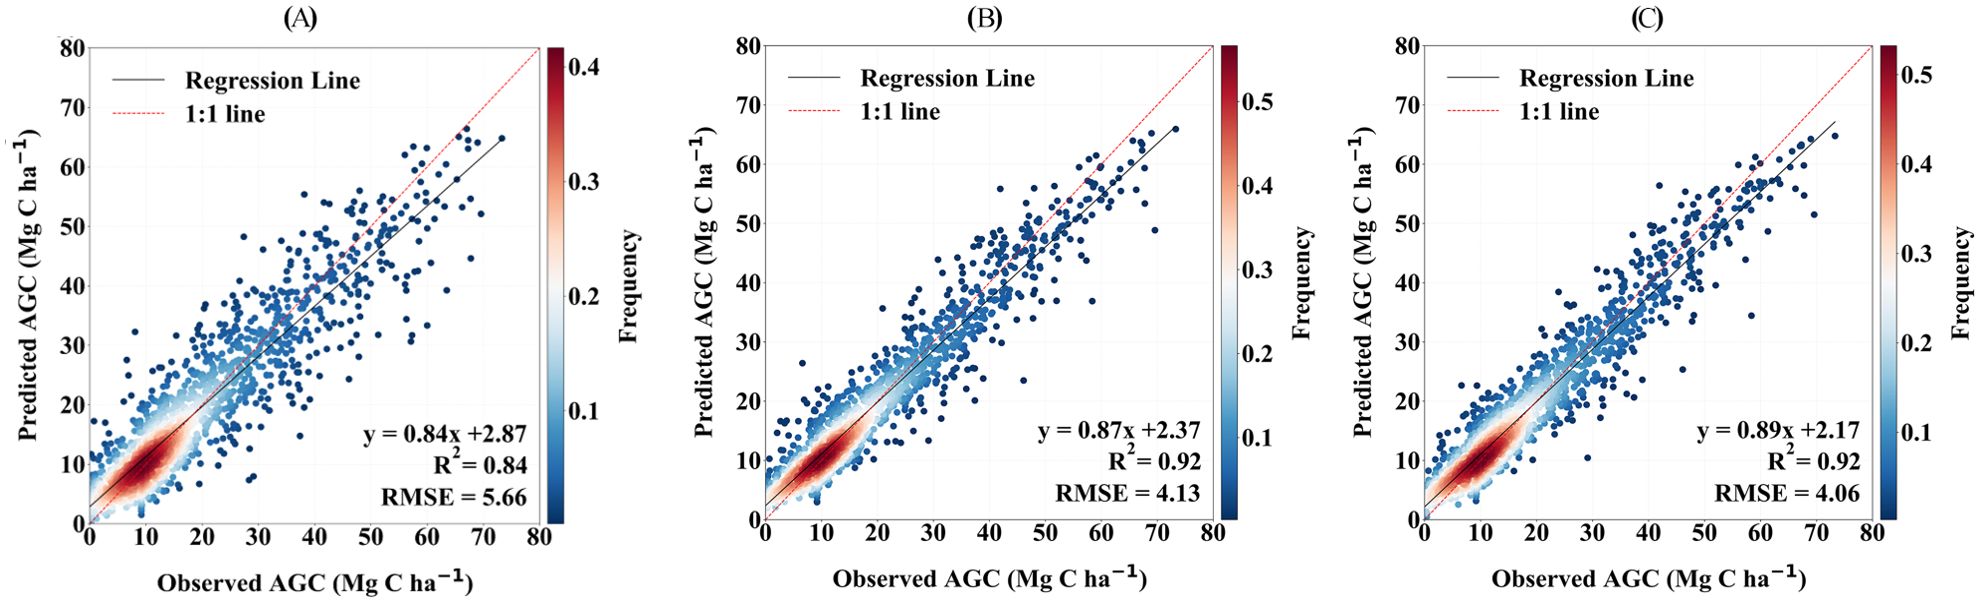
Figure 6. Evaluating the precision of AGC prediction models derived from Landsat: (A) BPNN machine learning model, (B) RF machine learning model, (C) CatBoost machine learning model.
In summary, the forest AGC predictive model built using the CatBoost algorithm demonstrates superior accuracy and overall performance. Therefore, this study will use the CatBoost model as the best estimation model for the spatiotemporal distribution of the forest AGC in Lishui City.
4.4 Spatiotemporal distribution of AGC in Lishui City
The dispersion of forest AGC density in Lishui City over the period from 1989 to 2019, estimated based on the CatBoost model, is shown in Figure 7 From a spatial perspective, the AGC values in the central and southwestern regions of Lishui City are relatively high. Areas with high forest AGC values are distributed in the southwestern part of Suichang County, the northwestern and southeastern parts of Longquan County, the northern part of Qingyuan County, the southeastern part of Songyang County, the northern and southeastern parts of Yunhe County, the northeastern part of Jingning County, the northern and southeastern parts of Jingde County, the southeastern part of Jinyun County, the southwestern part of Qingtian County, and the southern part of Liandu District. These areas have more mountains and a wide forest coverage area, so the forest AGC values are higher. The forest AGC values in areas near the city are generally lower, and the carbon density is also lower. From a temporal perspective, the forest AGC density in Lishui City shows an upward trend. It has changed from being dominated by low AGC values in 1989 to being dominated by high AGC values in 2019. During the period from 1989 to 2004, the proportion of Lishui forests with AGC values of 0–24 Mg C ha-1 was higher. The highest percentage of 0–6 Mg C ha-1 was 45.71% in 1989, 6–12 Mg C ha-1 was 52.63% in 1994, 12–18 Mg C ha-1 was 40.44% in 1999 and 6–12 Mg C ha-1 was 29.41% in 2004. From 2009 to 2019, Lishui City saw a higher proportion of forest AGC values ranging from 24–63 Mg C ha-1. In 2009, the 24–32 Mg C ha-1 range had a peak percentage of 36.08%. In 2014, the highest percentage of 24.26% was in the 32–42 Mg C ha-1 range. By 2019, the 42–50 Mg C ha-1 range had the highest percentage of 25.56%.
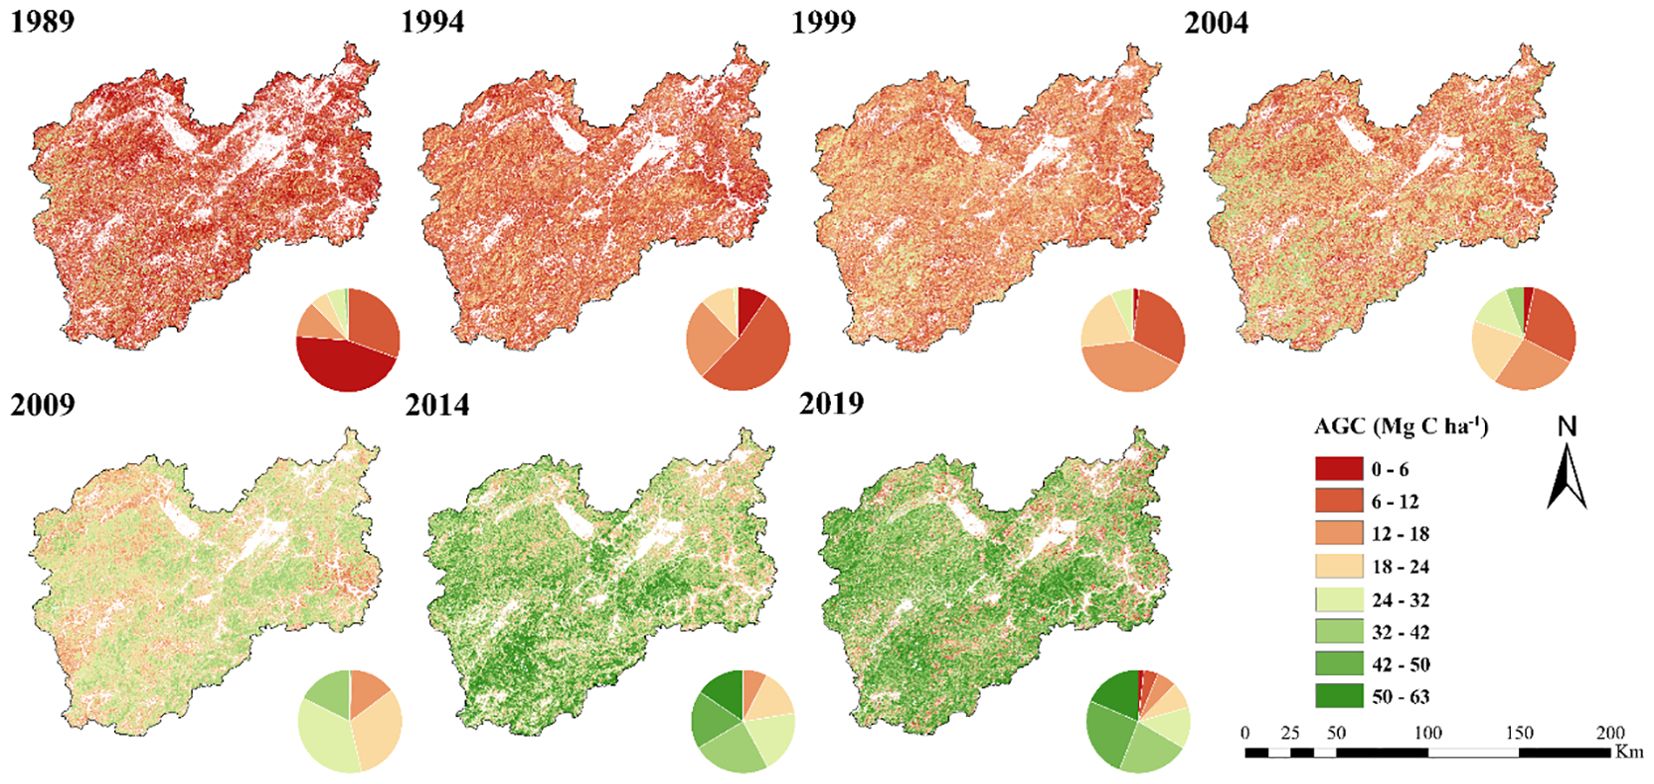
Figure 7. Spatial distribution of AGC on forested land in Lishui from 1989 to 2019.
As shown in Figure 8, the average forest AGC in Lishui City increased from 10.03 Mg C ha-1 in 1989 to 37.32 Mg C ha-1 in 2019, an increase of 2.72 times. Among them, the growth rate was the highest from 2009 to 2014, reaching 43.24%. The total storage of forest AGC increased from 1.36×10⁷ Mg C in 1989 to 6.16×10⁷ Mg C in 2019, an increase of 352.94%. This shows that the trend of change in the total storage of forest AGC is consistent with the trend of change in forest AGC density, showing a positive correlation. From 1989 to 2019, the total amount of forest AGC in Lishui City showed a continuous growth trend. Among them, the change in forest AGC was relatively large and the growth was relatively fast during the ten years from 2004 to 2014. The increase in forest AGC was less rapid between 1989 to 2004 and 2014 to 2019.
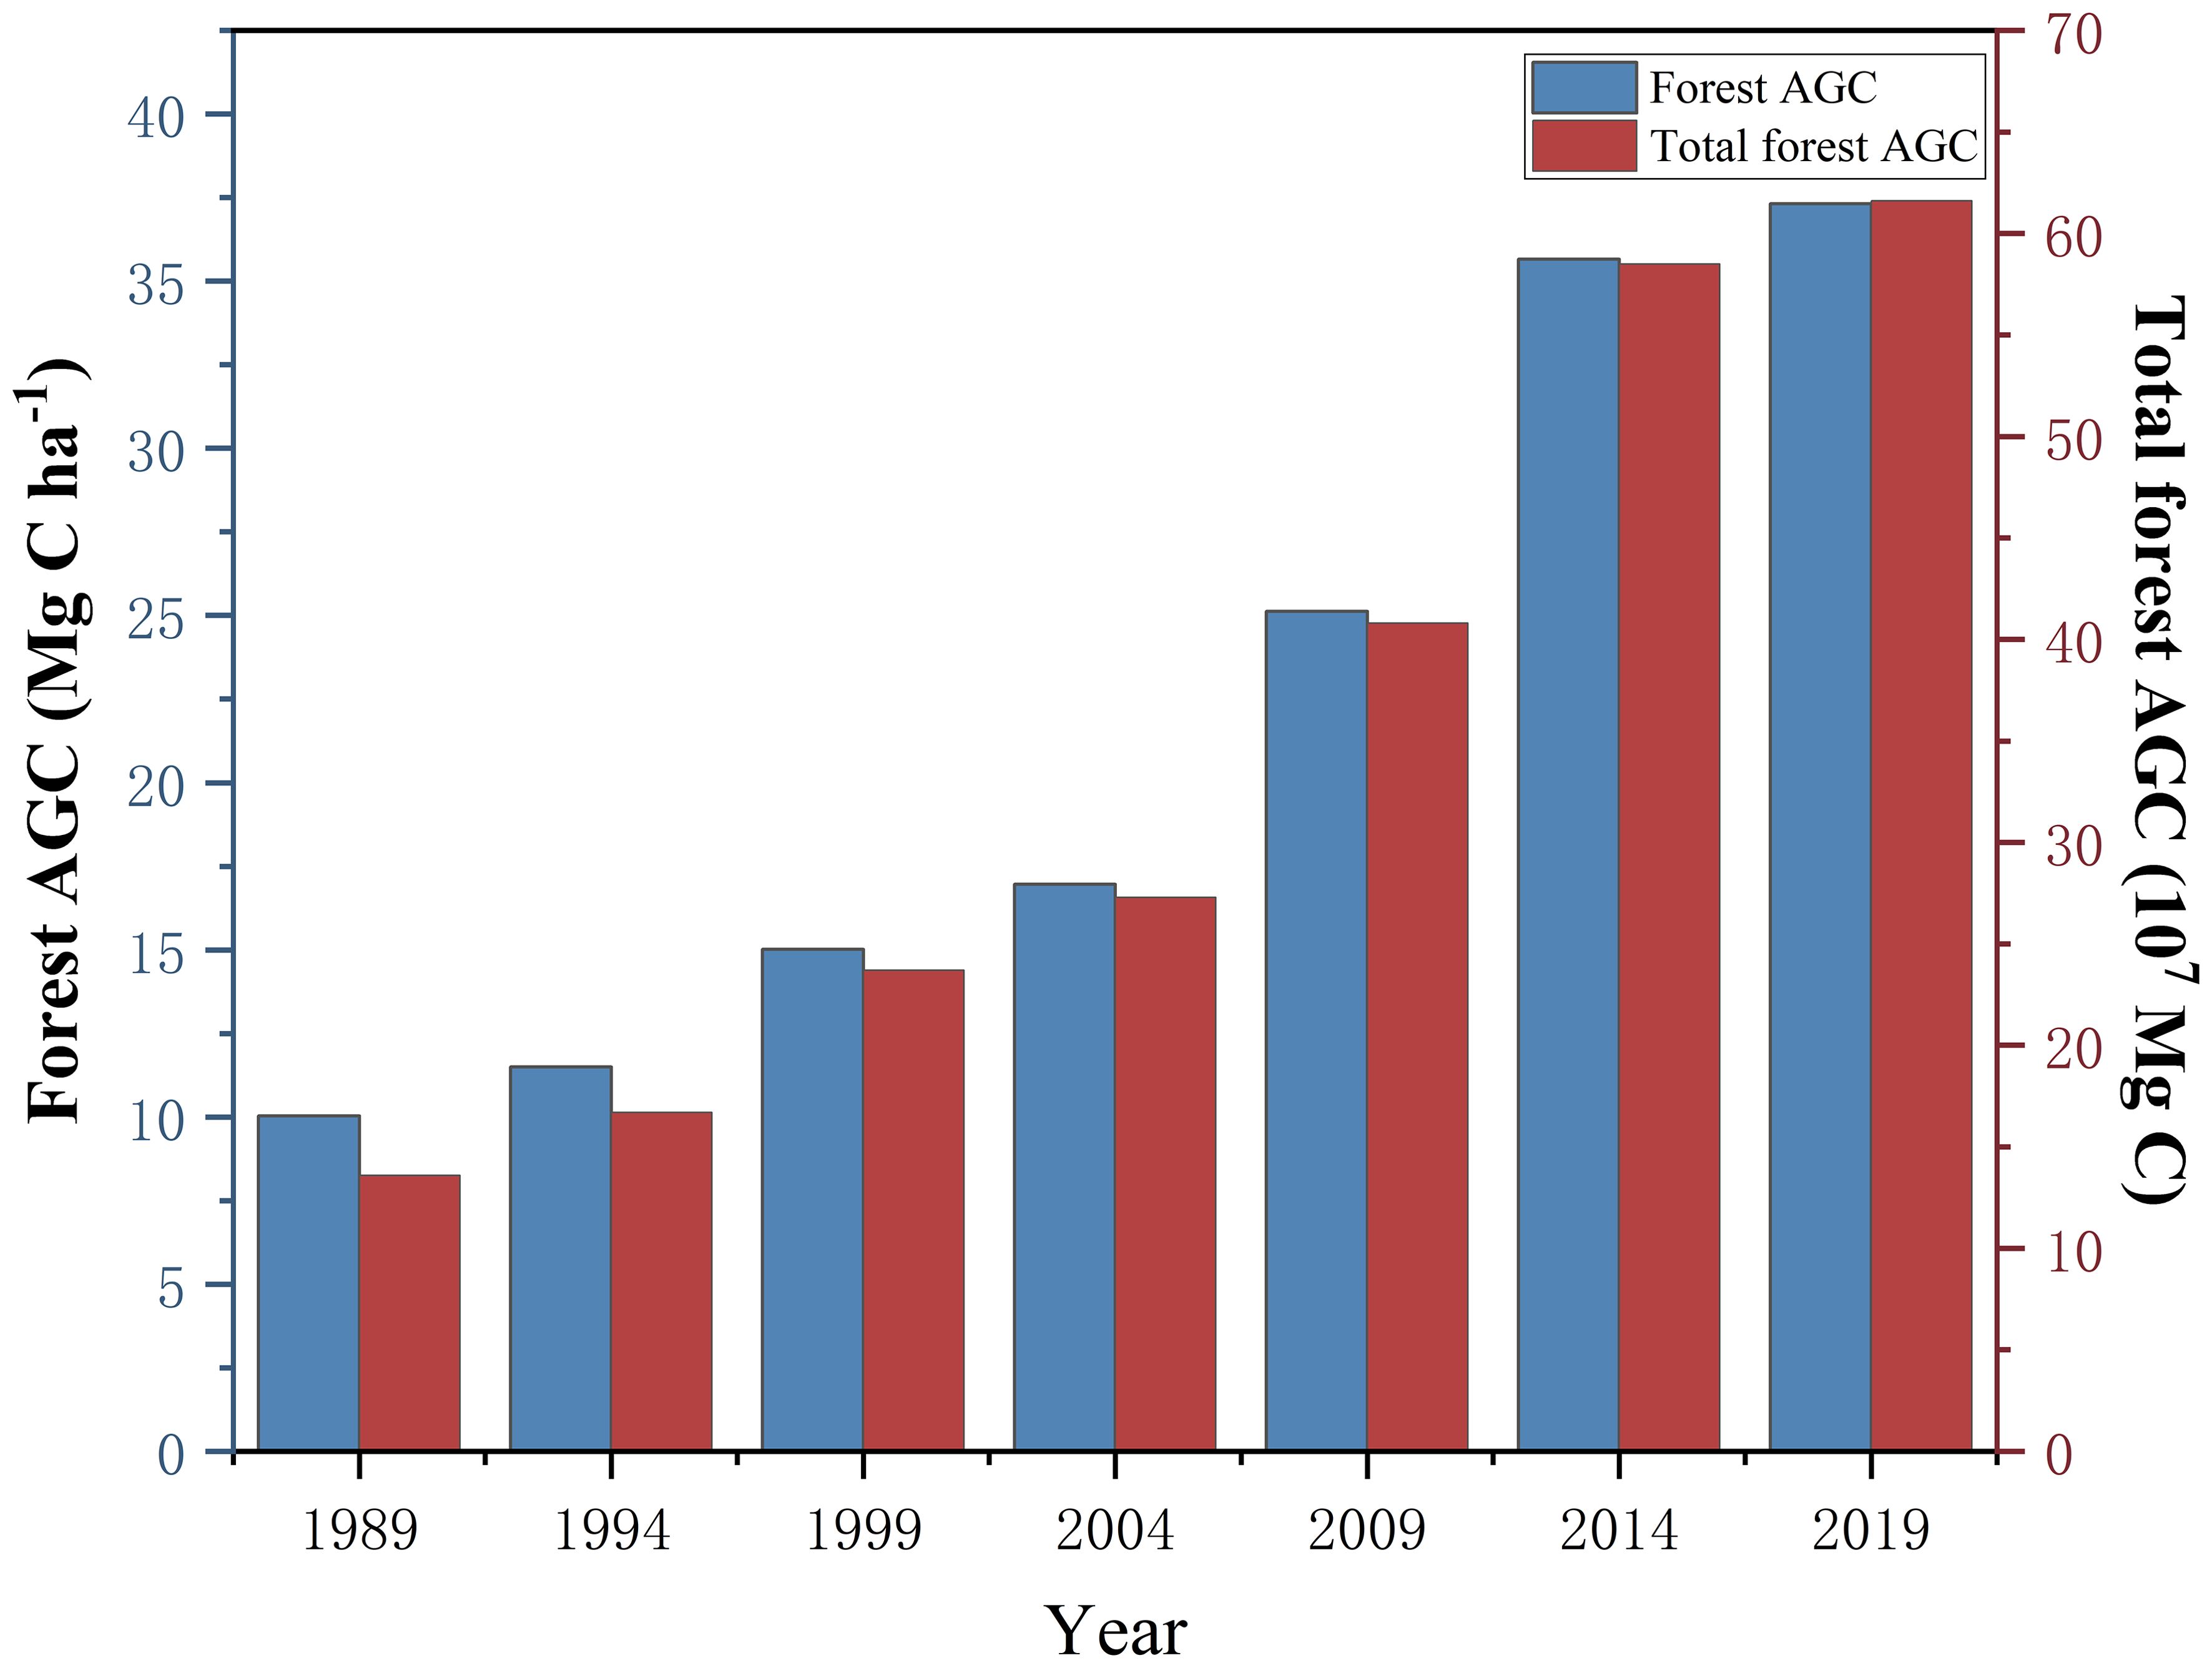
Figure 8. Forest AGC and total forest AGC storage from 1989 to 2019.
Figure 9 illustrates the yearly variations in forest AGC and the overall forest AGC storage across nine sectors: Songyang, Longquan, Yunhe, Suichang, Jingning, Jinyun, Qingtian, Liandu, and Qingyuan. Over time, the forest AGC in each division has increased year by year. In all sectors, the forest AGC reached its minimum in 1989 and peaked in 2019. During the study period, among the nine divisions, Longquan had the highest forest AGC, Jinyun had the lowest, and the forest AGC distribution in the other divisions was relatively uniform within the same year.
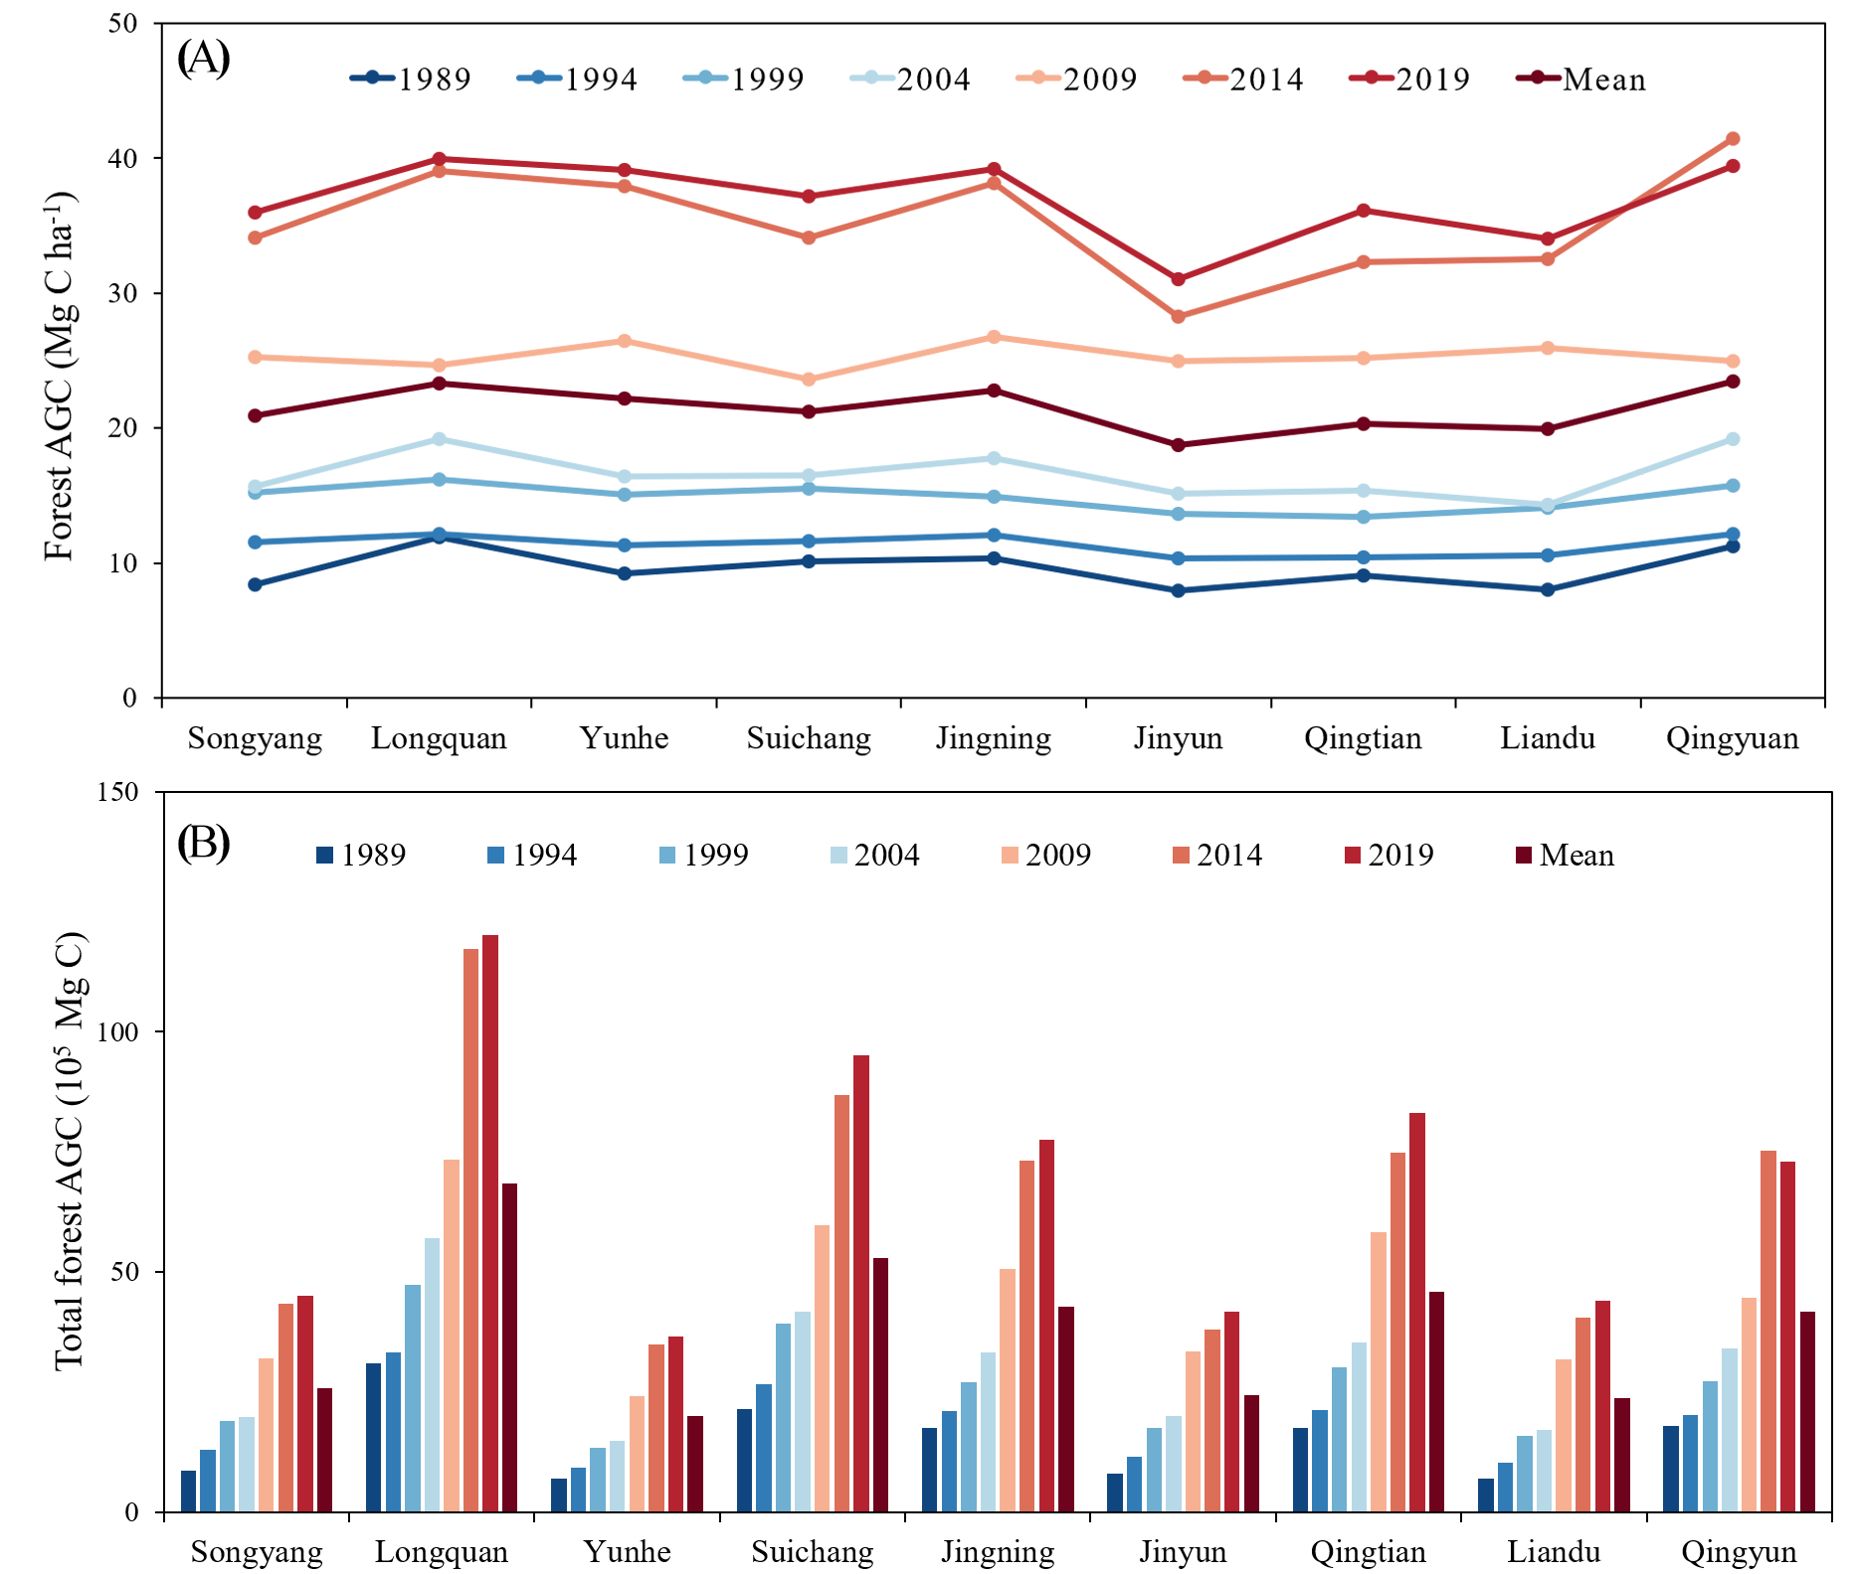
Figure 9. (A) Variations in forest AGC across various regions over different years, (B) cumulative forest AGC in different regions over various years.
5 Discussion
5.1 Variable selection importance analysis
The construction of the forest AGC model is closely related to the feature variables input into the model. The accuracy of the model is significantly influenced by the input of various feature variables. Therefore, this study uses the Boruta algorithm for variable selection. This eliminates redundant or irrelevant predictive features, thereby improving the performance of the model. The Boruta algorithm is run 500 times in different years to analyze the importance of each feature variable. Figure 10 shows the results of the feature variable importance ranking. As depicted in Figure 10, texture data has the most substantial effect on both the development and precision of the model. In the seven model periods from 1989 to 2019, texture features accounted for 48%, 81%, 43%, 63%, 58%, 73%, and 76% of the feature variables, respectively. In the forest AGC model, the significance of texture information surpasses that of the original bands, vegetation indices, and cap transformation features. Texture information is the most important feature parameter (Shen et al., 2016). The next are the vegetation index and original bands, which account for 14.86% and 13.14% of the total feature variables, respectively. This suggests that surface texture information is the primary element in constructing a forest AGC model, aligning with Zhang’s research findings (Zhang et al., 2019). In addition, the proportions of texture features in the 9 × 9 and 11 × 11 windows are higher. They constitute 28.3% and 35.84% of the overall texture features, respectively.
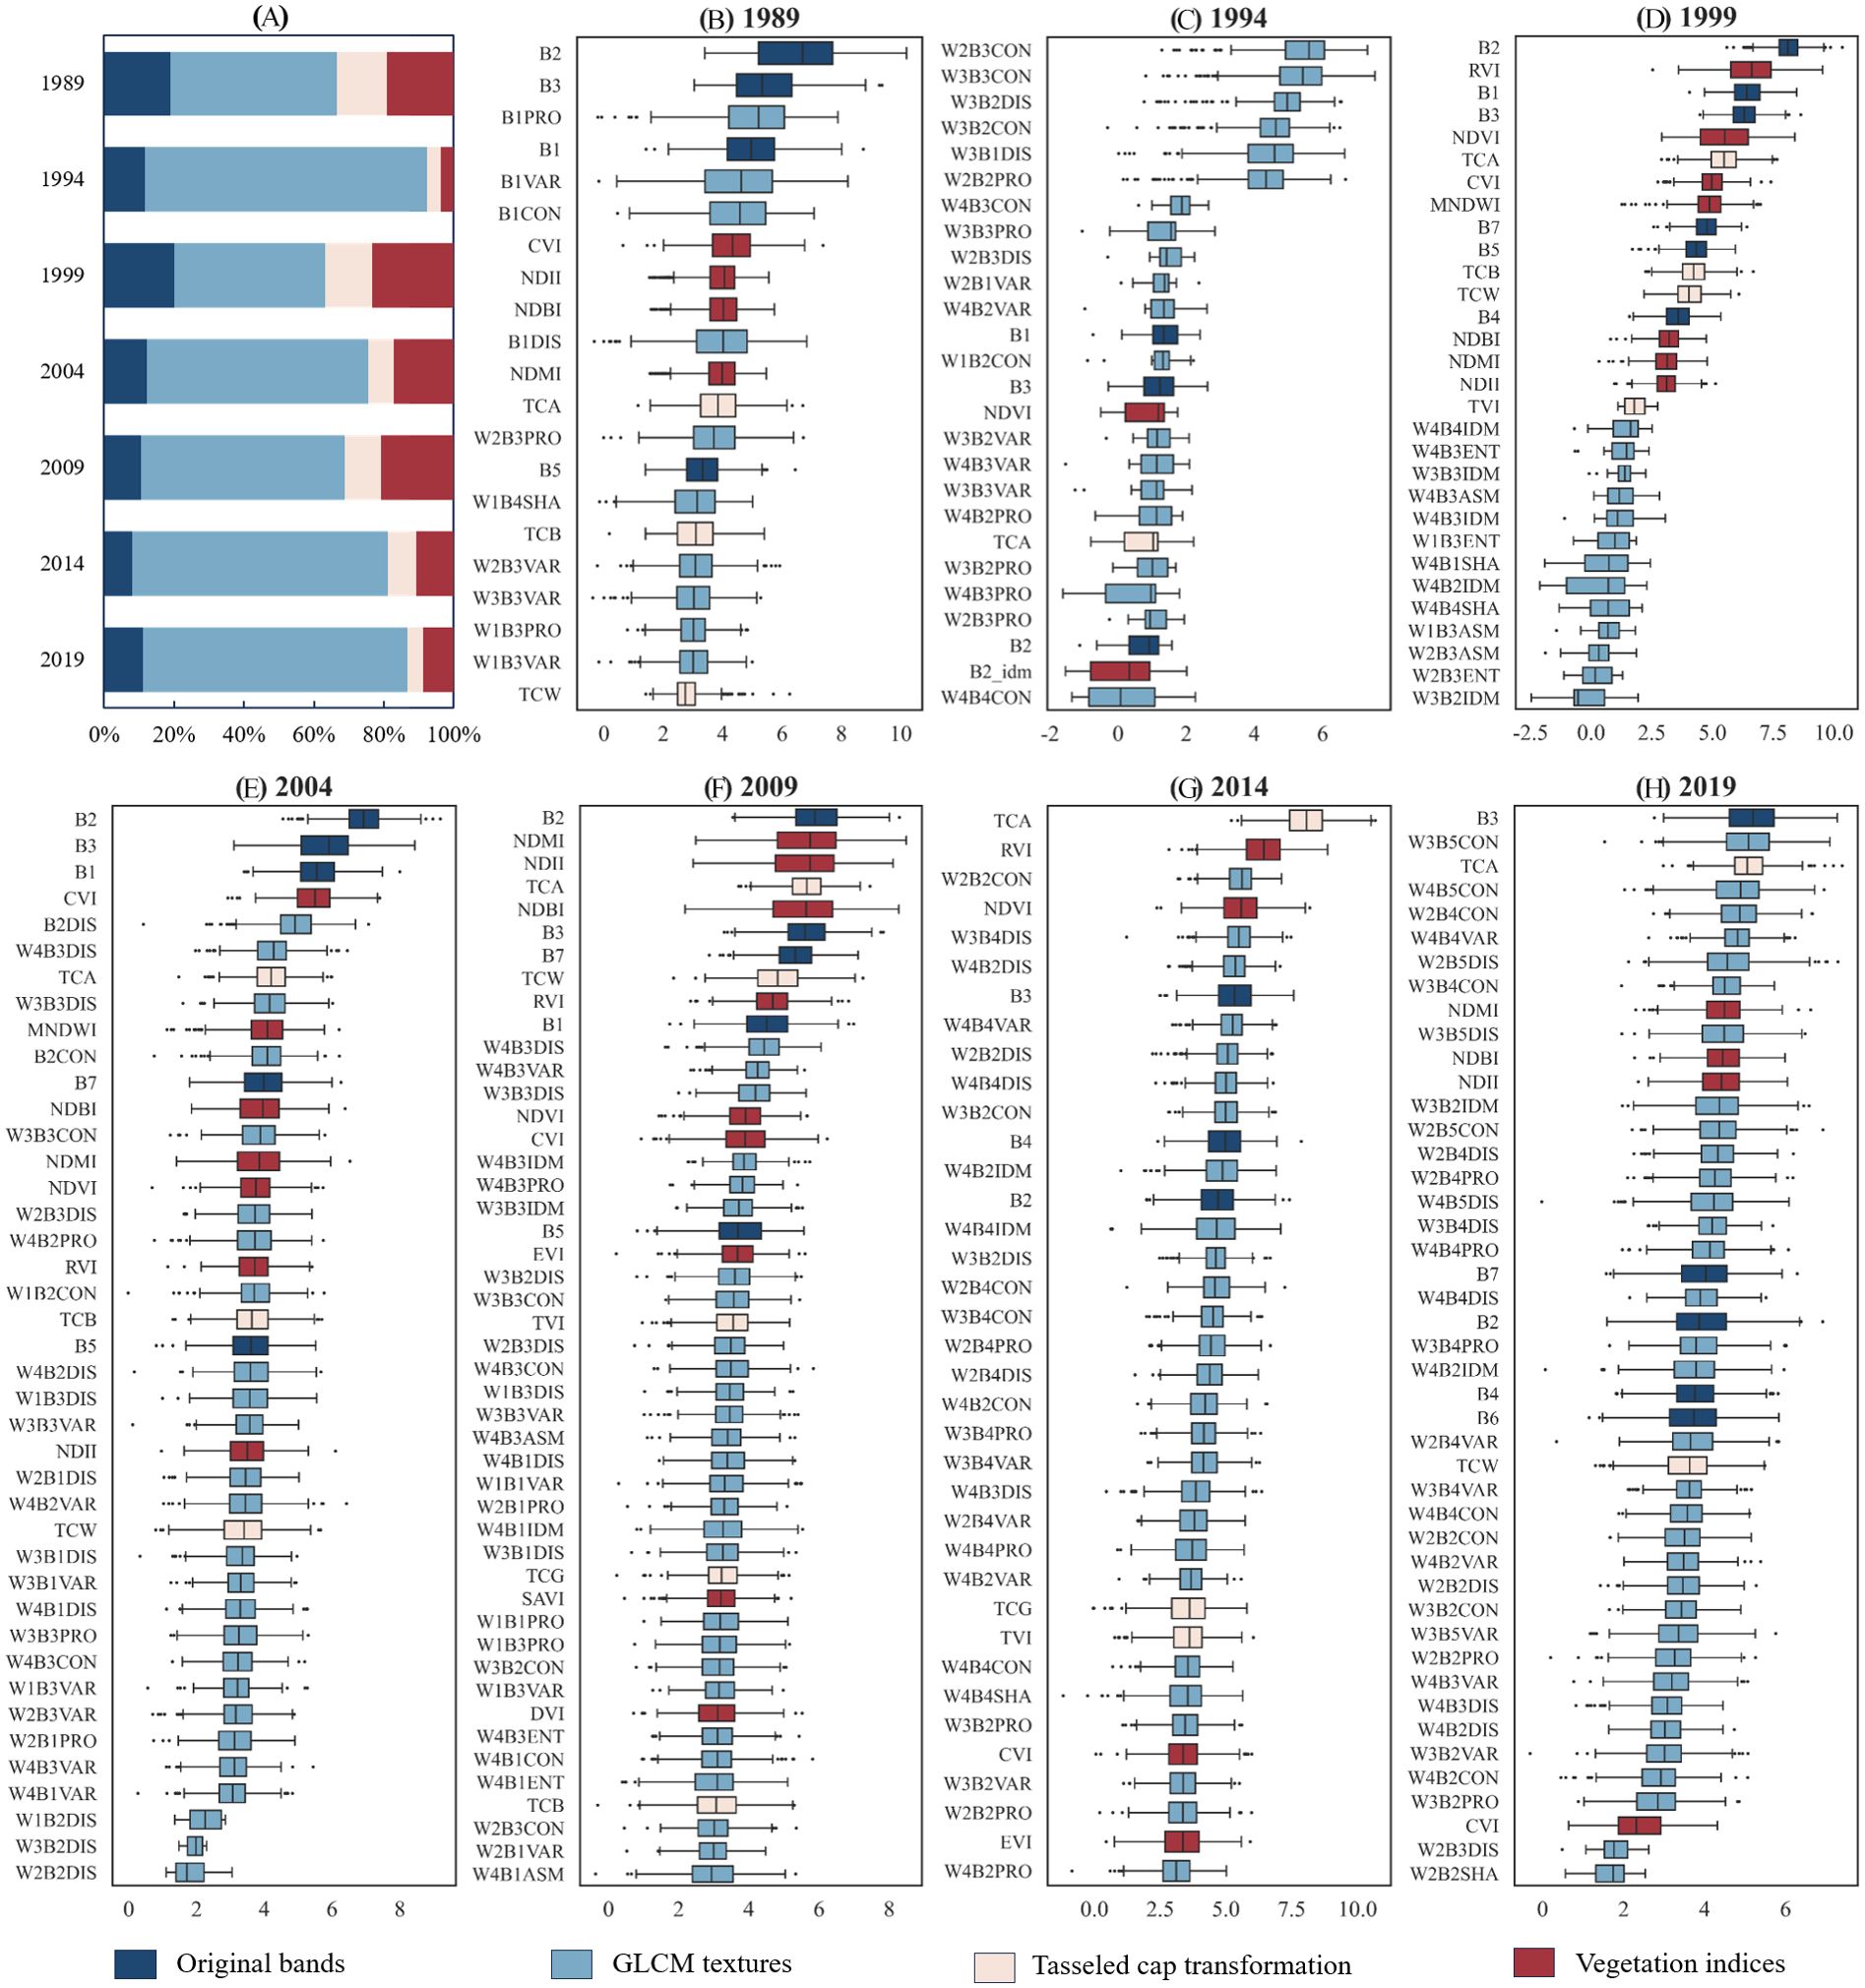
Figure 10. The percentage of the four feature types (A) and the result of variable selection on remote sensing data from seven periods using the Boruta variable selection method: 1989, 1994, 1999, 2004, 2009, 2014, and 2019 (B–H).
5.2 Model comparison analysis
This study applies three machine learning algorithms to remotely sense and quantitatively estimate the forest AGC in Lishui City from 1989 to 2019. The findings indicate that the CatBoost model outperforms the BPNN and RF models in terms of accuracy. BPNN can establish complex non-linear relationships. Nonetheless, the BPNN model’s capacity to generalize is limited, making it susceptible to overfitting (Yu et al., 2023). Moreover, there are many parameters to adjust in BPNN, and the process of selecting appropriate parameters is complex and lengthy (Ren et al., 2022). While the RF model is capable of processing high-dimensional data and exhibits strong resistance to noise, it tends to overfit during the model construction phase (Georganos and Kalogirou, 2022). CatBoost, as a relatively new machine learning algorithm, has strong robustness to poor data quality and can maintain good performance. This algorithm can also automatically normalize or standardize features (Zhai et al., 2023). Simultaneously, CatBoost incorporates an inherent regularization feature, which can mitigate overfitting to some degree and enhance the model’s predictive performance. Therefore, the overall performance of the CatBoost model is superior to the BPNN and RF models. In terms of forest AGC estimation, the CatBoost algorithm can provide more stable and higher accuracy inversion results. This aligns with the findings from Li’s research (Li H, et al., 2023).
5.3 AGC time series variation analysis
Research indicates that from 1989 to 2019, the total forest AGC in Lishui City increased annually. The total forest carbon storage increased from 1.36×10⁷ Mg to 6.61×10⁷ Mg, showing a continuous growth trend. This finding is consistent with the trend identified in Diao’s research (Diao, 2022). However, since Diao’s study centered on better-managed plantation forests, the AGC data obtained from our study are slightly lower than the figures reported by Diao (Diao, 2022). This is because plantation forests typically receive higher levels of management and maintenance. Compared to natural forests, this may lead to superior growing conditions and higher carbon uptake efficiency, resulting in greater carbon storage capacity. After 2000, the forest AGC in Lishui City increased significantly. Firstly, since 1994, Zhejiang Province has implemented projects aimed at cultivating young and middle-aged forests, as well as transforming low-yield and inefficient forests (Huang et al., 2023; Mao et al., 2022). By around 2000, the young forests involved in these projects had matured into middle-aged forests. This resulted in a substantial increase in carbon storage per tree, leading to a notable rise in the overall carbon storage of Lishui City. Secondly, following the invasion of natural secondary pine forests in Zhejiang Province by the pine wood nematode, the province adopted measures to convert coniferous forests into broad-leaved forests (“conifer to broadleaf” conversion) (Diao et al., 2022; Zhang et al., 2007). This gradual transformation significantly increased the proportion of broad-leaved and mixed coniferous-broadleaved forests within the forest landscape, thereby substantially enhancing the forest carbon storage capacity. Thirdly, the plot data used in this study originates from the continuous inventory of forest resources in Zhejiang Province. After 2000, the measured values from the inventory plots showed a significant increase, consequently leading to a corresponding rise in the forest carbon storage calculated through allometric equations. Additionally, the afforestation of high-efficiency and long-term carbon sink forests was promoted to comprehensively protect and restore the mountains, water, forests, fields, lakes, grasses, and sands at the source of the Oujiang River (Gu et al., 2023). Measures such as optimizing forest structure, strengthening the supervision and management of forest land use and harvesting, and controlling pine wilt disease were implemented. These efforts have increased the total forest AGC in Lishui City, expanded the forest area, and improved the ecological benefits of the forest. At the same time, Baishanzu National Geological Park is located in the central and southern parts of Lishui City. The forest AGC in this area is at the forefront of Lishui City and continues to rise. However, due to the impact of natural disasters such as snow disasters and typhoons, carbon storage in some areas of Lishui City has declined annually. In 2019, Typhoon “Lekima” landed in Zhejiang, and the affected forest area in Lishui City reached 610.81 km2 of forests (Zhang et al., 2021). Compared with 2014, the forest AGC on the eastern boundary of Lishui City has significantly decreased, and the growth rate of forest AGC has slowed down.
5.4 Limitations and prospects
This study provides a methodological reference for accurately monitoring forest carbon stocks. Moreover, the results of this study will offer valuable data support for assessing forest quality through monitoring. There are some limitations in this study. Due to some factors not being fully considered, the study possesses certain limitations. Firstly, the latest Landsat 8 remote sensing image has a resolution of 30 meters and contains 7 original bands. However, as research advances, there is an escalating demand for greater image accuracy and the richness of information that images provide. The problems of insufficient resolution of Landsat remote sensing satellite images and single remote sensing information are gradually emerging (Chen et al., 2021; Puliti et al., 2021). Secondly, the cross-validation grid search method for tuning hyperparameters is not well-suited for continuous hyperparameters. For continuous hyperparameters, grid search typically can only explore at fixed intervals. This can result in the optimal solution being overlooked as it might lie between two grid points. Thirdly, this study employs a single machine learning model, which can lead to scenarios where there are errors in the forest AGC estimation results (Zhai et al., 2023). In estimating forest AGC, the CatBoost model tends to underpredict consistently. Additionally, CatBoost is characterized by its complexity, encompassing numerous parameters, and the training procedure is notably time-consuming (Zhang et al., 2022).
In future research, emphasis should be placed on addressing the aforementioned issues. Subsequent studies could attempt to utilize high-resolution images, such as those from Sentinel-2A (Mallinis et al., 2018). Sentinel-2A data features a resolution of 10 meters, encompassing 13 original bands, particularly including the three red edge bands (Zarco-Tejada et al., 2018). These red edge bands are crucial for estimating forest biomass and AGC, significantly contributing to enhanced data accuracy. Secondly, algorithms such as random search and Bayesian optimization have performed well in hyperparameter tuning, achieving relatively precise results (Park et al., 2023). Simultaneously, in future research, a combination of various model types can be employed to estimate forest AGC. Spatial statistical models such as the Geographically Weighted Regression (GWR) model and Co-Kriging (COK) can effectively reflect spatial heterogeneity (Wang et al., 2021). Integrating different types of models can offset the errors caused by individual models, thereby enhancing the accuracy of the estimation results.
6 Conclusion
This study used BPNN, RF, and CatBoost, three machine learning methods, to remotely sense and quantitatively estimate the forest AGC in Lishui City based on Landsat remote sensing images. The results showed:
1. Texture information was a key parameter in constructing the forest AGC model. The Boruta algorithm was used for variable selection. The selection results indicated that texture information had the greatest impact on the construction of the forest AGC model for Lishui City. Among them, the proportions of texture features in the 9×9 and 11×11 windows were the highest.
2. All three machine learning models developed in this research were capable of predicting the forest AGC in Lishui City. Nevertheless, the AGC model built with the CatBoost algorithm demonstrated superior accuracy. When compared to BPNN and RF, the test set accuracy R2 of the CatBoost model saw an increase of 12.16% and 2.5% respectively, while the RMSE experienced a reduction of 25.96% and 3.65% respectively.
3. From 1989 to 2019, the forest AGC in Lishui City increased annually. The forest AGC density increased from 10.03 Mg C ha-1 to 37.32 Mg C ha-1, and the total forest AGC increased from 1.36 × 10⁷ Mg to 6.16 × 10⁷ Mg. This was due to the protection policies and forest transformation policies of Lishui City. However, at the same time, uncontrollable factors such as economic development plans and natural disasters also led to a decrease in forest resources and forest carbon storage in some areas. Therefore, in the future, while accelerating the process of urbanization, there will also be a need to focus on enhancing the conservation of forest resources.
Data availability statement
The data analyzed in this study is subject to the following licenses/restrictions: the data has confidentiality restrictions. Requests to access these datasets should be directed to ZGhxcnNAMTI2LmNvbQ==.
Author contributions
LH: Writing – original draft, Writing – review & editing. ZH: Investigation, Methodology, Supervision, Writing – review & editing. WZ: Investigation, Writing – review & editing. SW: Investigation, Writing – review & editing. XL: Methodology, Supervision, Writing – review & editing. FM: Methodology, Supervision, Writing – review & editing. MS: Data curation, Investigation, Writing – review & editing. YZ: Data curation, Investigation, Writing – review & editing. LL: Data curation, Investigation, Writing – review & editing. JY: Data curation, Investigation, Writing – review & editing. HD: Methodology, Supervision, Writing – review & editing.
Funding
The author(s) declare financial support was received for the research, authorship, and/or publication of this article. This study was supported by the Scientific Research Project of Baishanzu Family Park (2022JBGS02); the National Natural Science Foundation of China (Nos. 32171785, 32201553); and the Leader Goose Project of the Science and Technology Department of Zhejiang Province (No. 2023C02035).
Conflict of interest
The authors declare that the research was conducted in the absence of any commercial or financial relationships that could be construed as a potential conflict of interest.
Publisher’s note
All claims expressed in this article are solely those of the authors and do not necessarily represent those of their affiliated organizations, or those of the publisher, the editors and the reviewers. Any product that may be evaluated in this article, or claim that may be made by its manufacturer, is not guaranteed or endorsed by the publisher.
References
Alvarenga, C. B., Mundim, G. S. M., Santos, E. A., Gallis, R. B. A., Zampiroli, R., Rinaldi, P. C. N., et al. (2023). Normalized difference vegetation index for desiccation evaluation with glyphosate + 2,4-D in magnetized spray solution. Braz. J. Biol. 83, e246579. doi: 10.1590/1519-6984.246579
Aslami, F., Ghorbani, A., Sobhani, B., Esmali, A. (2019). Comprehensive comparison of daily IMERG and GSMaP satellite precipitation products in Ardabil Province, Iran. Int. J. Remote Sens. 40, 3139–3153. doi: 10.1080/01431161.2018.1539274
Bharati, M. H., Liu, J. J., Macgregor, J. F. (2004). Image texture analysis: methods and comparisons. Chemometrics Intelligent Lab. Syst. 72, 57–71. doi: 10.1016/j.chemolab.2004.02.005
Cai, J., Xu, K., Zhu, Y., Hu, F., Li, L. (2020). Prediction and analysis of net ecosystem carbon exchange based on gradient boosting regression and random forest. Appl. Energy 262, 114566. doi: 10.1016/j.apenergy.2020.114566
Chen, N., Tsendbazar, N.-E., Hamunyela, E., Verbesselt, J., Herold, M. (2021). Sub-annual tropical forest disturbance monitoring using harmonized Landsat and Sentinel-2 data. Int. J. Appl. Earth Obs. Geoinf. 102, 102386. doi: 10.1016/j.jag.2021.102386
Chrysafis, I., Mallinis, G., Tsakiri, M., Patias, P. (2019). Evaluation of single-date and multi-seasonal spatial and spectral information of Sentinel-2 imagery to assess growing stock volume of a Mediterranean forest. Int. J. Appl. Earth Obs. Geoinf. 77, 1–14. doi: 10.1016/j.jag.2018.12.004
Diao, J. (2022). Simulation and prediction of carbon dynamics in plantation forests considering forest disturbance and restoration (Nanjing, Jiangsu Province, China: Nanjing Forestry University).
Diao, J., Liu, J., Zhu, Z., Wei, X., Li, M. (2022). Active forest management accelerates carbon storage in plantation forests in Lishui, southern China. For. Ecosyst. 9, 100004. doi: 10.1016/j.fecs.2022.100004
Dong, L., Du, H., Han, N., Li, X., He, S. (2020a). Application of convolutional neural network on lei bamboo above-ground-biomass (AGB) estimation using worldview-2. Remote Sens. 12, 958. doi: 10.3390/rs12060958
Dong, L., Du, H., Mao, F., Han, N., Li, X., Zhou, G., et al. (2020b). Very high resolution remote sensing imagery classification using a fusion of random forest and deep learning technique—Subtropical area for example. IEEE J. Sel. Top. Appl. Earth Observations Remote Sens. 13, 113–128. doi: 10.1109/JSTARS.4609443
Du, H., Zhou, G., Ge, H., Fan, W., Xu, X., Fan, W., et al. (2012). Satellite-based carbon stock estimation for bamboo forest with a non-linear partial least square regression technique. Int. J. Remote Sens. 33, 1917–1933. doi: 10.1080/01431161.2011.603379
Du, H., Zhou, G., Ge, H., Zhao, X., Cui, L. (2008). A method to extract remote sensing information of bamboo forest based on TM data. J. Northeast Forestry Univ. 11 (5), 1458–1471. doi: 10.13759/j.cnki.dlxb.2008.03.027
Elbeltagi, A., Pande, C. B., Kumar, M., Tolche, A. D., Singh, S. K., Kumar, A., et al. (2023). Prediction of meteorological drought and standardized precipitation index based on the random forest (RF), random tree (RT), and Gaussian process regression (GPR) models. Environ. Sci. pollut. Res. 30, 43183–43202. doi: 10.1007/s11356-023-25221-3
Eshraghian, J. K., Ward, M., Neftci, E. O., Wang, X., Lenz, G., Dwivedi, G., et al. (2023). Training spiking neural networks using lessons from deep learning. Proc. IEEE 111, 1016–1054. doi: 10.1109/JPROC.2023.3308088
Georganos, S., Kalogirou, S. (2022). A forest of forests: A spatially weighted and computationally efficient formulation of geographical random forests. ISPRS Int. J. Geo-Information 11, 471. doi: 10.3390/ijgi11090471
Gomez, C., Gumersindo, M. (2017). Joint use of Sentinel-1 and Sentinel-2 for land cover classification : a machine learning approach. (Lund Sweden: Lund University).
Gorelick, N., Hancher, M., Dixon, M., Ilyushchenko, S., Thau, D., Moore, R. (2017). Google Earth Engine: Planetary-scale geospatial analysis for everyone. Remote Sens. Environ. 202, 18–27. doi: 10.1016/j.rse.2017.06.031
Gu, T.-w., Peng, J., Jiang, H., He, C.-f. (2023). Watershed-based territorial ecological restoration: theoretical cognition and key planning issues. J. Nat. Res. 38 (10), 2464–2474. doi: 10.31497/zrzyxb.20231003
Habibi, A., Delavar, M. R., Sadeghian, M. S., Nazari, B., Pirasteh, S. (2023). A hybrid of ensemble machine learning models with RFE and Boruta wrapper-based algorithms for flash flood susceptibility assessment. Int. J. Appl. Earth Observation Geoinformation 122, 103401. doi: 10.1016/j.jag.2023.103401
Hadi, Korhonen, L., Hovi, A., Rönnholm, P., Rautiainen, M. (2016). The accuracy of large-area forest canopy cover estimation using Landsat in boreal region. Int. J. Appl. Earth Observation Geoinformation 53, 118–127. doi: 10.1016/j.jag.2016.08.009
Hajihosseinlou, M., Maghsoudi, A., Ghezelbash, R. (2023). A novel scheme for mapping of MVT-type pb–zn prospectivity: lightGBM, a highly efficient gradient boosting decision tree machine learning algorithm. Natural Resour. Res. 32, 2417–2438. doi: 10.1007/s11053-023-10249-6
Huang, L., Jiang, J., Huang, W., Ye, H., Zhao, J., Ma, H., et al. (2019). Sentinel-2 imaging and BP neural networks combined for wheat stripe rust monitoring. Trans. Chin. Soc. Agric. Eng. 35, 178–185. doi: 10.11975/j.issn.1002-6819.2019.17.022
Huang, Z., Du, H., Li, X., Zhang, M., Mao, F., Zhu, D., et al. (2020). Spatiotemporal LUCC simulation under different RCP scenarios based on the BPNN_CA_Markov model: A case study of bamboo forest in Anji county. IJGI 9, 718. doi: 10.3390/ijgi9120718
Huang, Z., Li, X., Du, H., Zou, W., Zhou, G., Mao, F., et al. (2023). An algorithm of forest age estimation based on the forest disturbance and recovery detection. IEEE Trans. Geosci. Remote Sens. 61, 1–18. doi: 10.1109/TGRS.2023.3322163
Iqbal, N., Mumtaz, R., Shafi, U., Zaidi, S. M. H. (2021). Gray level co-occurrence matrix (GLCM) texture based crop classification using low altitude remote sensing platforms. PeerJ Comput. Sci. 7, e536. doi: 10.7717/peerj-cs.536
Jamei, M., Ali, M., Karbasi, M., Sharma, E., Mozhdeh, J., Chu, X., et al. (2023). A high dimensional features-based cascaded forward neural network coupled with MVMD and Boruta-GBDT for multi-step ahead forecasting of surface soil moisture. Eng. Appl. Artif. Intell. 120, 105895. doi: 10.1016/j.engappai.2023.105895
Joo, C., Park, H., Lim, J., Cho, H., Kim, J. (2023). Machine learning-based heat deflection temperature prediction and effect analysis in polypropylene composites using catboost and shapley additive explanations. Eng. Appl. Artif. Intell. 126, 106873. doi: 10.1016/j.engappai.2023.106873
Li, B., Wang, H., Qin, M., Zhang, P. (2017). A comparative study of the relationship between NDVI, NDMI and surface temperature. Prog. Geogr. 36, 585–596. doi: 10.18306/dlkxiz.2017.05.006
Li, H., Zhang, G., Zhong, Q., Xing, L., Du, H. (2023). Prediction of urban forest aboveground carbon using machine learning based on landsat 8 and sentinel-2: A case study of Shanghai, China. Remote Sens. 15, 284. doi: 10.3390/rs15010284
Li, K., Xu, E. (2021). High-accuracy continuous mapping of surface water dynamics using automatic update of training samples and temporal consistency modification based on Google Earth Engine: A case study from Huizhou, China. ISPRS J. Photogrammetry Remote Sens. 179, 66–80. doi: 10.1016/j.isprsjprs.2021.07.009
Li, M., Wu, Y., Bao, Y., Liu, B., Petropoulos, G. P. (2022). Near-surface NO2 concentration estimation by random forest modeling and sentinel-5P and ancillary data. Remote Sens. 14, 3612. doi: 10.3390/rs14153612
Li, X., Zhang, G., Tan, S., Yang, Z., Wu, X. (2023). Forest fire smoke detection research based on the random forest algorithm and sub-pixel mapping method. Forests 14, 485. doi: 10.3390/f14030485
Li, Y., Han, N., Li, X., Du, H., Mao, F., Cui, L., et al. (2018). Spatiotemporal estimation of bamboo forest aboveground carbon storage based on landsat data in Zhejiang, China. Remote Sens. 10, 898. doi: 10.3390/rs10060898
Liu, T., Mao, F., Li, X., Xing, L., Dong, L., Zheng, J., et al. (2019). Simulation of spatial and temporal dynamics of aboveground carbon stocks in bamboo forests in Zhejiang Province and the factors affecting them. Chin. J. Appl. Ecol. 30, 1743–1753. doi: 10.13287/j.1001-9332.201905.035
Liu, J., Wu, F. (2017). Forest carbon sequestration subsidy and carbon tax as part of China’s forestry policies. Forests 8, 58. doi: 10.3390/f8030058
Liu, Y., Yue, Q., Wang, Q., Yu, J., Zheng, Y., Yao, X., et al. (2021). A framework for actual evapotranspiration assessment and projection based on meteorological, vegetation and hydrological remote sensing products. Remote Sens. 13, 3643. doi: 10.3390/rs13183643
Lu, D. (2006). The potential and challenge of remote sensing-based biomass estimation. Int. J. Remote Sens. 27, 1297–1328. doi: 10.1080/01431160500486732
Ma, T., Hu, Y., Wang, J., Beckline, M., Pang, D., Chen, L., et al. (2023). A novel vegetation index approach using sentinel-2 data and random forest algorithm for estimating forest stock volume in the helan mountains, Ningxia, China. Remote Sens. 15, 1853. doi: 10.3390/rs15071853
Macintyre, P., van Niekerk, A., Mucina, L. (2020). Efficacy of multi-season Sentinel-2 imagery for compositional vegetation classification. Int. J. Appl. Earth Obs. Geoinf. 85, 101980. doi: 10.1016/j.jag.2019.101980
Mallinis, G., Mitsopoulos, I., Chrysafi, I. (2018). Evaluating and comparing Sentinel 2A and Landsat-8 Operational Land Imager (OLI) spectral indices for estimating fire severity in a Mediterranean pine ecosystem of Greece. GISci. Remote Sens. 55, 1–18. doi: 10.1080/15481603.2017.1354803
Mao, F., Du, H., Zhou, G., Zheng, J., Li, X., Xu, Y., et al. (2022). Simulated net ecosystem productivity of subtropical forests and its response to climate change in Zhejiang Province, China. Sci. Total Environ. 838, 155993. doi: 10.1016/j.scitotenv.2022.155993
Maudhi, R., Arhatin, R. E., Gaol, J. L. (2023). The mapping of the vulnerability coastal area in Pangandaran District by the coastal vulnerability index (CVI) approach. IOP Conf. Ser.: Earth Environ. Sci. 1260, 012051. doi: 10.1088/1755-1315/1260/1/012051
Mngadi, M., Odindi, J., Mutanga, O. (2021). The utility of sentinel-2 spectral data in quantifying above-ground carbon stock in an urban reforested landscape. Remote Sens. 13, 4281. doi: 10.3390/rs13214281
Mohammadpour, P., Viegas, D. X., Viegas, C. (2022). Vegetation mapping with random forest using sentinel 2 and GLCM texture feature—A case study for Lousã Region, Portugal. Remote Sens. 14, 4585. doi: 10.3390/rs14184585
Mostafiz, C., Chang, N.-B. (2018). Tasseled cap transformation for assessing hurricane landfall impact on a coastal watershed. Int. J. Appl. Earth Obs. Geoinf. 73, 736–745. doi: 10.1016/j.jag.2018.08.015
Muhaimin, M., Fitriani, D., Adyatma, S., Arisanty, D. (2022). mapping build-up area density using normalized difference built-up index (ndbi) and urban index (ui) wetland in the city banjarmasin. IOP Conf. Ser.: Earth Environ. Sci. 1089, 012036. doi: 10.1088/1755-1315/1089/1/012036
Park, M., Ladosz, P., Kim, J., Oh, H. (2023). Receding horizon-based infotaxis with random sampling for source search and estimation in complex environments. IEEE Trans. Aerosp. Electron. Syst. 59, 591–609. doi: 10.1109/TAES.2022.3184923
Prasad, R., Deo, R. C., Li, Y., Maraseni, T. (2019). Weekly soil moisture forecasting with multivariate sequential, ensemble empirical mode decomposition and Boruta-random forest hybridizer algorithm approach. CATENA 177, 149–166. doi: 10.1016/j.catena.2019.02.012
Puliti, S., Breidenbach, J., Schumacher, J., Hauglin, M., Klingenberg, T. F., Astrup, R. (2021). Above-ground biomass change estimation using national forest inventory data with Sentinel-2 and Landsat. Remote Sens. Environ. 265, 112644. doi: 10.1016/j.rse.2021.112644
Qiu, M., Gan, S., Zhao, L. (2022). An analytical study of index methods for watershed extraction in the Erhai Sea using Sentinel-2 imagery. Urban Geotechnical Invest. Surveying 2022 (06), 117–122.
Ren, D., Wang, Y., Wang, G., Liu, L. (2022). Fusion of CMONOC and ERA5 PWV products based on backpropagation neural network. Remote Sens. 14, 3750. doi: 10.3390/rs14153750
Ribal, A., Young, I. R. (2020). Global calibration and error estimation of altimeter, scatterometer, and radiometer wind speed using triple collocation. Remote Sens. 12, 1997. doi: 10.3390/rs12121997
Samadianfard, S., Kargar, K., Shadkani, S., Hashemi, S., Abbaspour, A., Safari, M. J. S. (2022). Hybrid models for suspended sediment prediction: optimized random forest and multi-layer perceptron through genetic algorithm and stochastic gradient descent methods. Neural Comput. Applic 34, 3033–3051. doi: 10.1007/s00521-021-06550-1
Sharaf El Din, E. (2020). A novel approach for surface water quality modelling based on Landsat-8 tasselled cap transformation. Int. J. Remote Sens. 41, 7186–7201. doi: 10.1080/01431161.2020.1754497
Shen, L., Jiang, C.-J., Liu, G.-J. (2016). Satellite objects extraction and classification based on similarity measure. IEEE Trans. Syst. Man Cybern Syst. 46, 1148–1154. doi: 10.1109/TSMC.2015.2468192
Sriwongsitanon, N., Gao, H., Savenije, H. H. G., Maekan, E., Saengsawang, S., Thianpopirug, S. (2016). Comparing the Normalized Difference Infrared Index (NDII) with root zone storage in a lumped conceptual model. Hydrol. Earth System Sci. 20, 3361–3377. doi: 10.5194/hess-20-3361-2016
Stovall, A. E. L., Vorster, A. G., Anderson, R. S., Evangelista, P. H., Shugart, H. H. (2017). Non-destructive aboveground biomass estimation of coniferous trees using terrestrial LiDAR. Remote Sens. Environ. 200, 31–42. doi: 10.1016/j.rse.2017.08.013
Su, Y., Guo, Q., Xue, B., Hu, T., Alvarez, O., Tao, S., et al. (2016). Spatial distribution of forest aboveground biomass in China: Estimation through combination of spaceborne lidar, optical imagery, and forest inventory data. Remote Sens. Environ. 173, 187–199. doi: 10.1016/j.rse.2015.12.002
Su, H., Shen, W., Wang, J., Ali, A., Li, M. (2020). Machine learning and geostatistical approaches for estimating aboveground biomass in Chinese subtropical forests. For. Ecosyst. 7, 1–20. doi: 10.1186/s40663-020-00276-7
Tan, Y., Sun, J.-Y., Zhang, B., Chen, M., Liu, Y., Liu, X.-D. (2019). Sensitivity of a ratio vegetation index derived from hyperspectral remote sensing to the brown planthopper stress on rice plants. Sensors 19, 375. doi: 10.3390/s19020375
Wan, Y., Ma, A., Zhong, Y., Hu, X., Zhang, L. (2020). Multiobjective hyperspectral feature selection based on discrete sine cosine algorithm. IEEE Trans. Geosci. Remote Sens. 58, 3601–3618. doi: 10.1109/TGRS.36
Wang, L., Diao, C., Xian, G., Yin, D., Lu, Y., Zou, S., et al. (2020). A summary of the special issue on remote sensing of land change science with Google earth engine. Remote Sens. Environ. 248, 112002. doi: 10.1016/j.rse.2020.112002
Wang, J., Du, H., Li, X., Mao, F., Kang, F. (2021). Remote sensing estimation of bamboo forest aboveground biomass based on geographically weighted regression. Remote Sens. 13, 2962. doi: 10.3390/rs13152962
Wang, V., Gao, J. (2019). Importance of structural and spectral parameters in modelling the aboveground carbon stock of urban vegetation. Int. J. Appl. Earth Observation Geoinformation 78, 93–101. doi: 10.1016/j.jag.2019.01.017
Wu, C., Shen, H., Shen, A., Deng, J., Wang, K. (2016). Comparison of machine-learning methods for above-ground biomass estimation based on Landsat imagery. J. Appl. Remote Sens. 10, 035010. doi: 10.1117/1.JRS.10.035010
Xie, Z., Phinn, S. R., Game, E. T., Pannell, D. J., Hobbs, R. J., Briggs, P. R., et al. (2020). Using landsat observations, (1988-2017) and Google Earth Engine to detect vegetation cover changes in rangelands - A first step towards identifying degraded lands for conservation. Remote Sens. Environ. 241, 111737. doi: 10.1016/j.rse.2020.111737
Xing, N., Huang, W., Xie, Q., Shi, Y., Ye, H., Dong, Y., et al. (2019). A transformed triangular vegetation index for estimating winter wheat leaf area index. Remote Sens. 12, 16. doi: 10.3390/rs12010016
Xiong, B., Chen, R., An, L., Zhang, Q., Xia, Z. (2021). Telecoupling urbanization and mountain areas deforestation between 2000 and 2020: Evidence from Zhejiang Province, China. Land Degradation Dev. 32, 4727–4739. doi: 10.1002/ldr.4074
Xiong, B., Chen, R., Xia, Z., Ye, C., Anker, Y. (2020). Large-scale mountainous deforestation in the 21st century of Zhejiang province, China. Land Degradation Dev. 31, 1761–1774. doi: 10.1002/ldr.3563
Xu, Z., Huang, X., Lin, L., Wang, Q., Liu, J., Yu, K., et al. (2018). BP neural networks and random forest models to detect damage by Dendrolimus punctatus Walker(corresponding author). J. Forestry Res. 2020, 107–121. doi: 10.1007/s11676-018-0832-1
Xu, X., Zhou, G., Du, H., Dong, D., Cui, R., Zhou, Y., et al. (2011). Estimation of aboveground biomass of thunder bamboo forest based on Landsat TM data. Scientia Silvae Sinicae 47, 1–6.
Yang, Y., Shi, Y., Sun, W., Chang, J., Zhu, J., Chen, L., et al. (2022). Characteristics of carbon sinks in terrestrial ecosystems and their contribution to carbon neutrality in China and globally. SCIENTIA Sin. Vitae 52, 534–574. doi: 10.1007/s11427-021-2045-5
Yu, S., Bu, H., Hu, X., Dong, W., Zhang, L. (2023). Establishment and accuracy evaluation of cotton leaf chlorophyll content prediction model combined with hyperspectral image and feature variable selection. Agronomy 13, 2120. doi: 10.3390/agronomy13082120
Zarco-Tejada, P. J., Hornero, A., Hernandez-Clemente, R., Beck, P. S. A. (2018). Understanding the temporal dimension of the red-edge spectral region for forest decline detection using high-resolution hyperspectral and Sentinel-2a imagery. ISPRS-J. Photogramm. Remote Sens. 137, 134–148. doi: 10.1016/j.isprsjprs.2018.01.017
Zhai, W., Li, C., Fei, S., Liu, Y., Ding, F., Cheng, Q., et al. (2023). CatBoost algorithm for estimating maize above-ground biomass using unmanned aerial vehicle-based multi-source sensor data and SPAD values. Comput. Electron. Agric. 214, 108306. doi: 10.1016/j.compag.2023.108306
Zhang, Y., Chang, Q., Chen, Y., Liu, Y., Jiang, D., Zhang, Z. (2023). Hyperspectral estimation of chlorophyll content in apple tree leaf based on feature band selection and the catBoost model. Agronomy 13, 2075. doi: 10.3390/agronomy13082075
Zhang, X., Chen, G., Cai, L., Jiao, H., Hua, J., Luo, X., et al. (2021). Impact assessments of typhoon lekima on forest damages in subtropical China using machine learning methods and landsat 8 OLI imagery. Sustainability 13, 4893. doi: 10.3390/su13094893
Zhang, M., Du, H., Zhou, G., Li, X., He, S. (2019). Estimating forest aboveground carbon storage in hang-Jia-Hu using landsat TM/OLI data and random forest model. Forests 10, 1004. doi: 10.3390/f10111004
Zhang, J., Ge, Y., Chang, J., Jiang, B., Jiang, H., Peng, C., et al. (2007). Carbon storage by ecological service forests in Zhejiang Province, subtropical China. For. Ecol. Manage. 245, 64–75. doi: 10.1016/j.foreco.2007.03.042
Zhang, C., Liu, Y., Tie, N. (2023). Forest land resource information acquisition with sentinel-2 image utilizing support vector machine, K-nearest neighbor, random forest, decision trees and multi-layer perceptron. Forests 14, 254. doi: 10.3390/f14020254
Zhang, Y., Ma, J., Liang, S., Li, X., Li, M. (2020). An evaluation of eight machine learning regression algorithms for forest aboveground biomass estimation from multiple satellite data products. Remote Sens. 12, 4015. doi: 10.3390/rs12244015
Zhang, Y., Ma, J., Liang, S., Li, X., Liu, J. (2022). A stacking ensemble algorithm for improving the biases of forest aboveground biomass estimations from multiple remotely sensed datasets. GISci. Remote Sens. 59, 234–249. doi: 10.1080/15481603.2021.2023842
Zhen, Z., Chen, S., Yin, T., Chavanon, E., Lauret, N., Guilleux, J., et al. (2021). Using the negative soil adjustment factor of soil adjusted vegetation index (SAVI) to resist saturation effects and estimate leaf area index (LAI) in dense vegetation areas. Sensors 21, 2115. doi: 10.3390/s21062115
Keywords: subtropical forest, AGC, machine learning, remote sensing, Lishui City
Citation: Huang L, Huang Z, Zhou W, Wu S, Li X, Mao F, Song M, Zhao Y, Lv L, Yu J and Du H (2024) Landsat-based spatiotemporal estimation of subtropical forest aboveground carbon storage using machine learning algorithms with hyperparameter tuning. Front. Plant Sci. 15:1421567. doi: 10.3389/fpls.2024.1421567
Received: 22 April 2024; Accepted: 08 August 2024;
Published: 29 August 2024.
Edited by:
Luca Brillante, California State University, Fresno, United StatesCopyright © 2024 Huang, Huang, Zhou, Wu, Li, Mao, Song, Zhao, Lv, Yu and Du. This is an open-access article distributed under the terms of the Creative Commons Attribution License (CC BY). The use, distribution or reproduction in other forums is permitted, provided the original author(s) and the copyright owner(s) are credited and that the original publication in this journal is cited, in accordance with accepted academic practice. No use, distribution or reproduction is permitted which does not comply with these terms.
*Correspondence: Huaqiang Du, ZGhxcnNAMTI2LmNvbQ==