 Manish K. Vishwakarma1*
 Pradeep K. Bhati1
 Uttam Kumar2
 Ravi P. Singh3
 Sundeep Kumar4
 Velu Govindan3
 Gurvinder Singh Mavi5
 Karthikeyan Thiyagarajan1Narain Dhar1
 Arun K. Joshi1,3*
- 1Borlaug Institute for South Asia (BISA), New Delhi, India
- 2Astralyan Agro (OPC) Pvt. Ltd, Shamli, Uttar Pradesh, India
- 3International Maize and Wheat Improvement Center (CIMMYT), Texcoco, Mexico
- 4Indian Council of Agricultural Research (ICAR)-National Bureau of Plant Genetic Resources, New Delhi, India
- 5Department of Plant breeding and genetics, Punjab Agricultural University, Ludhiana, Punjab, India
Bread wheat (T. aestivum) is one of the world’s most widely consumed cereals. Since micronutrient deficiencies are becoming more common among people who primarily depend upon cereal-based diets, a need for better-quality wheat varieties has been felt. An association panel of 154 T. aestivum lines was evaluated for the following quality traits: grain appearance (GA) score, grain hardness (GH), phenol reaction (PR) score, protein percent, sodium dodecyl sulfate (SDS) sedimentation value, and test weight (TWt). In addition, the panel was also phenotyped for grain yield and related traits such as days to heading, days to maturity, plant height, and thousand kernel weight for the year 2017–18 at the Borlaug Institute for South Asia (BISA) Ludhiana and Jabalpur sites. We performed a genome-wide association analysis on this panel using 18,351 genotyping-by-sequencing (GBS) markers to find marker-trait associations for quality and grain yield-related traits. We detected 55 single nucleotide polymorphism (SNP) marker trait associations (MTAs) for quality-related traits on chromosomes 7B (10), 1A (9), 2A (8), 3B (6), 2B (5), 7A (4), and 1B (3), with 3A, 4A, and 6D, having two and the rest, 4B, 5A, 5B, and 1D, having one each. Additionally, 20 SNP MTAs were detected for yield-related traits based on a field experiment conducted in Ludhiana on 7D (4) and 4D (3) chromosomes, while 44 SNP MTAs were reported for Jabalpur on chromosomes 2D (6), 7A (5), 2A (4), and 4A (4). Utilizing these loci in marker-assisted selection will benefit from further validation studies for these loci to improve hexaploid wheat for better yield and grain quality.
Introduction
Wheat (Triticum spp.) is a major staple crop in many countries, including India, and accounts for nearly 30% of global cereal consumption (van Ittersum et al., 2016). Although this main food crop is consumed chiefly as unleavened flatbread (chapati), 15% of the produced yield is used in baking for other bakery items such as bread and cookies. Wheat’s value-added characteristics are critical for home consumption and the baking industry (Cappelli and Cini, 2021). Wheat quality is currently described using a variety of metrics, and a single quality parameter can effectively distinguish wheat genotypes of variable qualities (Guzmán et al., 2019). Grain appearance, test weight, grain protein, grain hardness, sedimentation, gluten content, gluten index, iron, zinc, phenol score, and flour extraction are used to categorize wheat varieties suitable for specific end-products such as bread, biscuits, and chapatis. Wheat varieties have been divided into distinct product-specific genotypes based on these qualities in different nations.
The GlutoPeak test is used to forecast the baking qualities of wheat flour, and the association of GlutoPeak indices with several conventional quality measures such as grain hardness (GH), sodium dodecyl sulfate sedimentation value (SDSS value), farinograph, and alveograph has been investigated (Mecitoğlu Güçbilmez et al., 2019). The SDSS test is a quick test to forecast baking quality and gluten strength in wheat (Carter et al., 1999). Low alveograph stability, strength, P/L ratio, protein content, and high alveograph extensibility and biscuit diameter relate to soft endosperm genes in wheat, which are responsible for enhanced biscuit-making capacity. Ma and Baik (2018) reported that soft wheat varieties with low protein content (7.9–9.7%), low sedimentation volume (20.0–32.0 mL), and low damaged starch contents (1.9–3.4%) are desirable for good biscuit-making quality. Various physio-chemical parameters such as grain appearance (GA) score, grain hardness (GH), test weight (TWt), thousand kernel weight (TKW), protein, gluten content and index, SDSS value, phenol test, carotenoids, and diastatic activity are known to have a role in chapati-making quality (Kumar S. et al., 2018). In addition to this, for making a good loaf of bread the combination of elastic gluten with grain protein content of 13% is a prerequisite (Shuey, 1960). Wheat cultivars that have sedimentation values between 35 and 50 cc are typically used to make chapatis, while higher values than that are utilized to make bread (Mecitoğlu Güçbilmez et al., 2019). While GH and diastase activity play a clear role, it was found that phenol score may not be a good indicator of chapatti quality.
Although quality traits are important, bread wheat’s grain yield (GY) potential and stress tolerance must be increased to ensure global food security and fulfill future demands. Amid mounting breeding efforts, the low annual rate of GY increase (0.9%) (Ray et al., 2013), the growing menaces of heat and drought stresses on wheat yields (Zampieri et al., 2017), patterns of GY stagnation (Ray et al., 2012), invite the complementation of traditional breeding approaches with genomic tools that can hasten the development of high-yielding and stress-resilient wheat varieties. Wheat GY, however, has remained a challenging trait for genomic breeding due to its quantitative genetic regulation, including numerous loci with minor effects, a shortage of knowledge about the genetic basis of GY, unstable GY quantitative trait loci (QTL) reported in a different environment, epistatic effects, low heritability of GY across environments, and genotype × environment interactions (Jiang et al., 2017). Therefore, to effectively use genetic resources in breeding programs to increase wheat grain production, we must improve our knowledge of the genetic architecture of grain yield and other related attributes.
The molecular basis of complex traits is frequently studied via QTL mapping based on linkage analysis. However, mapping populations such as recombination-inbred lines (RILs) take a long time and much money to create. Furthermore, linkage mapping is based on recent recombination events, resulting in low mapping resolution, and only two alleles from the parents are considered. A genome-wide association study (GWAS) based on linkage disequilibrium (LD) represents an alternate strategy for examining connections between genotype and phenotype with the introduction of high-throughput sequencing technology (Gupta et al., 2020).
A GWAS has various advantages compared with linkage mapping, including a greater resolution and the ability to detect more variation without requiring mapping populations. GWAS has been successfully performed to explore various traits in a range of crops. In wheat, GWAS has been used to investigate grain yield, agronomic traits (Liu et al., 2017), and disease resistance (Liu et al., 2017; Riaz et al., 2018. However, only some studies have focused on quality-related traits in wheat under environmental stresses and grain yield-related traits. Hence, the main goal of this study was to use the mixed-linear model for GWAS of value-added traits and grain yield-related traits using 154 advanced breeding lines of genomic selection nurseries grown at the Ludhiana and Jabalpur Borlaug Institute for South Asia (BISA) sites. We also analyzed the phenotypic distributions of the traits and the statistical correlations between these traits. In addition, we used the KnetMiner to explore the homologous genes in other species with the reported marker trait associations (MTAs) in this study. Based on the available literature, this is the first GWAS using genotyping-by-sequencing (GBS) to examine the stability of value-added quality traits in spring wheat. Our findings provide an understanding of the genetic pathways underlying quality-related attributes.
Materials and methods
Plant material and phenotyping of grain yield and related traits
The panel of 154 selected advanced breeding lines of wheat (Supplementary Table 1) was evaluated in field trials at the BISA research farms, Jabalpur (JBP) (23°14′00.6N and 80°04′40.7E) and Ludhiana (LDH) (30°59′28.74N and 75°44′10.87E). The alpha-lattice experimental design was followed in two replications. The plot size was 5.016 m2, and the lines were sown in six rows, 22 cm apart and 3.8 m in length. The field trials were managed by standard agronomic practices recommended for the locations. Fertilizer was applied with the proportions of 150 N/60 P/40 K kg/ha at Ludhiana and 120 N/60 P/40 K kg/ha at Jabalpur as per the wheat growing zone recommendations.
During the 2017–18 crop season, the lines were phenotyped and evaluated across the location for five traits such as days to heading (DTHD) and days to maturity (DAYSMT). DTHD and DAYSMT were measured as the total number of days from sowing to when 75% of plants had either spike emergence or matured, respectively. Plant height (PH) was recorded from the plant’s base to the tip of the spike (excluding awns). Thousand kernel weight (TKW) and grain yield (GY) were measured per plot.
Estimation of value-added quality traits
Quality traits data was recorded at the Wheat Quality Laboratory, Punjab Agricultural University (PAU), Ludhiana, Punjab for six grain quality parameters including protein percent, TWt, GA, PR score,SDSS value, and GH.
Using an Infratec 1226 Cold Grain Analyzer and the AACCI standard procedure, protein percentage was measured non-destructively at 12% moisture basis. The instrument uses near-infrared light transmitted through the grains. The results are displayed as % protein content as per calibration.
TWt, also known as hectoliter mass, measures the volume of grain per unit. Hectoliter weight was determined using a Tecator model FP Auto 680 by taking wheat grains in a 100 mL measuring cylinder; the sample was weighed, and the hectoliter weight was expressed as kg ha−1 (AACC, 2000).
Subsequently, we measured the GA score through direct visualization based on the grain’s size, shape, color, and luster. It was evaluated subjectively out of a maximum score of 10. The phenol reaction score was evaluated by soaking about 100 grains overnight in 1% phenol solution. The grains were assessed for the extent of darkness out of a score of 10, half an hour after draining off the phenol solution.
The SDSS test was used since it is a simple, small-scale method that estimates wheat gluten strength quickly. The SDSS test was carried out according to Nakamura et al., (2012). The SDS-lactic acid solution was prepared by dissolving 20 g of SDS in 1 L of distilled water and adding 20 mL of stock diluted lactic acid solution (one-part lactic acid plus eight parts distilled water volume by volume). Six grams of the whole meal sample were placed in a stoppered, graduated cylinder with 50 mL of water. The samples were mixed, hydrated for 2 min, remixed, and then hydrated for another 2 min. SDS–lactic acid solution (50 mL) was added to each sample, and the contents were mixed by inverting the tubes four times. The contents were allowed to settle, and the sedimentation height (mL) was recorded. If the value was more than 60 mL, it was considered as strong gluten wheat; from 30 to 60, it was medium strong, and if less than 30 mL, it was weak.
The GH was measured using the grain hardness tester supplied by M/S Ogawa Seiki Co. Ltd., Japan, by crushing randomly taken ten grains one by one, considering the weight, diameter, and moisture of the grain. The mean force (kg) required to crush the grain was recorded (Heo and Sherman, 2013).
Statistical analysis
The experimental design in each environment was an alpha-lattice with two replications per environment/location. The best linear unbiased prediction (BLUP) values were obtained through META-R v6.03 (Alvarado et al., 2020). All effects are considered random for calculating the BLUP and broad-sense heritability. The correlation matrix between the BLUP values of studied traits was computed and visualized with the ‘corrplot’ package in the R software.
Genotyping, linkage disequilibrium
Genomic DNA of the lines was isolated from 15 days-old seedling leaves using a standard cetyltrimethyl ammonium bromide (CTAB) method (Doyle and Doyle, 1987). DNA concentration was quantified using the Quant-iT PicoGreen dsDNA assay (Life Technologies Inc., NY) and normalized to 20 ng/μl. The panel of 154 lines was genotyped using the GBS method (Poland et al., 2012). The single nucleotide polymorphisms (SNPs) were called using the TASSEL (Trait Analysis by association Evolution and Linkage) version V5.3.1 GBS pipeline (Glaubitz et al., 2014). Marker polymorphisms were found using a minor allele frequency of 0.01, which resulted 13,082,477 GBS tags. Among these, 68.98% were aligned to RefSeq v1.0 using Bowtie2 (Langmead and Salzberg, 2012) with assembly of Chinese Spring (IWGSC, 2018). After filtering the tags as described by Juliana et al. (2019), we found 89,863 SNPs. Then, these markers were filtered in panel, and those with more than 60% missing data, a minor allele frequency of less than 5%, or heterozygosity of less than 10% were eliminated. Similarly, the markers and lines with a total missing data percentage of more than 50% were eliminated and 18,351 polymorphic markers were used for all the subsequent analyses. LD analysis was performed using TASSEL V5.3.1 software (Bradbury et al., 2007) using the markers with known positions from the 18,351 polymorphic markers. The LD was estimated as squared allele frequency correlations (R2). P-values <0.01 for each pair of loci and Bonferroni correction <0.2 were considered significant.
Genome-wide association scans for grain quality and agronomic traits
Six grain quality parameters (GA Score, GH, PR Score, Protein %, SDSS Value, and TWt), and five agronomic traits (DTHD, DAYSMT, PH, GRYLD, and TKW) from both the locations (Ludhiana and Jabalpur) were considered for a GWAS using 18351 polymorphic GBS markers. GWAS analysis was performed with TASSEL V5.3.1 software (Bradbury et al., 2007) using a Mixed Linear Model (MLM). Population structure was used as a fixed effect in the model’s fitting, while kinship was used as a random effect that was considered by the first two principal components (Patterson et al., 2006; Price et al., 2006).
Detection of marker trait associations for quality traits
Associations of GA Score, GH, PR Score, Protein %, SDSS Value, and TWt, with candidate loci were identified. We obtained the p-values to determine the significance of the association of traits with the markers and the percent variance explained (PVE), which predicted the extent of the QTL effects. The Manhattan plots for grain quality traits were generated in the GWAS, indicating the most significant associations with a −log10 (P value) greater than 3, along with the Bonferroni correction threshold (we used the Bonferroni correction for multiple testing with an α level of 0.01 for the quality traits and a relaxed α level of 0.20 for all the other datasets) and quantile-quantile (Q-Q) plots.
Prediction of candidate gene and modeling of homology
The ENSEMBL Wheat database and the International Wheat Genome Sequencing Consortium (IWGSC) RefSeq v1.1 annotations were used to find candidate genes related to the stable loci discovered in this investigation. To find candidate genes, regions within the 1 Mbp window of the localized stable MTA were also chosen. For the gene network analysis and homology finding, an open-source online software, Knetminer, was used at: https://knetminer.org (accessed on Oct 28, 2022) (Hassani-Pak et al., 2021).
Results
Phenotypic variation and heritability grain quality traits and agronomic traits
A range of variation for all grain quality traits was reported in the advanced breeding lines of the spring wheat panel. The Protein % ranged from 8.50 to 12.35, with a mean of 10.35 and a CV of 8.61%. Similarly, TWt, GA Score, PR Score, SDSS values, and GH ranged from 66.50 to 78.00, 4.0 to 6.0, 2.20 to 5.50, 29.0 to 50.0, and 7.70 to 12.0 respectively (Table 1).
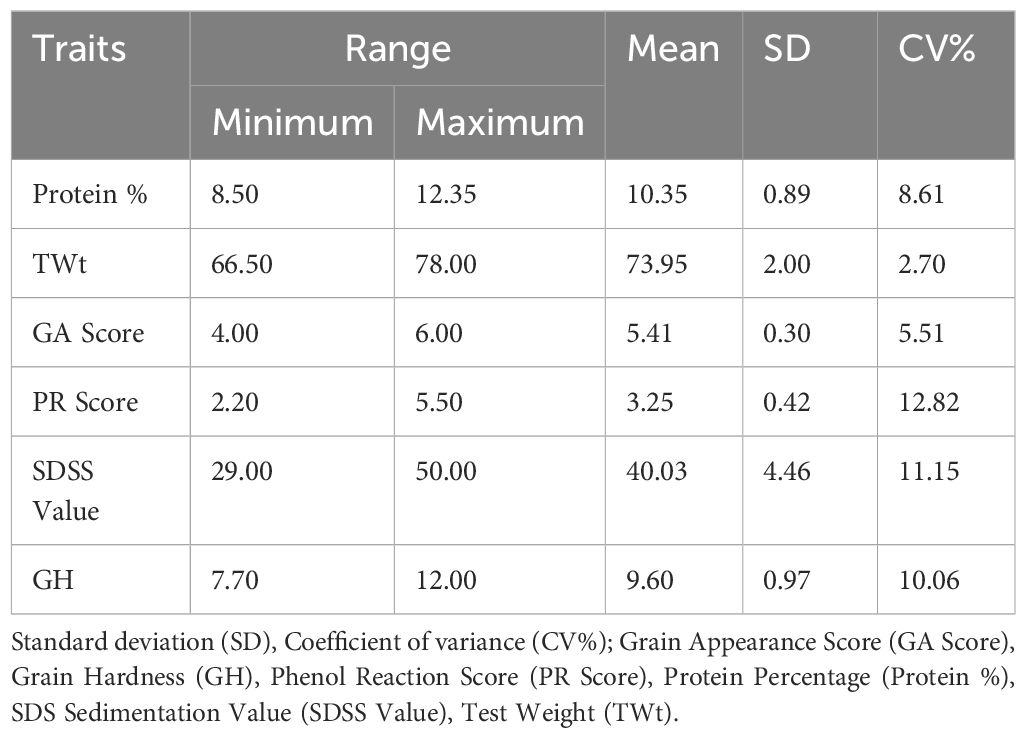
Table 1. Descriptive statistics of various quality traits of wheat.
Concerning the quantitative traits analysis, a range of variation was observed for GRYLD and other yield related traits at both the locations (Ludhiana and Jabalpur). The broad-sense heritability for the traits under consideration ranged from 0.40 to 0.91 (Table 2). The highest broad-sense heritability (0.91) was observed for DTHD at Jabalpur, while the same for GRYLD at Ludhiana and Jabalpur were recorded as 0.69 and 0.60, respectively. Similarly, nearly stable and high heritability were observed for TKW at Ludhiana (0.82) and Jabalpur (0.74). An excellent yielding line (GID: 6692345; SOKOLL/3/PASTOR//HXL7573/2*BAU/4/SOKOLL/WBLL1) with a yield of >7.0 t/h was observed for the Ludhiana location, while there were three lines (GID: 6681676, QUAIU#1/SUP152; GID: 6681793, ND643/2*WBLL1/4/WHEAR/KUKUNA/3/C80.1/3*BATAVIA//2*WBLL1 and GID: 6681817 SUP152/QUAIU#2) were >7.8 t/h for the Jabalpur location. In grain quality traits, the lines with GID 6568703 (PRL/2*PASTOR/4/CHOIX/STAR/3/HE1/3*CNO79//2*SERI*2/5/CHONTE), 6692267 (PASTOR//HXL7573/2*BAU/3/ATTILA/3*BCN/4/SOKOLL/3/PASTOR//HXL7573/2*BAU), and 6692345 (SOKOLL/3/PASTOR//HXL7573/2*BAU/4/SOKOLL/WBLL1) had 12.35, 12.32, and 12.28 protein %, respectively. The lines (GID: 6684333, SWSR22T.B./2*BLOUK #1//WBLL1*2/KURUKU) had high test weight value (78) while three lines (GID: 6568578, KIRITATI/4/2*SERI.1B*2/3/KAUZ*2/BOW//KAUZ/5/2*SUP152, GID: 6568703, PRL/2*PASTOR/4/CHOIX/STAR/3/HE1/3*CNO79//2*SERI*2/5/CHONTE and GID: 6684107, MUTUS*2/HARIL #1) had high grain hardness of 11.8, 11.8, and 12.0, respectively.
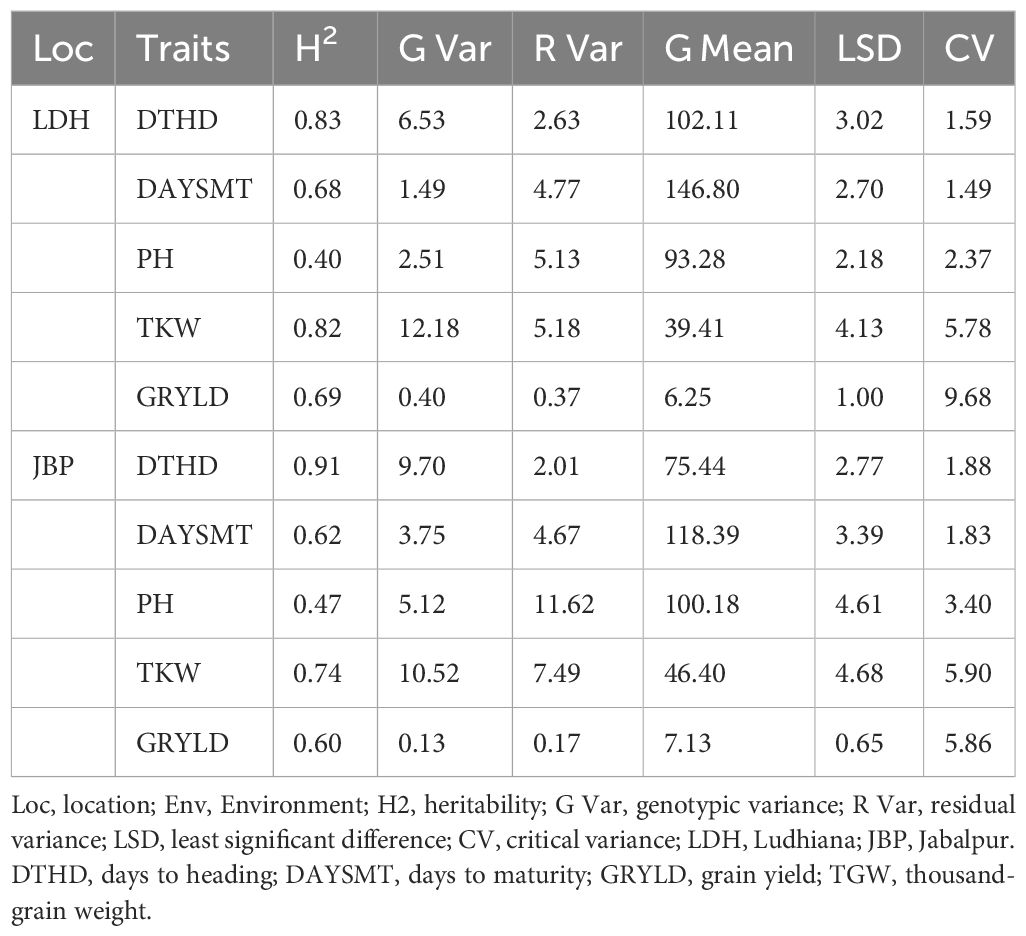
Table 2. Variability analysis of various yield-related agronomic traits at two locations.
Correlations between agronomic and quality traits of both locations
Location-wise correlation among the agronomic traits was analyzed. For Ludhiana and Jabalpur, the suffixes ‘L’ and ‘J’, respectively, have been added to the trait names. GRYLD_L showed a positive correlation with TKW_L, DTHD_L, PH_L, and DAYSMT_L with values of 0.39, 0.17, 0.12, and 0.10, respectively (Figure 1; Supplementary Table 2). TKW_L showed a positive correlation with PH_L with the value of 0.11 and a negative correlation with DAYSMT_L and DTHD_L with -0.18 and -0.09 values, respectively. GRYLD_J showed a positive (0.04) correlation with DAYSMT_J and TKW_J, while it had a negative correlation with DTHD_J, and PH_J with -0.21 and -0.13, respectively. TKW_J showed a positive correlation with PH_J with a value of 0.30 and a negative correlation with DAYSMT_J and DTHD_J with -0.14 and -0.10 values, respectively.

Figure 1. Correlation of agronomic traits in wheat lines. Phenotypic correlations between days to heading (DTHD), days to maturity (DAYSMT), plant height (PH), grain yield (GRYLD), thousand kernel weight (TKW), Ludhiana (_L), Jabalpur (_J), grain appearance score (GA Score), grain hardness (GH), phenol reaction score (PR Score), protein percentage (Protein %), SDS sedimentation value (SDSS Value), and test weight (TWt). The upper and lower 95% confidence intervals are included in parenthesis below the correlation value.
The correlation between the quality traits revealed that there were positive correlations between all the traits. For example, Protein % has a high correlation with the TWt, GA score, PR score, SDSS value, and GH with the values of 0.62, 0.46, 0.39, 0.59, and 0.36, respectively. Similarly, TWt had a high correlation with the GS score, PR score, SDSS value, and GH with the values of 0.92, 0.45, 0.64, and 0.66, respectively. We observed a positive correlation between SDSS value and HG (0.51). A similar pattern was observed for the GA score with the PR score (0.39), SDSS value (0.56), and GH (0.66) (Supplementary Table 1). There was a significant correlation between the GA score and PR score, SDSS value, and GH with values of 0.39, 0.56, and 0.66, respectively. In addition, the PR score correlated well with SDSS and GH with values of 0.33 and 0.34. In addition, SDSS value had a high correlation with GH with a value of 0.51.
The correlation between GRYLD and quality traits across sites (Ludhiana and Jabalpur) elucidated that, GRYLD_L has positive correlation with Protein%, TWt, GA Score, SDSS Value, and GH (0.11, 0.15, 0.23, 0.23 and 0.17, respectively) and showed a negative correlation with the PR Score (-0.18). Furthermore, GRYLD_J had very low correlation with GA Score (0.02) and PR Score (0.12).
Marker densities and population structure
Marker densities of all 18351 GBS markers utilized, aligned to RefSeq v1.0, showed that the telomeric and sub-telomeric regions had higher densities than the centromeric regions in all chromosomes (Figure 2). The B-genome has the highest number of markers (48.8%), followed by the A-genome (36.3%) and the D-genome (13.6%). The SNPs in high linkage disequilibrium with one another are reflected by the red area and are consequently inherited together (Figure 3). Population structure analysis of all the 154 lines in this study indicated moderate population structure, high diversity, and relatedness between the lines across the locations. The first two principal components plot, PC1 and PC2, explain 6.9% and 5.4% of the variation, respectively (Figure 4).
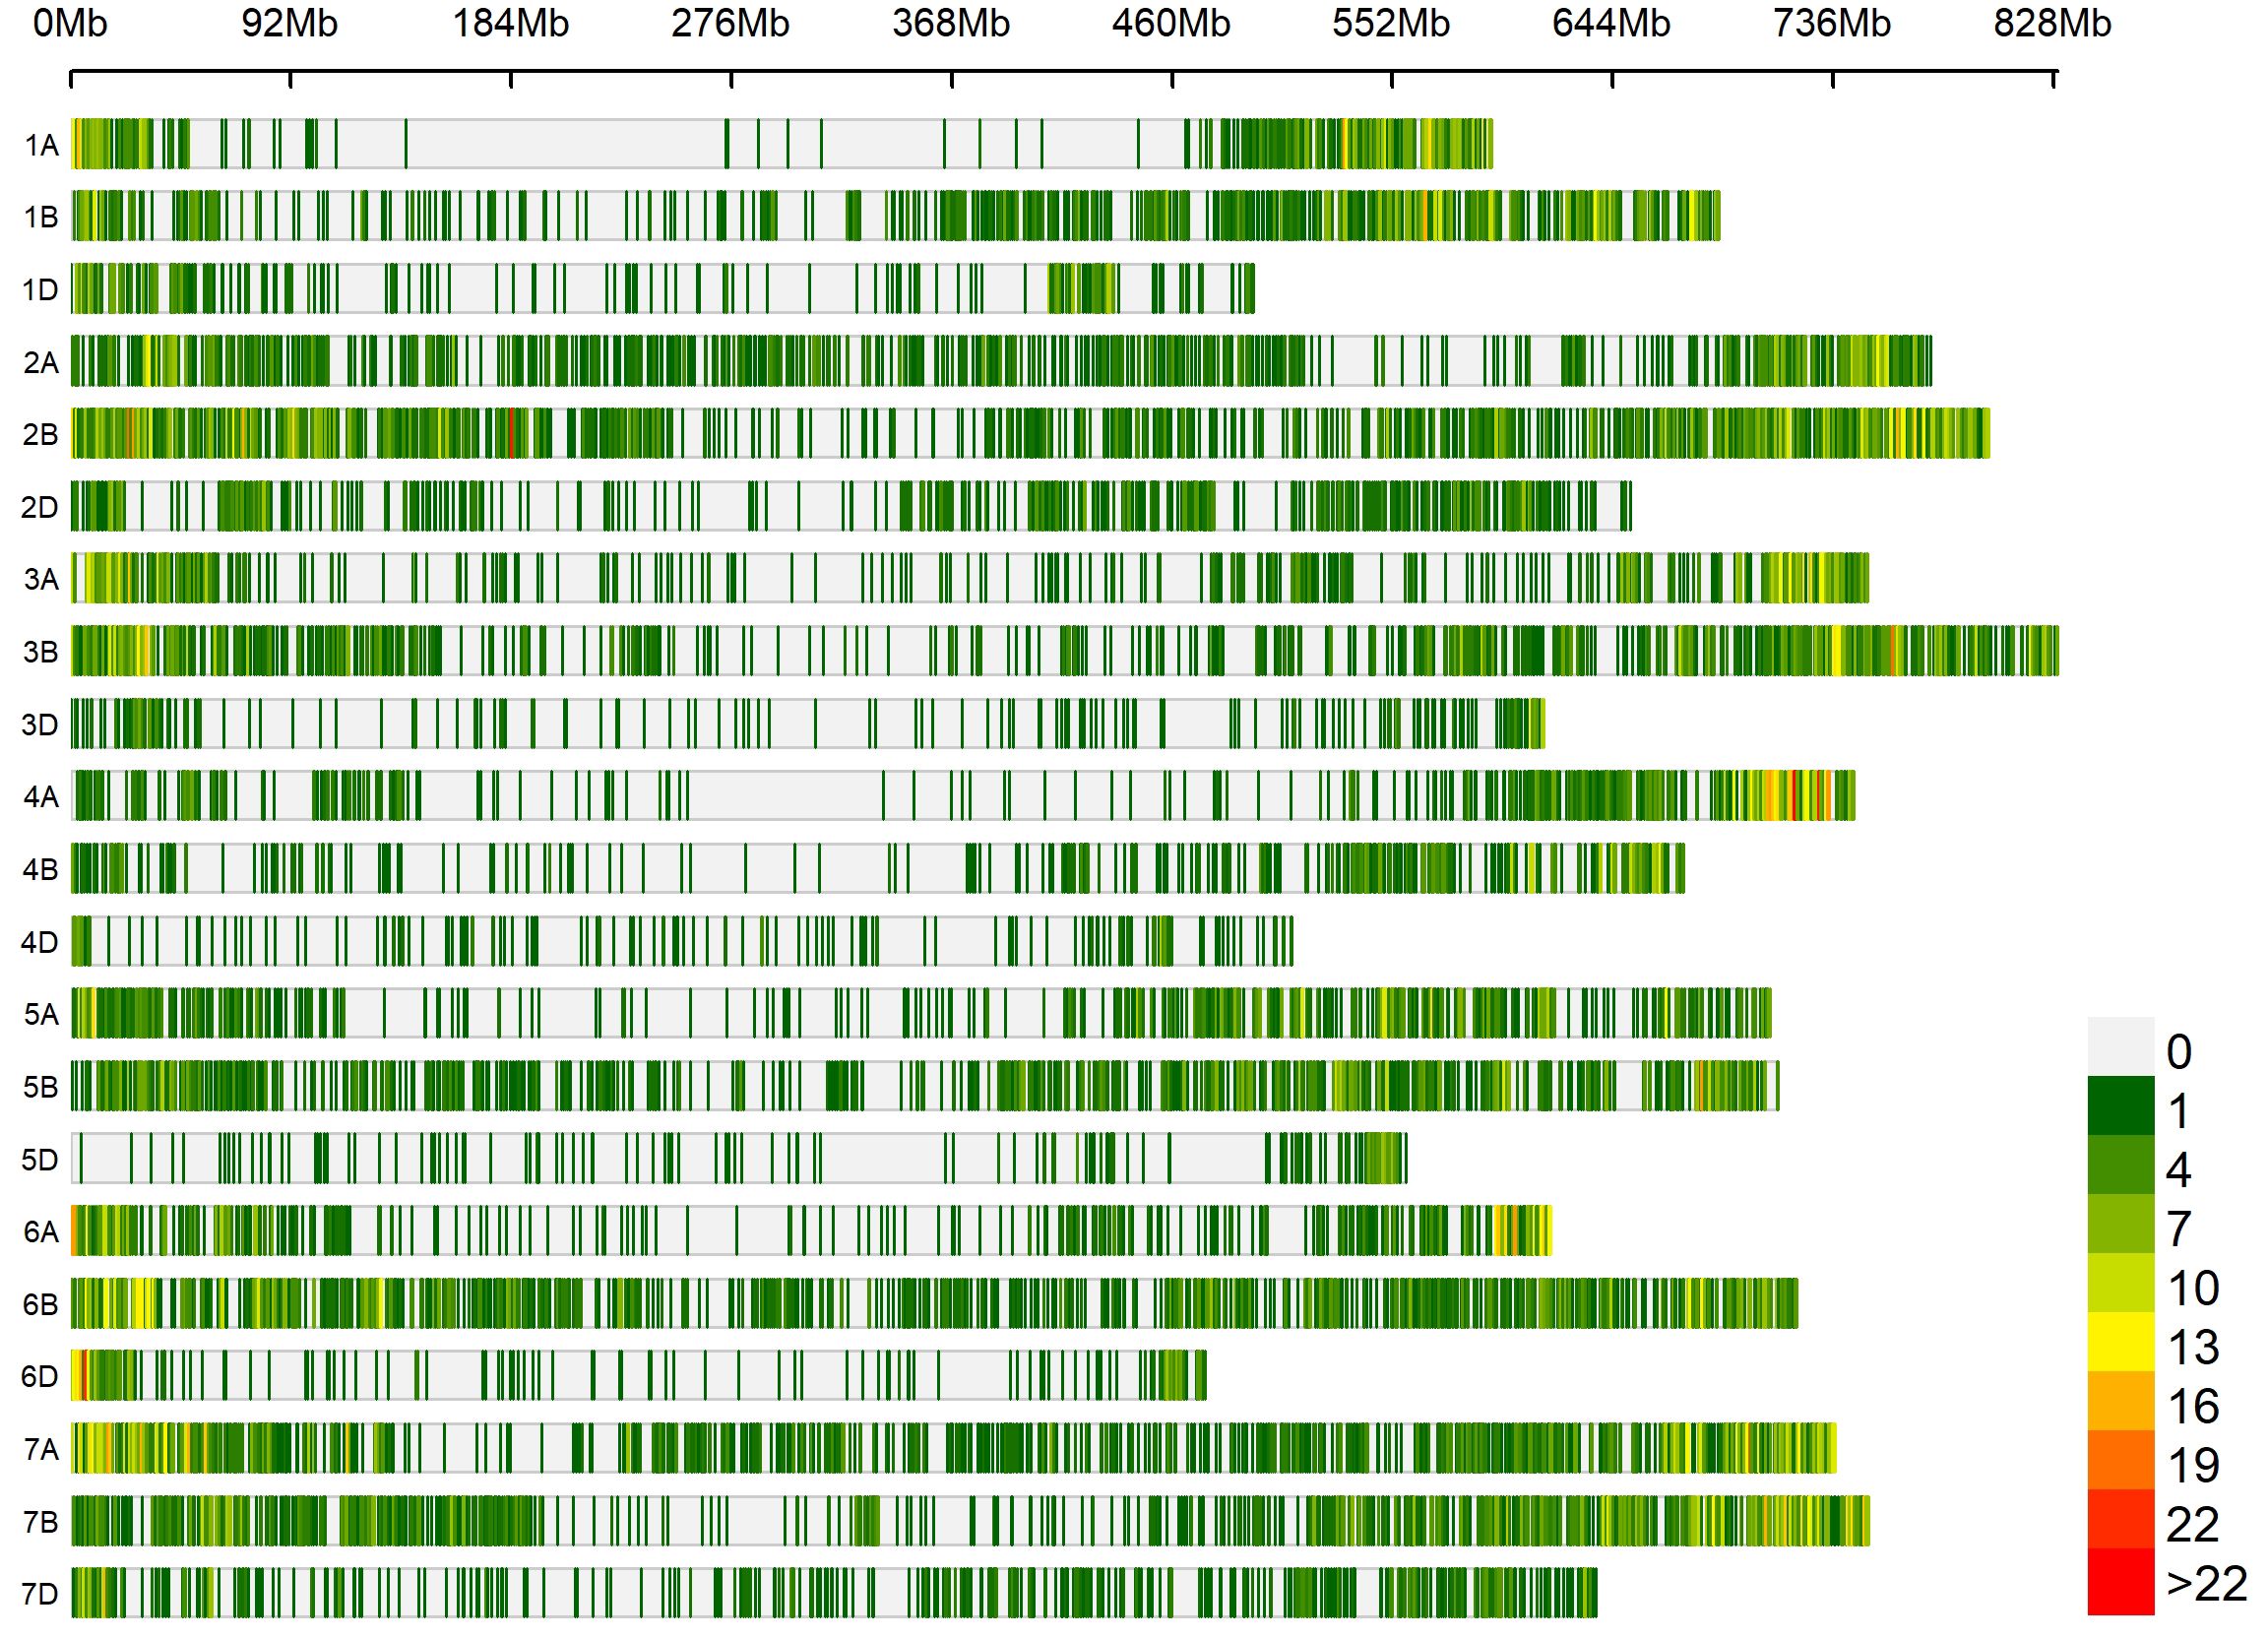
Figure 2. Densities of 18,351 genotyping-by-sequencing markers in the reference bread wheat genome (RefSeq v1.0). The color key with marker densities indicates the number of markers within a window size of 1 Mb.
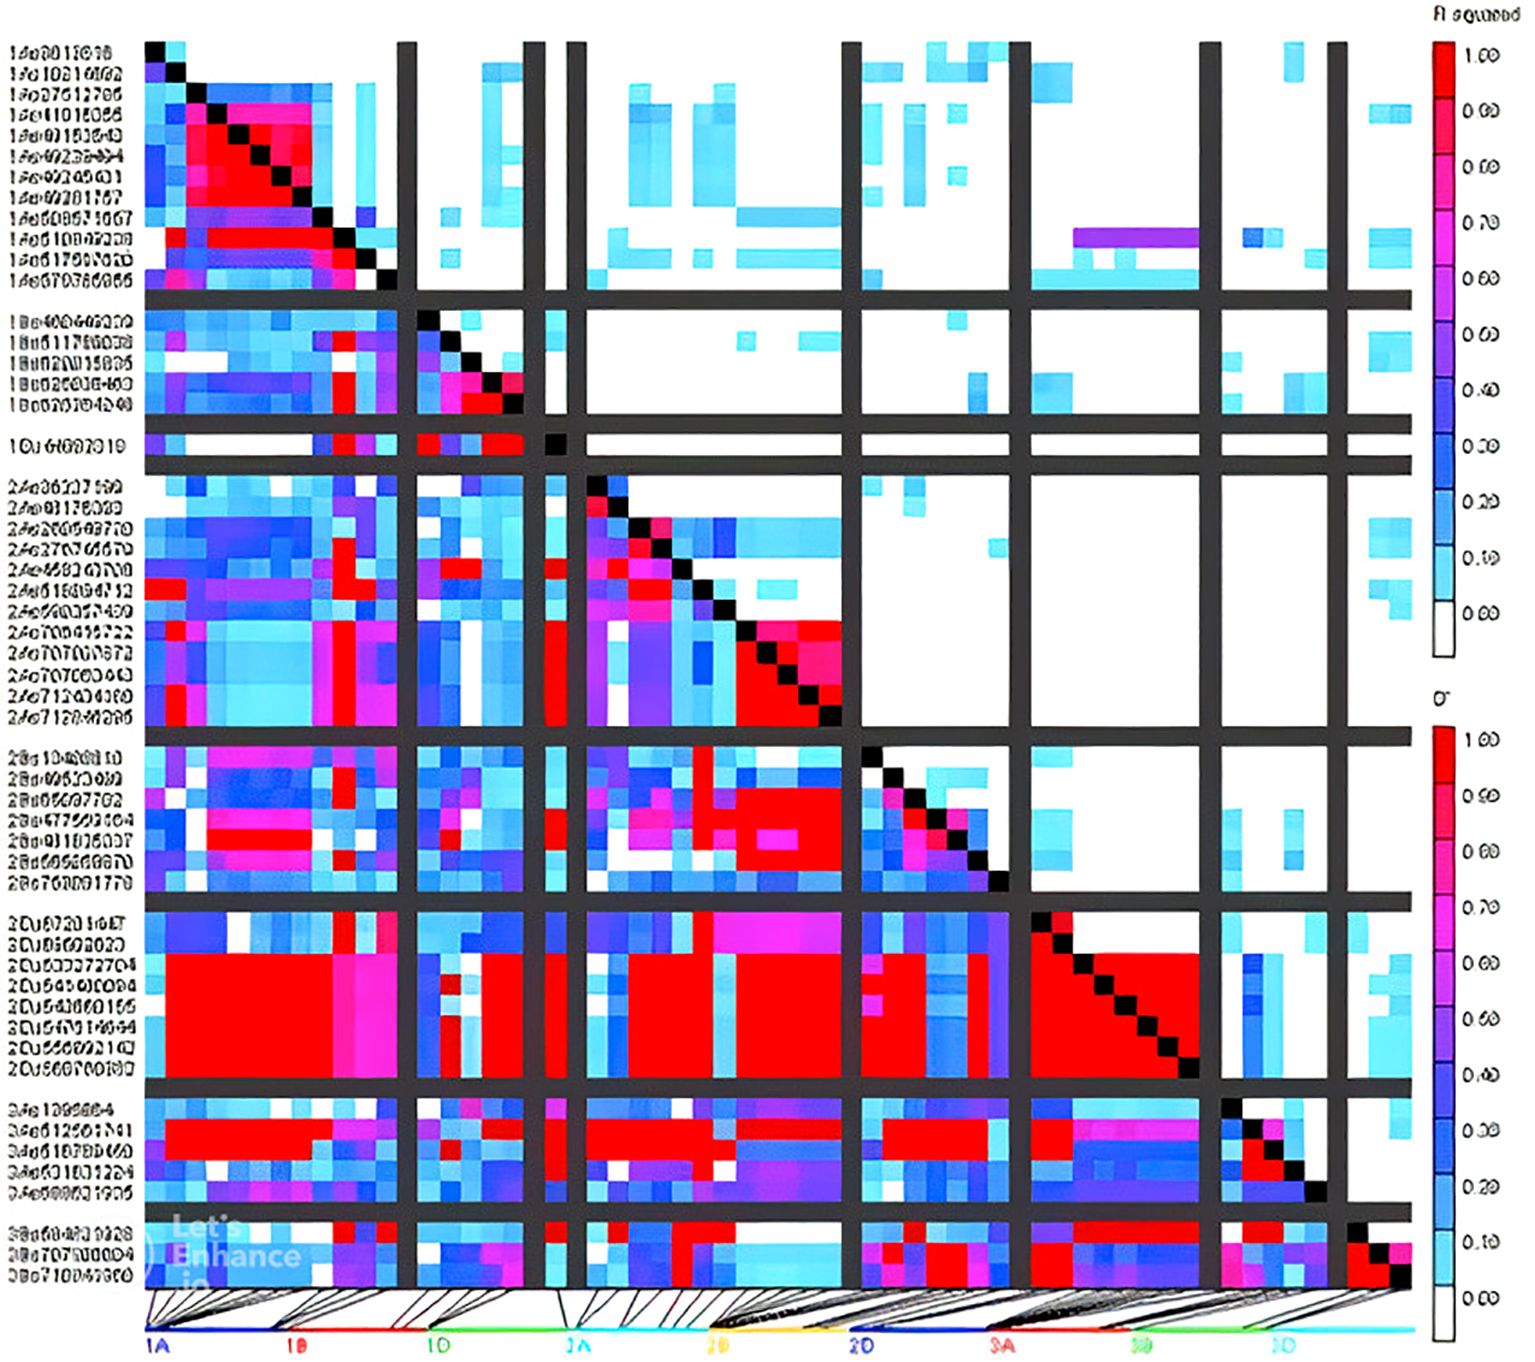
Figure 3. Patterns of LD blocks (right) of GWAS results indicating the position of candidate genes and/or QTL regions associated with grain quality traits and agronomic traits.
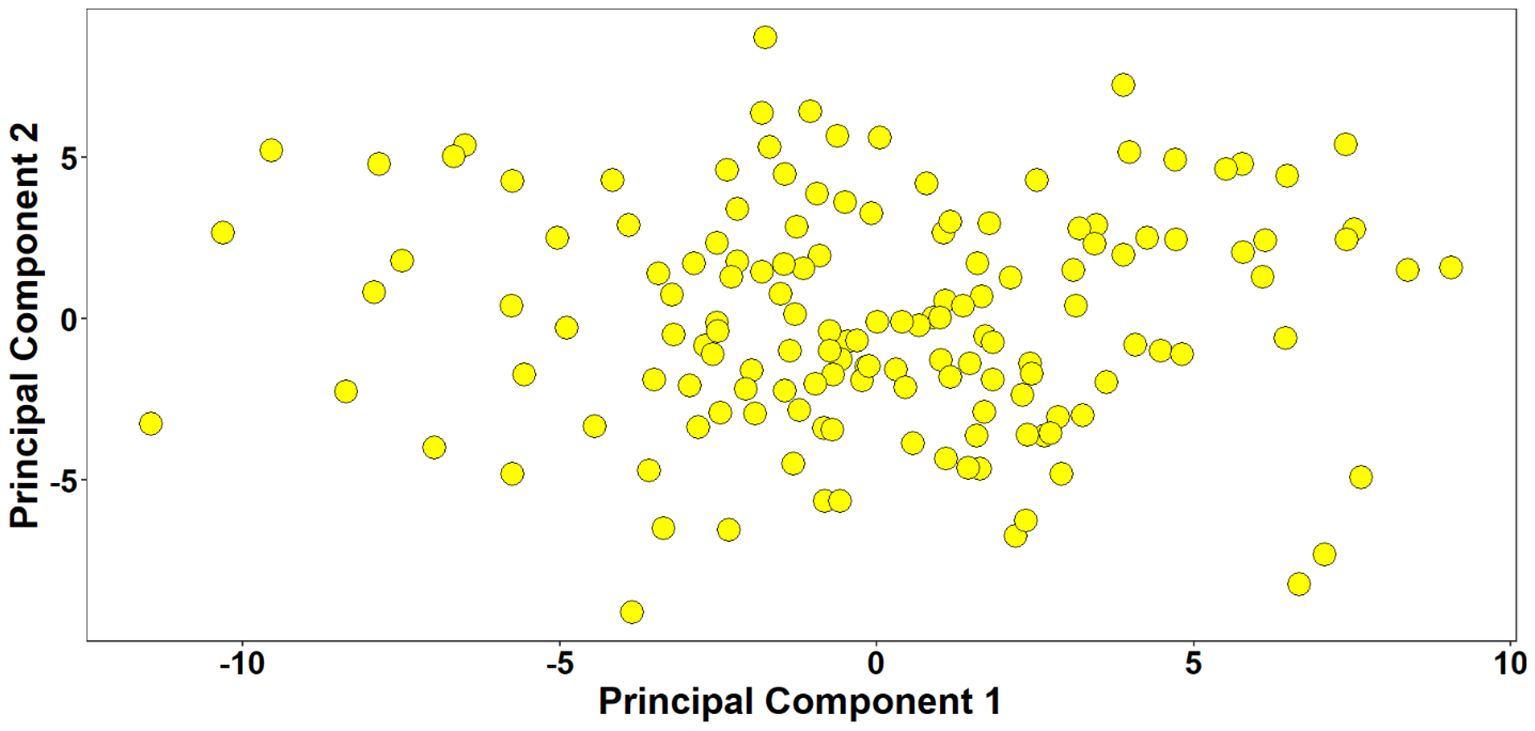
Figure 4. Population structure analysis of 154 lines. The plot of the first two principal components explaining 6.9% and 5.4% of the variation, respectively indicated weak population structure with high relatedness between the lines.
Detection of marker trait associations for grain quality traits
For the quality traits, a total of 55 significantly (P <0.001 and Bonferroni correction cut-off value of 0.2) associated SNPs were detected (Table 3, Figure 5). For GA Score, two SNPs, S5A_671478896 and S7B_613779914, were identified on chromosomes 5A and 7B that explained 18% and 27% of phenotypic variation, respectively. For GH, 13 MTAs were detected on 1A, 1D, 2B, 3A, 4A, 4B, and 7B with 9 – 13% PVE. Interestingly, seven MTAs were on chromosome 7B. Furthermore, SNPs S7B_689902344 and S2B_13408810 had 13% and 12% PVE, respectively. For PR score, five MTAs were detected only on a single chromosome, 2A, with 20–22% PVE, and two SNPs, S2A_707007872 and S2A_707063443, had 22% PVE.
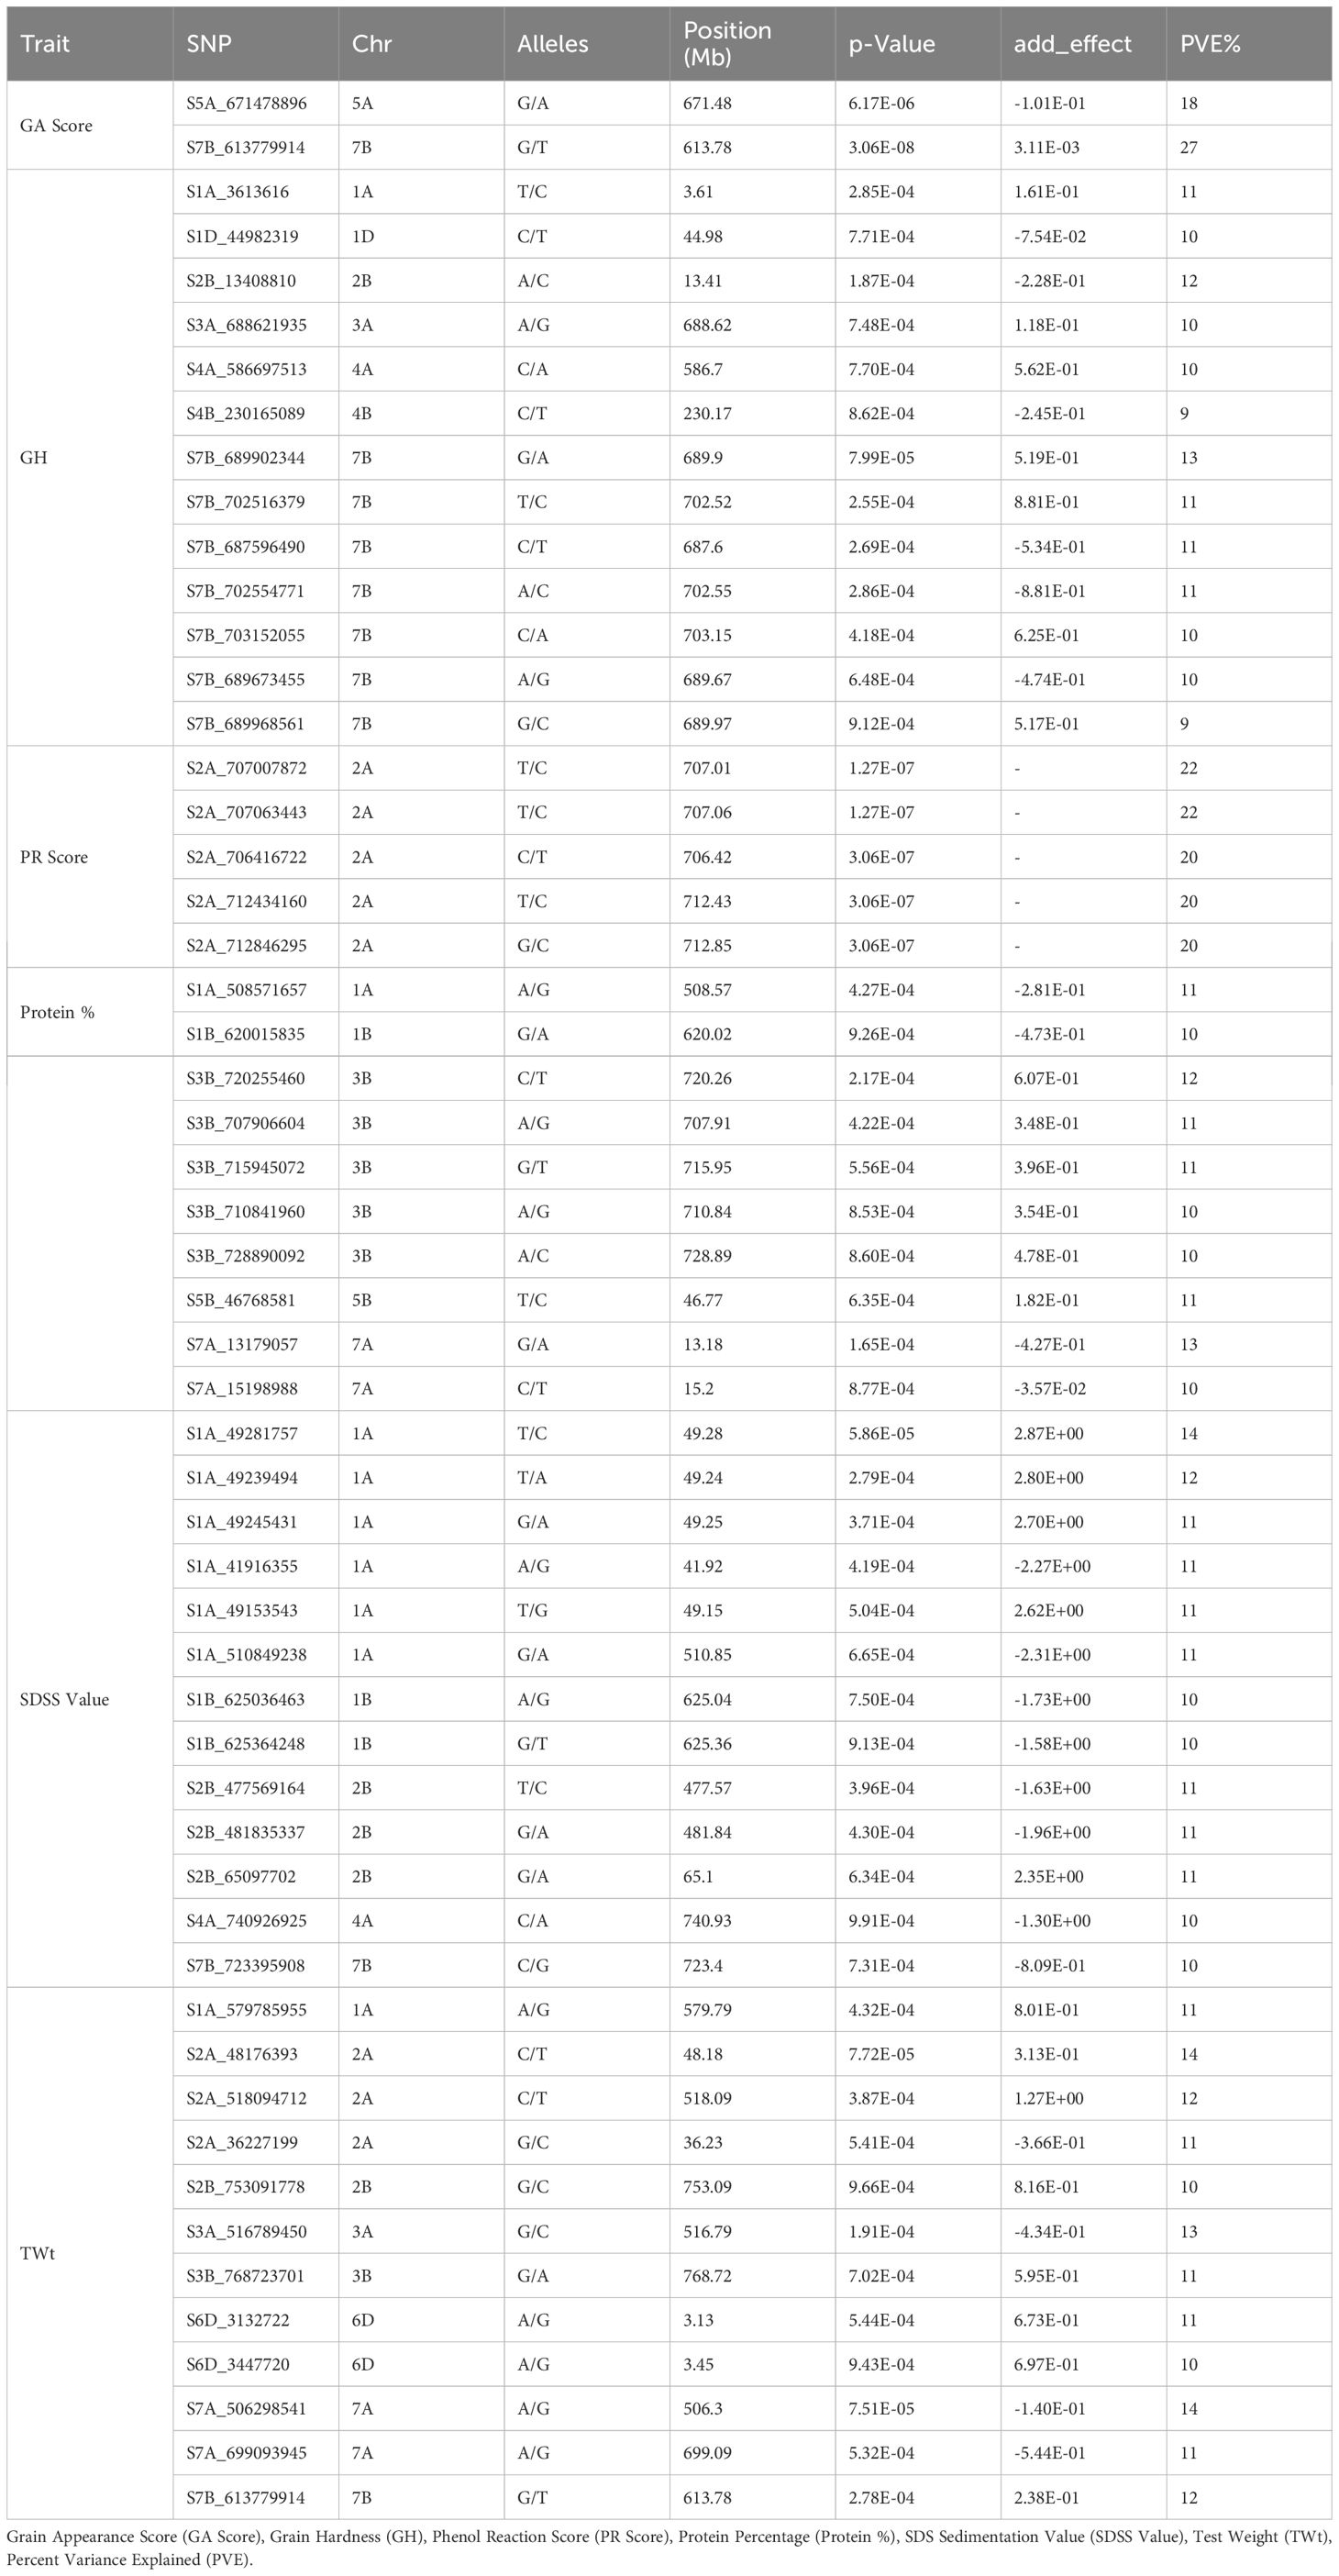
Table 3. Genome wide significant associations (R2) of single nucleotide polymorphisms (SNPs) with quality traits in wheat.
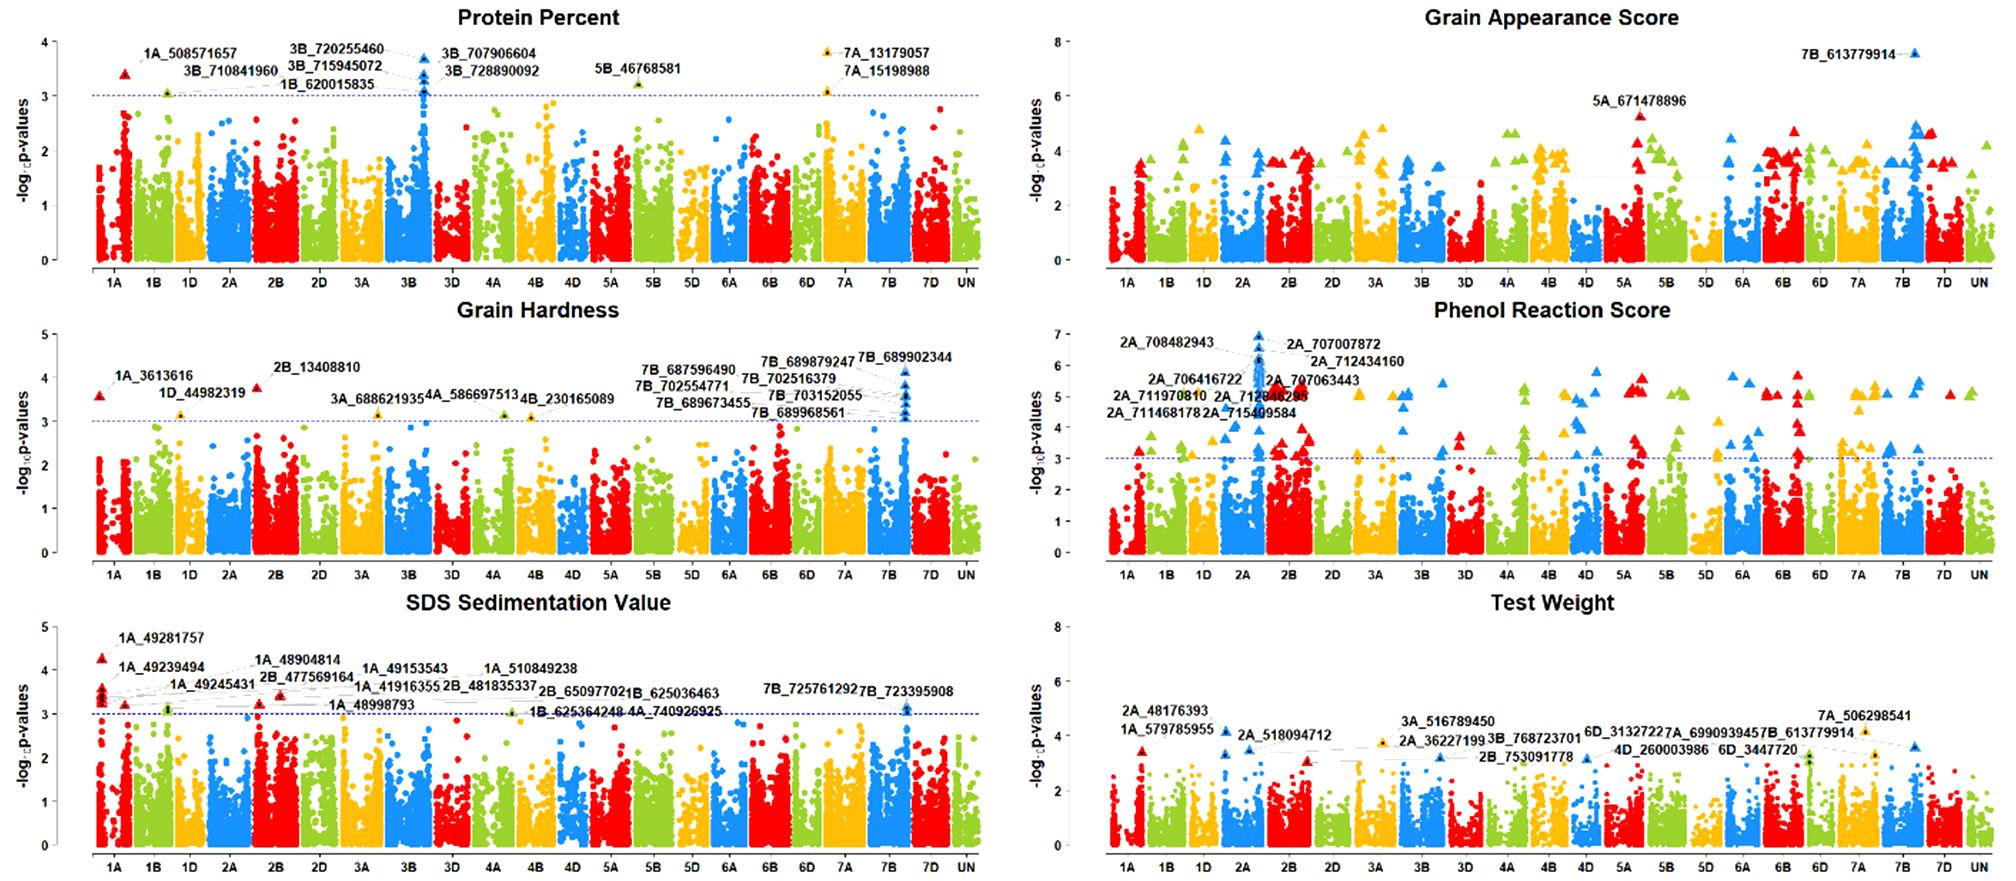
Figure 5. Manhattan plots of GWAS results for grain quality traits (grain appearance score (GA Score), grain hardness (GH), phenol reaction score (PR Score), protein percentage (Protein %), SDS sedimentation value (SDSS Value), and test weight (TWt).); Threshold = −log10(p−value) > 3.
For the Protein %, ten MTAs were obtained on chromosomes 1A, 1B, 3B, 5B, and 7A with 10- 13% PVE, whereas 3A consisted of five MTAs alone. SNP S7A_13179057 had the highest PVE at 13% and S3B_720255460 had 12% PVE. Furthermore, 13 MTAs were found for the SDSS value on chromosomes 1A, 1B, 2B, 4A, and 7B with a range of 10–14% PVE, with a maximum of six MTAs on the 1A chromosome. SNP S1A_49281757 had the highest PVE, 14%, followed by the SNP S1A_49239494 with 12% PVE on the same chromosome. For the TWt, 12 MTAs were reported on chromosomes 1A, 2A, 2B, 3A, 3B, 6D, 7A, and 7B with 10–14% PVE.SNPs S2A_48176393 and S7A_506298541 had the highest (14%) PVE.
Detection of marker trait associations for agronomic traits
For the Ludhiana location, a total of 20 MTAs were detected for all the agronomic traits (Table 4). Three MTAs, S4A_84900641, S4B_664526264, and S5A_470192586, on chromosomes 4A, 4B, and 5A, respectively, were found for the DAYSMT_L with a range of 10–11% of PVE (Figures 6, 7). Only two MTAs, S4D_456260804a and S4D_457212141, on single chromosome 4D were obtained for the DTHD_L with 14% PVE. Five MTAs were found on chromosomes 2B, 2D, 7B, and UN (non-confirmed location) for PH_L with a range of 10–14% PVE. SNP SUN_32203753 had the highest PVE of 14%, and SNPs S2B_49523499, S2D_69502623, and S2D_67201447 had 11% PVE. Furthermore, eight MTAs were reported for TKW_L with a range of 10–14% PVE on the 2B, 3B, 5B, 7A, and 7D chromosomes where four MTAs shared the 7D chromosome alone. SNPs S7D_450126108 and S2B_565059870 showed a high PVE of 14% and 13%, respectively.
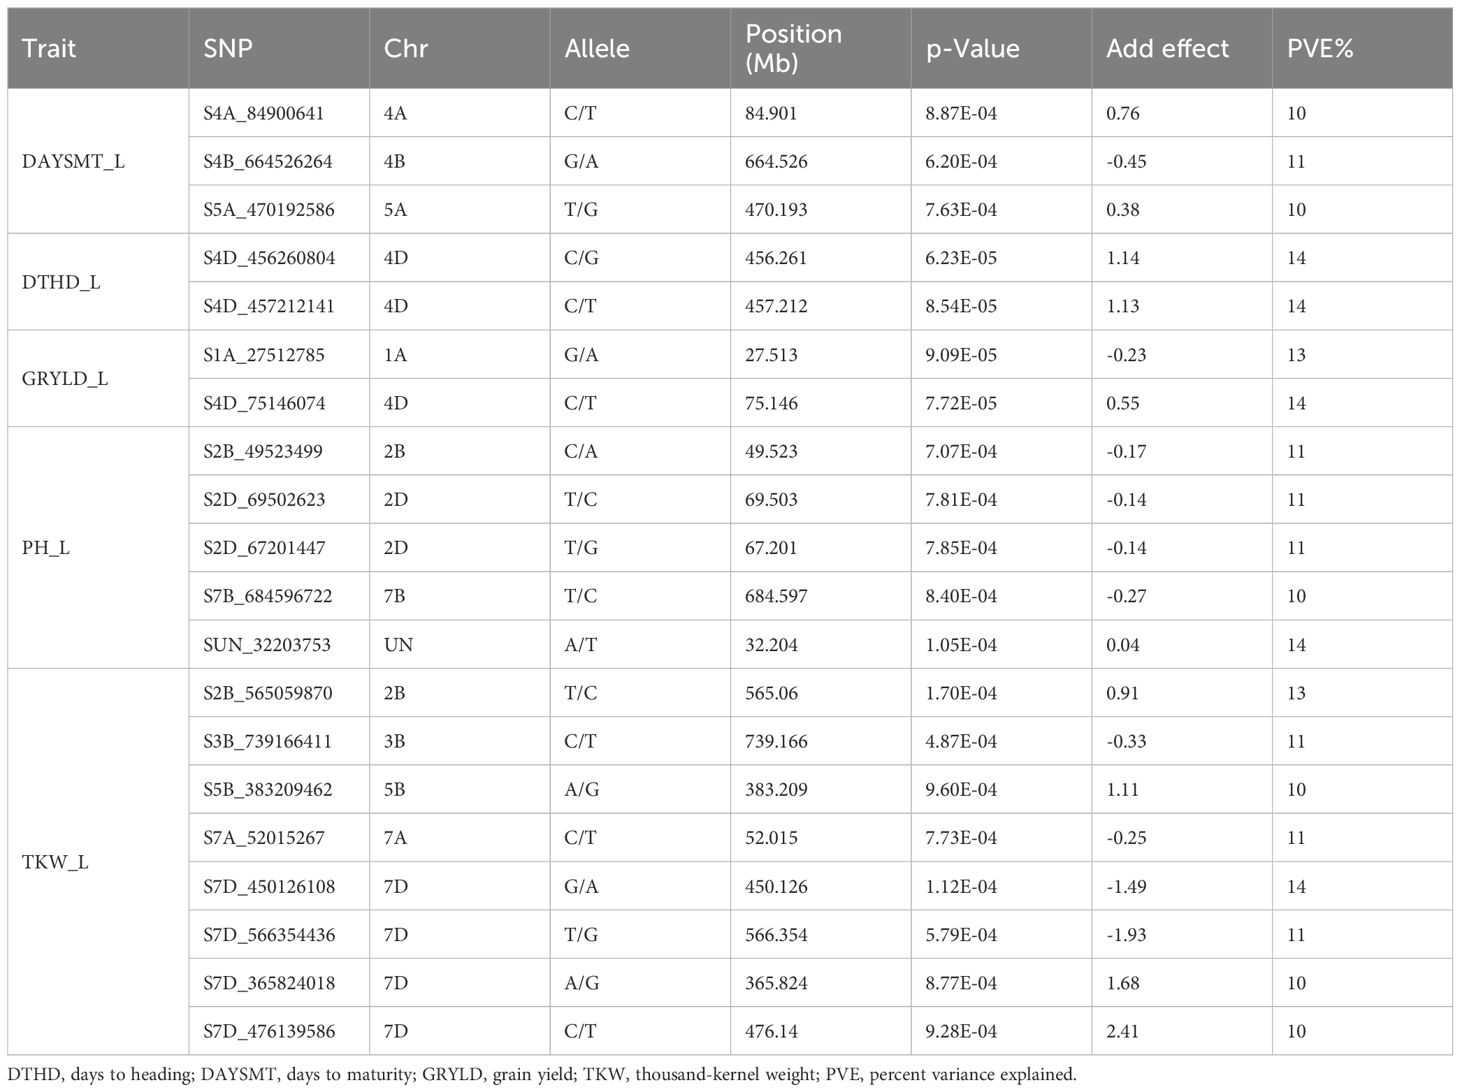
Table 4. Genome wide significant associations (R2) of single nucleotide polymorphisms (SNPs) with agronomic traits in wheat at Ludhiana.
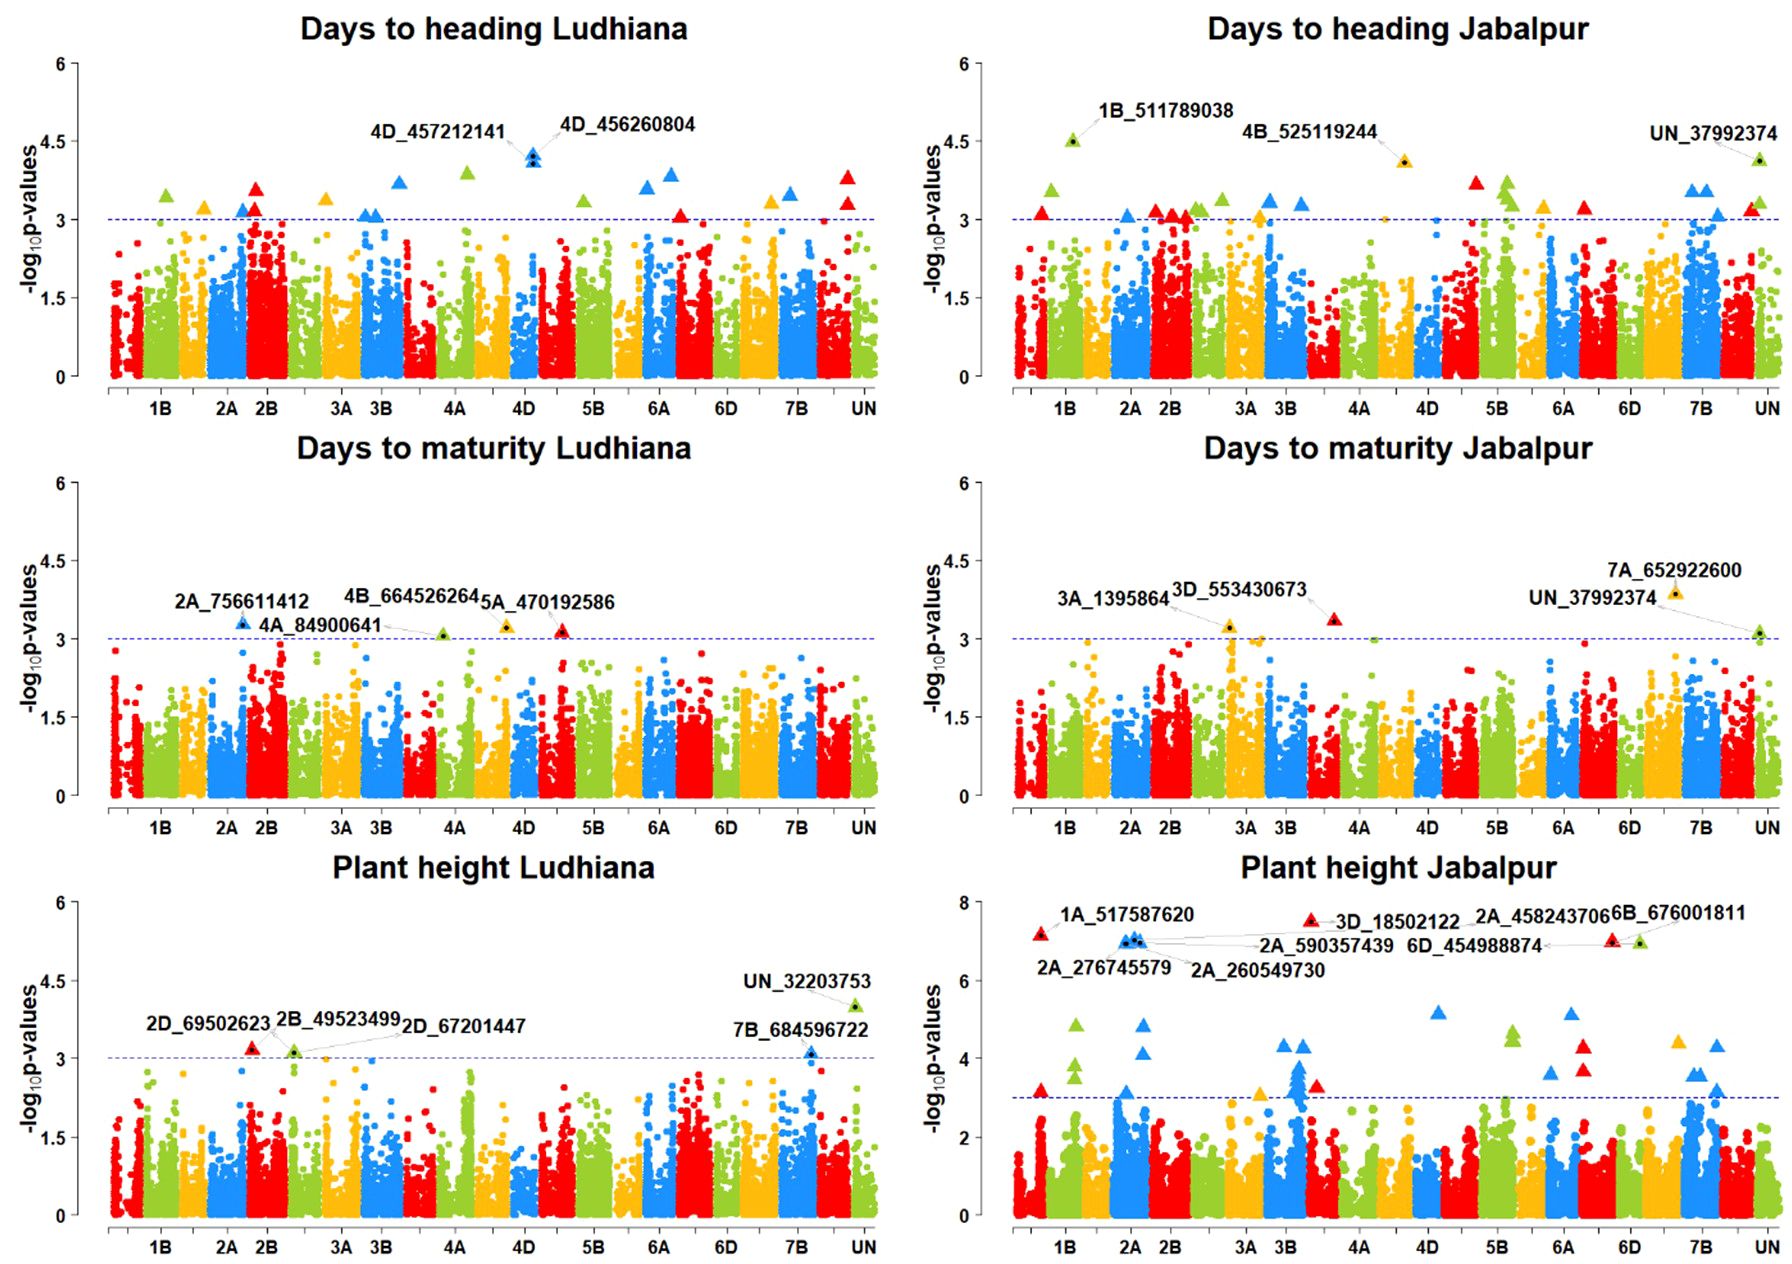
Figure 6. Manhattan plots of GWAS results for agronomic traits days to heading (DTHD), days to maturity (DAYSMT), and grain yield (GRYLD); Ludhiana (LDH), Jabalpur (JBP); Threshold = −log10(p−value) > 3.
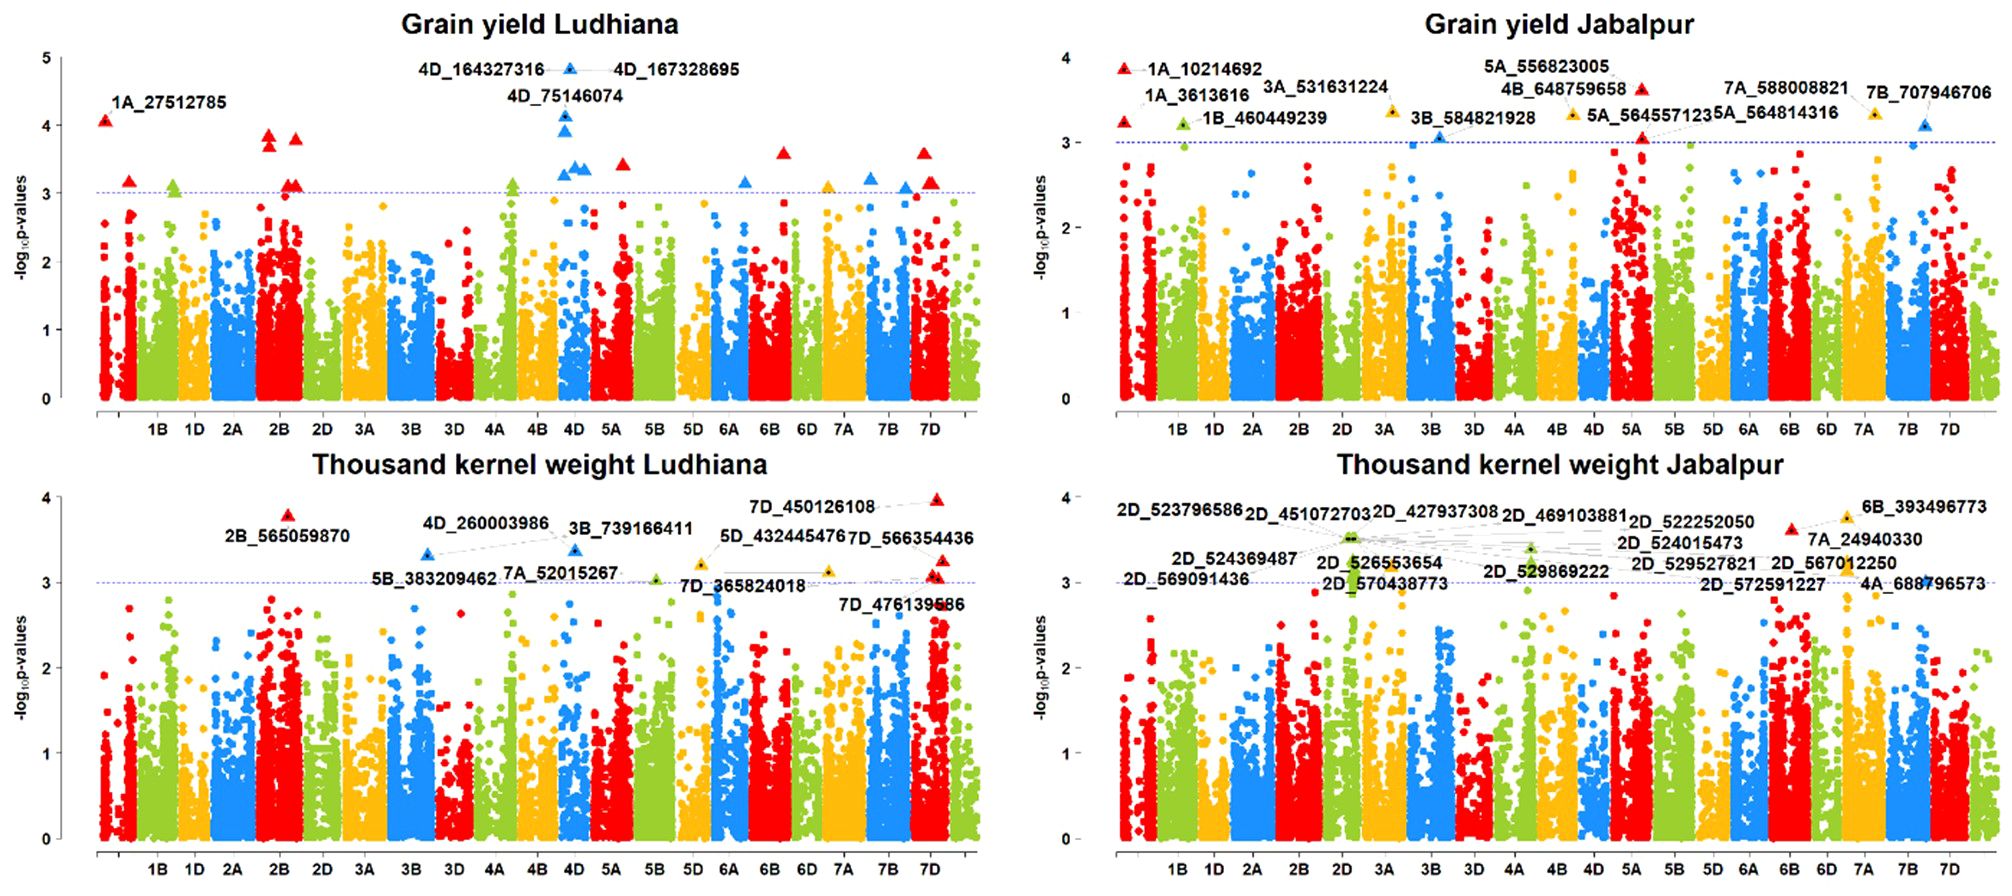
Figure 7. Manhattan plots of GWAS results for agronomic traits grain yield (GRYLD) and thousand kernel weight (TKW); Ludhiana (LDH), Jabalpur (JBP); Threshold = −log10(p−value) > 3.
For the Jabalpur location, 44 MTAs were reported for all the agronomic traits (Table 5; Figures 6, 7). We found three MTAs for DAYSMT_J on chromosome 7A (S7A_652922600), 3A (S3A_1395864), and 3D (S3D_553430673) which had a maximum of 13% and 11% PVE, respectively, while the location of one MTA that explains 11% of phenotypic variation was not known (SUN_37992374). Similarly, two MTAs for DTHD_J were found on chromosomes 1B (S1B_511789038), with 15% PVE, and 4B (S4B_525119244), with 14% PVE, while the location of one MTA that explained up to 14% of phenotypic variation was not known (SUN_37992374). Plant height had ten MTAs with a maximum of four on the 2A chromosome, whereas the highest PVE, 27%, was obtained on chromosome 3D (S3D_18502122), followed by 26% PVE on both 1A (S1A_517587620) and 2A (S2A_458243706). For TKW_J, a total of 16 MTAs was observed; a maximum of six were on chromosome 2D, followed by four on Chromosome 4A, and three on chromosome 7A. The highest PVE (13%) was obtained for the SNP S7A_24940330, followed by S6B_393496773 with 12% PVE; the rest of the MTAs were in the range of 10–11% for PVE.
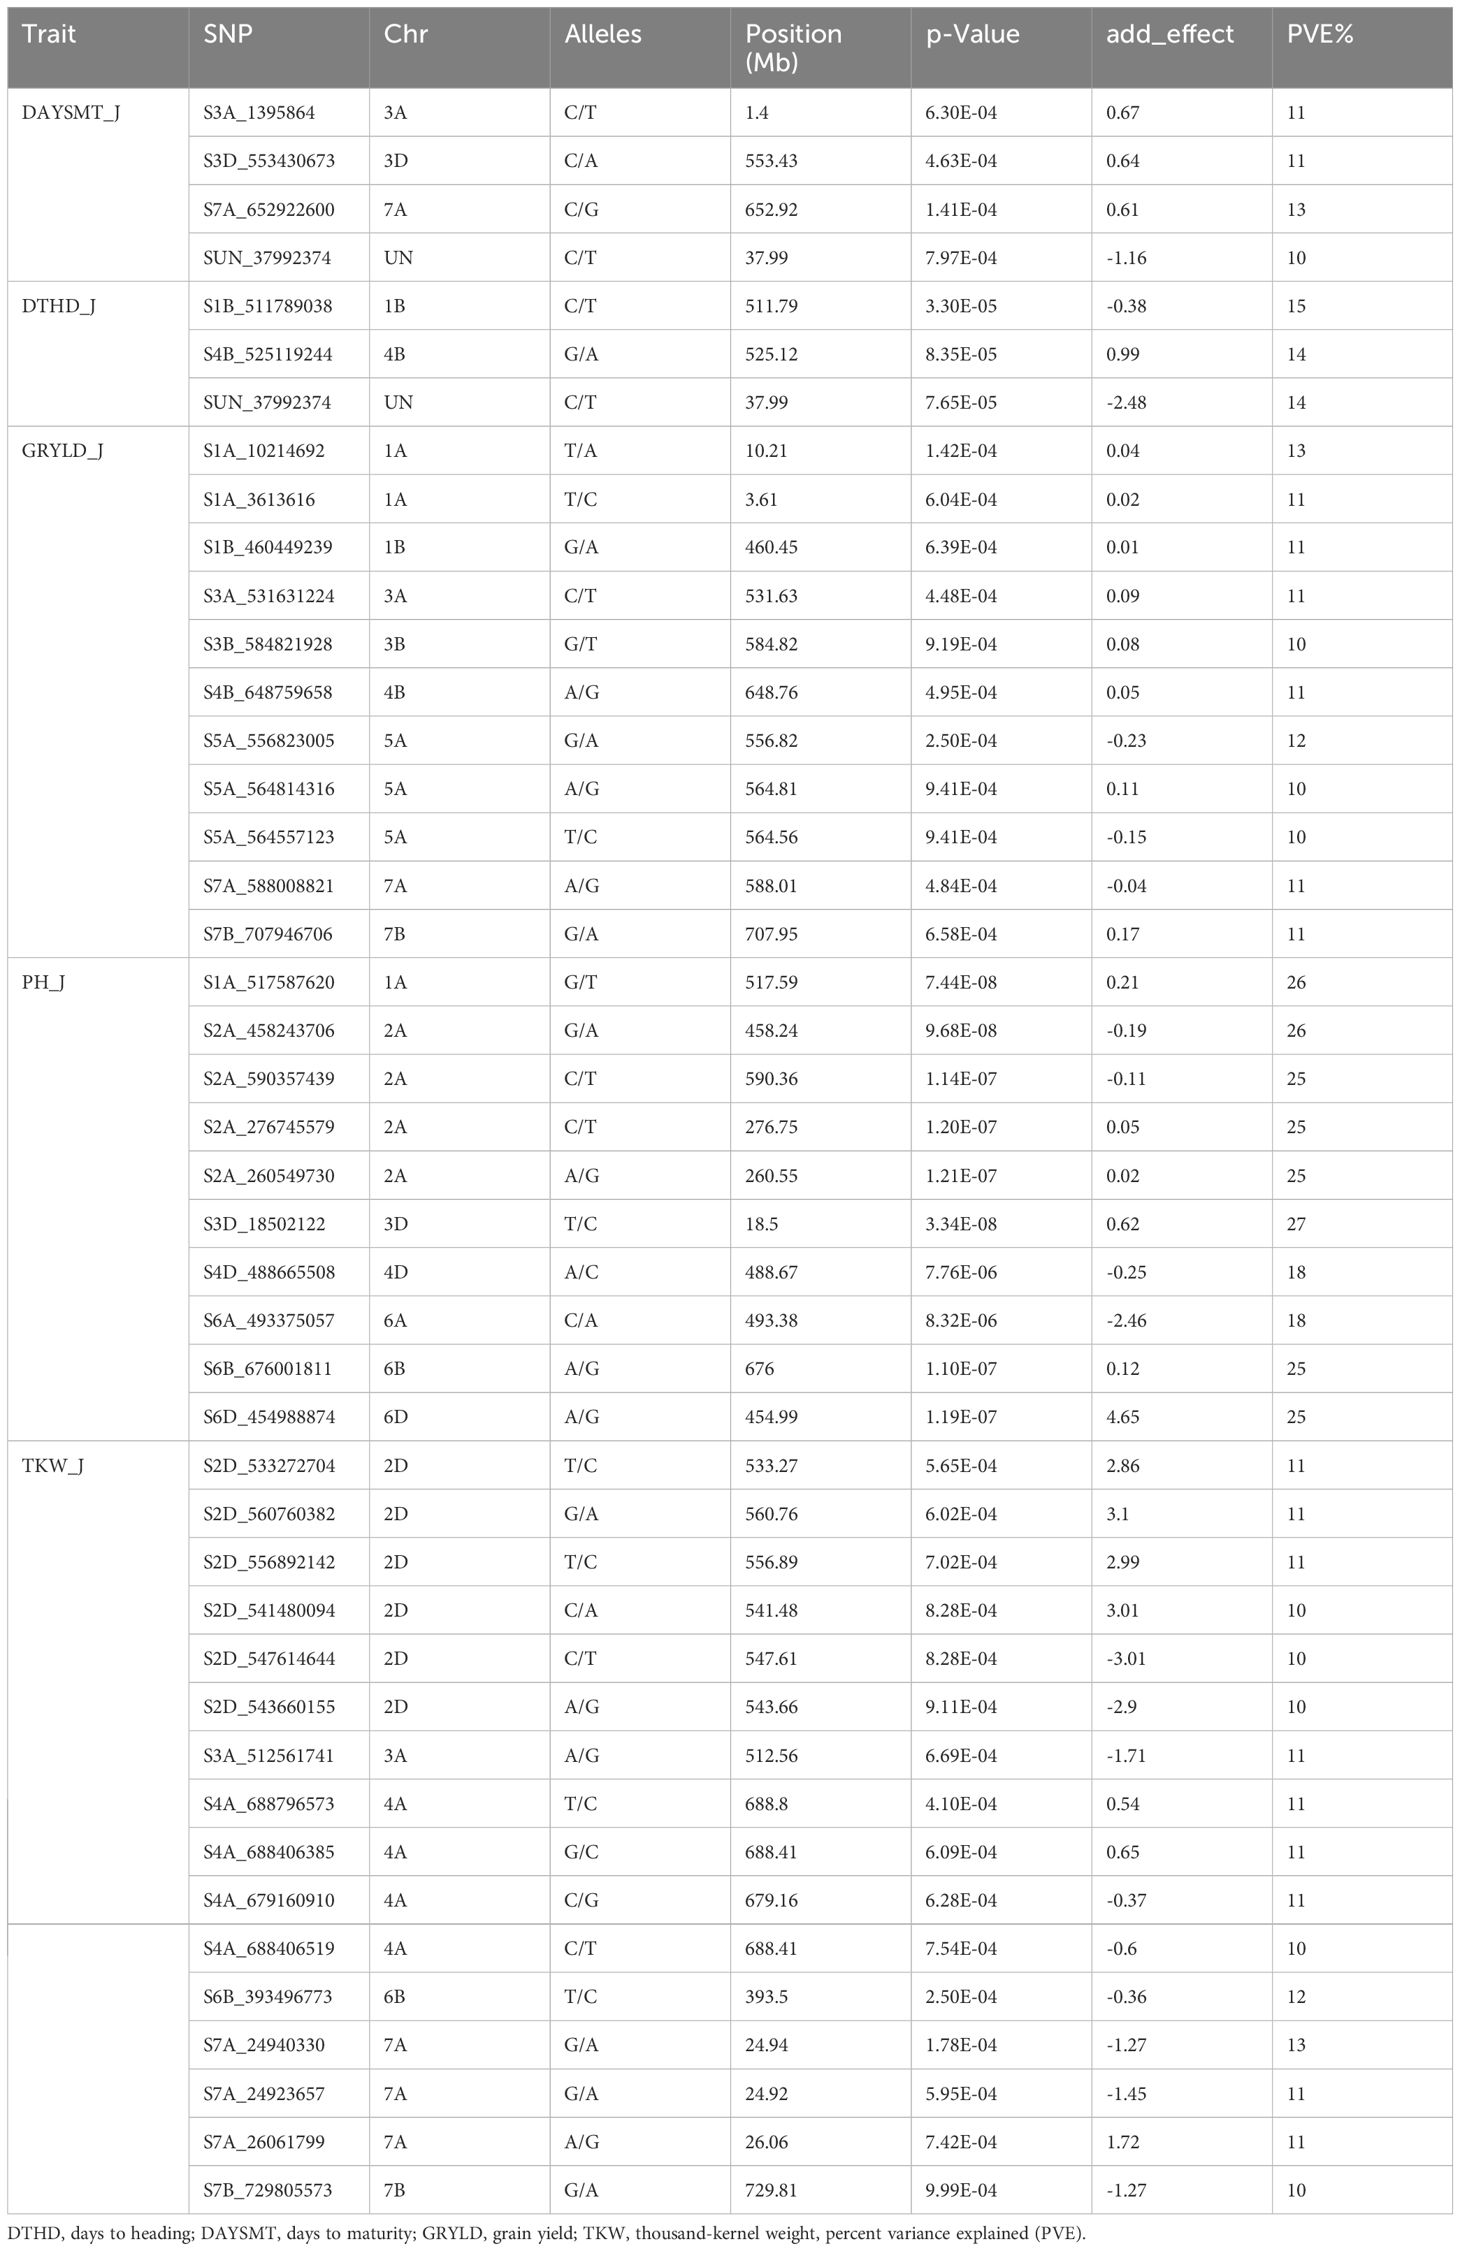
Table 5. Genome wide significant associations (R2) of single nucleotide polymorphisms (SNPs) with agronomic traits in wheat at Jabalpur.
Detection of marker trait associations for grain yield
For grain yield, only two MTA were detected for the Ludhiana location, SNPs S1A_27512785 (Chromosome 1A) and S4D_75146074 (Chromosome 4D), with 13 and 14% of PVE, respectively (Figure 7). At the Jabalpur location, 11 MTAs were obtained for GRYLD with a range of 10–13% PVE. There was a maximum of three MTAs on the chromosome 5A, followed by two on the chromosome 1A; the rest were on single chromosomes such as S1B_460449239 on 1B, S3A_531631224 on 3A, S3B_584821928 on 3B, S4B_648759658 on 4B, S7A_588008821 on 7A, and S7B_707946706 on 7B. Two SNPs, S1A_10214692 on 1A and S5A_556823005, on 5A, had the highest phenotypic variance with 13% and 12% PVE, respectively.
Candidate gene prediction and associated network
A total of 116 SNPs were physically mapped to IWGSC RefSeqv1.1 with high confidence. To identify the putative candidate genes, the 1Mb flanking region of the mapped SNPs was annotated using EnsemblPlant BioMart. This led to the identification of 19 SNPs overlapped by candidate genes (Table 6). Based on the literature survey and current findings, 19 SNPs were considered as novel, and were associated with the following traits: protein %, SDS, PH, DTHD, PR Score, TWt, TKW, GH, DMT, and GYLD. The validation results in KnetMiner network showed that the SNPs for SDSS, such as S1A_49153543, S1A_49281757, S2B_477569164, and S4A_740926925 overlapped with TraesCS1A02G066900, TraesCS1A02G067300, TraesCS2B02G333900, and TraesCS4A02G491100.
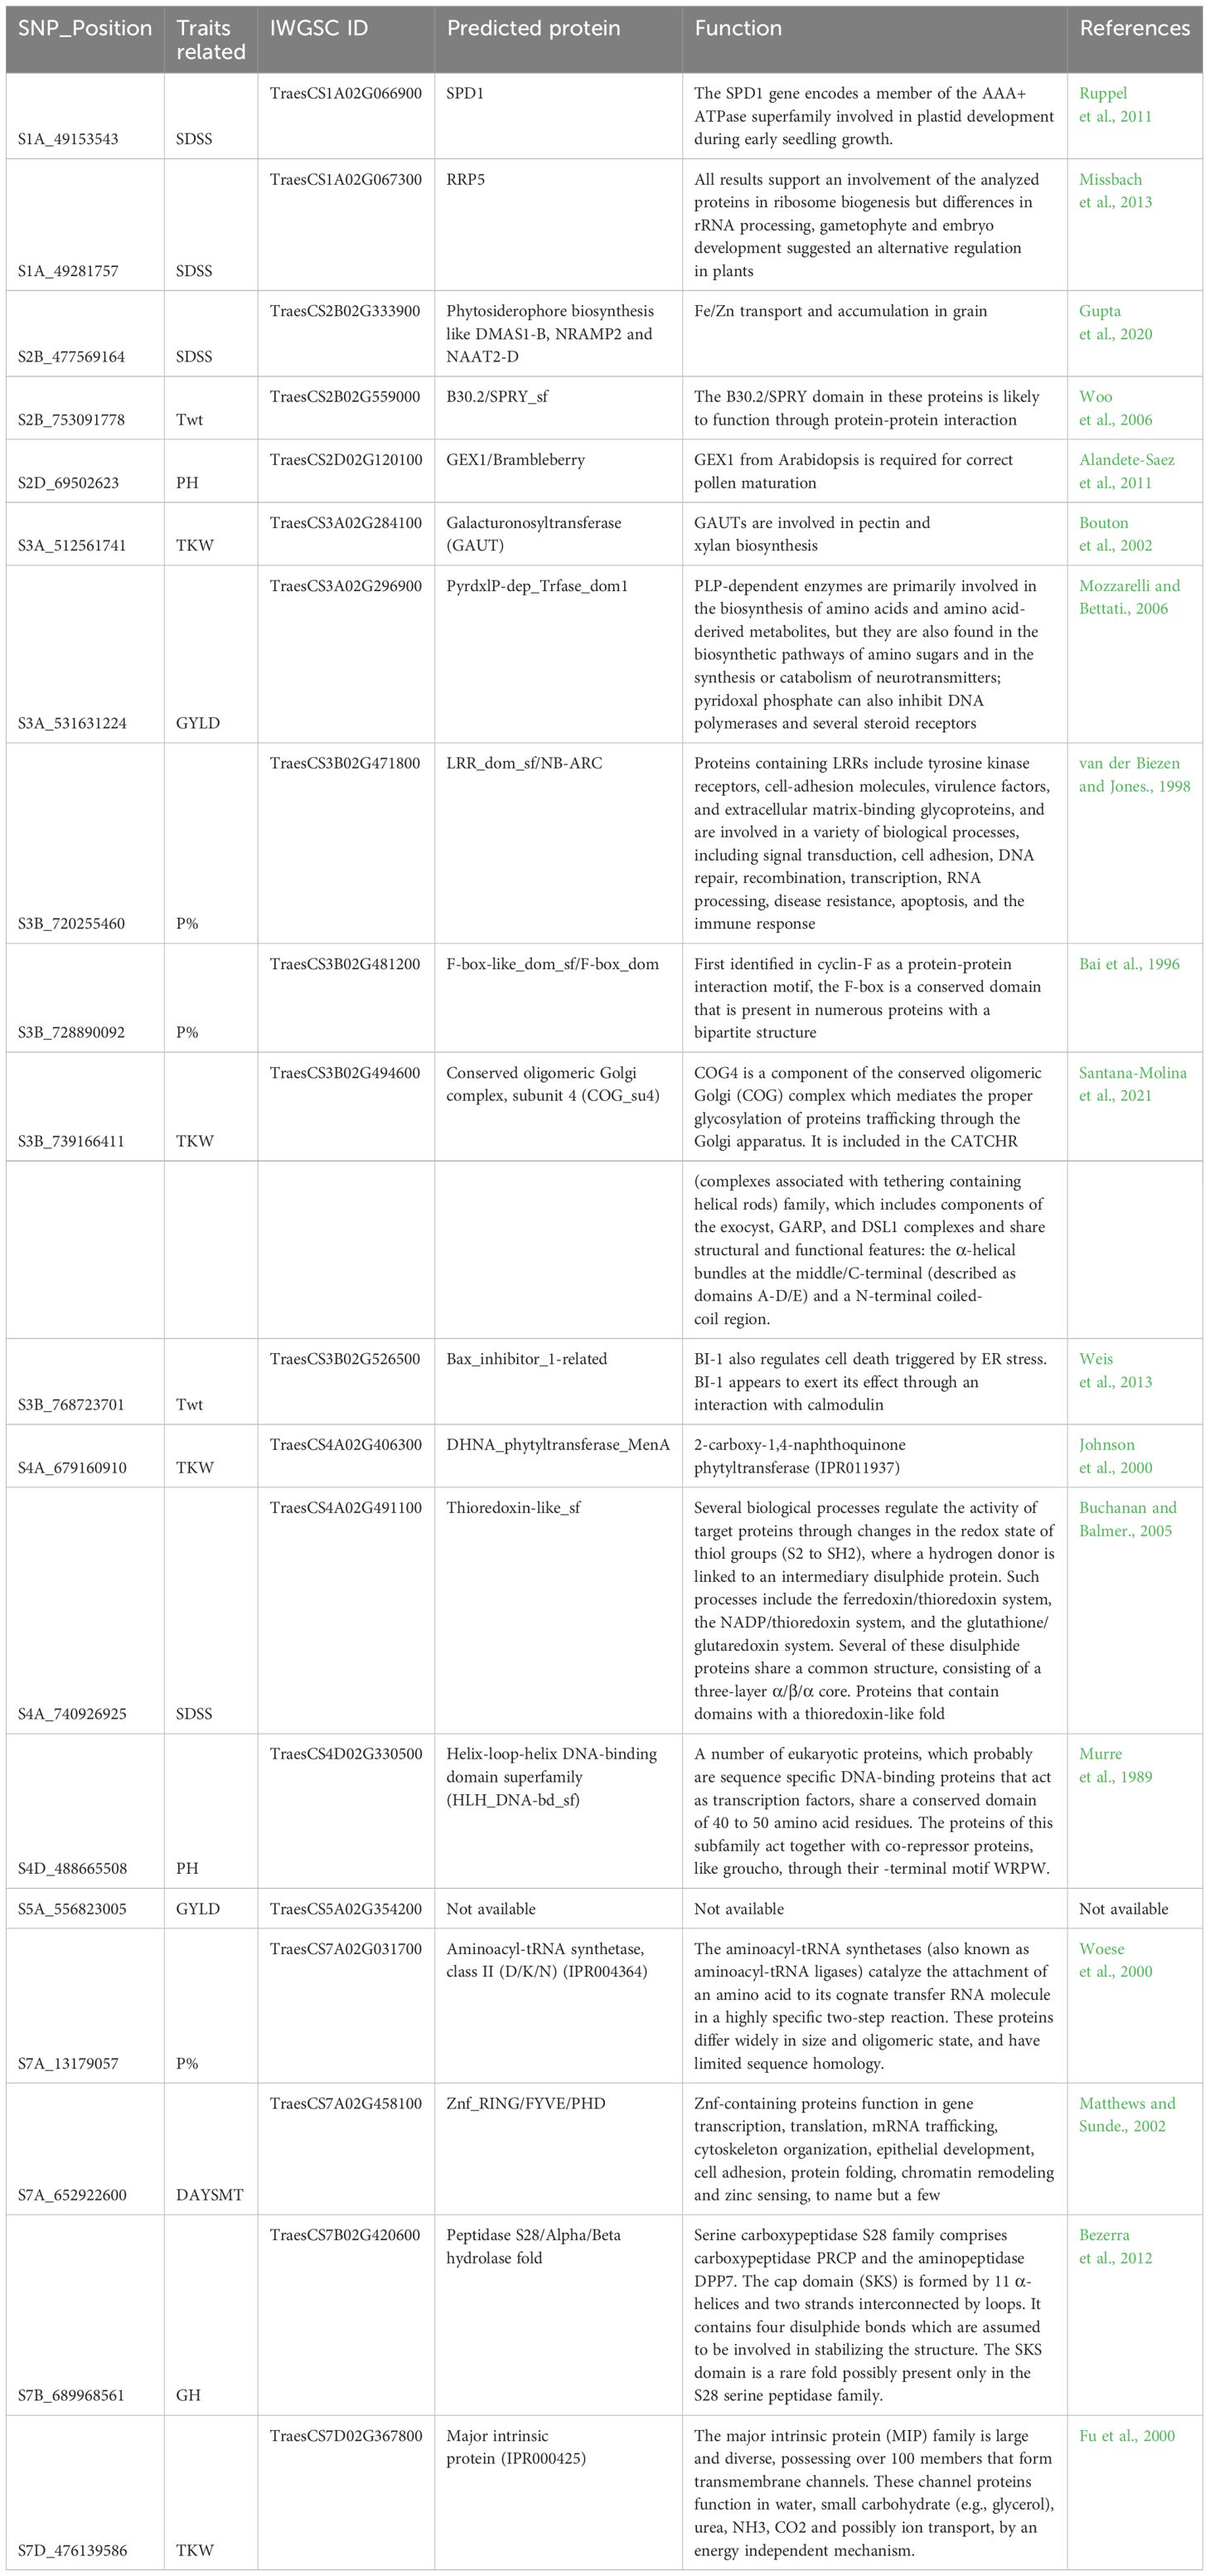
Table 6. A list of predicted proteins and function translated by IWGSC genes overlapping 19 Novel SNPs.
The SNPs were associated with coding proteins such as SPD1 (involved in plastid development during early seedling growth); RRP5 (role in alternative regulation in plants); DMAS1-B, NRAMP2 and NAAT2-D (Fe/Zn transport and accumulation in grain); and Thioredoxin-like_sf (Redox regulation) (Supplementary Figure 1). The SNPs for TKW (S3A_512561741, S3B_739166411, S4A_679160910, and S7D_476139586) overlapped with TraesCS3A02G284100, TraesCS3B02G494600, TraesCS4A02G406300, and TraesCS7D02G367800. These Traes IDs code proteins such as GAUT (involved in pectin and xylan biosynthesis); COG_su4 (mediates the proper glycosylation of proteins trafficking through the Golgi apparatus); DHNA_phytyltransferase_MenA (involved in 2-carboxy-1,4-naphthoquinone phytyltransferase); and MIP (These channel proteins function in water, small carbohydrate (e.g., glycerol), urea, NH3, CO2, and possibly ion transport). Likewise, the SNPs for protein %, viz. S3B_720255460, S3B_728890092, and S7A_13179057, were found to be associated with TraesCS3B02G471800, TraesCS3B02G481200, and TraesCS7A02G031700 respectively, which code for LRR_dom_sf/NB-ARC (involved in a variety of biological processes); F-box-like_dom_sf/F-box_dom (present in numerous proteins with a bipartite structure); and Aminoacyl-tRNA synthetase (These channel proteins function in water, small carbohydrate (e.g., glycerol), urea, NH3, CO2 and possibly ion transport, by an energy independent mechanism). Similarly, for TWt, PH, GYLD, and DAYSMT, we found 2, 2, 2, and 1 overlapped genes, respectively (see detail in Table 6).
Discussion
The performance of a wheat crop should not be judged only from the angle of grain yield as it has several end-product qualities that determine the market value with different value-added parameters. We must explore the different combinations of additional value-added quality parameters to select for desirable end-use quality. Molecular markers linked to the desirable traits is a holistic approach and can be applied in molecular breeding as a tool to identify varieties and lines at any crop development stage. This study attempted the high-resolution genetic dissection of quality, yield, and agronomic variables in spring wheat to find new valuable alleles in genotypes.
The heritability of GRYLD and TKW was good, while for the phenological traits, it was high for DTHD and moderate for DAYSMT and PH. This implies that the phenotypic measurements were of very high quality and that the attributes had a high degree of predictive power. It was reported (Maphosa et al., 2014; Würschum et al., 2018) that GRYLD, a highly quantitative and environmentally sensitive trait, showed significant variation among environments. We also found that agronomic traits significantly contributed to variance explanation and that their heritability was lower than that of other factors, indicating a considerable G×E impact on GRYLD. Therefore, moderate heritability values for GRYLD were anticipated, given that multiple genes govern it. The lower sowing density with smaller plots may also impact the low heritability and yield variances (Thorwarth et al., 2017; Bhatta et al., 2018). The two locations used in this study have very distinct climates. Due to the high ambient temperature, the growing season is comparatively shorter in Jabalpur than in Ludhiana, which has a significantly colder environment with longer growing seasons (Mondal et al., 2016).
Grain quality is a cumulative effect of several traits such as grain protein content, grain hardness, GA score, PR score, SDSS value, and test weight. There is a perception that for good end-products and chapati-making quality, there is a specific combination of the desired grain quality features. To ascertain which combination of quality has what relationship with the others, we estimated correlations between the grain quality of the advanced breeding lines. Likewise, we proceeded with the correlation study to elucidate the correlation between the agronomic and quality traits. There are only a few reports where correlations between the end-use quality traits such as protein %, TWt, GA Score, PR Score, GH, and SDSS value in spring wheat in multi-environment were studied (Guzmán et al., 2016; Ibba et al., 2020; Tsenov et al., 2020).
Grain protein is the primary determinant of wheat quality, its end use, and commercial value (Cox et al., 1985). However, it is well known that grain protein is negatively correlated with grain yield in wheat; in our study, too, we found that there was a negative correlation between protein percentage and the yield from Jabalpur (-0.20), but there was a slight non-significant correlation between protein % and the yield from Ludhiana (0.11). This revealed the influence of environment on the genotype quality. Despite this negative correlation, many reports have reported simultaneous improvements in grain yield and GP (Niu et al., 2010; Vishwakarma et al., 2014, 2016). Protein % has a positive correlation with all the quality measures. Even in this study, we found that all the quality traits studied significantly correlated. Mladenov et al. (2012) also reported a significant positive correlation between the Protein % and sedimentation (SDSS value). In addition to this, test weight is a measure of grain density, which showed a significantly positive correlation with Protein %; in contrast, none of the other traits had a significant correlation. This elucidates that the previous study’s test weight had shown a positive correlation with TKW but not with the Protein % and SDSS value due to these being environment-specific (Mladenov et al., 2012). Grain yield showed a positive correlation (0.17*) with days to maturity indicating that an increase in days to maturity would increase grain yield as also mentioned by Semnaninejad et al. (2021). In addition to this, Grain yield significantly positively correlated with TKW_L (0.39***) and TKW_J (0.04) for both locations as identified by earlier reports (Semnaninejad et al., 2021; Zhang et al., 2021).
GWAS for agronomic traits
For days to heading, we identified two MTAs on 4D. For the Jabalpur location, it was on chromosome 1B, 4B UN, which was earlier reported by Cadalen et al. (1998) in a double haploid population with his model that explained that the heading date loci from chromosomes 4B and 4D (Xfba1- 4B, Xglk556–4B, and Xfba211–4D) had the main effects. There were interaction effects with plant height QTLs (Xfba393–1A and Xcdo1188–1B) which explained about 50% of the plant height variation. Worland (1996) elucidated that almost all chromosomes carry genes for heading. This notwithstanding, the important genes Vrn (vernalization) and Ppd (photoperiod), located in homeologous groups 5 and 2, have a significant role in heading date. The SNPs significantly associated with plant height were identified on 2B, 2 (2D), 7B, and UN for the Ludhiana location and 1A, 2A, 3D, 4D, 6A, 6B, and 6D for the Jabalpur location. Previously, plant height was also reported on chromosomes 1A (Sukumaran et al., 2015), 2A (Ain et al., 2015; Mengistu et al., 2016; Sheoran et al., 2019), and 2B (Zanke et al., 2014; Ain et al., 2015; Gao et al., 2015; Sheoran et al., 2019). In addition, the SNPs identified for PH on chromosome 2B (565.060 Mb) were found in proximity to the reduced height genes Rht4 (609.3 Mb). We also obtained 4 SNPs on chromosome 2A, where the Rht7 gene was reported. In this study, SNPs for PH were detected on chromosome 6A. The locus on 6A was consistently detected under drought, heat, and irrigated conditions for yield (Edae et al., 2015; Lopes et al., 2015). Sukumaran et al. (2015) reported the PH in the WAMI population and PH was not correlated with YLD according to the genetic and phenotypic correlation study, demonstrating that the loci on 6A have pleiotropic effects on several characteristics (Sukumaran et al., 2015). However, numerous studies have shown that QTLs influenced by environmental factors in various crops regulate plant height and heading date (Xu et al., 2005; Zhang et al., 2009). The SNPs significantly associated with DTM were identified on chromosomes 4A, 4B, and 5A for the Ludhiana location and 3A, 3D, and 7A for the Jabalpur location, corresponding to the earlier reported genomic regions for DTM on chromosome 5A (Gahlaut et al., 2019; Sheoran et al., 2019), 4B (Sukumaran et al., 2015), and 7A (Adhikari et al., 2020). SNP S7A_652922600 (TraesCS7A02G458100) for the DAYSMT on chromosome 7A plays a key role in the function of Znf-containing proteins.
We found a set of three markers for TKW on chromosome 7A in the region from 718 to 735 Mb while Rathan et al. (2022) and Jamil et al. (2019) also identified markers for TKW on the same chromosomal region at 731.8 Mb in multiple environments. This indicated that this chromosome region might have some haplotype block for the TKW.
A complicated quantitative feature, grain yield contains MTAs dispersed across several chromosomes (Jamil et al., 2019). For grain yield in our study, we found MTAs on chromosomes 1A and 4D for the Ludhiana location, while for the Jabalpur location there were three MTAs on chromosome 5A and two MTAs on 1A, 1B, and 3A. Jamil et al. (2019) reported QTLs on 1A, 1B, 5A, and 3A for GRYLD. In an earlier study, two MTAs were present on chromosome 1A with 13% PVE. While chromosome 1B QTLs had 7.55% PVE in our study, one common MTA (S1A_3613616) on 1A had a pleiotropic effect with grain hardness that had a positive correlation with GRYLD also, which intimated that GH had a direct effect on GRYLD. Three markers on 1B explained 13% to 16% PVE for GRYLD (Jamil et al., 2019). Moreover, we reported one MTA on the 4D chromosome. Li et al. (2014) also reported a QTL (QGy4D) on the same chromosome flanked by SSR marker Xbarc334-Xwmc331. It is recognized that several important genes regulating plant height, yield productivity, and yield components are located on chromosomes 4B and 4D (Huang et al., 2006). In our study, we used different environments with very distinct climates. Jabalpur has high ambient temperatures in the daytime and cooler nights during the crop growing season, and the crop’s days to heading, flowering, and maturity periods are shorter in comparison to Ludhiana. In contrast, Ludhiana has a significantly colder environment with longer growing seasons (Mondal et al., 2016). These differences in the environment were also seen in the marker-trait association for the agronomic traits at both locations. We assume that this was the main reason for there being no common MTAs identified for the agronomic traits.
GWAS for quality and values added parameters
For the quality traits, most of the genetics studies undertaken on wheat have used linkage mapping to study the genetic basis of quality determinants. This entails identifying genes/QTLs linked with the trait of interest by establishing linkage disequilibrium (LD) in populations obtained from bi-parental crosses. However, because of the limited number and location of meiotic events, QTL mapping resolution is frequently limited to 10–30 cM, and it can only study a small fraction of the total number of potential alleles in the population from which the parents originated (Zhu et al., 2008). As an alternative to linkage mapping, association mapping (AM) can help locate alleles in a large number of germplasm samples Yu et al., 2006). Earlier investigations revealed that the GLM model could create false-positive sites due to the lack of a Kinship matrix and a shift in the phenotypic interpretation rate (Yu et al., 2006).
Value-added parameters are complex traits influenced by both the genetic background of the germplasm and the growth conditions (Mohan et al., 2022). Earlier genes/QTLs with major and minor effects on wheat end-use quality traits have been identified and characterized. Nonetheless, whether with bi-parental or association studies, genetically dissected the quantitative trait loci (QTLs)/alleles for the GA Score, PR Score, and SDSS Value, these traits remain uncharacterized. The literature search revealed that this is the first time MTAs for GA Score (2), PR score (5), and the SDSS Value (13) have been reported. This novel locus can be helpful in the identification of new end-use quality products with their corresponding combination in the existing germplasm.
The SDSS value is a thorough indicator for subtly assessing wheat quality and one of the crucial tests to gauge flour’s gluten content. This directly affects the flour’s suitability for processing and baking (Peña et al., 2012) Given that the SDSS value is a quantitative variable influenced by genetic and environmental influences, some QTLs can only be found in particular environments. We reported 13 such MTAs, which are consistent with other findings located on chromosomes 1A (6 SNPs), 1B (2), 2B (3), 4A, and 7B (Goel et al., 2019; Zhang et al., 2020; Alemu et al., 2021). We reported SNP S1A_510849238 on 1A, were near to QTL (540,660,000–544,610,000 bp, RefSeqv1.0) as earlier reported by Yang et al. (2020) through a GWAS. In addition, two more QTLs were reported on chromosome 1A QSsv.cau-1A.1.1 (371,573,909–386,426,688 bp, RefSeqv1.0) and QSsv.cau-1A.1.2 (419,490,584–492,004,197 bp, RefSeqv1.0) by (Tian et al., 2021). We found six MTAs associated with SDSS value on chromosome 1A; this indicates that chromosome 1A is an important region for SDSS value.
According to research, grains that react with phenol to generate color also have the unfavorable trait of browning wheat products like pasta and noodles (Bernier and Howes, 1994). This makes grain screening a valuable method for determining the quality of the end product, thus proving useful in screening the end products. For the phenol reaction score, we have reported five MTAz in between 712.85 -706.42 Mb i.e., the 6.43 Mb region only; this elucidated the possibility of a haplotype block for this trait. The phenol color reaction of the grain gene was on the long arm of chromosome 2A. According to Nair and Tomar (2001) Triticum turgidum variety durum Desf. has at least two genes that regulate the phenol color response.
The GA score was evaluated based on the grain’s size, shape, color, and luster. We have reported only two MTAs for the GA score on 5A and 7B chromosomes. To date, no previous report has been found for the gene/QTLs for GA score. Previously, Kumar et al. (2019) measured six traits related to grain shape and size, namely, length, width, area, length-to-width ratio, test weight, and thousand kernel weight. Despite a significant correlation with grain yield traits, no significant QTL was found for these traits. These findings could lead to the hypothesis that focusing on grain shape and size, particularly an increase in GA, may improve wheat yield by increasing TGW. Test weight is often referred to as the specific weight of a known volume of grain and serves as a crucial quality indicator. We reported MTAs for test weight on chromosomes 1A, 2A (3), 2B, 3A, 3B, 6D (2), 7A (2), and 7B. There are few studies showing QTL for test weight; however, one of the most recent ones found eight loci on chromosomes 1D, 2A, 2B, 2D, 3B, 3D, 4D, and 7A (Cabral et al., 2018), and while another found loci on 1B and 3B (Alemu et al., 2021).
The absence of Gpc-B1 allows the exploration of the novel identified loci contributed by the lines
Our study did not identify the major Gpc-B1 gene reported on chromosome 6B by Uauy et al. (2006). This indicates that the genotype x environment interactions played a crucial role. Therefore, exploring a non-adapted genotype provides an opportunity to enhance GPC in the cultivated wheat gene pool. Gpc-B1 played a significant role in developing several lines for the grain protein; however, it was found at par or negative yield (Uauy et al., 2006; Blanco et al., 2012; Vishwakarma et al., 2014, 2016). These independent loci could be useful to enhance GPC through MAS, without compromising yield. In this study, we identified MTAs on chromosomes 1A, 1B, 3B, 5B, and 7A. In earlier reports with bi-parental mapping populations, QGPC.ndsu.5B (found on 5BS) and QGPC.ndsu.7A.2 (found on 7AL) QTLs were present in non-adapted germplasm, according to a comparison with 49 GPC investigations (Kumar A. et al., 2018). Even though El-Feki et al. (2013) discovered a QTL on 5BS, it was too far away from QGPC.ndsu.5B. A few previous investigations in both durum (Peleg et al., 2009; Suprayogi et al., 2009) and hexaploid wheat (Mann et al., 2009; Li et al., 2012) found a stable QTL for GPC on 7AL. The QTL QGPC.ndsu.7A.2 was found near the telomeric end of chromosomal arm 7AL, whereas the QTLs previously published (Mann et al., 2009; Peleg et al., 2009; Suprayogi et al., 2009; Li et al., 2012) were found in the middle of the chromosome arm 7AL. We reported five MTAs on 3B alone within the 20.98 Mb region. The presence of GPC region QGpc.caas-3B flanked by marker wmc3-wmc418in in bi-parental mapping that showed a high LOD value, 11.10, with the highest phenotypic variance of 14.5% has been reported previously by Li et al. (2009). This could be of significant interest as these QTLs were independent of grain yield and may be used as haplotype blocks, contributing to the favorable alleles in the future.
Novel allele for grain hardness on chromosome 7B
Grain hardness or texture in wheat is directly associated with critical end-use quality attributes such as milling yield and flour extraction. Our research corroborated this by indicating a moderately positive relationship between GH and flour extraction in all settings. Grain hardness in wheat is controlled by the main hardness locus (Ha) on chromosome 5DS, which is positioned at a sub-telomeric location (Sourdille et al., 1996; Morris, 2002). Friabilins are 15-kD lipid-binding endosperm-specific proteins encoded by the Ha locus. The two main proteins in friabilins are Puroindoline a (Pina) and Puroindoline b (Pinb) (Gautier et al., 1994). According to a study of diverse wheat sets (Morris, 2002), hard wheat varieties either lack or possess specific mutations for the pin coding genes. The wild-type pin alleles are found in soft wheat types (Bhave and Morris, 2008). In addition to the significance of the Ha gene, previous research has identified numerous additional QTLs linked to hardness (Heo and Sherman, 2013). In this study, we found seven MTAs on 7B, and no QTL for GH on 7B was reported. These MTAs on 7B could be novel alleles, indicating that both parental genotypes will likely contain the Ha locus hardness alleles.
Conclusion
This is the first study to report a GWAS for value added quality traits in bread wheat T. aestivum. Genetic and functional analysis of the associated genomic regions may enhance wheat quality. Overall, several lines with a combination of appropriate grain quality and agronomic traits were identified, especially for protein content that plays a vital role in tackling nutritional deficiencies or hidden hunger. Quality-enriched T. aestivum lines and genomic regions harboring grain quality SNPs can accelerate the breeding program for developing nutritional and value-added end product quality wheat varieties.
Data availability statement
The original contributions presented in the study are included in the article/Supplementary Material, further inquiries can be directed to the corresponding author/s.
Author contributions
MV: Formal analysis, Investigation, Writing – original draft, Writing – review & editing. PB: Data curation, Writing – review & editing. UK: Conceptualization, Project administration, Writing – review & editing. RS: Conceptualization, Funding acquisition, Supervision, Writing – review & editing. SK: Visualization, Writing – review & editing. VG: Resources, Visualization, Writing – review & editing. GM: Data curation, Formal analysis, Resources, Writing – review & editing. KT: Data curation, Writing – review & editing. ND: Writing – review & editing, Data curation, Formal analysis. AJ: Resources, Visualization, Conceptualization, Funding acquisition, Project administration, Supervision, Writing – review & editing.
Funding
The author(s) declare financial support was received for the research, authorship, and/or publication of this article. The financial support was provided by the US Agency for International Development (USAID) Feed the Future Innovation Lab for Applied Wheat Genomics (Cooperative Agreement No. AID-OAA-A-13–00051) and Department of Biotechnology, Govt. of India (Grant No. BT/Ag/Network/Wheat/2019–20).
Acknowledgments
The technical support provided by Mr. Avdhesh Kumar and Dr. Raj Kumar Jat is duly acknowledged.
Conflict of interest
Author UK was employed by the company Astralyan Agro OPC Pvt. Ltd.
The remaining authors declare that the research was conducted in the absence of any commercial or financial relationships that could be construed as a potential conflict of interest.
Publisher’s note
All claims expressed in this article are solely those of the authors and do not necessarily represent those of their affiliated organizations, or those of the publisher, the editors and the reviewers. Any product that may be evaluated in this article, or claim that may be made by its manufacturer, is not guaranteed or endorsed by the publisher.
Supplementary material
The Supplementary Material for this article can be found online at: https://www.frontiersin.org/articles/10.3389/fpls.2024.1419227/full#supplementary-material
References
Adhikari, A., Basnet, B. R., Crossa, J., Dreisigacker, S., Camarillo, F., Bhati, P. K., et al. (2020). Genome-wide association mapping and genomic prediction of anther extrusion in CIMMYT hybrid wheat breeding program via modeling pedigree, genomic relationship, and interaction with the environment. Front. Genet. 11, 586687. doi: 10.3389/fgene.2020.586687
Ain, Q. U., Rasheed, A., Anwar, A., Mahmood, T., Imtiaz, M., Mahmood, T., et al. (2015). Genome-wide association for grain yield under rainfed conditions in historical wheat cultivars from Pakistan. Front. Plant Sci. 6, 743. doi: 10.3389/fpls.2015.00743
Alandete-Saez, M., Ron, M., Leiboff, S., McCormick, S. (2011). Arabidopsis thaliana GEX1 has dual functions in gametophyte development and early embryogenesis. Plant J. Cell Mol. Biol. 68 (4), 620–632. doi: 10.1111/j.1365-313X.2011.04713.x
Alemu, A., El Baouchi, A., El Hanafi, S., Kehel, Z., Eddakhir, K., Tadesse, W., et al. (2021). Genetic analysis of grain protein content and dough quality traits in elite spring bread wheat (Triticum aestivum) lines through association study. J. Cereal Sci. 100, 103214. doi: 10.1016/j.jcs.2021.103214
Alvarado, G., Rodríguez, F. M., Pacheco, A., Burgueño, J., Crossa, J., Vargas, M., et al. (2020). META-R: A software to analyze data from multi-environment plant breeding trials. Crop J. 8, 745–756. doi: 10.1016/j.cj.2020.03.010
Bai, C., Sen, P., Hofmann, K., Ma, L., Goebl, M., Harper, J. W., et al. (1996). SKP1 connects cell cycle regulators to the ubiquitin proteolysis machinery through a novel motif, the f-box. Cell 86 (2), 263–274. doi: 10.1016/s0092-8674(00)80098-7
Bernier, A. M., Howes, N. K. (1994). Quantification of variation in tyrosinase activity among durum and common wheat cultivars. J. Cereal Sci. 19, 157–159. doi: 10.1006/jcrs.1994.1021
Bezerra, G. A., Dobrovetsky, E., Dong, A., Seitova, A., Crombett, L., Shewchuk, L. M., et al. (2012). Structures of human DPP7 reveal the molecular basis of specific inhibition and the architectural diversity of proline-specific peptidases. PloS One 7 (8), e43019. doi: 10.1371/journal.pone.0043019
Bhatta, M., Morgounov, A., Belamkar, V., Baenziger, P. S. (2018). Genome-wide association study reveals novel genomic regions for grain yield and yield-related traits in drought-stressed synthetic hexaploid wheat. Int. J. Mol. Sci. 19, 3011. doi: 10.3390/ijms19103011
Bhave, M., Morris, C. F. (2008). Molecular genetics of puroindolines and related genes: Allelic diversity in wheat and other grasses. Plant Mol. Biol. 66, 205–219. doi: 10.3390/ijms19103011
Blanco, A., Mangini, G., Giancaspro, A., Giove, S., Colasuonno, P., Simeone, R., et al. (2012). Relationships between grain protein content and grain yield components through quantitative trait locus analyses in a recombinant inbred line population derived from two elite durum wheat cultivars. Mol. Breeding 30, 79–92. doi: 10.1007/s11032-011-9600-z
Bradbury, P. J., Zhang, Z., Kroon, D. E., Casstevens, T. M., Ramdoss, Y., Buckler, E. S. (2007). TASSEL: Software for association mapping of complex traits in diverse samples. Bioinformatics 23, 2633–2635. doi: 10.1093/bioinformatics/btm308
Bouton, S., Leboeuf, E., Mouille, G., Leydecker, M. T., Talbotec, J., Granier, F., et al. (2002). QUASIMODO1 encodes a putative membrane-bound glycosyltransferase required for normal pectin synthesis and cell adhesion in arabidopsis. Plant Cell 14 (10), 2577–2590. doi: 10.1105/tpc.004259
Buchanan, B. B., Balmer, Y. (2005). Redox regulation: a broadening horizon. Annu Rev Plant Biol. 56, 187–220. doi: 10.1146/annurev.arplant.56.032604.144246
Cabral, A. L., Jordan, M. C., Larson, G., Somers, D. J., Humphreys, G., McCartney, C. A. (2018). Relationship between QTL for grain shape, grain weight, test weight, milling yield, and plant height in the spring wheat cross RL4452/ ‘AC Domain.’. PloS One 13, e0190681. doi: 10.1371/journal.pone.0190681
Cadalen, T., Sourdille, P., Charmet, G., Tixier, M. H., Gay, G., Boeuf, C., et al. (1998). Molecular markers linked to genes affecting plant height in wheat using a doubled-haploid population. Theor. Appl. Genet. 96, 933–940. doi: 10.1007/s001220050823
Cappelli, A., Cini, E. (2021). Challenges and opportunities in wheat flour, pasta, bread, and bakery product production chains: A systematic review of innovations and improvement strategies to increase sustainability, productivity, and product quality. Sustainability 13, 2608. doi: 10.3390/su13052608
Carter, B. P., Morris, C. F., Anderson, J. A. (1999). Optimizing the SDS sedimentation test for end-use quality selection in a soft white and club wheat breeding program. Cereal Chem. 76, 907–911. doi: 10.1094/CCHEM.1999.76.6.907
Cox, M. C., Qualset, C. O., Rains, D. W. (1985). Genetic variation for nitrogen assimilation and translocation in wheat. I. Dry matter and nitrogen accumulation. Crop Sci. 25, 430–435. doi: 10.2135/cropsci1985.0011183X002500030002x
Doyle, J. J., Doyle, J. L. (1987). A rapid DNA isolation procedure for small quantities of fresh leaf tissue. Phytochem. Bull. 19, 11–15.
Edae, E. A., Bowden, R. L., Poland, J. (2015). Application of population sequencing (POPSEQ) for ordering and imputing genotyping-by-sequencing markers in hexaploid wheat. G3 Genes Genomes Genet. 5, 2547–2553. doi: 10.1534/g3.115.020362
El-Feki, W. M., Byrne, P. F., Reid, S. D., Lapitan, N. L. V., Haley, S. D. (2013). Quantitative trait locus mapping for end-use quality traits in hard winter wheat under contrasting soil moisture levels. Crop Sci. 53, 1953–1967. doi: 10.2135/cropsci2012.12.0674
Fu, D., Libson, A., Miercke, L. J., Weitzman, C., Nollert, P., Krucinski, J., et al. (2000). Structure of a glycerol-conducting channel and the basis for its selectivity. Sci. (New York N.Y.) 290 (5491), 481–486. doi: 10.1126/science.290.5491.481
Gahlaut, V., Jaiswal, V., Tyagi, B. S., Singh, G., Sareen, S., Balyan, H. S., et al. (2019). Multi-locus genome wide association mapping for yield and its contributing traits in hexaploid wheat under different water regimes. Sci. Rep. 9, 19486. doi: 10.1038/s41598-019-55520-0
Gao, F., Wen, W., Liu, J., Rasheed, A., Yin, G., Xia, X., et al. (2015). Genome-wide linkage mapping of QTL for yield components, plant height and yield-related physiological traits in the Chinese wheat cross Zhou 8425B/Chinese spring. Front. Plant Sci. 6, 1099. doi: 10.3389/fpls.2015.01099
Gautier, M. F., Aleman, M. E., Guirao, A., Marion, D., Joudrier, P. (1994). Triticum aestivum puroindolines, two basic cystine-rich seed proteins: cDNA sequence analysis and developmental gene expression. Plant Mol. Biol. 25, 43–57. doi: 10.1007/BF00024197
Glaubitz, J. C., Casstevens, T. M., Lu, F., et al. (2014). TASSEL-GBS: A high capacity genotyping by sequencing analysis pipeline. PloS One 9, e90346. doi: 10.1371/journal.pone.0090346
Goel, S., Singh, K., Singh, B., Grewal, S., Dwivedi, N., Alqarawi, A. A., et al. (2019). Analysis of genetic control and QTL mapping of essential wheat grain quality traits in a recombinant inbred population. PloS One 14, e0200669. doi: 10.1371/journal.pone.0200669
Güçbilmez, Ç. M., Şahin, M., Akçacık, A. G., Aydoğan, S., Demir, B., Hamzaoğlu, S., et al. (2019). Evaluation of GlutoPeak test for prediction of bread wheat flour quality, rheological properties and baking performance. J. Cereal Sci. 90, 102827. doi: 10.1016/j.jcs.2019.102827
Gupta, O. P., Pandey, V., Saini, R., Narwal, S., Malik, V.K., Khandale, T., et al. (2020). Identifying transcripts associated with efficient transport and accumulation of Fe and Zn in hexaploid wheat (T. aestivum L.). J. Biotechnol. 316, 46–55. doi: 10.1016/j.jbiotec.2020.03.015
Guzmán, C., Ammar, K., Govindan, V., Singh, R. (2019). Genetic improvement of wheat grain quality at CIMMYT. Front. Agric. Sci. Eng. 6, 265–272. doi: 10.15302/J-FASE-2019260
Guzmán, C., Peña, R. J., Singh, R., Atrique, E., Dreisigacker, S., Crossa, J., et al. (2016). Wheat quality improvement at CIMMYT and the use of genomic selection on it. Appl. Transl. Genom. 11, 3–8. doi: 10.1016/j.atg.2016.10.004
Hassani-Pak, K., Singh, A., Brandizi, M., Hearnshaw, J., Parsons, J.D., Amberkar, S., et al. (2021). KnetMiner: a comprehensive approach for supporting evidence-based gene discovery and complex trait analysis across species. Plant Biotechnol. J. 19, 1670–1678. doi: 10.1111/pbi.13583
Heo, H., Sherman, J. (2013). Identification of QTL for grain protein content and grain hardness from winter wheat for genetic improvement of spring wheat. Plant Breed Biotechnol. 1, 347–353. doi: 10.9787/PBB.2013.1.4.347
Huang, X. Q., Cloutier, S., Lycar, L., et al. (2006). Molecular detection of QTLs for agronomic and quality traits in a doubled haploid population derived from two Canadian wheats (Triticum aestivum L.). Theor. Appl. Genet. 113, 753–766. doi: 10.1007/s00122-006-0346-7
Ibba, M. I., Crossa, J., Montesinos-López, O. A., et al. (2020). Genome-based prediction of multiple wheat quality traits in multiple years. Plant Genome 13, e20034. doi: 10.1002/tpg2.20034
IWGSC (2018). Shifting the limits in wheat research and breeding using a fully annotated reference genome. Science 80-). 361, 1–163.
Jamil, M., Ali, A., Gul, A., Ghafoor, A., Napar, A. A., Ibrahim, A. M. H., et al. (2019). Genome-wide association studies of seven agronomic traits under two sowing conditions in bread wheat. BMC Plant Biol. 19, 149. doi: 10.1186/s12870-019-1754-6
Jiang, Y., Schmidt, R. H., Zhao, Y., Reif, J. C. (2017). Quantitative genetic framework highlights the role of epistatic effects for grain-yield heterosis in bread wheat. Nat. Genet. 49, 1741–1746. doi: 10.1038/ng.3974
Johnson, T. W., Shen, G., Zybailov, B., Kolling, D., Reategui, R., Beauparlant, S., et al. (2000). Recruitment of a foreign quinone into the A(1) site of photosystem i. i. genetic and physiological characterization of phylloquinone biosynthetic pathway mutants in synechocystis sp. pcc 6803. J. Biol. Chem. 275 (12), 8523–8530.
Juliana, P., Poland, J., Huerta-Espino, J., Shrestha, S., Crossa, J., Crespo-Herrera, L., et al. (2019). Improving grain yield, stress resilience and quality of bread wheat using large-scale genomics. Nat. Genet. 51, 1530–1539. doi: 10.1038/s41588-019-0496-6
Kumar, A., Jain, S., Elias, E. M., Ibrahim, M., Sharma, L. K. (2018). “An overview of QTL identification and marker-assisted selection for grain protein content in wheat,” in Eco-friendly Agro-biological Techniques for Enhancing Crop Productivity. Eds. Sengar, R., Singh, A. (Springer, Singapore). doi: 10.1007/978-981-10-6934-5_11
Kumar, A., Mantovani, E. E., Simsek, S., Jain, S., Elias, E. M., Mergoum, M.. (2019). Genome wide genetic dissection of wheat quality and yield related traits and their relationship with grain shape and size traits in an elite × non-adapted bread wheat cross. PloS One 14, e0221826. doi: 10.1371/journal.pone.0221826
Kumar, S., Sohu, V. S., Gupta, S. K., Singh, R. P., Bains, N. S. (2018). Understanding the chapati making attributes of the Indian wheats – I: The physico-chemical basis. J. Appl. Natural Sci. 10, 572–592. doi: 10.31018/jans.v10i2.1739
Langmead, B., Salzberg, S. L. (2012). Fast gapped-read alignment with Bowtie 2. Nat. Methods 9, 357–359. doi: 10.1038/nmeth.1923
Li, J., Cui, F., Ding, Am., Zhao, C-h., Wang, X-q., Wang, L., et al. (2012). QTL detection of seven quality traits in wheat using two related recombinant inbred line populations. Euphytica 183, 207–226. doi: 10.1007/s10681-011-0448-4
Li, Z. K., Jiang, X. L., Peng, T., Shi, C. L., Han, S. X., Tian, B., et al. (2014). Mapping quantitative trait loci with additive effects and additive x additive epistatic interactions for biomass yield, grain yield, and straw yield using a doubled haploid population of wheat (Triticum aestivum L.). Genet. Mol. Res. 13, 1412–1424. doi: 10.4238/2014.February.28.14
Li, Y., Song, Y., Zhou, R., Branlard, G., Jia, J. (2009). Detection of QTLs for bread-making quality in wheat using a recombinant inbred line population. Plant Breeding 128, 235–243. doi: 10.1111/j.1439-0523.2008.01578.x
Liu, Y., Lin, Y., Gao, S., Li, Z., Ma, J., Deng, M., et al (2017). A genome-wide association study of 23 agronomic traits in Chinese wheat landraces. Plant J. 91, 861–873. doi: 10.1111/tpj.13614
Lopes, M. S., Dreisigacker, S., Peña, R. J., Sukumaran, S., Reynolds, M. P. (2015). Genetic characterization of the wheat association mapping initiative (WAMI) panel for dissection of complex traits in spring wheat. Theor. Appl. Genet. 128, 453–464. doi: 10.1007/s00122-014-2444-2
Ma, F., Baik, B. K. (2018). Soft wheat quality characteristics required for making baking powder biscuits. J. Cereal Sci. 79, 127–133. doi: 10.1016/j.jcs.2017.10.016
Mann, G., Diffey, S., Cullis, B., Azanza, F., Martin, D., Kelly, A., et al. (2009). Genetic control of wheat quality: Interactions between chromosomal regions determining protein content and composition, dough rheology, and sponge and dough baking properties. Theor. Appl. Genet. 118, 1519–1537. doi: 10.1007/s00122-009-1000-y
Maphosa, L., Langridge, P., Taylor, H., Parent, B., Emebiri, L. C., Kuchel, H., et al. (2014). Genetic control of grain yield and grain physical characteristics in a bread wheat population grown under a range of environmental conditions. Theor. Appl. Genet. 127, 1607–1624. doi: 10.1007/s00122-014-2322-y
Matthews, J. M., Sunde, M. (2002). Zinc fingers–folds for many occasions. IUBMB Life 54 (6), 351–355. doi: 10.1080/15216540216035
Mengistu, D. K., Kidane, Y. G., Catellani, M., Frascaroli, E., Fadda, C., Pè, M. E., et al. (2016). High-density molecular characterization and association mapping in Ethiopian durum wheat landraces reveals high diversity and potential for wheat breeding. Plant Biotechnol. J. 14, 1800–1812. doi: 10.1111/pbi.12538
Missbach, S., Weis, B. L., Martin, R., Simm, S., Bohnsack, M. T., Schleiff, E. (2013). 40S ribosome biogenesis co-factors are essential for gametophyte and embryo development. PloS One 8 (1), e54084. doi: 10.1371/journal.pone.0054084
Mladenov, V., Banjac, B., Krishna, A., Miloaević, M. (2012). Relation of grain protein content and some agronomic traits in European cultivars of winter wheat. Cereal Res. Commun. 40, 532–541. doi: 10.1556/CRC.40.2012.0004
Mohan, D., Sendhil, R., Gupta, O. P., Pandey, V., Krishnappa, G., Singh, G. P. (2022). Wheat quality index: new holistic approach to identify quality superior genotypes. Cereal Res. Commun. 50, 1105–1115. doi: 10.1007/s42976-022-00254-5
Mondal, S., Rutkoski, J. E., Velu, G., Singh, P. K., Crespo-Herrera, L. A., Guzmán, C., et al. (2016). Harnessing diversity in wheat to enhance grain yield, climate resilience, disease and insect pest resistance and nutrition through conventional and modern breeding approaches. Front. Plant Sci. 7. doi: 10.3389/fpls.2016.00991
Morris, C. F. (2002). Puroindolines: The molecular genetic basis of wheat grain hardness. Plant Mol. Biol. 48, 633–647. doi: 10.1023/A:1014837431178
Mozzarelli, A., Bettati, S. (2006). Exploring the pyridoxal 5'-phosphate-dependent enzymes. Chem. Rec. (New York N.Y.) 6 (5), 275–287. doi: 10.1002/tcr.20094
Murre, C., McCaw, P. S., Baltimore, D. (1989). A new DNA binding and dimerization motif in immunoglobulin enhancer binding, daughterless, MyoD, and myc proteins. Cell 56 (5), 777–783. doi: 10.1016/0092-8674(89)90682-x
Nair, S. K., Tomar, S. M. S. (2001). Genetics of phenol colour reaction of grains and glumes in tetraploid and hexaploid wheats. J. Genet. Breed. 55, 369–373.
Nakamura, K., Taniguchi, Y., Taira, M., Ito, H. (2012). Investigation of soft wheat flour quality factors associated with sponge cake sensory tenderness. Cereal Chem. 89, 79–83. doi: 10.1094/CCHEM-07-11-0081
Niu, N., Arief, V. N., Delacy, I. H., Lush, D., Sheppard, J., Zhang, G., et al. (2010). Genetic gain in yield and protein over two cycles of a wheat recurrent selection program. Breed Sci. 60, 181–186. doi: 10.1270/jsbbs.60.181
Patterson, N., Price, A. L, Reich, D. (2006). Population structure and eigenanalysis. PloS Genet. 2, e190. doi: 10.1371/journal.pgen.0020190
Peleg, Z., Cakmak, I., Ozturk, L., Yazici, A., Jun, Y., Budak, H., et al. (2009). Quantitative trait loci conferring grain mineral nutrient concentrations in durum wheat × wild emmer wheat RIL population. Theor. Appl. Genet. 119, 353–369. doi: 10.1007/s00122-009-1044-z
Peña, R. J., Trethowan, R., Pfeiffer, W. H., van Ginkel, M. (2012). Quality (end-use) improvement in wheat compositional, genetic, and environmental factors. J. Crop Prod. 5, 1–37. doi: 10.1300/j144v05n01_02
Poland, J. A., Brown, P. J., Sorrells, M. E., Jannink, J. L. (2012). Development of high-density genetic maps for barley and wheat using a novel two-enzyme genotyping-by-sequencing approach. PloS One 7, e32253. doi: 10.1371/journal.pone.0032253
Price, A. L., Patterson, N. J., Plenge, R. M., Weinblatt, M. E., Shadick, N. A., Reich, D. (2006). Principal components analysis corrects for stratification in genome-wide association studies. Nat. Genet. 38, 904–909. doi: 10.1038/ng1847
Rathan, N. D., Krishna, H., Ellur, R. K., Sehgal, D., Govindan, V., Ahlawat, A. K., et al. (2022). Genome-wide association study identifies loci and candidate genes for grain micronutrients and quality traits in wheat (Triticum aestivum L.). Sci. Rep. 12, 7037. doi: 10.1038/s41598-022-10618-w
Ray, D. K., Mueller, N. D., West, P. C., Foley, J. A. (2013). Yield trends are insufficient to double global crop production by 2050. PloS One 8, e66428. doi: 10.1371/journal.pone.0066428
Ray, D. K., Ramankutty, N., Mueller, N. D., West, P. C., Foley, J. A. (2012). Recent patterns of crop yield growth and stagnation. Nat. Commun. 3, 1293. doi: 10.1038/ncomms2296
Riaz, A., Athiyannan, N., Periyannan, S. K., Afanasenko, O., Mitrofanova, O. P., Platz, G. J., et al. (2018). Unlocking new alleles for leaf rust resistance in the Vavilov wheat collection. Theor. Appl. Genet. 131, 127–144. doi: 10.1007/s00122-017-2990-5
Ruppel, N. J., Logsdon, C. A., Whippo, C. W., Inoue, K., Hangarter, R. P. (2011). A mutation in arabidopsis seedling plastid development1 affects plastid differentiation in embryo-derived tissues during seedling growth. Plant Physiol. 155 (1), 342–353. doi: 10.1104/pp.110.161414
Santana-Molina, C., Gutierrez, F., Devos, D. P. (2021). Homology and modular evolution of CATCHR at the origin of the eukaryotic endomembrane system. Genome Biol. Evol. 13 (7), evab125. doi: 10.1093/gbe/evab125
Semnaninejad, H., Nourmohammadi, G., Rameeh, V., Cherati, A. (2021). Correlation and path coefficient analyses of phenological traits, yield components and quality traits in wheat. Rev. Bras. Engenharia Agricola e Ambiental 25, 597–603. doi: 10.1590/1807-1929/agriambi.v25n9p597-603
Sheoran, S., Jaiswal, S., Kumar, D., Raghav, N., Sharma, R., Pawar, S., et al. (2019). Uncovering genomic regions associated with 36 agro-morphological traits in Indian spring wheat using GWAS. Front. Plant Sci. 10, 527. doi: 10.3389/fpls.2019.00527
Shuey, W. C. (1960). A wheat sizing technique for predicting flour milling yield. Cereal Sci. Today 5, 71.
Sourdille, P., Perretant, M. R., Charmet, G., Leroy, P., Gautier, M. F., Joudrier, P., et al. (1996). Linkage between RFLP markers and genes affecting kernel hardness in wheat. Theor. Appl. Genet. 93, 580–586. doi: 10.1007/BF00417951
Sukumaran, S., Dreisigacker, S., Lopes, M., Chavez, P., Reynolds, M. P. (2015). Genome-wide association study for grain yield and related traits in an elite spring wheat population grown in temperate irrigated environments. Theor. Appl. Genet. 128, 353–363. doi: 10.1007/s00122-014-2435-3
Suprayogi, Y., Pozniak, C. J., Clarke, F. R., Clarke, J. M., Knox, R. E., Singh, A. K. (2009). Identification and validation of quantitative trait loci for grain protein concentration in adapted Canadian durum wheat populations. Theor. Appl. Genet. 119, 437–448. doi: 10.1007/s00122-009-1050-1
Thorwarth, P., Ahlemeyer, J., Bochard, A. M., Krumnacker, K., Blümel, H., Laubach, E., et al. (2017). Genomic prediction ability for yield-related traits in German winter barley elite material. Theor. Appl. Genet. 130, 1669–1683. doi: 10.1007/s00122-017-2917-1
Tian, X., Engel, B. A., Qian, H., Hua, E., Sun, S., Wang, Y. (2021). Will reaching the maximum achievable yield potential meet future global food demand? J. Cleaner Prod. 294, 126285. doi: 10.1016/j.jclepro.2021.126285
Tsenov, N., Gubatov, T., Yanchev, I. (2020). Correlations between grain yield and related traits in winter wheat under multi-environmental traits. Agric. Sci. Technol. 12, 295–300. doi: 10.15547/issn1314-412X
Uauy, C., Distelfeld, A., Fahima, T., Blechl, A., Dubcovsky, J. (2006). A NAC gene regulating senescence improves grain protein, zinc, and iron content in wheat. Science 314, 1298–1301. doi: 10.1126/science.1133649
van der Biezen, E. A., Jones, J. D. (1998). The NB-ARC domain: a novel signalling motif shared by plant resistance gene products and regulators of cell death in animals. Curr. Biol. CB 8 (7), R226–R227. doi: 10.1016/s0960-9822(98)70145-9
van Ittersum, M. K., van Bussel, L. G. J., Wolf, J., Grassini, P., van Wart, J., Guilpart, N., et al. (2016). Can sub-Saharan Africa feed itself? Proc. Natl. Acad. Sci. U. S. A. 113, 14964–14969. doi: 10.1073/pnas.1610359113
Vishwakarma, M. K., Arun, B., Mishra, V. K., Yadav, P. S., Kumar, H., Joshi, A. K. (2016). Marker-assisted improvement of grain protein content and grain weight in Indian bread wheat. Euphytica 208, 313–321. doi: 10.1007/s10681-015-1598-6
Vishwakarma, M. K., Mishra, V. K., Gupta, P. K., Yadav, P. S., Kumar, H., Joshi, A. K. (2014). Introgression of the high grain protein gene Gpc-B1 in an elite wheat variety of Indo-Gangetic Plains through marker assisted backcross breeding. Curr. Plant Biol. 1, 60–67. doi: 10.1016/j.cpb.2014.09.003
Weis, C., Hückelhoven, R., Eichmann, R. (2013). LIFEGUARD proteins support plant colonization by biotrophic powdery mildew fungi. J. Exp. Bot. 64 (12), 3855–3867. doi: 10.1093/jxb/ert217
Woese, C. R., Olsen, G. J., Ibba, M., Söll, D. (2000). Aminoacyl-tRNA synthetases, the genetic code, and the evolutionary process. Microbiol. Mol. Biol. Rev. MMBR 64 (1), 202–236. doi: 10.1128/MMBR.64.1.202-236.2000
Woo, J. S., Imm, J. H., Min, C. K., Kim, K. J., Cha, S. S., Oh, B. H. (2006). Structural and functional insights into the B30.2/SPRY domain. EMBO J. 25 (6), 1353–1363. doi: 10.1038/sj.emboj.7600994
Worland, A. J. (1996). The influence of flowering time genes on environmental adaptability in European wheats. Euphytica 89, 49–57. doi: 10.1007/BF00015718
Würschum, T., Leiser, W. L., Langer, S. M., Tucker, M. R., Longin, C. F.H. (2018). Phenotypic and genetic analysis of spike and kernel characteristics in wheat reveals long-term genetic trends of grain yield components. Theor. Appl. Genet. 131, 2071–2084. doi: 10.1007/s00122-018-3133-3
Xu, X., Bai, G., Carver, B. F., Shaner, G. E. (2005). A QTL for early heading in wheat cultivar Suwon 92. Euphytica 146, 233–237. doi: 10.1007/s10681-005-9017-z
Yang, Y., Chai, Y., Zhang, X., Lu, S., Zhao Z, Z., Wei, D., et al (2020). Multi-locus GWAS of quality traits in bread wheat: mining more candidate genes and possible regulatory network. Front. Plant Sci. 11. doi: 10.3389/fpls.2020.01091
Yu, J., Pressoir, G., Briggs, W. H., Vroh Bi, I., Yamasaki, M., Doebley, J. F., et al. (2006). A unified mixed-model method for association mapping that accounts for multiple levels of relatedness. Nat. Genet. 38, 203–208. doi: 10.1038/ng1702
Zampieri, M., Ceglar, A., Dentener, F., Toreti, A. (2017). Wheat yield loss attributable to heat waves, drought and water excess at the global, national and subnational scales. Environ. Res. Lett. 12, 064008. doi: 10.1088/1748-9326/aa723b
Zanke, C., Ling, J., Plieske, J., Kollers, S., Ebmeyer, E., Korzun, V., et al. (2014). Genetic architecture of main effect QTL for heading date in European winter wheat. Front. Plant Sci. 5. doi: 10.3389/fpls.2014.00217
Zhang, P., Guo., G., Wu., Q., Chen, Y., Xie, J., Lu, P., et al. (2020). Identification and fine mapping of spot blotch (Bipolaris sorokiniana) resistance gene Sb4 in wheat. Theor. Appl. Genet. 133, 2451–2459. doi: 10.1007/s00122-020-03610-3
Zhang, K., Tian, J., Zhao, L., Liu, B., Chen, G. (2009). Detection of quantitative trait loci for heading date based on the doubled haploid progeny of two elite Chinese wheat cultivars. Genetica 135, 257–265. doi: 10.1007/s10709-008-9274-6
Zhang, C., Zheng, B., He, Y. (2021). Improving grain yield via promotion of kernel weight in high yielding winter wheat genotypes. Biology 11, 42. doi: 10.3390/biology11010042
Keywords: wheat, GWAS, quality traits, grain protein, MTAS, SNPs, end-use quality
Citation: Vishwakarma MK, Bhati PK, Kumar U, Singh RP, Kumar S, Govindan V, Mavi GS, Thiyagarajan K, Dhar N and Joshi AK (2024) Genetic dissection of value-added quality traits and agronomic parameters through genome-wide association mapping in bread wheat (T. aestivum L.). Front. Plant Sci. 15:1419227. doi: 10.3389/fpls.2024.1419227
Received: 17 April 2024; Accepted: 12 July 2024;
Published: 20 August 2024.
Edited by:
Somashekhar M. Punnuri, Fort Valley State University, United StatesReviewed by:
Yiyong Zhao, Harvard University, United StatesVikas Venu Kumaran, Indian Agricultural Research Institute (ICAR), India
Zihao Zheng, Syngenta, United States
Copyright © 2024 Vishwakarma, Bhati, Kumar, Singh, Kumar, Govindan, Mavi, Thiyagarajan, Dhar and Joshi. This is an open-access article distributed under the terms of the Creative Commons Attribution License (CC BY). The use, distribution or reproduction in other forums is permitted, provided the original author(s) and the copyright owner(s) are credited and that the original publication in this journal is cited, in accordance with accepted academic practice. No use, distribution or reproduction is permitted which does not comply with these terms.
*Correspondence: Manish K. Vishwakarma, bS52aXNod2FrYXJtYUBjZ2lhci5vcmc=; Arun K. Joshi, YS5rLmpvc2hpQGNnaWFyLm9yZw==