
95% of researchers rate our articles as excellent or good
Learn more about the work of our research integrity team to safeguard the quality of each article we publish.
Find out more
ORIGINAL RESEARCH article
Front. Plant Sci. , 24 July 2024
Sec. Plant Breeding
Volume 15 - 2024 | https://doi.org/10.3389/fpls.2024.1418328
This article is part of the Research Topic Manipulation of Plant Architecture for Crop Production View all 10 articles
 Kangni Han1
 Zhilan Wang1,2Lin Shen2
 Xiaofen Du1,2Shichao Lian1Yuxin Li1Yanfang Li1Chuchu Tang2Huixia Li1Linyi Zhang1Jun Wang1,2*
Plant height (PH) is a crucial trait for strengthening lodging resistance and boosting yield in foxtail millet. To identify quantitative trait loci (QTL) and candidate genes associated with PH, we first developed a genetic map using a recombinant inbred line (RIL) population derived from a cross between Aininghuang and Jingu 21. Then, PH phenotyping data and four variations of best linear unbiased prediction (BLUP) were collected from nine environments and three development stages. Next, QTL mapping was conducted using both unconditional and conditional QTL methods. Subsequently, candidate genes were predicted via transcriptome analysis of parental samples at three developmental stages. The results revealed that the genetic map, based on re-sequencing, consisted of 4,360 bin markers spanning 1,016.06 cM with an average genetic distance of 0.23 cM. A total of 19 unconditional QTL, accounting for 5.23%–35.36% of the phenotypic variation explained (PVE), which included 7 major and 4 stable QTL, were identified. Meanwhile, 13 conditional QTL, explaining 5.88%–40.35% of PVE, including 5 major and 3 stable QTL, were discovered. Furthermore, four consistent and stable QTL were identified. Finally, eight candidate genes were predicted through RNA-seq and weighted gene co-expression network analysis (WGCNA). Those findings provide a crucial foundation for understanding the genetic mechanisms underlying PH development and facilitate molecular marker-assisted breeding of ideal plant types in foxtail millet.
Foxtail millet (Setaria italica L., 2n=2x=18), with a cultivation history extending over 16,000 years in China (Doust et al., 2009), is considered an important source of food and fodder globally, particularly in the arid and semi-arid regions such as India and China (Singh and Prasad, 2020). Because of its higher resistance to drought, higher adaptability to infertile soils, and higher water use efficiency, foxtail millet not only is of immense significance for the advancement of ecological agriculture (Singh et al., 2024), but also plays a key role in adjusting cropping structures as a strategic reserve crop (Diao, 2019; Ramesh et al., 2023). However, increasing yield and environmental adaptability in foxtail millet, compared to other major cereal crops like maize, remains a significant potential, by developing short-statured and lodging-resistant varieties (Diao et al., 2014).
Plant height (PH), a critical agronomic trait, is closely linked to plant architecture and yield. Ideal PH can improve plant lodging resistance and photosynthesis–respiration balance as well as increase stress resistance, thereby contributing to higher yields (Stubbs et al., 2023). As a quantitative trait, PH is influenced by the intricate interplay of genetic, hormonal, and environment factors. Advances in molecular biology technology have made it easier to identify quantitative trait loci (QTL) for PH through linkage and/or association analysis. So far, more than 100 QTL for PH in foxtail millet have been identified in multiple environments and widely distributed on nine chromosomes. Among those, 24 were identified repeatedly, namely, qPH1–1, qPH1–2, qPH1–3, qPH2–1, qPH2–2, qPH2–3, qPH3–1, qPH3–2, qPH3–3, qPH4–1, qPH4–2, qPH4–3, qPH4–4, qPH5–1, qPH5–2, qPH6–1, qPH6–2, qPH6–3, qPH7, qPH8–1, qPH8–2, qPH9–1, qPH9–2, and qPH9–3 (Mauro-Herrera and Doust, 2016; Fan et al., 2017; Feldman et al., 2017; Zhang et al., 2017; He et al., 2021). Notably, qPH5–2, located on chromosome 5, contributed to the highest proportion of phenotypic variation explained (PVE) (61.5%) (Mauro-Herrera and Doust, 2016). To date, five QTL or genes, SiD2, SiD3, SiDw1, Seita.1G242300, and Seita.5G404900, which regulated PH development through gibberellin synthesis and signaling pathways, have been fine mapped and cloned in foxtail millet (Xue et al., 2016; Fan et al., 2017; He et al., 2021; Zhu et al., 2023). Notably, SiDw1, a GRAS family gene encoding a DELLA protein, homologous with GAI/RGA in Arabidopsis, SLR1 in rice, D8 in maize, and Rht-B1b and Rht-D1b in wheat, has been functionally validated (Zhao et al., 2019).
All previously mentioned QTL and genes were identified using a conventional mapping method to analyze phenotype data at maturity. However, the development of PH is a complex and dynamic process, influenced by complex genetic networks and environment factors. Numerous genes involved in PH development exhibit dynamic expression patterns across various development stages (Che et al., 2020; Fu et al., 2022; Wu et al., 2022). To fully understand the regulatory mechanisms of PH development, it is imperative to determine the temporal and spatial expression patterns of underlying genes. Consequently, it is of paramount importance to accurately identify QTL and how to regulate PH across entire development stages.
Multiple major and stage-specific QTL for PH in crops such as wheat, cotton, and rice have been identified by dynamic QTL mapping, indicating that PH is differentially expressed throughout the plant development process (Che et al., 2020; Fu et al., 2022; Wu et al., 2022). In foxtail millet, only Mauro-Herrera and Doust (2016) carried out dynamic QTL mapping for PH in a RIL population and found that the QTL H9a, with a PVE ranging from 7.6% to 15.5%, had a significant and consistent impact during the vegetative growth, flowering, and harvest stages under varying environmental conditions. However, research on dynamic QTL mapping for PH throughout the entire developmental process is still scarce.
In the present study, both unconditional and conditional QTL mapping methods were employed to identify QTL associated with PH. This approach will enable us to uncover QTL that are specifically expressed only under certain conditions and those stably expressed across different environment conditions and developmental stages. By further integrating of RNA-seq and weighted gene co-expression network analysis (WGCNA), we aim to identify candidate genes potentially involved in regulating PH. These findings will not only deepen our understanding of the molecular mechanisms underlying the dynamic development of PH, but also lay a foundation for the fine mapping and cloning of QTL for PH in foxtail millet.
To carry out QTL mapping, we developed an F2:7 recombinant inbred line (RIL) population consisting of 127 lines. This population was created using the single-seed descent method in a cross between Aininghuang (female parent, derived from natural variation of Ninghuang 1) and Jingu 21 [male parent, accession number: GPD Foxtail millet (2017)140009, obtained from Co60-irradiated Jinfen 52 dry seeds]. Aininghuang is characterized by a dwarf phenotype of approximately 110 cm, whereas Jingu 21 typically attained a taller stature, approximately 180 cm. The RIL population, along with two parents, was cultivated in three distinct experiment sites in Shanxi Province (China), during three crop seasons (2020–2022). The sites included Datong (DT, 39.3°N, 113.3°E), characterized by a cold–dry climate, with growing season temperatures ranging from 15°C to 25°C, and an annual precipitation of approximately 400 mm; Jinzhong (JZ, 37.6°N, 112.7°E), characterized by a semi-arid climate where summer temperatures often exceed 30°C and annual precipitation is approximately 450 mm; and Changzhi (CZ, 36.2°N, 113.1°E), which has a humid subtropical climate with temperatures ranging from 20°C to 28°C and an annual precipitation of approximately 550 mm. A randomized complete block design (RCBD) (Federer, 1955) with three replications was used. Each experimental block comprised two parents and all 127 lines of the RIL population. A wide–narrow row planting pattern, with a wide row of 0.48 m and a narrow row of 0.18 m, was used to cultivate all plant materials. Each plot was allocated to two rows with 2 m in length. Thinning was conducted to ensure a density of 25 plants per row once the third leaf emerged.
PH was dynamically evaluated at three key development stages: jointing (T1), heading (T2), and harvest (T3). At T1 and T2, PH measurement was taken from the soil surface to the apex of the main stem; at T3, PH was measured from the soil surface to the tip of the main panicle. For phenotyping, five well-grown plants from the middle of one row, randomly selected in each line, were investigated. Net increases in PH were quantified as ΔT1–2 and ΔT2–3, representing the increases from T1 to T2 and from T2 to T3, respectively. Generalized heritability (H2) was classified into three levels: low (less than 20%), medium (between 20% and 40%), and high (more than 40%) (Wang et al., 2018).
Genomic DNA from leaves of the biparent and RILs was isolated via the CTAB method (Chen and Ronald, 1999). Re-sequencing was carried out according to the CASAVA 1.8 (Illumina, Inc., San Diego, CA, USA). Genomic DNA was sheared into ~350-bp fragments for library construction. Paired-end reads (150 bp) were sequenced using the HiSeq 2500 system (Illumina, Inc., San Diego, CA, USA), with the target sequencing depth for each sample set at 30×. Raw reads were filtered based on barcode sequences. After trimming, clean reads were aligned to the Yugu1 genome sequence (Setaria italica v2.2) using the Burrows–Wheeler Aligner (BWA) software (Li and Durbin, 2009). Duplicate marking was performed using Picard tools (Picard, http://sourceforge.net/projects/picard/), and Genome Analysis Toolkit (GATK) (McKenna et al., 2010) was used for InDel realignment and base recalibration as part of the preprocessing steps. Subsequently, GATK was utilized again for the detection and filtering of single-nucleotide polymorphisms (SNPs) to obtain the final set of SNP sites. Finally, SNPs identified between two parents were considered polymorphic, with those exhibiting an aa×bb pattern being selected for subsequent analysis.
To enhance the quality of the genetic map, further filtration and selection of polymorphic SNP markers from the initial set of 712,243 SNPs were performed. Sliding scans across chromosomes for genotyping were determined by a window of 15 SNPs and a step size of 1 SNP. When the count of “aa” or “bb” genotypes within the window reached or surpassed 11, it was classified as “aa” or “bb”; otherwise, it was imputed and corrected to “ab” (Huang et al., 2009). In the RIL population, SNP loci were compared against parental genotypes for binning. Samples were organized based on their chromosomal positions, marking genotype transitions as recombination breakpoints and grouping corresponding SNPs into bins. Bins shorter than 10 kb and markers exhibiting significant segregation distortion were further excluded to minimize bias. Filtered bins were utilized for genotyping analysis and further segmented into various linkage groups with HighMap software (Sasaki and International Rice Genome Sequencing, P, 2005).
PH data from the RIL population were collected from nine different environments (20CZ, 20JZ, 20DT, 21CZ, 21JZ, 21DT, 22CZ, 22JZ, and 22DT). In addition, four best linear unbiased predictions (BLUPs) were calculated to account for environmental variability. Four BLUPs were designated as follows: BLUP1 for CZ, BLUP2 for JZ, BLUP3 for DT, and BLUP4 representing a combined analysis across all nine environments. Each individual test was based on data from a single year, location, or stage, respectively. Unconditional QTL referred to the cumulative effects at T1, T2, and T3 stages under various environmental conditions (Fu et al., 2022; Meyer et al., 2023), while conditional QTL referred to the net genetic effects during ΔT1–2 and ΔT2–3 (Zhu, 1995; Wu et al., 1997). In total, 65 tests were conducted, consisting of 39 tests for unconditional QTL mapping and 26 tests for conditional QTL mapping. Among the unconditional QTL mapping tests, 27 were conducted at T1, T2, and T3 stages across nine different environments, and 12 were conducted at T1, T2, and T3 stages using four BLUPs. Correspondingly, in the 26 conditional QTL mapping tests, 18 were carried out during ΔT1–2 and ΔT2–3 across nine environments, and 8 were performed using four BLUPs during ΔT1–2 and ΔT2–3.
QTL mapping analysis was conducted using the Inclusive Composite Interval Mapping (ICIM) method of the IciMapping 4.2 software (Meng et al., 2015), with a stepwise distance of 1 cM and a PIN value set at 0.001. Candidate QTL were identified based on a threshold corresponding to a 0.995 confidence level through a permutation test conducted 1,000 times. QTL name was designated as “q+PH+chromosome number+‘-’+number” (Mccouch et al., 1997). Unconditional QTL and conditional QTL were distinguished by prefixes “G” and “D”, respectively. Major QTL referred to those identified at least in two tests with a LOD score greater than 3.0 and a PVE greater than 10%. Stable QTL were those identified in more than three tests (Sun et al., 2012; Fan et al., 2015).
RNA from two parents was prepared from the penultimate internode at T1 and T2, and the internode below the panicle at T3, respectively, with three biological replicates. RNA extraction and cDNA library construction were conducted by Biomarker Technologies (Beijing, China) according to standard procedures. The cDNA libraries were sequenced on the Illumina HiSeq 2500 platform with paired-end 150-bp reads. After filtering raw reads with Trimmomatic (Bolger et al., 2014), 116.45 Gb of clean reads were obtained, with the percentage of Q30 bases in each sample being not less than 92.38% (Supplementary Table S1). The clean reads were mapped to the Yugu 1 reference genome using Hisat2 (Kim et al., 2015), and alignments were quantified with StringTie (Pertea et al., 2015).
Gene expression level was calculated using fragments per kilobase of transcript per million fragments mapped reads (FPKM) method. Differential gene expression analysis was conducted using DESeq2 (Love et al., 2014), with criteria set for a false discovery rate (FDR) < 0.01 and a fold change ≥ 2. Following the sequencing of the library preparations on an Illumina platform and the generation of paired-end reads, a comprehensive data analysis was undertaken. This processing included quality control, comparative analysis, functional annotation of genes, SNP calling, quantification of gene expression levels, and differential expression analysis.
To elucidate the biological significance of gene expression changes, Gene Ontology (GO) and Kyoto Encyclopedia of Genes and Genomes (KEGG) pathway enrichment analyses were performed using BMKCloud (www.biocloud.net). KEGG analysis was used to find the pathways of three stages, then DEGs across three stages were identified as candidate genes for dynamic PH. Furthermore, WGCNA was conducted based on PH phenotype and differential gene expression levels to identify significantly related modules, and then the functions of the genes within these modules were then analyzed using BMKCloud.
Total RNA was extracted from the penultimate internode at T1 and T2, and the internode below the panicle at T3, using RNAiso Plus (TaKaRa Bio Inc., Shiga, Japan), following the manufacturer’s instructions. An equal amount of 2.0 μg of total RNA was reverse-transcribed to cDNA using oligo dT primers in the PrimeScript II 1st Strand cDNA Synthesis Kit (TaKaRa Bio Inc., Shiga, Japan). Primer 3.0 (https://primer3.ut.ee/) was employed to design qRT-PCR primers based on sequences from the S. italica v2.2 genome (https://phytozome-next.jgi.doe.gov/info/Sitalica_v2_2). The qRT-PCR reaction was performed on an ABI7500 system in a 10.0-μL volume containing 1.0 μL of template cDNA, 5.0 μL of TB Green Premix Ex Tap II (TaKaRa Bio Inc., Shiga, Japan), 2.0 μL of primer (2 μmol L−1), and 2.0 μL of ddH2O. The reaction conditions were as follows: 95°C for 3 min, followed by 40 cycles of 95°C for 10 s, 58°C for 30 s, and 72°C for 30 s, followed by a melt curve at 65–95°C by increments of 0.5°C/s. The ACTIN of S. italica was used as the internal reference, and the relative expression levels of interested genes were calculated using the 2−ΔΔCT method (Kong et al., 2019a, b). All primer sequences used in the present study are listed in Supplementary Table S2.
Descriptive statistical analysis for PH of the biparent and RIL population was conducted using IBM SPSS Statistics 17 (SPSS, Chicago, USA). Analysis of variance (ANOVA) and H2 were processed using the QTL IciMapping 4.2 software (Meng et al., 2015; Ma et al., 2019). BLUPs were estimated using the lme4 package in R software (de Los Campos et al., 2013). The 2−ΔΔCT of qRT-PCR data were calculated via Microsoft Excel 2013, and mean calculation, significance analysis, and bar graph creation were conducted using GraphPad Prism 9.5. Venn diagrams and heatmaps of differentially expressed genes (DEGs) were drawn using TBtools (Chen et al., 2023).
The male parent Jingu 21 consistently exhibited taller PH than the female parent Aininghuang at three stages (T1, T2, and T3) and during ΔT1–2 and ΔT2–3 across nine environments almost in all tests. The RIL population showed a continuous distribution across all nine environments, exhibiting relatively small skewness and kurtosis, and two-way transgressive segregation was observed almost at all stages (Supplementary Figure S1). Therefore, the PH of the population followed a normal distribution, making it suitable for QTL analysis (Table 1; Supplementary Figure S1).
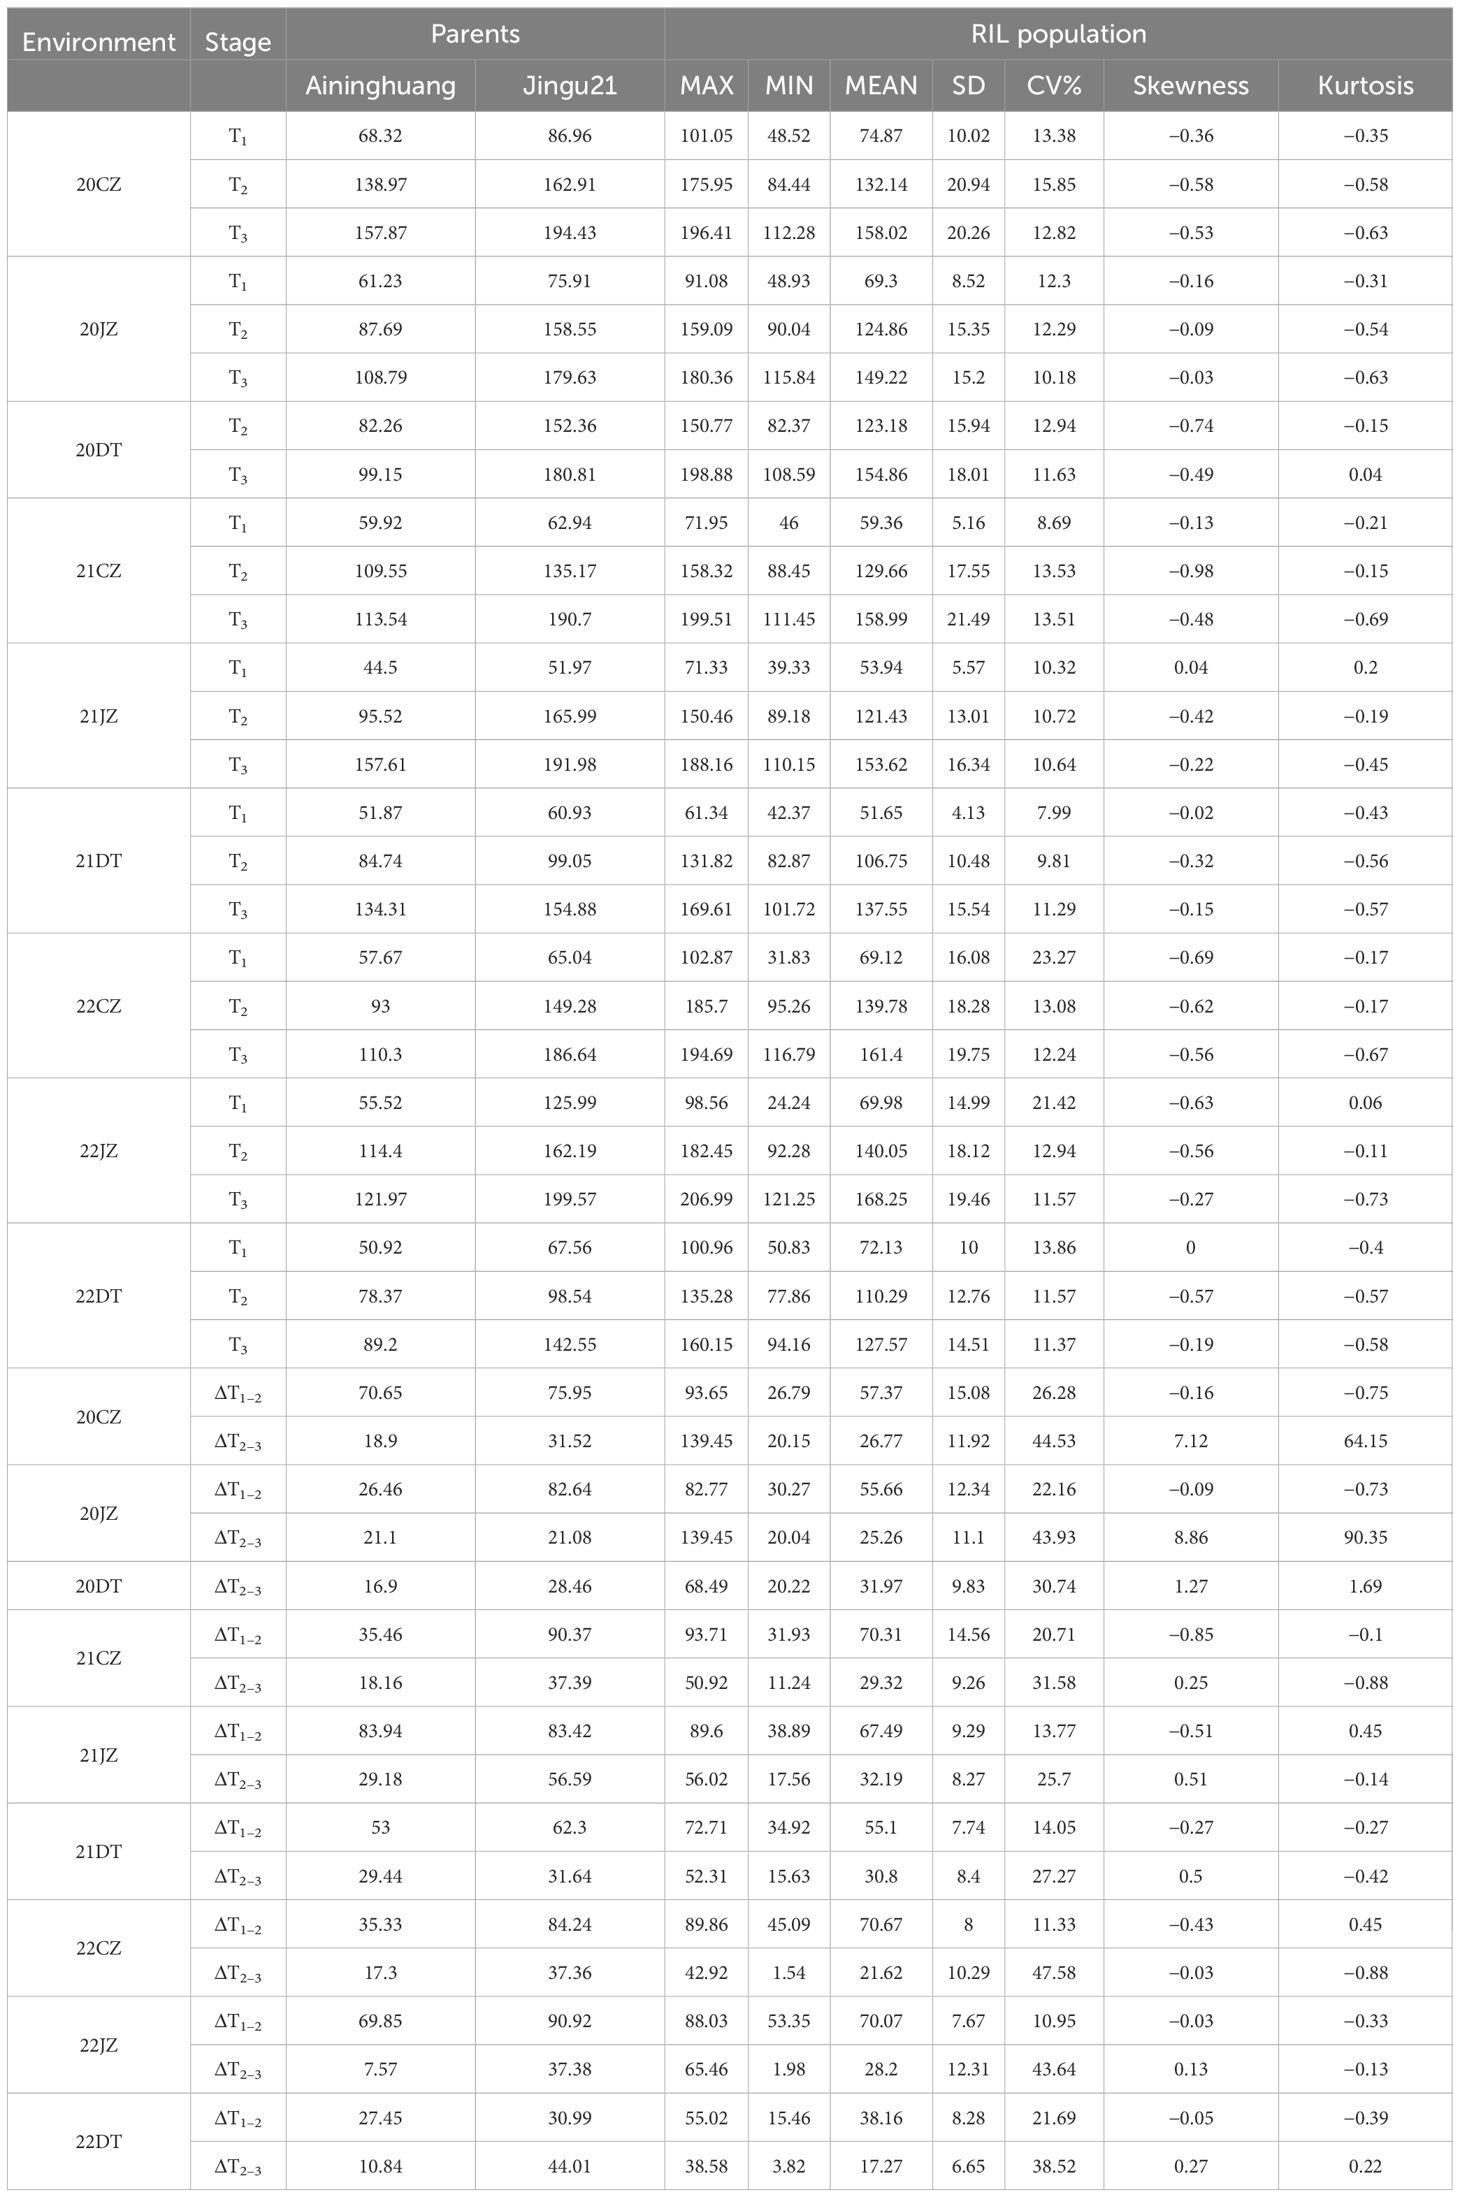
Table 1 PH performance of RIL and their parents.
Almost under all environments with the exception of Jingu 21 at 22DT, the growth speed of PH in two parents and RIL population rapidly increased during ΔT1–2, with an average growth of 61.99 cm, and then the speed of increase slowed down during ΔT2–3, with an average increase of 27.34 cm (Table 1), indicating that the rapid growth period of PH occurred before T2. ANOVA revealed that there were extremely significant differences on PH in the RIL population at T1, T2, and T3 stages, attributing to genotype, environment, and genotype × environment interactions (p < 0.01). Furthermore, H2 was 91.73%, 96.99%, and 97.81% at T1, T2, and T3 stages, respectively, indicating that PH exhibited high heritability within the RIL population (Supplementary Table S1).
RAD-seq was conducted on two parents and 127 RIL lines, and the RAD-seq data were aligned to the Yugu 1 reference genome. Aininghuang yielded 7.76 Gbp of clean reads with an average coverage of 31×, while Jingu 21 obtained 7.66 Gbp of clean reads with an average coverage of 34×. For 127 RIL lines, 88.21 Gbp of clean reads were obtained, with an average coverage of 2.97×. Finally, a genetic map was constructed using 4,360 bin markers from 712,243 SNPs, spanning 1,016.06 cM in length with an average interval of 0.23 cM between adjacent markers (Figure 1A). The longest linkage group, Chr. 9, spanned 144.37 cM and included 597 bin markers with an average genetic distance of 0.24 cM, whereas the shortest group, Chr. 6, spanned 92.48 cM and consisted of 300 bin markers with an average genetic distance of 0.31 cM. Collinearity analysis revealed an average Spearman coefficient up to 0.99 between the genetic and physical maps (Figure 1B; Supplementary Table S3).
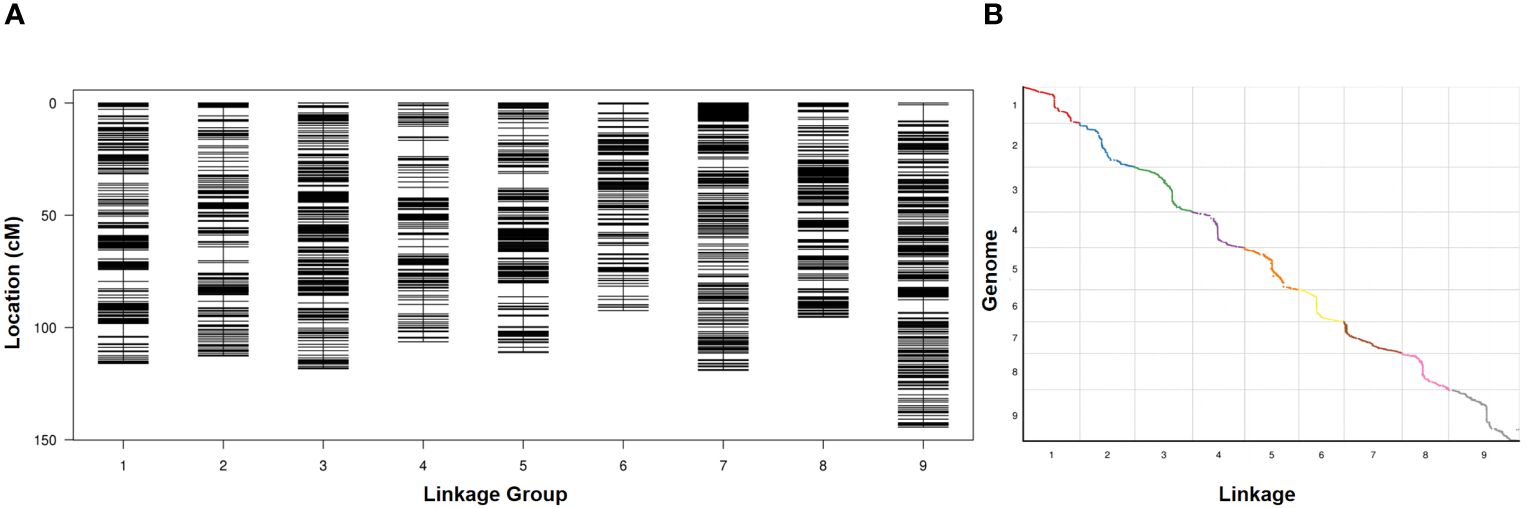
Figure 1 (A) Distribution of polymorphic markers in the genetic map constructed from the RIL population. (B) Collinearity analysis between the genetic map and the physical map.
A total of 19 unconditional QTL associated with PH, including 7 major QTL, were identified at three stages under nine environments and BLUP data (Table 2). Among those, eight, nine, and eight QTL were identified at T1, T2, and T3, respectively, of which five were repeatedly identified out at least at two stages. These QTL were distributed on chromosomes 1, 4, 5, 7 and 9, respectively, characterized by PVE ranging from 5.23% to 35.36%, and LOD scores spanning from 3.02 to 16.44. Among them, 13 QTL had positive additive alleles contributed by Aininghuang, and the remaining ones were attributed to Jingu 21. Notably, four QTL, namely, GqPH5–1, GqPH5–2, GqPH5–3, and GqPH1–1, were consistently identified at least under three different conditions and were considered stable QTL (Table 2, Figure 2). Specifically, GqPH5–2 was identified in 24 different tests, with PVE ranging from 12.67% to 34.62% and LOD scores ranging from 3.77 to 15.99. This QTL was consistently identified across two or three development stages under four BLUPs, exhibiting substantial PVE (24.91%–34.61%), which further underscores its reliability. In addition, GqPH5–1 also exhibited notable stability across seven tests, with PVE and LOD scores ranging from 20.88% to 35.36% and 7.85 to 16.44, respectively. These results showed that PH was controlled by different QTL at various development stages.

Table 2 Unconditional QTL of PH identified in different environments.
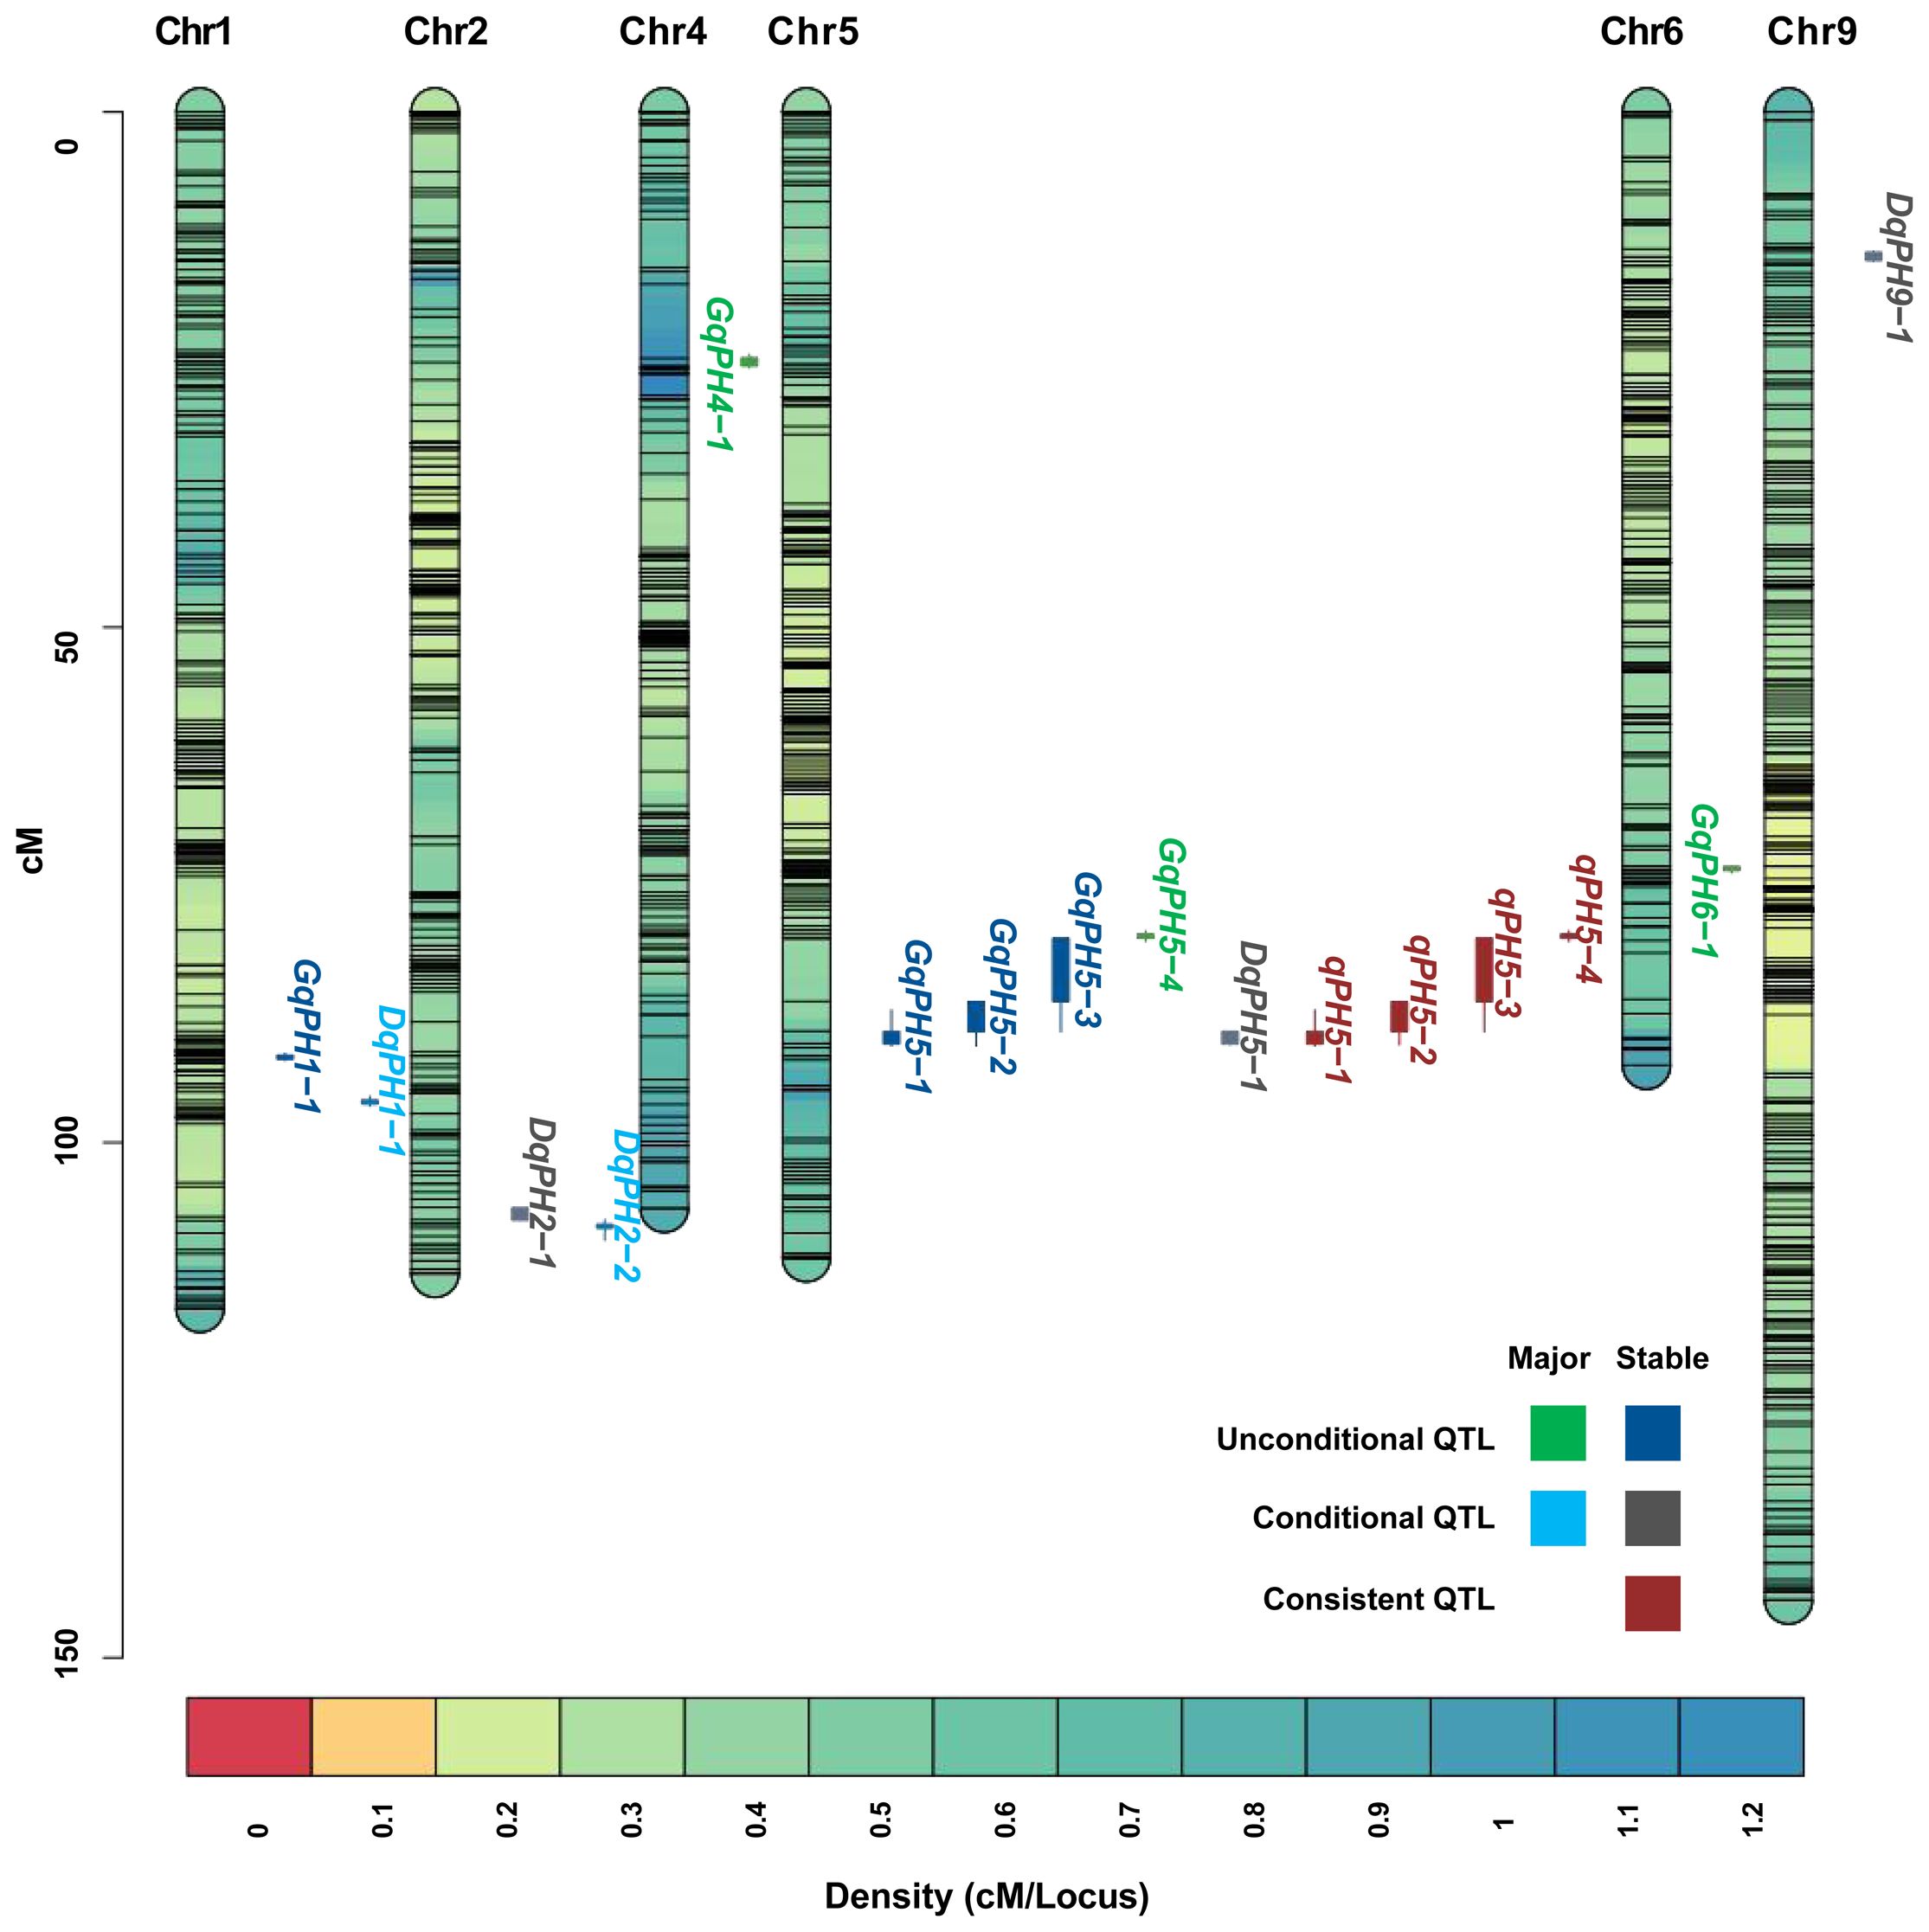
Figure 2 The chromosome-wise distribution of QTL for PH.
During ΔT1–2 and ΔT2–3, eight and five QTL were identified, respectively, but no overlapping QTL were identified between them, which explained 6.5%–40.35% of PVE with LOD values ranging from 3.01 to 25.11 (Table 3). The positive additive effects of all QTL were contributed by Aininghuang. In total, five major QTL and three stable QTL were further identified. Notably, DqPH9–1, one of the three stable QTL, was a major co-localized QTL, and expressed only during ΔT2–3, explaining 8.04%–40.35% of the PVE under various environments. This QTL was consistently identified during ΔT2–3 under four BLUPs, with a substantial PVE ranging from 12.3% to 40.35%, which further underscores its reliability. Additionally, DqPH5–1 was consistently identified during ΔT1–2 under four BLUPs, proving it is also a stable QTL.
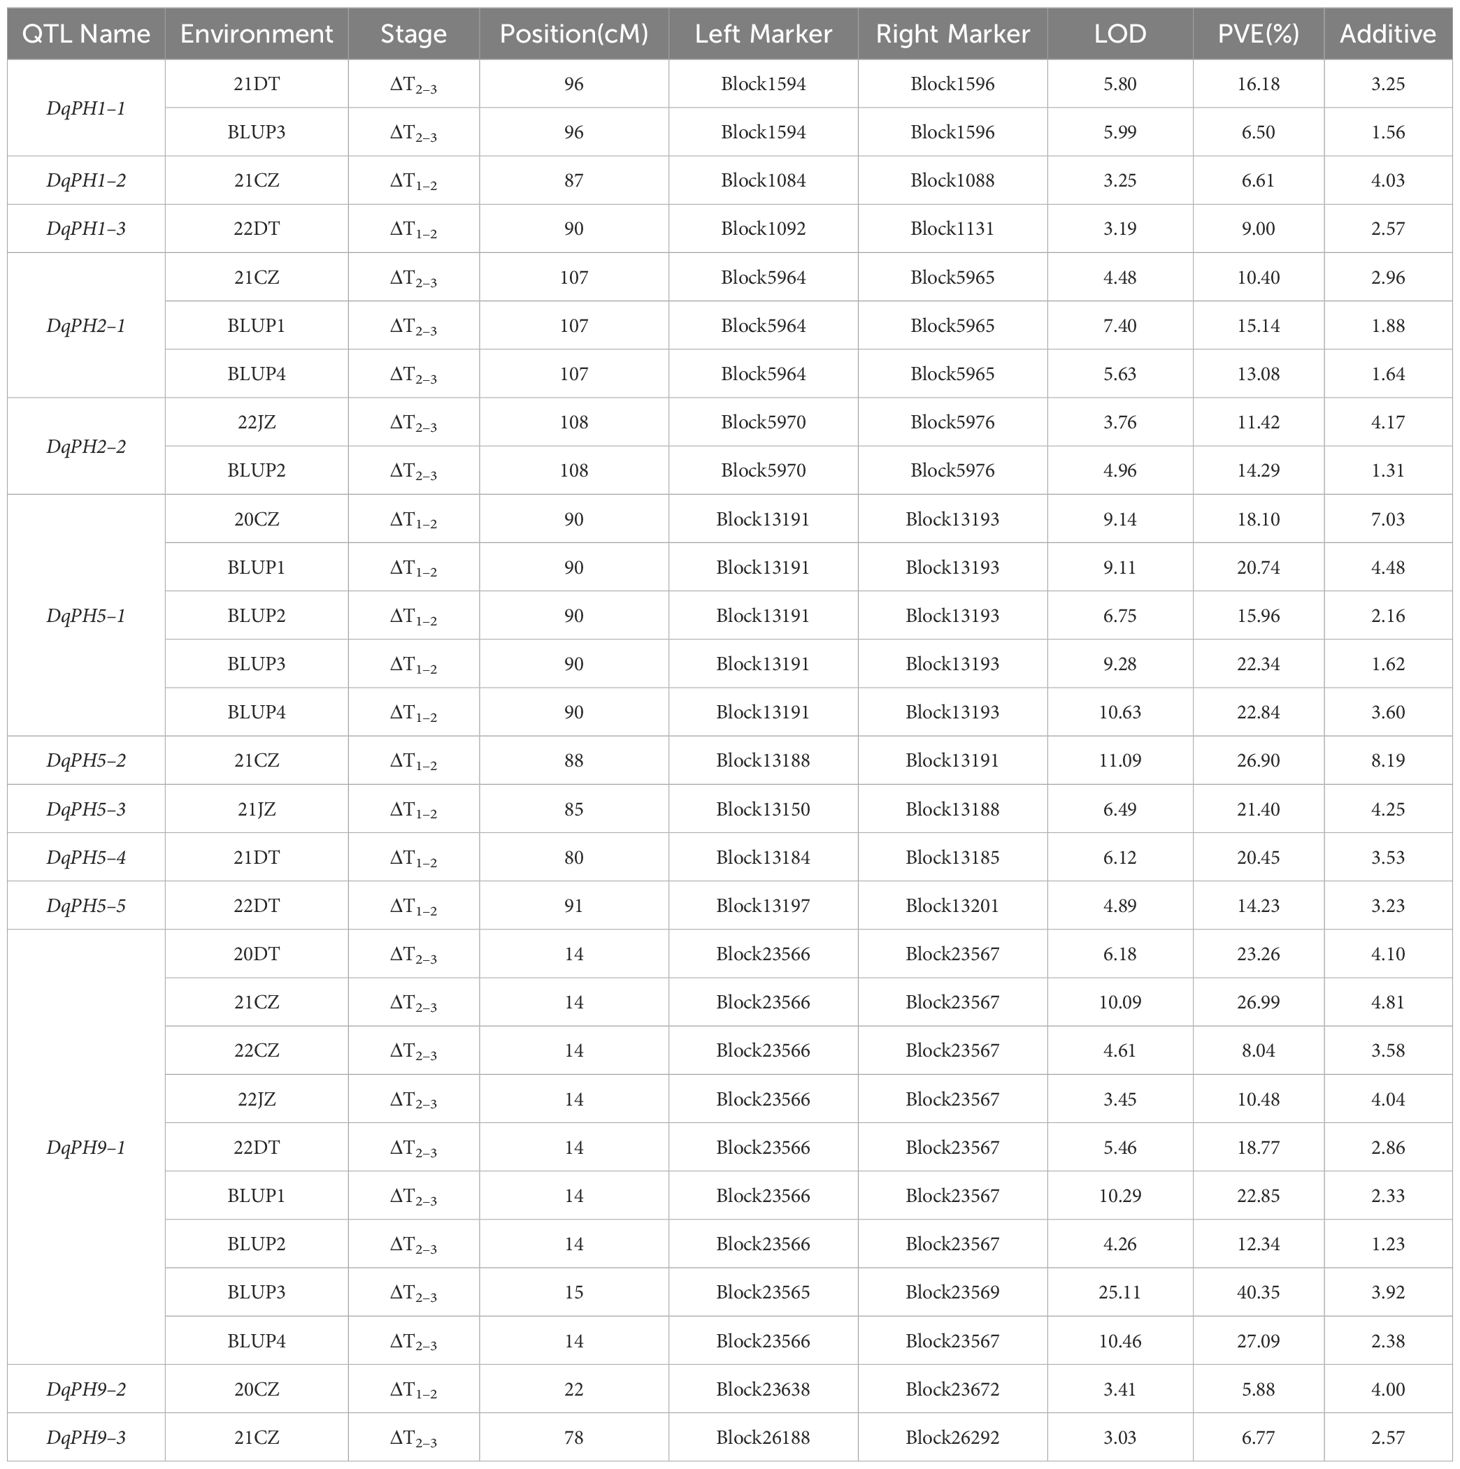
Table 3 Conditional QTL of PH identified in different environments.
The comparative analysis between 19 unconditional and 13 conditional QTL showed that a total of 4 QTL, namely, qPH5–1, qPH5–2, qPH5–3, and qPH5–4, were consistent QTL due to their overlapping confidence intervals (Table 4, Figure 2). These QTL exhibited PVE ranging from 12.67% to 35.36% and LOD scores from 3.77 to 16.44. Notably, qPH5–1 and qPH5–2 were highlighted for stable expression across three experiment sites. Moreover, qPH5–2 was identified at multiple development stages, indicating that it played a crucial role throughout the entire developmental process. In addition, qPH5–1 exhibited stable expression across multiple environments and development stages, including that it may be a QTL with a continuous effect. However, qPH5–4 was identified only in DT, suggesting it may possess environmental specificity or adaptability.
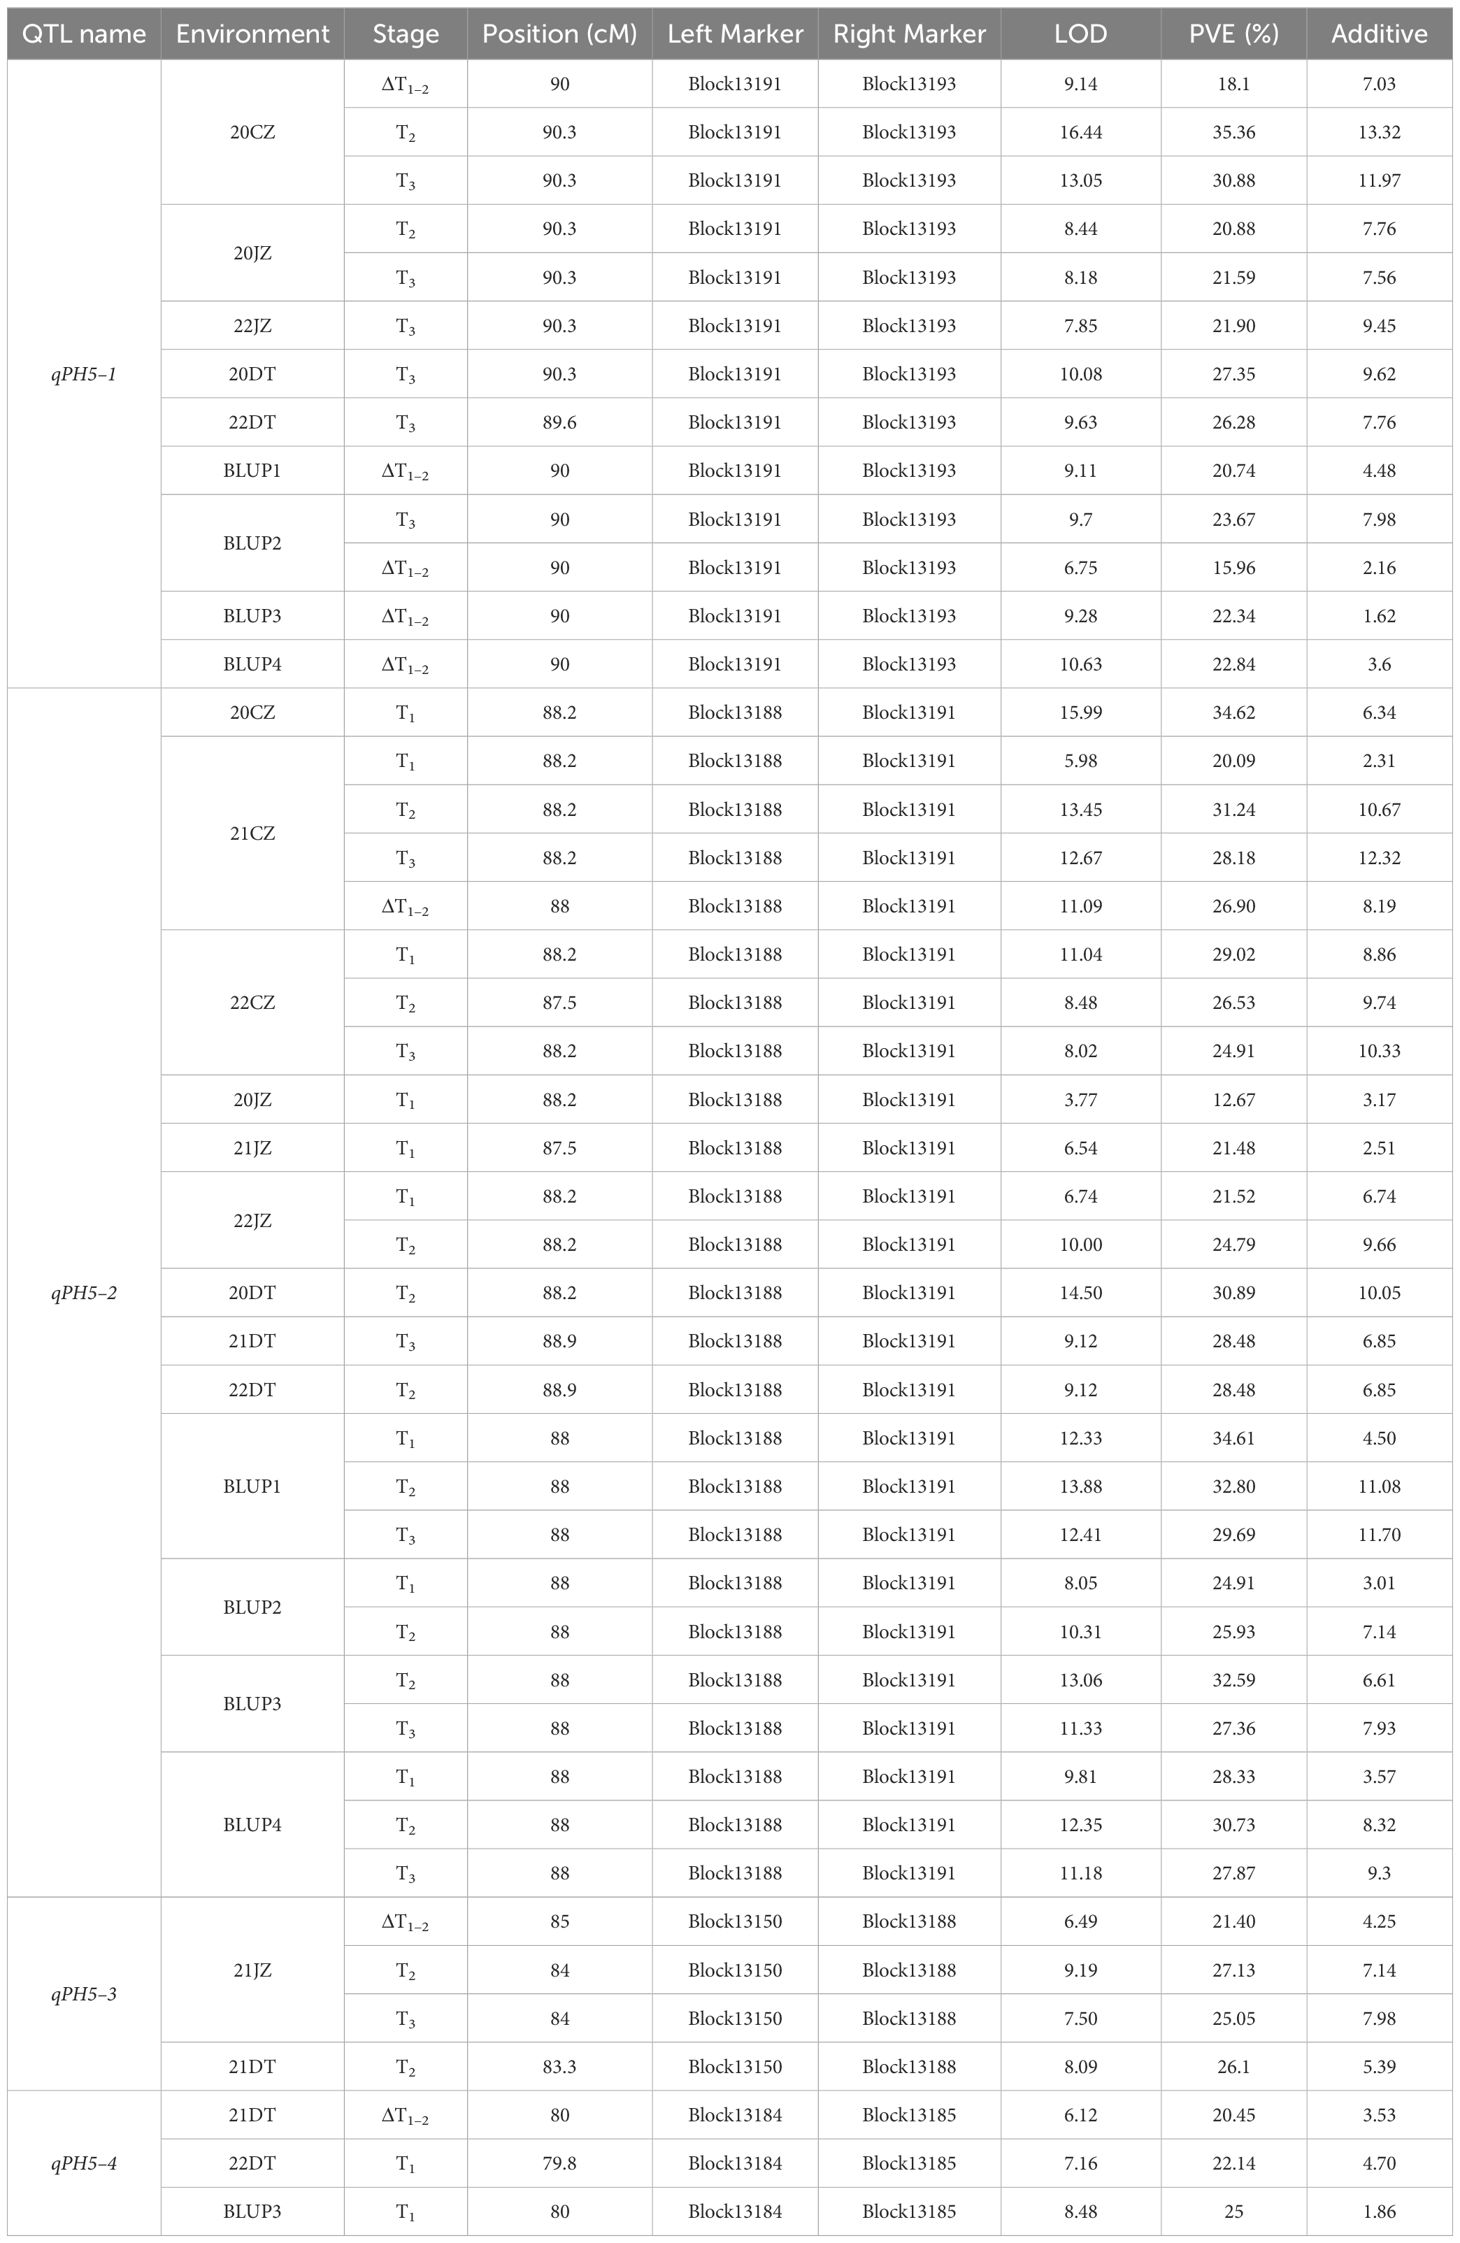
Table 4 Consistent QTL of PH identified in different environments.
To further identify the key candidate genes underlying PH, we conducted a full-length transcriptome analysis. A total of 131.29 Gb of clean reads, with a GC content of 50.67%–53.00%, were obtained after removing adapter and low-quality reads. The sequencing quality was high enough (Q20 ≥ 97.81%, Q30 ≥ 92.97%) for further analysis (Supplementary Table S4). Upon mapping the quality-controlled sequencing data from two parents to the Yugu 1 reference genome, it was found that over 91.5% of the clean reads corresponded to the reference genome (Supplementary Table S5). Most of the mapped reads were concentrated in the exon region of genes (Figure 3A; Supplementary Figure S2), indicating that the sequencing results were consistent with the characteristics of RNA-Seq. Principal component analysis (PCA) revealed that two distinct groups between two parents were clustered with minimal variation among three biological replicates (Figures 3B, C).
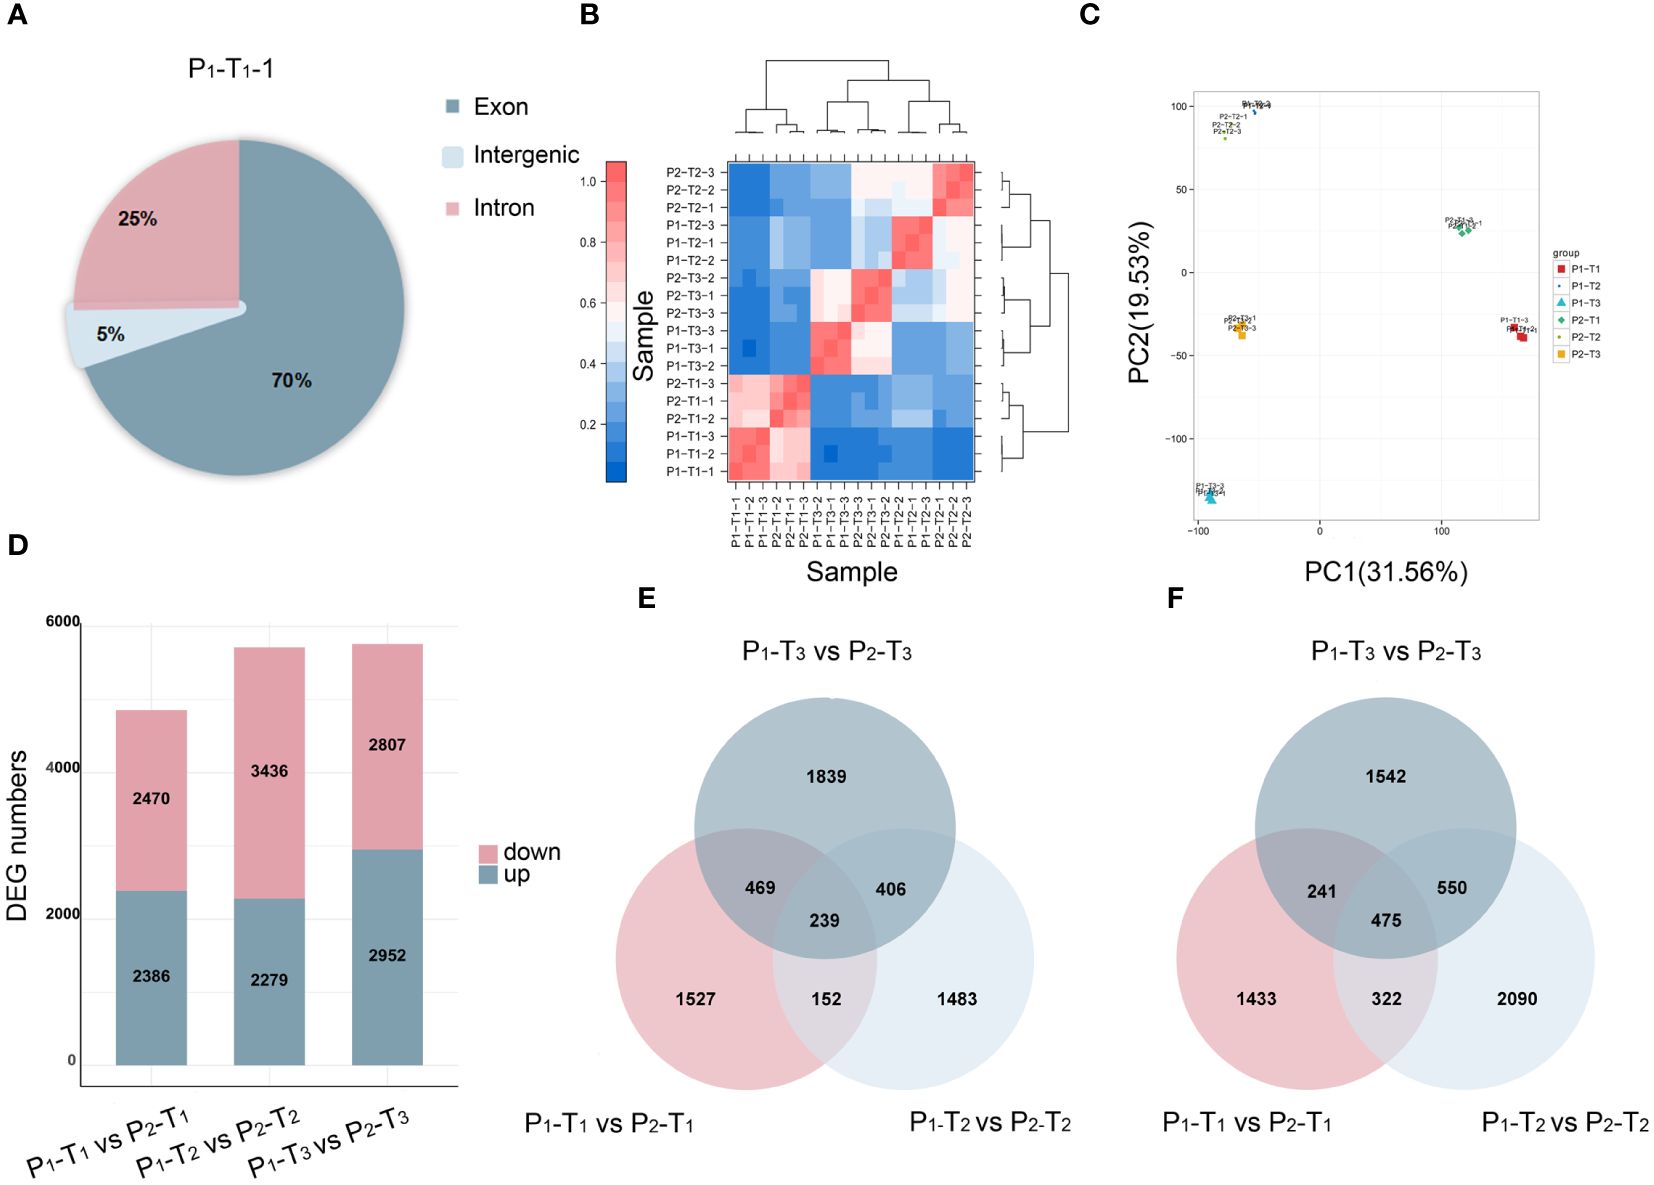
Figure 3 Transcriptome analysis of 18 samples. (A) Reads mapping. (B) Correlation analysis. (C) PCA. (D) DEGs at T1, T2, and T3 stages. (E, F) Venn diagrams of upregulated (E) and downregulated (F) DEGs at T1, T2, and T3 stages.
A total of 4,856, 5,715, and 5,759 DEGs were identified at T1, T2, and T3, respectively (Figure 3D). Among these, 239 upregulated genes (Figure 3E) and 475 downregulated genes (Figure 3F) were overlapped and identified across T1, T2, and T3, respectively, suggesting that a shared group of genes played a continuous and crucial role throughout the entire process of PH development.
GO analysis of DEGs in four consistent stable QTL regions showed that DEGs were predominantly involved in cellular processes and metabolic processes within the biological process (BP) category, cellular anatomical entity, intracellular and protein-containing complex in cellular component (CC), and binding and catalytic activity in molecular function (MF) at three stages, respectively (Figures 4A, C, E). Additionally, the KEGG enrichment analysis demonstrated that significant enrichment was present in carbon fixation, photosynthetic organisms and glycosphingolipid biosynthesis-globo isoglobo series at T1 (Figure 4B), glycerolipid metabolism and biosynthesis of unsaturated fatty acids at T2 (Figure 4D), and carbon fixation in photosynthetic organisms and fructose and mannose metabolism at T3 (Figure 4F).
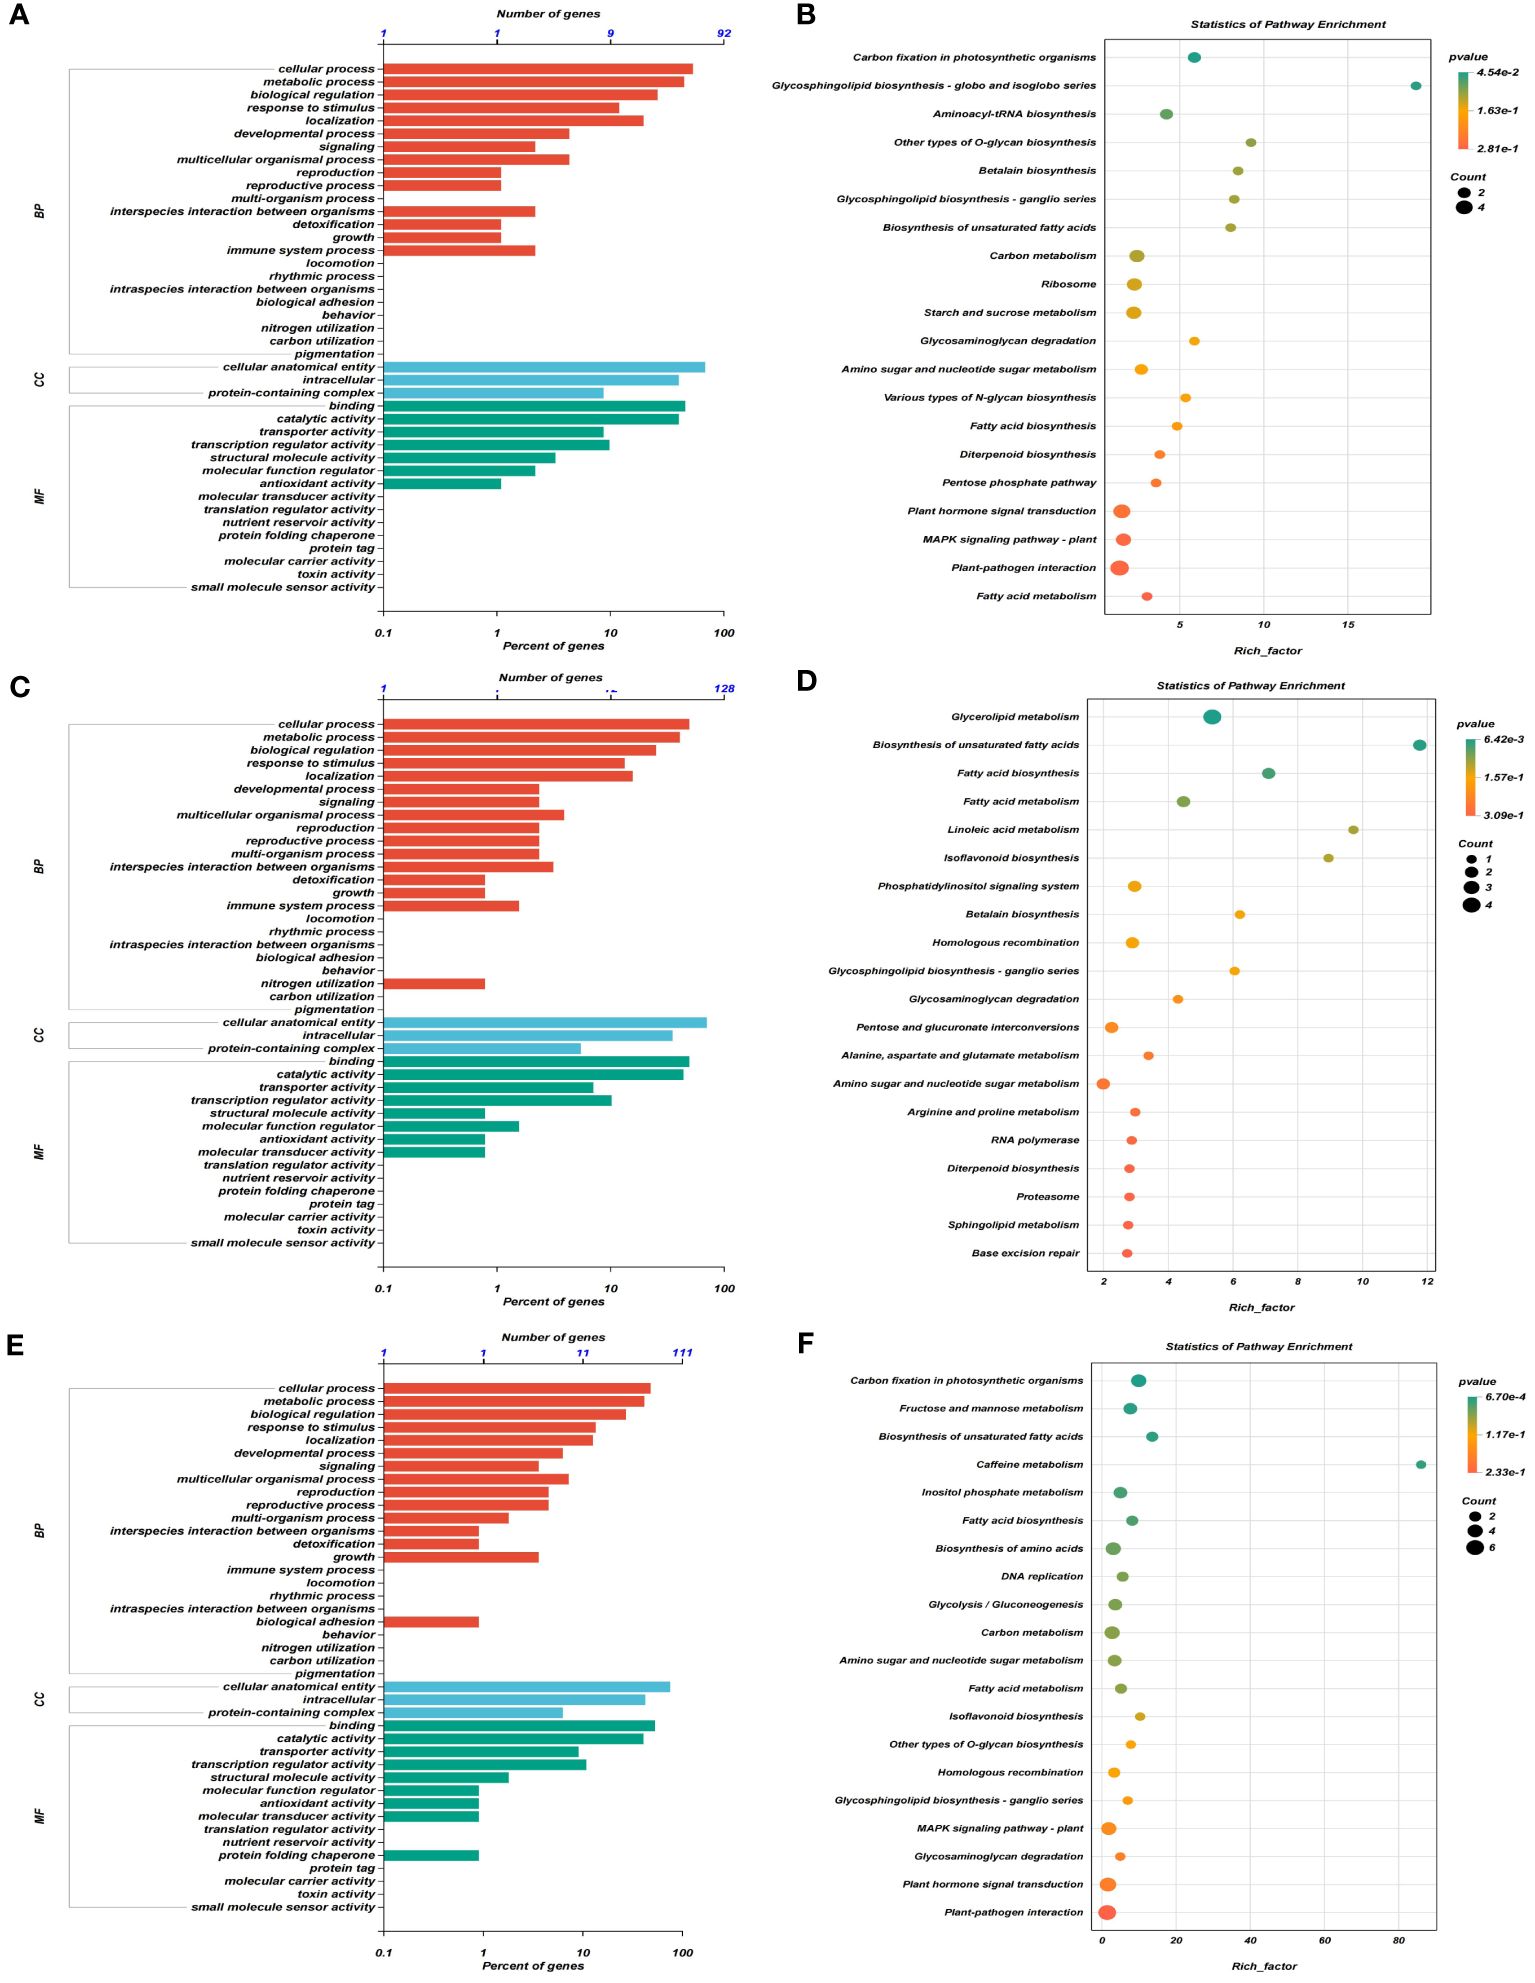
Figure 4 GO term and KEGG pathway enrichment analyses of DEGs obtained by RNA sequencing in four consistent stable QTL regions. (A, C, E) GO terms enriched for three aspects of all DEGs at T1 (A), T2 (C), and T3 (E) stages, respectively, in which MF represents molecular function, BP represents biological processes, and CC represents cellular components. (B, D, F) The top 20 terms for KEGG pathway enrichment analyses of DEGs at T1 (B), T2 (D), and T3 (F) stages, respectively.
To predict candidate genes, we analyzed pathways that were significantly enriched across three stages. A total of 24 pathways were significantly enriched at T1, T2, and T3 stages, including fatty acid biosynthesis, biosynthesis of unsaturated fatty acids, fatty acid metabolism, homologous recombination, amino sugar and nucleotide sugar metabolism, glycosaminoglycan degradation, and glycosphingolipid biosynthesis-ganglio series (Figure 5A). From these pathways, we identified 61 potential candidate genes for PH within four consistent stable QTL mapping intervals. Notably, five specific genes, namely, Seita.5G363400, Seita.5G372100, Seita.5G394300, Seita.5G402700, and Seita.5G404900, showed significant expression differences between two parents at three stages (Figures 5B, 6A).
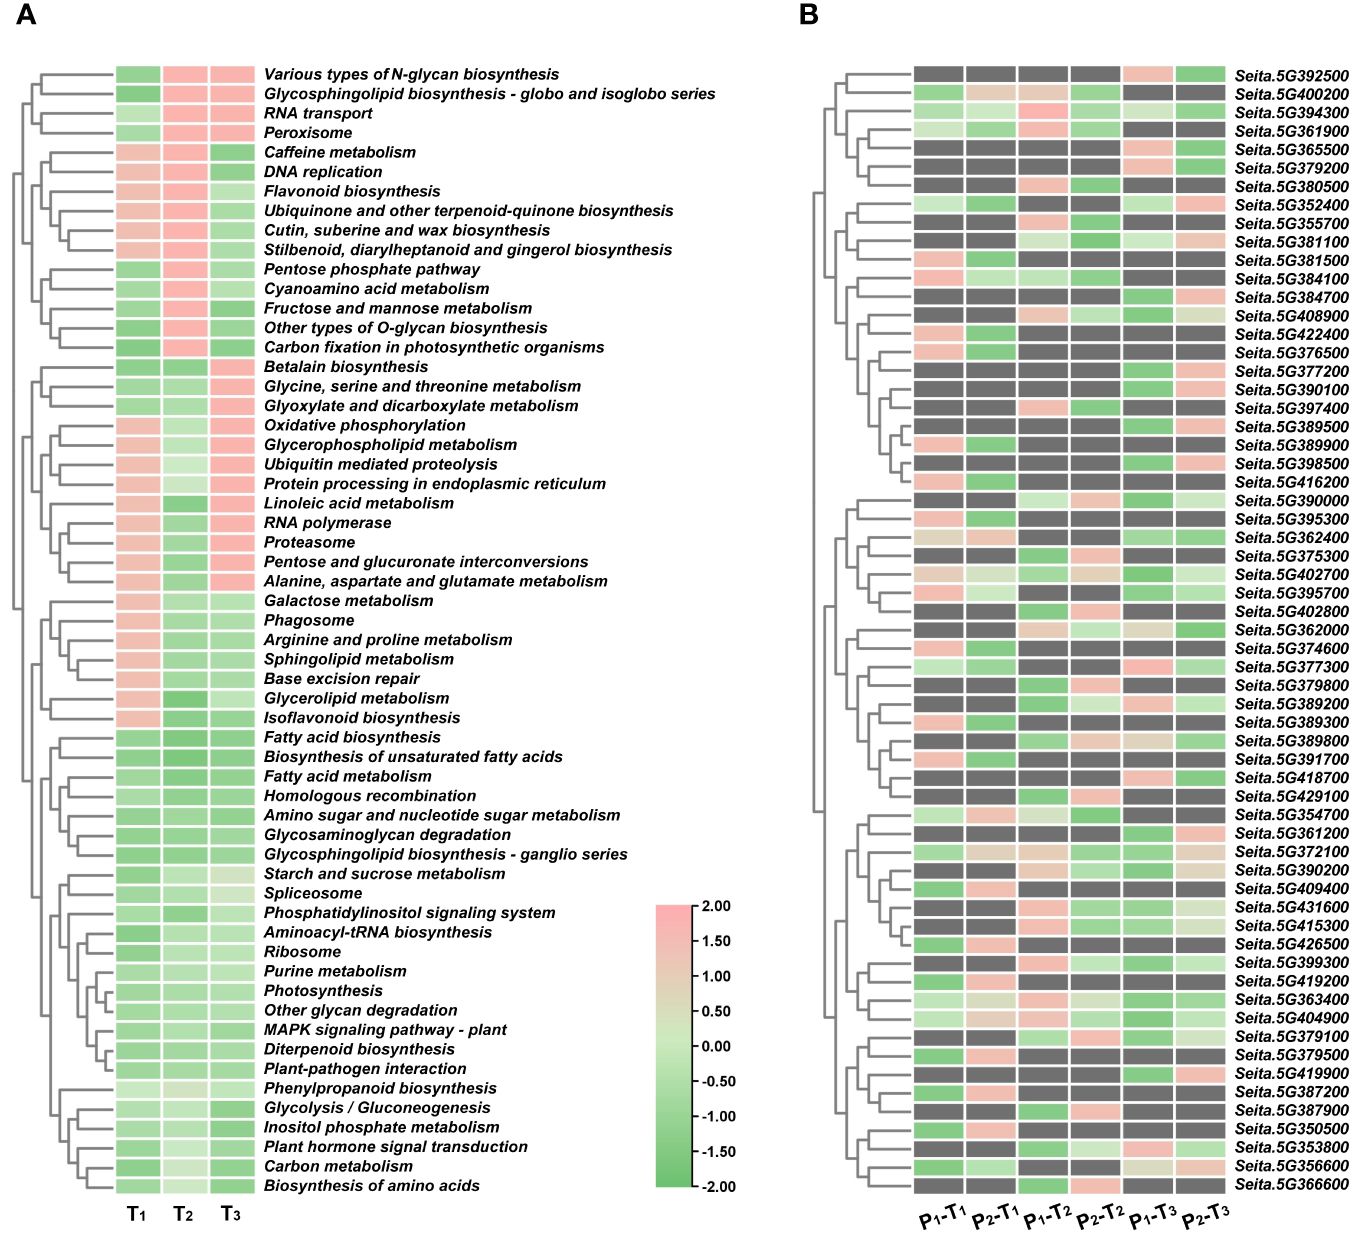
Figure 5 (A) KEGG pathway enrichment analyses of DEGs at T1, T2, and T3 stages in four consistent QTL regions. (B) Expression heatmap of 61 DEGs.
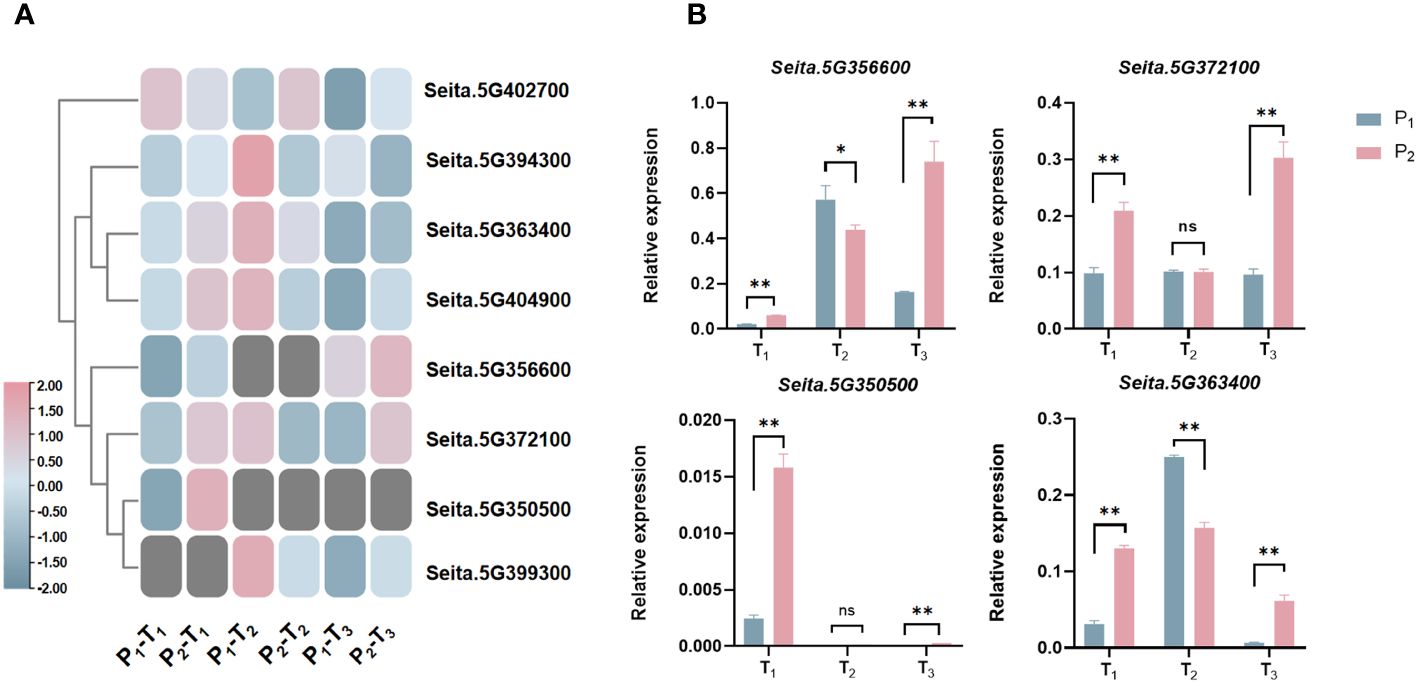
Figure 6 (A) Expression heatmap of eight candidate genes related to PH at three stages. (B) Expression analysis of four candidate genes in biparent via qRT-PCR at three stages. *statistically significant at p < 0.05; **statistically significant at p < 0.01; ns, not significant.
Compared to Aininghuang, Seita.5G372100, Seita.5G363400, and Seita.5G404900 in Jingu 21 were upregulated at T1, downregulated at T2, and upregulated again at T3; Seita.5G394300 was upregulated at T1, then downregulated at T2 and T3. Seita.5G402700 was downregulated at T1, followed by upregulation at both T2 and T3. Those expression patterns suggested that the T1 stage was a critical period for PH development, and these genes may be involved in key processes such as stem elongation, cell division, and hormone regulation on PH development (Figure 6A).
To explore the gene expression network associated with PH, WGCNA was conducted using a total of 38,494 expressed genes that were detected. These genes were divided into 14 modules, of which 2, lightsteelblue and salmon2, significantly correlated with PH (Figures 7A, B). Scatter plot analysis revealed that there was a positive correlation between module membership (MM) and gene significance (GS) in the two modules (Figures 7C, E).
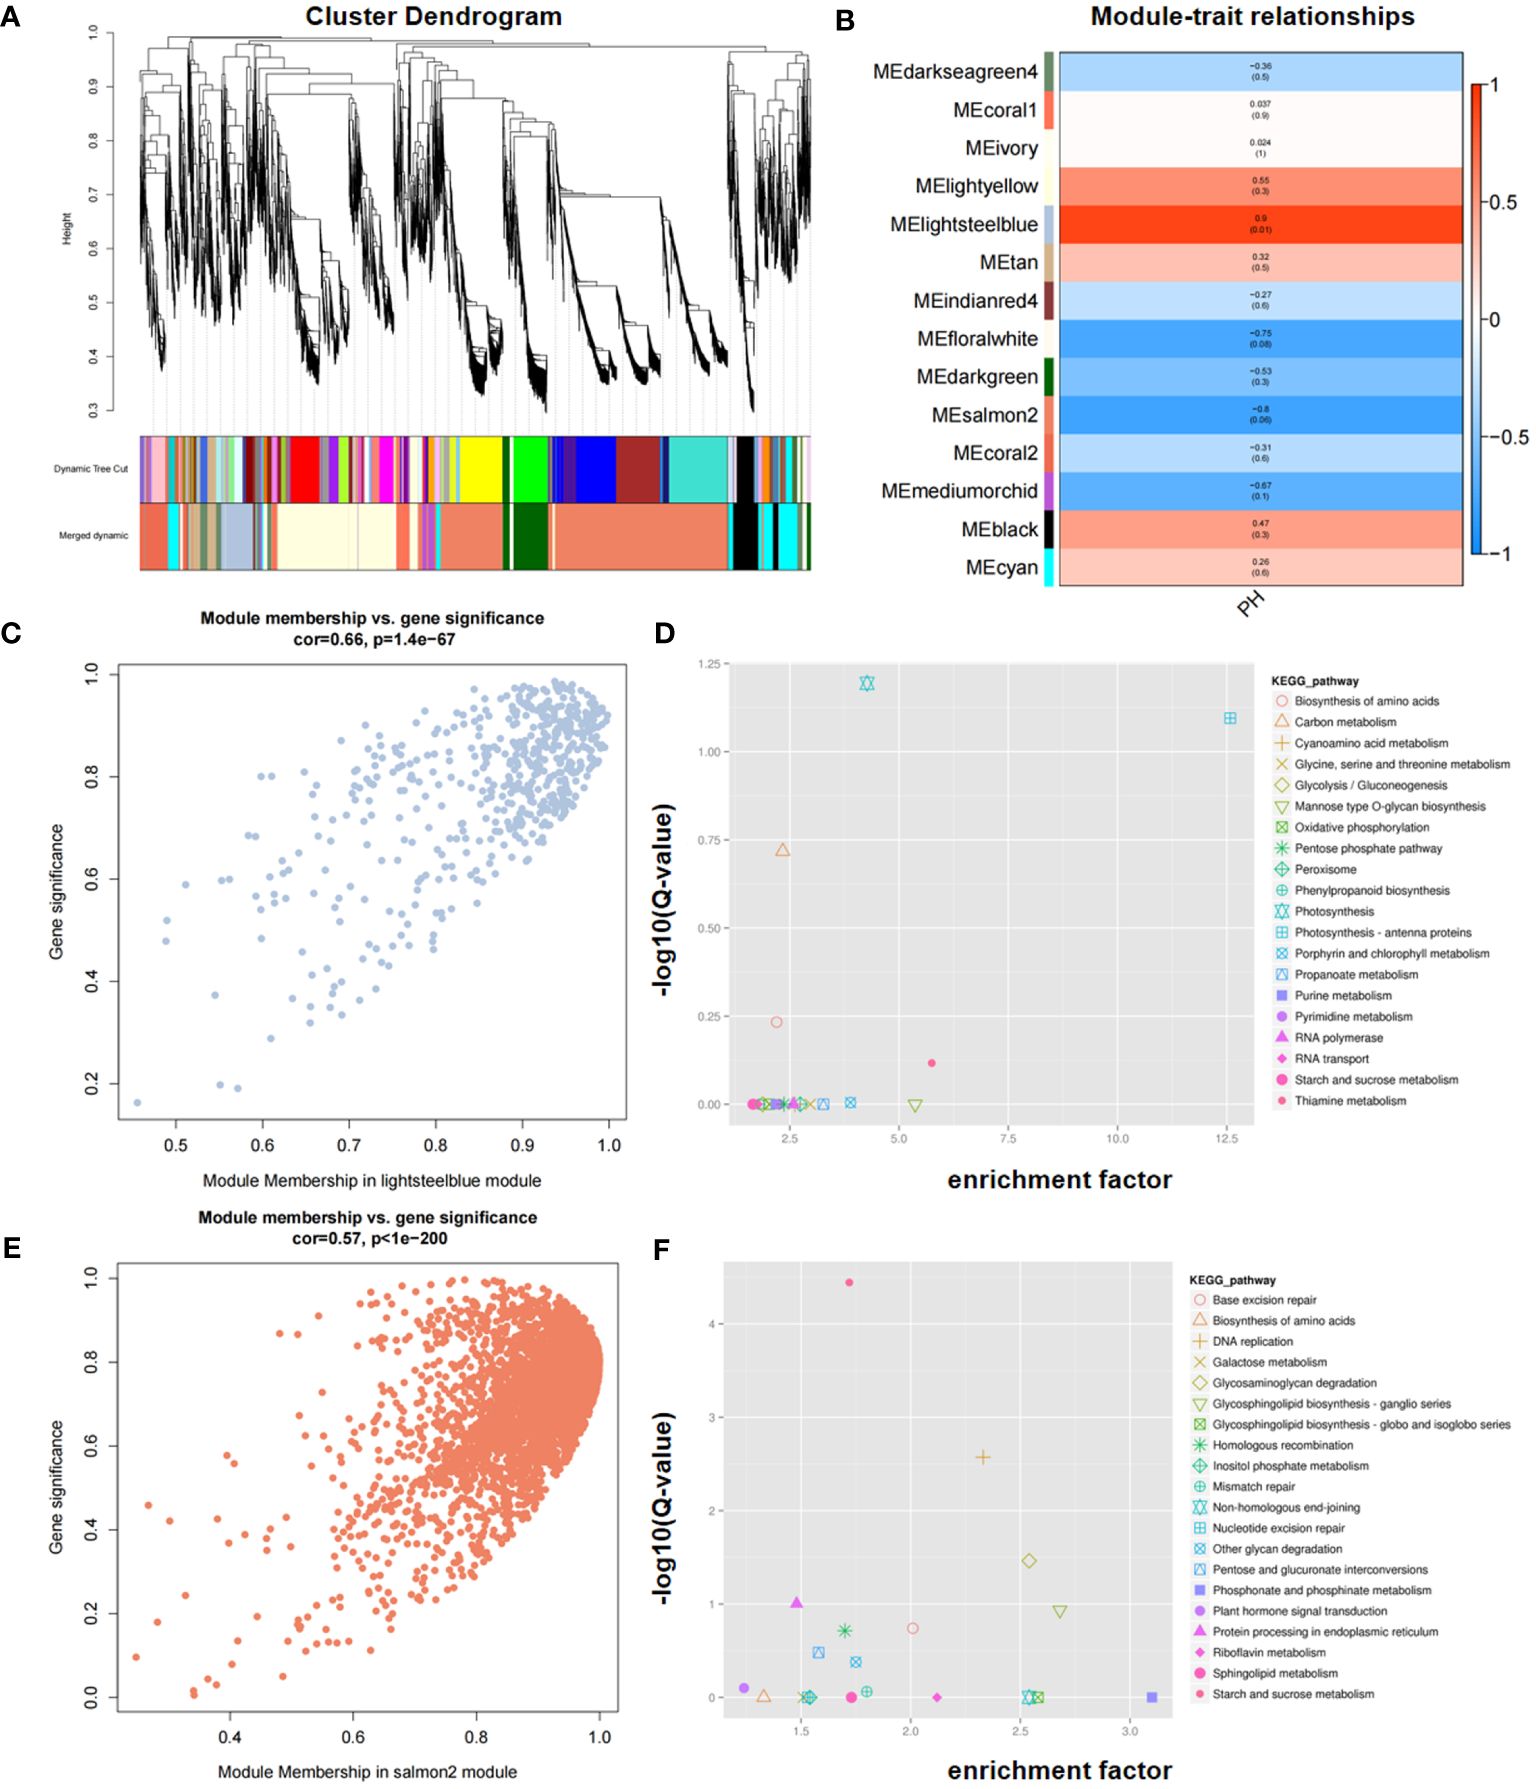
Figure 7 Identification of candidate genes via WGCNA. (A) Cluster dendrogram. (B) Module–trait relationships in WGCNA. (C, E) Correlation between MM (Module Membership) and GS (Gene Significance) in the lightsteelblue (C) and salmon2 (E) modules, respectively. (D, F) KEGG enrichment of genes within consistent QTL in the lightsteelblue (D) and salmon2 (F) modules, respectively. GS represents the correlation of each gene within the module, and MM represents the correlation between a single gene and its module.
KEGG enrichment analysis revealed that the lightsteelblue module was significantly enriched in photosynthesis, photosynthesis-antenna proteins, carbon metabolism, biosynthesis of amino acids, and thiamine metabolism pathways, and the salmon2 module was significantly enriched in starch and sucrose metabolism, DNA replication, glycosaminoglycan degradation, protein processing in endoplasmic reticulum, and glycosphingolipid biosynthesis-ganglio series, among others (Figures 7D, F). Based on the KEGG enriched pathways in both modules, four genes, namely, Seita.5G350500, Seita.5G356600, Seita.5G399300, and Seita.5G394300, were identified as candidates for PH. Through the integration of KEGG enrichment analysis of DEGs in RNA-seq with WGCNA, three genes, namely, Seita.5G350500, Seita.5G356600, and Seita.5G399300, were consistently identified, underscoring their potential significance in modulating PH.
To clarify the precise expression level of candidate genes, we randomly selected four candidates, namely, Seita.5G350500, Seita.5G356600, Seita.5G363400, and Seita.5G372100, to carry out expression analysis using qRT-PCR in the two parents (Figure 6B). The results demonstrated that almost all genes were differentially expressed between two parents at three development stages, which were consistent with the results of RNA-Seq (Figure 6A), indicating that these genes were key candidates.
BLUP significantly improved predictive accuracy in both animal and plant populations (Macedo et al., 2020; VanRaden and Cole, 2020). Considering the significant influence of interactions between genes and environment on quantitative traits, phenotype data were typically collected from diverse environments to mitigate environmental impacts and enhance predictive accuracy through phenotype regression analysis of numerous genetic variants (de Los Campos et al., 2013; Ankamah-Yeboah et al., 2020). In this study, BLUP values for three experiment sites (CZ, JZ, and DT) as well as for overall were calculated. The results demonstrated a high degree of agreement between the data and the model, thereby establishing a solid foundation for QTL mapping.
Traditional QTL mapping provided information on cumulative effects at specific growth stages (Fu et al., 2022; Meyer et al., 2023). However, this approach, which focused on the final values of quantitative traits, neglected the net or incremental genetic effects of QTLs across different development processes (Zhu, 1995; Wu et al., 1997). By integrating unconditional and conditional QTL mapping, it was possible to acquire the genetic loci that affected quantitative traits at various development stages and, further, to clearly elucidate the expression patterns and effects of underlying loci throughout the developmental process (Yang et al., 2006; Cui et al., 2011; Wu et al., 2022).
In the present study, we identified eight, nine, and eight unconditional QTL at T1, T2, and T3 stages, and eight and five conditional QTL during ΔT1–2 and ΔT2–3, respectively, indicating selective expression at different development stages. Among those, GqPH5–3, GqPH5–5, GqPH6–1, GqPH1–1, and DqPH9–1 overlapped with prior studies (Zhang et al., 2017; He et al., 2021), suggesting that those QTL may exhibit consistent functions or effects across different studies. Remarkably, QTL occurrence was more pronounced in the early stages of PH development, indicating that QTL expression was particularly vigorous during the initial stages, which was consistent with previous studies (Wang et al., 2019; Che et al., 2020; Wu et al., 2022).
Meanwhile, we identified four stable unconditional QTL, GqPH5–1, GqPH5–2, GqPH5–3, and GqPH1–1, and three stable conditional QTL, DqPH2–1, DqPH5–1, and DqPH9–1. Furthermore, four consistent QTL, namely, qPH5–1, qPH5–2, qPH5–3, and qPH5–4, were found to exert both net genetic and cumulative effects on PH via a combination analysis of unconditional and conditional QTL mapping. Notably, qPH5–1 was stably expressed across three environment sites (CZ, JZ, and DT) during ΔT1–2 and the subsequent T2 and T3 (Table 3). The region of qPH5–1 was consistent with that reported by Ni et al. (2017), indicating its stability and reliability.
Transcriptome analysis was effective in identifying genes that responded significantly to specific conditions, and WGCNA focused on identifying gene sets that may not show significant changes in expression individually but work together in biological processes (Yao et al., 2023; Xie et al., 2024). In the present study, we identified 61 DEGs associated with PH from RNA-seq, among which five genes, namely, Seita.5G404900, Seita.5G363400, Seita.5G394300, Seita.5G372100, and Seita.5G402700, were continuously differentially expressed throughout the development stages and considered as candidates. Furthermore, three genes, Seita.5G350500, Seita.5G356600, and Seita.5G399300, were identified to be differentially expressed through WGCNA. In summary, through the integration of transcriptome analysis and WGCNA, we identified eight candidate genes potentially influencing PH.
Notably, the “Green Revolution” gene SD1 in rice, the homology of Seita.5G404900, has been proven to play an essential role in regulating PH (Phillips et al., 1995; Huang et al., 1998; Hedden and Phillips, 2000; Sakamoto et al., 2001; Yamaguchi, 2008; Zhu et al., 2023). Also in rice, OFP2, the homology of Seita.5G363400, decreased PH by interacting with KNOX and BELL genes to suppress gibberellin biosynthesis (Schmitz et al., 2015). RBOHH, the homology of Seita.5G372100, influenced PH by regulating reactive oxygen species (ROS) levels mediated by DELLA proteins in response to both biotic and abiotic stresses in Arabidopsis and rice (Achard et al., 2008; Zhu et al., 2024). Therefore, we randomly selected four candidates, namely, Seita.5G350500, Seita.5G356600, Seita.5G363400, and Seita.5G372100, to carry out expression analysis using qRT-PCR. The results showed that all of them exhibited differential expression between the two parents at three development stages (Figure 6B), which was consistent with the RNA-Seq, indicating that those candidates played a significant role in the development of PH in foxtail millet.
PH is a critical trait influencing lodging, stress resistance, and yield in foxtail millet. In the present study, a total of seven major unconditional QTL and five major conditional QTL for PH were identified using a high-density genetic map with 4,360 bin markers based on a RIL population, of which four QTL were simultaneously identified via unconditional and conditional QTL mapping. Within the four consensus QTL intervals, eight candidate genes were predicted through RNA-seq and WGCNA. This study laid the foundation for fine mapping and cloning of QTL for PH in foxtail millet.
The datasets presented in this study can be found in online repositories. The names of the repository/repositories and accession number(s) can be found in the article/Supplementary Material.
KH: Conceptualization, Data curation, Formal Analysis, Funding acquisition, Investigation, Methodology, Project administration, Resources, Supervision, Validation, Visualization, Writing – original draft, Writing – review & editing. ZW: Writing – review & editing, Data curation, Methodology, Resources. LS: Data curation, Investigation, Writing – review & editing. XD: Data curation, Investigation, Methodology, Writing – review & editing. SL: Investigation, Resources, Writing – review & editing. YXL: Investigation, Writing – review & editing. YFL: Visualization, Writing – review & editing. CT: Investigation, Writing – review & editing. HL: Writing – review & editing, Formal analysis, Funding acquisition. LZ: Investigation, Resources, Writing – review & editing. JW: Conceptualization, Funding acquisition, Project administration, Resources, Supervision, Writing – review & editing.
The author(s) declare financial support was received for the research, authorship, and/or publication of this article. This research was primarily funded by the Shanxi Province Youth Science Research Project (20210302124233), the Minor Crop Molecular Breeding Platform Special Project of the Shanxi Academy of Agricultural Sciences (YGC2019FZ3), the Central Government Guides Local Science and Technology Development Funds Project (YDZJSX2022A043), the earmarked fund for Modern Agro-industry Technology Research System (2024CYJSTX04-01), and Shanxi Province Science and Technology Innovation Team Project (2015013001–09).
The authors declare that the research was conducted in the absence of any commercial or financial relationships that could be construed as a potential conflict of interest.
All claims expressed in this article are solely those of the authors and do not necessarily represent those of their affiliated organizations, or those of the publisher, the editors and the reviewers. Any product that may be evaluated in this article, or claim that may be made by its manufacturer, is not guaranteed or endorsed by the publisher.
The Supplementary Material for this article can be found online at: https://www.frontiersin.org/articles/10.3389/fpls.2024.1418328/full#supplementary-material
Achard, P., Renou, J. P., Berthome, R., Harberd, N. P., Genschik, P. (2008). Plant DELLAs restrain growth and promote survival of adversity by reducing the levels of reactive oxygen species. Curr. Biol. 18, 656–660. doi: 10.1016/j.cub.2008.04.034
Ankamah-Yeboah, T., Janss, L. L., Jensen, J. D., Hjortshøj, R. L., Rasmussen, S. K. (2020). Genomic selection using pedigree and marker-by-environment interaction for barley seed quality traits from two commercial breeding programs. Front. Plant Sci. 11. doi: 10.3389/fpls.2020.00539
Bolger, A. M., Lohse, M., Usadel, B. (2014). Trimmomatic: a flexible trimmer for Illumina sequence data. Bioinformatics 30, 2114–2120. doi: 10.1093/bioinformatics/btu170
Che, Y. H., Song, N., Yang, Y. P., Yang, X. M., Zhang, Y., Zhang, J. P., et al. (2020). Dynamic QTL mapping for plant height in the hybrid population of Agropyron Gaertn. Plant breed. 139, 1016–1028. doi: 10.1111/pbr.12814
Chen, C. J., Wu, Y., Li, J. W., Wang, X., Zeng, Z. H., Xu, J., et al. (2023). TBtools-II: A “one for all, all for one” bioinformatics platform for biological big-data mining. Mol. Plant 16, 1733–1742. doi: 10.1016/j.molp.2023.09.010
Chen, D. H., Ronald, P. (1999). A rapid DNA minipreparation method suitable for AFLP and other PCR applications. Plant Mol. Biol. Report. 17, 53–57. doi: 10.1023/A:1007585532036
Cui, F., Li, J., Ding, A. M., Zhao, C. H., Wang, L., Wang, X. Q., et al. (2011). Conditional QTL mapping for plant height with respect to the length of the spike and internode in two mapping populations of wheat. Theor. Appl. Genet. 122, 1517–1536. doi: 10.1007/s00122-011-1551-6
de Los Campos, G., Vazquez, A. I., Fernando, R., Klimentidis, Y. C., Sorensen, D. (2013). Prediction of complex human traits using the genomic best linear unbiased predictor. PloS Genet. 9, e1003608. doi: 10.1371/journal.pgen.1003608
Diao, X. M. (2019). Progresses in stress tolerance and field cultivation studies of orphan cereals in China. Sci. Agric. Sin. 52, 3943–3949. doi: 10.3864/j.issn.0578-1752.2019.22.001
Diao, X., Schnable, J., Bennetzen, J. L., Li, J. (2014). Initiation of Setaria as a model plant. Front. Agric. Sci. Eng. 1, 16–20. doi: 10.15302/J-FASE-2014011
Doust, A. N., Kellogg, E. A., Devos, K. M., Bennetzen, J. L. (2009). Foxtail millet: a sequence-driven grass model system. Plant Physiol. 149, 137–141. doi: 10.1104/pp.108.129627
Fan, X. L., Cui, F., Zhao, C. H., Zhang, W., Yang, L. J., Zhao, X. Q., et al. (2015). QTLs for flag leaf size and their influence on yield-related traits in wheat (L.). Mol. Breed. 35, 24. doi: 10.1007/s11032-015-0205-9
Fan, X. K., Tang, S., Zhi, H., He, M. M., Ma, W. S., Jia, Y. C., et al. (2017). Identification and fine mapping of SiDWARF3 (D3), a pleiotropic locus controlling environment-independent dwarfism in foxtail millet. Crop Sci. 57, 2431–2442. doi: 10.2135/cropsci2016.11.0952
Feldman, M. J., Paul, R. E., Banan, D., Barrett, J. F., Sebastian, J., Yee, M. C., et al. (2017). Time dependent genetic analysis links field and controlled environment phenotypes in the model C4 grass Setaria. PloS Genet. 13, e1006841. doi: 10.1371/journal.pgen.1006841
Fu, Y., Zhao, H. Y., Huang, J. K., Zhu, H. T., Luan, X., Bu, S. H., et al. (2022). Dynamic analysis of QTLs on plant height with single segment substitution lines in rice. Sci. Rep. 12, 5465. doi: 10.1038/s41598-022-09536-8
He, Q., Zhi, H., Tang, S., Xing, L., Wang, S. Y., Wang, H. G., et al. (2021). QTL mapping for foxtail millet plant height in multi-environment using an ultra-high density bin map. Theor. Appl. Genet. 134, 1–16. doi: 10.1007/s00122-020-03714-w
Hedden, P., Phillips, A. L. (2000). Gibberellin metabolism: new insights revealed by the genes. Trends Plant sci. 5, 523–530. doi: 10.1016/S1360-1385(00)01790-8
Huang, X. H., Feng, Q., Qian, Q., Zhao, Q., Wang, L., Wang, A. H., et al. (2009). High-throughput genotyping by whole-genome resequencing. Genome Res. 19, 1068–1076. doi: 10.1101/gr.089516.108
Huang, S., Raman, A. S., Ream, J. E., Fujiwara, H., Cerny, R. E., Brown, S. M. (1998). Overexpression of 20-oxidase confers a gibberellin-overproduction phenotype in Arabidopsis. Plant Physiol. 118, 773–781. doi: 10.1104/pp.118.3.773
Kim, D., Langmead, B., Salzberg, S. L. (2015). HISAT: a fast spliced aligner with low memory requirements. Nat. Methods 12, 357–360. doi: 10.1038/nmeth.3317
Kong, W. L., An, B., Zhang, Y., Yang, J., Li, S. M., Sun, T., et al. (2019a). Sugar transporter proteins (STPs) in Gramineae crops: comparative analysis, phylogeny, evolution, and expression profiling. Cells 8, 560. doi: 10.3390/cells8060560
Kong, W. L., Zhong, H., Gong, Z. Y., Fang, X., Sun, T., Deng, X. X., et al. (2019b). Meta-analysis of salt stress transcriptome responses in different rice genotypes at the seedling stage. Plants 8, 64. doi: 10.3390/plants8030064
Li, H., Durbin, R. (2009). Fast and accurate short read alignment with Burrows-Wheeler transform. Bioinformatics 25, 1754–1760. doi: 10.1093/bioinformatics/btp324
Love, M. I., Huber, W., Anders, S. (2014). Moderated estimation of fold change and dispersion for RNA-seq data with DESeq2. Genome Biol. 15, 1–21. doi: 10.1186/s13059-014-0550-8
Ma, J. J., Pei, W. F., Ma, Q. F., Geng, Y. H., Liu, G. Y., Liu, J., et al. (2019). QTL analysis and candidate gene identification for plant height in cotton based on an interspecific backcross inbred line population of Gossypium hirsutum× Gossypium barbadense. Theor. Appl. Genet. 132, 2663–2676. doi: 10.1007/s00122-019-03380-7
Macedo, F. L., Christensen, O. F., Astruc, J. M., Aguilar, I., Masuda, Y., Legarra, A. (2020). Bias and accuracy of dairy sheep evaluations using BLUP and SSGBLUP with metafounders and unknown parent groups. Genet. Sel. Evol. 52, 47. doi: 10.1186/s12711-020-00567-1
Mauro-Herrera, M., Doust, A. N. (2016). Development and genetic control of plant architecture and biomass in the panicoid grass, Setaria. PloS One 11, e0151346. doi: 10.1371/journal.pone.0151346
Mccouch, S. R., Chen, X., Panaud, O., Temnykh, S., Xu, Y., Cho, Y. G., et al. (1997). Microsatellite marker development, mapping and applications in rice genetics and breeding. Plant Mol. Biol. Report. 35, 89–99. doi: 10.1023/A:1005711431474
McKenna, A., Hanna, M., Banks, E., Sivachenko, A., Cibulskis, K., Kernytsky, A., et al. (2010). The Genome Analysis Toolkit: a MapReduce framework for analyzing next-generation DNA sequencing data. Genome Res. 20, 1297–1303. doi: 10.1101/gr.107524.110
Meng, L., Li, H. H., Zhang, L. Y., Wang, J. K. (2015). QTL IciMapping: Integrated software for genetic linkage map construction and quantitative trait locus mapping in biparental populations. Crop J. 3, 269–283. doi: 10.1016/j.cj.2015.01.001
Meyer, R. C., Weigelt-Fischer, K., Tschiersch, H., Topali, G., Altschmied, L., Heuermann, M. C., et al. (2023). Dynamic growth QTL action in diverse light environments: characterization of light regime-specific and stable QTL in Arabidopsis. J. Exp. Bot. 74, 5341–5362. doi: 10.1093/jxb/erad222
Ni, X. M., Xia, Q. J., Zhang, H. B., Cheng, S., Li, H., Fan, G. Y., et al. (2017). Updated foxtail millet genome assembly and gene mapping of nine key agronomic traits by resequencing a RIL population. GigaScience 6, 1–8. doi: 10.1093/gigascience/giw005
Pertea, M., Pertea, G. M., Antonescu, C. M., Chang, T. C., Mendell, J. T., Salzberg, S. L. (2015). StringTie enables improved reconstruction of a transcriptome from RNA-seq reads. Nat. Biotechnol. 33, 290–295. doi: 10.1038/nbt.3122
Phillips, A. L., Ward, D. A., Uknes, S., Appleford, N. E., Lange, T., Huttly, A. K., et al. (1995). Isolation and expression of three gibberellin 20-oxidase cDNA clones from Arabidopsis. Plant Physiol. 108, 1049–1057. doi: 10.1104/pp.108.3.1049
Picard. Picard Toolkit. Available online at: http://sourceforge.net/projects/picard/.
Ramesh, P., Juturu, V. N., Yugandhar, P., Pedersen, S., Hemasundar, A., Yolcu, S., et al. (2023). Molecular genetics and phenotypic assessment of foxtail millet (Setaria italica (L.) P. Beauv.) landraces revealed remarkable variability of morpho-physiological, yield, and yield-related traits. Front. Genet. 14. doi: 10.3389/fgene.2023.1052575
Sakamoto, T., Kobayashi, M., Itoh, H., Tagiri, A., Kayano, T., Tanaka, H., et al. (2001). Expression of a gibberellin 2-oxidase gene around the shoot apex is related to phase transition in rice. Plant Physiol. 125, 1508–1516. doi: 10.1104/pp.125.3.1508
Sasaki, T., International Rice Genome Sequencing, P (2005). The map-based sequence of the rice genome. Nature 436, 793–800. doi: 10.1038/nature03895
Schmitz, A. J., Begcy, K., Sarath, G., Walia, H. (2015). Rice Ovate Family Protein 2 (OFP2) alters hormonal homeostasis and vasculature development. Plant Sci. 241, 177–188. doi: 10.1016/j.plantsci.2015.10.011
Singh, B. D., Abhishek, G. J., Priya, P., Kumar, S., Shinde, S. P., Kumar, S., et al. (2024). Millets as an ancient grains for modern food security and sustainable agriculture. J. Sci. Res. Rep. 30, 706–714. doi: 10.9734/jsrr/2024/v30i62089
Singh, R. K., Prasad, M. (2020). Foxtail Millet: A climate-resilient crop species with potential to ensure food and agriculture security amidst global climate change. IJPE 6, 165–169. doi: 10.18811/ijpen.v6i03.01
Stubbs, C. J., Kunduru, B., Bokros, N., Verges, V., Porter, J., Cook, D. D., et al. (2023). Moving toward short stature maize: the effect of plant height on maize stalk lodging resistance. Field Crops Res. 300, 109008. doi: 10.1016/j.fcr.2023.109008
Sun, F. D., Zhang, J. H., Wang, S. F., Gong, W. K., Shi, Y. Z., Liu, A. Y., et al. (2012). QTL mapping for fiber quality traits across multiple generations and environments in upland cotton. Mol. Breed. 30, 569–582. doi: 10.1007/s11032-011-9645-z
VanRaden, P. M., Cole, J. B. (2020). Genomic selection and using it well in dairy breeding programs. Anim. Front. 10, 48–53. doi: 10.1093/af/vfaa004
Wang, C. T., Wang, X. Z., Wu, Q., Wang, Z. W., Tang, Y. Y., Du, Z. B., et al. (2018). Sensory quality of fresh green peanuts: Dominance analysis, selection of elite lines and heritability estimates. J. Peanut Sci. 47, 71–74. doi: 10.14001/j.issn.1002-4093.2018.04.012
Wang, X. Q., Zhang, R. Y., Song, W., Han, L., Liu, X. L., Sun, X., et al. (2019). Dynamic plant height QTL revealed in maize through remote sensing phenotyping using a high-throughput unmanned aerial vehicle (UAV). Sci. Rep. 9, 3458. doi: 10.1101/369884
Wu, W., Li, W., Lu, H. (1997). Strategy of dynamic mapping of quantitative trait loci. J. Biomath. S1), 6.
Wu, J., Mao, L. L., Tao, J. C., Wang, X. X., Zhang, H. J., Xin, M., et al. (2022). Dynamic quantitative trait loci mapping for plant height in recombinant inbred line population of upland cotton. Front. Plant Sci. 13. doi: 10.3389/fpls.2022.914140
Xie, N., Guo, Q. Q., Li, H. E., Yuan, G. Y., Gui, Q., Xiao, Y., et al. (2024). Integrated transcriptomic and WGCNA analyses reveal candidate genes regulating mainly flavonoid biosynthesis in Litsea coreana var. sinensis. BMC Plant Biol. 24, 231. doi: 10.1186/s12870-024-04949-1
Xue, C. X., Zhi, H., Fang, X. J., Liu, X. T., Tang, S., Chai, Y., et al. (2016). Characterization and fine mapping of SiDWARF2 (D2) in foxtail millet. Crop Sci. 56, 95–103. doi: 10.2135/cropsci2015.05.0331
Yamaguchi, S. (2008). Gibberellin metabolism and its regulation. Annu. Rev. Plant Biol. 59, 225–251. doi: 10.1007/s003440010039
Yang, G. H., Xing, Y. Z., Li, S. Q., Ding, J. Z., Yue, B., Deng, K., et al. (2006). Molecular dissection of developmental behavior of tiller number and plant height and their relationship in rice (Oryza sativa L.). Hereditas 143, 236–245. doi: 10.1111/j.2006.0018-0661.01959.x
Yao, Y. J., Xiong, E. H., Qu, X. L., Li, J. F., Liu, H. L., Quan, L. P., et al. (2023). WGCNA and transcriptome profiling reveal hub genes for key development stage seed size/oil content between wild and cultivated soybean. BMC Genomics 24, 494. doi: 10.1186/s12864-023-09617-6
Zhang, K., Fan, G. Y., Zhang, X. X., Zhao, F., Wei, W., Du, G. H., et al. (2017). Identification of QTLs for 14 agronomically important traits in Setaria italica based on SNPs generated from high-throughput sequencing. G3: Genes Genomes Genet. 7, 1587–1594. doi: 10.1534/g3.117.041517
Zhao, M. C., Zhi, H., Zhang, X., Jia, G. Q., Diao, X. M. (2019). Retrotransposon-mediated DELLA transcriptional reprograming underlies semi-dominant dwarfism in foxtail millet. Crop J. 7, 458–468. doi: 10.1016/j.cj.2018.12.008
Zhu, J. (1995). Analysis of conditional genetic effects and variance components in developmental genetics. Genetics 141, 1633–1639. doi: 10.1002/gcc.2870140411
Zhu, M. Y., He, Q., Lyu, M. J., Shi, T. T., Gao, Q., Zhi, H., et al. (2023). Integrated genomic and transcriptomic analysis reveals genes associated with plant height of foxtail millet. Crop J. 11, 12. doi: 10.1016/j.cj.2022.09.003
Keywords: foxtail millet, plant height, BLUP, dynamic QTL mapping, RNA-Seq, candidate gene
Citation: Han K, Wang Z, Shen L, Du X, Lian S, Li Y, Li Y, Tang C, Li H, Zhang L and Wang J (2024) Mapping of dynamic quantitative trait loci for plant height in a RIL population of foxtail millet (Setaria italica L.). Front. Plant Sci. 15:1418328. doi: 10.3389/fpls.2024.1418328
Received: 16 April 2024; Accepted: 01 July 2024;
Published: 24 July 2024.
Edited by:
Zoe Hilioti, Centre for Research and Technology Hellas (CERTH), GreeceReviewed by:
Kaushal Pratap Singh, Directorate of Rapeseed Mustard Research (DRMR), IndiaCopyright © 2024 Han, Wang, Shen, Du, Lian, Li, Li, Tang, Li, Zhang and Wang. This is an open-access article distributed under the terms of the Creative Commons Attribution License (CC BY). The use, distribution or reproduction in other forums is permitted, provided the original author(s) and the copyright owner(s) are credited and that the original publication in this journal is cited, in accordance with accepted academic practice. No use, distribution or reproduction is permitted which does not comply with these terms.
*Correspondence: Jun Wang, MTI4d2FuQDE2My5jb20=
Disclaimer: All claims expressed in this article are solely those of the authors and do not necessarily represent those of their affiliated organizations, or those of the publisher, the editors and the reviewers. Any product that may be evaluated in this article or claim that may be made by its manufacturer is not guaranteed or endorsed by the publisher.
Research integrity at Frontiers
Learn more about the work of our research integrity team to safeguard the quality of each article we publish.