 Yuping Lv
 Linhui Gu
 Runze Man
 Xiaoyin Liu2
 Junzeng Xu
95% of researchers rate our articles as excellent or good
Learn more about the work of our research integrity team to safeguard the quality of each article we publish.
Find out more
ORIGINAL RESEARCH article
Front. Plant Sci. , 01 August 2024
Sec. Photosynthesis and Photobiology
Volume 15 - 2024 | https://doi.org/10.3389/fpls.2024.1397948
This article is part of the Research Topic Enhancement of Photosynthesis through Light Utilization in Plants and Crops View all 10 articles
To investigate the dynamics of stomata, transpiration, and photosynthesis under varying light intensities and CO2 conditions during leaf development, the light response and CO2 response of stomatal conductance (gsw), transpiration rate (Tr), and net photosynthetic rate (Pn) were observed for rice leaves at different days after leaf emergence (DAE). The results showed that (1) as photosynthetically active radiation (PAR) increased, leaf gsw, Tr, and Pn initially increased rapidly and linearly, followed by a more gradual rise to maximum values, and then either stabilized or showed a declining trend. The maximum gsw, Tr, and Pn were smaller and occurred earlier for old leaves than for young leaves. The gsw, Tr, and Pn all exhibited a linear decreasing trend with increasing DAE, and the rate of decrease slowed down with the reduction in PAR; (2) as the CO2 concentration (Ca) increased, gsw and Tr decreased gradually to a stable minimum value, while Pn increased linearly and slowly up to the maximum and then kept stable or decreased. The gsw, Tr, and Pn values initially kept high and then decreased with the increase of DAE. These results contribute to understanding the dynamics in gsw, Tr, and Pn during rice leaf growth and their response to varied light and CO2 concentration conditions and provide mechanistic support to estimate dynamic evapotranspiration and net ecosystem productivity at field-scale and a larger scale in paddy field ecosystems through the upscaling of leaf-level stomatal conductance, transpiration, and photosynthesis.
Stomata play a crucial role in regulating water loss through transpiration and carbon dioxide (CO2) uptake for photosynthesis, significantly influencing water use efficiency and plant productivity (Lawson and Vialet-Chabrand, 2019). Understanding the responses of stomatal conductance (gsw), transpiration rate (Tr), and net photosynthetic rates (Pn) to environmental factors is essential to assess evapotranspiration and net ecosystem productivity in agroecosystems (Bellasio, 2023; Konieczna et al., 2023; Lv et al., 2024). Research into the intricate dynamics of gsw, Tr, and Pn across different environments improves predictive abilities and refines strategies for water utilization and agricultural optimization, which contributes to developing sustainable agricultural strategies aimed at maximizing productivity while minimizing water consumption (Elfadl and Luukkanen, 2006; Katul, 2023; Wu et al., 2023).
Several factors, including crop canopy structure (leaf area index, leaf tilt angle, etc.), leaf nutrient elements (nitrogen, chlorophyll, etc.), soil water-thermal conditions, and meteorological factors (solar radiation, CO2 concentration, temperature, atmospheric humidity, etc.), have been widely studied for their influence on leaf gsw, Tr, and Pn (Chen et al., 2011; Xu et al., 2015; Liu et al., 2019). The impact of light and CO2, as the primary energy source and substrate for plant photosynthesis, on leaf gsw, Tr, and Pn have been extensively studied (Baroli et al., 2008, Li et al., 2023, Yi et al., 2023). With increased light intensity and CO2 concentration, leaf Pn initially increase rapidly and then slowly up to the maximum, followed by a declining trend or a stable state, which have been universally acknowledged on various crops (Kabir et al., 2023). Yu et al. (2004) reported that winter wheat gsw decreases with increased CO2 concentration and increases with increased light intensity, Marín et al. (2014) stated that tobacco Tr is higher at high than at low light intensities, and Kirschbaum and McMillan (2018) showed that increasing atmospheric CO2 concentrations reduce canopy transpiration. Additionally, the duration (such as cumulative time, thermal time accumulation, or radiant heat accumulation) after leaf emergence also leads to changes in leaf gsw, Tr, and Pn due to changes in both leaf traits (Legner et al., 2014; Scoffoni et al., 2016; Hirooka et al., 2018) and biomass sink–source relations (Kitajima et al., 2002; Xie and Luo, 2003) along with leaf aging from leaf appearance to senescence—for example, Vos and Oyarzun (1987) reported that potato Pn and gsw decreased at near-saturating irradiance with leaf age, Echer and Rosolem (2015) stated that cotton Pn and gsw decreased in the order of 15-, 30-, 45-, and 60-day-old leaves. Locke and Ort (2014) showed that soybean Pn decreased at a specific light intensity. However, the response of gsw, Tr, and Pn to light and CO2, respectively, are rarely reported for rice leaves with different durations after emergence.
As the most important staple food crop in the world, the three-dimensional canopy structure of rice, describing the elongation process and spatial distribution of various organs (leaves, leaf sheaths, stems, and panicles), has been widely studied (Watanabe et al., 2005; Song et al., 2013). Temporal leaf evapotranspiration and photosynthesis with detailed 3D representation of canopy architecture are necessary to estimate seasonal variation in evapotranspiration and ecosystem productivity at field-scale and a larger scale in paddy field ecosystems, which are often achieved through the upscaling of leaf-level stomatal conductance, transpiration, or photosynthesis (Van der Zande et al., 2009; Chang et al., 2019; Shi et al., 2019). Measured light-saturated rice Pn reaches a maximum at the fully developed stage and then declines gradually as leaves senesce (Wang et al., 2009) or decreases from the top (young leaves) to the base (old leaves) within the rice canopy (Murchie et al., 2002; Jin et al., 2004). The response of Pn to light and CO2 also changes as rice leaves age (Xu et al., 2019). Thus, it is well known that gsw and Tr, under different light density and CO2 concentration conditions, also vary among leaves with various durations after leaf emergence. However, the response of gsw and Tr to light and CO2 is rarely reported for rice leaves with different durations after leaf emergence.
The southern regions of the Yangtze River constitute the primary rice cultivation area in China (You et al., 2011). Understanding how the duration after leaf emergence affects Pn, gsw, and Tr under different light density and CO2 concentration conditions is essential to unravel the physiological mechanisms of crop transpiration and photosynthesis and to assess seasonal changes in evapotranspiration and ecosystem productivity under different environmental conditions. Therefore, this study aimed to elucidate and analyze the influence of different days after leaf emergence (DAE) on Pn, gsw, and Tr as well as their quantitative relationships with DAE. This will help to understand the dynamic changes in Pn, gsw, and Tr and provide a reference to clarify the mechanism of transpiration and photosynthesis during the growth process of rice leaves.
The Japonica Rice NJ46 was transplanted with 13 cm × 25 cm hill spacing on July 1, 2017 and harvested on October 26, 2017 in Kunshan, East China (31°15′50″ N, 120°57′43″ E) under field conditions. The rice field extended approximately 200 m in all directions. The region has a subtropical monsoon climate, with average temperature, mean relative humidity, and seasonal precipitation of 25.9°C, 76.9%, and 450.8 mm during the 2017 rice season. Irrigation, fertilizer, and pesticides were applied according to local farming practice (Guo et al., 2017; Li et al., 2023; Lv et al., 2024). To record DAE for subsequent data collection, three latest-emerged leaves on approximately 20 rice plants were tagged at 2-day intervals during tillering, jointing, and booting stages. Using a photosynthesis system (LI- 6800; LI-COR, Lincoln, NE, USA) equipped with a red/blue LED light source (LI-6800–02B) and a charged CO2 cartridge (CO2 source), the response of leaf stomatal conductance (gsw), transpiration rate (Tr), and net photosynthetic rate (Pn) to photosynthetically active radiation (PAR) and atmospheric CO2 concentration (Ca) were measured for tagged leaves at various DAE values at booting and heading stages. The chamber temperature and relative humidity were set as 30°C and 70%, and the measurements were conducted under saturated soil moisture conditions at 8:00–12:00 a.m. on randomly selected sunny days during jointing and heading stages. For the response of gsw, Tr, and Pn to PAR, the Ca and PAR were set at 400 μmol mol-1 (approximate atmospheric CO2 concentration) and 2,000 μmol m-2 s-1, and such a condition was maintained for 15 min for adaptation and stabilization of leaf photosynthesis prior to measurement. Then, leaf gsw, Tr, and Pn were recorded automatically at 120-s intervals at 19 PAR levels (in decreasing order of 2,000, 1,950, 1,900, 1,800, 1,600, 1,400, 1,200, 1,000, 800, 600, 400, 300, 200, 150, 100, 70, 50, 30, and 0 μmol m-2 s-1). For the response of gsw, Tr, and Pn to Ca, the Ca and PAR were set at 400 μmol mol-1 and 1,600 μmol m-2 s-1 [slightly lower than saturation light intensity (Xu et al., 2019) to prevent photo inhibition], and leaf gsw, Tr, and Pn were recorded automatically at 120-s intervals at 14 Ca levels (in the order of 400, 300, 200, 100, 50, 400, 400, 500, 600, 800, 1,000, 1,300, 1,500, and 1,800 μmol mol–1) after a 15-min pre-treatment. Totally, 37 response curves to PAR and 24 curves to Ca were measured, evenly distributed across DAE values ranging from 3 to 55.
The gsw, Tr, and Pn values were influenced by both the DAE and PAR (Figure 1). Under dark conditions (PAR = 0 μmol m-2 s-1), leaves at different DAE maintained relatively low gsw and Tr and negative Pn. As PAR increased, gsw, Tr, and Pn initially exhibited a linear and rapid increase, and then the increase rate (indicated by dgsw/dPAR, dTr/dPAR, and dPn/dPAR) gradually slowed down. When PAR reached a certain light intensity (referred to the saturation light intensity for gsw, Tr, and Pn, respectively), gsw, Tr, and Pn reached their maximum values. Subsequently, with further increases in PAR, there was a declining trend (for leaves at DAE lower than approximately 40 days) or a stable state (for leaves at DAE higher than approximately 40 days). The gsw, Tr, and Pn, as well as their increase rates with increasing PAR among leaves at different DAE, exhibited similar values under low PAR conditions and showed more pronounced differences as PAR increased.
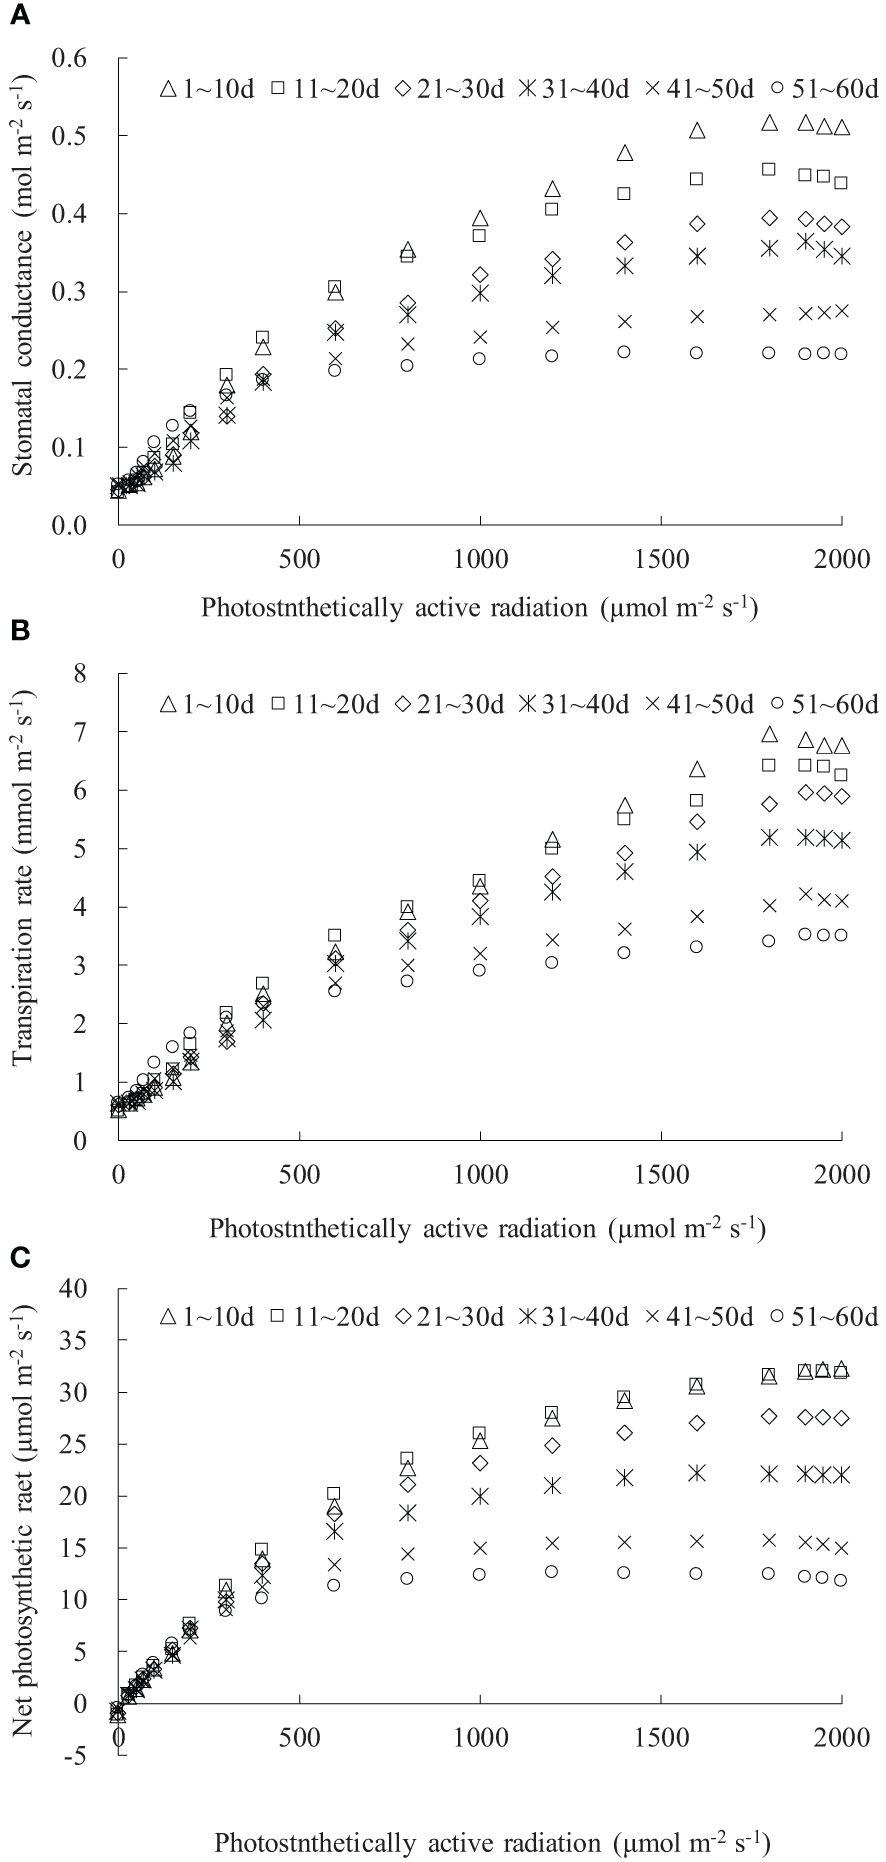
Figure 1 (A–C) The light response of stomatal conductance, transpiration rate, and net photosynthetic rate for rice leaves with different ranges of days after leaf emergence (“m~n d” in the legend indicates the days after leaf emergence; ranges from m to n).
Both the maximum gsw and its corresponding saturation light intensity decreased with increasing DAE, with older leaves reaching maximum gsw at lower PAR conditions (Figure 1A). The maximum gsw were 0.517, 0.456, 0.394, 0.364, 0.275, and 0.221 mol m-2 s-1 for leaves at DAE of 1–10, 11–20, 21–30, 31–40, 41–50, and 51–60 days. Young leaves (low DAE) maintained high gsw, facilitating photosynthesis and transpiration under high PAR conditions. The light response curves of leaf Tr were distinctly influenced by DAE (Figure 1B). The Tr at specific PAR values, as well as the saturation light intensity when Tr reached the maximum, considerably decreased with increasing DAE. The average Pn values, respectively, were -1.173, -1.141, -0.990, -0.720, -0.519, and -0.462 μmol m-2 s-1 for leaves at DAE of 1–10, 11–20, 21–30, 31–40, 41–50, and 51–60 days under PAR = 0 μmol m-2 s-1 conditions (Figure 1C). The negative Pn observed under no-light conditions represented leaf respiration capacity. The decreased absolute value of Pn with increasing DAE implied that the leaf respiration rate attenuated with an increase in DAE, attributable to the exuberant leaf respiration for young leaves. The maximum Pn values were 32.263, 31.959, 27.645, 22.164, 15.676, and 12.582 μmol m-2 s-1, respectively, for leaves at DAE of 1–10, 11–20, 21–30, 31–40, 41–50, and 51–60 days. Young leaves sustained high Pn under high PAR conditions and exhibited vigorous physiological growth.
In any PAR condition, leaf gsw linearly decreased with an increase in DAE, and the decrease rate (indicated by the absolute value of the slope of the linear regression line) increased with enhanced PAR (Figure 2). Under PAR of 0 and 100 μmol m-2 s-1 conditions, DAE had a negligible impact on leaf gsw, and the leaves consistently maintained a lower gsw value. Under PAR of 200, 400, and 800 μmol m-2 s-1 conditions, the slopes of gsw against DAE were -0.0018, -0.0038, and -0.0057, respectively; the leaf gsw significantly decreased with increasing DAE, and there are noticeable differences in both leaf gsw and the decrease rate among different PAR intensities. Under conditions of PAR higher than 1,200 μmol m-2 s-1, the decrease rate in leaf gsw with DAE was approximately 0.007, and leaf gsw ranged from 0.127 to 0.659 mmol m-2 s-1. Leaf gsw significantly decreased with increasing DAE, but the differences in both leaf gsw and the decrease rate were less pronounced among different PAR intensities.
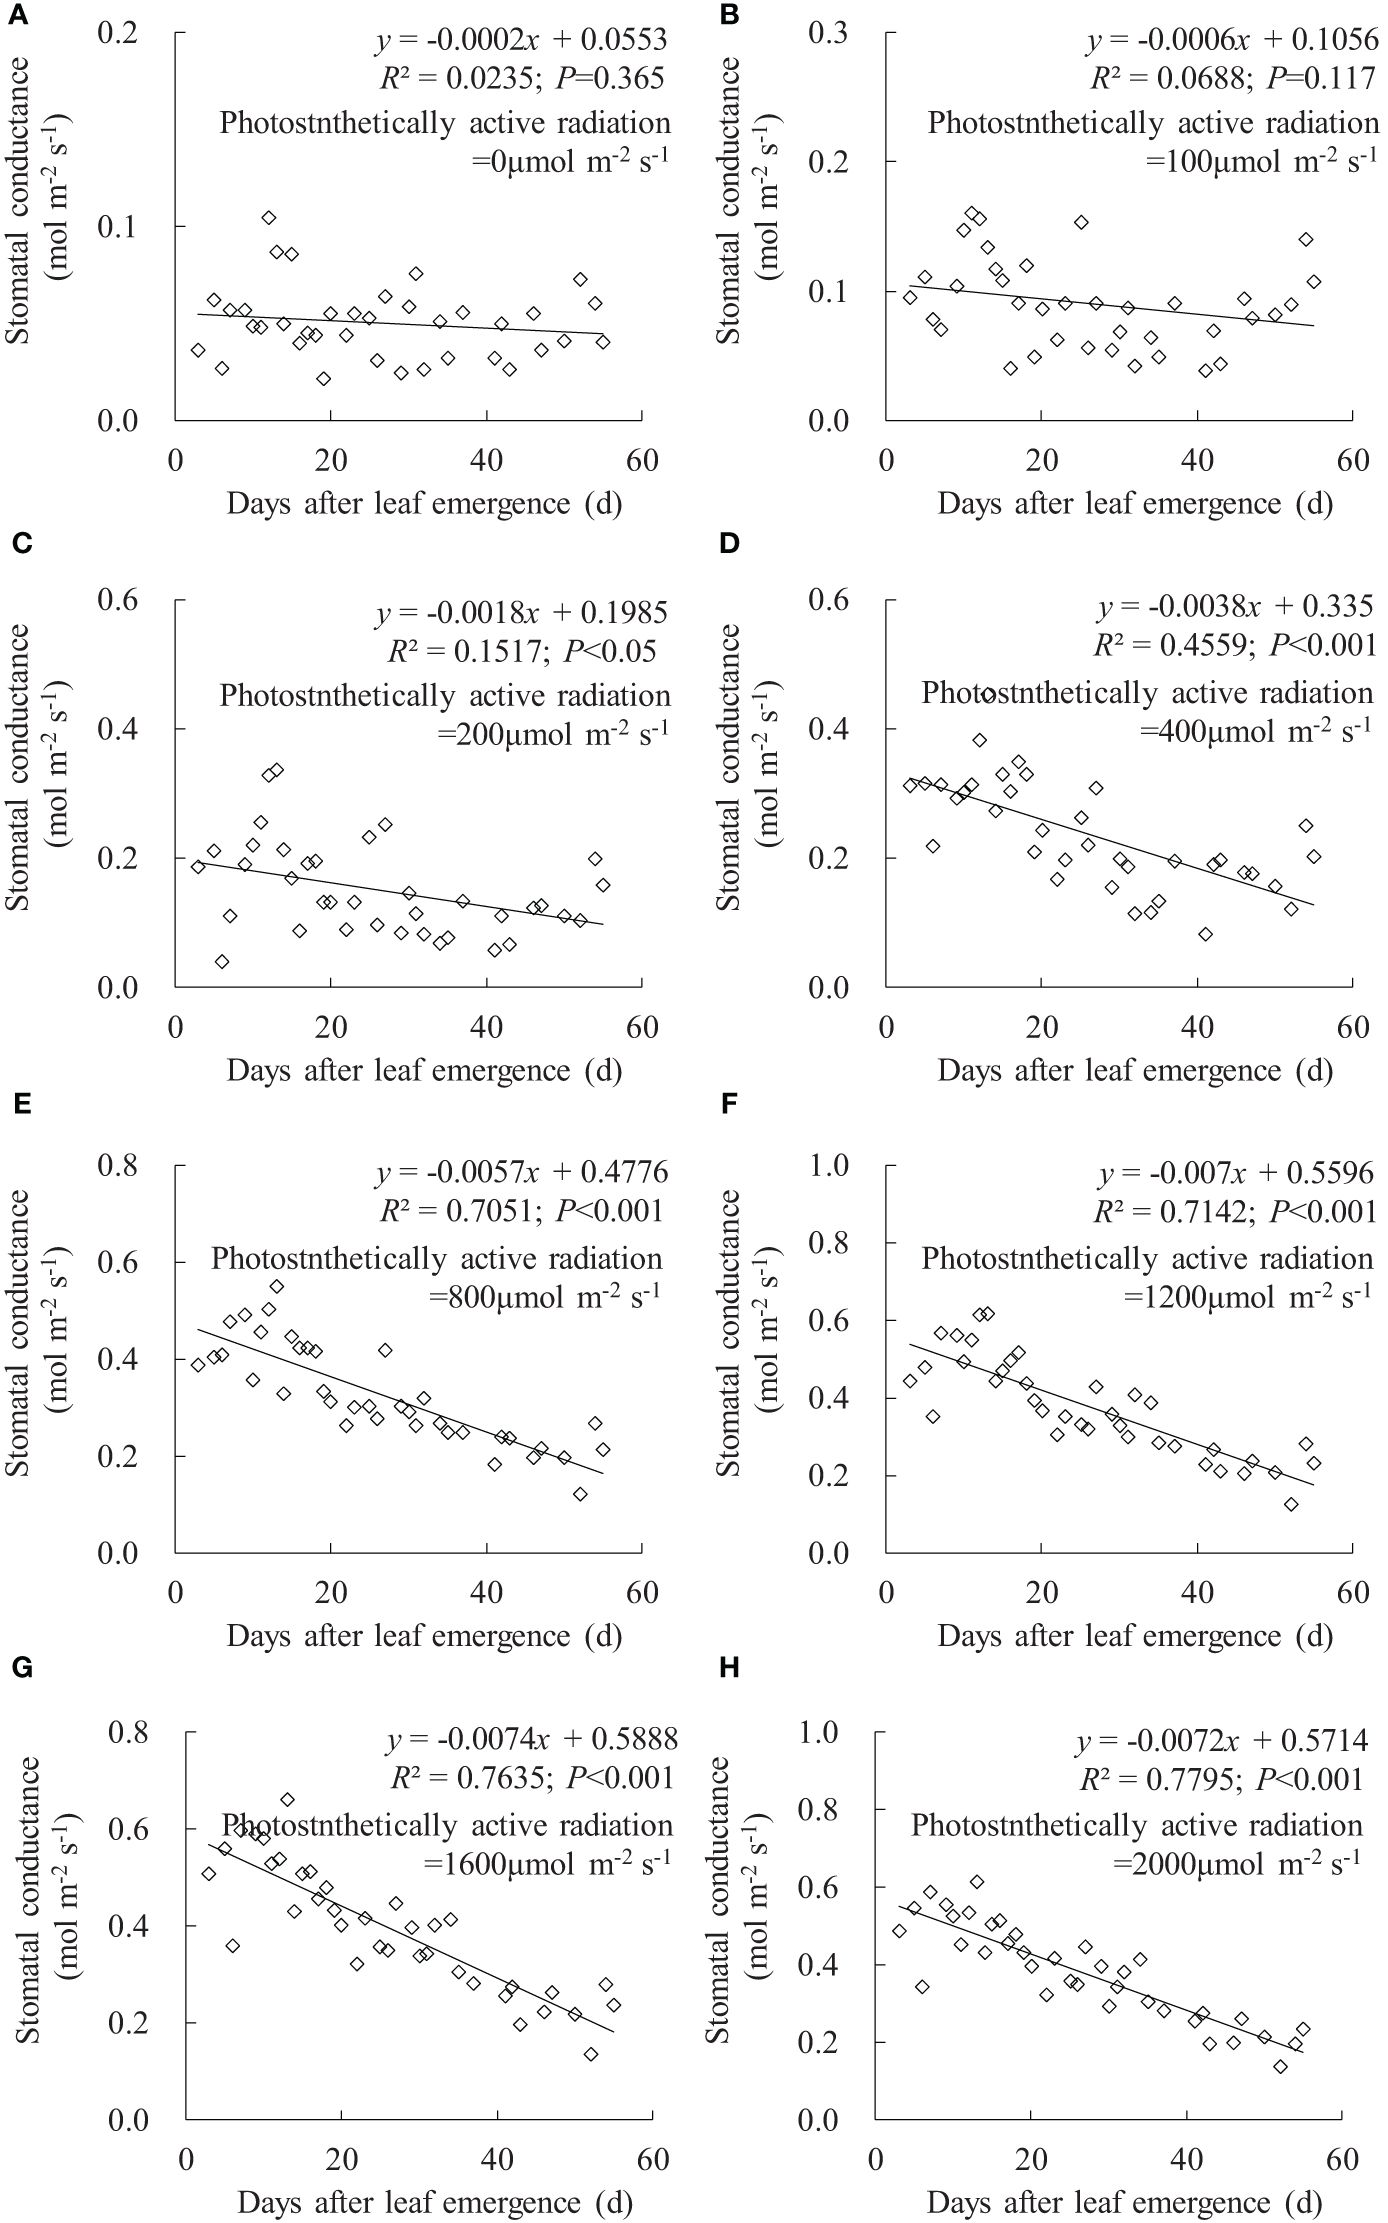
Figure 2 (A–H) Impact of days after leaf emergence on stomatal conductance under different photosynthetically active radiation conditions.
Consistent with the variation in leaf gsw, leaf Tr linearly decreased with an increase in DAE under any PAR condition, and the decrease rate increased with enhanced PAR (Figure 3). Under PAR conditions lower than 200 μmol m-2 s-1, leaf Tr external environmental demand for leaf evaporation is weak, and leaf Tr remains consistently low, with no significant decrease in leaf Tr with increasing DAE. Under PAR intensities of 400, 800, 1,200, 1,600, and 2,000 μmol m-2 s-1, leaf Tr respectively ranged from 1.015 to 4.265, 1.724 to 5.359, 1.938 to 7.790, 2.221 to 7.677, and 2.819 to 9.072 mmol m-2 s-1, and the slopes of leaf Tr against DAE, respectively, were -0.0325, -0.0464, -0.0666, -0.0771, and -0.0988. Under high PAR conditions (exceeding 400 μmol m-2 s-1), leaf Tr significantly decreased, and the decrease rate becomes more pronounced with increasing PAR. Younger leaves can maintain higher Tr under high light conditions to expedite transpirational cooling, enabling the leaves to remain within the optimal temperature range for physiological activities. As the leaves aged, physiological activity decreased, and leaf adaptability to light intensity decreased, resulting in lower Tr under high light conditions.
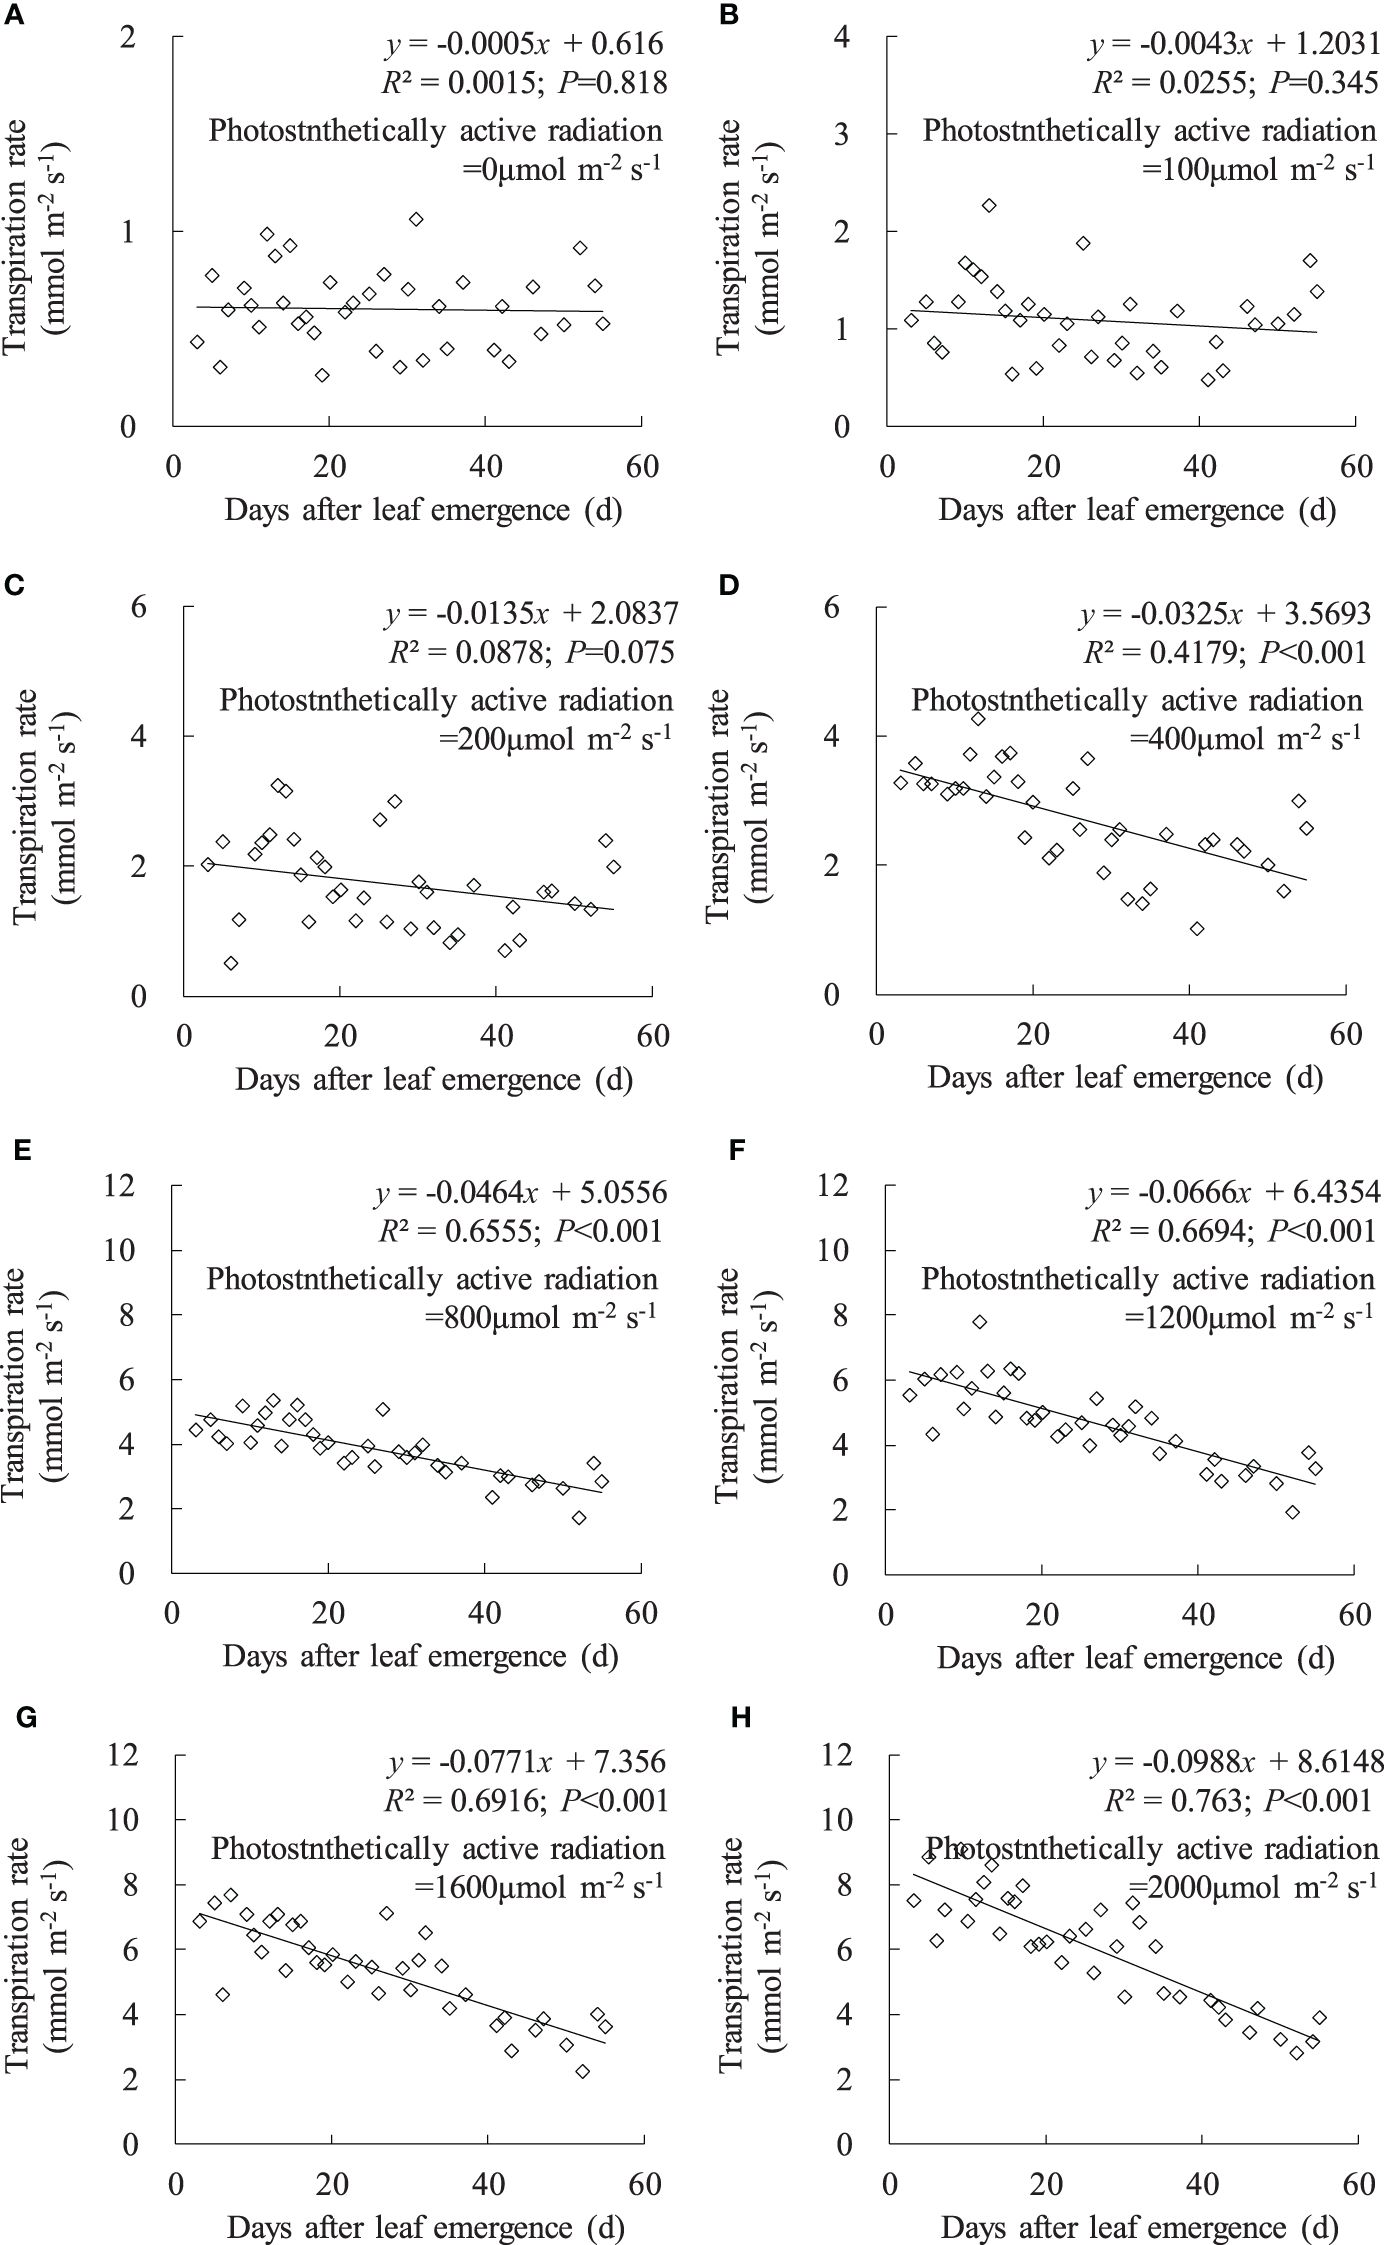
Figure 3 (A–H) Impact of days after leaf emergence on transpiration rate under different photosynthetically active radiation conditions.
Under no-light conditions (PAR = 0 μmol m-2 s-1), leaf Pn was negative, and Pn linearly increased with DAE (Figure 4). The leaves were unable to perform photosynthesis under zero light intensity, and leaves with low DAE exhibited a stronger metabolic activity, reflected in a higher respiration rate (manifested as negative values). Under a PAR of 100 μmol m-2 s-1, leaf Pn remained at approximately 3.6 μmol m-2 s-1, with no significant change in leaf Pn with increasing DAE. Under PAR conditions higher than 200 μmol m-2 s-1, leaf Pn significantly decreased with increasing DAE, and the magnitude of decrease became more pronounced with enhanced PAR.
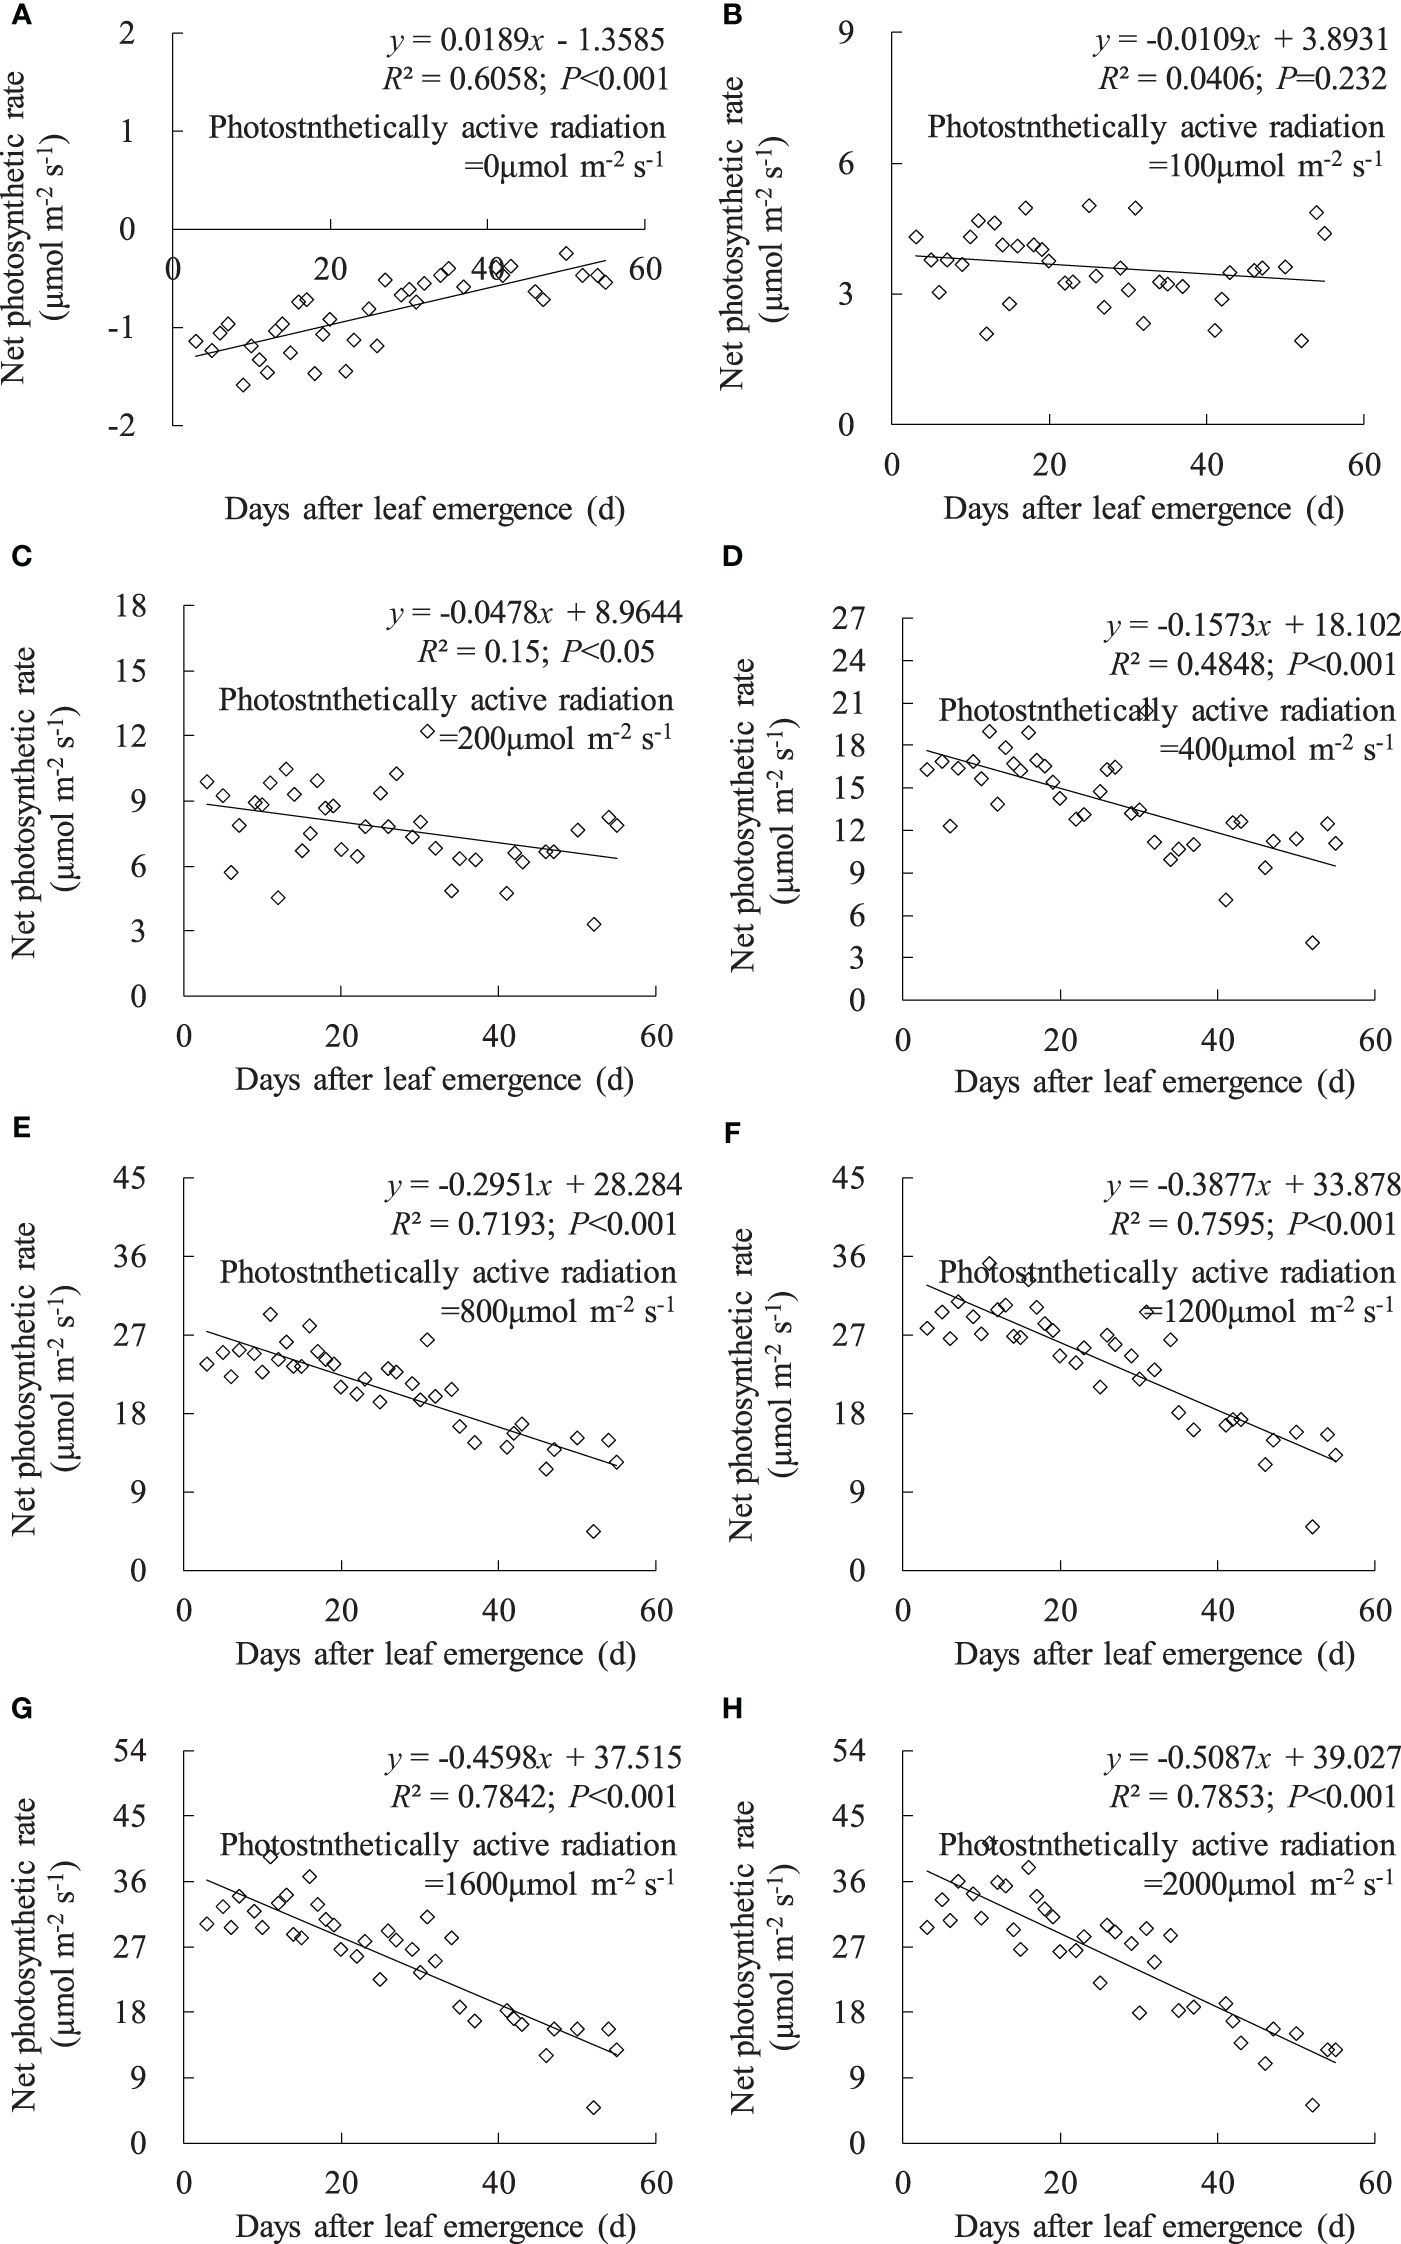
Figure 4 (A–H) Impact of days after leaf emergence on net photosynthetic rate under different photosynthetically active radiation conditions.
The Ca considerably influenced gsw, Tr, and Pn in rice leaves (Figure 5). The diffusion of CO2 from the outside to the inside of the leaf primarily relied on stomata; an increase in Ca led to a reduction in leaf gsw, followed by a decrease in leaf Tr (Figures 5A, B). Leaf gsw and Tr gradually decreased with increasing Ca and DAE, and their decreasing rate slowed down as Ca increased. When Ca increased to approximately 1,500 μmol mol-1, leaf gsw and Tr stabilized at the minimum values. Under the Ca range of 0 to 1,800 μmol mol-1, leaf gsw respectively ranged from 0.103 to 0.693, 0.171 to 0.411, 0.139 to 0.458, 0.133 to 0.404, 0.135 to 0.247, and 0.104 to 0.165 mol m-2 s-1, and leaf Tr respectively ranged from 1.426 to 7.895, 2.694 to 5.622, 2.431 to 6.401, 2.423 to 5.912, 2.326 to 3.872, and 1.615 to 2.514 mmol m-2 s-1 for DAE of 1–10, 11–20, 21–30, 31–40, 41–50, and 51–60 days. Both leaf gsw and Tr decreased with increasing DAE under specific Ca conditions. Leaves at smaller DAE maintained higher gsw and Tr at low Ca, indicating that vigorously growing leaves sustained higher gsw for physiological processes (such as transpiration and photosynthesis) and exhibited robust physiological activity even under low Ca conditions. There was a relatively small difference in leaf gsw and Tr among leaves at different DAE at high Ca concentrations. Leaves with larger DAE (41–50 and 51–60 days) showed limited sensitivity of gsw and Tr to changes in Ca concentration, maintaining consistently lower values regardless of the variations in Ca concentration.
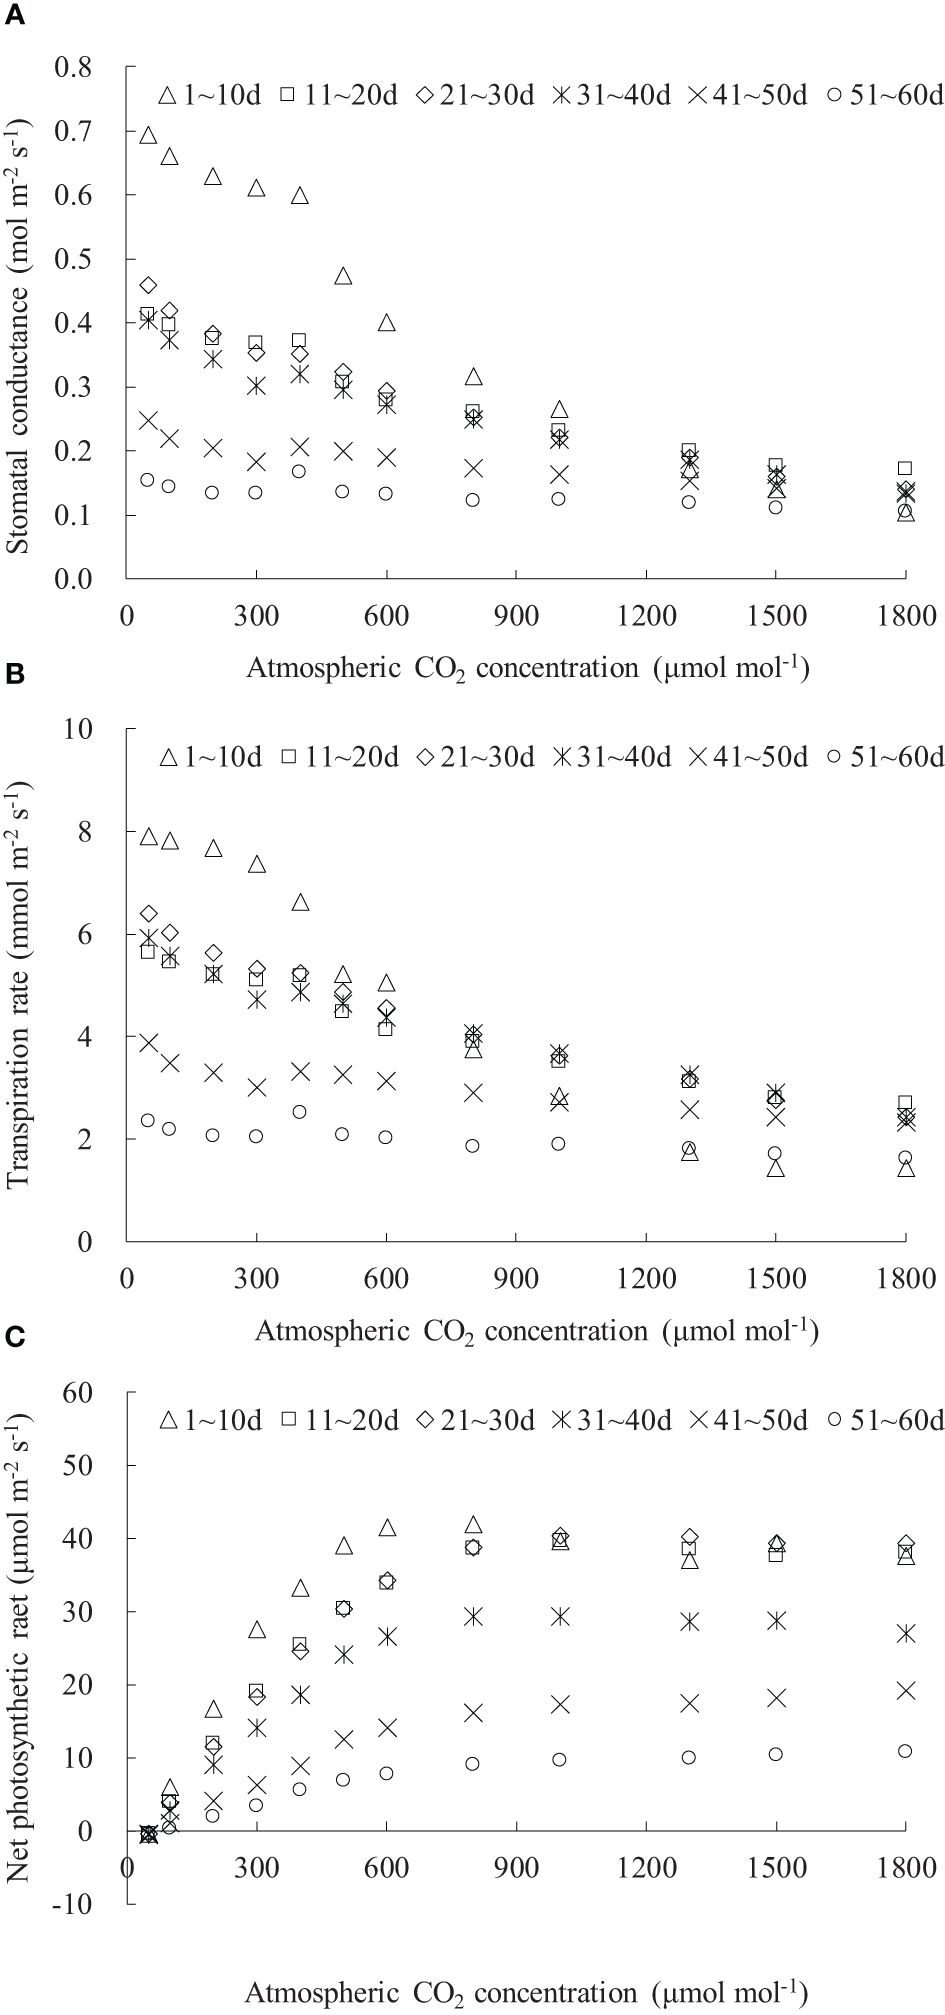
Figure 5 (A–C) CO2 response of stomatal conductance, transpiration rate, and net photosynthetic rate of rice leaves with different ranges of days after leaf emergence (“m~n d” in the legend indicates the days after leaf emergence; ranges from m to n).
The leaf Pn at different DAE exhibited a similar trend with changing atmospheric Ca (Figure 5C). The increase rate of leaf Pn (indicated by dPn/dCa) gradually slowed down with increasing DAE. As Ca increased, rice leaf Pn initially increased rapidly in a linear fashion, and the increase rate subsequently decreased, and leaf Pn gradually reached its maximum value, resulting in either a stable or a declining Pn. Under CO2 concentrations lower than 50 μmol mol-1, leaf photosynthesis was constrained by the available CO2 concentration; larger stomatal conductance could not compensate for the impact of low CO2 concentration, resulting in lower leaf photosynthesis than respiration, leading to CO2 emission (negative Pn values). Within the Ca range of 0 to 1,800 μmol mol-1, leaf Pn ranged from -0.437 to 41.866, -0.419 to 39.614, -0.491 to 40.345, -0.639 to 29.344, -0.485 to 19.135, and -0.504 to 10.657 μmol m-2 s-1 for DAE of 1–10, 11–20, 21–30, 31–40, 41–50, and 51–60 days, respectively. As DAE decreases, both the peak value of Pn and the carboxylation rate (the slope of the linear segment) increased, indicating that leaves with smaller DAE possessed a stronger photosynthetic capability.
The relationships between gsw, Tr, and Pn and DAE could be fitted using quadratic regression equations (Figures 6–8). Under Ca of 50, 200, 400, 600, 1,000, and 1,800 μmol mol-1, leaf gsw respectively ranged from 0.132 to 0.535, 0.122 to 0.474, 0.134 to 0.478, 0.129 to 0.390, 0.111 to 0.316, and 0.046 to 0.224 mmol m-2 s-1. Leaf gsw decreased along with increasing Ca. As DAE increased, leaf gsw initially remained at higher values and subsequently gradually decreased. Young leaves (small DAE) maintained higher gsw to facilitate physiological activities at low Ca conditions. High CO2 concentrations (especially at a Ca of 1,800 μmol mol-1) inhibited stomatal aperture, and the leaf gsw at different DAE consistently remained at lower values.
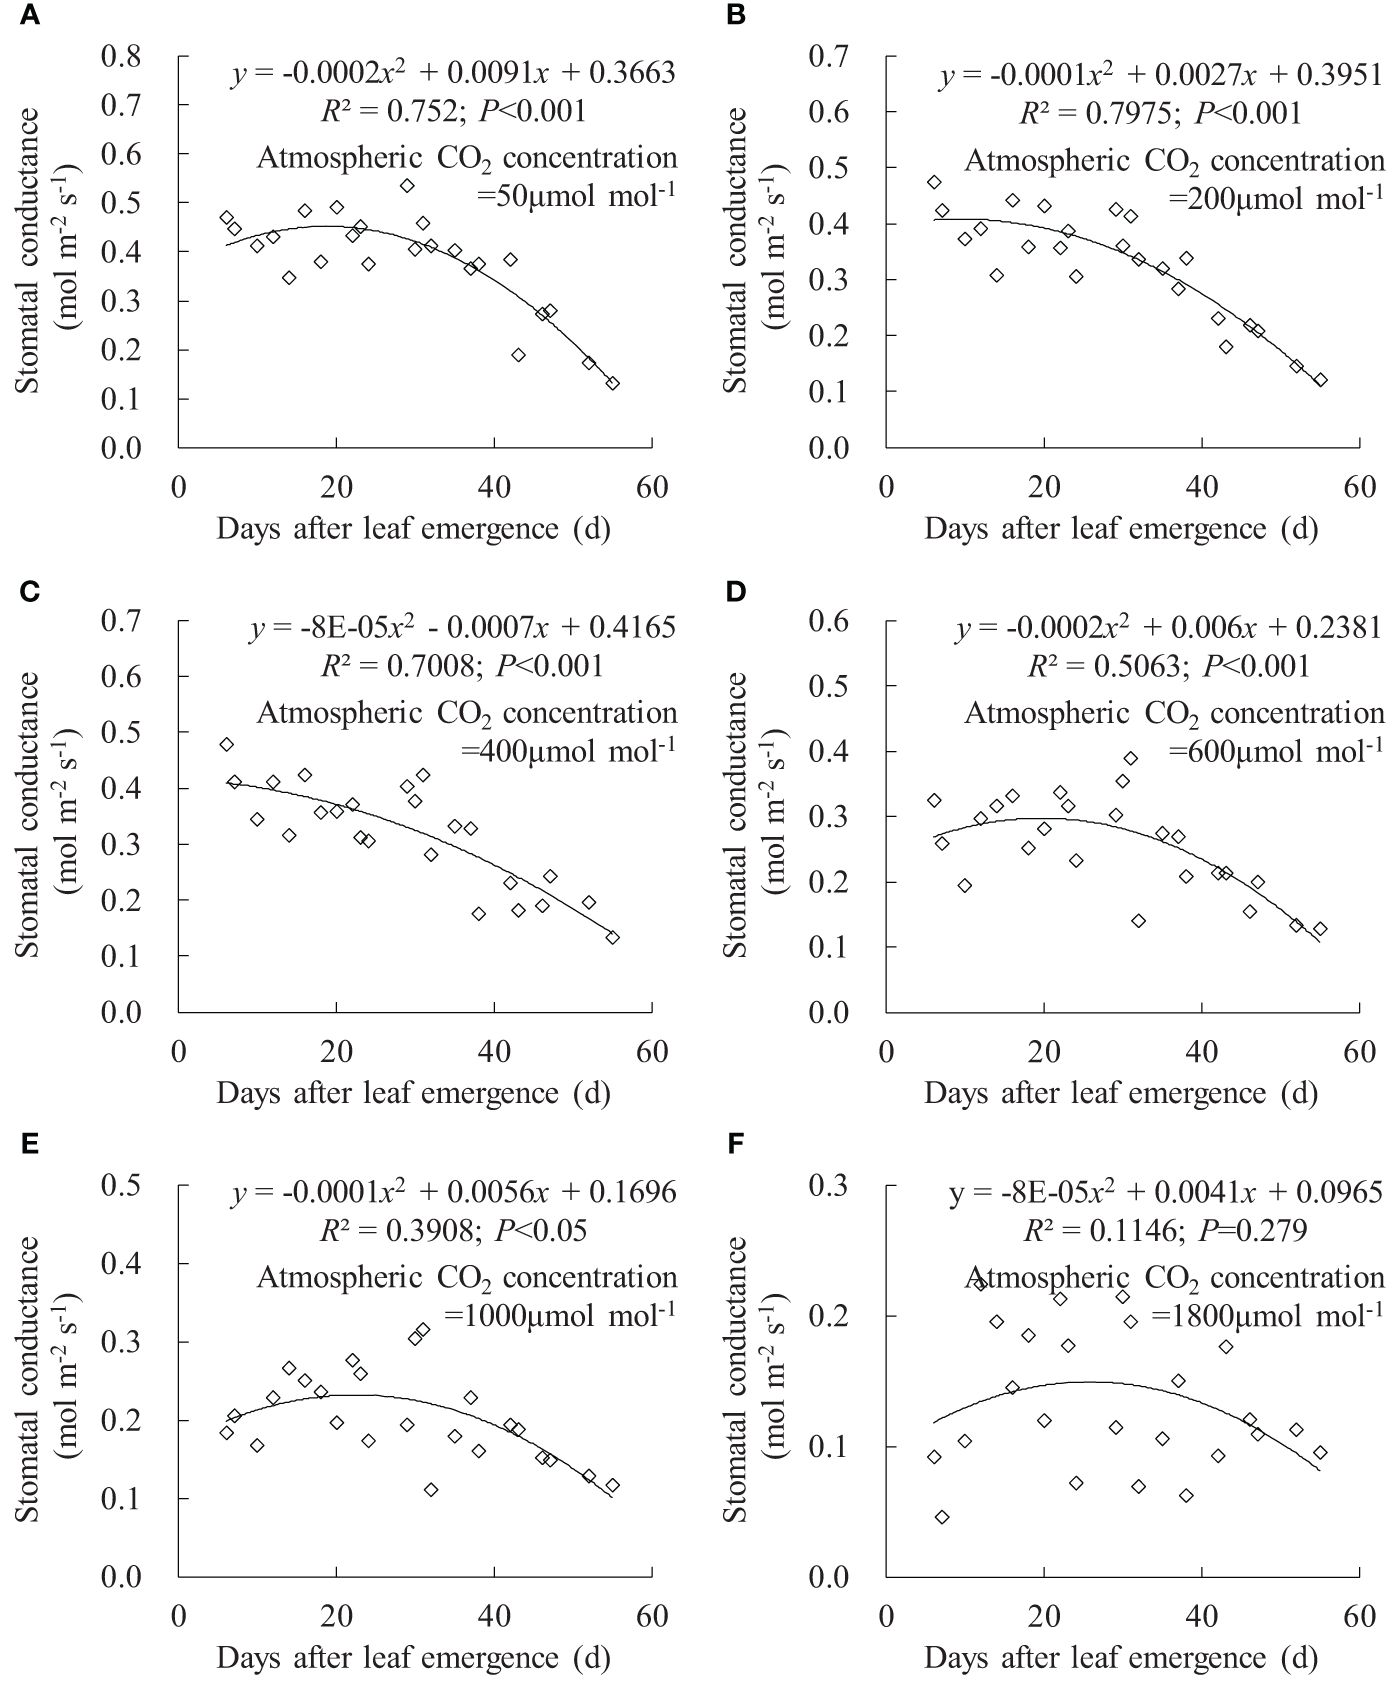
Figure 6 (A–F) Impact of days after leaf emergence on stomatal conductance under different atmospheric CO2 concentration conditions.
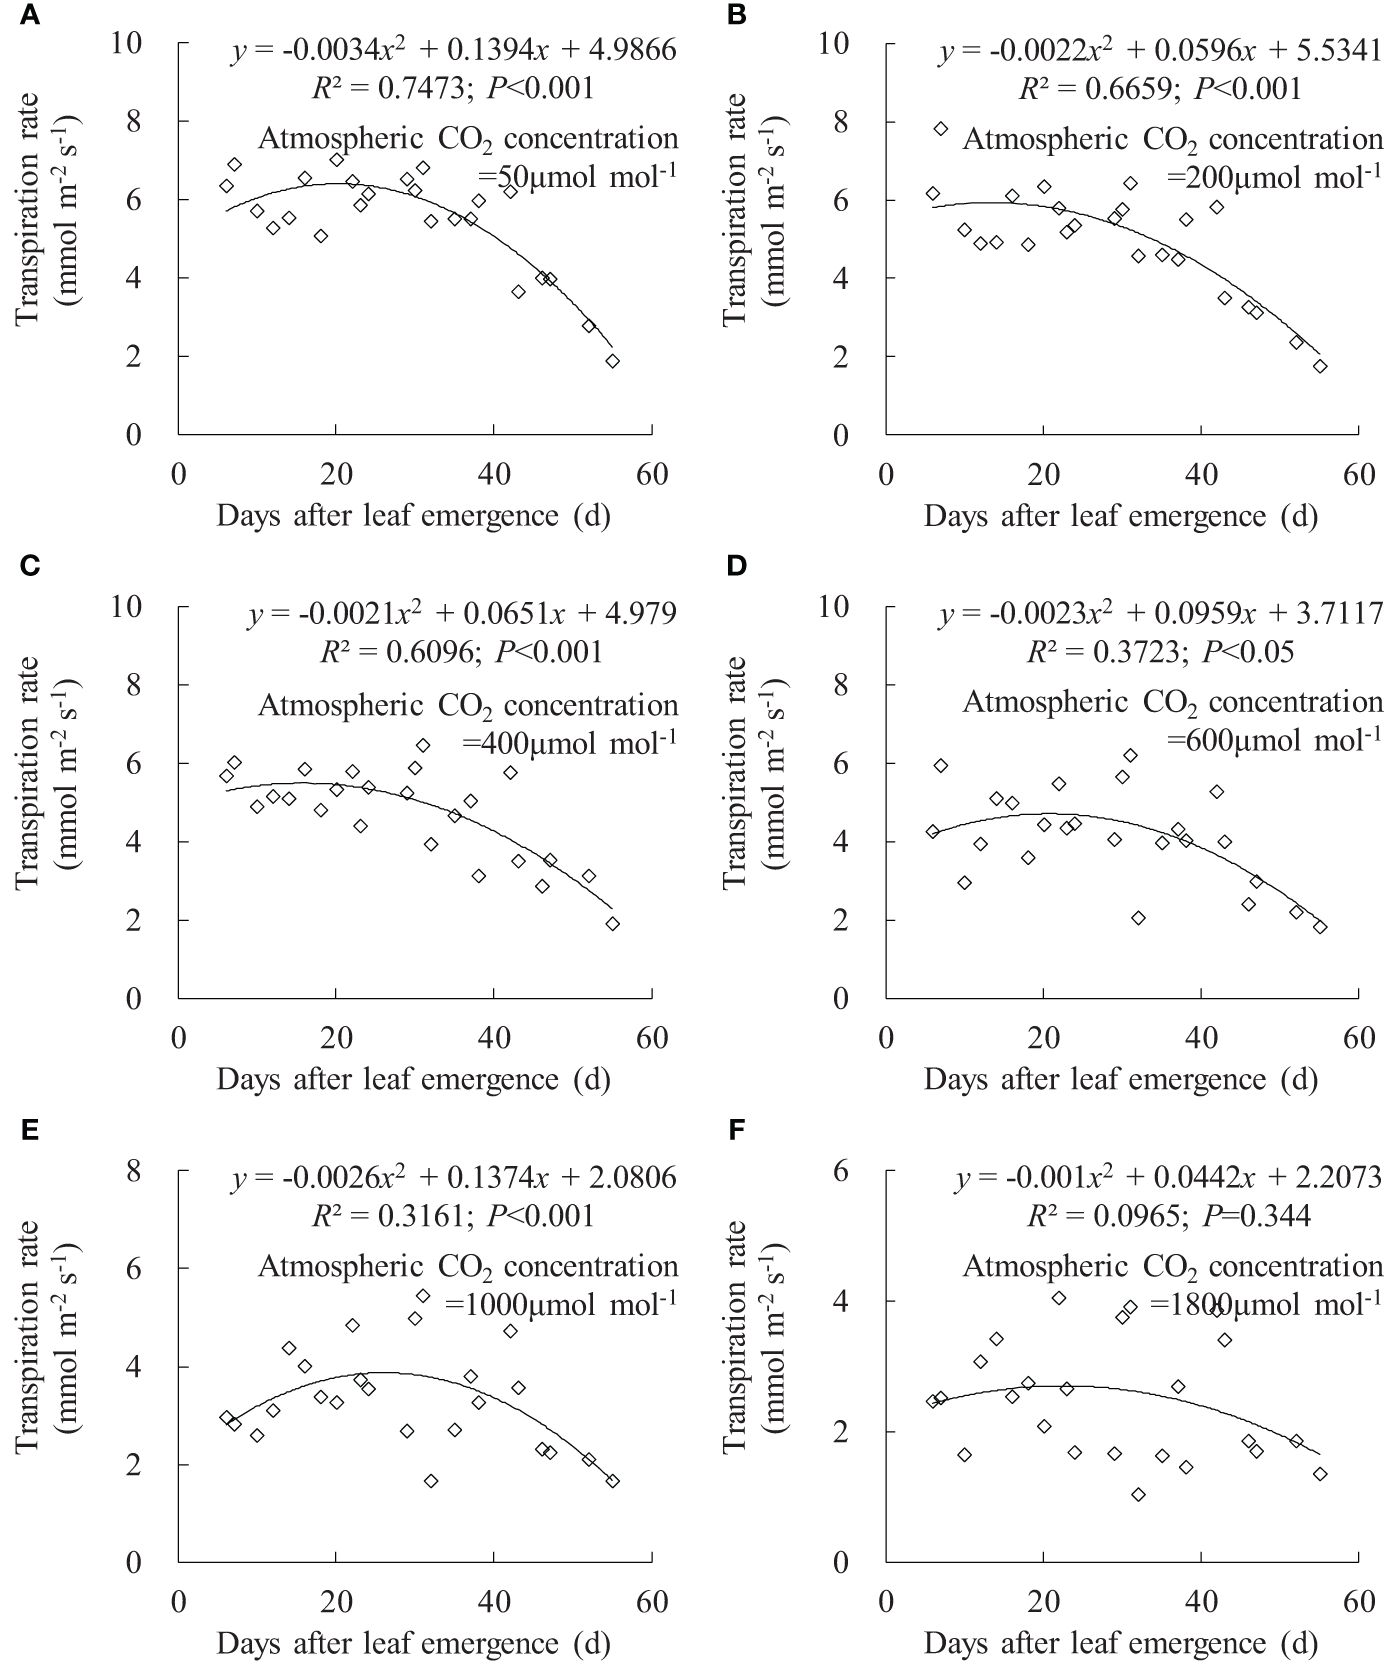
Figure 7 (A–F) Impact of days after leaf emergence on transpiration rate under different atmospheric CO2 concentration conditions.
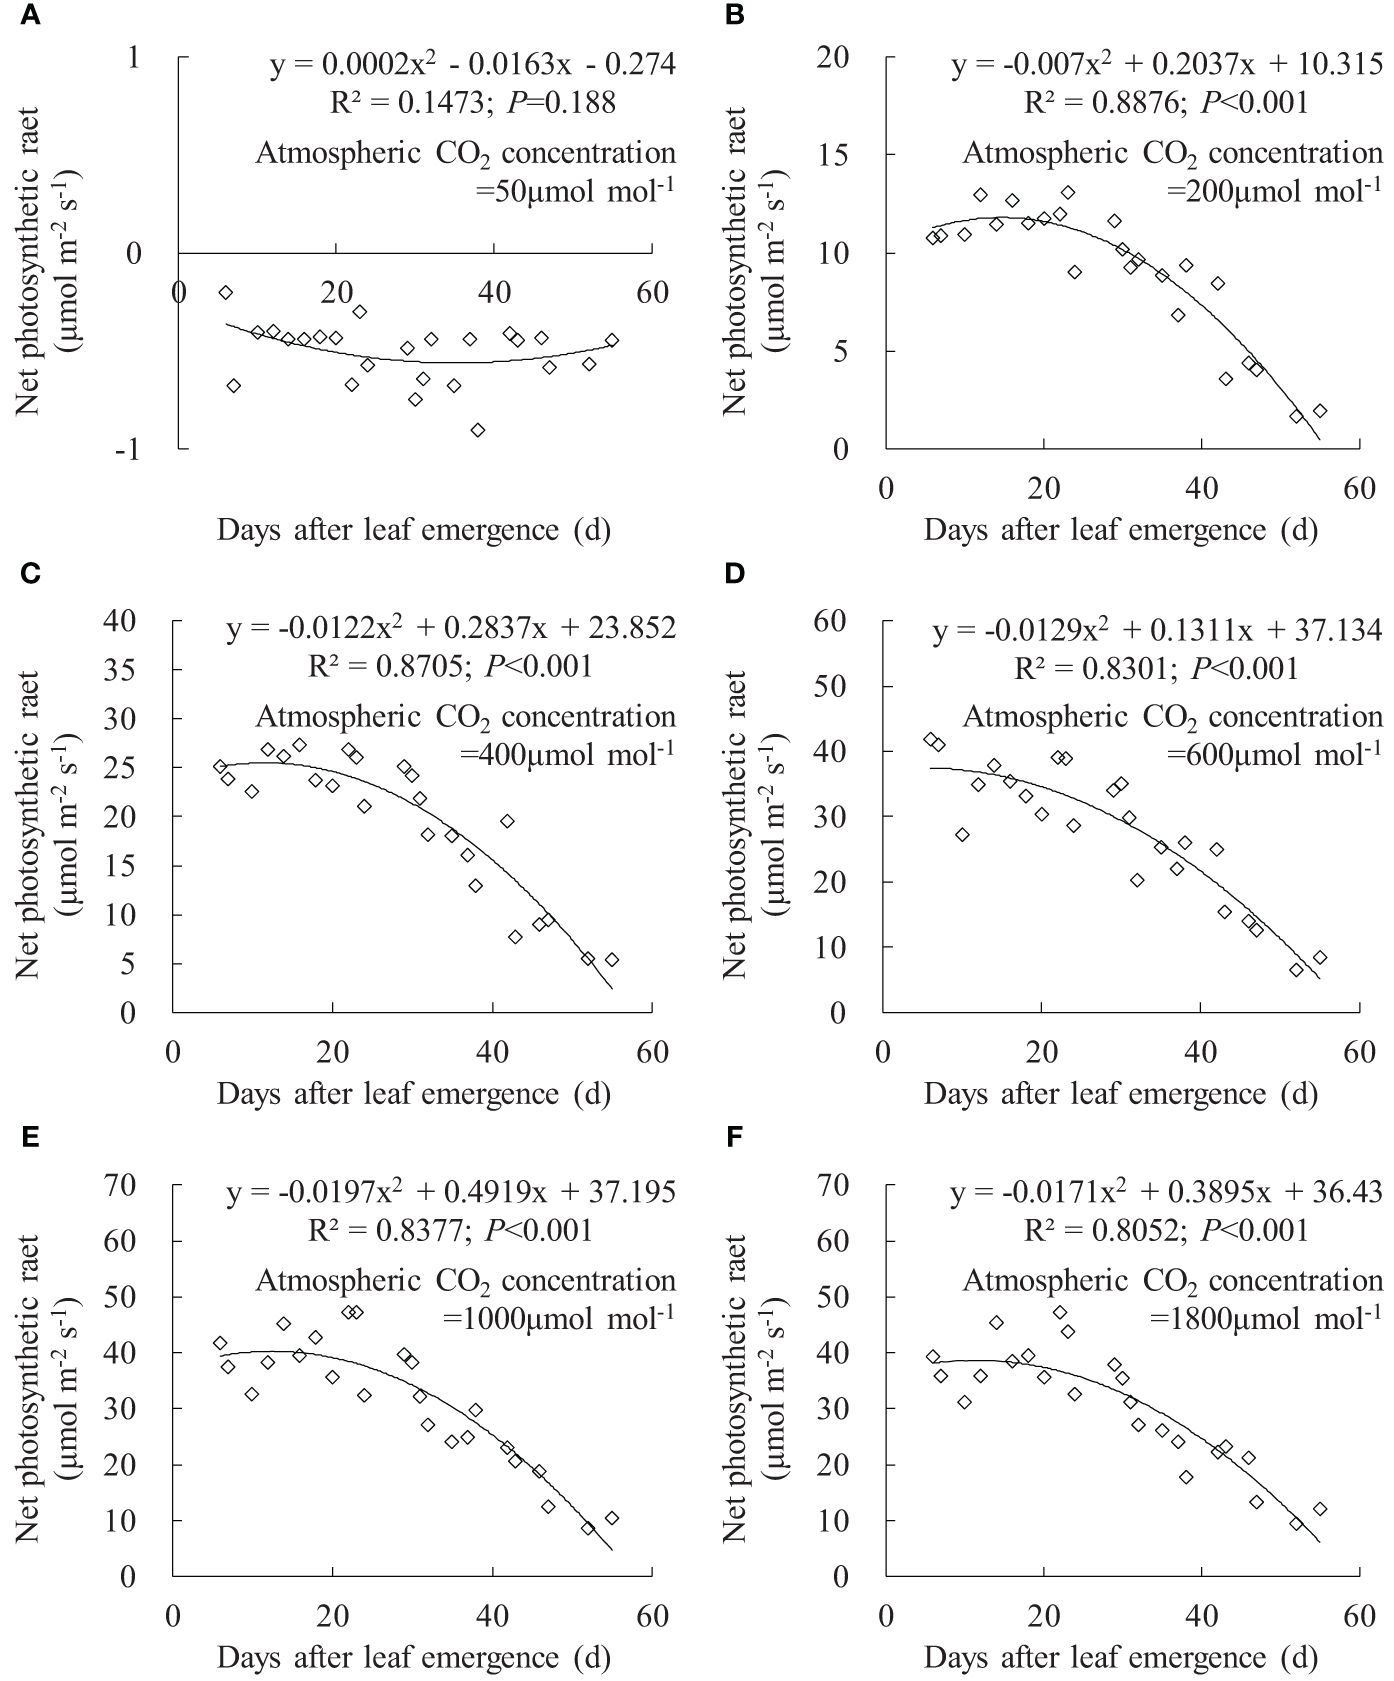
Figure 8 (A–F) Impact of days after leaf emergence on net photosynthetic rate under different atmospheric CO2 concentration conditions.
Leaf Tr exhibited a similar trend to leaf gsw (Figure 7). Under Ca of 50, 200, 400, and 600 μmol mol-1, leaf Tr for different DAE respectively ranged from 1.876 to 7.007, 1.743 to 7.810, 1.905 to 6.467, and 1.815 to 6.202 mmol m-2 s-1. Leaf Tr decreased with increasing Ca, and rice leaves at small DAE maintained a higher Tr at low Ca. As DAE increased, leaf Tr initially remained at higher values and then gradually decreased. At Ca of 1,000 and 1,800 μmol mol-1, the impact of DAE on Tr diminished, and high CO2 concentration inhibited stomatal aperture and transpiration.
The variation in leaf Pn with DAE under different Ca is depicted in Figure 8. At Ca of 50 μmol mol-1, the leaf Pn at different DAE consistently remained at approximately -0.5 μmol m-1 s-1. This is primarily attributed to the limitation of photosynthetic capacity by low CO2 concentrations, where leaf respiration exceeded photosynthesis, resulting in CO2 release. At Ca of 200, 400, 600, 1,000, and 1,800 μmol mol-1, leaf Pn respectively ranged from 1.690 to 13.114, 5.484 to 27.375, 6.694 to 41.858, 8.576 to 47.116, and 9.304 to 47.137. Leaf Pn rapidly increased with rising Ca, reaching its peak at approximately 1,000 μmol mol-1 Ca, with no considerable difference between 1,000 and 1,800 μmol mol-1 Ca. When Ca exceeded 200 μmol mol-1, leaf Pn remained relatively high at smaller DAE and gradually decreased with further increases in DAE. This indicated that vigorously growing leaves exhibited higher Pn, and leaf photosynthetic capacity decreased as leaves age, leading to a decline in carbon assimilation.
As PAR was enhanced, leaf gsw, Tr, and Pn initially exhibited a linear and rapid increase, followed by a gradual slowdown in the increase rate, eventually reaching a maximum value and then stabilizing or slightly decreasing thereafter (Figure 1). Similar trends have been observed in the flag leaves of winter wheat (Inoue et al., 2004; Carmo-Silva et al., 2017). Under no-light conditions (PAR = 0 μmol m-2 s-1), the leaves were unable to undergo photosynthesis, resulting in metabolic CO2 emission (with leaf Pn showing as a negative value). Leaves at smaller DAE released more CO2 due to their vigorous metabolic activity (Pantin et al., 2012). Under low-light conditions, limited atmospheric evaporative capacity and insufficient PAR for photosynthesis led to lower gsw, Tr, and Pn regardless of the variations in DAE. As PAR intensified, leaf stomatal opening widened, leading to an increase in gsw. Larger stomatal apertures allowed a greater influx of CO2 (providing an ample supply for leaf photosynthesis) and output of water vapor through the stomata; thus, leaf Pn and Tr increased. Simultaneously, the increased atmospheric evaporative capacity caused by enhanced PAR also resulted in higher Tr. Leaves with larger DAE reached the light saturation point earlier, and gsw, Tr, and Pn, under saturated light conditions, decreased with increasing DAE, suggesting that young leaves could maintain larger stomatal apertures for efficient transpiration and photosynthesis under high light intensity (high Tr and Pn). As the leaves aged, their adaptation to high light weakened, and leaves with larger DAE could not fully utilize high light intensity for photosynthesis.
Under a specific PAR condition, gsw, Tr, and Pn showed a consistent linear decrement with the increase in DAE (Figures 2–4). This finding was congruent with the decline in gsw and Pn with potato leaf senesced (Vos and Oyarzun, 1987). Echer and Rosolem (2015) also asserted that cotton leaf DAE had nominal impact on leaf Pn under low PAR, while Pn was notably higher in 15- and 30-day-old leaves compared to 45- and 60-day-old leaves when PAR exceeded a threshold, with both Tr and gsw reduced as the leaves aged and the light intensity waned. Hossain et al. (2007) and Jin et al. (2004) reported that rice gsw, Tr, and Pn, at particular PAR, decreased significantly with lowering leaf position, which was consistent with the current research, as newly emerged rice leaves appeared in the upper canopy, implicating a reduction in leaf DAE as leaf position decreased. Generally, rice leaf photosynthesis was highly related to leaf nitrogen level, efficiencies of radiant energy utilization, electron transport, and photophosphorylation, and these values decreased with leaf aging (or downward leaves) (Murchie et al., 2002; Suzuki et al., 2009; Okami et al., 2016; Yang et al., 2016), which also agreed with the decreased Pn. In contrast, Wang et al. (2009) reported that the measured light-saturated rice gsw, Tr, and Pn reached the maximum at the last second fully developed leaf and then declined gradually in downward leaves at nine-leaf age (an indicator representing the developmental progress of plants) stage (tillering stage correspondingly). Xu et al. (2019) also stated that light-saturated rice Pn peaked at around 10 days after leaf emergence and then decreased as leaves aged. The discrepancy with the current study might be attributed to low-frequency measurement for photosynthetic characteristics under smaller DAE, as the measurement was inconvenient due to the small leaf area before they were fully expanded. Additionally, the measurement in the current study began at DAE of 3 days, at which time the leaves had a large leaf area. Consequently, the study did not monitor the increase in leaf gsw, Tr, and Pn during the leaf expansion process.
As Ca increased, leaf gsw and Tr gradually decreased, while Pn increased linearly and rapidly, and the amplitude of variations in gsw, Tr, and Pn decelerated, eventually leading to a stabilization of minimal gsw and Tr and an elevation of Pn to its peak, subsequently maintaining stability or experiencing a slight decline (Figure 5). Yasutake et al. (2016) found that 1,000 μmol mol-1 Ca significantly increased sweet pepper Pn but decreased gsw and Tr compared with 400 Ca. Ahmed et al. (2022) reported that Pn increased and gsw and Tr decreased in the order of 500, 1,000, and 1,500 μmol mol-1 Ca. This was consistent with the decreased gsw and Tr and increased Pn with leaf aging observed in the current study. Inamoto et al. (2022) showed that the increase in Oriental Hybrid Lily Pn was greater in the low Ca range (380 to 1,000 μmol mol-1) and lower in the high Ca range (1,000 to 2,000 μmol mol-1), which agreed with the amplitude of variations in Pn.
Under specific Ca, the leaf gsw, Tr, and Pn remained at a relatively high level when DAE was less than approximately 25 days and then gradually decreased with the further increase in DAE (Figures 6, 7, 8). Chlorophyll activity, Rubisco activity, RuBP regeneration capacity, and nitrogen content (positively correlated with the photosynthetic potential of leaves) generally exhibited an increasing trend during the leaf expansion phase, followed by the maintenance of relatively high values, and then decreased as the leaves aged (Murchie et al., 2002; Suzuki et al., 2009; Gunasekera et al., 2013), which might be the primary reasons for the variation in gsw, Tr, and Pn. At lower Ca concentrations, leaves at a smaller DAE maintained higher gsw to facilitate atmospheric CO2 entering for transpiration and photosynthesis. Leaves at a greater DAE had weaker adaptability to external environments, maintaining lower levels of gsw, Tr, and Pn regardless of Ca level. When Ca exceeded a certain level, Ca exerted a suppressive effect on stomatal conductance to reduce transpiration, but the photosynthetic rate did not decrease.
This study investigated the dynamics of stomatal conductance gsw, transpiration rate Tr, and net photosynthetic rate Pn in rice leaves across varying light intensities and CO2 conditions during leaf development. The key conclusions drawn from the findings are as follows:
(1) Response to photosynthetically active radiation PAR: Increasing PAR led to an initial rapid and linear increase in gsw, Tr, and Pn, followed by a more gradual rise to maximum values, with subsequent stabilization or decline. Notably, old leaves reached their maximum gsw, Tr, and Pn earlier and at smaller magnitudes compared to young leaves. Additionally, a linear decreasing trend in gsw, Tr, and Pn with increasing DAE was observed, with the decrease rate slowing down with reduced PAR.
(2) Response to atmospheric CO2 concentrations Ca: With increasing Ca, gsw and Tr decreased gradually to a stable minimum value, while Pn exhibited a linear and slow increase up to a maximum before stabilizing or decreasing. Under specific Ca conditions, rice leaf gsw, Tr, and Pn initially remain at higher values and then gradually decrease with increasing DAE.
These conclusions provided crucial mechanistic insights to estimate dynamic evapotranspiration and net ecosystem productivity at both field-scale and larger scales in paddy field ecosystems by upscaling leaf-level physiological processes. This knowledge can inform more accurate predictions and management strategies to optimize agricultural practices and enhance the sustainability of rice cultivation amidst changing environmental conditions.
The datasets presented in this article are not readily available because the authors do not have permission to share data. Requests to access the datasets should be directed to YL, bHZ5dXBpbmdAeXp1LmVkdS5jbg==.
YL: Conceptualization, Funding acquisition, Writing – original draft. LG: Investigation, Writing – original draft. RM: Formal analysis, Validation, Writing – review & editing. XL: Writing – review & editing. JX: Writing – review & editing.
The author(s) declare financial support was received for the research, authorship, and/or publication of this article. This project was supported financially by the National Science Foundation of China (NO. 52309064).
The authors declare that the research was conducted in the absence of any commercial or financial relationships that could be construed as a potential conflict of interest.
All claims expressed in this article are solely those of the authors and do not necessarily represent those of their affiliated organizations, or those of the publisher, the editors and the reviewers. Any product that may be evaluated in this article, or claim that may be made by its manufacturer, is not guaranteed or endorsed by the publisher.
Ahmed, H. A., Tong, Y. X., Li, L., Sahari, S. Q., Almogahed, A. M., Cheng, R. F. (2022). Integrative effects of CO2 concentration, illumination intensity and air speed on the growth, gas exchange and light use efficiency of lettuce plants grown under artificial lighting. Horticulturae. 8, 270. doi: 10.3390/horticulturae8030270
Baroli, I., Price, G. D., Badger, M. R., von Caemmerer, S. (2008). The contribution of photosynthesis to the red light response of stomatal conductance. Plant Physiolology. 146, 737–737. doi: 10.1104/pp.107.110924
Bellasio, C. (2023). The slope of assimilation rate against stomatal conductance should not be used as a measure of water use efficiency or stomatal control over assimilation. Photosynthesis Res. 158, 195 199. doi: 10.1007/s11120-023-01054-6
Carmo-Silva, E., Andralojc, P. J., Scales, J. C., Driever, S. M., Mead, A., Lawson, T., et al. (2017). Phenotyping of field-grown wheat in the UK highlights contribution of light response of photosynthesis and flag leaf longevity to grain yield. J. Exp. Botany. 68, 3473–3486. doi: 10.1093/jxb/erx169
Chang, T. G., Zhao, H. L., Wang, N., Song, Q. F., Xiao, Y., Qu, M. N., et al. (2019). A three-dimensional canopy photosynthesis model in rice with a complete description of the canopy architecture, leaf physiology, and mechanical properties. J. Exp. Botany. 70, 2479–2490. doi: 10.1093/jxb/ery430
Chen, Z. Y., Peng, Z. S., Yang, J., Chen, W. Y., Ou-Yang, Z. M. (2011). A mathematical model for describing light-response curves in Nicotiana tabacum L. Photosynthetica 49, 467–471. doi: 10.1007/s11099-011-0056-5
Echer, F. R., Rosolem, C. A. (2015). Cotton leaf gas exchange responses to irradiance and leaf aging. Biol. Plantarum. 59, 366–372. doi: 10.1007/s10535-015-0484-3
Elfadl, M. A., Luukkanen, O. (2006). Field studies on the ecological strategies of Prosopis juliflora in a dryland ecosystem: 1. A leaf gas exchange approach. J. Arid Environments. 66, 1–15. doi: 10.1016/j.jaridenv.2005.09.006
Gunasekera, H., Costa, W. D., Nugawela, A. (2013). Canopy photosynthetic capacity and light response parameters of rubber hevea brasiliensis with reference to exploitation. Curr. Agric. Res. J. 1, 1–12. doi: 10.12944/CARJ
Guo, J. X., Hu, X. Y., Gao, L. M., Xie, K. L., Ling, N., Shen, Q. R., et al. (2017). The rice production practices of high yield and high nitrogen use efficiency in Jiangsu, China. Sci. Rep. 7, 2101. doi: 10.1038/s41598-017-02338-3
Hirooka, Y., Homma, K., Shiraiwa, T. (2018). Parameterization of the vertical distribution of leaf area index (LAI) in rice (Oryza sativa L.) using a plant canopy analyzer. Sci. Rep. 8, 6387. doi: 10.1038/s41598-018-24369-0
Hossain, S. T., Sugimoto, H., Yamashita, J. (2007). Effect of topdressing on individual leaf photosynthesis at different position in direct-sown rice with non-woven fabric mulch system. Photosynthetica. 45, 576–581. doi: 10.1007/s11099-007-0099-9
Inamoto, K., Nagasuga, K., Yano, T. (2022). Effect of CO2 enrichment on the photosynthesis and dry matter accumulation in the oriental hybrid lily 'Siberia'. Horticulture J. 91, 541–550. doi: 10.2503/hortj.UTD-372
Inoue, T., Inanaga, S., Sugimoto, Y., An, P., Eneji, A. E. (2004). Effect of drought on ear and flag leaf photosynthesis of two wheat cultivars differing in drought resistance. Photosynthetica 42, 559–565. doi: 10.1007/S11099-005-0013-2
Jin, S. H., Wang, P. M., Zhao, K., Yang, Y. Q., Yao, S., Jiang, D. A. (2004). Characteristic of gas exchange and chlorophyll fluorscence in different position leaves at booting stage in rice plants. Rice Science. 11, 283–289.
Kabir, M. Y., Nambeesan, S. U., Díaz-Pérez, J. C. (2023). Carbon dioxide and light curves and leaf gas exchange responses to shade levels in bell pepper (Capsicum annuum L.). Plant Sci. 326, 111532. doi: 10.1016/j.plantsci.2022.111532
Katul, G. G. (2023). Agrivoltaics in color: going from light spectra to biomass. Earth’s Future. 11, e2023EF003512. doi: 10.1029/2023EF003512
Kirschbaum, M. U. F., McMillan, A. M. S. (2018). Warming and elevated CO2 have opposing influences on transpiration. Which is more important? Curr. Forestry Rep. 4, 51–71. doi: 10.1007/s40725-018-0073-8
Kitajima, K., Mulkey, S. S., Samaniego, M., Wright, S. J. (2002). Decline of photosynthetic capacity with leaf age and position in two tropical pioneer tree species. Am. J. Botany. 89, 1925–1932. doi: 10.3732/ajb.89.12.1925
Konieczna, W., Warchol, M., Mierek-Adamska, A., Skrzypek, E., Waligórski, P., Piernik, A., et al. (2023). Changes in physio-biochemical parameters and expression of metallothioneins in Avena sativa L. @ in response to drought. Sci. Rep. 13, 2486. doi: 10.1038/s41598-023-29394-2
Lawson, T., Vialet-Chabrand, S. (2019). Speedy stomata, photosynthesis and plant water use efficiency. New Phytologist. 221, 93–98. doi: 10.1111/nph.15330
Legner, N., Fleck, S., Leuschner, C. (2014). Within-canopy variation in photosynthetic capacity, SLA and foliar N in temperate broad-leaved trees with contrasting shade tolerance. Trees-Structure Funct. 28, 263–280. doi: 10.1007/s00468-013-0947-0
Li, F., Gao, X. D., Li, C. J., He, H. H., Siddique, K. H. M., Zhao, X. N. (2023). Elevated CO2 concentration regulate the stomatal traits of oilseed rape to alleviate the impact of water deficit on physiological properties. Environ. Exp. Botany. 211, 105355. doi: 10.1016/j.envexpbot.2023.105355
Li, J. P., Vatsa, P., Ma, W. L. (2023). Can mechanized pesticide application help reduce pesticide use and increase crop yield? Evidence from rice farmers in Jiangsu province, China. Int. J. Agric. Sustainability. 21, 2227809. doi: 10.1080/14735903.2023.2227809
Liu, Q., Dong, L. H., Li, F. R. (2019). Modification of a photosynthetic light-response (PLR) model for modeling the vertical gradient in the response of crown PLR curves. Can. J. For. Res. 49, 949–959. doi: 10.1139/cjfr-2018-0438
Locke, A. M., Ort, D. R. (2014). Leaf hydraulic conductance declines in coordination with photosynthesis, transpiration and leaf water status as soybean leaves age regardless of soil moisture. J. Exp. Botany. 65, 6617–6627. doi: 10.1093/jxb/eru380
Lv, Y. P., Gu, L. H., Liu, X. Y., Xu, J. Z. (2024). A coupled hourly water-carbon flux model at plot and field scales for water-saving irrigated rice paddy. Agric. Water Management. 293, 108706. doi: 10.1016/j.agwat.2024.108706
Marín, D., Martín, M., Serrot, P. H., Sabater, B. (2014). Thermodynamic balance of photosynthesis and transpiration at increasing CO2 concentrations and rapid light fluctuations. Biosystems. 116, 21–26. doi: 10.1016/j.biosystems.2013.12.003
Murchie, E. H., Hubbart, S., Chen, Y. Z., Peng, S. B., Horton, P. (2002). Acclimation of rice photosynthesis to irradiance under field conditions. Plant Physiol. 130, 1999–2010. doi: 10.1104/pp.011098
Okami, M., Kato, Y., Yamagishi, J. (2016). Canopy Architecture and Leaf Nitrogen Distribution of Rice (Oryza sativa L.) under Chronic Soil Water Deficit. J. Agron. Crop Sci. 202, 464–471. doi: 10.1111/jac.12179
Pantin, F., Simonneau, T., Muller, B. (2012). Coming of leaf age: control of growth by hydraulics and metabolics during leaf ontogeny. New Phytologist. 196, 349–366. doi: 10.1111/j.1469-8137.2012.04273.x
Scoffoni, C., Chatelet, D. S., Pasquet-kok, J., Rawls, M., Donoghue, M. J., Edwards, E. J., et al. (2016). Hydraulic basis for the evolution of photosynthetic productivity. Nat. Plants. 2, 16072. doi: 10.1038/nplants.2016.72
Shi, Z., Chang, T. G., Chen, G. Y., Song, Q. F., Wang, Y. J., Zhou, Z. W., et al. (2019). Dissection of mechanisms for high yield in two elite rice cultivars. Field Crops Res. 241, 107563. doi: 10.1016/j.fcr.2019.107563
Song, Q. F., Zhang, G. L., Zhu, X. G. (2013). Optimal crop canopy architecture to maximize canopy photosynthetic CO2 uptake under elevated CO2 – a theoretical study using a mechanistic model of canopy photosynthesis. Funct. Plant Biol. 40, 109–124. doi: 10.1071/FP12056
Suzuki, Y., Miyamoto, T., Yoshizawa, R., Mae, T., Makino, A. (2009). Rubisco content and photosynthesis of leaves at different positions in transgenic rice with an overexpression of RBCS. Plant Cell Environ. 32, 417–427. doi: 10.1111/j.1365-3040.2009.01937.x
Van der Zande, D., Mereu, S., Nadezhdina, N., Cermak, J., Muys, B., Coppin, P., et al. (2009). 3D upscaling of transpiration from leaf to tree using ground-based LiDAR: Application on a Mediterranean Holm oak (Quercus ilex L. ) tree. Agric. Water Manage. 149, 1573–1583. doi: 10.1016/j.agrformet.2009.04.010
Vos, J., Oyarzun, P. J. (1987). Photosynthesis and stomatal conductance of potato leaves- effects of leaf age, irradiance, and leaf water potential. Photosynthesis Res. 11, 253–264. doi: 10.1007/BF00055065
Wang, D., Lu, Q., Li, X. F., Jiang, Q. S., Wu, J. X., Jiang, D. A. (2009). Relationship between Rubisco activase isoform levels and photosynthetic rate in different leaf positions of rice plant. Photosynthetica. 47, 621–629. doi: 10.1007/s11099-009-0089-1
Watanabe, T., Hanan, J. S., Room, P. M., Hasegawa, T., Nakagawa, H., Takahashi, W. (2005). Rice morphogenesis and plant architecture: measurement, specification and the reconstruction of structural development by 3D architectural modelling. Ann. Botany. 95, 1131–1143. doi: 10.1093/aob/mci136
Wu, C. Y., Chen, D. S., Xia, G. W., Sun, X. M., Zhang, S. G. (2023). Response characteristics of photosynthetic productivity to the canopy spatial distribution pattern of larix kaempferi. Forests. 14, 1171. doi: 10.3390/f14061171
Xie, S. X., Luo, X. S. (2003). Effect of leaf position and age on anatomical structure, photosynthesis, stomatal conductance and transpiration of Asian pear. Botanical Bull. Academia Sinica. 44, 297–303.
Xu, J. Z., Lv, Y. P., Liu, X. Y., Wei, Q., Qi, Z. M., Yang, S. H., et al. (2019). A general non-rectangular hyperbola equation for photosynthetic light response curve of rice at various leaf ages. Sci. Rep. 9, 9909. doi: 10.1038/s41598-019-46248-y
Xu, J. Z., Wang, Y. H., Yang, S. H., Peng, S. Z., Kong, W. L. (2015). Improved perfermance of photosynthetic light response equations with unified parameters for rice leaves with SPAD Values. Pakistan J. Botany. 47, 877–882.
Yang, J., Gong, W., Shi, S., Du, L., Sun, J., Song, S. L. (2016). Estimation of nitrogen content based on fluorescence spectrum and principal component analysis in paddy rice. Plant Cell Environment. 62, 178–183. doi: 10.17221/802/2015-PSE
Yasutake, D., Miyauchi, K., Mori, M., Kitano, M., Ino, A., Takahashi, A. (2016). Multiple effects of CO2 concentration and humidity on leaf gas exchanges of sweet pepper in the morning and afternoon. Environ. Control Biol. 54, 177–181. doi: 10.2525/ecb.54.177
Yi, Y., Yano, Yano, K. (2023). Nocturnal versus diurnal transpiration in rice plants: Analysis of five genotypes grown under different atmospheric CO2 and soil moisture conditions. Agric. Water Management. 286, 108397. doi: 10.1016/j.agwat.2023.108397
You, L. Z., Spoor, M., Ulimwengu, J., Zhang, S. M. (2011). Land use change and environmental stress of wheat, rice and corn production in China. China Economic Review. 22, 461–473. doi: 10.1016/j.chieco.2010.12.001
Keywords: photosynthetic rate, transpiration rate, stomatal conductance, light response, CO2 response, leaf with different appearance days
Citation: Lv Y, Gu L, Man R, Liu X and Xu J (2024) Response of stomatal conductance, transpiration, and photosynthesis to light and CO2 for rice leaves with different appearance days. Front. Plant Sci. 15:1397948. doi: 10.3389/fpls.2024.1397948
Received: 08 March 2024; Accepted: 08 July 2024;
Published: 01 August 2024.
Edited by:
Meijian Yang, Cornell University, United StatesCopyright © 2024 Lv, Gu, Man, Liu and Xu. This is an open-access article distributed under the terms of the Creative Commons Attribution License (CC BY). The use, distribution or reproduction in other forums is permitted, provided the original author(s) and the copyright owner(s) are credited and that the original publication in this journal is cited, in accordance with accepted academic practice. No use, distribution or reproduction is permitted which does not comply with these terms.
*Correspondence: Yuping Lv, bHZ5dXBpbmdAeXp1LmVkdS5jbg==
†ORCID: Yuping Lv, orcid.org/0000-0003-4936-633X
Disclaimer: All claims expressed in this article are solely those of the authors and do not necessarily represent those of their affiliated organizations, or those of the publisher, the editors and the reviewers. Any product that may be evaluated in this article or claim that may be made by its manufacturer is not guaranteed or endorsed by the publisher.
Research integrity at Frontiers
Learn more about the work of our research integrity team to safeguard the quality of each article we publish.