
94% of researchers rate our articles as excellent or good
Learn more about the work of our research integrity team to safeguard the quality of each article we publish.
Find out more
ORIGINAL RESEARCH article
Front. Plant Sci. , 30 July 2024
Sec. Technical Advances in Plant Science
Volume 15 - 2024 | https://doi.org/10.3389/fpls.2024.1393965
 Florian Larue1,2
 Lauriane Rouan1,2
 David Pot1,2Jean-François Rami1,2
 Delphine Luquet1,2
 Grégory Beurier1,2*
Introduction: Predicting the performance (yield or other integrative traits) of cultivated plants is complex because it involves not only estimating the genetic value of the candidates to selection, the interactions between the genotype and the environment (GxE) but also the epistatic interactions between genomic regions for a given trait, and the interactions between the traits contributing to the integrative trait. Classical Genomic Prediction (GP) models mostly account for additive effects and are not suitable to estimate non-additive effects such as epistasis. Therefore, the use of machine learning and deep learning methods has been previously proposed to model those non-linear effects.
Methods: In this study, we propose a type of Artificial Neural Network (ANN) called Convolutional Neural Network (CNN) and compare it to two classical GP regression methods for their ability to predict an integrative trait of sorghum: aboveground fresh weight accumulation. We also suggest that the use of a crop growth model (CGM) can enhance predictions of integrative traits by decomposing them into more heritable intermediate traits.
Results: The results show that CNN outperformed both LASSO and Bayes C methods in accuracy, suggesting that CNN are better suited to predict integrative traits. Furthermore, the predictive ability of the combined CGM-GP approach surpassed that of GP without the CGM integration, irrespective of the regression method used.
Discussion: These results are consistent with recent works aiming to develop Genome-to-Phenotype models and advocate for the use of non-linear prediction methods, and the use of combined CGM-GP to enhance the prediction of crop performances.
The need to develop plant varieties adapted to evolving production scenarios, especially in the face of climate change, necessitates crops to fulfill increasingly complex and diverse requirements, posing a great challenge for breeders. In this context, the pursuit of traits combinations that confer desired crop properties and adaptation is more critical than ever, giving rise to the necessity to enhance multi-criteria or multi-trait breeding (Moeinizade et al., 2020).
Leveraging the complete set of nucleotide diversity distributed across the genome, for predicting breeding values of quantitative traits (Genomic Prediction, GP, Meuwissen et al., 2001) has already demonstrated its effectiveness in breeding programs. This approach has proven instrumental to increase rates of genetic gains and mitigating costs (Hickey et al., 2017). Nevertheless, the growing need to breed for multiple environments (ME), e.g. in response to climate change and better-defined target populations of environments (Chapman et al., 2000), necessitates the adaptation of genomic prediction methodologies to account for the emergence of interactions between genotypes and environments (GxE) (Rincent et al., 2017).
Previous studies tried to tackle GxE within Genomic Selection (GS). For instance, Burgueño et al. (2012) developed multi-environments statistical models. However, these models only consider linear and non-causal environmental effects reducing possible gains in prediction accuracy, especially for complex integrative traits or for environments that significantly differ from those in the calibration set (Rogers and Holland, 2022). Heslot et al. (2014) on the other hand used a Crop Growth Model (CGM) to derive environmental covariates. The incorporation of environmental covariates within the GS framework increased prediction accuracies and decreased prediction variability in unobserved environments compared to standard GS models. Integrating crop models to address GxE, as shown in studies such as those by Heslot et al. (2014), emphasizes the utility of this approach in the described breeding context. Nonetheless, considering a large number of covariates significantly increases the complexity of the problem, rendering it exceedingly challenging to model (Larkin et al., 2019).
Furthermore, given that the target production traits commonly predicted through GP models are typically polygenic (Song and Zhang, 2009) and thus the presence of potential GxE interactions, the decomposition of these traits into elementary traits, as facilitated by CGM (Bustos-Korts et al., 2019), can offer a valuable advantage. The exploration of multi-trait (MT) genomic prediction strategies has been proposed to enhance the predictive accuracy of integrative traits (e.g., Arojju et al., 2020; Gaire et al., 2022; Shahi et al., 2022). Studies have demonstrated that incorporating correlated physiological traits in the training (and/or validation) sets can improve predictive abilities compared to single-trait (ST) genomic prediction approaches. Crop growth models inherently simulate integrative traits based on other secondary traits, their integration into the genomic prediction framework could thus provide an additional dimension to consider. CGM simulate plant non-linear (causal) responses to the environment through model parameters (representing genotypic sensibility to these responses, GxE). They also have the advantage of being able to simulate multiple traits dynamically. Calibrated CGM for a genotype can thus be helpful to predict its performance in unknown environments (e.g.: Larue et al., 2019), but they cannot predict unknown genotypes.
Combining GP with CGM (integrated CGM-GP prediction) could meet the shortcomings of standard GP models and CGM by enabling the prediction of multiple traits, in multiple environments, for unknown genotypes and unknown environments (Technow et al., 2015; Cooper et al., 2016; Onogi, 2022). However, these studies focus on a small number of parameters, physiological processes, and markers, which contrasts with the need to consider increasingly complex multi-traits phenotypes, and the availability of high-throughput genotyping resulting in a large number of markers.
Another drawback of classical GP models is their linear nature. Integrative traits are generally under the impact of multiple genes, rather than relying solely on small numbers of genetic variations. This is commonly referred to as the “missing heritability problem”. If the effects are additive, then “classical” GP models should be able to capture them. However, if there are non-linear interactions between markers (such as epistasis, Zuk et al., 2012), linear models will fail to predict these integrative traits. Addressing these challenges, non-linear regression methods, such as Deep Learning (Pérez-Enciso and Zingaretti, 2019), coupled with the utilization of Graphical Unit Processing (GPU) computing (Carré et al., 2022), present a promising avenue. This contrasts with conventional linear regression methods (e.g., Montesinos-López et al., 2018), offering in addition the potential to substantially reduce the computational time required for evaluating epistasis.
In CGM, however, integrative traits are simulated by interlinking secondary traits under the influence of multiple genotypic input parameters through non-linear equations. When coupled with genetic information through GP, this approach holds the potential to address the missing heritability problem by simulating integrative traits through non-linear equations that consider the combined effects of all genes.
In this paper, we propose a comparison between three genomic prediction approaches to study the extent to which non-linear regression methods and crop growth models can contribute to enhance the prediction of integrative traits. Using linear (LASSO, Bayes C), or non-linear (Convolutional Neural Networks) regression models, a plant complex integrative phenotypic trait (aboveground fresh weight accumulation) is predicted either directly or with an integrated CGM-GP approach.
The phenotypic data used in this study are composed of 136 sorghum accessions selected within the Generation Challenge reference set (Billot et al., 2013). Phenotyping was conducted on the PhenoArch high-throughput phenotyping platform in Montpellier, France (Cabrera Bosquet et al., 2015) where all genotypes were followed for 45 days from September to October 2017. The Phenoarch platform is based on a PhenoWare™ system (Lyon, France) composed of a conveyor belt structure of 28 lanes carrying 60 carts of one pot. Plants were grown in polyvinyl chloride (PVC) 9L pots (0.19m diameter and 0.4m high) filled with a 30:70 mixture of a clay and organic compost. Line spacing was of 0.4m and row spacing was of 0.2m. Five grains per pot were sown on August 30th, which were subsequently thinned to a single plant two weeks after sowing. Two water treatment scenarios were tested during the late vegetative phase (starting from eight fully expanded leaves): well-watered (WW) plants were kept at 132% of soil humidity (Fraction of Transpirable Soil Water, FTSW of 0.6) and water-deficit (WD) plants were dried-down until 60% of soil humidity (± 5%, FTSW of 0.22).
Within each treatment, genotypes were replicated four times and local interactions were reduced by separating the genotypes into seven classes depending on plant height. To control the environmental heterogeneity of the greenhouse, the 28 rows were separated into four complete blocks defined according to the environmental gradient of the greenhouse (light and temperature, Cabrera-Bosquet et al., 2016). Each block was further divided into seven sub-blocks wherein plant height classes were randomly assigned following a Youden square (28 genotypes per sub-block). A d-optimal design generation software (SAS procedure OPTEX) was used to assign the genotypes to the sub blocks following an alpha-lattice.
All along the experiment, day temperature was kept at 30°C and night temperatures at 23°C. Environmental variables, air temperature (°C), radiation (PFFD, µmol m-2 s-1) and air relative humidity (%) were continuously monitored at eight positions in the greenhouse, above the canopy and recorded every fifteen minutes.
Thirteen pictures (twelve sides and one top) were taken daily of each plant. Seven genotypes (one for each plant height class, at three different growth stages) were used in a side experiment to calibrate a model used to estimate the following traits on all plants: aboveground fresh weight (Biomaerofw), plant leaf area (PLA), and plant height (PHT). Weekly measurements by hand of additional traits were conducted to assess: the number of appeared (App) and ligulated (Lig) leaves on the main stem and the number of tillers (Tillernb). After 45 days, plants were harvested and final measurements were conducted: shoot (Biomaerofw), mainstem (Mainstemfw) and mainstem blade (Bladefw) biomass fresh weight, base mainstem diameter (Stemdiam), and last ligulated leaf length and width (used to compute area of last ligulated leaf, Arealfel). Table 1 summarizes all measured traits.
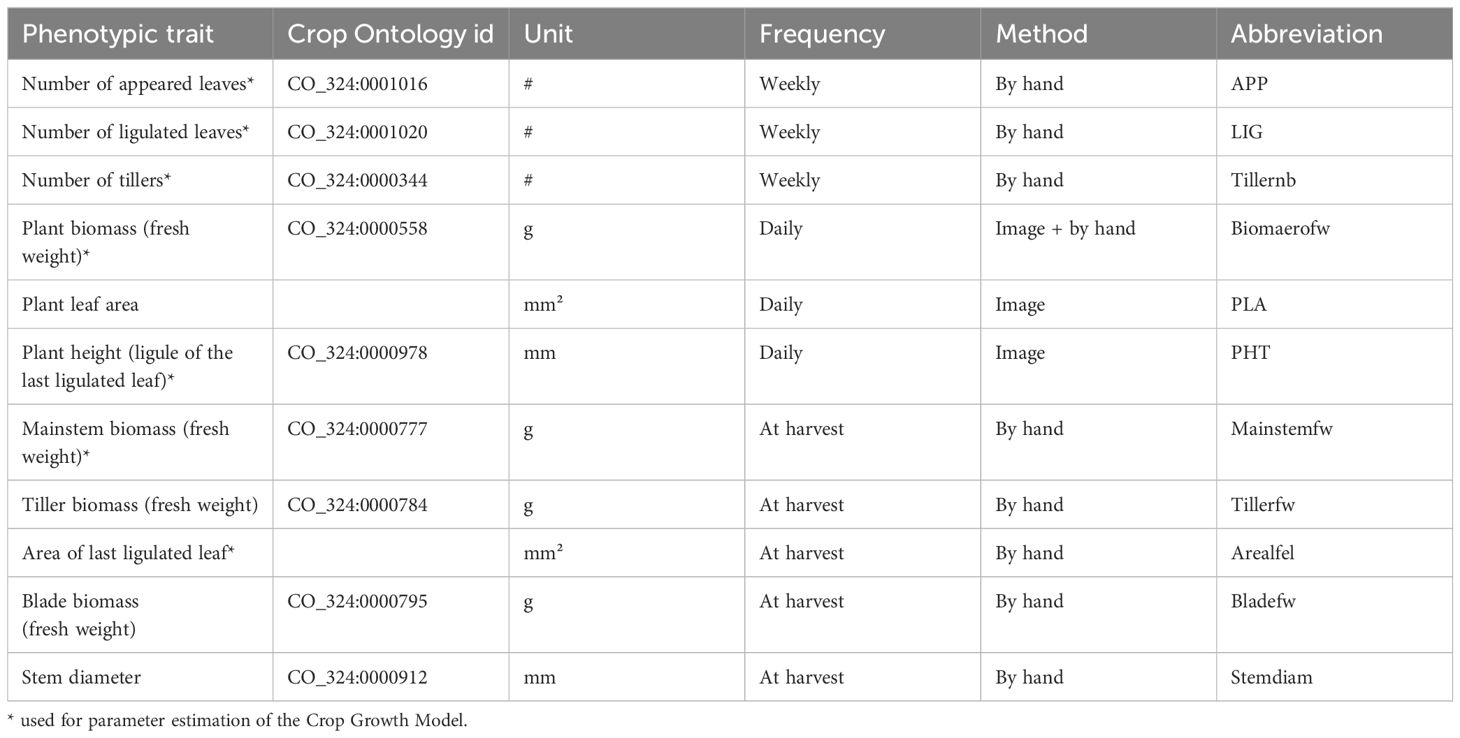
Table 1 Phenotypic traits measured on the Phenoarch high-throughput phenotyping platform (see https://cropontology.org).
The integrative trait considered for genomic prediction in this study is a Best Linear Unbiased Predictor (BLUP) of above-ground biomass, estimated by a mixed model (Equation 1, modeled using the R package Asreml v3, Butler et al., 2009) and considering all 8 plant replicates (4 replicates per water treatment, two water treatments).
With the fixed effect of the replicate, the fixed competition effect of any neighbor, n the number of neighbors, the random effect of any row j (except the first and second row), and the fixed effect of the first and second row. and the indicators of the first and second rows: their value is 1 if the pot belongs to the first (respectively second) row, and 0 otherwise. Gv the random genotypic effect of variety v, wt the fixed effect of the watering treatment t and (Gw)vt their interaction. Hik the between sub-blocks error, i.e. random effect of the sub-block of the ith replicate to which the kth height class was assigned. Eivt the residual error for variety v in replicate i of treatment t.
This mixed model was the result of a more complete analysis of the data and assumes that it partially compensates for the heterogeneity of the greenhouse by modelling it as row and column effects. The mixed model was selected after exploring several types of variance decomposition. For the estimation of genotypic parameters of the crop model, raw data from the four WW replicate plants were used alongside local weather data (see Cabrera-Bosquet et al., 2016), as environmental effects are formalized inside the crop model (see Ecomeristem Model).
Genotypic information of the 136 accessions was obtained through Genotyping by Sequencing (GBS). Sequencing libraries were prepared according to the GBS protocol as per Elshire et al. (2011), with the ApeK1 enzyme. Single-end sequencing was performed on an Illumina HiSeq2000 (at the Genotool platform in Toulouse, France). SNP calling was performed using the GATK pipeline. After the SNP calling step, imputation was then realized using Beagle v.4 (Browning and Browning, 2013) with a 1000-SNP window and an overlap of 500 SNP after filtering on missing data per SNP (60% maximum of missing data and 5% maximum for minor allele frequency to keep a SNP). The imputed genotype matrix available for further analysis contained 31 713 SNP on the whole set of 136 accessions.
Ecomeristem is a sink-driven CGM developed for rice vegetative vigor (Luquet et al., 2006 and Luquet et al., 2007) and adapted for sorghum whole crop cycle (Larue et al., 2019). The model is implemented in C++ and is simulated following the DEVS formalism (Zeigler, 1987). The model simulates plant growth and development at organ level driven by several genotypic parameters. The model is hierarchical: it defines the organs in atomic models and their temporal interaction in coupled models.
In this study, the focus was put on sorghum biomass growth (fresh weight) during the vegetative phase. The vegetative phase plays a crucial role in determining biomass and grain yield. Mainly, during this phase sorghum plants focus on leaf area expansion which increases the plant’s ability to capture light, essential for photosynthesis, and thus contributing to biomass production and later on grain filling. Ecomeristem simulates aboveground biomass as the integration of different elementary traits: number, size and weight of the organs of each axis of the plant. The organ number is defined by an initiation rate “plastochrone, plasto_init” depending on the temperature (thermal time between the initiation of two successive phytomers). The “phyllochrone, phyllo_init” defines the time from the first growth phase of a leaf until it appears beyond the sheath of the previous leaf (thermal time between the appearances of two successive leaves). Finally, the “ligulochrone, ligulo_init” defines the time from its appearance until its ligulation (thermal time between the ligulation of two successive leaves). The size of the leaves is defined by the parameter “Meristem Growth Rate, MGR_init” which makes it possible to calculate the pre-dimensioning of the leaves under the influence of radiation (through a state variable defining the balance between supply and demand in Carbon (C), “Index of internal Competition, IC”). The growth of an organ is therefore defined by the final size to be reached divided by the thermal time needed for each phase (see above). Organ and whole plant growth can be slowed down if the daily supply of carbohydrates (defined by the parameter “Epsib” which converts the radiation into C) is no longer sufficient to meet the needs on the scale of the plant. The thickness of the leaves is defined by the “SLAp” parameter, which decreases the specific leaf area between successive leaves. The weight of the leaves is then defined by the leaf area divided by the specific leaf area. The “Leaf_length_to_IN_length” parameter defines the internodes’ pre-sizing compared to the corresponding leaf’s pre-sizing. The growth of the internodes then occurs as for the leaves: a final size to be reached in a defined (thermal) time, defined as being equal to 3 times the “ligulochrone”, and can be slowed down if the supply of C is not sufficient to meet the demands. Each internode’s volume and density then define the weight of the internodes. Finally, these different processes take place daily on each axis (i.e. main stem + tillers) of the plant. Tillers appear at each “plastochrone + phyllochrone” if the state of the plant (supply/demand balance in C) is favorable during the “phyllochrone” phase, that is to say if the IC is greater than the parameter threshold “ICt.” All of these processes therefore make it possible to integrate biomass growth during the vegetative phase at the scale of the whole plant. Table 2 summarizes these parameters and the selected ranges of values for parameter estimation. A genotype is thus characterized by its set of genotypic parameters.
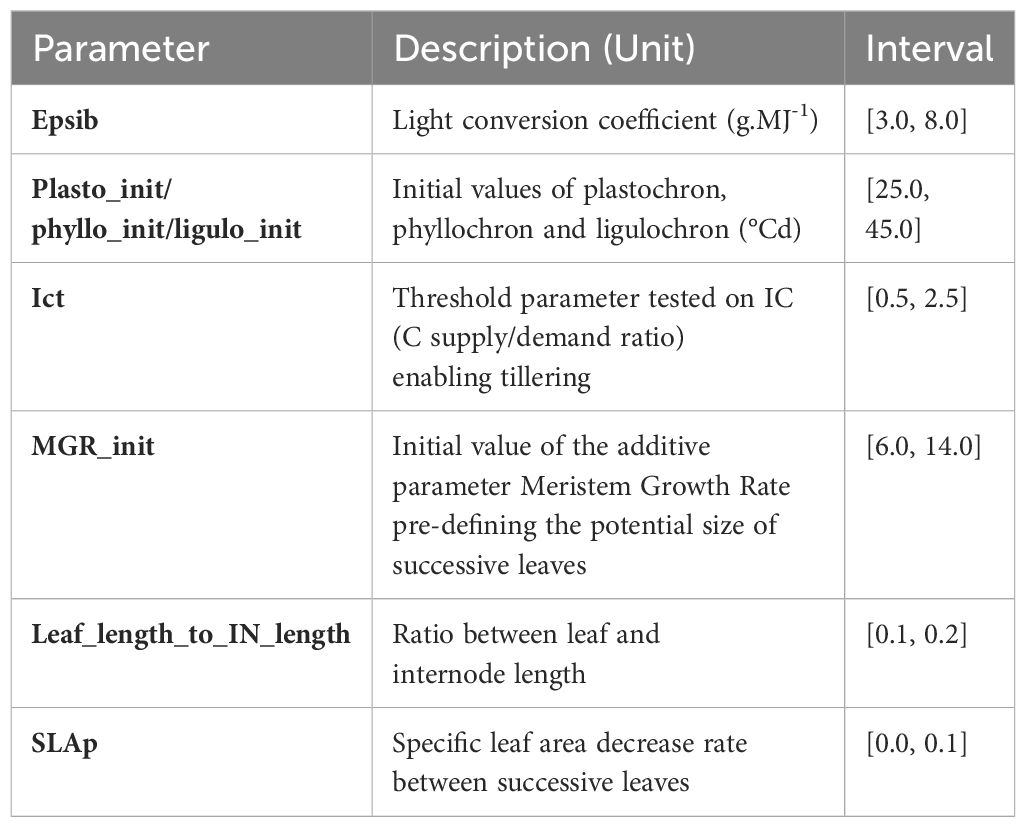
Table 2 Key genotypic parameters and the value ranges used for parameter estimation.
Parameter estimation for each genotype, was performed using the Differential Evolution (DE) metaheuristic implemented in the DEoptim R package (Ardia et al., 2020). Eight key genotypic parameters were estimated (see Table 2) for each genotype using the data gathered on the PhenoArch platform by reducing the errors between observed and simulated values for all measured traits (see Table 1). The error was computed as the mean of Normalized Root Mean Square Error (NRMSE, eq. 2) over the four replicates.
Where are the predicted values, the observed values and n the number of observations.
The parameter set resulting in the lowest error after 10 000 iterations of the DEoptim algorithm was then selected for each genotype, these parameter values are hereafter considered as “observed” parameter values. To facilitate the interpretation of the results, the error per observed trait is represented by a Normalized Mean Absolute Error (NMAE) in Supplementary Table S1.
Genomic prediction was performed either by using the Least Absolute Shrinkage and Selection Operator (LASSO) implemented in the glmnet R package (Friedman et al., 2010), Bayes C implemented in the BGLR R package (Perez and de los Campos, 2014) or by a multilayer Convolutional Neural Networks (CNN) constructed with Tensorflow 2.0 (Singh and Manure, 2020) in Python (Van Rossum and Drake, 2009). For each method, validation was performed using a k-fold cross-validation method (with k = 5). The composition of each fold was equal across methods.
Two scenarios were investigated in this study. In the first instance, the direct prediction of aboveground fresh weight was done using the abovementioned three regression methods. The 31 713 SNP were used as the explanatory variables and the observed Biomaerofw as the explained variable. In the second scenario, the CGM Ecomeristem was used. First its input parameters were predicted using the same three regression methods, i.e. the SNP were used as the explanatory variables and the eight genotypic parameters as the explained variables. Then the predicted parameters were used to simulate growth and development of each genotype. The Ecomeristem output variable “Biomaerofw” was used as prediction for the aboveground fresh weight and compared to the observed Biomaerofw. The two scenarios and the three regression methods were compared based on the Normalized Mean Absolute Error (NMAE, Equation 3) between predicted and observed phenotypic trait, as well as the predictive ability (PA, Equation 4).
Where are the predicted values of either the integrative phenotypic trait or the CGM parameters, the observed values of either the trait (phenotyped on the Phenoarch platform) or the CGM parameters (estimated trough the DE optimization algorithm, see Parameter estimation of the CGM), the standard deviation and the covariance.
The genetic markers used as input data were encoded as {-1, 0, 1} corresponding respectively to homozygous for the reference allele, heterozygous and the homozygous for the alternative allele.
The first penalized regression method tested in this study is LASSO. This method performs variable selection and regularization and was first proposed by Tibshirani (1996). In this method, the coefficient for all SNP (β) are obtained by minimizing the sum of squares of the residuals (Equation 5), and are in addition under constraint as follows: where t is an arbitrary specified parameter controlling the regularization of the estimated coefficients. This regularization is an l1-norm penalization allowing some coefficients to exactly equal zero.
LASSO works well in problems of high dimensionality where the number of predictors is higher than the number of individuals (p > n) but only if a few of these predictors explain the observations. Indeed, LASSO selects at most n variables before it saturates (Zou and Hastie, 2005).
The second regression method tested is Bayes C (Habier et al., 2011). This method is derived from the Bayes A and Bayes B methods (proposed by Meuwissen et al., 2001) to address some of their drawbacks. Bayes A and B have shown to better address linkage disequilibrium (LD) between SNP and QTL than with least squares of the LASSO method resulting in higher prediction accuracies (Hayes et al., 2009). However, Gianola et al. (2009) have shown certain limitations to Bayes A and B concerning the prior of marker effects.
Bayes A and B are based on the general statistical model (Equation 6). The SNP effect is zero with probability π and is normally distributed with mean zero and a locus specific variance, with probability 1-π: N(0, σ²j). In Bayes A, all SNP have non-zero effect (i.e. π = 0), while in Bayes B π > 0. Having a locus-specific variance means that the shrinkage of SNP effects heavily relies on the scale parameter. Additionally, it becomes evident that such variance introduces challenges in Bayesian learning due to the posterior having only one more degree of freedom than the prior, thus limiting the predictability of posteriors significantly deviating from the prior (Gianola et al., 2009). Bayes C has been developed to overcome these limitations by considering a common variance to all SNP (see Habier et al., 2011).
Where µ is the overall mean of the phenotypic trait, u the polygenic effects of all individuals, K is the number of SNP, the genotype at SNP k, the additive effect of that SNP and e the residual effects.
The last method tested is a Convolutional Neural Network (CNN, LeCun et al., 2015), a type of neural network (NN). Neural networks are machine-learning methods used for regression and classification in a non-linear way. These networks are made up of a set of “neurons”, i.e. computational units, which, like neurons in the brain, can receive a signal and transmit it (through a non-linear function) to other connected neurons. These neurons are arranged in layers and the signal passes through these successive layers. Each neuron therefore performs a non-linear (and potentially local) regression of part or all the connected neurons of the previous layer (Figure 1).
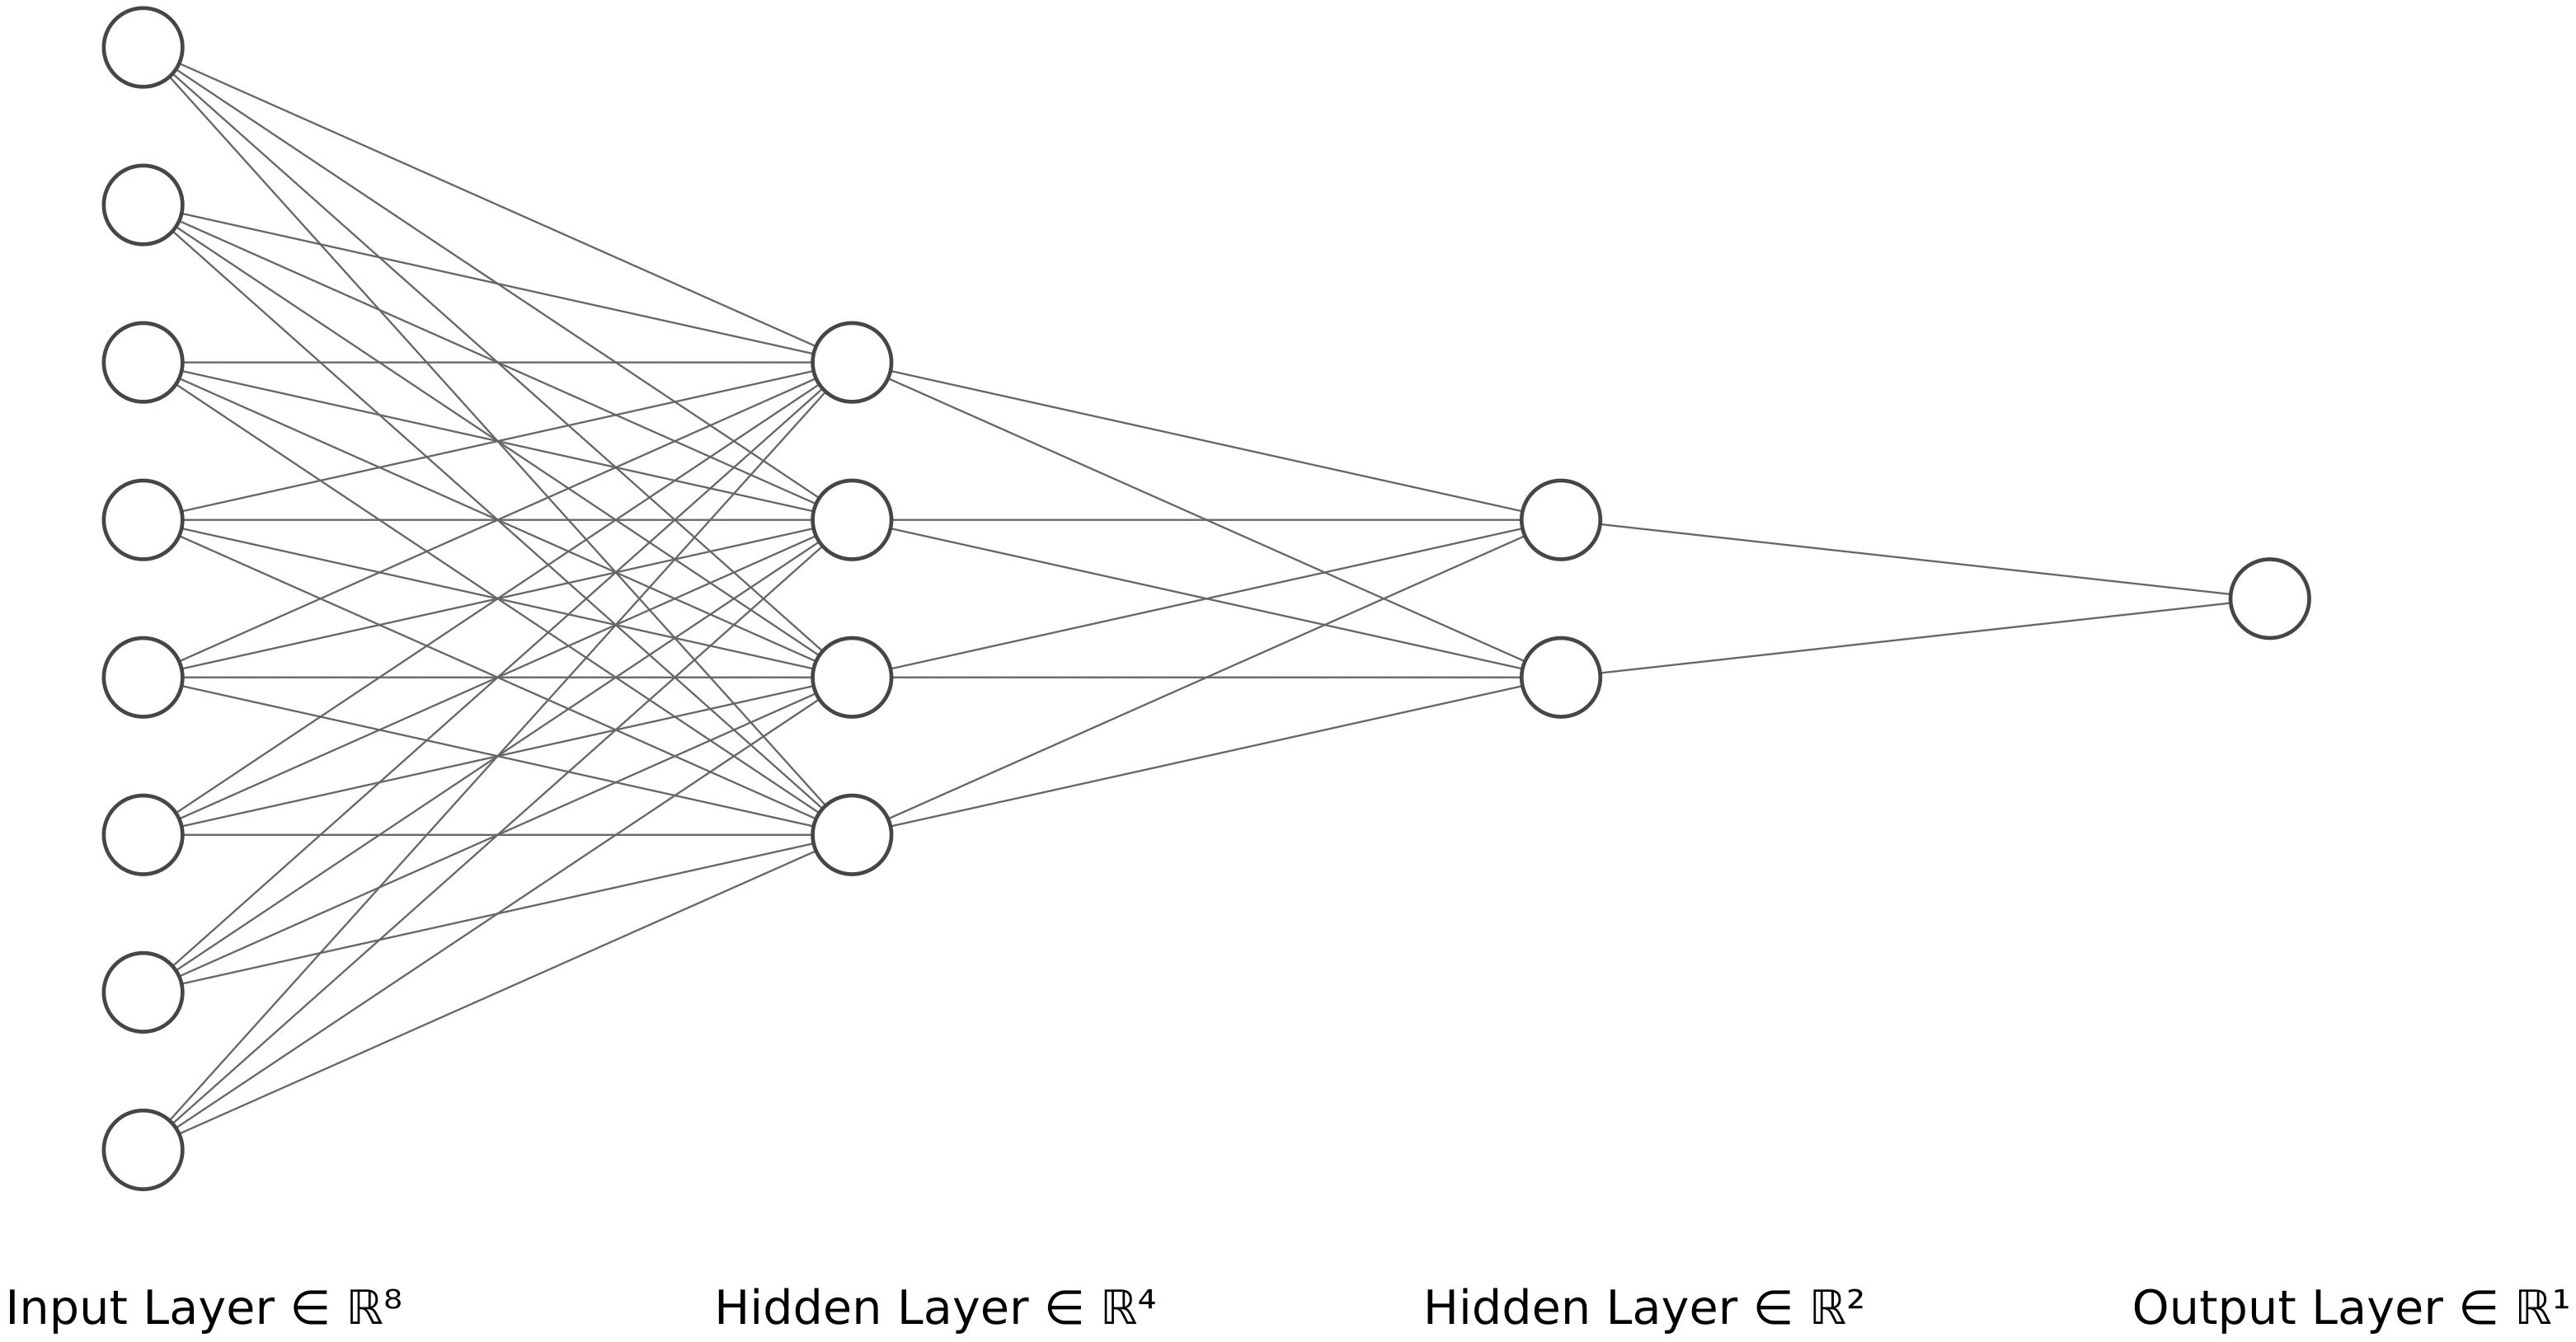
Figure 1 Schematic representation of a neural network with an input layer of size 8 and two hidden layers containing 4 and 2 neurons respectively. Drawn with LeNail (2019) tool.
CNN (Figure 2) are a type of NN inspired by the visual cortex of the human brain where neurons respond to stimuli in specific regions of the field of view, with these regions overlapping. This principle is used in CNN through two layers: a first layer of filters that extracts high-level features (in our case, characteristics of the genetic architecture between nearby markers), this is the convolution layer that performs local regression between these markers, i.e. SNP markers effect are estimated. The second layer is the reduction of the dimension of this convolution through pooling, generally a maxpooling which returns the maximum value of the portion of markers covered by the convolution, in our case similarly to other methods considering SNP with zero effect. CNN are a continuation of these two layers of convolutions (here between markers, or non-linear regression of groups of markers) and pooling. Following these layers, CNN typically have a layer of fully connected neurons in order to learn non-linear combinations of the high-level features detected by the convolution layers. CNN have completely changed the field of image analysis because they are particularly well suited to take into account the spatial nature of data, typically the relationship between pixels in an image or similarly genetic markers along a sequence.
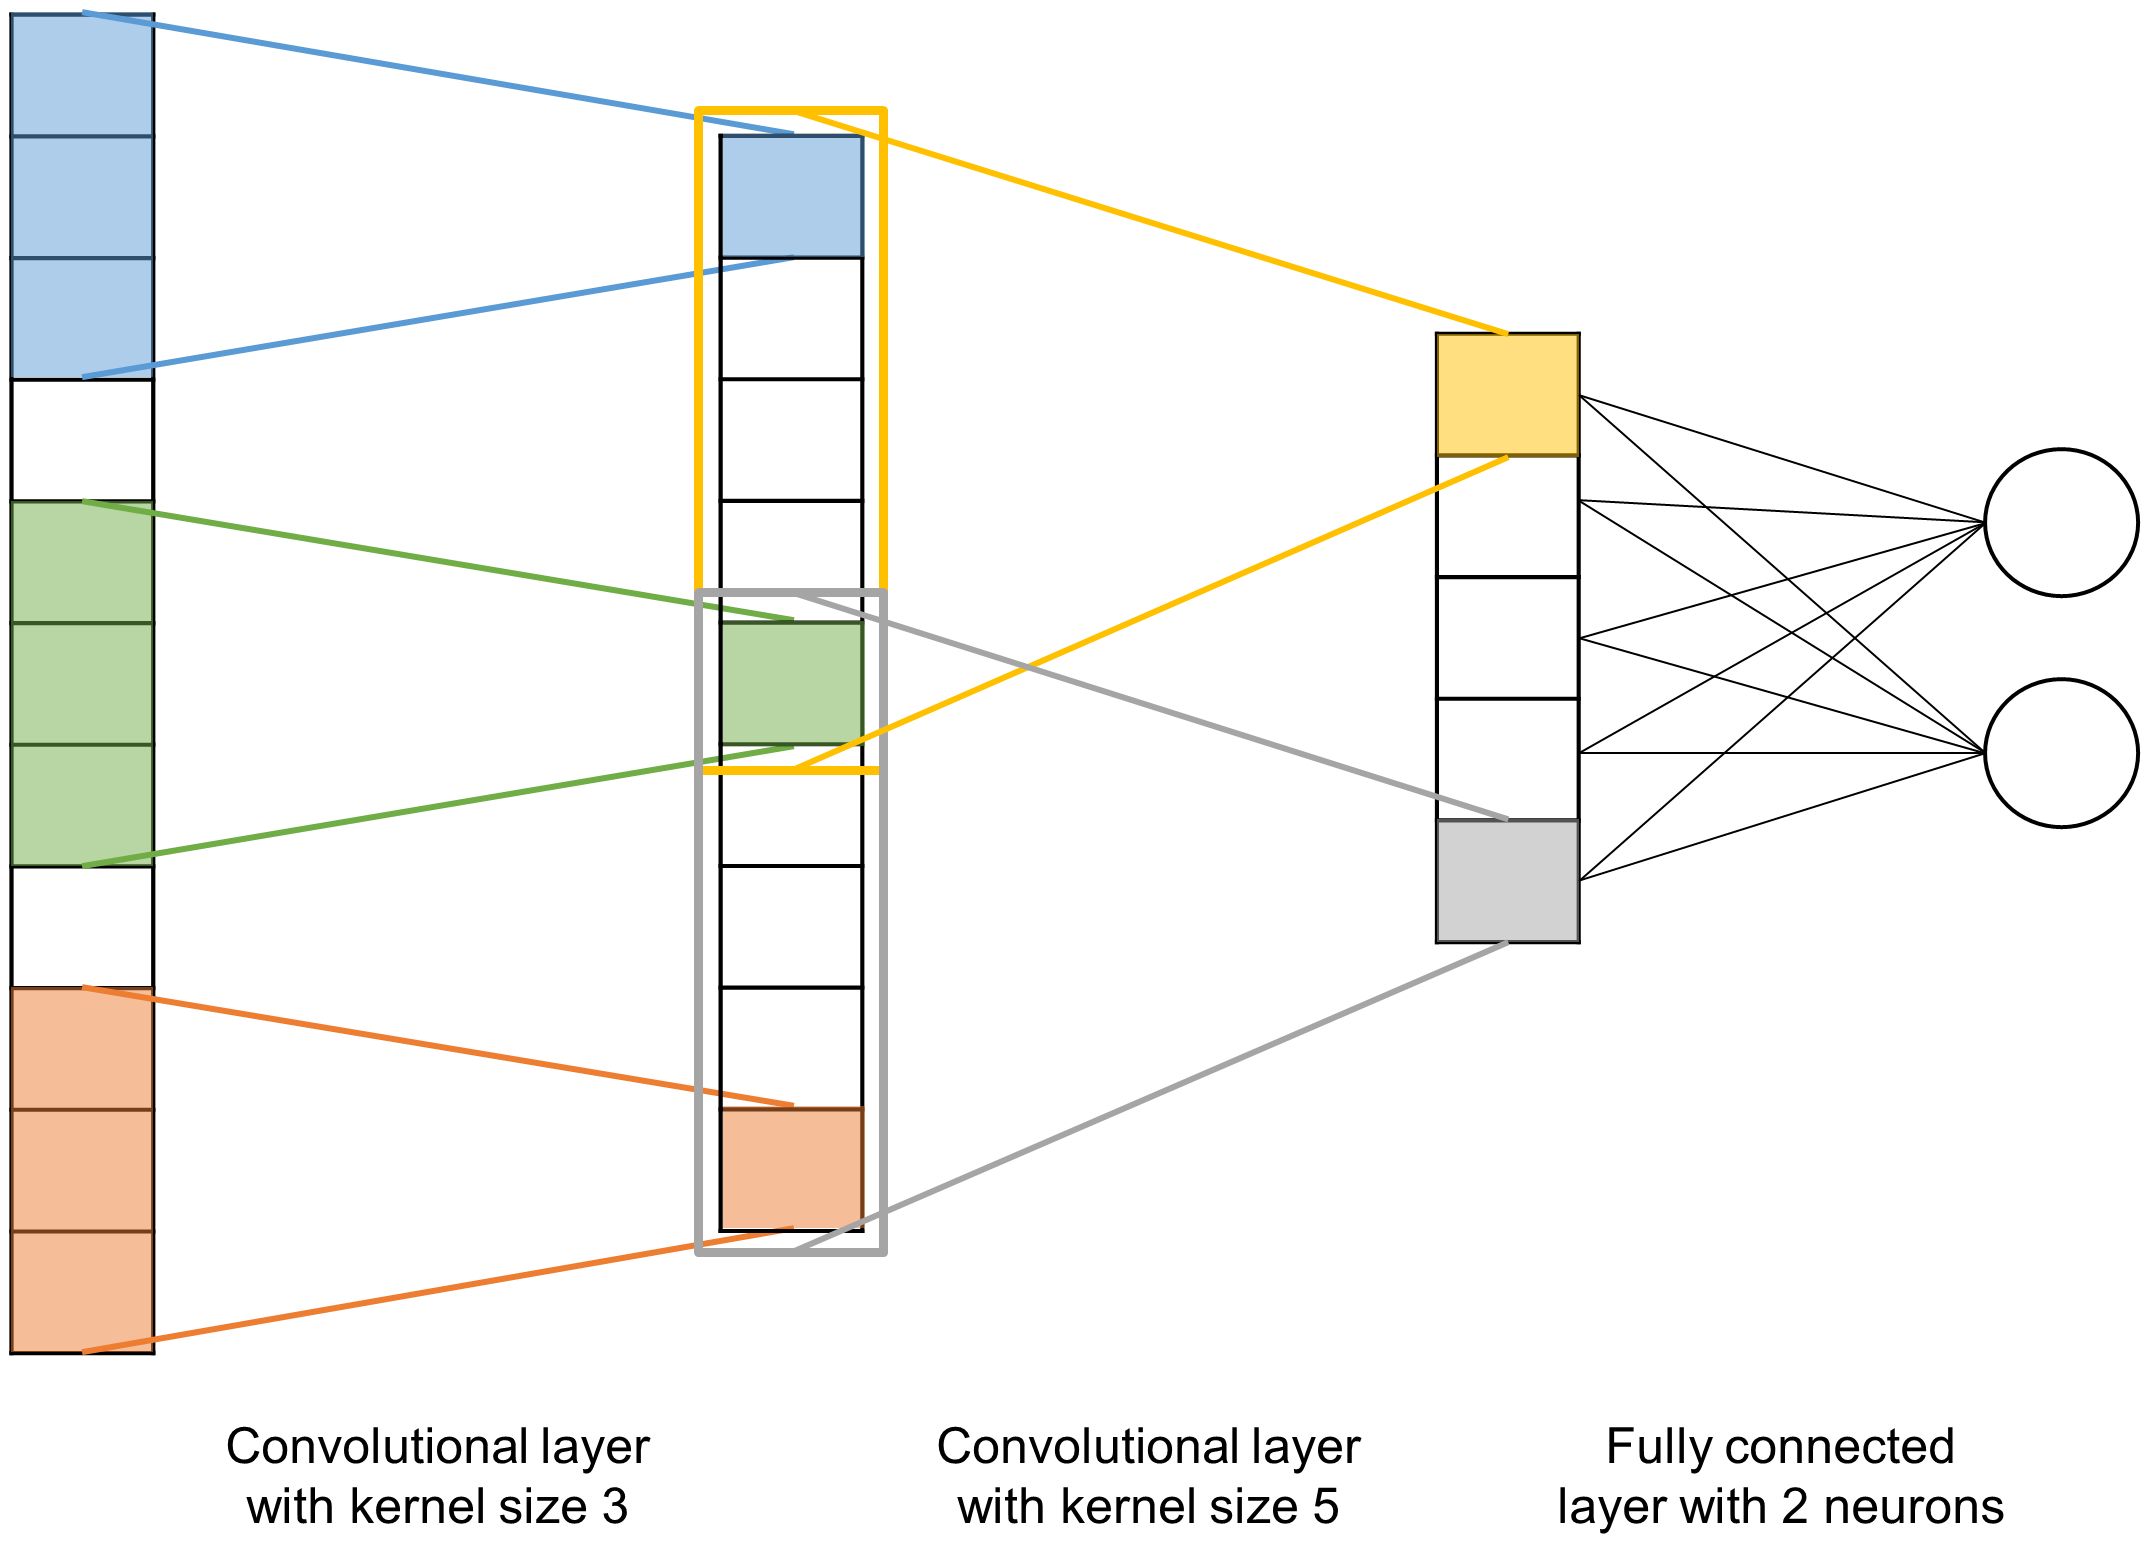
Figure 2 Schematic representation of a 1-dimensional convolutional neural network with two convolution layers (kernel sizes 3 and 5 respectively) and a fully connected 2-neuron layer. The kernel of the first layer (initially in blue) will slide over the input data with a step size defined by the stride (here equal to 1) and perform a convolution of the n adjacent inputs (where n is the size of the kernel). The kernel of the second layer (initially in orange) will do the same.
The CNN architecture developed in this study was designed by hyperparameter optimization (Feurer and Hutter, 2019). Hyperparameter tuning consists in trying multiple combinations of network parameters and architectures until a suitable architecture adapted to the studied data is identified. Typical hyperparameters include number of layers, size of filters, activation functions, etc. The hyperparameterized CNN was composed of five 1D-convolution layers with kernel sizes of 11, 11, 9, 13 and 9; and strides of 1, 3, 5, 5 and 5. Followed by a dense fully connected layer composed of 32 neurons, and the output layer of size 8 (number of CGM parameters to be estimated) or one (for the direct prediction of the phenotypic trait). The activation function (Nwankpa et al., 2018) between each layer was a succession Rectified Linear activation function (ReLU, Equation 7) or a softmax (Euation 8) except for the output layer where a sigmoid (Equation 9) was used. The models were trained using the Adam optimizer (Kingma and Ba, 2014) and evaluated using the NRMSE (see Equation 2) loss function.
Narrow-sense heritability for all phenotypic traits, and CGM parameters, were computed using the genotypic and phenotypic data described above. In a first step, the Genomic Relationship Matrix (GRM) using the method proposed by VanRaden (2008) and implemented in the snpReady R package (Granato et al., 2018) was generated. Then, marker-based heritability was estimated using the heritability R package (Kruijer et al., 2015). The results are presented in the Supplementary Table S2.
The first scenario compared the three regression methods on the direct prediction of sorghum aboveground fresh weight (Figure 3). LASSO yielded the least accurate results with a NMAE of 0.41 and a PA of 0.39. Bayes C had slightly better results with a NMAE of 0.4 and a PA of 0.47. Finally, genomic prediction using a CNN showed the best results with a NMAE of 0.22 and a PA of 0.53.
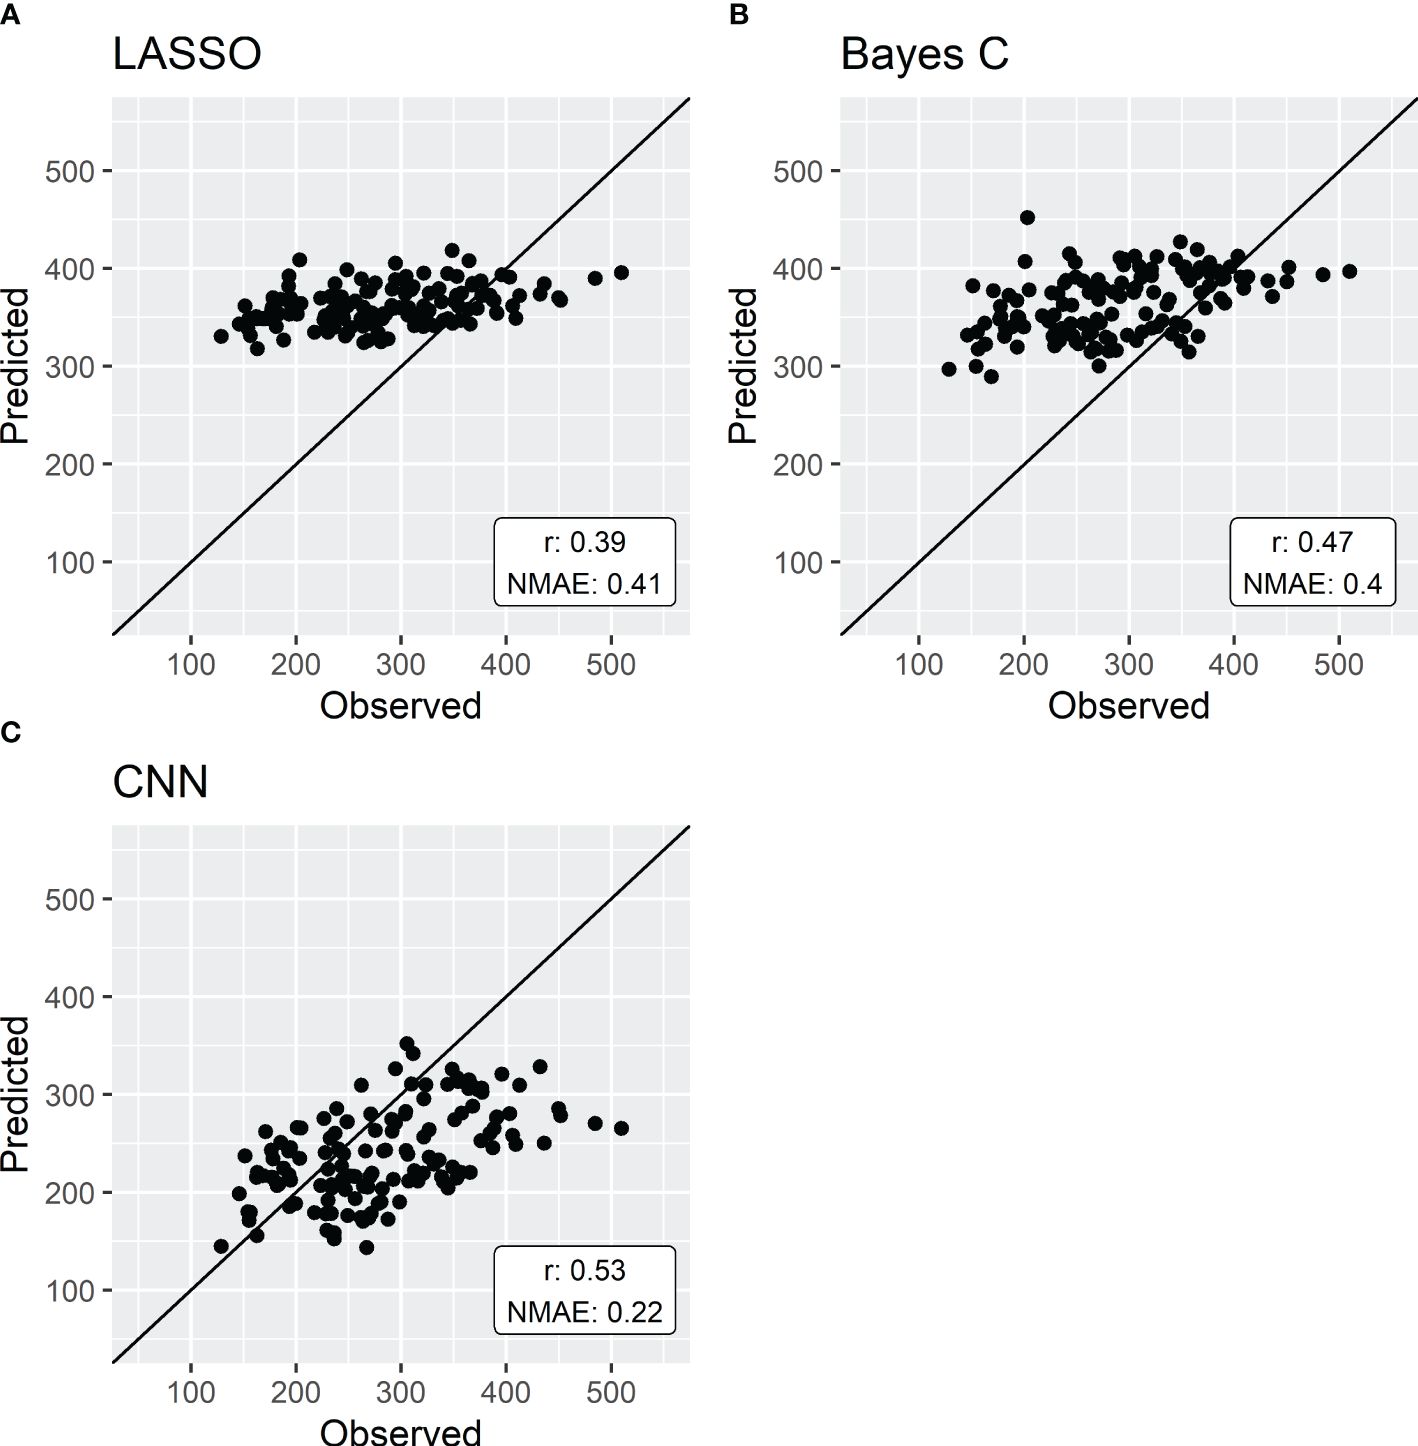
Figure 3 Genomic prediction of aboveground fresh weight by either LASSO (A), Bayes C (B) or CNN (C). Models are trained with a 5-fold cross-validation using data from 136 sorghum genotypes. Results are expressed by normalized mean absolute error (NMAE) and the predictive ability (r).
The genomic prediction of CGM parameters yielded variable results across predicted parameters but not across prediction methods (Table 3). NMAE varied from 0.87 for the least accurately predicted parameter, SLAp, to 0.05 for the most accurately predicted parameter, Ligulo_init. The average NMAE for each method was of 0.26 (SD = 0.27) for LASSO, 0.24 (SD = 0.24) for Bayes C and 0.24 (SD = 0.24) for CNN.
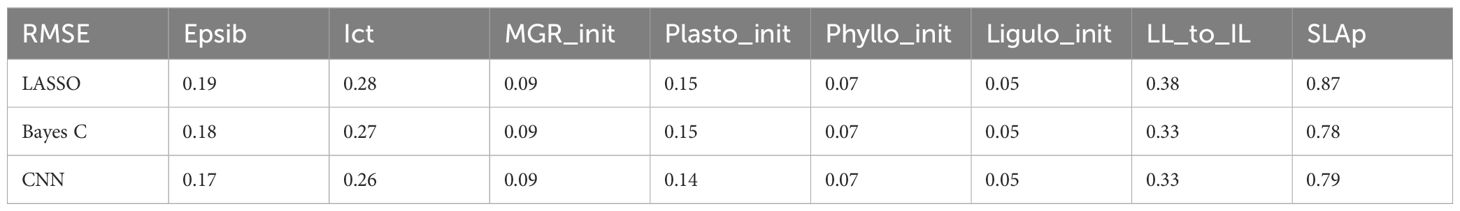
Table 3 Normalized Mean Absolute Error (NMAE) on the prediction of Ecomeristem parameters using LASSO, Bayes C or CNN.
The prediction of Biomaerofw using Ecomeristem (Figure 4) was slightly more precise when using parameters predicted with a CNN (NMAE 0.19, PA 0.63). LASSO and Bayes C still yielded parameters that resulted in good predictions (NMAE 0.20 and 0.19 respectively and PA 0.52 and 0.61).
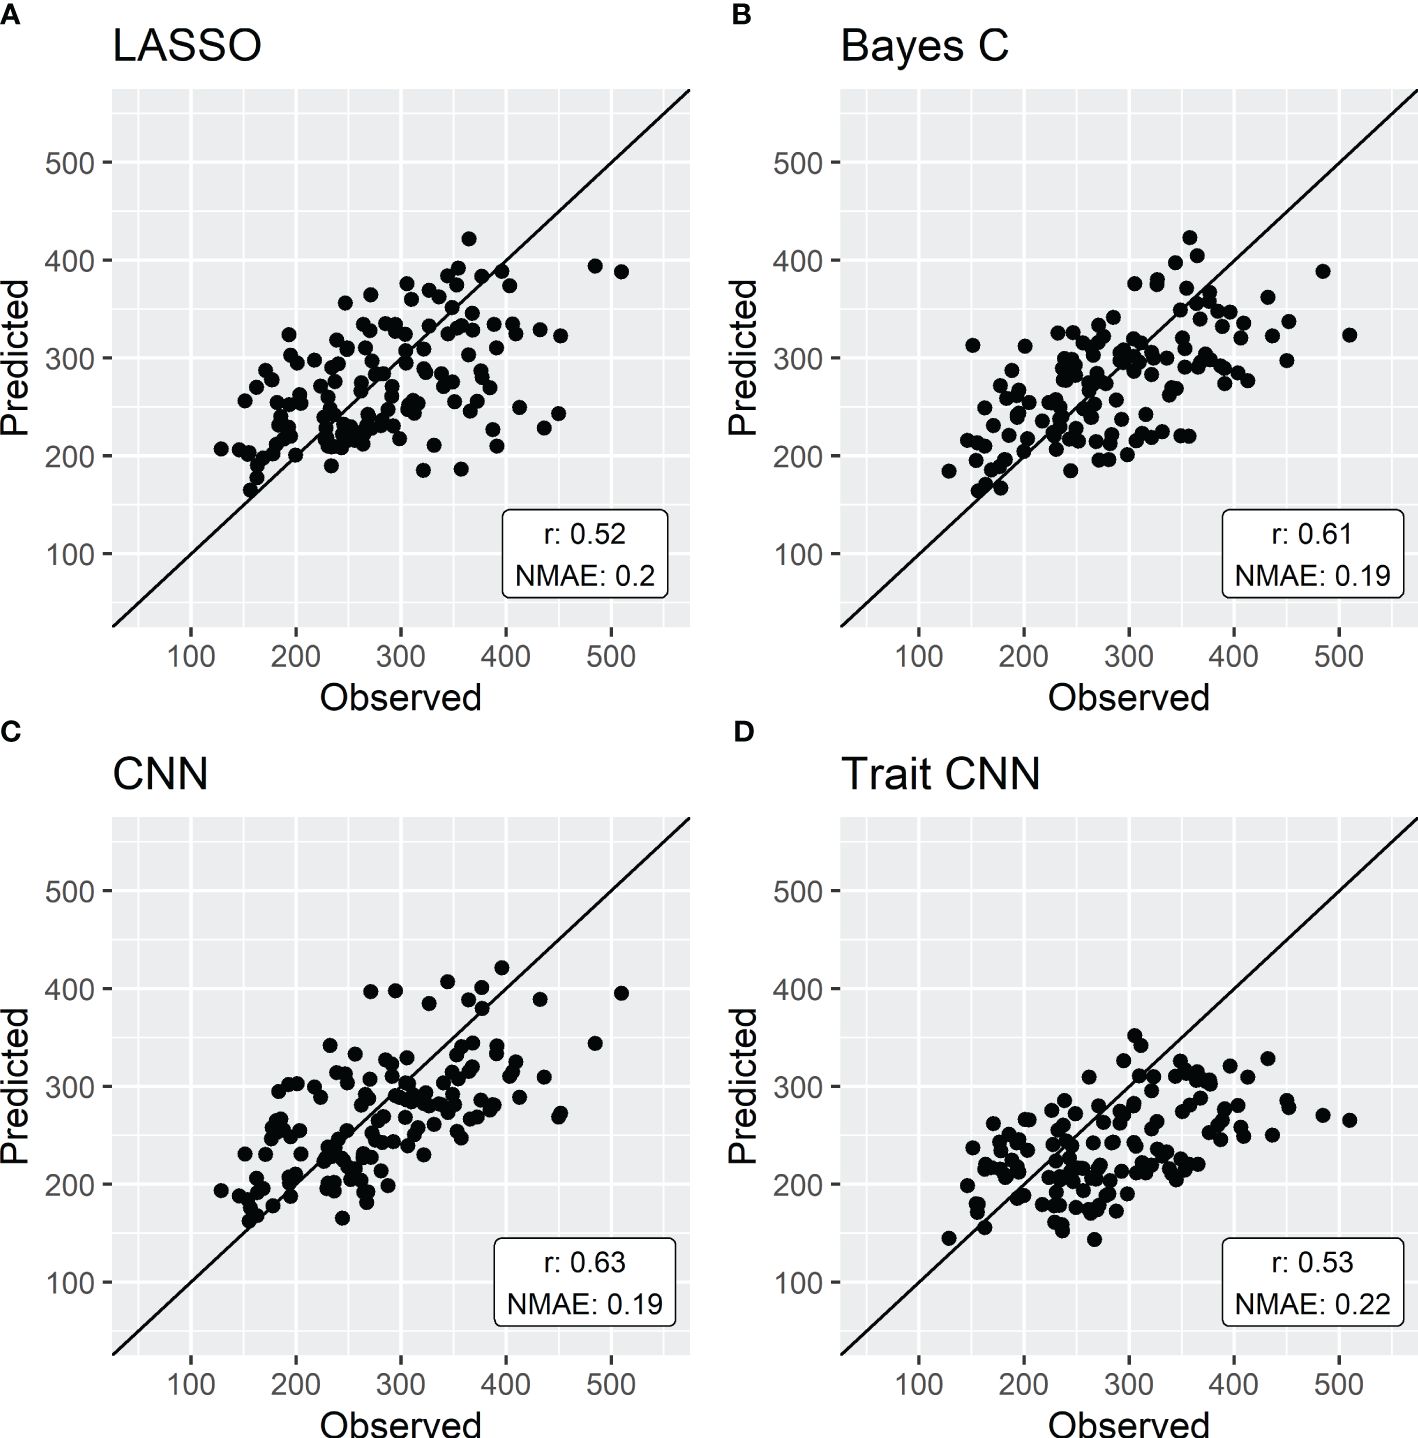
Figure 4 | 5-fold cross validation of simulations of Biomaerofw by Ecomeristem using parameters predicted by either LASSO (A), Bayes C (B) or CNN (C) compared to the direct genomic prediction of the integrative trait aboveground fresh weight (D). Each point represents the mean predicted value of the genotypes forming the validation set in each fold.
Biomass components (secondary traits) were also simulated using Ecomeristem, based on the prediction of genotypic parameters through a convolutional neural network and are presented in Supplementary Figure 1. Mainstem biomass (Mainstemfw, NMAE = 0.18, r = 0.72) as well as plant height (Pht, NMAE = 0.18, r = 0.6) were accurately predicted. The predictive ability for both individual leaf size (Arealfel, NMAE = 0.13, r = 0.53) and leaf biomass (Bladefw, NMAE = 0.22, r = 0.47) were lower.
In the present study, prediction of an integrative trait, sorghum aboveground fresh weight (Biomaerofw), using different methods was analyzed. The crop growth model Ecomeristem was then used to better consider the direct environmental effects and their interaction with genotypes on biomass growth. Eight genotypic parameters were predicted using the same three regression methods. Finally, the CGM predictions were compared to the direct genomic prediction of Biomaerofw.
Integrative traits are under the influence of (i) many genes and genetic interactions, especially epistasis (Zuk et al., 2012), and (ii) Genotype x Environment interactions (Rincent et al., 2017). These interactions are, by nature, non-linear. Therefore, to assess the capacity of linear regression models in producing accurate predictions of these traits, LASSO and Bayes C were compared to a non-linear regression method, specifically a convolutional neural network (CNN). The results revealed that LASSO exhibited the least accurate predictions for the studied integrative trait. While Bayes C demonstrated higher prediction accuracy, it still faced challenges in predicting aboveground fresh weight compared to convolutional neural networks (almost twice as high NMAE, Figure 3). These results are in line with previous studies comparing LASSO and Bayesian methods (e.g. Howard et al., 2014).
The use of non-linear regression methods, capable of efficiently considering interactions between polymorphism sites, could potentially address the challenge of epistasis in predicting integrative traits. Results showed that CNN, as a non-linear regression method, surpassed both LASSO and Bayes C in predicting total biomass fresh weight. The complexity of sorghum biomass growth, influenced by numerous interdependent biological processes and characterized as polygenic (Habyarimana et al., 2020), underscores the relevance of considering epistatic interactions. Previous studies have shown the influence of epistasis on complex trait variation, such as growth rate or crop yield (Kroymann and Mitchell-Olds, 2005; Melchinger et al., 2007). Given that integrative traits are influenced by myriad of local and distal SNP-SNP interactions (Qian et al., 2017), convolutional neural networks, by design, emerge as a suitable tool for accommodating these epistatic interactions in the prediction of these traits. Recent studies proposed the application of neural networks (NN), and in particular CNNs in genomic prediction of complex human and animal traits (e.g. Pook et al., 2020). These studies show that NNs can exhibit either slightly better, similar or inferior prediction accuracies compared to classical linear regression. Notably, the outcome is highly dependent on the set of SNPs, the genetic architecture of the trait (e.g. Bellot et al., 2018), and the architecture of the NN itself (Zhu et al., 2021).
The use of NNs in genomic prediction is obviously case-dependent, and it is apparent that more research is needed to adapt these non-linear methods to the Genomic Selection process. Specifically, this involves understanding how genetic data is processed by the NN, and assessing their impact on prediction outcomes (e.g. Verplaetse et al., 2023). In contrast to classical linear regression, a universal neural network architecture that suits all cases does not exist. Apart from estimating regression parameters, the entire structure (including the number, type, and size of layers, activation functions, etc.) must be adapted to the specific prediction problem at hand.
The Ecomeristem crop growth model was used to provide a more comprehensive consideration of causal non-linear environmental effects, as well as interactions between biomass components on biomass growth, potentially leading to enhanced prediction accuracies. Biomass is a highly polygenic trait, Habyarimana et al. (2020) detected significant marker-trait associations across eight of the then sorghum chromosomes. It is also under the influence of epistatic interactions: Brown et al. (2008) highlighted epistatic interactions between two major dwarfing QTL, Ishimori et al. (2020) showed the important role of epistasis for total biomass as well as stem length. Moreover, biomass components show differences in the dynamics of the effects of different genes depending on environmental conditions as well as developmental stage (Mu et al., 2022).
In this context, we proceeded to predict genotypic parameters that govern the equations formalizing biological processes where GxE, as well as interactions between resulting intermediate traits take place. Not all CGM parameters where predicted with the same accuracy. The least accurate predicted parameter was associated with the control of specific leaf area decrease between successive leaves (SLAp), with an average NMAE of 0.81. This can be attributed to the limited variability observed on this parameter across genotypes, with 40% of them having identical values, although SLAp exhibited high heritability (0.616). The challenge in accurately predicting SLAp emphasizes the influence of parameter characteristics and parameter estimation quality on the efficiency of genomic predictions of crop model parameters. Variations in prediction accuracy across other parameters can be explained by their heritability (see Supplementary Table S2). Parameters such as Plasto_init, Phyllo_init and Ligulo_init, characterized by a lower heritability, resulted in less accurate predictions. Conversely, parameters with higher heritability, including MGR_init, LL_to_INL, and ICt, exhibited predictions that are more accurate.
While errors are not directly comparable between parameters, intermediate traits, and the integrative trait, the simulation of Biomaerofw with Ecomeristem showed higher accuracies than the direct prediction of the trait, as illustrated in Figures 4C and D. This observation aligns with recent studies (e.g. Heslot et al., 2014; Tolhurst et al., 2022; Filho et al., 2023) which highlighted the enhanced prediction accuracies achieved through the incorporation of environmental effects. Interestingly some studies, like the one of Widener et al. (2021), suggest that the inclusion of environmental covariates may have limited impact, if any, on improving predictions in extreme environments. Moreover, they suggest that the composition of the calibration set of environments may hold greater significance as they found that only a subset of the available environments was needed to accurately predict GEBV. In addition, Rogers and Holland (2022) showed that the environmental similarity between training and test sets had a great impact on prediction accuracies. Phenomic selection (PS, Rincent et al., 2018) is one way of considering the impact of GxE. It is suggested that environmental variation is captured by the spectra and could thus enhance prediction accuracies compared to genomic prediction (e.g. Lane et al., 2020; Robert et al., 2022). On the other hand, the integration of crop models, as proposed in our study, introduces promising avenue to include causal environmental effects into GP. By providing causal relationships between environmental variation and individual traits, crop models have the potential to offer insights of the environmental effect on phenotypic plasticity. For example, the Ecomeristem model has already demonstrated its ability to predict plant behavior in new environments, i.e. not used during the estimation of genotypic parameters, or for alternate crop management (Larue et al., 2019). In addition, CGM simulate integrative traits as a result of interactions between intermediate traits and as responses to plant state. Therefore, the integrated CGM-GP approach could also answer the varying effects of genes depending on plant developmental stage. However, further research is imperative to thoroughly assess and quantify the impact of the integration of crop models with genomic prediction on prediction accuracy of the genetic values of candidates to selection, particularly in the context of multi-environmental trials. Our dataset was composed of a single environment. While GxE was still introduced by considering individual plant micro-environment inside the greenhouse (see Phenotypic data section), it is still necessary to validate this approach in a multi-environment setting. Several studies have explored this question (e.g. Reymond et al., 2003; Technow et al., 2015; Jighly et al., 2023). Nevertheless, it is important to note that their methodologies differ from the approach proposed in our study, particularly in terms of how crop model parameters are predicted through the use of genomic prediction: in their approach, genotypic parameters are sampled in each iteration of a Bayesian model and used for predicting observed traits through the CGM that is then used to update the marker effects. They are thus estimating parameters at the same time as the markers effects. In our approach, the parameter values are considered to be known. More specifically, the parameters are estimated in a preliminary step by model inversion using an optimization algorithm (here, a metaheuristic called Differential Evolution). These “observed” parameter values are then used to train a prediction model using marker information with no feedback of the CGM performance, relying solely on the difference between predicted and “observed” parameter values. Once trained, the prediction model is then used to predict the value of these genotypic parameters for the validation set and are then fed to the CGM to predict the phenotypic traits. Furthermore, these studies often focus on either a limited number of markers or crop model parameters; or they consider a reduced set of physiological processes within the crop model. The differences in methods and areas of interest highlights the need for a comprehensive study into the potential benefits of employing crop models for predicting integrative traits.
As mentioned previously, the prediction accuracy of the CGM-GP approach is highly dependent on the calibration set, the quality of parameter estimation and also the relevance of the crop model (Rincent et al., 2017). Indeed, the main limiting factor of the CGM-GP approach is how well the crop model is able to simulate the integrative trait of interest. In our study, the “optimal” parameter set yielded an average NMAE of 0.065 on Biomaerofw (Supplementary Table S1). A perfect prediction of the CGM parameters could not yield a more precise result than the “optimal” parameter set. In any case, our study shows that the CGM-GP approach improves the predictive accuracy of an integrative trait compared to its direct prediction.
In this study, we showed that using non-linear regression methods (convolutional neural networks) in the genomic prediction process yielded higher prediction accuracies than classical linear methods, such as LASSO or Bayes C. However, CNN superiority is less significant when the prediction target is CGM parameters rather than the integrative trait (Figure 3). Table 3 shows that, across all CGM parameters, the NMAE is similar for all regression methods. The same trend in parameter prediction accuracy as highlighted before is true for the three regression methods. As mentioned previously, it is suggested that the crop models decompose integrative traits into potentially more heritable intermediate traits (organ size, number, etc.) that are simulated through response curves to the environment, defined by genotypic parameters and can thus be used to predict the genetic variability of these integrative traits (Reymond et al., 2003; Parent and Tardieu, 2014). Indeed, the heritability of the integrative trait Biomaerofw was of 0.714 while the elementary traits composing aboveground biomass systematically harbored higher heritability with the exception of the number of tillers (see Supplementary Table S2). Most of these traits were indeed simulated with higher accuracy than the direct prediction of aboveground biomass (see Supplementary Figure S1).
It is interesting to note that the prediction of the trait through a CGM is also more accurate for the LASSO and Bayes C methods compared to the direct prediction of the trait. These results may show that genotypic parameters are under less complex genetic control than the integrative traits of interest. It could also indicate the robustness of the crop model for parameter sets that deviate slightly from the observed values. Lastly, considering causal effects of the environment on intermediate traits, as formalized in crop models, could enhance prediction accuracies of the integrative trait.
The present study suggested that the use of convolutional neural networks (CNN) to predict complex integrative phenotypic traits enhanced prediction accuracies in classical Genomic Prediction approaches by considering non-linear genetic interactions. It also reaffirmed the benefits of using crop growth models (CGM) to better account for environmental effects on these traits as well as facilitating marker-based prediction by breaking down integrative traits into simpler traits. Epistatic genetic architecture and non-linear relationships between traits and between CGM parameters were suggested as the explanation for the more robust results of CNN. The CGM-GP approach using CNN showed promising results in a multi-trait (MT) context and could also enhance predictions in a multi-environment (ME) and MTME context.
The original contributions presented in the study are publicly available. This data can be found here: https://github.com/GBeurier/GenomicPrediction_Frontier.
FL: Conceptualization, Data curation, Formal analysis, Investigation, Methodology, Software, Validation, Visualization, Writing – original draft, Writing – review & editing. LR: Conceptualization, Data curation, Formal analysis, Investigation, Methodology, Software, Supervision, Validation, Visualization, Writing – original draft, Writing – review & editing. DP: Conceptualization, Data curation, Methodology, Supervision, Validation, Writing – original draft, Writing – review & editing. J-FR: Conceptualization, Data curation, Methodology, Supervision, Writing – original draft, Writing – review & editing. DL: Conceptualization, Data curation, Formal analysis, Funding acquisition, Investigation, Methodology, Project administration, Supervision, Validation, Visualization, Writing – original draft, Writing – review & editing. GB: Conceptualization, Data curation, Formal analysis, Investigation, Methodology, Software, Supervision, Validation, Visualization, Writing – original draft, Writing – review & editing.
The author(s) declare financial support was received for the research, authorship, and/or publication of this article. Biomass for the Future project (ANR-11-BTBR-0006-BFF) funded by the French National Research Agency (ANR): cofunded the experimental trial; Sorghum Genomics Toolbox funded by the Bill & Melinda Gates Foundation: cofunded the experimental trial.
The authors declare that the research was conducted in the absence of any commercial or financial relationships that could be construed as a potential conflict of interest.
All claims expressed in this article are solely those of the authors and do not necessarily represent those of their affiliated organizations, or those of the publisher, the editors and the reviewers. Any product that may be evaluated in this article, or claim that may be made by its manufacturer, is not guaranteed or endorsed by the publisher.
The Supplementary Material for this article can be found online at: https://www.frontiersin.org/articles/10.3389/fpls.2024.1393965/full#supplementary-material
Supplementary Figure 1 | 5-fold cross validation of simulations of mainstem fresh weight (A), plant height (B), area of last fully elongated leaf (C) and mainstem leaf blade fresh weight (D) by Ecomeristem using genomic predicted parameters obtained with the use of a convolutional neural network.
Supplementary Table 1 | Results of parameter estimation expressed as the mean of normalized mean absolute error over all genotypes for each observed phenotypic trait.
Supplementary Table 2 | Narrow sense heritability for estimated parameters and their corresponding trait.
Supplementary Table 3 | Normalized Mean Absolute Error (NMAE) and Predictive Ability (PA) for the three genomic prediction model used either in the direct prediction of sorghum biomass (direct-GP) or the prediction through an integrated crop growth model – genomic prediction (CGM-GP) approach.
Ardia, D., Boudt, K., Carl, P., Mullen, K. M., Peterson, B. G. (2011). Differential evolution with DEoptim: an application to non-convex portfolio optimization. R Journal 3 (1), 27–34. doi:10.32614/RJ-2011-005
Arojju, S. K., Cao, M., Trolove, M., Barrett, B. A., Inch, C., Eady, C., et al. (2020). Multi-trait genomic prediction improves predictive ability for dry matter yield and water-soluble carbohydrates in perennial ryegrass. Front. Plant Sci. 11, 1197. doi: 10.3389/fpls.2020.01197
Bellot, P., de Los Campos, G., Pérez-Enciso, M. (2018). Can deep learning improve genomic prediction of complex human traits? Genetics 210, 809–819. doi: 10.1534/genetics.118.301298
Billot, C., Ramu, P., Bouchet, S., Chantereau, J., Deu, M., Gardes, L., et al. (2013). Massive sorghum collection genotyped with SSR markers to enhance use of global genetic resources. PloS One 8, e59714. doi: 10.1371/journal.pone.0059714
Brown, P. J., Rooney, W. L., Franks, C., Kresovich, S. (2008). Efficient mapping of plant height quantitative trait loci in a sorghum association population with introgressed dwarfing genes. Genetics 180, 629–637. doi: 10.1534/genetics.108.092239
Browning, B. L., Browning, S. R. (2013). Improving the accuracy and efficiency of identity-by-descent detection in population data. Genetics 194 (2), 459–471. doi: 10.1534/genetics.113.150029
Burgueño, J., de los Campos, G., Weigel, K., Crossa, J. (2012). Genomic prediction of breeding values when modeling genotype× environment interaction using pedigree and dense molecular markers. Crop Sci. 52, 707–719. doi: 10.2135/cropsci2011.06.0299
Bustos-Korts, D., Boer, M. P., Malosetti, M., Chapman, S., Chenu, K., Zheng, B., et al. (2019). Combining crop growth modeling and statistical genetic modeling to evaluate phenotyping strategies. Front. Plant Sci. 10, 1491. doi: 10.3389/fpls.2019.01491
Butler, D. G., Cullis, B. R., Gilmour, A. R., Gogel, B. J. (2009). ASReml-r reference manual (Brisbane: The State of Queensland, Department of primary industries and fisheries).
Cabrera Bosquet, L., Brichet, N., Fournier, C., Grau, A., Mineau, J., Negre, V., et al. (2015). “PHENOARCH, a multiscale phenotyping platform for plant architecture, growth rate, water use efficiency and radiation use efficiency,” in Recent progress in drought tolerance from genetics to modelling(Montpellier, FRA).
Cabrera-Bosquet, L., Fournier, C., Brichet, N., Welcker, C., Suard, B., Tardieu, F. (2016). High-throughput estimation of incident light, light interception and radiation-use efficiency of thousands of plants in a phenotyping platform. New Phytol. 212, 269–281. doi: 10.1111/nph.14027
Carré, C., Carluer, J. B., Chaux, C., Roche, N., Mas, A., Krouk, G. (2022). Full epistatic interaction maps retrieve part of missing heritability and improve phenotypic prediction. bioRxiv. doi: 10.1101/2022.07.20.500572
Chapman, S. C., Hammer, G. L., Butler, D. G., Cooper, M. (2000). Genotype by environment interactions affecting grain sorghum. III. Temporal sequences and spatial patterns in the target population of environments. Aust. J. Agric. Res. 51, 223–234. doi: 10.1071/AR99022
Cooper, M., Technow, F., Messina, C., Gho, C., Totir, L. R. (2016). Use of crop growth models with whole-genome prediction: application to a maize multienvironment trial. Crop Sci. 56, 2141–2156. doi: 10.2135/cropsci2015.08.0512
Elshire, R. J., Glaubitz, J. C., Sun, Q., Poland, J. A., Kawamoto, K., Buckler, E. S., et al. (2011). A robust, simple genotyping-by-sequencing (GBS) approach for high-diversity species. PloS One 6, e19379. doi: 10.1371/journal.pone.0019379
Feurer, M., Hutter, F. (2019). “Hyperparameter optimization,” in Automated Machine Learning (Springer, Cham), 3–33.
Filho, C. C. F., Andrade, M. H. M. L., Nunes, J. A. R., Jarquin, D. H., Rios, E. F. (2023). Genomic prediction for complex traits across multiples harvests in alfalfa (Medicago sativa L.) is enhanced by enviromics. Plant Genome 16 (2), e20306. doi: 10.1002/tpg2.20306
Friedman, J., Hastie, T., Tibshirani, R. (2010). Regularization paths for generalized linear models via coordinate descent. J. Stat. Software 33, 1–22. doi: 10.18637/jss.v033.i01
Gaire, R., de Arruda, M. P., Mohammadi, M., Brown-Guedira, G., Kolb, F. L., Rutkoski, J. (2022). Multi-trait genomic selection can increase selection accuracy for deoxynivalenol accumulation resulting from fusarium head blight in wheat. Plant Genome 15, e20188. doi: 10.1002/tpg2.20188
Gianola, D., de Los Campos, G., Hill, W. G., Manfredi, E., Fernando, R. (2009). Additive genetic variability and the Bayesian alphabet. Genetics 183, 347–363. doi: 10.1534/genetics.109.103952
Granato, I. S., Galli, G., de Oliveira Couto, E. G., Mendonça, L. F., Fritsche-Neto, R. (2018). snpReady: a tool to assist breeders in genomic analysis. Mol. Breed. 38, 1–7. doi: 10.1007/s11032-018-0844-8
Habier, D., Fernando, R. L., Kizilkaya, K., Garrick, D. J. (2011). Extension of the Bayesian alphabet for genomic selection. BMC Bioinf. 12, 186. doi: 10.1186/1471-2105-12-186
Habyarimana, E., De Franceschi, P., Ercisli, S., Baloch, F. S., Dall’Agata, M. (2020). Genome-Wide Association Study for Biomass Related Traits in a Panel of Sorghum bicolor and S. bicolor× S. halepense Populations. Front. Plant Sci. 11, 1796. doi: 10.3389/fpls.2020.551305
Hayes, B. J., Bowman, P. J., Chamberlain, A. C., Verbyla, K., Goddard, M. E. (2009). Accuracy of genomic breeding values in multi-breed dairy cattle populations. Genet. Selection Evol. 41, 1–9. doi: 10.1186/1297-9686-41-1
Heslot, N., Akdemir, D., Sorrells, M. E., Jannink, J. L. (2014). Integrating environmental covariates and crop modeling into the genomic selection framework to predict genotype by environment interactions. Theor. Appl. Genet. 127, 463–480. doi: 10.1007/s00122-013-2231-5
Hickey, J. M., Chiurugwi, T., Mackay, I., Powell, W. (2017). Genomic prediction unifies animal and plant breeding programs to form platforms for biological discovery. Nat. Genet. 49 (9), 1297–1303. doi: 10.1038/ng.3920
Howard, R., Carriquiry, A. L., Beavis, W. D. (2014). Parametric and nonparametric statistical methods for genomic selection of traits with additive and epistatic genetic architectures. G3: Genes Genomes Genet. 4, 1027–1046. doi: 10.1534/g3.114.010298
Ishimori, M., Takanashi, H., Hamazaki, K., Atagi, Y., Kajiya-Kanegae, H., Fujimoto, M., et al. (2020). Dissecting the genetic architecture of biofuel-related traits in a sorghum breeding population. G3: Genes Genomes Genet. 10, 4565–4577. doi: 10.1534/g3.120.401582
Jighly, A., Weeks, A., Christy, B., O’Leary, G. J., Kant, S., Aggarwal, R., et al. (2023). Integrating biophysical crop growth models and whole genome prediction for their mutual benefit: a case study in wheat phenology. J. Exp. Bot. 74, 4415–4426. doi: 10.1093/jxb/erad162
Kingma, D. P., Ba, J. (2014). Adam: A method for stochastic optimization. arXiv preprint arXiv:1412.6980. doi: 10.48550/arXiv.1412.6980
Kroymann, J., Mitchell-Olds, T. (2005). Epistasis and balanced polymorphism influencing complex trait variation. Nature 435, 95–98. doi: 10.1038/nature03480
Kruijer, W., Boer, M. P., Malosetti, M., Flood, P. J., Engel, B., Kooke, R., et al. (2015). Marker-based estimation of heritability in immortal populations. Genetics 199, 379–398. doi: 10.1534/genetics.114.167916
Lane, H. M., Murray, S. C., Montesinos−López, O. A., Montesinos−López, A., Crossa, J., Rooney, D. K., et al. (2020). Phenomic selection and prediction of maize grain yield from near-infrared reflectance spectroscopy of kernels. Plant Phenome J. 3, e20002. doi: 10.1002/ppj2.20002
Larkin, D. L., Lozada, D. N., Mason, R. E. (2019). Genomic selection—considerations for successful implementation in wheat breeding programs. Agronomy 9, 479. doi: 10.3390/agronomy9090479
Larue, F., Fumey, D., Rouan, L., Soulié, J. C., Roques, S., Beurier, G., et al. (2019). Modelling tiller growth and mortality as a sink-driven process using Ecomeristem: implications for biomass sorghum ideotyping. Ann. Bot. 124, 675–690. doi: 10.1093/aob/mcz038
LeCun, Y., Bengio, Y., Hinton, G. (2015). Deep learning. Nature 521, 436–444. doi: 10.1038/nature14539
LeNail, A. (2019). Nn-svg: Publication-ready neural network architecture schematics. J. Open Source Software 4, 747. doi: 10.21105/joss.00747
Luquet, D., Dingkuhn, M., Kim, H., Tambour, L., Clement-Vidal, A. (2006). EcoMeristem, a model of morphogenesis and competition among sinks in rice. 1. Concept, validation, and sensitivity analysis. Funct. Plant Biol. 33, 309–323. doi: 10.1071/FP05266
Luquet, D., Song, Y. H., Elbelt, S., This, D., Clément-Vidal, A., Périn, C., et al. (2007). Model-assisted physiological analysis of Phyllo, a rice architectural mutant. Funct. Plant Biol. 34, 11–23. doi: 10.1071/FP06180
Melchinger, A. E., Piepho, H. P., Utz, H. F., Muminovic, J., Wegenast, T., TOrjek, O. T. T. O., et al. (2007). Genetic basis of heterosis for growth-related traits in Arabidopsis investigated by testcross progenies of near-isogenic lines reveals a significant role of epistasis. Genetics 177, 1827–1837. doi: 10.1534/genetics.107.080564
Meuwissen, T. H. E., Hayes, B. J., Goddard, M. E. (2001). Prediction of total genetic values using genome-wide dense marker maps. Genetics 157, 1819–1829. doi: 10.1093/genetics/157.4.1819
Moeinizade, S., Kusmec, A., Hu, G., Wang, L., Schnable, P. S. (2020). Multi-trait genomic selection methods for crop improvement. Genetics 215, 931–945. doi: 10.1534/genetics.120.303305
Montesinos-López, A., Montesinos-López, O. A., Gianola, D., Crossa, J., Hernández-Suárez, C. M. (2018). Multi-environment genomic prediction of plant traits using deep learners with dense architecture. G3: Genes Genomes Genet. 8, 3813–3828. doi: 10.1534/g3.118.200740
Mu, Q., Guo, T., Li, X., Yu, J. (2022). Phenotypic plasticity in plant height shaped by interaction between genetic loci and diurnal temperature range. New Phytol. 233, 1768–1779. doi: 10.1111/nph.17904
Nwankpa, C., Ijomah, W., Gachagan, A., Marshall, S. (2018). Activation functions: Comparison of trends in practice and research for deep learning. . arXiv preprint arXiv:1811.03378. doi: 10.48550/arXiv.1811.03378
Onogi, A. (2022). Integration of crop growth models and genomic prediction. Genomic Prediction of Complex Traits: Methods and Protocols, 359–396. doi: 10.1007/978-1-0716-2205-6_13
Parent, B., Tardieu, F. (2014). Can current crop models be used in the phenotyping era for predicting the genetic variability of yield of plants subjected to drought or high temperature? J. Exp. Bot. 65 (21), 6179–6189. doi: 10.1093/jxb/eru223
Perez, P., de los Campos, G. (2014). Genome-wide regression and prediction with the BGLR statistical package. Genetics 198, 483–495. doi: 10.1534/genetics.114.164442
Pérez-Enciso, M., Zingaretti, L. M. (2019). A guide on deep learning for complex trait genomic prediction. Genes 10, 553. doi: 10.3390/genes10070553
Pook, T., Freudenthal, J., Korte, A., Simianer, H. (2020). Using local convolutional neural networks for genomic prediction. Front. Genet. 11, 561497. doi: 10.3389/fgene.2020.561497
Qian, L., Hickey, L. T., Stahl, A., Werner, C. R., Hayes, B., Snowdon, R. J., et al. (2017). Exploring and harnessing haplotype diversity to improve yield stability in crops. Front. Plant Sci. 8, 1534. doi: 10.1186/s40035-017-0081-9
Reymond, M., Muller, B., Leonardi, A., Charcosset, A., Tardieu, F. (2003). Combining quantitative trait loci analysis and an ecophysiological model to analyze the genetic variability of the responses of maize leaf growth to temperature and water deficit. Plant Physiol. 131 (2), 664–675. doi: 10.1104/pp.013839
Rincent, R., Charpentier, J. P., Faivre-Rampant, P., Paux, E., Le Gouis, J., Bastien, C., et al. (2018). Phenomic selection is a low-cost and high-throughput method based on indirect predictions: proof of concept on wheat and poplar. G3: Genes Genomes Genet. 8, 3961–3972. doi: 10.1534/g3.118.200760
Rincent, R., Kuhn, E., Monod, H., Oury, F. X., Rousset, M., Allard, V., et al. (2017). Optimization of multi-environment trials for genomic selection based on crop models. Theor. Appl. Genet. 130, 1735–1752. doi: 10.1007/s00122-017-2922-4
Robert, P., Auzanneau, J., Goudemand, E., Oury, F. X., Rolland, B., Heumez, E., et al. (2022). Phenomic selection in wheat breeding: identification and optimisation of factors influencing prediction accuracy and comparison to genomic selection. Theor. Appl. Genet., 1–20. doi: 10.1007/s00122-021-04005-8
Rogers, A. R., Holland, J. B. (2022). Environment-specific genomic prediction ability in maize using environmental covariates depends on environmental similarity to training data. G3 12 (2), jkab440. doi: 10.1093/g3journal/jkab440
Shahi, D., Guo, J., Pradhan, S., Khan, J., Avci, M., Khan, N., et al. (2022). Multi-trait genomic prediction using in-season physiological parameters increases prediction accuracy of complex traits in US wheat. BMC Genomics 23 (1), 298. doi: 10.1186/s12864-022-08487-8
Singh, P., Manure, A. (2020). “Introduction to tensorflow 2.0,” in Learn tensorFlow 2.0 (Apress, Berkeley, CA), 1–24. doi: 10.1007/978-1-4842-5558-2
Song, X., Zhang, T. (2009). Quantitative trait loci controlling plant architectural traits in cotton. Plant Sci. 177, 317–323. doi: 10.1016/j.plantsci.2009.05.015
Technow, F., Messina, C. D., Totir, L. R., Cooper, M. (2015). Integrating crop growth models with whole genome prediction through approximate Bayesian computation. PloS One 10, e0130855. doi: 10.1371/journal.pone.0130855
Tibshirani, R. (1996). Regression shrinkage and selection via the lasso. J. R. Stat. Society: Ser. B (Methodological) 58, 267–288. doi: 10.1111/j.2517-6161.1996.tb02080.x
Tolhurst, D. J., Gaynor, R. C., Gardunia, B., Hickey, J. M., Gorjanc, G. (2022). Genomic selection using random regressions on known and latent environmental covariates. Theor. Appl. Genet. 135, 3393–3415. doi: 10.1007/s00122-022-04186-w
VanRaden, P. M. (2008). Efficient methods to compute genomic predictions. J. dairy Sci. 91, 4414–4423. doi: 10.3168/jds.2007-0980
Verplaetse, N., Passemiers, A., Arany, A., Moreau, Y., Raimondi, D. (2023). Large sample size and nonlinear sparse models outline epistatic effects in inflammatory bowel disease. Genome Biol. 24, 224. doi: 10.1186/s13059-023-03064-y
Widener, S., Graef, G., Lipka, A. E., Jarquin, D. (2021). An assessment of the factors influencing the prediction accuracy of genomic prediction models across multiple environments. Front. Genet. 12, 689319. doi: 10.3389/fgene.2021.689319
Zeigler, B. P. (1987). Hierarchical, modular discrete-event modelling in an object-oriented environment. Simulation 49, 219–230. doi: 10.1177/003754978904900506
Zhu, X., Ni, P., Xing, Q., Wang, Y., Huang, X., Hu, X., et al. (2021). Genomic prediction of growth traits in scallops using convolutional neural networks. Aquaculture 545, 737171. doi: 10.1016/j.aquaculture.2021.737171
Zou, H., Hastie, T. (2005). Regularization and variable selection via the elastic net. J. R. Stat. society: Ser. B (statistical methodology) 67, 301–320. doi: 10.1111/j.1467-9868.2005.00503.x
Keywords: convolutional neural networks, crop growth model, genomic prediction, sorghum, CGM-WGP
Citation: Larue F, Rouan L, Pot D, Rami J-F, Luquet D and Beurier G (2024) Linking genetic markers and crop model parameters using neural networks to enhance genomic prediction of integrative traits. Front. Plant Sci. 15:1393965. doi: 10.3389/fpls.2024.1393965
Received: 11 March 2024; Accepted: 04 July 2024;
Published: 30 July 2024.
Edited by:
Pilar Hernandez, Spanish National Research Council (CSIC), SpainReviewed by:
Cheryl Dalid, University of Florida, United StatesCopyright © 2024 Larue, Rouan, Pot, Rami, Luquet and Beurier. This is an open-access article distributed under the terms of the Creative Commons Attribution License (CC BY). The use, distribution or reproduction in other forums is permitted, provided the original author(s) and the copyright owner(s) are credited and that the original publication in this journal is cited, in accordance with accepted academic practice. No use, distribution or reproduction is permitted which does not comply with these terms.
*Correspondence: Grégory Beurier, Z3JlZ29yeS5iZXVyaWVyQGNpcmFkLmZy
Disclaimer: All claims expressed in this article are solely those of the authors and do not necessarily represent those of their affiliated organizations, or those of the publisher, the editors and the reviewers. Any product that may be evaluated in this article or claim that may be made by its manufacturer is not guaranteed or endorsed by the publisher.
Research integrity at Frontiers
Learn more about the work of our research integrity team to safeguard the quality of each article we publish.