 Jun-Jie Luo
 Hui Shang
 Zhi-Qing Xue
 Ying Wang
 Xi-Ling Dai
 Hui Shen
 Yue-Hong Yan
94% of researchers rate our articles as excellent or good
Learn more about the work of our research integrity team to safeguard the quality of each article we publish.
Find out more
ORIGINAL RESEARCH article
Front. Plant Sci., 08 July 2024
Sec. Plant Systematics and Evolution
Volume 15 - 2024 | https://doi.org/10.3389/fpls.2024.1392990
Introduction: Natural hybridization is common and plays a crucial role in driving biodiversity in nature. Despite its significance, the understanding of hybridization in ferns remains inadequate. Therefore, it is imperative to study fern hybridization to gain a more comprehensive understanding of fern biodiversity. Our study delves into the role of hybridization in shaping fern species, employing Microlepia matthewii as a case study to investigate its origins of hybridization.
Methods: We performed double digest Genotyping-by-sequencing (dd-GBS) on M. matthewii and its potential parent species, identifying nuclear and chloroplast SNPs. Initially, nuclear SNPs were employed to construct the three cluster analysis: phylogenetic tree, principal component analysis, and population structure analysis. Subsequently, to confirm whether the observed genetic mixture pattern resulted from hybridization, we utilized two methods: ABBA-BABA statistical values in the D-suite program and gene frequency covariance in the Treemix software to detect gene flow. Finally, we employed chloroplast SNPs to construct a phylogenetic tree, tracing the maternal origin.
Results and discussion: The analysis of the nuclear SNP cluster revealed that M. matthewii possesses a genetic composition that is a combination of M. hancei and M. calvescens. Furthermore, the analysis provided strong evidence of significant gene flow signatures from the parental species to the hybrid, as indicated by the two gene flow analyses. The samples of M. matthewii cluster separately with M. hancei or M. calvescens on the chloroplast systematic tree. However, the parentage ratio significantly differs from 1:1, suggesting that M. matthewii is a bidirectional and asymmetrical hybrid offspring of M. hancei and M. calvescens.
A significant proportion of identified species have originated from hybridization, with at least 25% of plant species and 10% of animal species, predominantly the youngest ones, being involved in hybridization and potential introgression with other species (Mallet, 2005). Natural hybridization denotes the gene flow between populations that have naturally undergone genetic differentiation under natural conditions (Arnold, 1992 and 1997). It constitutes a pivotal factor in the speciation and evolution of vascular plants (Abbott et al., 2016), particularly in ferns (Barrington et al., 1989; Sigel, 2016), and greatly influence on species diversity. On one hand, hybridization has the potential to lead to the reverse speciation of taxa in the process of species differentiation, giving rise to the formation of extensive hybrid clusters that may contribute to a reduction in species diversity (Seehausen, 2006; Grant and Grant, 2014). Moreover, it has the potential to contribute to the extinction of specific rare species or populations (Balao et al., 2015). On the other hand, natural hybridization is a vital process of speciation to increase species diversity. One mechanism is allopolyploid introgression (Soltis et al., 2014), exemplified by the tetraploid Primula kewensis resulting from the hybridization and genome duplication of two diploid species, P. verticillata and P. floribunda (Ramsey and Schemske, 2002). Another mechanism is autopolyploid hybridization adaptation introgression. For instance, the sunflower (Helianthus annuus) thrives in clayey soils, while its close relative, the prairie sunflower (H. petiolaris), flourishes in sandy soils. Consequently, three natural hybridizations (H. anomalus, H. deserticola, and H. paradoxus) have emerged, each uniquely adapted to a specific environment (Rieseberg, 1991). Therefore, recognizing and identifying these types of hybridization is essential for understanding the origin of species diversity.
Ferns are highly susceptible to natural hybridization due to ineffective reproductive isolation mechanisms (Knobloch, 1976; Barrington et al., 1989). This is evident even between distantly related taxa, exemplified by the natural hybrid offspring Cystocarpium roskamianum. Its parent specie belong to different generas, Cymnocarpium and Cystopteris, and had diverged from each other approximately 60 million years ago (Rothfels et al., 2015). This results in a high proportion of hybridized fern species. A survey in Japan identified 371 interspecific hybrids in addition to the 721 native, non-hybrid taxa comprising the fern and lycophyte flora of Japan (Ebihara and Nitta, 2019). In Hawaii, the number of hybridized species is 37 out of a total of 221 species of fern and fern allies (Palmer, 2003). The identification of fern hybrids is crucial for recognizing fern diversity. However, research on fern hybrids in some areas has been insufficiently executed. For instance, according to the Flora of China (Wu et al., 2013), only 62 fern hybrids have been identified and hypothesized, constituting less than 3% of the total number of 2254. This figure is lower than the preliminary estimate of about 500 naturally hybridized ferns in China by Yan et al. (2016), which was based on conditions in neighboring regions such as Japan and field observations. In recent years, gene fragments from the chloroplast genome, which has been proven to exhibit maternal inheritance in ferns (Gastony and Yatskievych, 1992; Vogel et al., 1998; Guillon and Raquin, 2000), and nuclear genes (exhibiting biparental inheritance) have been utilized to identify the hybrid origin and parentage of many fern species. Examples include Adiantum ×meishanianum (Zhang et al., 2014; Shang et al., 2016), A. ×ailaoshanense (Wang et al., 2015a, b), and Microsorum ×tohieaense (Nitta et al., 2018). In the majority of these studies, hybridization occurred in a unidirectional manner, where either the mother or father was clearly identified as the definite parent, rather than in the opposite direction. Additionally, using molecular markers of biparental inheritance (chloroplast gene rbcL and the nuclear gene pigC), along with the C-value of DNA reflecting cellular ploidy, Hori et al. (2014) revealed reticulate evolutionary relationships among 11 species, including the Dryopteris varia complex and its related species, suggesting that hybridization in ferns is common. Furthermore, Yi et al. (2023) employed restriction-site-associated DNA sequencing (RAD-seq) and integrated phylogenomics and population genomic analyses to investigate the phylogenetic relationships and evolutionary history of 16 scaly tree ferns (Cyatheaceae) from China and Vietnam, which revealed genome-wide evidence for prevalent hybridization not only between closely related species but also between distantly related species from different genera.
Microlepia C. Presl is a member of the Dennstaedtiaceae family, which constitutes one of the six main clades (Suborders) within the Polypodiales order (PPG I, 2016; Du et al., 2021). Dennstaedtiaceae comprises eleven small genera, with only three, namely Microlepia, Hypolepis, and Dennstaedtia, having more than 50 species each (Schwartsburd et al., 2020; Triana-Moreno et al., 2023). Microlepia encompasses a wide range of species with significant morphological diversity, including the 1–4-pinnately compound lamina (Moore, 2010; Yan et al., 2013; Luo, 2018), six different leaf epidermal and stomatal characteristics (van Cotthem, 1970), significant variation in chromosome number (Nakato and Serizawa, 1981; Nakato and Ebihara, 2011), and diverse spore ornamentation, which can be inner lophate or reticulate and outer sericate or capillate (Luo et al., 2018). Hybridization may contribute to the observed high diversity in Microlepia. Several studies (Shang et al., 2015 and 2016; Schwartsburd et al., 2020) have indicated the presence of numerous hybrids based on morphological and chloroplast fragment analyses, and these hybrids may share a maternal plastid genome with morphologically distinguishable species. In the case observed in Microlepia, M. matthewii is found on branches of various other species, while M. krameri and M. herbacea are in similar situations (Wang, 2016; Luo et al., 2018). In this study, we selected M. matthewii as a representative species to investigate the role of hybridization in generating diversity within the Microlepia genus. Morphologically, M. matthewii displays intermediate traits between M. hancei and M. marginata (Figures 1A-H). Additionally, spores of M. matthewii are observed to be deformed and incapable of germination (Luo, 2018). Considering its abnormal chloroplast phylogenetic position, where several samples of M. matthewii clustered with M. hancei while a small number clustered with M. marginata, we hypothesize that M. matthewii may be a hybrid with either M. hancei or M. marginata as the maternal species.
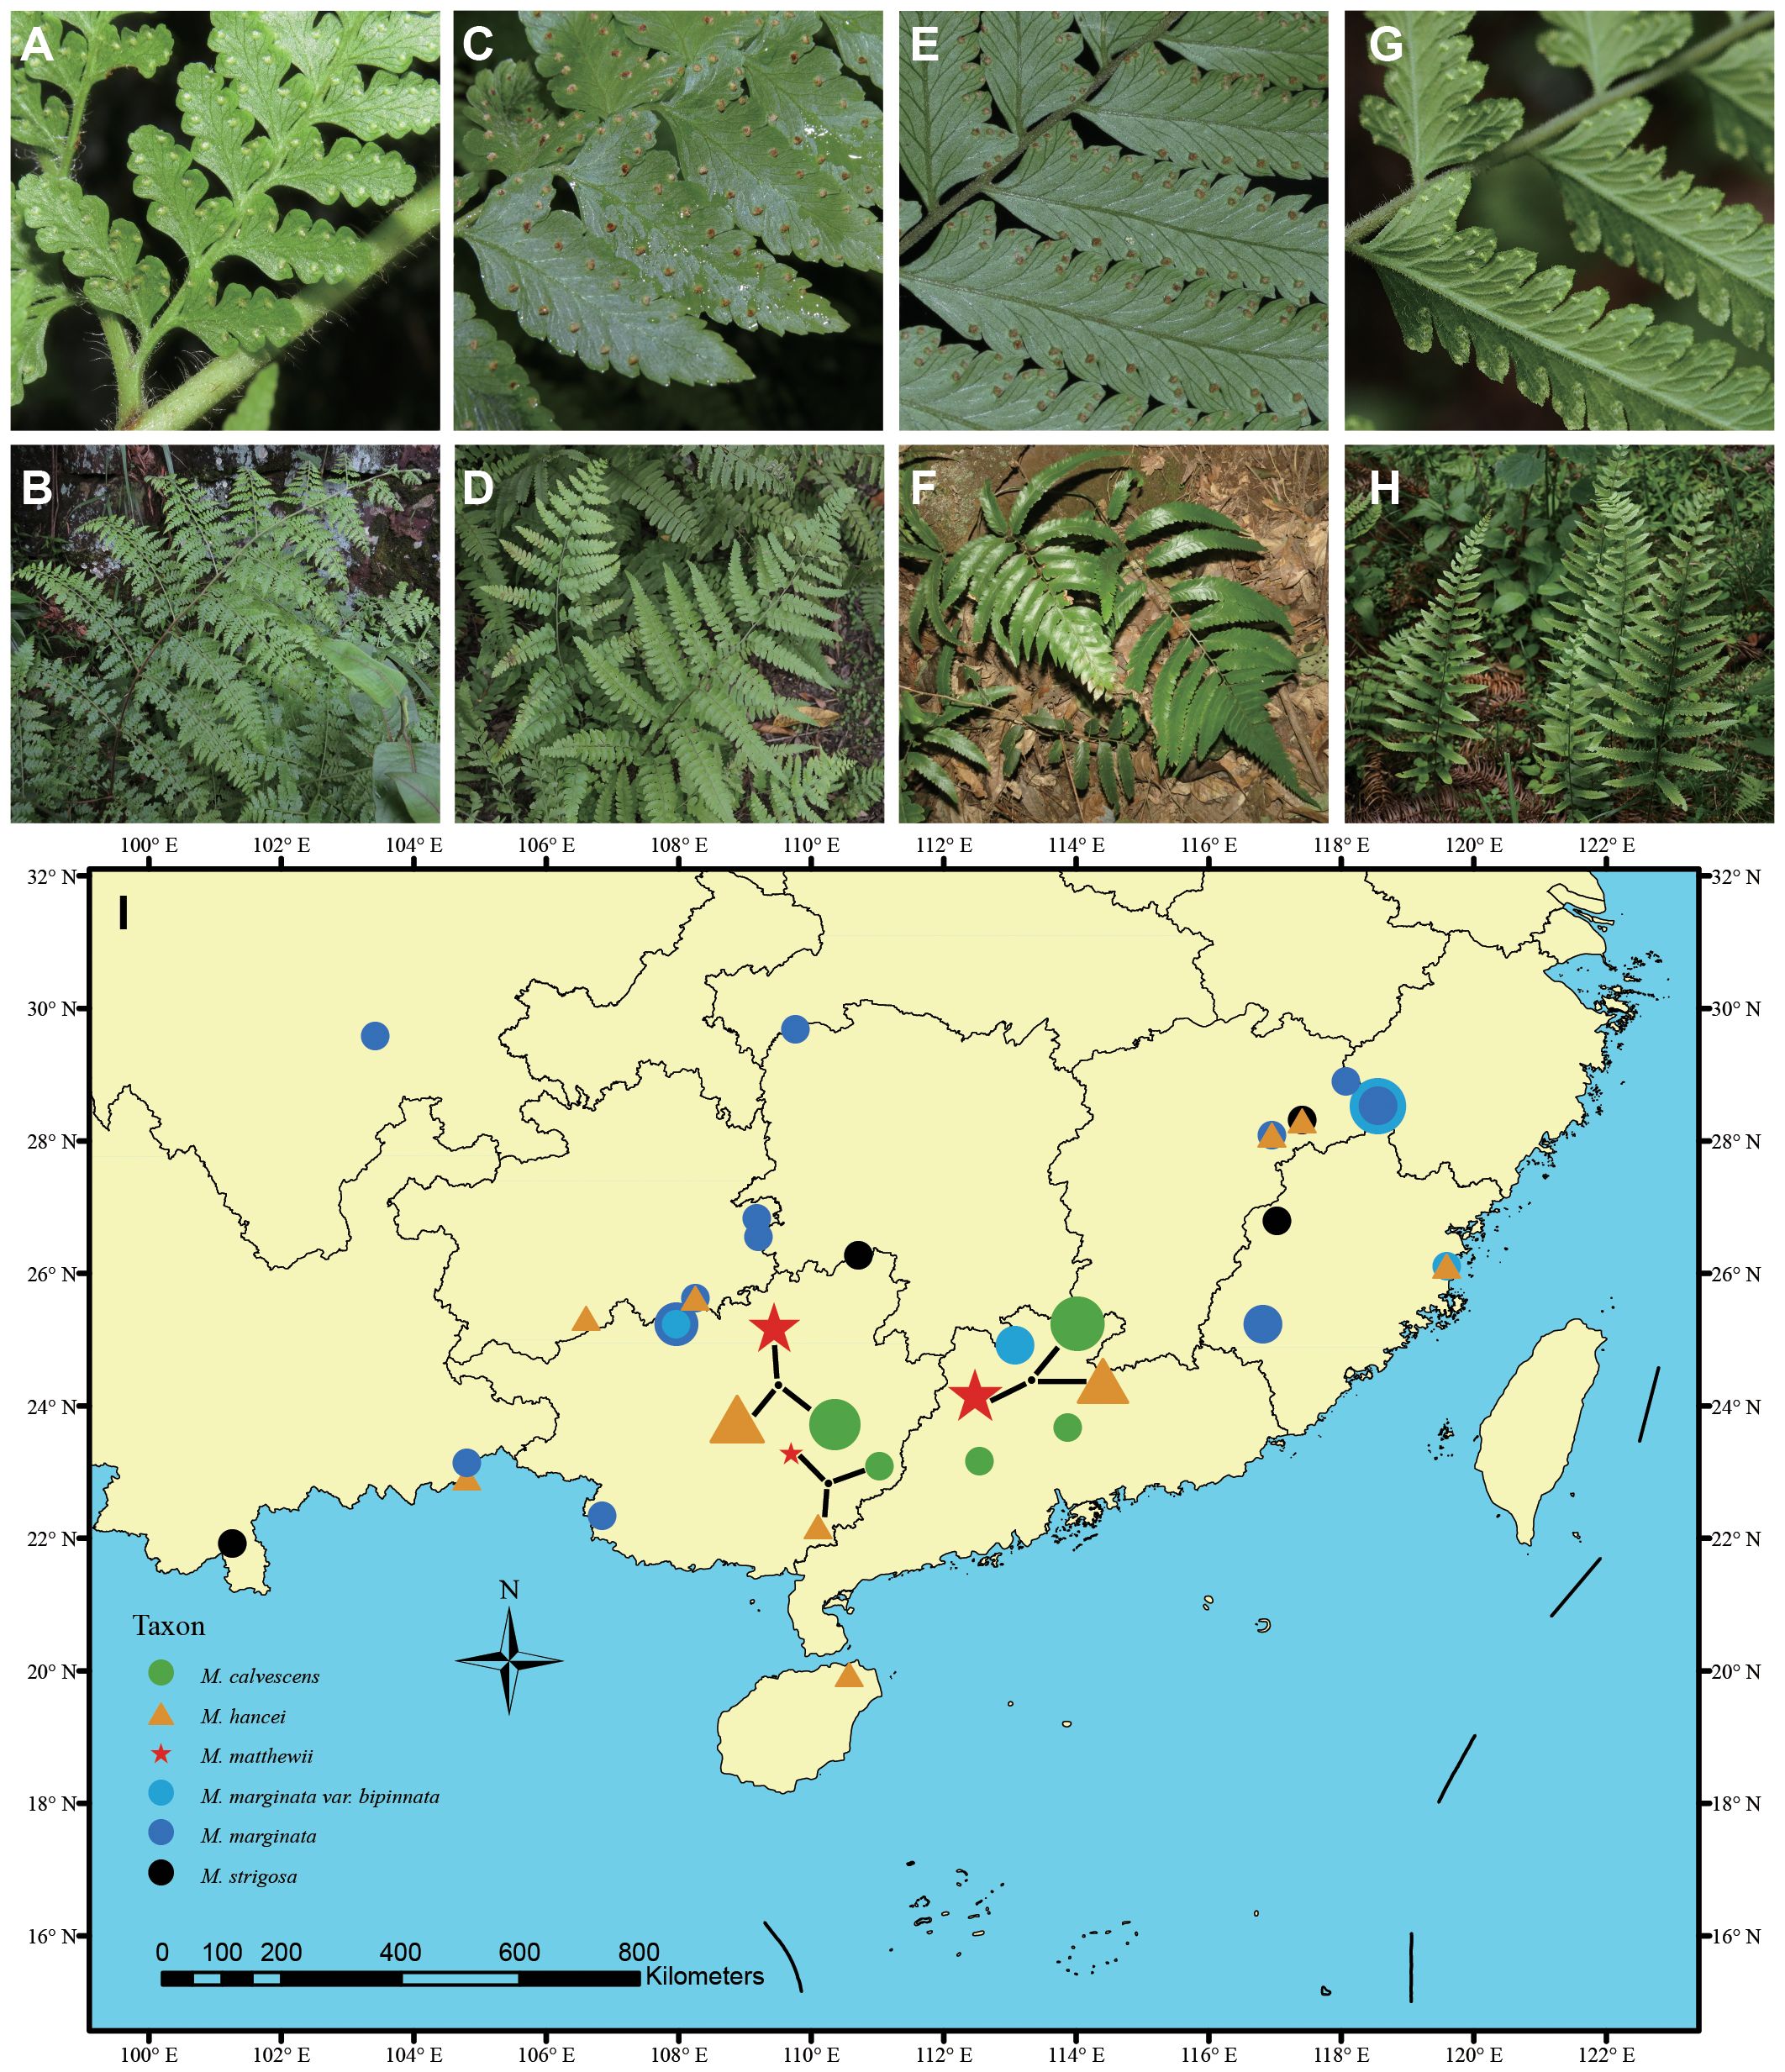
Figure 1 Photos of living plants of hybrid and potential parent species in this study. (A, B) Microlepia hancei. (C, D) M. matthewii. (E, F) M. calvescens. (G, H) M. marginata. Photo credits by Hong-Jin Wei. (I) The sampling map uses different symbols to represent various species, with the size of each symbol indicating the sample size of each population.
However, the chloroplast genome has only a small number of variant sites, exhibits maternal inheritance, and is relatively conserved compared to the entire genome. While some studies have considered nuclear genes (Zhang et al., 2014; Wang et al., 2015a; Shang et al., 2016; Nitta et al., 2018), relying solely on a few gene fragments presents several limitations. These include the inability to detect hybridization beyond F1 generations or minimal introgressive hybridization. Additionally, the selected gene segments often exhibit limited variation, making it challenging to accurately infer the origin of hybrids. Therefore, genetic markers at the whole-genome level are essential. More recently, the use of high-throughput sequencing, including reduced representation genome sequencing (also known as simplified genome sequencing) and genome re-sequencing technologies, has facilitated the detection of hybridization or gene flow. Furthermore, in this study, M. marginata, as the potential parent of M. matthewii, is a complex comprising numerous variations (Yan et al., 2013; Wang and Liu, 2023). However, it cannot be distinguished using several gene fragments alone (Luo et al., 2018). The genomic evidence should be helpful to determine the relationships among the species within this complex, which are not well resolved in the phylogenetic tree based on chloroplast fragments. Overall, in this study, employing a type of simplified genome sequencing—double digest Genotyping-by-sequencing (dd-GBS), we aims to address the scientific questions: 1) is M. matthewii of hybrid origin? And 2) what are the respective paternal and maternal species of M. matthewii?
In this study, we sampled a total 88 material, including 21 individuals of suspected hybrid M. matthewii and its potential parents (19 individuals of M. hancei and 44 individuals of M. marginata) based on the hypotheses outlined in the introduction section of this study and findings from previous research (Wang, 2016; Luo et al., 2018). M. marginata includes the original variant, var. calvescens (sometimes treated as M. calvescens in some literature, e.g. Liu et al., 2016; Wei and Zhang, 2016; Fraser-Jenkins et al., 2017), var. bipinnata, with an additional four individuals of M. strigosa as outgroups based on previous study (Luo et al., 2018). Most samples (60 individuals, 68.2% of the total) were collected at the population level, while the remaining samples were obtained from previous field collections stored in the National Wild Plant Germplasm Resource Center for Shanghai Chenshan Botanical Garden (ZWGX2202). The sampling locations are represented on the map (Figure 1I), and further details regarding the sampling are listed in Supplementary Table S1.
These specimens were field-collected and dried using silica gel. Voucher specimens were curated at Chenshan Herbarium (CSH). DNA extraction from silica gel-dried leaves followed the modified CTAB method, with subsequent determination of DNA concentration and total amount. Samples passing the test proceeded to double digest Genotyping-by-sequencing (dd-GBS) library construction, involving double-enzymatic (Msel-Taqal) digestion and adapter attachment to the cleavage site ends of digested fragments. Primers designed based on adapter sequences were used for fragment amplification. After passing quality control, bipartite sequencing was conducted on the Illumina HiSeq X Ten platform (Illumina, USA), capturing approximately 150 bases of sequence on either end. Raw data underwent adapter trimming and quality screening to obtain clean data. Reads of low quality, including those with more than 40% of nucleotides having a quality value lower than 15, more than 10% of N nucleotides, or a length less than 30bp, were discarded.
The chloroplast and nuclear SNP datasets were obtained separately. To call chloroplast SNPs, we used the published plastid genome of M. marginata (GenBank assembly accession: MT130649; Du et al., 2021) as the reference. The clean data of 88 samples were then mapped to this reference using BWA v.0.7.12-r1039 (Li and Durbin, 2009) with maximal exact matches. The resulting BAM files were directly used in the standard GATK Best Practices workflow to call variants via the GATK HaplotypeCaller algorithm. Default GATK program settings were applied to filter the variants, and InDel variants were excluded from our study. In the end, we obtained 4649 chloroplast SNPs.
Nuclear SNPs were called by assembling the retained clean reads using the de novo assembly pipeline Stacks v2.1 (Rochette et al., 2019), and before calling, reads that could be mapped to the chloroplast reference were excluded. We required at least six identical reads (option –m 6) to create a stack for each individual using ustacks. A catalog of all loci across populations was then constructed using cstacks. After matching each sample against the catalog with sstacks, tsv2bam and gstacks were executed to incorporate paired-end reads, identify, and phase the SNPs. The variant call format (VCF) of called variants was exported using populations. The final dataset for subsequent analysis was filtered by vcftools with a minor allele frequency of 0.01, a maximum missing rate of 0.5, and a minimum depth of five. In the end, we obtained 1274 nuclear SNPs.
Phylogenetic trees were constructed from a nuclear SNP dataset using maximum likelihood (ML) concatenation analysis. The best-fit nucleotide substitution models were selected based on the Bayesian information criterion (BIC) using ModelFinder (Kalyaanamoorthy et al., 2017) implemented in IQTREE v2 (Nguyen et al., 2015). IQTREE was executed with the ascertainment bias correction (+ASC) model (Lewis, 2001) for the nuclear SNP dataset, and 1000 ultrafast bootstrap replicates were performed.
Population structure analysis was performed using ADMIXTURE v1.3.0 (Alexander et al., 2009). The number of pre-defined genetic clusters ranged from K = 1 to K = 7, determined based on the number of species and presumed genetic components, and adjusted according to the final results. The best-fitting model was determined using cross-validation (CV) error.
Plink v2.0 (Purcell et al., 2007) was applied to conduct principal component analysis (PCA) on the nuclear SNPs. Each sample was plotted based on the first two principal components (PCs), and the resulting figure was generated using R 4.1.3 with the ggplot2 package (https://ggplot2.tidyverse.org).
To assess historical introgression between species in the nuclear genome, we employed Patterson’s D-statistic (ABBA-BABA statistics; Durand et al., 2011) in the Dsuite program (Malinsky et al., 2021) and gene frequency covariance in the treemix software (Pickrell and Pritchard, 2012).
For Treemix analysis, the vcf file was obtained using vcftools and converted to the Treemix format using a Python script (https://github.com/wk8910/bio_tools/tree/master/03.treemix, accessed on 7 May 2023). Then, the analysis was conducted incrementally, considering pre-defined numbers of migration events (1-5) using the software Treemix. The increase in explained variation was compared for each number of migration events to infer the best result. The tree for the best result was visualized in R 4.1.3.
In Dsuite analysis, we assessed admixture across the M. hancei to M. marginata complex utilizing Patterson’s D (Green et al., 2010; Durand et al., 2011) and the f-branch (fb) statistic (Malinsky et al., 2018) with Dsuite v0.4r38 (Malinsky et al., 2021). To determine Dmin, representing the minimum allele sharing for all trios of ingroup lineages (n = 5), we employed Dtrios from Dsuite with the SNP dataset and the treemix phylogeny, irrespective of any assumptions about the tree topology. The fb statistic with Fbranch from Dsuite summarized rates of introgression. The generated “.tree” file by Dtrios and the treemix phylogeny were employed, and resulting fb statistics were plotted on the treemix phylogeny using “dtools.py”. M. strigosa served as the out-group.
Phylogenetic analyses of the chloroplast SNP dataset were conducted employing three different methods: maximum parsimony (MP), maximum likelihood (ML), and Bayesian Inference (BI). These analyses were performed using PAUP * 4.0b10 (Swofford, 2003), RAxML-HPC (Stamatakis, 2006), and MrBayes v3.2.5 (Huelsenbeck and Ronquist, 2001; Ronquist et al., 2012), respectively.
The ML analyses were performed using RAxML-HPC (Stamatakis, 2006) with ML tree searches and bootstrapping. The default model of -m GTRCAT was applied, along with 1000 rapid bootstrap analyses. A one-time search for the best-scoring tree was conducted (Stamatakis et al., 2006).
The MP analyses were carried out in PAUP* ver. 4.0b10 (Swofford, 2003) with 1000 tree-bisection-reconnection (TBR) searches. One thousand replicates were performed, each with 10 TBR searches, and a maximum of 100 trees were held per TBR search.
The best-fitting likelihood model for Bayesian analyses was chosen based on the Bayesian information criterion using jModeltest2 (Darriba et al., 2012). Bayesian inference (BI) was performed using MrBayes 3.2.5 (Huelsenbeck and Ronquist, 2001; Ronquist et al., 2012). We executed two independent runs, each employing four chains – one cold and three heated. The temperature parameter was set at 0.2, and the transition/transversion rate ratio was designated as beta, while the priors remained at their default settings. At the outset of each run, a random tree was initialized, and subsequently, every 1000 generations, a single tree was sampled, totaling 10,000,000 generations. The evaluation of convergence and stationarity was conducted using Tracer version 1.4 (Rambaut and Drummond, 2007), and to ensure the convergence of runs, the initial 25% of trees were discarded as burn-in. Subsequently, the remaining trees were employed to compute posterior probabilities (PP) for the majority-rule consensus topology.
The G-test was used to test the parentage ratio of the 21 individuals of the suspected hybrid M. matthewii (whether the ratio of M. calvescens: hancei significantly deviation from the expected 1:1 ratio). This analysis was conducted using the RVAideMemoire package (Herve, 2023) in R 4.1.3.
Furthermore, Bayesian Species Delimitation analyses (BFD) were conducted using the chloroplast SNP dataset to assess whether M. calvescens is a distinct species compared to other M. marginata variants, without considering hybridization. The nexus file was used to create the BFD input xml files in BEAUti v.2.4.5 (Bouckaert et al., 2014). We tested five different species assignment models, either combining the variants of M. marginata differently or treating them as distinct units. The BFD analyses were executed in SNAPP v.1.2.5 (Bryant et al., 2012), utilizing 12 initialization steps and chain-lengths of one million for each clade model. The remaining settings followed the guidelines set forth by Brandrud et al. (2020).
On the nuclear SNP phylogenetic tree (Figure 2A), the samples of M. hancei, M. marginata (excluding M. calvescens) and M. calvescens formed monophyletic groups separately (therefore, in the following text, any reference to M. marginata will exclude M. calvescens). However, M. matthewii did not form a monophyletic clade.
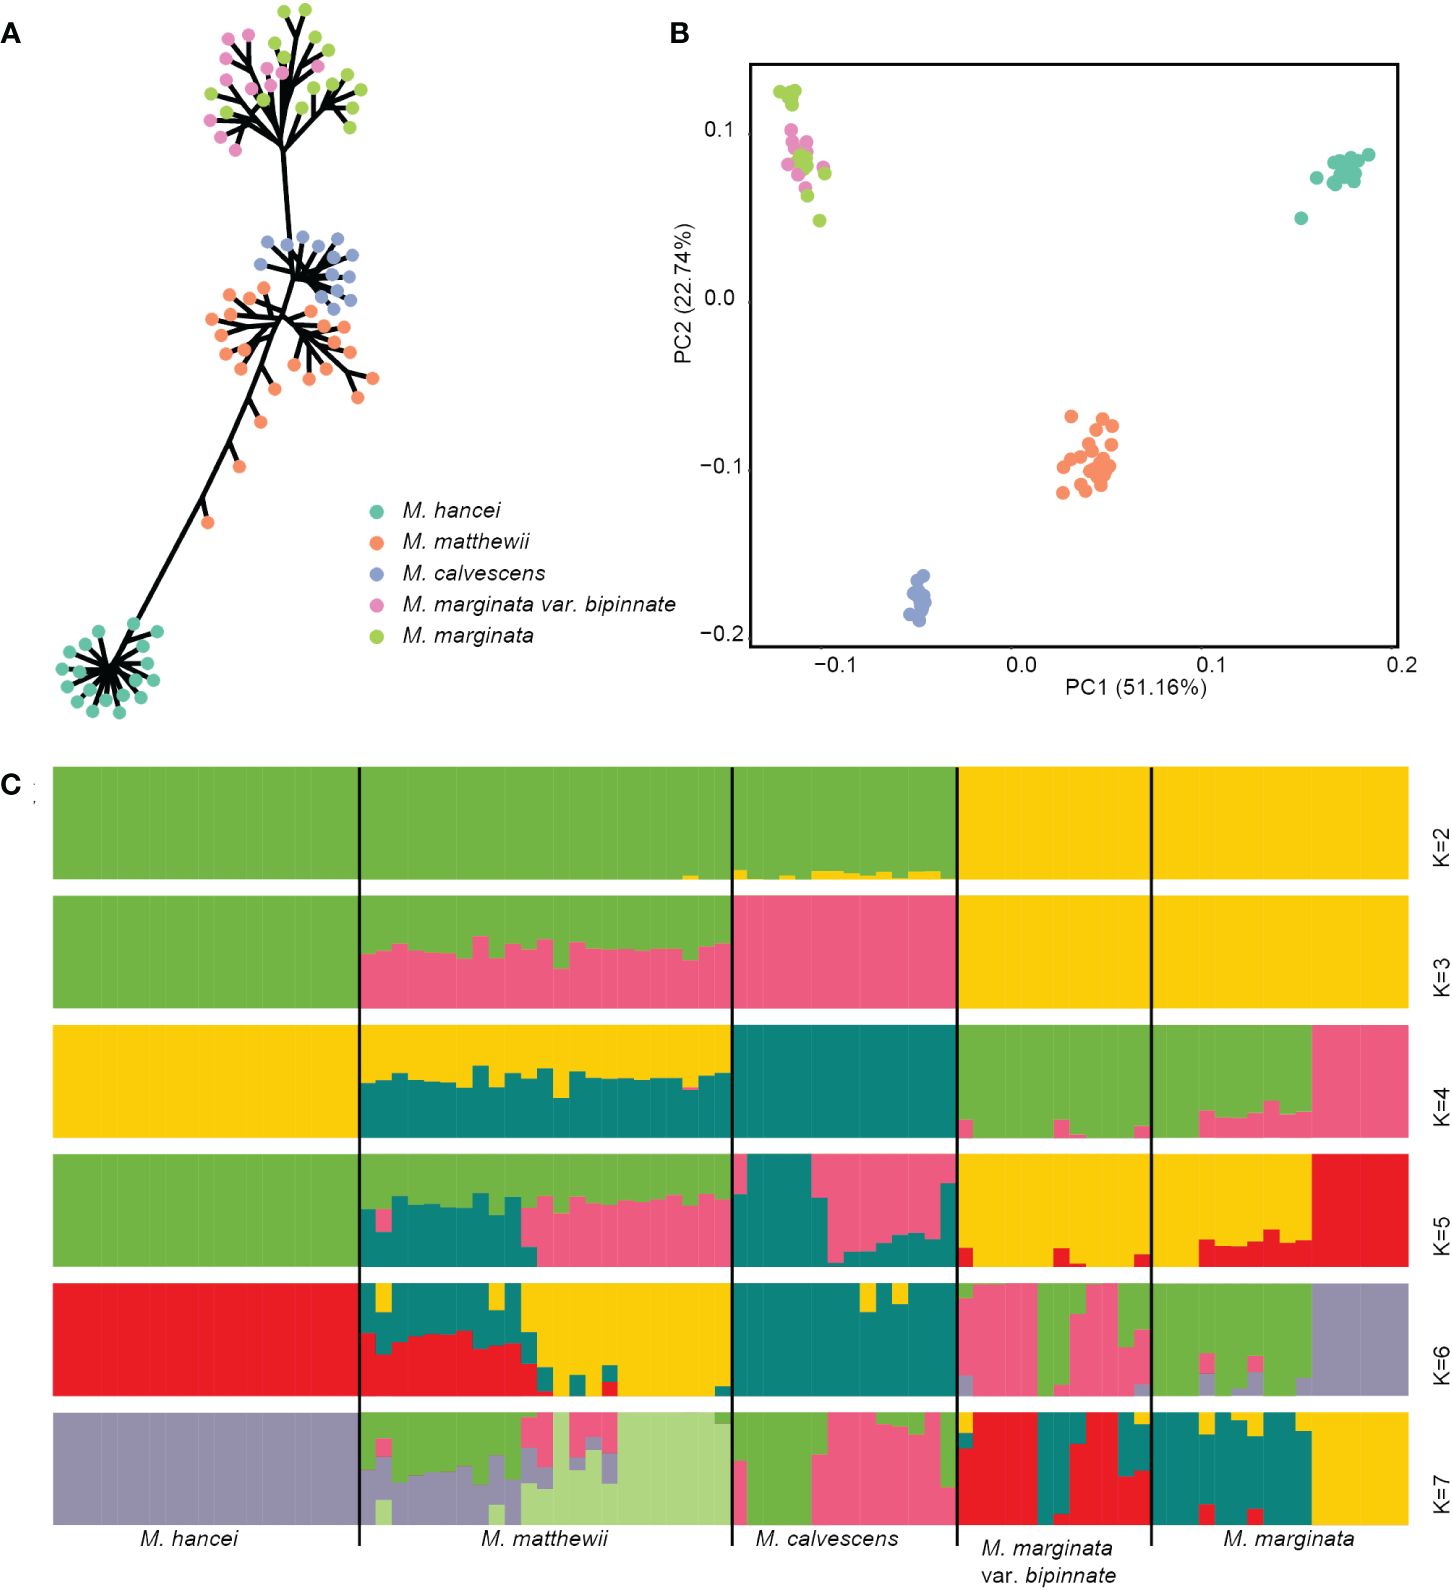
Figure 2 Genetic cluster based nuclear SNPs of four Microlepia species in this study. (A) Phylogenetic tree (unrooted). (B) PCA plot. Different colors representing different species in (A, B). (C) Genetic structure output from admixture. The length of each colored segment represents the proportion of the individual’s genome from K = 2 to 7 ancestral genetic groups. The samples are grouped by species and are depicted with different colors representing different genetic components.
The PCA analysis demonstrated a clear separation of the 84 individuals into four lineages on the first two axes (PCs), which accounted for 73.9% of the total variation (see Supplementary Figure S1A). These lineages corresponded to M. hancei, M. marginata, M. calvescens, and M. matthewii (positioned between M. calvescens and M. hancei) (Figure 2B).
The admixture analysis confirmed the patterns observed in PCA (Figure 2C), especially at K = 3, effectively distinguishing M. hancei, M. marginata, M. calvescens, and M. matthewii as a mixture of M. hancei and M. calvescens. The result at K = 4 showed a division of M. marginata into two genetic components. However, based on the CV error, K = 5 was determined as the optimal value (see Supplementary Figure S1B), leading to the further division of M. calvescens into two genetic components. Conversely, all M. marginata variations except M. calvescens grouped together in the K = 2 and K = 3 results.
The ABBA-BABA tests revealed that three out of the ten tested four-taxon phylogenies, considering triplets involving M. matthewii and M. hancei, showed a significant signal of introgression (P < 0.05, non-zero D-statistics) (Table 1). D-statistics ranged from 0.88 to 0.92 for all the significant tests. Additionally, one gene flow from M. hancei to M. matthewii was identified on the f-branch (fb) statistic plot (Figure 3A).
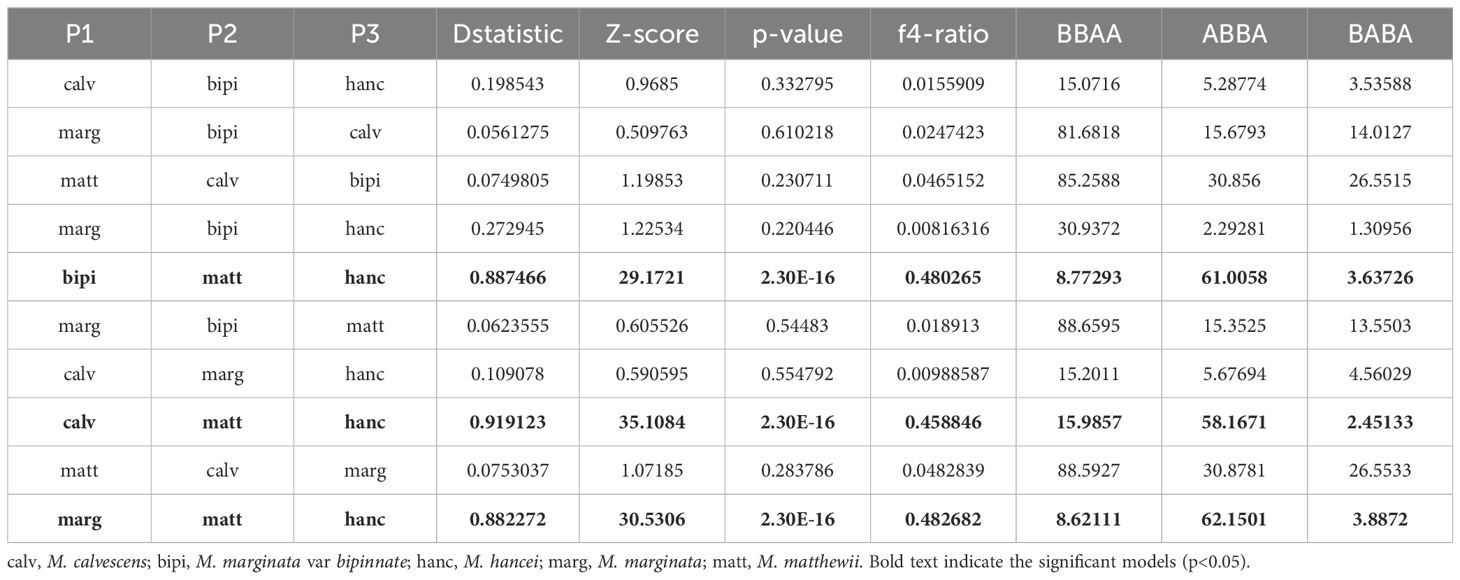
Table 1 D-statistics and F4-ratios from Dsuite for all species trios in this study.
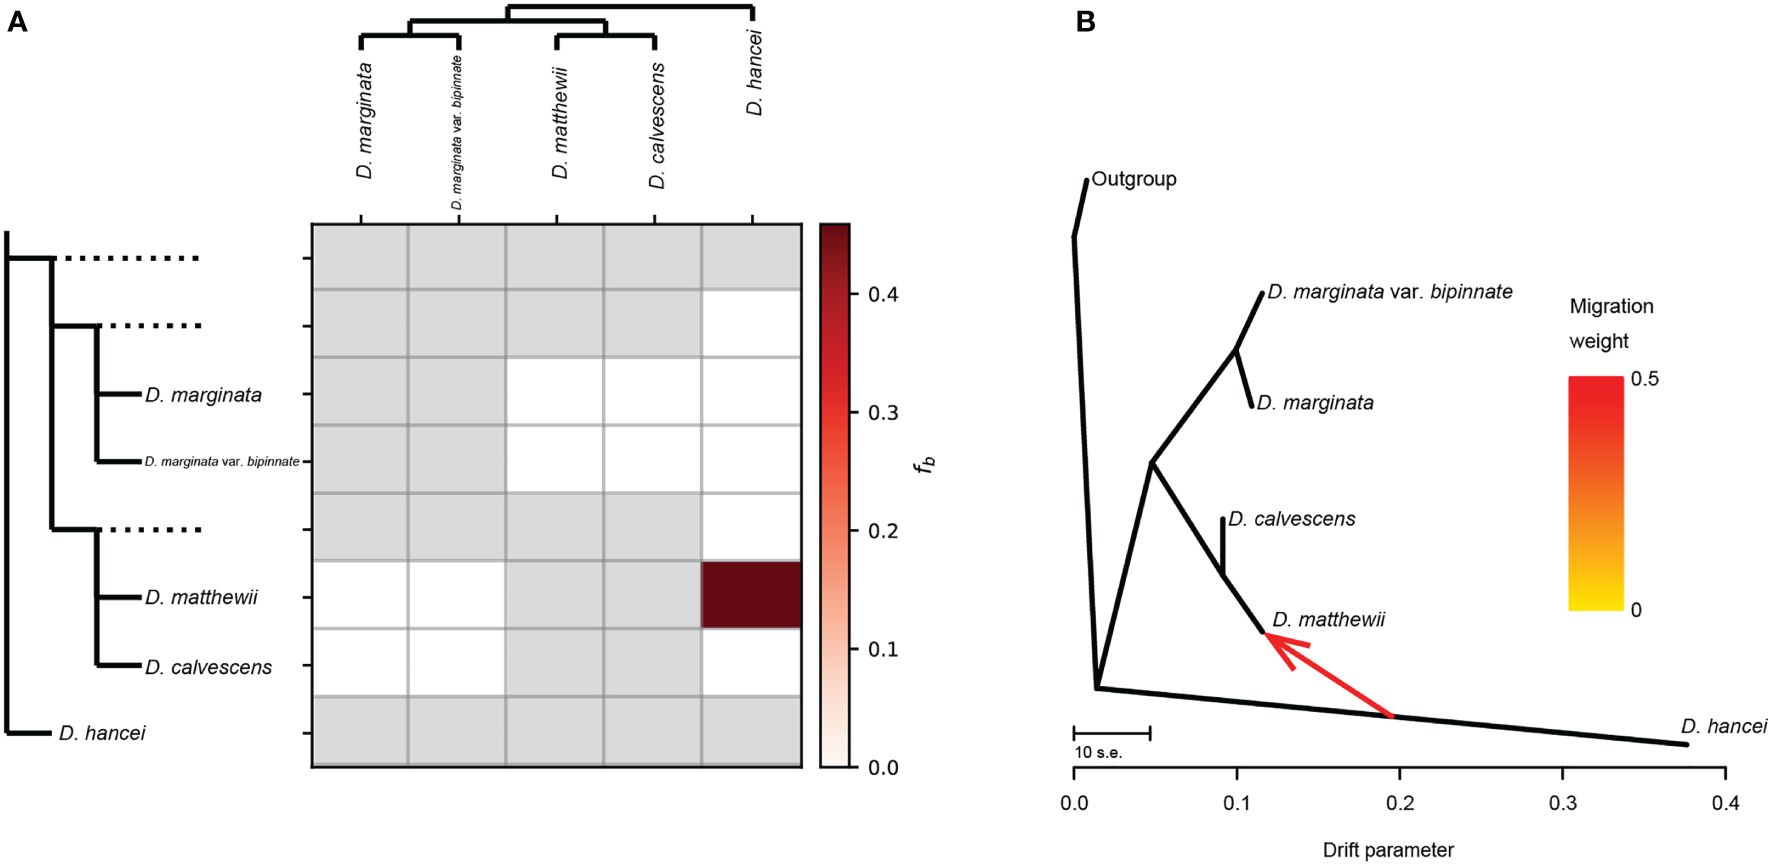
Figure 3 Gene flow between Microlepia species in this study. (A) Gene flow signals detected by Dsuite. The heatmap shows the magnitude of the fb ratio between each branch (left) and the sample (top). Grey squares indicate comparisons that cannot be made. (B) Gene flow depicted as the maximum-likelihood tree produced in Treemix.
The general topology of the Treemix ML tree (Figure 3B) was consistent with the phylogenetic relationship recovered from the other phylogenetic analysis. One migration event between the M. matthewii and M. hancei improved with the explained variation from the initial 96% (with zero migration events allowed) to 99.96% (with one migration event allowed). The variation of further migration events (two to four) are 99.98%, 99.99% and 100%. As a max explained variation improving, the scenario with only one migration event was chosen to be the best model.
By employing the chloroplast genome of M. marginata as a reference, a comprehensive set of 4,649 SNP loci was acquired. Subsequent tree construction using various methodologies, including maximum parsimony, maximum likelihood, and Bayesian methods, consistently revealed similar topologies (Figure 4). Excluding outgroups, three well-supported monophyletic lineages were identified within the inner group. M. calvescens constituted a distinct monophyletic group, while the other variants of M. marginata formed a sister group without M. calvescens, representing a separate monophyletic lineage. The third monophyletic lineage comprised M. hancei.
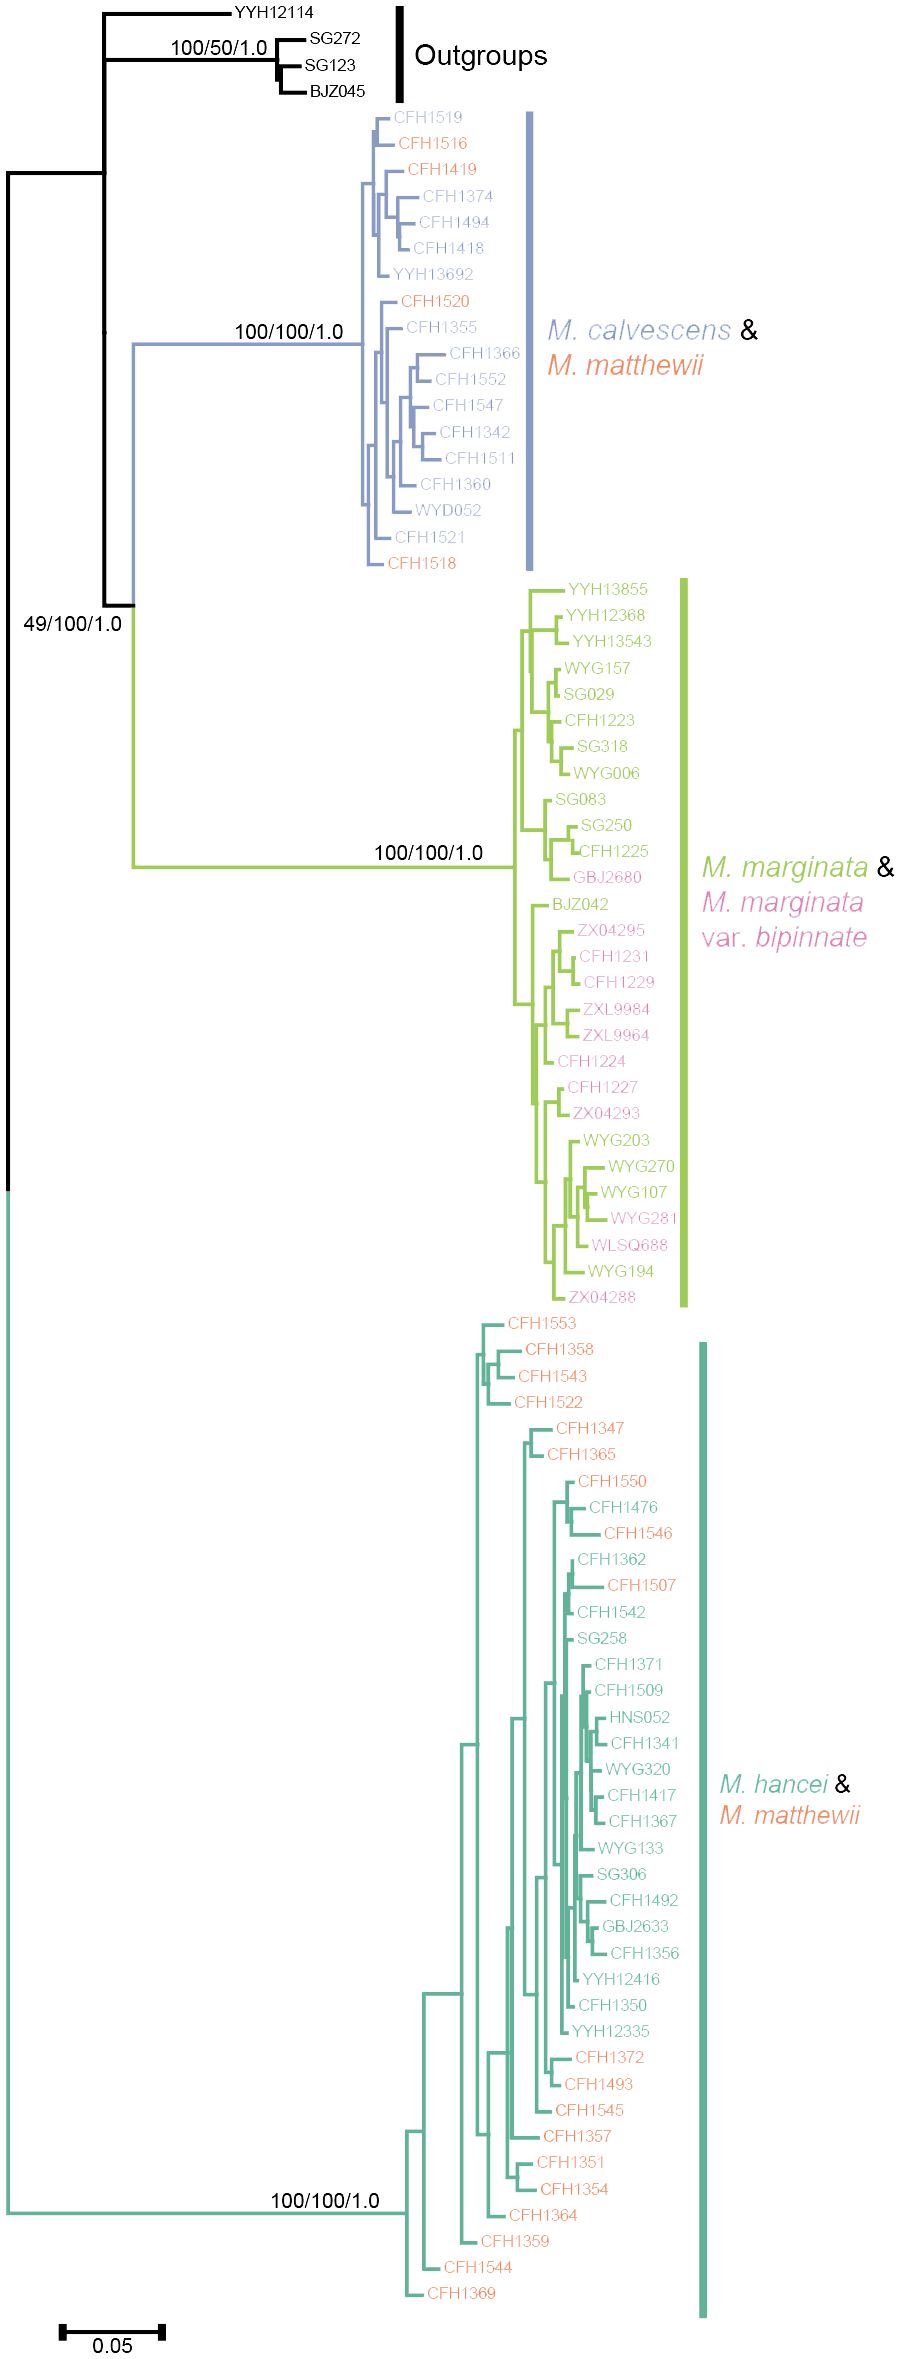
Figure 4 Phylogenetic tree based chloroplast SNPs. Different colors representing different species same as Figures 2A, B.
The two most optimal models identified in the Bayesian Species Delimitation (BFD) analyses both supported the topology in which M. calvescens is considered a distinct species, separate from other M. marginata variants, as indicated by the maximum marginal likelihood estimates (MLE) shown in Table 2. The MLEs of the first and second optimal models were very close (Δ<10), and significantly higher (Δ>1000) than that of the third-ranked model.
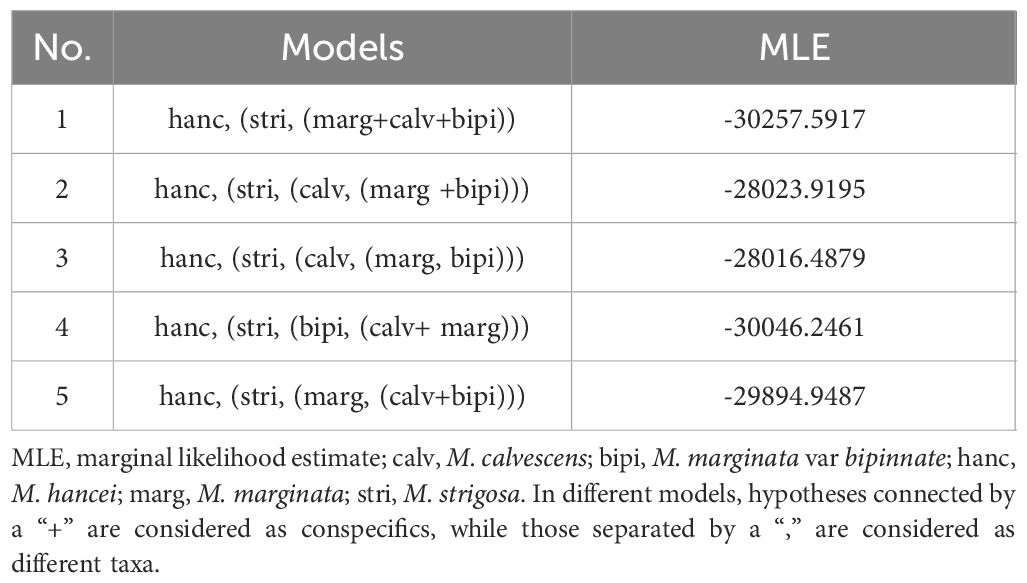
Table 2 Results of Bayesian Species Delimitation analyses (BFD) in this study.
Within these lineages, four individuals in M. matthewii clustered in the clade of M. calvescens, while the remaining 17 individuals clustered in the M. hancei clade, resulting in a significant deviation from the expected 1:1 ratio (G test: G= 8.6618, P= 0.003249).
The three cluster analyses conducted in this study—phylogeny, structural analyses, and PCA—clearly depict a mixture pattern for M. matthewii, suggesting the possibility of it being a hybrid species. Further details are discussed below:
The result of admixture analyses for K = 2 didn’t agree with the phylogenetic tree, as the M. marginata complex separated first, and M. hancei, M. calvescens and M. matthewii clustered together in another group. In many studies, the first run of structure at K = 2 tends to be the earliest of the two major branches to be separated or not genetically mixed (e.g., Yi et al., 2023) and often exists as the optimal K (e.g., Chattopadhyay et al., 2019; Xue et al., 2021; Encinas-Viso et al., 2022) because there are generally much longer branch lengths between the two main clades than within them. However, in this study, M. calvescens did not cluster with its closest relative on the phylogenetic tree, M. marginata, but instead with M. hancei at K = 2. This may be attributed to strong gene flow between M. calvescens and M. hancei, causing the two, along with their hybrid offspring, to cluster into a single genetic component first. Additionally, the CV error of K = 2 is very high and not optimal, predicting the implausibility of the structure.
The outcome from K = 3 indicates that M. calvescens forms a unique evolutionary cluster on the structure diagram, suggesting it should be classified as a distinct species. The remaining variants of M. marginata, including the original variant, var. bipinnata, and so forth, appear identical. The phylogenetic tree verifies the separation of M. calvescens and the other M. marginata varieties as two independent sister groups, both forming monophyletic clusters. Additionally, the principal component analysis (PCA) results indicate that M. calvescens and other M. marginata variants constitute two distinct groups.
The results of K = 4 for M. marginata reveal two distinct genetic groups, implying further differentiation within the species M. marginata or among these variants. However, the genetic groups do not correspond to the variants, suggesting that the differentiation is incomplete or ongoing and there is no evidence of new species arising at the present stage. And the results of PCA also did not support differentiation, with all individuals clustered together closely. Although some individuals in M. marginata are slightly separated on the PCA plot, consistent with the results of K = 4, they are so close that M. marginata is still considered a clustered entity.
The results of K = 5 for M. calvescens also reveal two distinct genetic groups, but this is not supported by the PCA, where all the plots clustered together.
Although the optimal K value is five with the lowest CV error value, the CV error values for K values ranging from three to six are very close to each other (Supplementary Figure S1, 0.28398, 0.27836, 0.26708, and 0.27742). Based on the results of the PCA and phylogenetic tree, K = 3 appears to be the most appropriate choice. Most importantly, the findings from K = 3 to K = 5 analyses reveal two significant points: 1) M. calvescens constitutes a distinct genetic component separate from other M. marginata variants, consistent with both the phylogeny and BFD analyses; 2) The presence of a mixture of M. calvescens and M. hancei genetic components in M. matthewii suggests a potential hybridization event between these two species. This speculation is also supported by the fact that M. matthewii lies between M. calvescens and M. hancei on the PCA plot.
Hybridization, involving gene flow between species, can lead to a mixed genetic structure. However, it is not the only cause. Two other mechanisms, namely ghost admixture and recent bottleneck effects, can also result in a mixed pattern (Lawson et al., 2018). Therefore, classical methods such as phylogeny, structural analyses, and PCA are currently insufficient for fully identifying instances of species hybridization. Gene flow assays are necessary tools that must be employed to augment these methods.
Therefore, we employed two methods to calculate gene flow to test whether the mixed pattern of M. matthewii is caused by hybridization. One of them, treemix, is based on gene frequency covariance. The presence of gene flow is indicated if the actual value is less than the estimated value, as gene flow can reduce gene frequency covariance. In the treemix analysis, gene flow from M. hancei to M. calvescens was detected, and M. matthewii and M. calvescens were clustered as sister groups on the maximum likelihood tree. This same gene flow was confirmed by the Dsuit results, using the ABBA-BABA principle, finally confirming that M. matthewii is a hybridization between M. hancei and M. calvescens.
By employing phylogenetic analysis using chloroplast SNPs to determine the parentage of M. matthewii, we discovered evidence of bidirectional and asymmetrical hybridization. The chloroplast phylogenetic analysis showed that most hybrids clustered with M. hancei, while a few clustered with M. calvescens. This suggests that both M. hancei and M. calvescens could be maternal or potential paternal parents of M. matthewii. This different from the numerous fern hybridizations with defined parents proved in previous studies, such as A. meishanianum, a hybrid with A. menglianense as father and A. malesianum as mother (Zhang et al., 2014; Shang et al., 2016).Therefore, it is likely that M. matthewii is a product of bi-directional hybridization involving M. hancei and M. calvescens.
Furthermore, it was observed that despite the minimal contribution of plastid genetics, offspring resulting from the two types of hybridization still displayed morphological differences. For instance, M. matthewii, with M. calvescens as its mother, exhibited longer petioles (Luo, 2018). This bidirectional hybridization may have further enriched biodiversity. Similar to M. matthewii, samples of M. krameri are positioned on the branches of both M. hancei and M. marginata in the chloroplast phylogenetic tree (Luo et al., 2018). This positioning suggests a potential bi-directional hybridization between these two species. However, further verification is required through the collection of additional material.
Out of the 21 hybrid offspring detected, 17 had M. hancei as the mother, while only 4 had M. calvescens. This resulted in a ratio of 4.25:1, significantly deviating from the expected 1:1 ratio. This type of asymmetrical hybridization has been previously reported in hybridization studies of two North American Dryopteris hybrids. For example, a 7.1:1 ratio of carthusiana: intermedia genome inheritance was found for D. × triploidea, and a 3.6:1 cristata: intermedia ratio was detected for D. × boottii. These deviations were driven by an array of reproductive traits, such as archegonial neck canals and spermatozoids (Testo et al., 2015).
The data presented in the study are deposited in the NCBI Sequence Read Archive (SRA, PRJNA1081188), accession numbers can be found in Supplementary Table S1.
JL: Data curation, Formal Analysis, Investigation, Methodology, Writing – original draft, Writing – review & editing. HSha: Formal Analysis, Funding acquisition, Methodology, Project administration, Visualization, Writing – original draft, Writing – review & editing. ZX: Formal Analysis, Methodology, Software, Writing – review & editing. YW: Conceptualization, Resources, Writing – review & editing. XD: Resources, Supervision, Writing – review & editing. HShe: Project administration, Resources, Writing – review & editing. YY: Conceptualization, Funding acquisition, Project administration, Supervision, Writing – review & editing.
The author(s) declare financial support was received for the research, authorship, and/or publication of this article. This study was supported by a grant from the National Natural Science Foundation of China (NSFC) to YY (#31370234) and the Shanghai Municipal Administration of Forestation and City Appearances (G242419, G242409, G222405).
We express our gratitude to Yan Xiao, Morigengaowa, Yu-Feng Gu, Xi-Le Zhou, Hong-Jin Wei, Li He, Hao Wang, Xiao-Feng Zhu, Guo-Hua Zhao, Dong-Mei Jin, Bin Chen, Bin Shen, Yong-Xin Su, Xin Zhong, Xiao-Chen Li and Bin-Jie Ge for their assistance in field investigation or analysis. Special thanks go to Hong-Jin Wei for sharing images. We also thank the curators of CSH for granting access to the material in their care. The study received additional support from the National Wild Plant Germplasm Resource Center for Shanghai Chenshan Botanical Garden (ZWGX2202). Gratitude is extended to ChatGPT for its invaluable aid in enhancing the language of the manuscript.
The authors declare that the research was conducted in the absence of any commercial or financial relationships that could be construed as a potential conflict of interest.
All claims expressed in this article are solely those of the authors and do not necessarily represent those of their affiliated organizations, or those of the publisher, the editors and the reviewers. Any product that may be evaluated in this article, or claim that may be made by its manufacturer, is not guaranteed or endorsed by the publisher.
The Supplementary Material for this article can be found online at: https://www.frontiersin.org/articles/10.3389/fpls.2024.1392990/full#supplementary-material
Supplementary Figure 1 | (A) the variance contribution of each principal component in the PCA analysis; (B) the cross-validation error for each K in the admixture analysis.
Supplementary Table 1 | The NCBI accession number, taxon identification (Latin name), specimen voucher and Location for the samples in this study.
Abbott, R. J., Barton, N. H., Good, J. M. (2016). Genomics of hybridization and its evolutionary consequences. Mol. Ecol. 25, 2325–2332. doi: 10.1111/mec.13685
Alexander, D. H., Novembre, J., Lange, K. (2009). Fast model-based estimation of ancestry in unrelated individuals. Genome Res. 19, 1655–1664. doi: 10.1101/gr.094052.109
Arnold, M. L. (1992). Natural hybridization as an evolutionary process. Annu. Rev. Ecol. Evol. Syst. 37, 237–261. doi: 10.1146/annurev.ecolsys.23.1.237
Arnold, M. L. (1997). Natural Hybridization and Evolution (Oxford: Oxford University Press). doi: 10.1093/oso/9780195099744.001.0001
Balao, F., Casimiro-Soriguer, R., Luis, G. C. J., Terrab, A., Talavera, S. (2015). Big thistle eats the little thistle: does unidirectional introgressive hybridization endanger the conservation of Onopordum hinojense? New Phytol. 206, 448–458. doi: 10.1111/nph.13156
Barrington, D. S., Haufler, C. H., Werth, C. R. (1989). Hybridization, reticulation, and species concepts in the ferns. Am. Fern J. 79, 55–64. doi: 10.2307/1547160
Bouckaert, R., Heled, J., Kühnert, D., Vaughan, T., Wu, C.-H., Xie, D., et al. (2014). BEAST 2: a software platform for bayesian evolutionary analysis. PloS Comput. Biol. 10, e1003537. doi: 10.1371/journal.pcbi.1003537
Brandrud, M. K., Baar, J., Lorenzo, M. T., Athanasiadis, A., Bateman, R. M., Chase, M. W., et al. (2020). Phylogenomic relationships of diploids and the origins of allotetraploids in dactylorhiza (orchidaceae). Syst. Biol. 69, 91–109. doi: 10.1093/sysbio/syz035
Bryant, D., Bouckaert, R., Felsenstein, J., Rosenberg, N., Roychoudhury, A. (2012). Inferring species trees directly from biallelic genetic markers: bypassing gene trees in a full coalescent analysis. Mol. Biol. Evol. 29, 1917–1932. doi: 10.1093/molbev/mss086
Chattopadhyay, B., Garg, K. M., Soo, Y. J., Low, G. W., Frechette, J. L., Rheindt, F. E. (2019). Conservation genomics in the fight to help the recovery of the critically endangered Siamese crocodile Crocodylus siamensis. Mol. Ecol. 28, 936–950. doi: 10.1111/mec.15023
Darriba, D., Taboada, G. L., Doallo, R., Posada, D. (2012). jModelTest 2: more models, new heuristics and high-performance computing. Nat. Methods 9, 772. doi: 10.1038/nmeth.2109
Du, X.-Y., Lu, J.-M., Zhang, L.-B., Wen, J., Kuo, L.-Y., Mynssen, C. M., et al. (2021). Simultaneous diversification of Polypodiales and angiosperms in the Mesozoic. Cladistics 37, 518–539. doi: 10.1111/cla.12457
Durand, E. Y., Patterson, N., Reich, D., Slatkin, M. (2011). Testing for ancient admixture between closely related populations. Mol. Biol. Evol. 28, 2239–2252. doi: 10.1093/molbev/msr048
Ebihara, A., Nitta, J. H. (2019). An update and reassessment of fern and lycophyte diversity data in the Japanese Archipelago. J. Plant Res. 132, 723–738. doi: 10.1007/s10265-019-01137-3
Encinas-Viso, F., Morin, L., Raghu, S., Knerr, N., Roux, C., Broadhurst, L. (2022). Population genomics reveal multiple introductions and admixture of Sonchus oleraceus in Australia. Divers. Distrib. 28, 1951–1965. doi: 10.1111/ddi.13597
Fraser-Jenkins, C. R., Gandhi, K. N., Kholia, B. S., Benniamin, A. (2017). An Annotated Checklist of Indian Pteridophytes Vol. 1 (Dehra Dun: BSMPS), 1–562.
Gastony, G. J., Yatskievych, G. (1992). Maternal inheritance of the chloroplast and mitochondrial genomes in cheilanthoid ferns. Am. J. Bot. 79, 716–722. doi: 10.1002/j.1537-2197.1992.tb14613.x
Grant, P. R., Grant, B. R. (2014). Evolutionary biology: speciation undone. Nature 507, 178–179. doi: 10.1038/507178b
Green, R. E., Krause, J., Briggs, A. W., Maricic, T., Stenzel, U., Kircher, M., et al. (2010). A draft sequence of the neandertal genome. Science 328, 710–722. doi: 10.1126/science.1188021
Guillon, J.-M., Raquin, C. (2000). Maternal inheritance of chloroplasts in the horsetail Equisetum variegatum (Schleich.). Curr. Genet. 37, 53–56. doi: 10.1007/s002940050008
Herve, M. (2023). RVAideMemoire: Testing and Plotting Procedures for Biostatistics. R package version 0.9-83-7. Available online at: https://CRAN.R-project.org/package=RVAideMemoire.
Hori, K., Tono, A., Fujimoto, K., Kato, J., Ebihara, A., Watano, Y., et al. (2014). Reticulate evolution in the apogamous Dryopteris varia complex (Dryopteridaceae, subg. Erythrovariae, sect. Variae) and its related sexual species in Japan. J. Plant Res. 127, 661–684. doi: 10.1007/s10265-014-0652-0
Huelsenbeck, J. P., Ronquist, F. (2001). MRBAYES: Bayesian inference of phylogenetic trees. Bioinformatics 17, 754–755. doi: 10.1093/bioinformatics/17.8.754
Kalyaanamoorthy, S., Minh, B. Q., Wong, T. K., Von Haeseler, A., Jermiin, L. S. (2017). ModelFinder: fast model selection for accurate phylogenetic estimates. Nat. Methods 14, 587–589. doi: 10.1038/nmeth.4285
Knobloch, I. W. (1976). Pteridophyte hybrids. Publ. Mus. Michigan State Univ., Biol. Ser. 5. 273–352.
Lawson, D. J., Van Dorp, L., Falush, D. (2018). A tutorial on how not to over-interpret STRUCTURE and ADMIXTURE bar plots. Nat. Commun. 9, 3258. doi: 10.1038/s41467-018-05257-7
Lewis, P. O. (2001). A likelihood approach to estimating phylogeny from discrete morphological character data. Syst. Biol. 50, 913–925. doi: 10.1080/106351501753462876
Li, H., Durbin, R. (2009). Fast and accurate short read alignment with Burrows–Wheeler transform. Bioinf. (Oxford) 25, 1754–1760. doi: 10.1093/bioinformatics/btp324
Liu, H. L., Cheng, M. E., Peng, D. Y. (2016). New records of distribution of medical plants in Anhui province. China J. Chin. Mat. Med. 41, 1358–1360. doi: 10.4268/cjcmm20160732
Luo, J. J. (2018). Natural hybridization origin of Microlepia matthewii complex (Shanghai: Shanghai Normal University), 1–92.
Luo, J. J., Wang, Y., Shang, H., Zhou, X. L., Wei, H. J., Huang, S. N., et al. (2018). Phylogeny and systematics of the genus Microlepia (Dennstaedtiaceae) based on palynology and molecular evidence. Chin. Bull. Bot. 53, 782–792. doi: 10.11983/CBB17258
Malinsky, M., Matschiner, M., Svardal, H. (2021). Dsuite - Fast D-statistics and related admixture evidence from VCF files. Mol. Ecol. Resour. 21, 584–595. doi: 10.1111/1755-0998.13265
Malinsky, M., Svardal, H., Tyers, A. M., Miska, E. A., Genner, M. J., Turner, G. F., et al. (2018). Whole-genome sequences of Malawi cichlids reveal multiple radiations interconnected by gene flow. Nat. Ecol. Evol. 2, 1940–1955. doi: 10.1038/s41559-018-0717-x
Mallet, J. (2005). Hybridization as an invasion of the genome. Trends Ecol. Evol. 20, 229–237. doi: 10.1016/j.tree.2005.02.010
Moore, S. J. (2010). A monograph on the genus Microlepia of Dennstaedtiaceae (Taipei: Taiwan Normal University), 1–198.
Nakato, N., Ebihara, A. (2011). Chromosome number of Microlepia hookeriana (Dennstaedtiaceae) and chromosome number evolution in the genus Microlepia. Bull. Natl. Mus. Nat. Sci. Ser. B (Botany) 37, 75–78.
Nakato, N., Serizawa, S. (1981). Chromosome numbers of the genus Microlepia in Japan with description of a new hybrid. J. Jap. Bot. 56, 161–168.
Nguyen, L. T., Schmidt, H. A., Von Haeseler, A., Minh, B. Q. (2015). IQ-TREE: a fast and effective stochastic algorithm for estimating maximum-likelihood phylogenies. Mol. Biol. Evol. 32, 268–274. doi: 10.1093/molbev/msu300
Nitta, J. H., Amer, S., Davis, C. C. (2018). Microsorum ×tohieaense (Polypodiaceae), a new hybrid fern from French Polynesia, with implications for the taxonomy of Microsorum. Syst. Bot. 43, 397–413. doi: 10.1600/036364418X697166
Pickrell, J. K., Pritchard, J. K. (2012). Inference of population splits and mixtures from genome-wide allele frequency data. PloS Genet. 8, e1002967. doi: 10.1038/npre.2012.6956.1
PPG I (2016). A community-derived classification for extant lycophytes and ferns. J. Syst. Evol. 54, 563–603. doi: 10.1111/jse.12229
Purcell, S., Neale, B., Todd-Brown, K., Thomas, L., Ferreira, M. A., Bender, D., et al. (2007). PLINK: a tool set for whole-genome association and population-based linkage analyses. Am. J. Hum. Genet. 81, 559–575. doi: 10.1086/519795
Rambaut, A., Drummond, A. J. (2007). Tracer 1.4. Available online at: http://beast.bio.ed.ac.uk/Tracer.
Ramsey, J., Schemske, D. W. (2002). Neopolyploidy in flowering plants. Annu. Rev. Ecol. Syst. 33, 589–639. doi: 10.1146/annurev.ecolsys.33.010802.150437
Rieseberg, L. H. (1991). Homoploid reticulate evolution in Helianthus (Asteraceae): evidence from ribosomal genes. Am. J. Bot. 78, 1218–1237. doi: 10.1002/j.1537-2197.1991.tb11415.x
Rochette, N. C., Rivera-Colón, A. G., Catchen, J. M. (2019). Stacks 2: Analytical methods for paired-end sequencing improve RADseq-based population genomics. Mol. Ecol. 28, 4737–4754. doi: 10.1111/mec.15253
Ronquist, F., Teslenko, M., van der Mark, P., Ayres, D. L., Darling, A., Höhna, S., et al. (2012). MrBayes 3.2: efficient Bayesian phylogenetic inference and model choice across a large model space. Syst. Biol. 61, 539–542. doi: 10.1093/sysbio/sys029
Rothfels, C. J., Johnson, A. K., Hovenkamp, P. H., Swofford, D. L., Roskam, H. C., Fraser-Jenkins, C. R., et al. (2015). Natural hybridization between genera that diverged from each other approximately 60 million years ago. Am. Nat. 185, 433–442. doi: 10.1086/679662
Schwartsburd, P. B., Perrie, L. R., Brownsey, P., Shepherd, L. D., Shang, H., Barrington, D. S., et al. (2020). New insights into the evolution of the fern family Dennstaedtiaceae from an expanded molecular phylogeny and morphological analysis. Mol. Phylogenet. Evol. 150, 106881. doi: 10.1016/j.ympev.2020.106881
Seehausen, O. (2006). Conservation: losing biodiversity by reverse speciation. Curr. Biol. 16, R334–R337. doi: 10.1016/j.cub.2006.03.080
Shang, H., Ma, Q. X., Yan, Y. H. (2015). Dryopteris shiakeana (Dryopteridaceae): A new fern from Danxiashan in Guangdong, China. Phytotaxa 218, 156–162. doi: 10.11646/phytotaxa.218.2.5
Shang, H., Wang, Y., Zhu, X. F., Zhao, G. H., Wang, F. H., Lu, J. M., et al. (2016). Likely allopatric origins of Adiantum× meishanianum (Pteridaceae) through multiple hybridizations. J. Syst. Evol. 54, 528–534. doi: 10.1111/jse.12205
Sigel, E. M. (2016). Genetic and genomic aspects of hybridization in ferns. J. Syst. Evol. 54, 638–655. doi: 10.1111/jse.12226
Soltis, D. E., Visger, C. J., Soltis, P. S. (2014). The polyploidy revolution then and now: Stebbins revisited. Am. J. Bot. 101, 1057–1078. doi: 10.3732/ajb.1400178
Stamatakis, A. (2006). RAxML-VI-HPC: maximum likelihood-based phylogenetic analyses with thousands of taxa and mixed models. Bioinformatics 22, 2688–2690. doi: 10.1093/bioinformatics/btl446
Swofford, D. (2003). PAUP*. Phylogenetic Analysis Using Parsimony (*and Other Methods). Version 4.0b10 (Sunderland, MA, USA: Sinauer Associates).
Testo, W. L., Watkins, J. E., Jr., Barrington, D. S. (2015). Dynamics of asymmetrical hybridization in North American wood ferns: reconciling patterns of inheritance with gametophyte reproductive biology. New Phytol. 206, 785–795. doi: 10.1111/nph.13213
Triana-Moreno, L. A., Yañez, A., Kuo, L. Y., Rothfels, C. J., Pena, N. T. L., Schwartsburd, P. B., et al. (2023). Phylogenetic revision of Dennstaedtioideae (Dennstaedtiaceae: Polypodiales) with description of Mucura, gen. nov. Taxon 72, 20–46. doi: 10.1002/tax.12858
van Cotthem, W. (1970). “Comparative morphological study of the stomata in the Filicopsida,” in Bulletin du Jardin botanique national de Belgique/Bulletin van de Nationale Plantentuin van Belgie. 40, 81–88. doi: 10.2307/3667713
Vogel, J. C., Russell, S. J., Rumsey, F. J., Barrett, J. A., Gibby, M. (1998). Evidence for maternal transmission of chloroplast DNA in the genus Asplenium (Aspleniaceae, Pteridophyta). Bot. Acta 111, 247–249. doi: 10.1111/j.1438-8677.1998.tb00704.x
Wang, Y. (2016). Molecular phylogeny of the genus Microlepia (Dennstaedtiaceae) (Shanghai: Shanghai Normal University), 1–107.
Wang, R. X., Liu, L. (2023). Leaf epidermis micromorphology characters of 18 species of Microlepia from China and its taxonomic significance. Guihaia 43, 1793–1804. doi: 10.11931/guihaia.gxzw202211065
Wang, Y., Shang, H., Gu, Y., Wei, H., Zhao, G., Yan, Y. (2015a). A new cryptic hybrid species of Adiantum L.(Pteridaceae) identified by nuclear and chloroplast DNA sequences. Chin. Sci. Bull. (Chinese Version) 60, 922–932. doi: 10.1360/N972014-00891
Wang, Y., Shang, H., Zhou, X. L., Zhao, G. H., Dai, X. L., Yan, Y. H. (2015). Adiantum ×ailaoshanense (Pteridaceae), a new natural hybrid from Yunnan, China. Phytotaxa 236, 266–272. doi: 10.11646/phytotaxa.236.3.7
Wei, X. P., Zhang, X. C. (2016). Distributional patterns of the monolete and trilete ferns in China. Biodiv. Sci. 24, 1129. doi: 10.17520/biods.2016219
Wu, Z. Y., Raven, P. H., Hong, D. Y. (2013). Flora of China, volumes 2–3, Lycopodiaceae through Polypodiaceae (Beijing: Science Press; St. Louis: Missouri Botanical Garden Press).
Xue, Z., Greimler, J., Paun, O., Ford, K. A., Barfuss, M. H., Chiapella, J. O. (2021). The evolutionary history of New Zealand Deschampsia is marked by long-distance dispersal, endemism, and hybridization. Biology 10, 1001. doi: 10.3390/biology10101001
Yan, Y. H., Qi, X. P., Zhang, X. C. (2013). “Dennstaedtiaceae,” in Flora of China, vol. 2–3 . Eds. Wu, Z. Y., Raven, P. H., Hong, D. Y. (Beijing: Science Press; St. Louis: Missouri Botanical Garden Press), 147–168.
Yan, Y. H., Zhang, X. C., Zhou, X. L., Sun, J. Q. (2016). Species catalogue of China—Pteridophytes (Beijing: Science Press).
Yi, H., Dong, S., Yang, L., Wang, J., Kidner, C., Kang, M. (2023). Genome-wide data reveal cryptic diversity and hybridization in a group of tree ferns. Mol. Phylogenet. Evol. 184, 107801. doi: 10.1016/j.ympev.2023.107801
Keywords: dd-GBS, dennstaedtiaceae, gene flow, pteridophyte, SNPs, species diversity
Citation: Luo J-J, Shang H, Xue Z-Q, Wang Y, Dai X-L, Shen H and Yan Y-H (2024) Genome-wide data reveal bi-direction and asymmetrical hybridization origin of a fern species Microlepia matthewii. Front. Plant Sci. 15:1392990. doi: 10.3389/fpls.2024.1392990
Received: 28 February 2024; Accepted: 20 June 2024;
Published: 08 July 2024.
Edited by:
Xiaohua Jin, Chinese Academy of Sciences (CAS), ChinaReviewed by:
Hengchang Wang, Chinese Academy of Sciences (CAS), ChinaCopyright © 2024 Luo, Shang, Xue, Wang, Dai, Shen and Yan. This is an open-access article distributed under the terms of the Creative Commons Attribution License (CC BY). The use, distribution or reproduction in other forums is permitted, provided the original author(s) and the copyright owner(s) are credited and that the original publication in this journal is cited, in accordance with accepted academic practice. No use, distribution or reproduction is permitted which does not comply with these terms.
*Correspondence: Hui Shen, c2hlbmh1aUBjZW1wcy5hYy5jbg==; Yue-Hong Yan, eWh5YW5Ac2licy5hYy5jbg==
†These authors have contributed equally to this work and share first authorship
Disclaimer: All claims expressed in this article are solely those of the authors and do not necessarily represent those of their affiliated organizations, or those of the publisher, the editors and the reviewers. Any product that may be evaluated in this article or claim that may be made by its manufacturer is not guaranteed or endorsed by the publisher.
Research integrity at Frontiers
Learn more about the work of our research integrity team to safeguard the quality of each article we publish.