
94% of researchers rate our articles as excellent or good
Learn more about the work of our research integrity team to safeguard the quality of each article we publish.
Find out more
ORIGINAL RESEARCH article
Front. Plant Sci., 19 April 2024
Sec. Crop and Product Physiology
Volume 15 - 2024 | https://doi.org/10.3389/fpls.2024.1386109
This article is part of the Research TopicNovel Ways and Methodologies to Improve Crop YieldView all 20 articles
 Tao Zhong1†
 Jinxia Zhang1*†
 Liangliang Du1Lin Ding2Rui Zhang1Xingrong Liu3Fangfang Ren1Meng Yin1Runheng Yang1Pengliang Tian1Kaiyuan Gan1Tian Yong1Qirun Li1Fuqiang Li1Xuan Li1
Compared to conventional irrigation and fertilization, the Water-fertilizer coupling can significantly enhance the efficiency of water and fertilizer utilization, thereby promoting crop growth and increasing yield. Targeting the challenges of poor crop growth, low yield, and inefficient water and fertilizer utilization in the arid region of northwest China under conventional irrigation and fertilization practices. Therefore, a two-year on-farm experiment in 2022 and 2023 was conducted to study the effects of water-fertilizer coupling regulation on pumpkin growth, yield, water consumption (ET), and water and fertilizer use efficiency. Simultaneously the comprehensive evaluation of multiple objectives was carried out using principal component analysis (PCA) methods, so as to propose an suitable water-fertilizer coupling regulation scheme for the region. The experiment was set up as a two-factor trial using water-fertilizer integration technology under three irrigation volume (W1 = 37.5 mm, W2 = 45.5 mm, W3 = 52.5mm) and three organic fertilizer application amounts (F1 = 3900-300 kg ha-1, F2 = 4800-450 kg·ha-1, F3 = 5700-600 kg·ha-1), with the traditional irrigation and fertilization scheme from local farmers as control treatments (CK). The results indicated that irrigation volume and organic fertilizer application significantly affected pumpkin growth, yield, and water and fertilizer use efficiency (P<0.05). Pumpkin yield increased with increasing irrigation volume. Increasing organic fertilizer levels within a certain range benefited pumpkin plant growth, dry matter accumulation, and yield, however, excessive application beyond a certain level had inhibited effects on those. The increased fertilizer application under the same irrigation volume enhanced the efficiency of water and fertilizer utilization. However excessive irrigation only resulted in inefficient water consumption, reducing the water and fertilizer use efficiency. The Comprehensive evaluation by PCA revealed that the F2W3 treatment outperformed all the others, effectively addressing the triple objectives of increasing production, improving efficiency, and promoting green production. Therefore, F2W3 (Irrigation volume: 52.5 mm; Fertilizer application amounts: 4800-450 kg/ha-1) as a water and fertilizer management scheme for efficient pumpkin production in the arid region of northwest China.
Pumpkin, is an annual herb with a long cultivation history and wide distribution. China is the largest producer and consumer in the world. According to the latest FAO statistics, global pumpkin production in 2021 reached 2.38 million tons, with China accounting for 31.2% at 0.74 million tons (FAO, 2021). Due to its rich raw materials and health benefits, pumpkins offer great economic advantages (Rico et al., 2020; Zeng et al., 2023).
In the traditional planting process, over-irrigation and fertilization are common, leading to the waste of water and fertilizer resources and a decline in crop yield (Wang et al., 2021), thus restricting the sustainable development of the pumpkin planting industry. Therefore, it is great significant to carry out the research on reasonable water-fertilizer coupling regulation of pumpkin for its green and efficient production.
Water-fertilizer coupling effect is defined as the impact of the interaction relationship between nitrogen (N), phosphorus (P), potassium (K) and other elements contained in water and fertilizers (Cheng et al., 2023; Liu et al., 2023), which on crop growth and development, yield formation and its water-fertilizer use efficiency, in agricultural ecosystems (Liu et al., 2019). That can be classified into positive effect of mutual reinforcing (i.e., synergistic effect), negative effect of mutual offsetting (i.e., antagonistic effect), and the effect of no avail, the sum of the effects of each system (i.e., superimposed effect) (Yu et al., 2019). The use of water-fertilizer coupling technology practice in production can achieve the best combination of water and fertilizer (Koc and Nzokou, 2023), which is a powerful measure to promote high-quality sustainable development of farmland (Zhang et al., 2017a). A scientific and reasonable water and fertilizer management system can not only improve crop water consumption and water and fertilizer use efficiency (Cai et al., 2023; Wu et al., 2023), but also holds significant academic significance and practical value for improving crop yield (Dou et al., 2022; Huang et al., 2023).
In summary, although there have been many studies on water-fertilizer coupling effect at present, but most of them are focused on wheat, fruit trees, corn, and other crops (Chen et al., 2016; Li et al., 2023). Research on the mechanism of water-fertilizer coupling effect on the physiological growth, yield and water-fertilizer use efficiency of pumpkin is still vacant or not yet fully explored, which is very important for the research on green and efficient production of pumpkin. In this paper, to adequately fill the knowledge gap in the study, we focus on the potential of water-fertilizer coupling regulation to replace the traditional irrigation and fertilization scheme for yield increase and efficiency in pumpkin, will be explored in depth. Specifically, by a two-year field trial, this research would be conducted to study the regulation mechanism of different water-fertilizer coupling schemes on the physiological growth, yield and water-fertilizer use efficiency of pumpkin in the northwest arid region. Moreover, it will be also combined with principal component analysis, correlation analysis and cluster analysis to seek the optimal water-fertilizer scheme, so that the goals of increased yield and efficiency, green production, on pumpkin in the region, can be achieved.
The experiment was conducted in 2022 and 2023 at Minqin Irrigation Experimental Station of Gansu Research Institute for Water Resources, China (103°08´ E, 38°37´ N). The experimental geographic location is shown in Figure 1. The station is in Dongda Village, Datan Township, about 13.5 km north of Minqin County, Gansu Province, which is situated at the junction of the oasis and the Tengger Desert. With an average elevation of 1400m, it belongs to a typical continental desert climate. The soil used for the test is clay loam at a depth of 0~60cm, and gradually changes to sandy loam below 60cm, with an average dry bulk weight, specific gravity, porosity, field water holding capacity, and permanent wilting point of 1.54 g·cm-3, 2.61 g·cm-3, 42.80%, 35.42%, and 7.65% in the 0-100cm soil, respectively. The available water content of 0-60cm soil was 144.45mm.
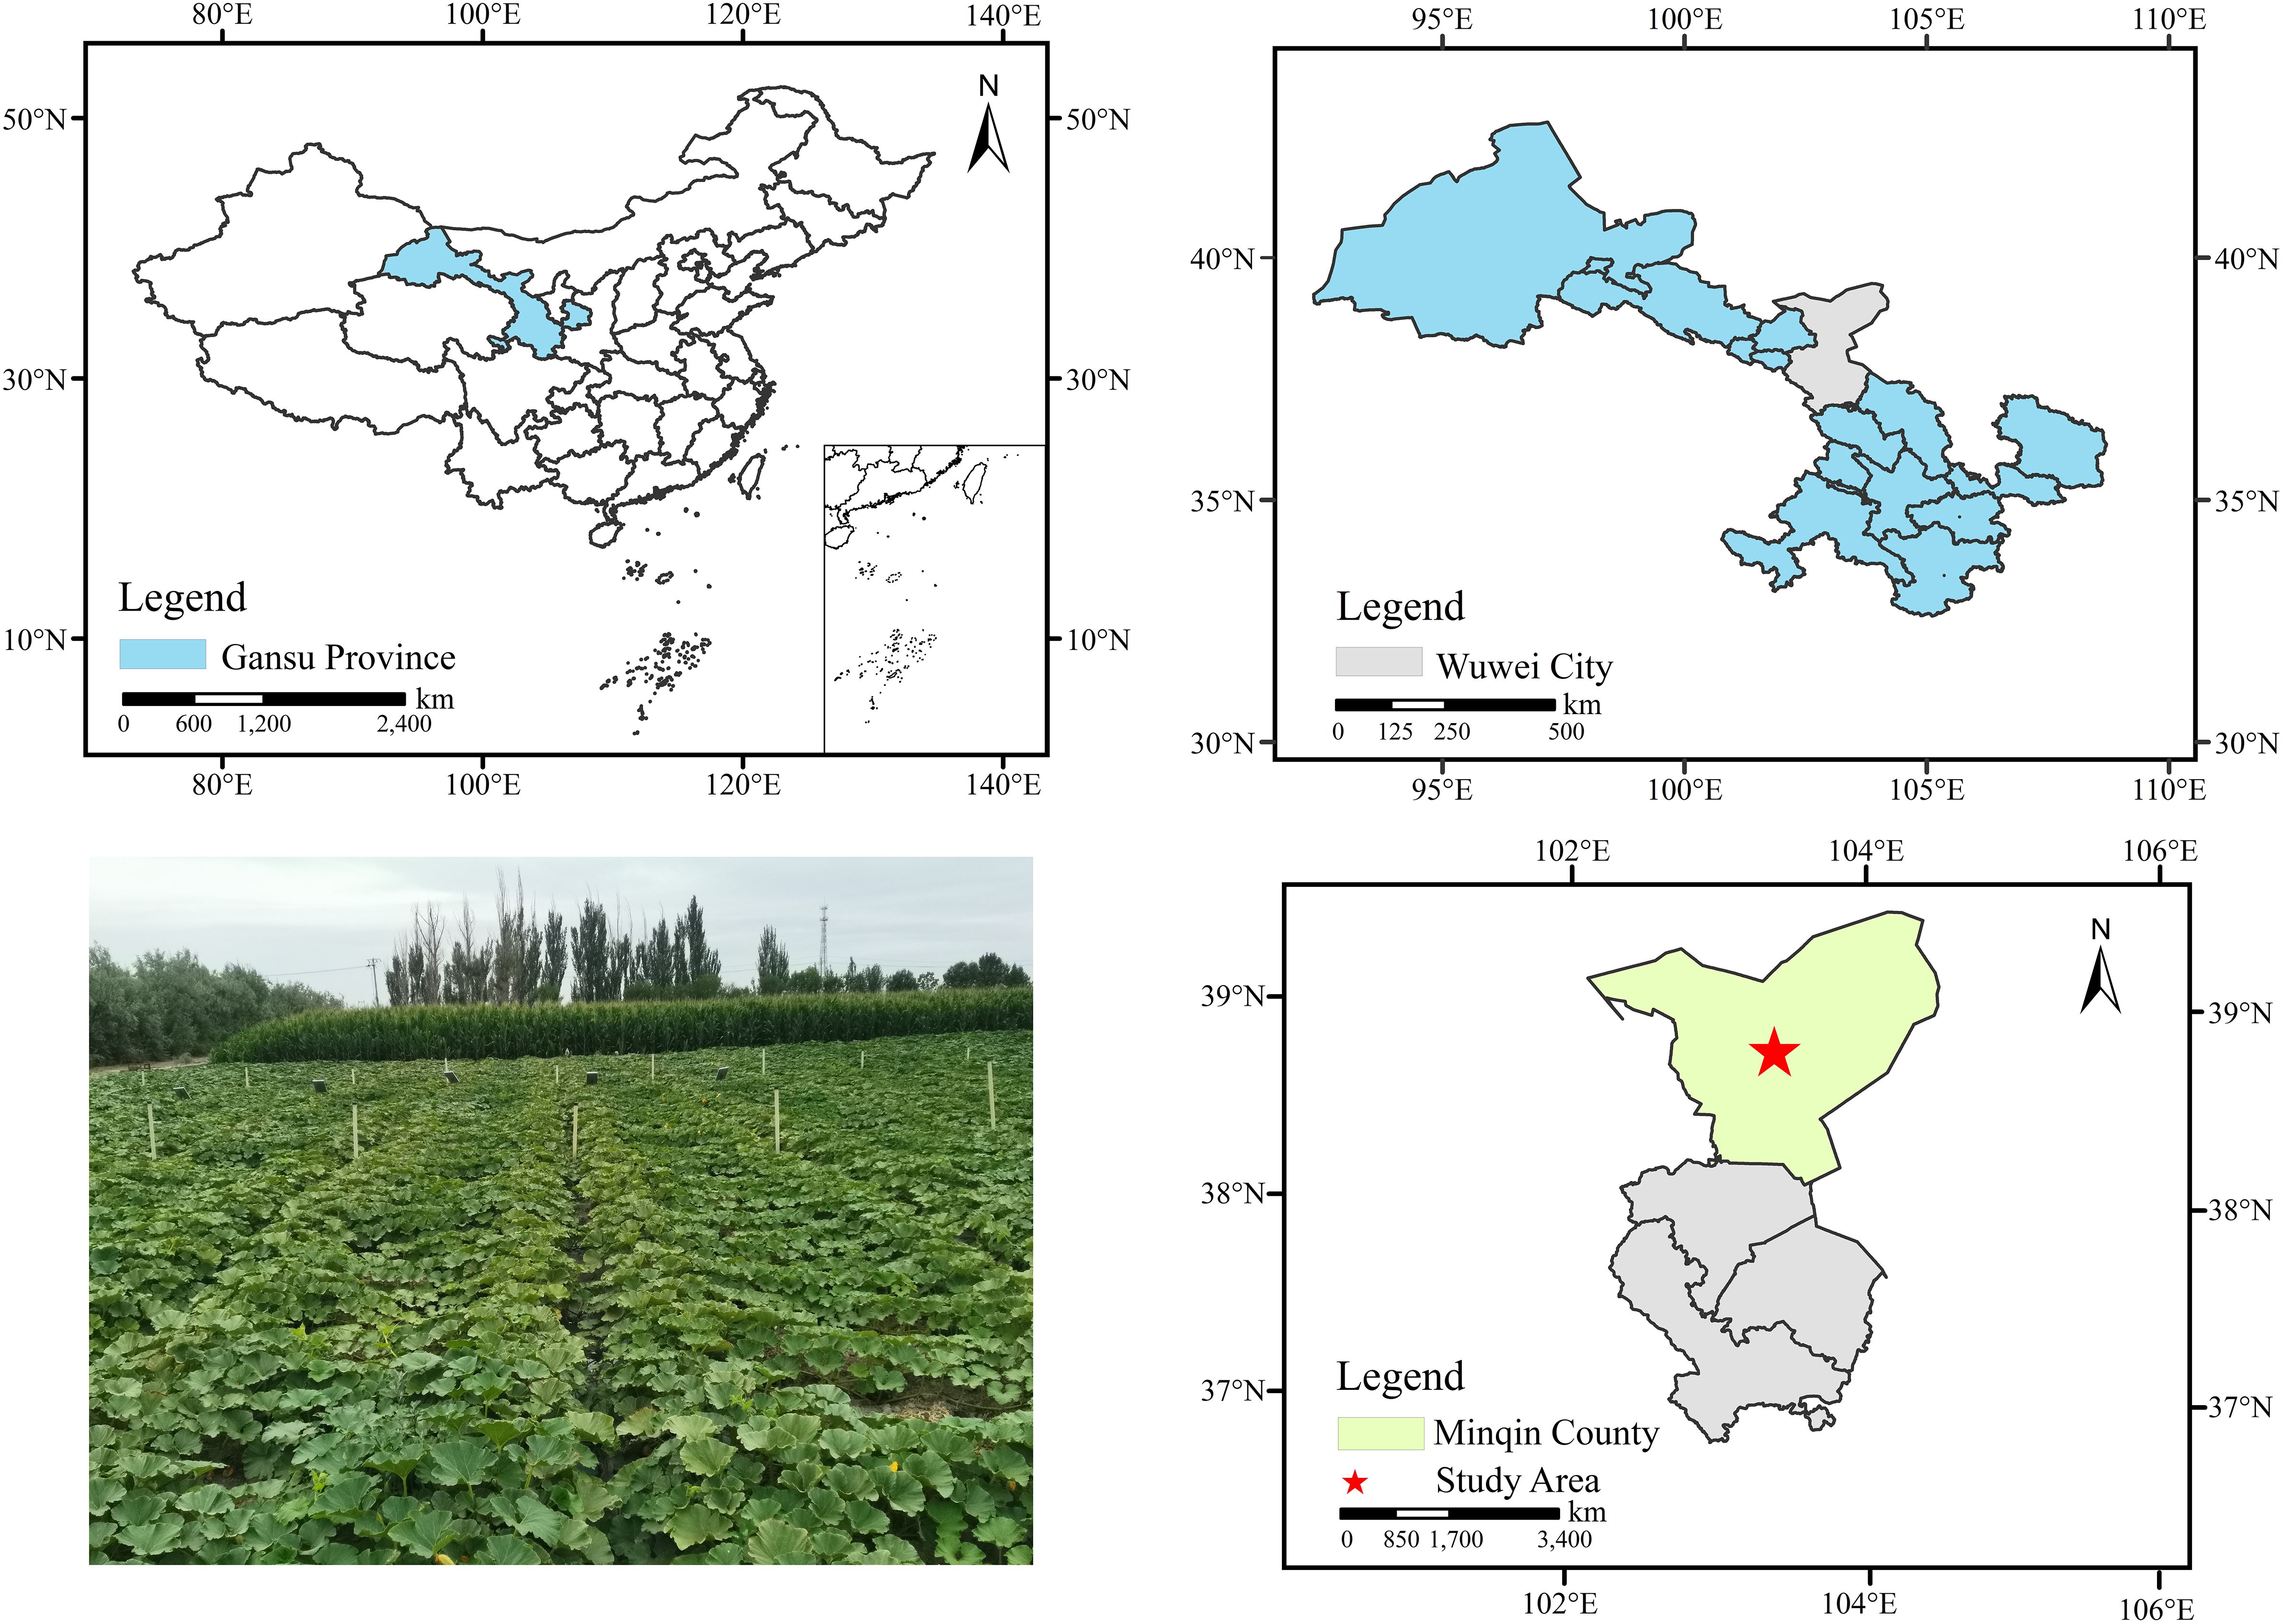
Figure 1 Geographical location of the test area.
In this experiment, based on previous research (Liu et al., 2014; Li et al., 2022), and considering the climate, soil characteristics, local irrigation and fertilization scheme for pumpkin under conventional furrow irrigation in the experimental area, two control factors were selected: irrigation volume and organic fertilizer amounts. The experiment followed a two-factor randomized block design with three levels for each factor, namely low, medium and high, increasing sequentially in quantitative order. The three levels irrigation of volumes were W1 (37.5 mm), W2 (45.0 mm) and W3 (52.5 mm). For the three levels of organic fertilizer amounts, solid bottom fertilizer-liquid fertilizer application amounts were F1 (3900-300 kg ha-1), F2 (4800-450 kg ha-1), and F3 (5700-600 kg ha-1), respectively, with the liquid trailing fertilizer application twice during the growth period, of which effective components are: N+P2O5+K2O ≥ 18% effective bacteria (Bacillus subtilis + Bacillus licheniformis) ≥ 50 million/ml, and amino acids ≥ 3% (Lanzhou Xindali Water Fertilizer Integrated Service Co., Ltd.). Additionally, the conventional irrigation and chemical fertilization scheme from local farmers were chosen as control treatments (CK), including an irrigation volume of 52.5 mm along with bottom fertilizer of 300 kg ha-1 diammonium phosphate (DAP) (0-46-0) and 450 kg ha-1 urea (with N ≥46.3% or 46-0-0, Lanzhou Zhongshi fertilizer Co., Ltd), also trailing fertilizer of 300 kg ha-1 urea twice. Therefore, there are a total of 10 treatments replicated three times, 30 plots of 87.5 m2 (35 m × 2.5 m). Each treatment underwent harrowing, leveling, and furrowing before sowing, and being irrigated once before sowing, with an irrigation volume of 45.0 mm. It was irrigated thrice during the growth period following the same irrigation frequency and irrigation time for all treatments during the entire growth period. The specific experimental design program is shown in Table 1.
Table 1 Experimental design scheme.
The test variety is “Sweet Pumpkin”, which is a conventional cultivar by local farmers. Pumpkin Seeds for the test were sown on April 28, 2022, and April 29, 2023, respectively. Additionally, pumpkin was harvested, at once tested for yield measurement on August 15, 2022, and August 20, 2023, respectively. The seeds were sown at a spacing of 200 cm between large rows, 50cm between small rows, with a plant spacing of 30cm, 2 rows plant in one furrow and one film, and 1~2 plants per hole. The test site was deeply plowed, and winter irrigated during the leisure period, with an irrigation volume of 120.0 mm.
Vine length: At the end of each growth period of pumpkin, 10 plants were selected from each treatment to measure the vine length, with a steel tape measure of 1 mm accuracy, and then averaged.
Stem thickness: At the end of each growth period of pumpkin, 10 plants were selected from each treatment to measure stem thickness, with a vernier caliper of 0.02 mm accuracy, and the average value did take.
Leaf area: 5 plants were sampled from pumpkin seedling stage to maturity in each experimental plot fixation and determined by portable leaf area meter (ECA-YM02 type, YIKANGNONG Co., Ltd, China).
During each growth period of pumpkin, 5 plants were randomly taken from each treatment to measure rhizome fresh weight, leaf fresh weight and total fresh weight, respectively. After marking in sequence, the samples were put into sample bags and put into the oven at 105°C for 30 minutes, then dried at 55°C until a constant weight. Obtaining the dry weights with rhizome and leaf, and total dry weight, respectively, followed. Finally, the drying rate was calculated.
Where Dr is the drying rate; DW is the drying weight, g; FW is the fresh weight, g.
During the pumpkin harvest, each plot was harvested individually and measured for yield and yield components. The yield of the entire planting was then calculated based on the yield of each plot.
Water and fertilizer use efficiency is represented by water use efficiency (WUE), irrigation water use efficiency (IWUE) and partial factor productivity (PFP). The formulas for WUE, IWUE, and PFP are as follows, respectively:
Where Y is the economic yield, kg ha-1; W is the total water consumption during planting, m3 ha-1; I is the total irrigation water amount during planting, m3 ha-1; F is the total fertilizer application during planting, kg ha-1; Other symbols, as above.
The weather data were measured by the meteorological and ecological environment monitoring system (QX100, SCIENTO Technology Co. LTD, China) at the test site, with 24-hour observation in a day and automatic data recording by data collectors.
Soil moisture content was monitored at each treatment by an intelligent wireless moisture monitoring instrument (ET100, Oriental wisdom Sense Technology Co. LTD, China), which automatically collected soil moisture data every 10cm layer from 0-100cm.
The formula for soil water storage was as follows:
Where is the water storage capacity, mm; V is the volumetric water content, cm3·cm-3; and h is the soil depth, cm.
Evapotranspiration (ET): In this experiment, ET was determined using the farm water balance equation, which was calculated as follows:
Where ET is the amount of transpiration evaporation, that is the total water consumption, mm; P is the amount of precipitation, mm; I is the amount of irrigation water, mm; and ΔSWS is the change in soil water storage between maturity and seedling period, mm. In this experiment, the terrain of the test plot is flat, the average depth of groundwater is 20 m, and the runoff and deep leakage are ignored.
In this experiment, we conducted principal component analysis by SPSS software (IBM US). The key principal components were selected according to the principle of principal components greater than 1 and the principal component scores were calculated through the comprehensive analysis of the growth dynamic indexes, yield and water and fertilizer use efficiency of pumpkin. Then, the contribution of each principal component was used as weights to derive a principal component composite model. Finally, the ranking of the scores between the different treatments was derived.
The software SPSS statistics 27 (IBM US) was used for mathematical and statistical analysis, comprehensive evaluation calculation, and cluster analysis. Origin 2022 (Origin Lab US) was used for drawing.
The data in Table 2 demonstrates the consistent impact of water-fertilizer coupling on pumpkin vine length in 2022 and 2023. Significantly different results were observed among treatments during the same growth period (P<0.01). Both irrigation and fertilization significantly affected pumpkin vine length throughout the entire growth period (P<0.01).
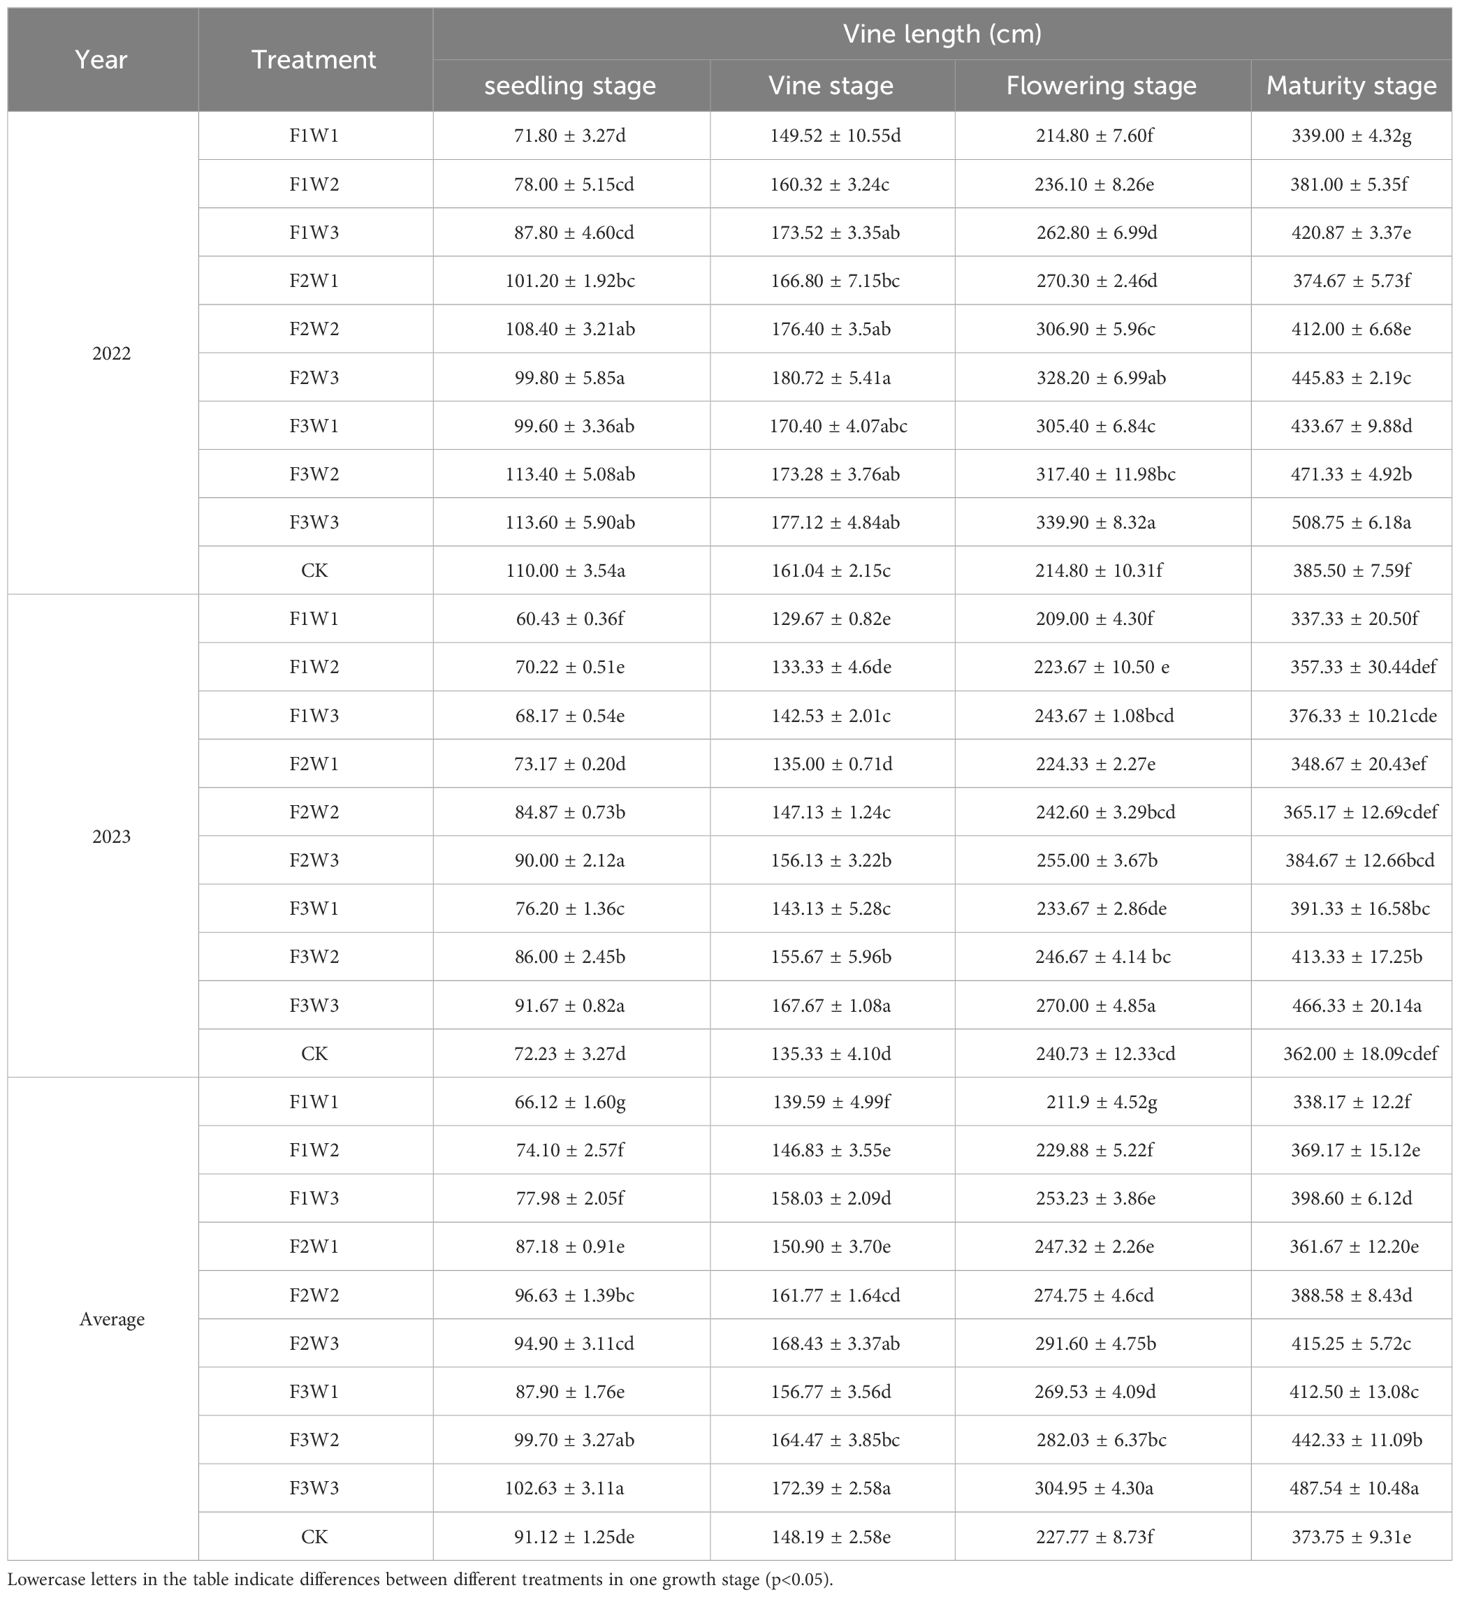
Table 2 Effect of coupled water and fertilizer regulation on Vine length in pumpkin.
The vine stage was crucial for the growth of vines in this experiment. The vines grew slowly during the seedling stage, rapidly during flowering stages, and ultimately reaching its maximum at maturity. The overall growth of the vine exhibited a positive correlation with irrigation and fertilization factors. In 2022 and 2023, under the same level of irrigation volume during of pumpkin, the vine length at the maturity stage was as follows: F3>F2>F1 under fertilization influence, W3>W2>W1 under irrigation influence factors (data used the two -year average value, the same below). The vine length under F3W3 treatment reached the maximum, significantly higher than other treatments. It increased by 44.18%, and 27.50% compared to the F1W1 and CK, respectively. Compared to that at seedling stage, vine growth stage, and blooming stage, The length of F3W3 treated vines increased by 375.70%, 182.80%, and 59.60% at the maturity stage of pumpkin, compared to the first three growth stages, respectively. That of F1W1 treatment increased by 412.50%, 141.30%, and 54.50%, respectively, of CK treatment increased by 200.50%, 152.40%, and 64.20%, respectively.
It could be seen that, the organic fertilizer application increased the growth rate of pumpkin vine length compared to CK, increasing both fertilization amount and irrigation volume promoted the pumpkin vine growth.
Table 3 shows the effect on pumpkin stem thickness, and the data trend remained consistent in 2022 and 2023. The results indicated significant differences in pumpkin stem thickness under each water-fertilizer coupled regulation scheme (P<0.05). The effects of irrigation and fertilization factors on pumpkin stem thickness were highly significant (P<0.01). However, the interaction between these two factors did not significantly affect pumpkin stem thickness.
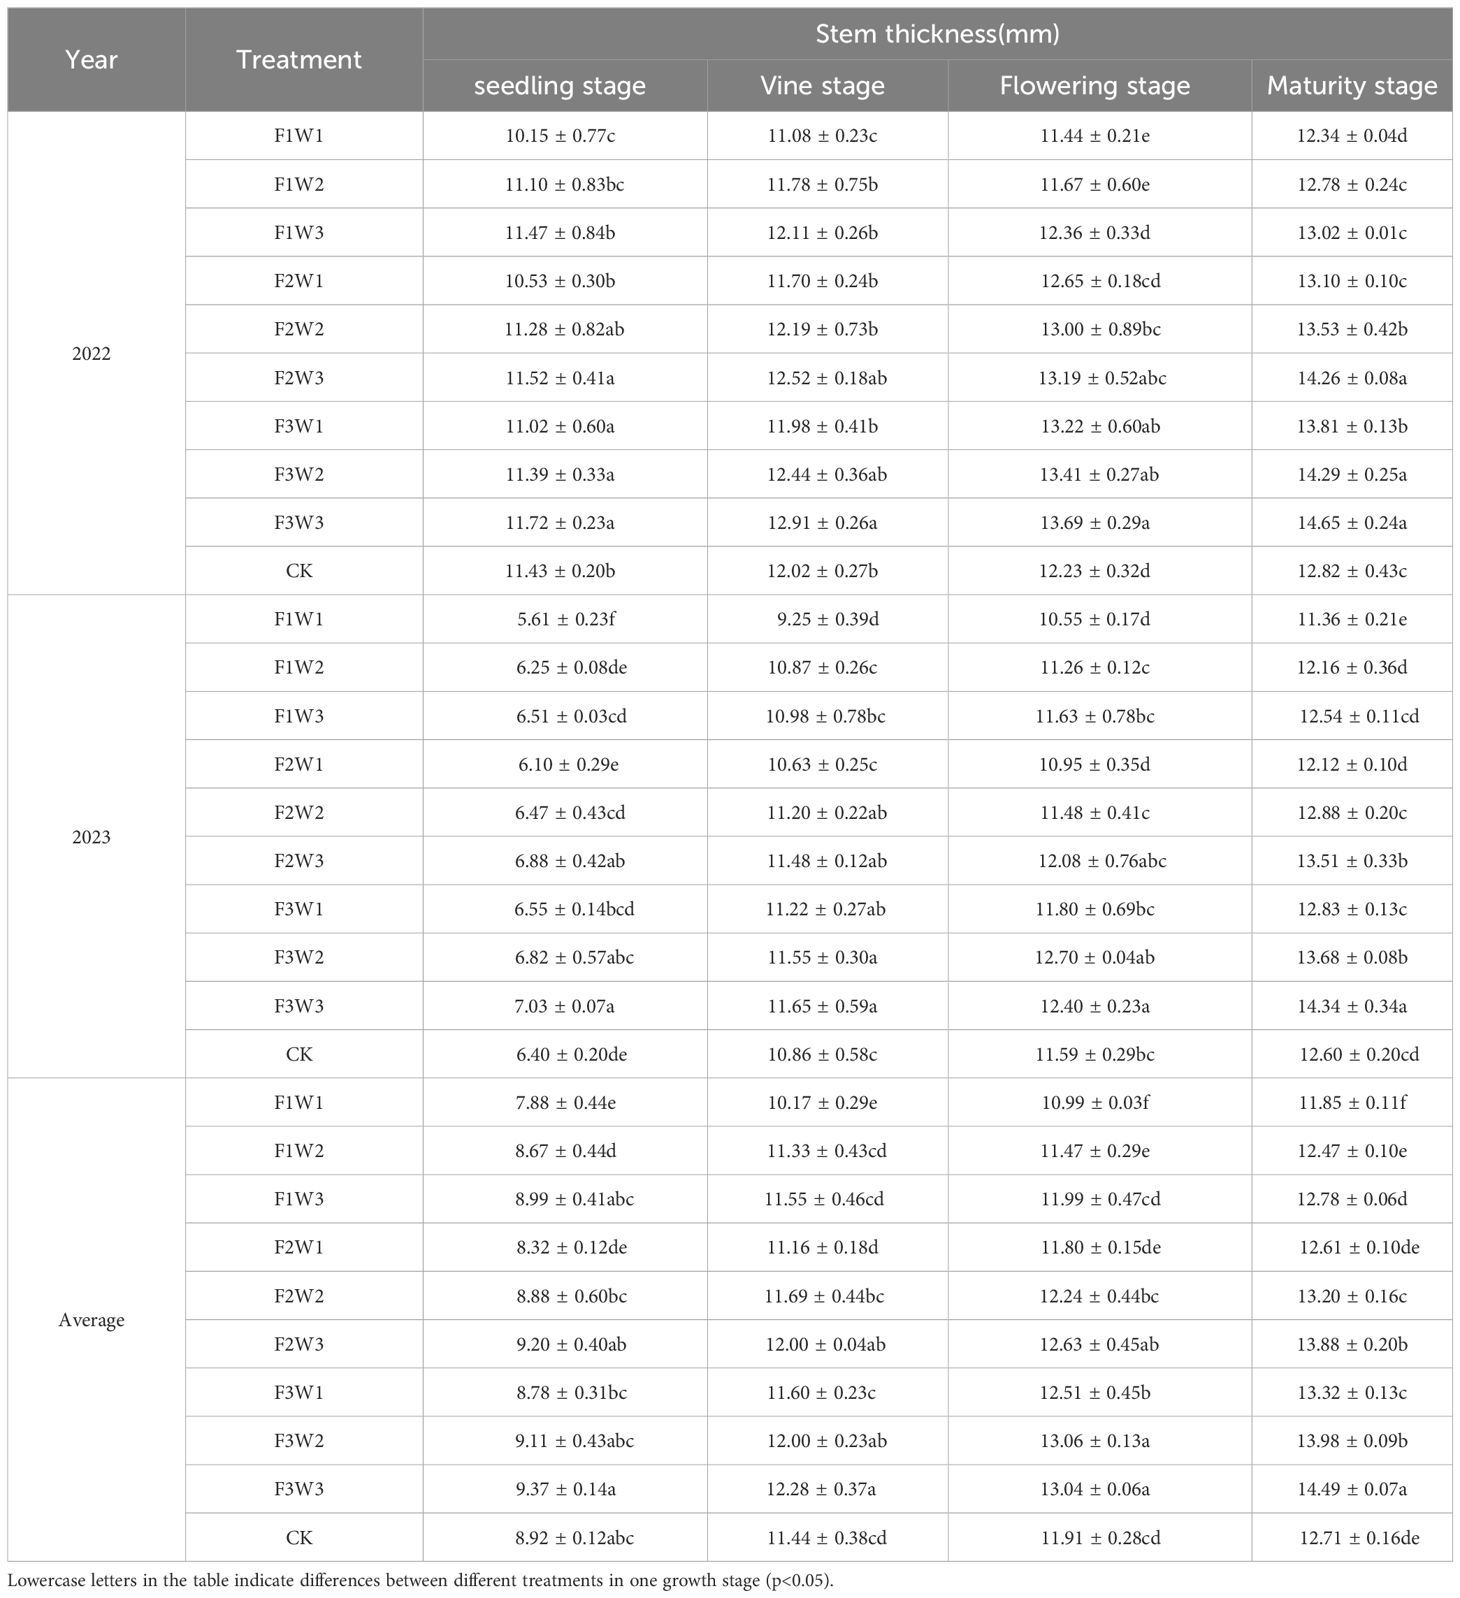
Table 3 Effect of coupled water and fertilizer regulation on Stem thickness in pumpkin.
The stem thickness gradually increased and stabilized during the flowering stage, ultimately reaching its maximum at the maturity stage. Overall, stem thickness showed a positive correlation with irrigation and fertilization factors., The stem thickness under F3W3 treatment reached its maximum at the maturity stage, significantly surpassing other treatments (P>0.05), it increased by 22.55% compared to F1W1 treatment and 23.6% compared to CK treatment.
In conclusion, improving fertilization amounts and irrigation volume promotes pumpkin stem development. Irrigation factors have a greater impact on the pumpkin stem during the early growth stage, while fertilization factors play a more significant role in the flowering stage.
Table 4 shows the effect on pumpkin leaf area index (LAI), with consistent trends in 2022 and 2023. The results indicated that the differences in pumpkin LAI were significant (P<0.05) under each water-fertilizer coupled regulation scheme. Both irrigation and organic fertilization highly significantly influenced on pumpkin LAI (P<0.01).
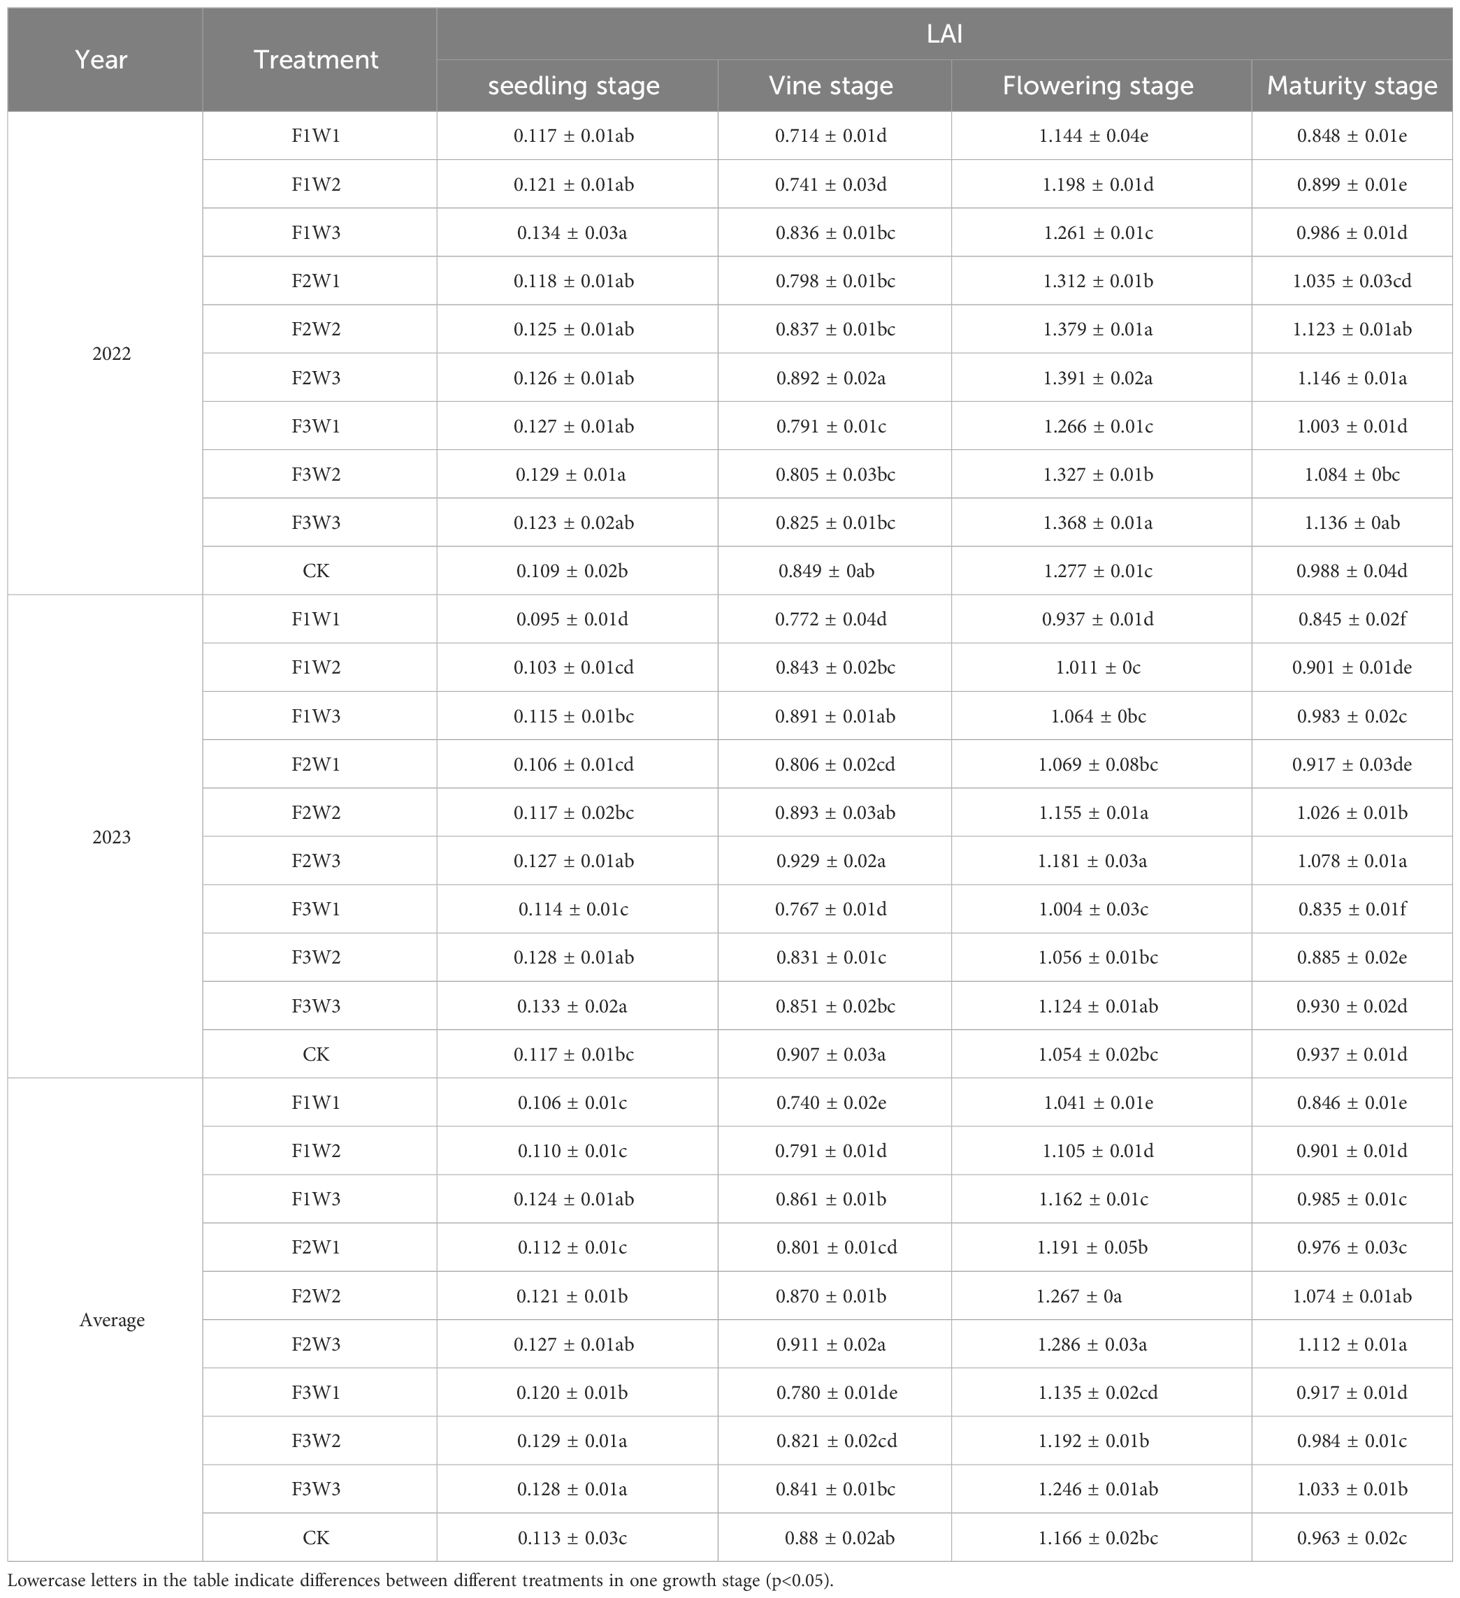
Table 4 Effect of coupled water and fertilizer regulation on LAI.
Pumpkin LAI increased rapidly during the seedling stage, peaked at the flowering stage, then decreased thereafter during the maturity stage. LAI increased by 596.64% at the vine stage, 42.19% at flowering stage, compared to the previous growth stage, respectively. At maturity stage, it was reduced by 20.48% compared to the previous growth period.
Pumpkin LAI increased with irrigation volume, reaching a peak before decreasing with fertilization amounts. Under F2W3 treatment, it was the highest during flowering stage, with a 10.78% and 23.56% increase compared to the CK and F1W1 treatments, respectively. Compared to the next growth period, there was a decrease of 15.56%, 21.10%, and 22.93% for F2W3, CK, and F1W1 treatments, respectively.
In conclusion, increasing fertilization amounts and irrigation volume within a certain range promotes pumpkin LAI growth, however, excessive fertilization inhibited its growth.
The effects of water-fertilizer coupling on pumpkin dry matter accumulation in 2022 and 2023 remained basically the same (Table 5). The dry matter accumulation of pumpkin showed significant differences under each water-fertilizer coupled regulation scheme during the same growth period (P<0.05). Irrigation level and organic fertilization amount had highly significant effect on dry matter accumulation of pumpkin rhizomes and leaves (P<0.01).
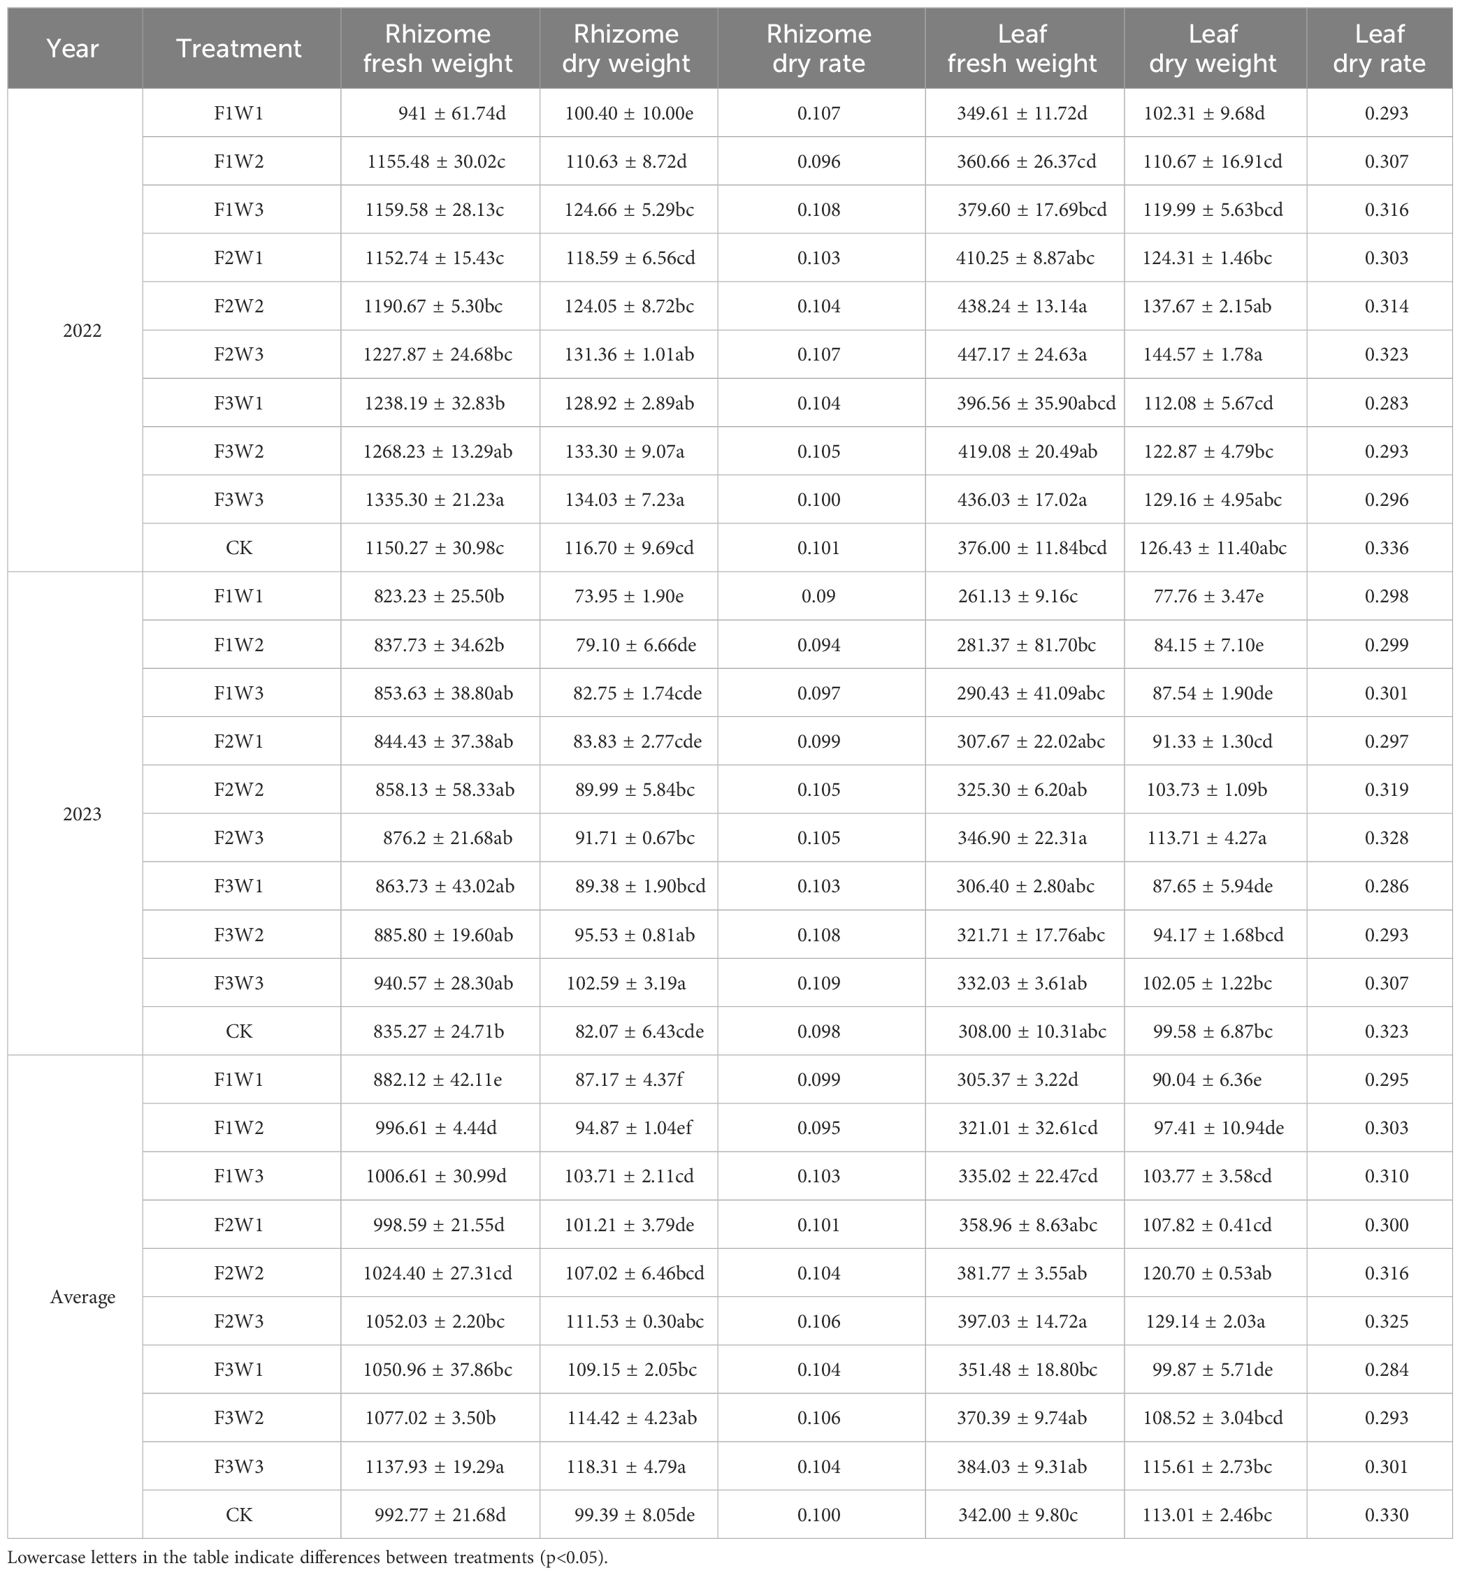
Table 5 Effect of coupled water and fertilizer regulation on dry matter accumulation in pumpkin.
In 2022 and 2023, the fresh weight of pumpkin rhizomes showed a positive correlation with irrigation and organic fertilization. The largest rhizomes fresh weight was achieved under F3W3 treatment, which was 29.9% higher than that under the F1W1 treatment, 14.56% higher than that under the CK, respectively. As a whole, the dry weight of pumpkin rhizomes showed an increasing trend with increasing irrigation volume and organic fertilization amounts, reaching a maximum under F3W3 treatment, which was 36.15% higher than the F1W1 treatment, and 18.91% higher than the CK treatment. Pumpkin rhizomes drying rate was the highest under F2W3 treatment.
The fresh weight of pumpkin leaves exhibited a positive correlation with the irrigation volume, while it displayed an increasing-then-decreasing pattern in response to the organic fertilization amount. Leaf fresh weight reached a maximum under F2W3 treatment, which had increased by 30.00% compared to the lowest F1W1 treatment, and increased by 16.07% compared to CK treatment. The pumpkin leaf dry weight overall increased with increasing irrigation volume, also showed an increasing and then decreasing trend with increasing fertilization amount. Reaching the maximum under F2W3 treatment, which having been 43.43% and 14.18% higher than the lowest treatments F1W1 and CK, respectively. Leaf drying rate achieved its maximum under CK and F2W3 treatment was next.
The leaf drying rate of pumpkin was positively correlated with irrigation volume. It showed an increasing and then decreasing trend with fertilizer application amount. These indicate that increasing irrigation volume and fertilization amount promote dry matter accumulation in leaves, although excessive fertilization amount has an inhibitory effect.
The effect trend of pumpkin yield remained consistent in both 2022 and 2023 year (Table 6). The yield varied significantly across treatments (P<0.01),and significantly affected by irrigation, fertilization and their interaction(P<0.01).

Table 6 Effect of coupled water and fertilizer regulation on pumpkin yield.
Pumpkin yield was positively correlated with irrigation volume and exhibited a trend of initially increasing and then decreasing with the increase of fertilization amount. It reached the maximum under F2W3 treatment, significantly higher than other treatments, increasing by 25.70% and 42.55%, compared with CK and F1W1 with the lowest yield, respectively. The yield did not significantly increase with increasing irrigation volume under high fertilization amount (F3). When the amount of organic fertilization was raised from F2 to F3, there was a decline in yield. Pumpkin yields were ranked asW2>W3>W1 in terms of irrigation factors, F2>F3>F1 by organic fertilization amount. A regression model was constructed, and a surface was fitted using the average data of 2022 and 2023 years, with irrigation volume and organic fertilization amounts as independent variables, and pumpkin yield as dependent variable (Figure 2). The F-value for the model was 27.81, p<0.01, indicating that the model was extremely significant. Furthermore, the R2 value of 0. 877 indicated a good model fit for the model. The regression model illustrated that increasing the level of irrigation and organic fertilization amounts was beneficial for pumpkin to obtain high yield, but it began to decline when reaching the critical point. All those further illustrated that theF2W3 treatment could promote high yield of pumpkin, while the low irrigation volume and organic fertilizer amount, along with the high amount of organic fertilizer, exerted an inhibitory effect on pumpkin yield formation.
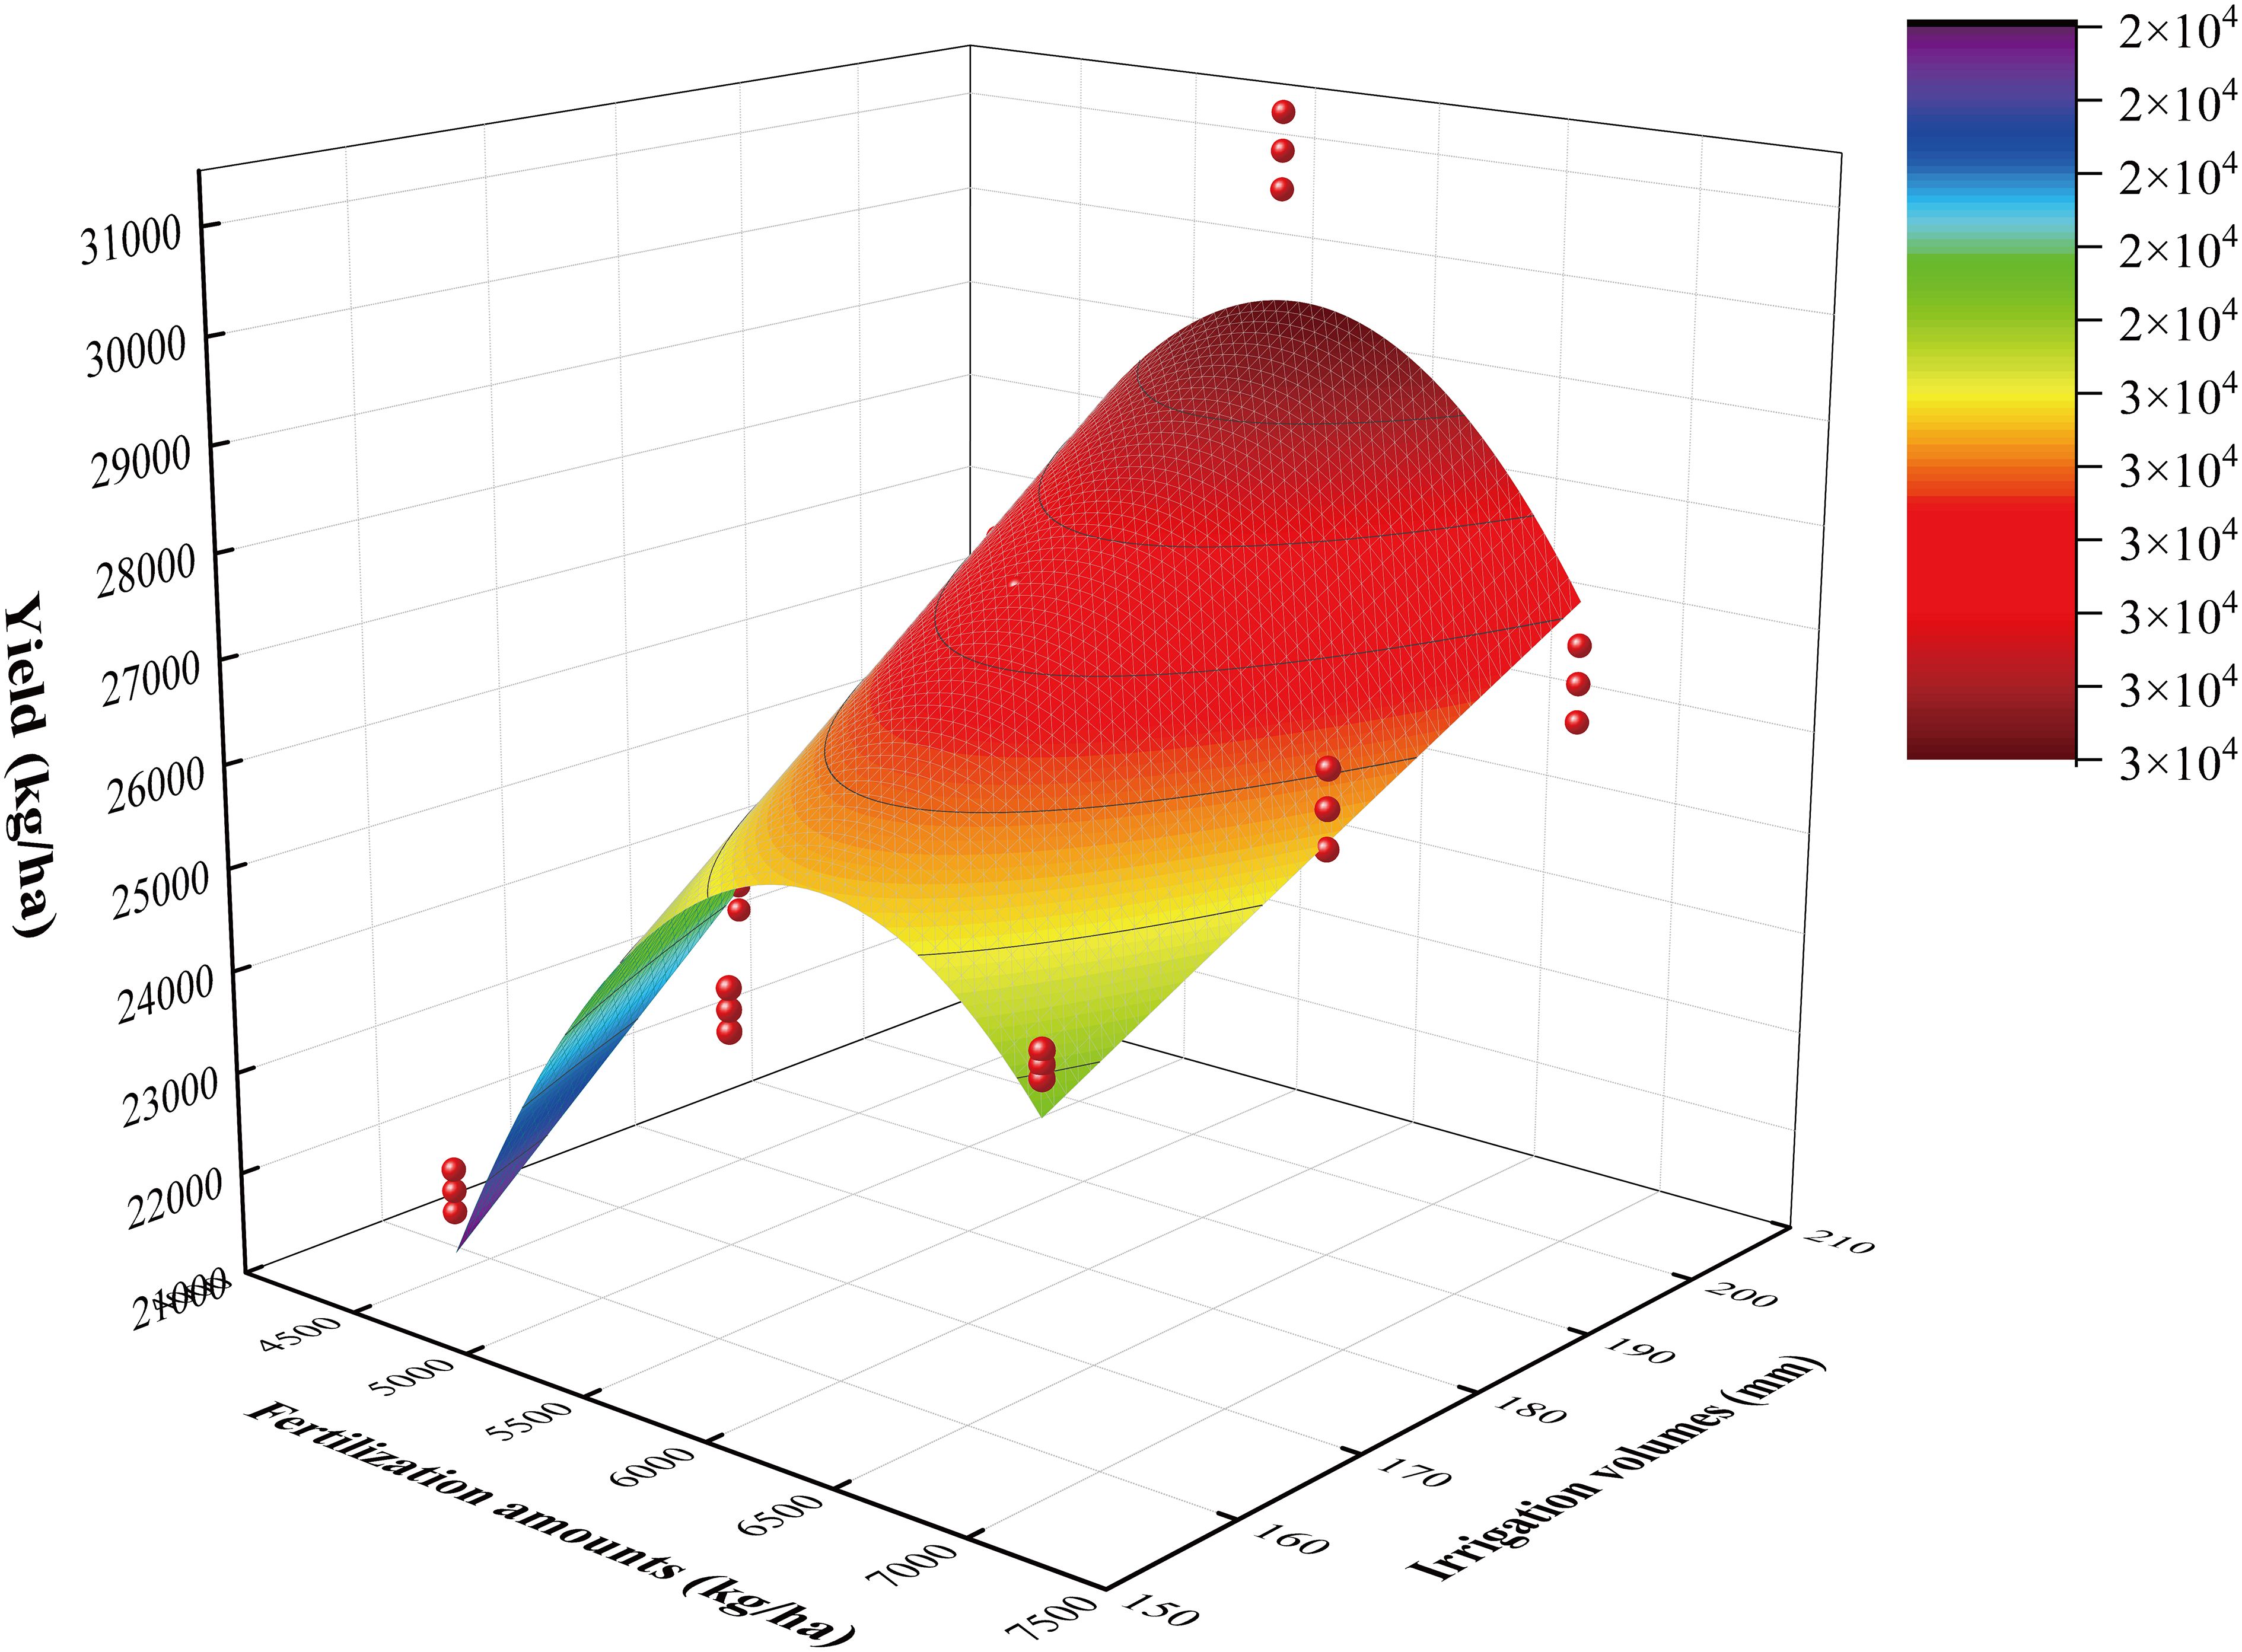
Figure 2 Regression model of pumpkin yield with irrigation and fertilization coupled.
The effect of different water-fertilizer coupled regulation on evapotranspiration (ET) in 2022 and 2023 is shown in Table 7. Significant differences in ET were observed among treatments at each growth stage (P<0.05). Irrigation factors significantly influenced ET, while the impact of fertilization factors varied across growth stages, with no significance effect during the vine stage (P<0.05) and extreme significance in other stages (P<0.01). However, their interaction on ET varies with the growth period.
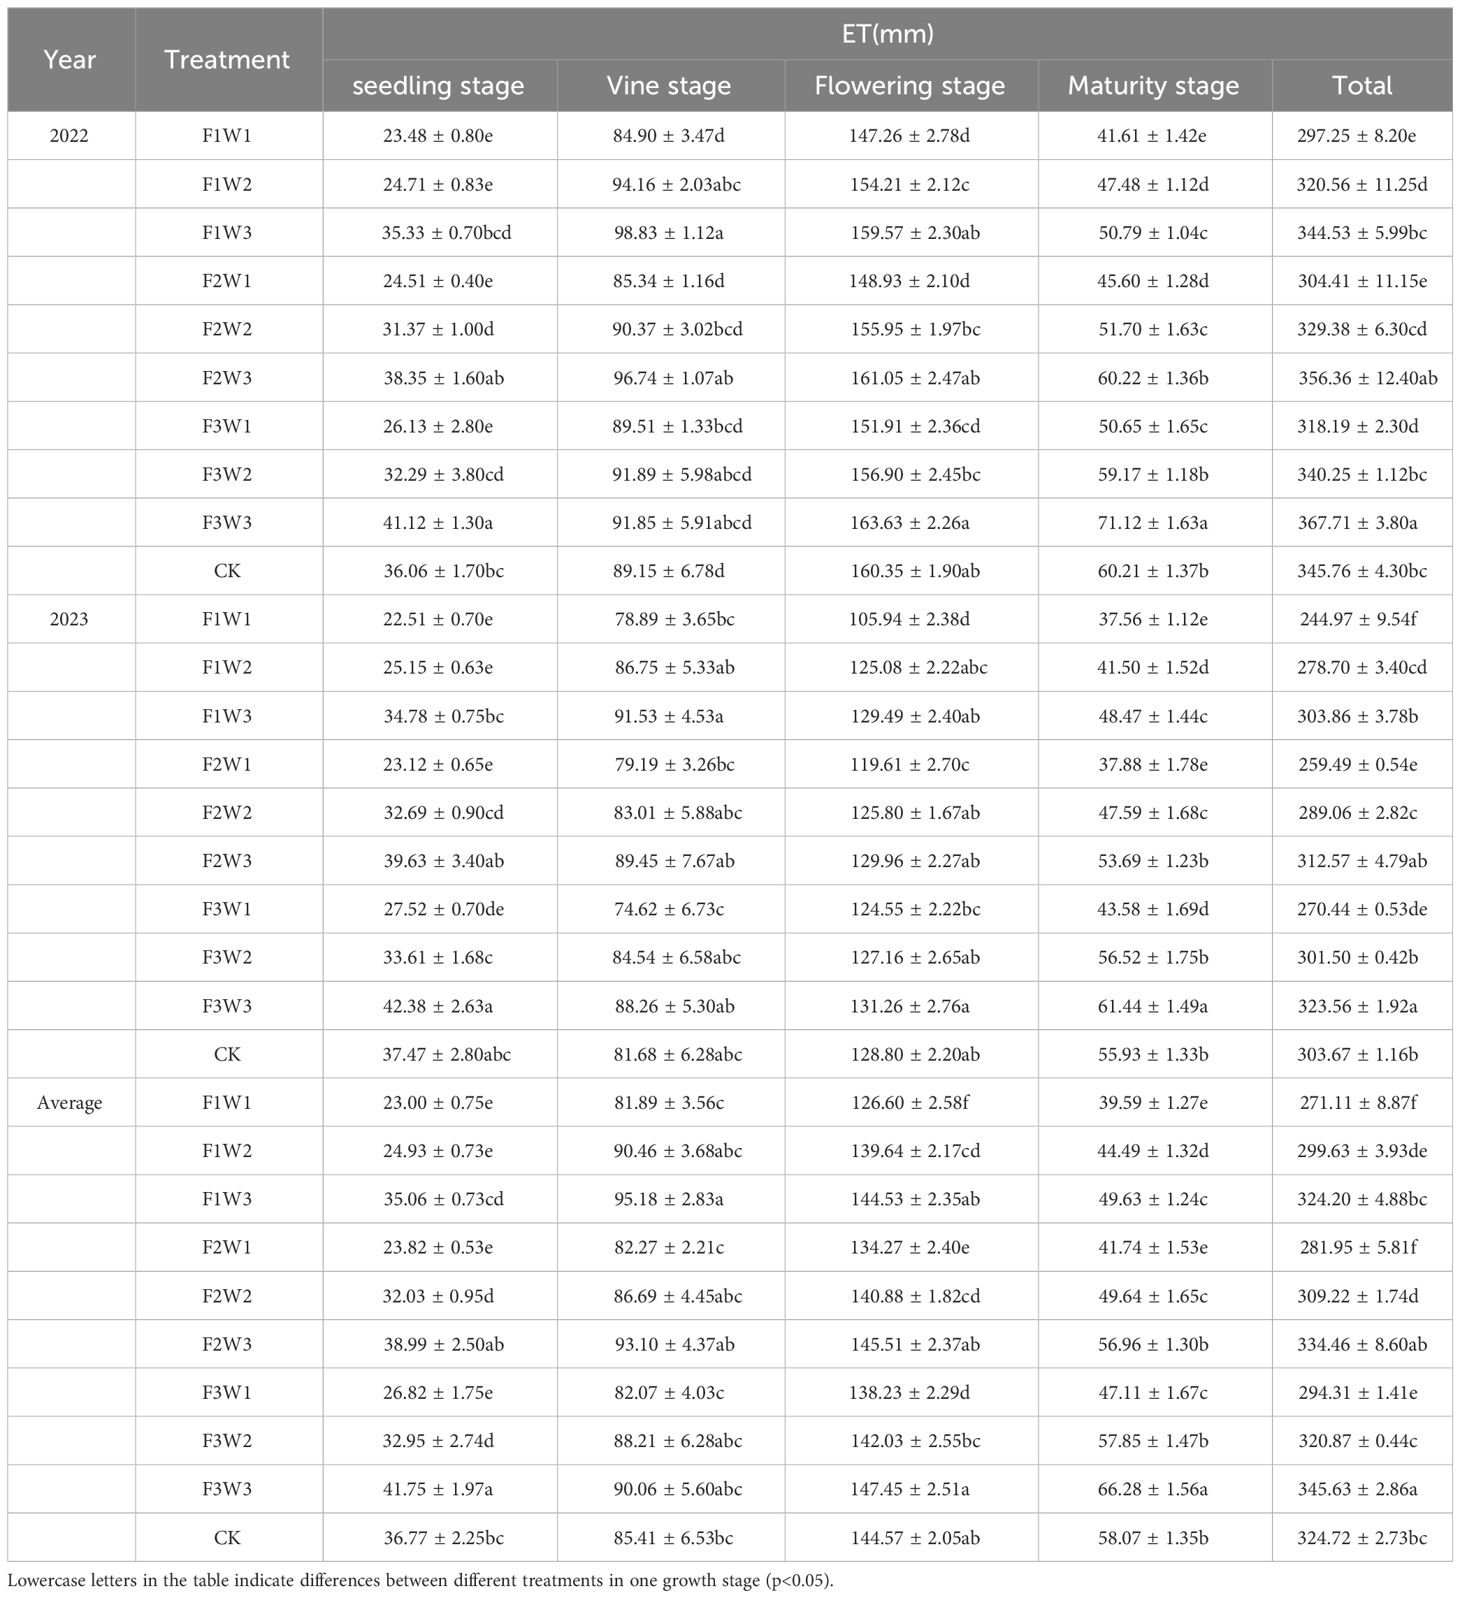
Table 7 Effect of coupled water and fertilizer regulation on ET.
The irrigation factors were the main determinants of ET. The highest ET of pumpkin was observed under F3W3 treatment, while the lowest under the F1W1 treatment. The data clearly showed a positive correlation between ET and irrigation volume, organic fertilizer amount. It initially increased and then decreased during the period, with consistent both 2022 and 2023.
The flowering stage was critical for pumpkin water demand, with the highest ET throughout its growth,. The proportion of ET during this stage was 42.66%, 46.70%, and 44.52% for F3W3, F1W1, and CK treatments, respectively, in relation to the total ET. The total ET of F3W3 increased by 27.48% and 2.65%, respectively, compared to F1W1 and CK. In conclusion, appropriately reducing the irrigation level and organic fertilizer amount could reduce ineffective ET. The application of organic fertilizer increased ET during pumpkin growth.
The effects of coupled water-fertilizer regulation on WUE, IWUE and PFP of pumpkin in 2022 and 2023 is shown in Table 8, the basically consistent trends of the two years being. The results showed that water-fertilizer coupling significantly affected the WUE, IWUE and PFP for pumpkin (P<0.05).

Table 8 Effect of coupled water and fertilizer regulation on water and fertilizer utilization efficiency of pumpkin.
The WUE exhibited a positive correlation with increasing irrigation volume under F2 levels, while it initially decreased with increasing irrigation volume under the F1, F3 levels. The WUE influenced by irrigation volume in the order of W1>W2>W3, and under the influence of fertilization amounts is F2>F3>F1. The F2W3 treatment reached the highest value, significantly superior to the other treatments, and showing an increase of 18.45% and 25.84% compared to CK and F1W1 treatment, respectively. The summary is that modest increasing irrigation volume enhances WUE, while moderate fertilization amounts increase it but excessive amounts inhibit it.
The IWUE showed a negative correlation with irrigation volume and exhibited an initial increase followed by a subsequent decrease with increasing fertilization amount. The IWUE was highest with F3W1 treatment, increasing by 28.96% and 13.62% compared to CK and F1W1 treatment, respectively. The order of IWUE was F2>F3>F1 under different fertilization amounts, and it was W1>W2>W3 under different irrigation volume. Thus, reducing irrigation volume and fertilization amounts appropriately can enhance IWUE. The PFP showed a positive correlation with irrigation volume and a negative correlation with fertilization amount. The maximum PFP was achieved under the F1W3 treatment, showing an 18.35% increase compared to F1W1 treatment, the percentage is 68.65% decrease compared to CK treatments.
Correlation analysis based on nine indicators of pumpkin growth index, yield, ET, WUE, IWUE and PFP under each water-fertilizer coupling scheme (Figure 3) showed that yield was significantly and positively correlated with dry matter, stem thickness, LAI and ET (P<0.05), with the correlation coefficients of 0.89, 0.70, 0.93 and 0.70, respectively. WUE was significantly and positively correlated with IWUE, the correlation coefficient is 0.85. Total dry matter accumulation was significantly and positively correlated with stem thickness, vine length, LAI and ET with correlation coefficients of 0.88, 0.74, 0.94, and 0.79, respectively. Stem thickness was significantly and positively correlated with vine length, LAI and ET with correlation coefficients of 0.95, 0.69 and 0.78, respectively. Vine length was significantly and positively correlated with ET, the correlation coefficient is 0.78.
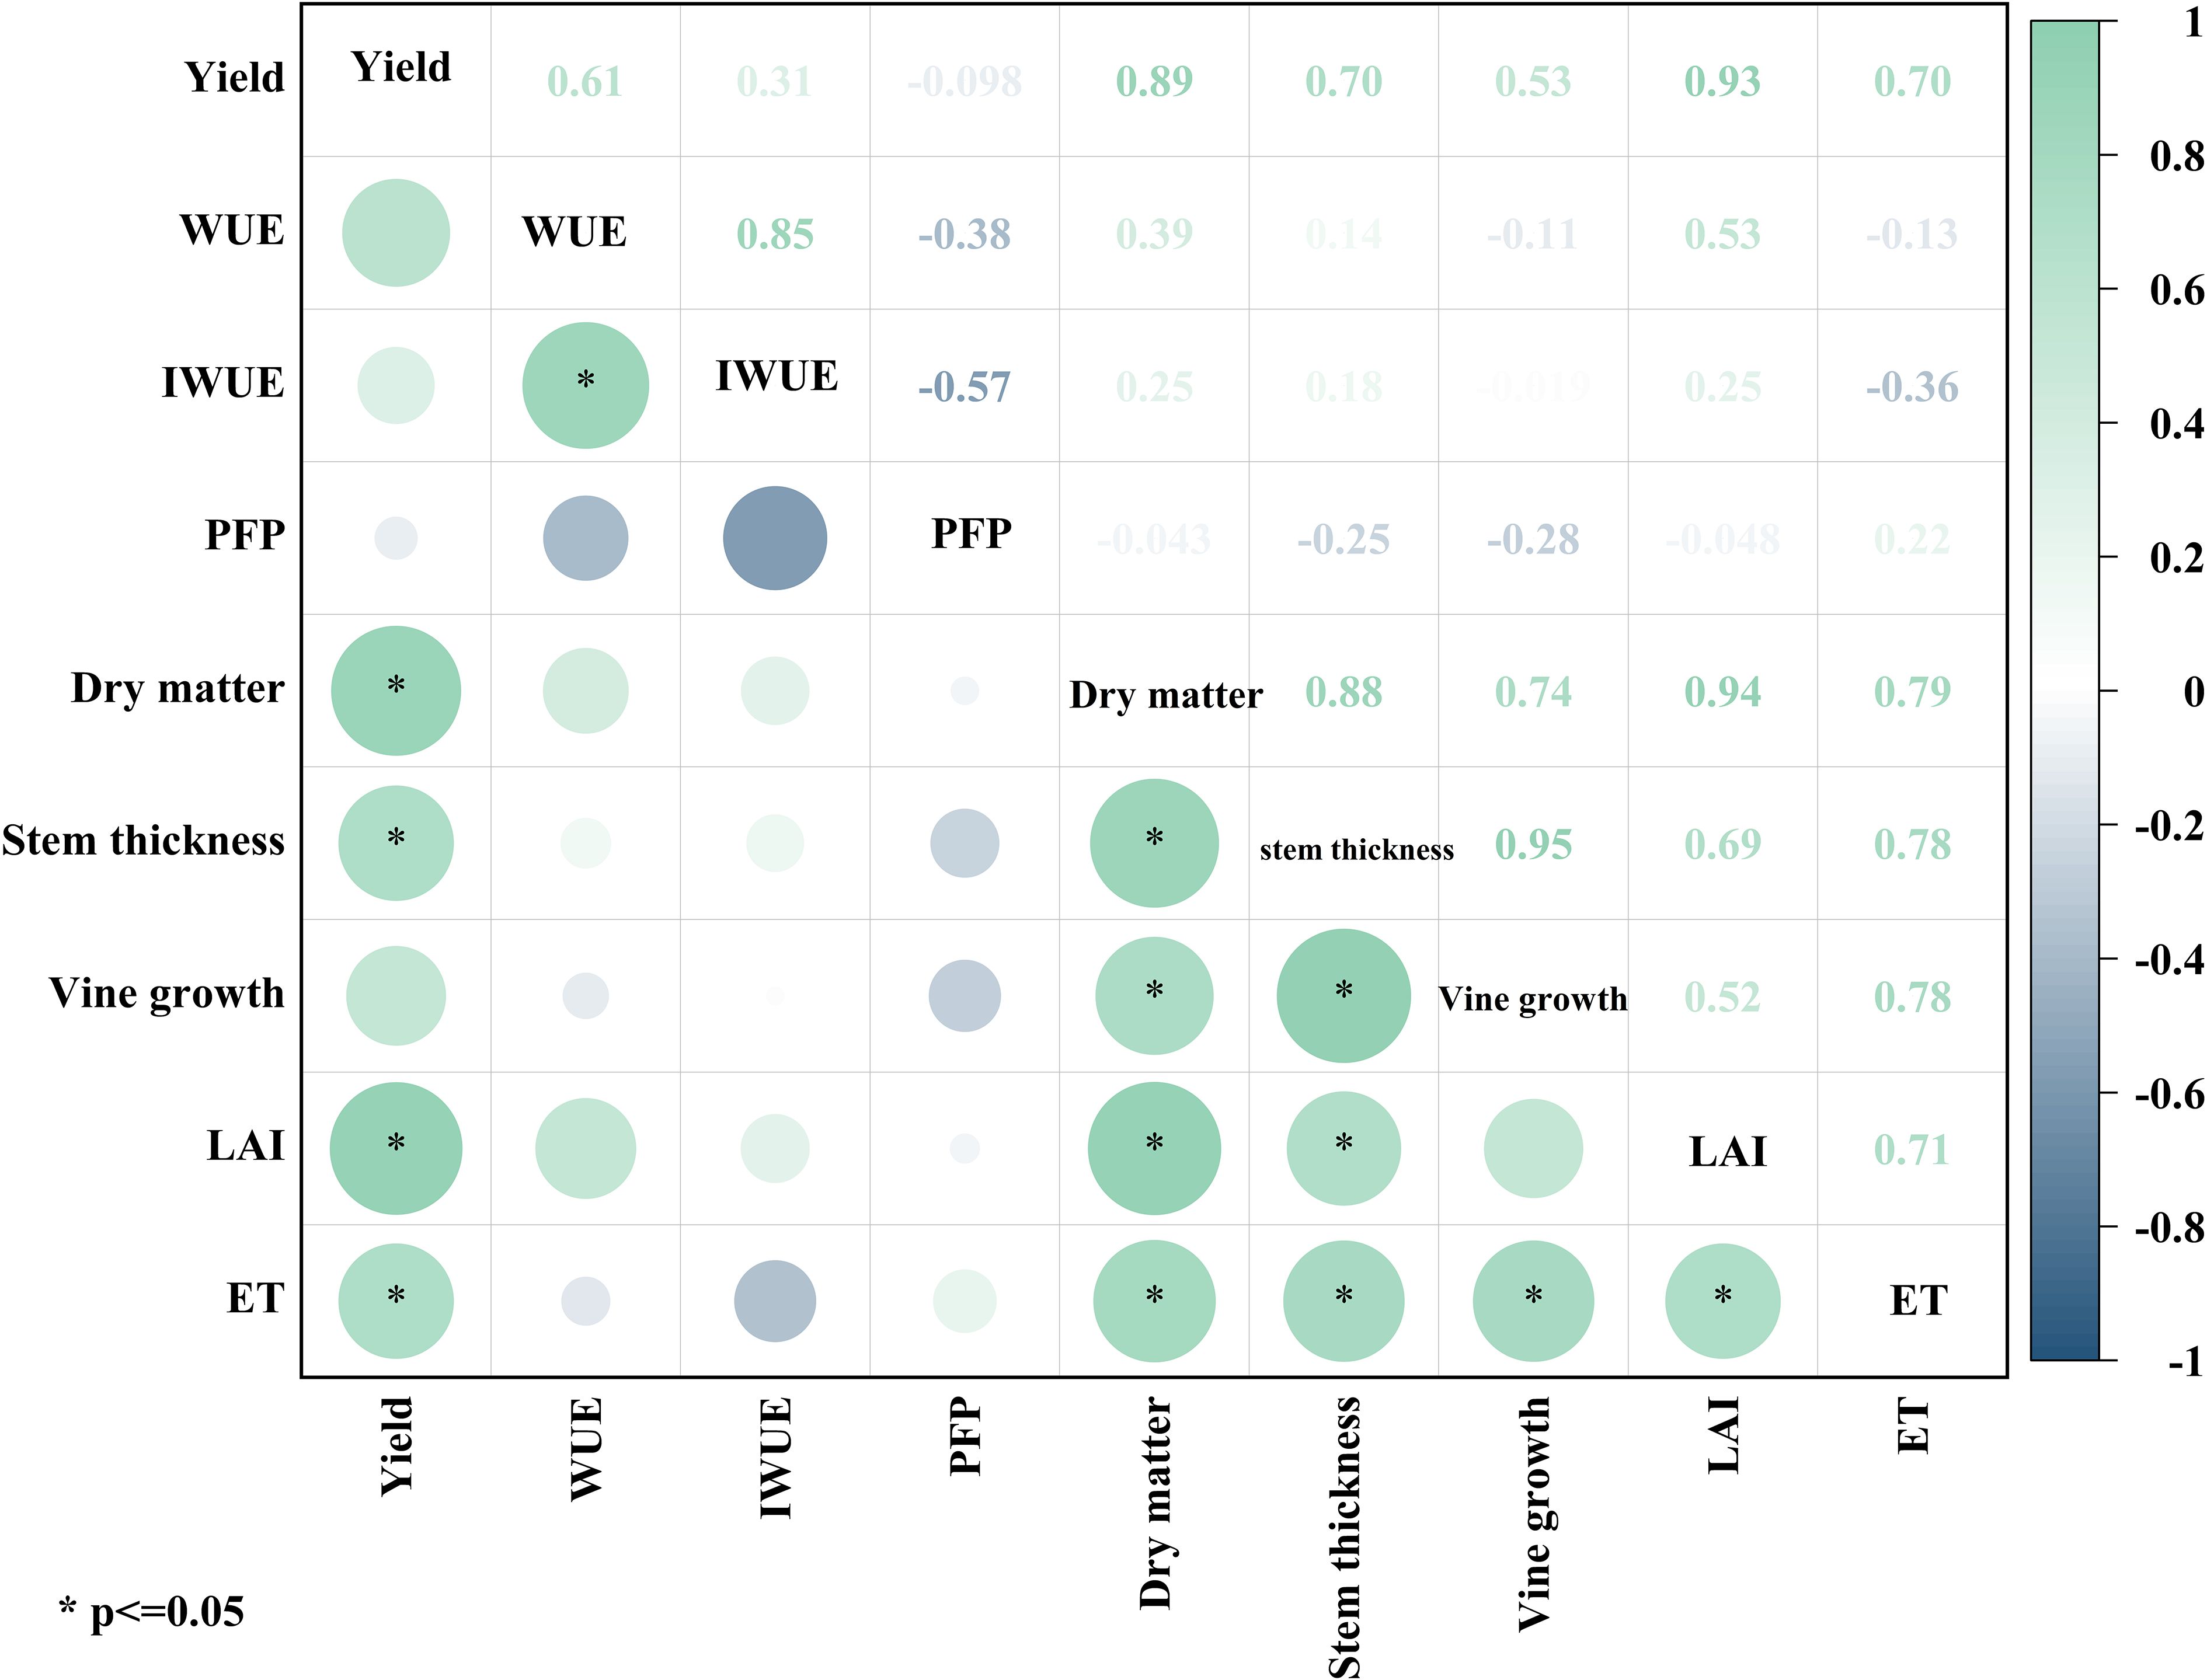
Figure 3 Correlation analysis.
Principal component analysis (PCA) method was performed based on nine indicators of pumpkin under each water-fertilizer coupling treatment using SPSS software, the results being shown in Table 9. Taking the average value of 2022 and 2023 years as an example, at first, the principal components would be selected. In here, the first 3 principal components, with eigenvalues > 1 and the cumulative contribution rate with 95.63% in the extraction results, were selected, all which indicated that these 3 principal components had been able to represent most of the information of the indexes measured and meet the requirements of the PCA. Among them, the contribution rate was 55.77% of the first principal component, and 26.91% of the second principal component, and 12.95% of the third principal component, respectively. Then, for the three principal components analyzed, a matrix of component scores was calculated. Finally, a linear relationship was obtained according to the principal component model, as follows.
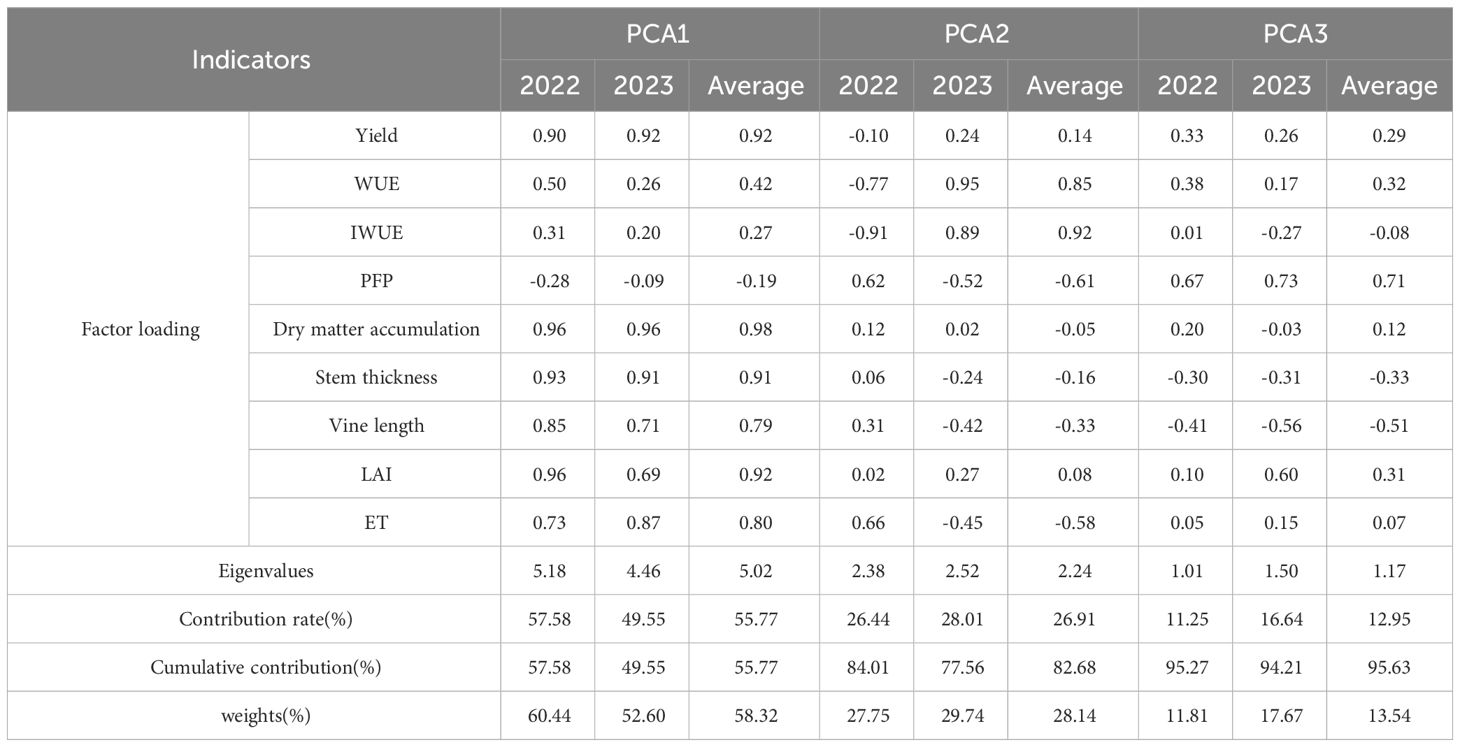
Table 9 Load matrix, eigenvalues, contribution rate and weights of each principal component factor.
Where, X1 to X9 respectively represented yield, WUE, IWUE, PFP, dry matter accumulation, stem thickness, vine length, LAI and ET; F1, F2 and F3 represented the score of the three principal component, respectively; and F represented the sum of the three principal component scores.
The results of Table 9 showed that the variance contribution rate of PCA1 the maximum value of the three principal components, indicating that it had the greatest influence on the comprehensive evaluation. The main influencing factors of PCA1 were yield, dry matter, stem thickness, LAI and ET, which were positively correlated with PCA1, indicating the larger value of the principal component loading, the larger the five indexes were. The main influence factors of PCA2 were WUE and IWUE, being positively correlated with PCA2, and indicating that the larger principal component loading value, the larger these 2 indicators were. The PCA3 variance contribution accounted for 15.44%, with PFP identified as the primary influencing factor exhibiting a positive correlation with PCA3. This suggests that higher values of principal component loading correspond to larger PFP values.
The comprehensive evaluation results of different water-fertilizer coupled regulation schemes were obtained by calculating comprehensive scores and ranking them (Table 10). The higher composite score of PCA, the better the growth, yield, and water fertilizer utilization of pumpkin. The composite scores were positive, indicating that the growth, yield, and water-fertilizer utilization of pumpkin were higher than the mean value. Six of the all coupled water-fertilizer regulation schemes, F2W1, F2W2, F2W3, F3W1,F3W2, and F3W3, were higher than the mean value; while F1W1, F1W2, F1W3 and CK were lower than the mean value. The composite score values of the 10 water-fertilizer coupling regulation schemes ranged from -0.95 to 1.33, indicating that the comprehensive growth of pumpkin under different water-fertilizer coupling regulation schemes varied significantly. According to the comprehensive score, the comprehensive ranking of each treatment had been gotten. Moreover, the comprehensive score under F2W3 treatment was the 1st, indicating that the treatment was relatively better, and the 2022 and 2023 data remained consistent. The F2W3 treatment demonstrated superior efficacy in promoting pumpkin growth, enhancing yield, and optimizing water and fertilizer utilization.
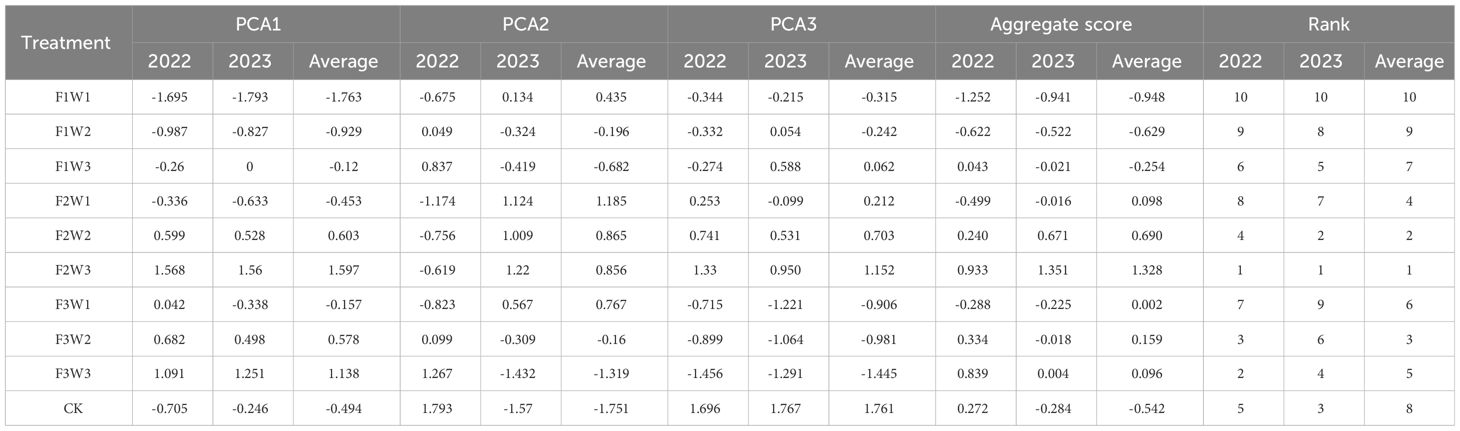
Table 10 Comprehensive scores of treatments under different water-fertilizer coupling regulation.
Based on the nine indicators that could reflect the growth, yield, and efficiency aspects of pumpkin, a systematic cluster analysis was using SPSS 27 and a horizontal spectrum was drawn (Figure 4). The 10 treatments at a Euclidean distance of 2.5 were categorized into four groups, the first being F2W3, the second including F2W2, F3W3, F3W2 and F1W3, the third including F1W2, F2W1, CK and F3W1, and the fourth including F1W1. In the first category, values of several indexes reached the maximum, such as yield, WUE, dry matter and LAI, the remaining indicators remain at a significantly elevated level, of which the principal component score was the 1st. In the second category, indicators reached higher levels, with principal component scores all being in the top 5. In the third and fourth categories, the indicators were observed to be at a comparatively lower level, with all of the principal component scores ranking toward the bottom of the list. The results of the cluster analysis were found to be largely consistent with those obtained from the PCA, and the data remained consistent between the 2022 and 2023.
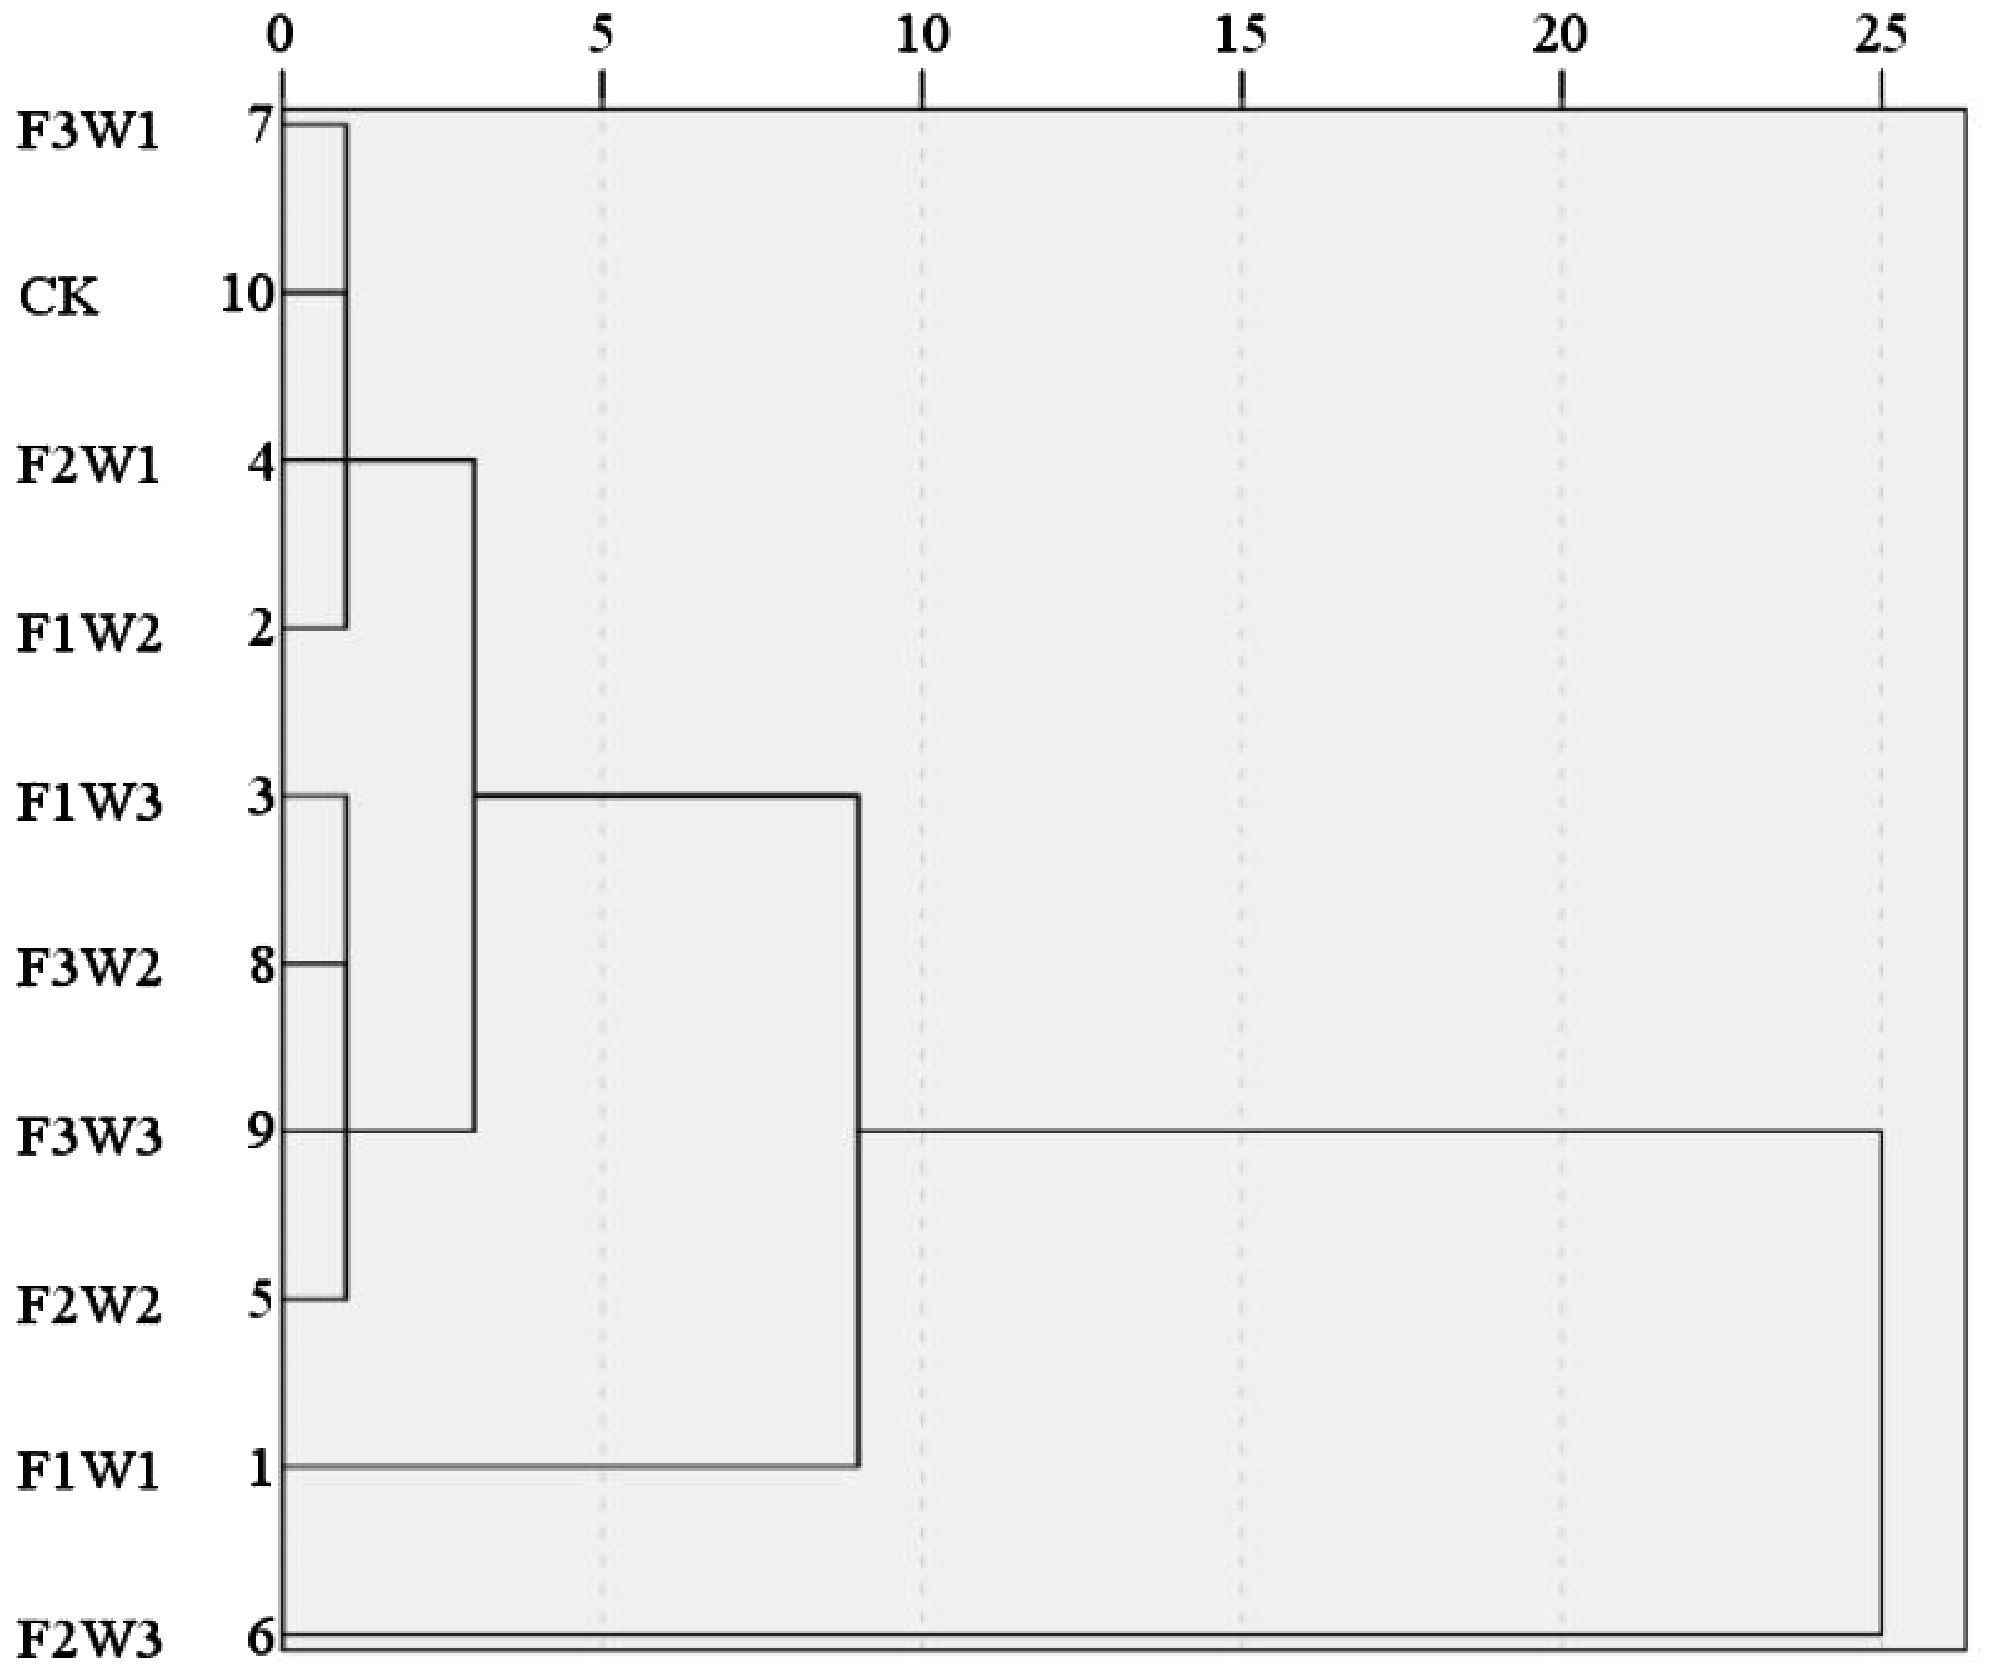
Figure 4 Cluster analysis.
In actual agricultural production, the growth and development of pumpkins require appropriate water and fertilizer conditions due to the complex interactions between them. The results indicated highly significant responses of irrigation and fertilization factors on pumpkin vine length, stem thickness and leaf area index, and dry matter (P<0.01). In addition, Within a certain range, increasing fertilization application amount and irrigation quota could significantly promote the growth of pumpkin plants, which was consistent with the findings of Cheng (Cheng, 2020). The coupled regulation of water-fertilizer could significantly promote the leaves growth, dry matter accumulation of pumpkin (Cheng et al., 2019), the same rule was also found in the study of watermelon (Hong et al., 2022). The results of this study indicated that either too high or too low water and fertilizer levels would have negative coupling effect, thereby affecting pumpkin leaf growth. Under low water and fertilizer conditions, insufficient soil moisture led to reduce free water and total water content in pumpkin leaves. Consequently, this hindered the leaves growth and dry matter accumulation of pumpkin, aligning with Khalili’s findings (Khalili and Nejatzadeh, 2021). In this study, higher fertilizer amount inhibited the growth of pumpkin leaf area. The leaf area index (LAI) of pumpkin initially increased and then decreased with increasing fertilization level, consistent with the findings of Naderi (Naderi et al., 2017), as well as a similar pattern was observed in studies on green vegetables and greenhouse tomatoes (Fan et al., 2017; Yue et al., 2022). The excessive nutrition, resulting from high levels of irrigation and fertilization, leaded to futile growth, caused an increase in the vegetative parts of the pumpkin plants, subsequently in turn affected yield formation. This decline in pumpkin yields may be attributed to the excessive use of nutrients and water during the early stages, as well as a deficiency of nutrients for pumpkin fruits during the later stages. These findings align with Ma’s conclusions (Ma et al., 2023), and are similar to those drawn by numerous scholars studying various crops such as sugarcane (Wu et al., 2022), pear (Wang et al., 2022a) and potato (Zhang et al., 2023a).
The conclusion indicated that irrigation, fertilization, and their interaction had a significant impact on yield (P<0.01). Based on experimental data in 2022 and 2023, the yield increased with higher irrigation volume, while the effect of fertilization amounts showed an initial increase followed by a decrease. The excessive fertilization negatively impacted the water-fertilizer coupling during pumpkin yield formation stage, thereby impeding yield development. The amount of fertilizer applied has a greater influence than the amount of irrigation, and appropriate irrigation and fertilization scheme could enhance pumpkin yield (Budak and Güneş, 2023). The increase in irrigation volume under high fertilization amount did not significantly enhance pumpkin yield, consistent with Khalili (Khalili and Nejatzadeh, 2021). The yield initially increases and then decreases with the improvement of fertilizer amounts and irrigation amounts under their coupled control. The relationship between crop yield and irrigation volume and fertilizer amounts follows a quadratic parabola. Excessive or insufficient irrigation and fertilizer levels negatively impact crop yield (Xiao et al., 2021; Zhang et al., 2023b). This conclusion is slightly different from the experimental results. The pumpkin yield did not decrease with the increase of irrigation volume, which may be attributed to the fact that the irrigation volume designed in this experiment did not reach the gradient of negative impact on yield. The experiment revealed a threshold for the impact of water-fertilizer coupling regulation on pumpkin yield. When fertilization amounts exceeded this threshold, a negative effect of water-fertilizer coupling emerged, further increasing the fertilization amounts inhibited the formation of pumpkin yield, which aligns with previous findings (Chen et al., 2019). Therefore, the coupling regulation of water and fertilizer in pumpkin must be carried out within an appropriate range, consistent with the “dilution effect” conclusion by Wang (Wang et al., 2015). Similar findings have also been observed in studies on wolfberry (Liu et al., 2021a), Panax notoginseng (Liu et al., 2021b), and summer maize (Ma et al., 2021).
This study found that irrigation factors significantly influenced Evapotranspiration (ET) (P<0.01). The impact of fertilization factors on ET varied with the growth stage of pumpkins but remained significant overall (P<0.01). The interaction between the two factors on ET changes with the growth period, and the overall level is significant, and irrigation factors had a greater influence than fertilization factors. The water demand of pumpkin varied throughout its growth period in this experiment. The rate of increase in ET was relatively slow during the seedling and vine stages, peaked at the flowering stage, and declined thereafter until maturity. During the flowering stage of pumpkins, there was a significant increase in water demand in, accounting for approximately one-third of the total ET. This could be attributed to the high temperature during this stage (in July), leading to strong transpiration and increased water demand for pumpkin fruit development. These findings align with previous studies (Zhou et al., 2020). Therefore, actual production should provide sufficient water during the flowering stage to ensure normal pumpkin growth and lay the foundation for high yield. The results indicated that increasing irrigation water and fertilizer led to higher ET in pumpkins throughout their growth period. This suggests that applying more organic fertilizer promoted pumpkin’s absorption and utilization of water, especially under lower irrigation volume. The application of W3 irrigation can significantly reduce ET by reducing fertilizer usage. However, the yield decreased under F3 treatment, and reducing fertilizer application not only reduced ineffective ET but also increased the yield. This maximizes the synergistic effect of coupling water and fertilizer, achieving the goal of transferring water with fertilizer and promoting fertilizer with water, the finding aligns with prior research (Fu et al., 2022; He et al., 2023a; Zhang et al., 2023c). In this experiment, There were a quadratic parabolic relationship between irrigation amount and water use efficiency (WUE), with the optimal irrigation amount enhancing WUE. However, when the irrigation level exceeded the critical value, WUE declined, consistent with previous studies (Yang et al., 2016; Jahromi et al., 2023). The experiment demonstrated that irrigation and fertilization had a positive coupling effect within the appropriate range, but excessive fertilization hindered efficient water use in pumpkin production, aligning with previous studies (Ye et al., 2022). The application amount is adjusted based on the irrigation volume in actual production, fully leveraging the coupling effect of water and fertilizer to improve water utilization and achieve high efficiency and high yield.
In this experiment, IUWE decreased with increasing irrigation volume, and initially increased but then decreased with the fertilization amount. This suggests that high irrigation and fertilization levels are not beneficial for water absorption and utilization in pumpkins. Under the F3W1 treatment, IWUE reached its maximum value, indicating that appropriate coupling scheme of water and fertilizer could improve water absorption and utilization in pumpkin plants (Piri and Albalasmeh, 2022; Zhang et al., 2023d).
The PFP exhibited a positive correlation with increasing irrigation amount, while showed a negative association with increasing fertilization amount (Zhang et al., 2017b; Da et al., 2023). A higher PFP did not necessarily result in the highest yield (Zhang et al., 2018). This experiment confirmed this finding, as it showed that F1W3 had the highest PFP, and a reduced yield deficit compared to the treatment F2W3. The scarcity of nutrients may cause pumpkin plants to prioritize their own growth by absorbing more, resulting in lower yields (Yue et al., 2023; He et al., 2023b).
In summary, the growth, yield, and water-fertilizer use efficiency of pumpkin were studied in this experiment under different water-fertilizer coupling control schemes. Principal component analysis and cluster analysis methods were used to comprehensively evaluate the different indices in 2022 and 2023. Both evaluation results were consistent, indicating that the F2W3 treatment ranked first in terms of comprehensive score. This treatment can serve as a valuable reference for high-yield and efficient pumpkin cultivation in the arid region of northwest China.
The response mechanism of pumpkin to the water-fertilizer coupling regulation was discussed by analyzing the variations in pumpkin growth and yield, ET, water and fertilizer use efficiency. The irrigation and fertilization levels, whether too low or too high, adversely affect pumpkin plant growth, yield, ET, water and fertilizer use efficiency. The higher fertilization level led to a decrease in pumpkin leaf area index and dry matter accumulation, inhibition of pumpkin yield, increased ET, and low water and fertilizer utilization efficiency. The use of organic fertilizer enhanced pumpkin growth, yield, WUE and IWUE compared to CK. The comprehensive evaluation of different water-fertilizer coupling treatments was conducted using principal component analysis and cluster analysis. The results indicated that F2W3 achieved the highest overall score in both 2022 and 2023. Therefore, the F2W3 treatment is recommended as the optimal water-fertilizer coupled scheme for pumpkin green production in the northwest arid region. It not only increases yield and efficiency but also promotes green environmental protection by saving fertilizers. The findings of this study are practically significant for enhancing crop yield and production efficiency in local and similar climate areas.
The original contributions presented in the study are included in the article/supplementary material. Further inquiries can be directed to the corresponding author.
TZ: Writing – original draft, Writing – review & editing. JZ: Conceptualization, Data curation, Formal analysis, Funding acquisition, Methodology, Project administration, Resources, Supervision, Validation, Writing – review & editing. LLD: Conceptualization, Data curation, Formal analysis, Visualization, Writing – review & editing. LD: Funding acquisition, Investigation, Project administration, Resources, Supervision, Validation, Writing – review & editing. RZ: Conceptualization, Resources, Supervision, Writing – review & editing. XRL: Conceptualization, Methodology, Resources, Writing – review & editing. FR: Data curation, Methodology, Visualization, Writing – review & editing. MY: Data curation, Formal analysis, Software, Writing – review & editing. RY: Software, Visualization, Writing – review & editing. PT: Formal analysis, Visualization, Writing – review & editing. KG: Validation, Writing – review & editing. TY: Methodology, Writing – review & editing. QL: Resources, Software, Writing – review & editing. FL: Conceptualization, Supervision, Validation, Writing – review & editing. XL: Data curation, Supervision, Validation, Writing – review & editing.
The author(s) declare financial support was received for the research, authorship, and/or publication of this article. This work was funded by the construction project of Gansu Provincial Science and Technology Major Project (23ZDFA009), the “Innovative Team for Water Saving Irrigation and Water Resource Regulation in Arid Irrigation Areas” in the discipline of water conservancy engineering at Gansu Agricultural University (GSAU-XKJS-2023-38), Technical Consulting Project of Gansu Provincial Department of Water Resources (GSAU-JSZX-2023- 001), the National Natural Science Foundation of China (51509039), and Gansu Province Water Conservancy Research and Technology Promotion Plan Project (23 GSLK012, 23 GSLK013).
We thank editors and reviewers for their valuable comments and suggestions on the manuscript.
The authors declare that the research was conducted in the absence of any commercial or financial relationships that could be construed as a potential conflict of interest.
All claims expressed in this article are solely those of the authors and do not necessarily represent those of their affiliated organizations, or those of the publisher, the editors and the reviewers. Any product that may be evaluated in this article, or claim that may be made by its manufacturer, is not guaranteed or endorsed by the publisher.
Budak, E., Güneş, A. (2023). The effects of potassium applied at different doses and times on the yield and nutrient content of pumpkin seed (Cucurbita pepo L.). Gesunde Pflanz. 75, 2879–2887. doi: 10.1007/s10343-023-00865-w
Cai, Z., Bai, J. M., Li, R., He, D. W., Du, R. C., Li, D. Y., et al. (2023). Water and nitrogen management scheme of melon based on yield–quality–efficiency matching perspective under CO2 enrichment. Agr. Water Manage 285, 108379. doi: 10.1016/j.agwat.2023.108379
Chen, J., Zhang, Y., Tan, Y., Zhang, M., Fan, X. (2016). Agronomic nitrogen-use efficiency of rice can be increased by driving OsNRT2.1 expression with the OsNAR2.1 promoter. Plant Biotechnol. J. 14, 1705–1715. doi: 10.1111/pbi.12531
Chen, Y., Zhou, X. Z., Lin, Y. S., Ma, L. N. (2019). Pumpkin yield affected by soil nutrients and the interactions of nitrogen, phosphorus, and potassium fertilizers. HortScience 54 (10), 1831–1835. doi: 10.21273/HORTSCI14152-19
Cheng, L. F. (2020). Effects of fertilizationand N, P, K application rates on the growth, yield, and quality of pumpkin. Hunan Agric. Univ. doi: 10.27136/d.cnki.ghunu.2020.000480
Cheng, L. F., Dai, S. H., Chen, S. X., Li, Y. L., Sun, X. W., He, C. Z. (2019). Effects of different fertilization methods on growth ,yield and quality of pumpkin. Chin. Cucurbits Vegetables 32, 22–24. doi: 10.16861/j.cnki.zggc.2019.0225
Cheng, M. H., Wang, H. D., Zhang, F. C., Wang, X. K., Liao, Z. Q., Zhang, S. H., et al. (2023). Effects of irrigation and fertilization regimes on tuber yield, water-nutrient uptake and productivity of potato under drip fertigation in sandy regions of northern China. Agr. Water Manage. 287, 108459. doi: 10.1016/j.agwat.2023.108459
Da, R.B.L.A.S., Zotarelli, L., Dukes, M. D., van Santen, E., Asseng, S. (2023). Nitrogen fertilizer rate and timing of application for potato under different irrigation methods. Agr. Water Manage. 283, 0378–3774. doi: 10.1016/j.agwat.2023.108312
Dou, X., Wang, R., Zhou, X., Gao, F., Yu, Y., Li, C., et al. (2022). Soil water, nutrient distribution and use efficiencies under different water and fertilizer coupling in an apple–maize alley cropping system in the Loess Plateau, China. Soil Till. Res. 218, 105308. doi: 10.1016/j.still.2021.105308
Fan, M. H., Zhang, B. G., Cao, J., Song, Z. (2017). Effects of water and fertilizer coupling on growth and sound seedling index of green cabbage seedlings. Agric. Sci. Technol. 18, 805–838.
FAO (2021) The State of Food Security and Nutrition in the World 2021. Available online at: https://data.unicef.org/resources/sofi-2021/.
Fu, S. N., Wei, X. G., Wang, T. L., Bai, Y. K. (2022). Effects of different water and fertilizer treatments on grapevine sap flow and water consumption characteristics. Scientia Hortic. 304, 111317. doi: 10.1016/j.scienta.2022.111317
He, Z. J., Hu, Q. Y., Zhang, Y., Zhang, Y., Nan, X. P., Li, Z. J. (2023b). Optimization of apple irrigation and N fertilizer in Loess Plateau of China based on ANP-EWM-TOPSIS comprehensive evaluation. Scientia Hortic. 311, 111794. doi: 10.1016/j.scienta.2022.111794
He, R., Tong, C. F., Wang, J., Qin, Z. Y., Zhen, Z. X., Guo, S. H., et al. (2023a). Effects of water and nitrogen regulation on growth, water-fertilizer use efficiency and soil water-salt distribution in sunflower. J. Of Irrigation And Drainage 42, 73–81. doi: 10.13522/j.cnki.ggps.2023257
Hong, T. T., Cai, Z. L., Li, R., Liu, J. C., Li, J. L., Wang, Z., et al. (2022). Effects of water and nitrogen coupling on watermelon growth, photosynthesis and yield under CO2 enrichment. Agr. Water Manage 259, 107229. doi: 10.1016/j.agwat.2021.107229
Huang, Y., Yang, Y. R., Yu, J. X., Jia, X. H., Yi, F. K., Ya, R. D., et al. (2023). Interaction of the coupled effects of irrigation mode and nitrogen fertilizer format on tomato production. Water 15, 1546. doi: 10.3390/w15081546
Jahromi, M. N., Razzaghi, F., Zand-Parsa, S. (2023). Strategies to increase barley production and water use efficiency by combining deficit irrigation and nitrogen fertilizer. Irrigation Sci. 41, 261–275. doi: 10.1007/s00271-022-00811-0
Khalili, M., Nejatzadeh, F. (2021). Effect of deficit irrigation and kaolin clay on yield and yield components of pumpkin ( Cucurbita pepo L.). SN Appl. Sci. 3, 1–11. doi: 10.1007/s42452-021-04536-1
Koc, I., Nzokou, P. (2023). Combined effects of water stress and fertilization on the morphology and gas exchange parameters of 3-year-old Abies fraseri (Pursh) Poir. Acta Physiol. Plant 45. doi: 10.1007/s11738-023-03529-4
Li, H. T., Shao, L. W., Liu, X. W., Sun, H. Y., Chen, S. Y., Zhang, X. Y. (2023). What matters more, biomass accumulation or allocation, in yield and water productivity improvement for winter wheat during the past two decades? Eur. J. Agron. 149, 126910. doi: 10.1016/j.eja.2023.126910
Li, X., Zhang, H. J., Li, F. Q., Deng, H. L., Wang, Z. Y., Chen, X. T. (2022). Evaluating effects of regulated deficit irrigation under mulched on yield and quality of pumpkin in a cold and arid climate. Water 14, 1563. doi: 10.3390/w14101563
Liu, Y. A., Bai, M. J., Li, Y. N., Zhang, B. Z., Wu, X. B., Shi, Y., et al. (2023). Evaluating the combined effects of water and fertilizer coupling schemes on pear vegetative growth and quality in north China. Agronomy 13, 867. doi: 10.3390/agronomy13030867
Liu, S. Q., Cao, H. X., Zhang, J. Q., Hu, X. T. (2014). The effects of different water and nitrogen supply on the growth, yield, and water and nitrogen utilization efficiency of pumpkin roots. Scientia Agricultura Sin. 47, 1362–1371. doi: 10.3864/j.issn.0578-1752.2014.07.013
Liu, X., Li, M., Guo, P., Zhang, Z. X. (2019). Optimization of water and fertilizer coupling system based on rice grain quality. Agr. Water Manage. 221, 34–46. doi: 10.1016/j.agwat.2019.04.009
Liu, P. Z., Li, M. H., Song, Y. C., Yang, D., Gao, X. D. (2021a). Effects of fertigation on yield, water and nitrogen utilization and economic productivity benefit of wolfberry (Lycium barbarum L.). Plant Nutr. Fertilizer Sci. 27, 1820–1828. doi: 10.11674/zwyf.2021166. a.
Liu, Y. W., Zhou, X., Han, H. H., Yang, Q. L., Liu, X. G. (2021b). Coupling scheme optimization of panax notoginseng considering yield, quality and water-fertilizer use efficiency. Trans. Chin. Soc. Agric. Eng. 37, 139–146. doi: 10.11975/j.issn.1002-6819.2021.19.016
Ma, J. Q., He, Q. X., Liu, L. (2021). Optimizing irrigation and fertilization coupling to balance the improvement of yield and water use efficiency of summer maize. J. Irrigation Drainage 40, 58–63. doi: 10.13522/j.cnki.ggps.20202036
Ma, Z. H., Yin, J., Yang, Y. P., Sun, F. B., Yang, Z. (2023). Effect of water and nitrogen coupling regulation on the growth, physiology, yield, and quality attributes and comprehensive evaluation of wolfberry (Lycium barbarum L.). Front. Plant Sci. 14. doi: 10.3389/fpls.2023.1130109
Naderi, M. R., Bannayan, M., Goldani, M., Alizadeh, A. (2017). Effect of nitrogen application on growth and yield of pumpkin. J. Plant Nutr. 40, 890–907. doi: 10.1080/01904167.2016.1262416
Piri, H., Albalasmeh, A. (2022). Interactive effects of deficit irrigation and vermicompost on yield, quality, and irrigation water use efficiency of greenhouse cucumber. J. Arid Land 14, 1274–1292. doi: 10.1016/j.scienta.2022.111794
Rico, X., Gullón, B., Alonso, L. J., Yáñez, R. (2020). Recovery of high value-added compounds from pineapple, melon, watermelon and pumpkin processing by-products: an overview. Food Res. Int. 132, 109086. doi: 10.1016/j.foodres.2020.109086
Wang, J. P., Chen, H. Y., Ma, R. H., Shao, J. F., Huang, S. J., Liu, Y., et al. (2021). Novel water- and fertilizer-management strategy: Nutrient-water carrier. J. Clean. Prod. 291, 125961. doi: 10.1016/j.jclepro.2021.125961
Wang, J. X., He, X. L., Gong, P., Zhao, D. ,. Q., Zhang, Y., Wang, Z. L., et al. (2022a). Optimization of a water-saving and fertilizer-saving model for enhancing xinjiang korla fragrant pear yield, quality, and net profits under water and fertilizer coupling. Sustainability 14, 8495. doi: 10.3390/su14148495
Wang, P. B., Li, J. M., Ding, J. J., Liu, G. Y., Du, Q. J. (2015). Effect of water and fertilizer coupling on quality, yield and water use efficiency of tomato cultivated by organic substrate in bag. Scientia Agricultura Sin. 48, 314–323. doi: 10.3864/j.issn.0578-1752.2015.02.11
Wu, W. X., Fu, W. X., Juha, M. A., Ma, Z. X., Bai, Y. (2022). Effects of coupling water and fertilizer on agronomic traits, sugar content and yield of sugarcane in Guangxi, China. Agronomy 12, 321. doi: 10.3390/agronomy12020321
Wu, Y., Si, W., Yan, S. C., Wu, L. F., Zhao, W. J., Zhang, J. L., et al. (2023). Water consumption, soil nitrate-nitrogen residue and fruit yield of drip-irrigated greenhouse tomato under various irrigation levels and fertilization practices. Agr. Water Manage. 277, 108092. doi: 10.1016/j.agwat.2022.108092
Xiao, C., Zou, H., Fan, J., Zhang, F., Li, Y., Sun, S., et al. (2021). Optimizing irrigation amount and fertilization rate of drip-fertigated spring maize in northwest China based on multi-level fuzzy comprehensive evaluation model. Agr. Water Manage. 257, 107157. doi: 10.1016/j.agwat.2021.107157
Yang, X. T., Zhang, H. J., Zhang, M., Ba, Y. C. (2016). Effects of irrigation amount and frequency on water consumption characteristics and water productivity of pumpkin. Acta Agriculturae Boreali-Sinica 31, 192–198. doi: 10.7668/hbnxb.2016.04.030
Ye, T. Y., Ma, J. F., Zhang, P., Shan, S., Liu, L. L., Tang, L., et al. (2022). Interaction effects of irrigation and nitrogen on the coordination between crop water productivity and nitrogen use efficiency in wheat production on the North China Plain. Agr. Water Manage. 271. doi: 10.1016/j.agwat.2022.107787
Yu, Y. H., Wang, Y., Zhong, X. P. (2019). Current state and prospects of the research on water-fertilizer coupling in planted forest. World Forestry Res. 32, 35–39. doi: 10.13348/j.cnki.sjlyyj.2019.0008.y
Yue, W. J., Liu, L. S., Chen, S., Bai, Y., Li, N. Y. (2022). Effects of water and nitrogen coupling on growth, yield and quality of greenhouse tomato. Water 14, 3665. doi: 10.3390/w14223665
Yue, X., Yang, Q., Liang, J., Tang, J., Yang, Y. (2023). Alternate micro-sprinkler irrigation synergized with organic fertilizer: A sustainable water-fertilizer management technology of improving quality and increasing efficiency in Panax notoginseng production. Ind. Crops Products 194, 116335. doi: 10.1016/j.indcrop.2023.116335
Zeng, L., Wang, Z., He, Z., Zeng, M., Qin, F., Chen, J. (2023). Physicochemical and gel properties of pumpkin seed protein: a comparative study. Int. J. Food Sci. Tech. 58, 1639–1651. doi: 10.1111/ijfs.16124
Zhang, F., Chen, M. R., Fu, J. T., Zhang, X. Z., Li, Y., Shao, Y. T., et al. (2023a). Coupling effects of irrigation amount and fertilization rate on yield, quality, water and fertilizer use efficiency of different potato varieties in Northwest China. Agr. Water Manage. 287, 108446. doi: 10.1016/j.agwat.2023.108446
Zhang, J. X., Du, L. L., Xing, Z. S., Zhang, R., Li, F. Q., Zhong, T., et al. (2023b). Effects of dual mulching with wheat straw and plastic film under three irrigation regimes on soil nutrients and growth of edible sunflower. Agr. Water Manage. 288, 108453. doi: 10.1016/j.agwat.2023.108453
Zhang, T. T., Duan, Y., Zhang, J., An, H., Liang, J. M., Fan, X., et al. (2023c). Study on water demand and coupling effect of water and nitrogen on sunflower in the north of Yinshan Mountain. J. Irrigation Drainage 42(10), 23–31. doi: 10.13522/j.cnki.ggps.2022624
Zhang, F. C., Gao, Y., Jiao, W., Hu, W. H. (2017b). Effects of water and fertilizer supply on growth, water and nutrient use efficiencies of potato in sandy soil of yulin area. Trans. Chin. Soc. Agric. Machinery 48, 270–278. doi: 10.6041/j.issn.1000-1298.2017.03.034
Zhang, Y., Qiang, S. C., Zhang, G. X., Sun, M., Wen, X. X., Liao, Y. C., et al. (2023d). Effects of ridge–furrow supplementary irrigation on water use efficiency and grain yield of winter wheat in Loess Plateau of China. Agr. Water Manage. 289, 108537. doi: 10.1016/j.agwat.2023.108537
Zhang, F. C., Yan, F. L., Fan, X. K., Li, G. D., Liu, X., Lu, J. S., et al. (2018). Effects of irrigation and fertilization levels on grain yield and water-fertilizer use efficiency of drip-fertigation spring maize in Ningxia. Trans. Chin. Soc. Agric. Eng. 34, 111–120. doi: 10.11975/j.issn.1002-6819.2018.22.014
Zhang, Z. X., Zhang, S. W., Guo, D., Tan, Z. X., Chen, X. (2017a). Coupling effects of different water and fertilizer conditions and optimization of water and fertilizer schemes on maize. Trans. Chin. Soc. Agric. Machinery 48, 206–214. Available at: https://kns.cnki.net/kcms2/article/abstract?v=ttOPOQ75YvJp0lOIOGeDRPHnb9bzXuejd4OB3TiyhEzbeOpsq3nuk7UOgbEOafq98Dz9QWTtoDRfnrbm9pNO3H2t_Eu486klhnM8JLFw95gfWzNl-F_J3qSHzjURHymUq431jFa9UFmH8GGtCxqNQg==&uniplatform=NZKPT&language=CHS
Keywords: irrigation volume and organic fertilizer amount, water-fertilizer coupling, agricultural water management, water-fertilizer use efficiency, pumpkin yield, comprehensive evaluation
Citation: Zhong T, Zhang J, Du L, Ding L, Zhang R, Liu X, Ren F, Yin M, Yang R, Tian P, Gan K, Yong T, Li Q, Li F and Li X (2024) Comprehensive evaluation of the water-fertilizer coupling effects on pumpkin under different irrigation volumes. Front. Plant Sci. 15:1386109. doi: 10.3389/fpls.2024.1386109
Received: 14 February 2024; Accepted: 01 April 2024;
Published: 19 April 2024.
Edited by:
Miroslav Zoric, LoginEKO Research and Development Center, SerbiaReviewed by:
Milka Brdar-Jokanović, Institute of Field and Vegetable Crops, SerbiaCopyright © 2024 Zhong, Zhang, Du, Ding, Zhang, Liu, Ren, Yin, Yang, Tian, Gan, Yong, Li, Li and Li. This is an open-access article distributed under the terms of the Creative Commons Attribution License (CC BY). The use, distribution or reproduction in other forums is permitted, provided the original author(s) and the copyright owner(s) are credited and that the original publication in this journal is cited, in accordance with accepted academic practice. No use, distribution or reproduction is permitted which does not comply with these terms.
*Correspondence: Jinxia Zhang, amlueGlhemhhbmcxOTc3QDE2My5jb20=
†These authors share first authorship
Disclaimer: All claims expressed in this article are solely those of the authors and do not necessarily represent those of their affiliated organizations, or those of the publisher, the editors and the reviewers. Any product that may be evaluated in this article or claim that may be made by its manufacturer is not guaranteed or endorsed by the publisher.
Research integrity at Frontiers
Learn more about the work of our research integrity team to safeguard the quality of each article we publish.