 Rongrong Tian
 Jinghai Wang*Minhua Yin*Yanlin MaQiong JiaYanxia KangGuangping QiYalin GaoYuanbo JiangHaiyan LiFeng Xiao
- College of Water Conservancy and Hydropower Engineering, Gansu Agricultural University, Lanzhou, China
Resource-based water shortages, uncoordinated irrigation, and fertilization are prevalent challenges in agricultural production. The scientific selection of appropriate water and fertilizer management methods is important for improving the utilization efficiency of agricultural resources and alleviating agricultural non-point source pollution. This study focused on wolfberry and compared the effects of four irrigation levels [full irrigation (W0, 75%–85% θf), slight water deficit (W1, 65%–75% θf), moderate water deficit (W2, 55%–65% θf), and severe water deficit (W3, 45%–55% θf)] and four nitrogen application levels [no nitrogen application (N0, 0 kg·ha−1), low nitrogen application (N1, 150 kg·ha−1), medium nitrogen application (N2, 300 kg·ha−1), and high nitrogen application (N3, 450 kg·ha−1)] on soil nitrate nitrogen (NO3−–N) transport, plant nitrogen allocation, and soil nitrous oxide (N2O) emissions during the harvest period of wolfberry. And this study used CRITIC-entropy weights-TOPSIS model to evaluate 16 water and nitrogen regulation models comprehensively. The results revealed the following: (1) The NO3−–N content of the soil decreased with increasing horizontal distance from the wolfberry. It initially decreased, then increased, and finally decreased with an increase in soil depth. The average NO3−–N content in the 0–100 cm soil layer ranged from 3.95–13.29 mg·kg−1, indicating that W0 > W1, W2, W3, and N3 > N2 > N1 > N0. (2) The soil NO3−–N accumulation ranged from 64.45–215.27 kg·ha−1 under varying water and nitrogen levels, demonstrating a decreasing trend with increasing horizontal distance. The NO3−–N accumulation at each horizontal distance increased with increasing irrigation and nitrogen application. The NO3−–N accumulation of W0N3 treatment increased by 5.55%–57.60% compared with the other treatments. (3) The total nitrogen content and nitrogen uptake in all wolfberry organs were W1 > W0 > W2 > W3, and N2 > N3 > N1 > N0. The maximum total nitrogen content and nitrogen uptake in W1N2 treatment were 3.25% and 27.82 kg·ha−1 in the roots, 3.30% and 57.19 kg·ha−1 in the stems, 3.91% and 11.88 kg·ha−1 in the leaves, and 2.42% and 63.56 kg·ha−1 in the fruits, respectively. (4) The emission flux and total emission of N2O increased with increasing irrigation and nitrogen application. The emission flux exhibited a transient peak (116.39–177.91 ug·m−2·h−1) after irrigation. The intensity of N2O emissions initially decreased and then increased with an increase in the irrigation amount. It also initially increased with increasing nitrogen application amount, then decreased, and finally increased again. The maximum emission intensity was observed under the W3N3 treatment (0.23 kg·kg−1). The N2O emission coefficients ranged from 0.17%–0.39%, in the order of W0 > W1 > W2 > W3 (except for N1) and N1 > N2 > N3. (5) Under varying water and nitrogen concentrations, N2O emission flux showed a positive linear correlation with soil pore water content and NO3−–N content and a negative linear correlation with soil temperature. The comprehensive evaluation revealed that a slight water deficit (65%–75% θf) combined with medium nitrogen application (300 kg·ha−1) decreased soil NO3−–N leaching, increased nitrogen uptake, and reduced N2O emission. These findings can serve as a reference for improving the efficiency and reducing emissions of wolfberry in the Yellow River irrigation region of Gansu Province and in similar climate zones.
1 Introduction
The evolutionary relationship between crop growth and water and fertilizer management has a significant impact on agricultural production potential, the improvement of water and fertilizer utilization efficiency, and the prevention and control of non-point source pollution in agricultural. This has long-standing concern agricultural science (Ju et al., 2016). However, influenced by the traditional idea that high water and fertilizer usage leads to increased yields, farmers often tend to over-invest in these resources, ignoring the laws governing crop water and fertilizer demand. This results in the inadequate utilization of water and fertilizer resources and exacerbates serious agricultural non-point source pollution (Xing et al., 2021). This is inconsistent with China’s major strategic deployments such as the “one control, two reduction and three basic” requirements proposed in 2020, the zero growth in the use of fertilizers and pesticides and the effective utilization coefficient of irrigation water reaching 0.6 by 2030, and the “dual carbon” goal (Wang et al., 2022). Therefore, to further alleviate the contradiction between the water and fertilizer supply and demand and improve the soil environment, it is important to investigate farmland management strategies that involve “promoting fertilizer with water and transferring water with fertilizer” to promote the green and high-quality development of agricultural production.
Water and nitrogen play important roles in regulating crop growth and development, soil nitrogen leaching, and greenhouse gas emissions (Wang et al., 2018a). Water infiltration and redistribution can indirectly affect soil nutrient availability by affecting litter decomposition and element mineralization processes (Liu et al., 2006), ultimately enhancing soil fertility and plant nutrient absorption. Nitrogen addition can increase soil available nitrogen content and enhance plant nitrogen absorption. However, this can lead to residue problems in the soil, increasing the substrate concentration of soil microbial nitrification-denitrification, and resulting in higher soil N2O emissions (Song et al., 2013). In addition, the supply of water and nitrogen is not directly proportional to crop nitrogen absorption, soil inorganic nitrogen residues, or greenhouse gas emissions. On the one hand, if the water and nitrogen supply are lower than the crop absorption threshold, crop production potential will be restricted, and water and fertilizer utilization efficiency will be reduced (Liao et al., 2021). On the other hand, excessive water and nitrogen cause ecological and environmental problems, such as groundwater pollution, soil acidification, and nitrogen deposition (Yan et al., 2016; Chen et al., 2020). In context of soil-plant nitrogen transport, well-designed irrigation and fertilization strategies can minimize soil NO3−–N leaching and accumulation while enhancing crop nitrogen absorption (Azad et al., 2020). Water-saving and nitrogen-reduction measures significantly reduce soil NO3−–N leaching compared with high water and high nitrogen and increase plant biomass and nitrogen uptake (Cong et al., 2021; Mohkum et al., 2023). Irrigation with 120 mm of water coupled with nitrogen application of 180 kg·ha−1 can increase nitrogen content in the stems and leaves as well as promote nitrogen uptake by summer cotton plants, maximizing the total aboveground nitrogen uptake of summer cotton (Si et al., 2017). In terms of soil N2O emissions, the N2O emissions are significantly affected by water and nitrogen. In winter wheat-spring maize rotation, N2O emissions increase with increasing irrigation water and nitrogen application (Li et al., 2016). However, in the facility vegetable land, a combination of medium water (irrigation of 204.6 mm) and low nitrogen (nitrogen application of 75 kg·ha−1) compared with high water and high nitrogen (irrigation of 239.9 mm, nitrogen application of 525 kg·ha−1) can effectively mitigate reduce greenhouse effects and reduce the total amount of N2O emissions (Du et al., 2019). Irrigation of sugarcane fields with 80%–90% θf combined with nitrogen application of 250 kg·ha−1 can significantly reduce soil N2O emission flux (Chen et al., 2023). In summary, optimizing the allocation of water and nitrogen can enhance crop nitrogen accumulation, transport, and utilization, thereby effectively improving regional ecological conditions (Bai et al., 2018; Li et al., 2015).
The Yellow River irrigation region of Gansu Province is located in and arid to semi-arid inland area of northwest China. It is an important and comprehensive agricultural commodity production base in Gansu Province, with abundant light and heat resources and a significant temperature difference between day and night (Yang et al., 2019). However, the area is characterized by scarce precipitation, water scarcity, and severe secondary soil salinization (Zhao et al., 2019). Wolfberry (Lycium barbarum L.) is a deciduous shrub with a well-developed root system and strong resistance to cold. It has significant effects on windbreak and sand fixation, soil and water conservation, and the improvement of saline-alkaline land improvement (Danial et al., 2022). It is widely planted in the Yellow River irrigation area of Gansu Province. Previous studies on nitrogen transport have mostly focused on food crops (Mahdi et al., 2009; Mario et al., 2017; Wang et al., 2018b) and cash crops (Si et al., 2017; Du et al., 2019; Chen et al., 2023). However, there is a lack of research on economically important forest plants, such as wolfberry. In particular, research on the systematic comparison of nitrogen transport and distribution between soil, wolfberry, and the atmosphere under different water and nitrogen regulations is still rare. In view of this, this study aimed to (1) systematically analyze the distribution and accumulation of soil NO3−–N under different water and nitrogen supplies, the nitrogen distribution and absorption of wolfberry, and the characteristics and influencing factors of soil N2O emissions; (2) comprehensively evaluate different water and nitrogen treatments using the CRITIC-entropy weights-TOPSIS model; and (3) explore water-saving and nitrogen-reducing, water-fertilizer coupling, and environmentally friendly water and nitrogen management modes for wolfberry. This study provides a reference for the efficiency and emission reduction of wolfberry production in the Yellow River irrigation region of Gansu Province and similar arid climate areas.
2 Materials and methods
2.1 Description of the experimental site
The experiment was conducted at the Irrigation Experimental Station (37°23′N, 104°08′E) of the Jingtaichuan Electric Power Irrigation Water Resource Utilization Center in Gansu Province from July to September 2022. This region has a temperate continental arid climate characterized by intense sunshine, infrequent rainfall, and a dry climate. The annual average sunshine duration, frost-free period, radiation amount, temperature, precipitation, and evaporation are 2652 hours, 191 days, 6.18 ×10⁵ J·cm−2, 8.6°C, 201.6 mm, and 3028 mm, respectively. The soil texture at the experimental site was loam, and the dry bulk density of the soil was 1.63 g·cm−3. The field water capacity was 24.1% (mass water content), and the pH was 8.11. Groundwater depth was > 40 m. The initial soil properties of the study site were as follows: total nitrogen 1.62 g·kg−1, total phosphorus 1.32 g·kg−1, total potassium 34.03 g·kg−1, available nitrogen 74.51 mg·kg−1, available phosphorus 26.31 mg·kg−1, available potassium 173 mg·kg−1, and alkali-hydrolyzed nitrogen 55.2 mg·kg−1 in the 0–60 cm soil layer. Meteorological data were collected by a small intelligent agrometeorological station installed at the experimental station. The total amount of precipitation, daily maximum temperature and daily minimum temperature during the experiment were 77.01 mm, 35.07°C and 8.71°C, respectively (Figure 1).
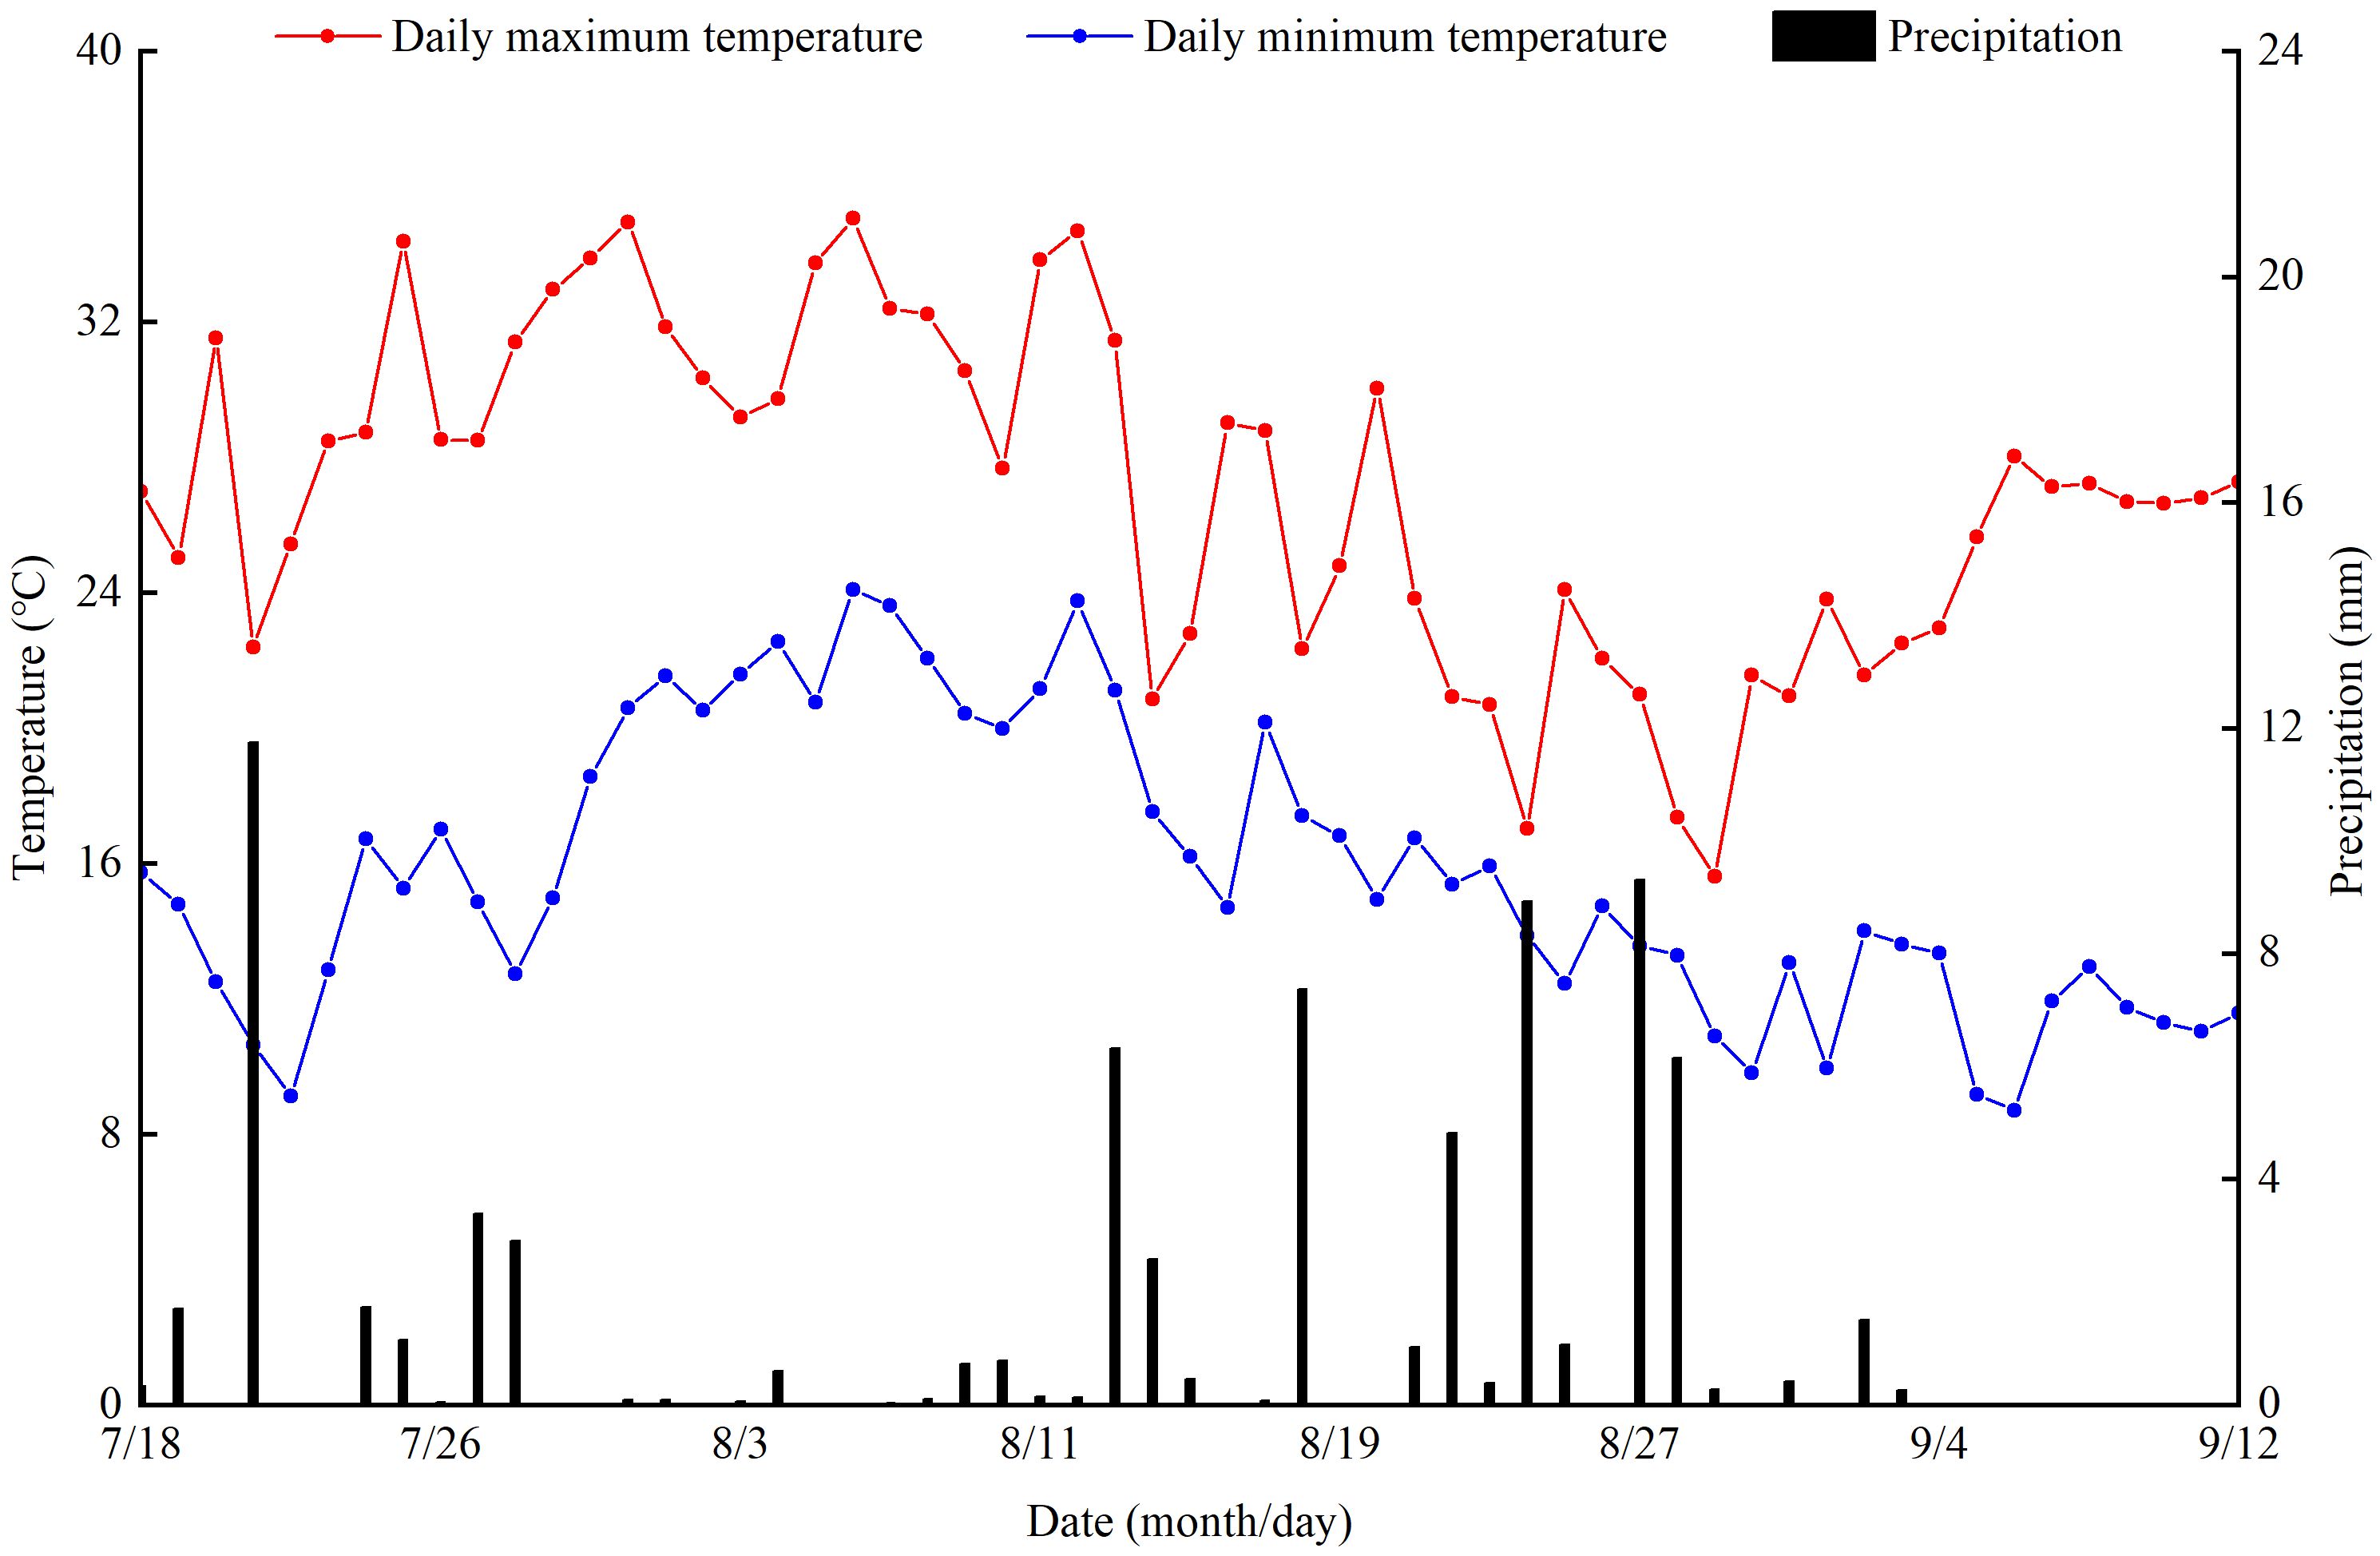
Figure 1 Daily distribution of precipitation and temperature during the experiment.
2.2 Experimental design and field management
The selected wolfberry (Ningqi No.5) was a two-year-old seedling transplanted on 12 April 2021, with a plant spacing of 1.5 m and row spacing of 3.0 m. Based on local production practices and previous studies (Tian et al., 2023), the experiment utilized a completely randomized block design, with irrigation and nitrogen application levels as two factors. Among them, the irrigation levels [the upper and lower limits of irrigation were set to control the percentage of soil volumetric moisture content to field water capacity (θf), and the planned depth of humid layer was 60 cm] included 75%–85% θf (W0, full irrigation), 65%–75% θf (W1, slight water deficit), 55%–65% θf (W2, moderate water deficit) and 45%–55% θf (W3, severe water deficit). The nitrogen application (pure nitrogen) levels included 0 kg·ha−1 (N0, no nitrogen application), 150 kg·ha−1 (N1, low nitrogen application), 300 kg·ha−1 (N2, medium nitrogen application), and 450 kg·ha−1 (N3, high nitrogen application) (Table 1). Thus, there were 16 treatments in total, with each treatment repeated three times. The residential area measures 76.5 m2 (10.2 m × 7.5 m). Drip irrigation was then applied. Valves and water meters (with an accuracy of 0.0001 m3) were independently installed in the water-delivery pipes of each district to regulate the amount of irrigation effectively. The spacing of the drip irrigation belt layout was 0.3 m, the designed flow rate of the drip head was 2.0 L·h−1, and the spacing of the drip head was 0.3 m. The irrigation process during the wolfberry growth is illustrated in Figure 2. The main growth period of wolfberry in 2022 was divided into four stages: the vegetative growth period (26 April to 28 May), the full flowering period (29 May to 30 June), the full fruit period (1 July to 14 August) and the autumn fruit period (15 August to 10 September). In growing season, nitrogen fertilizer (urea and nitrogen content 46%) according to 6:2:2 was applied during the vegetative growth period (21 May), the full flowering period (7 June), and the full fruit period (4 July). Phosphate (superphosphate, with a phosphorus content of 12%) and potassium (potassium chloride, with a potassium content of 60%) at a rate of 130 kg·ha−1 were applied as the base fertilizer in a single application during the vegetative growth period on 21 May. Field management includes pest control and other measures consistent with those of local growers.
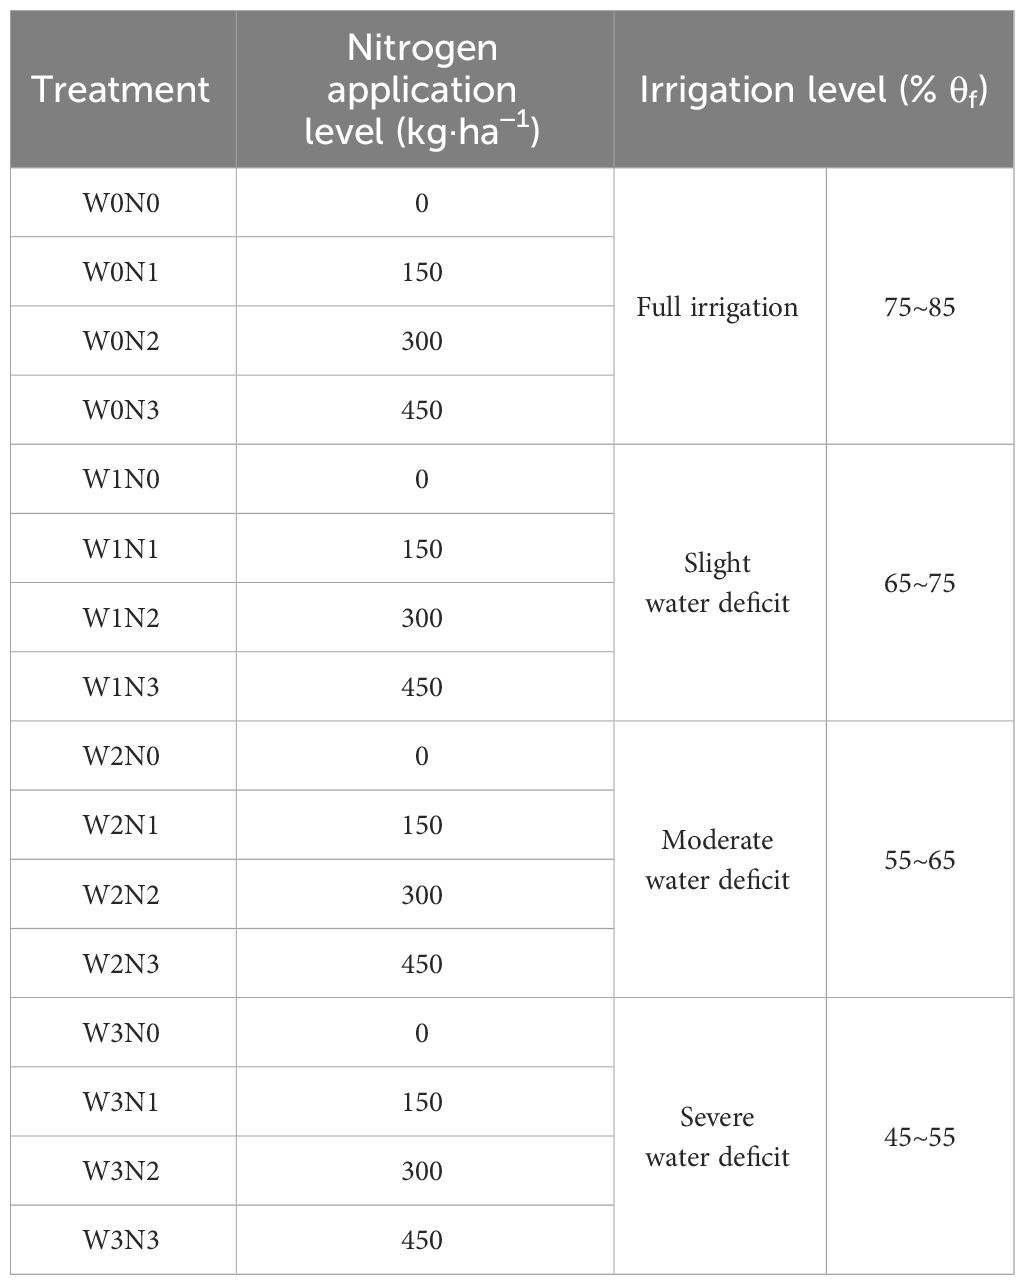
Table 1 Experimental design.
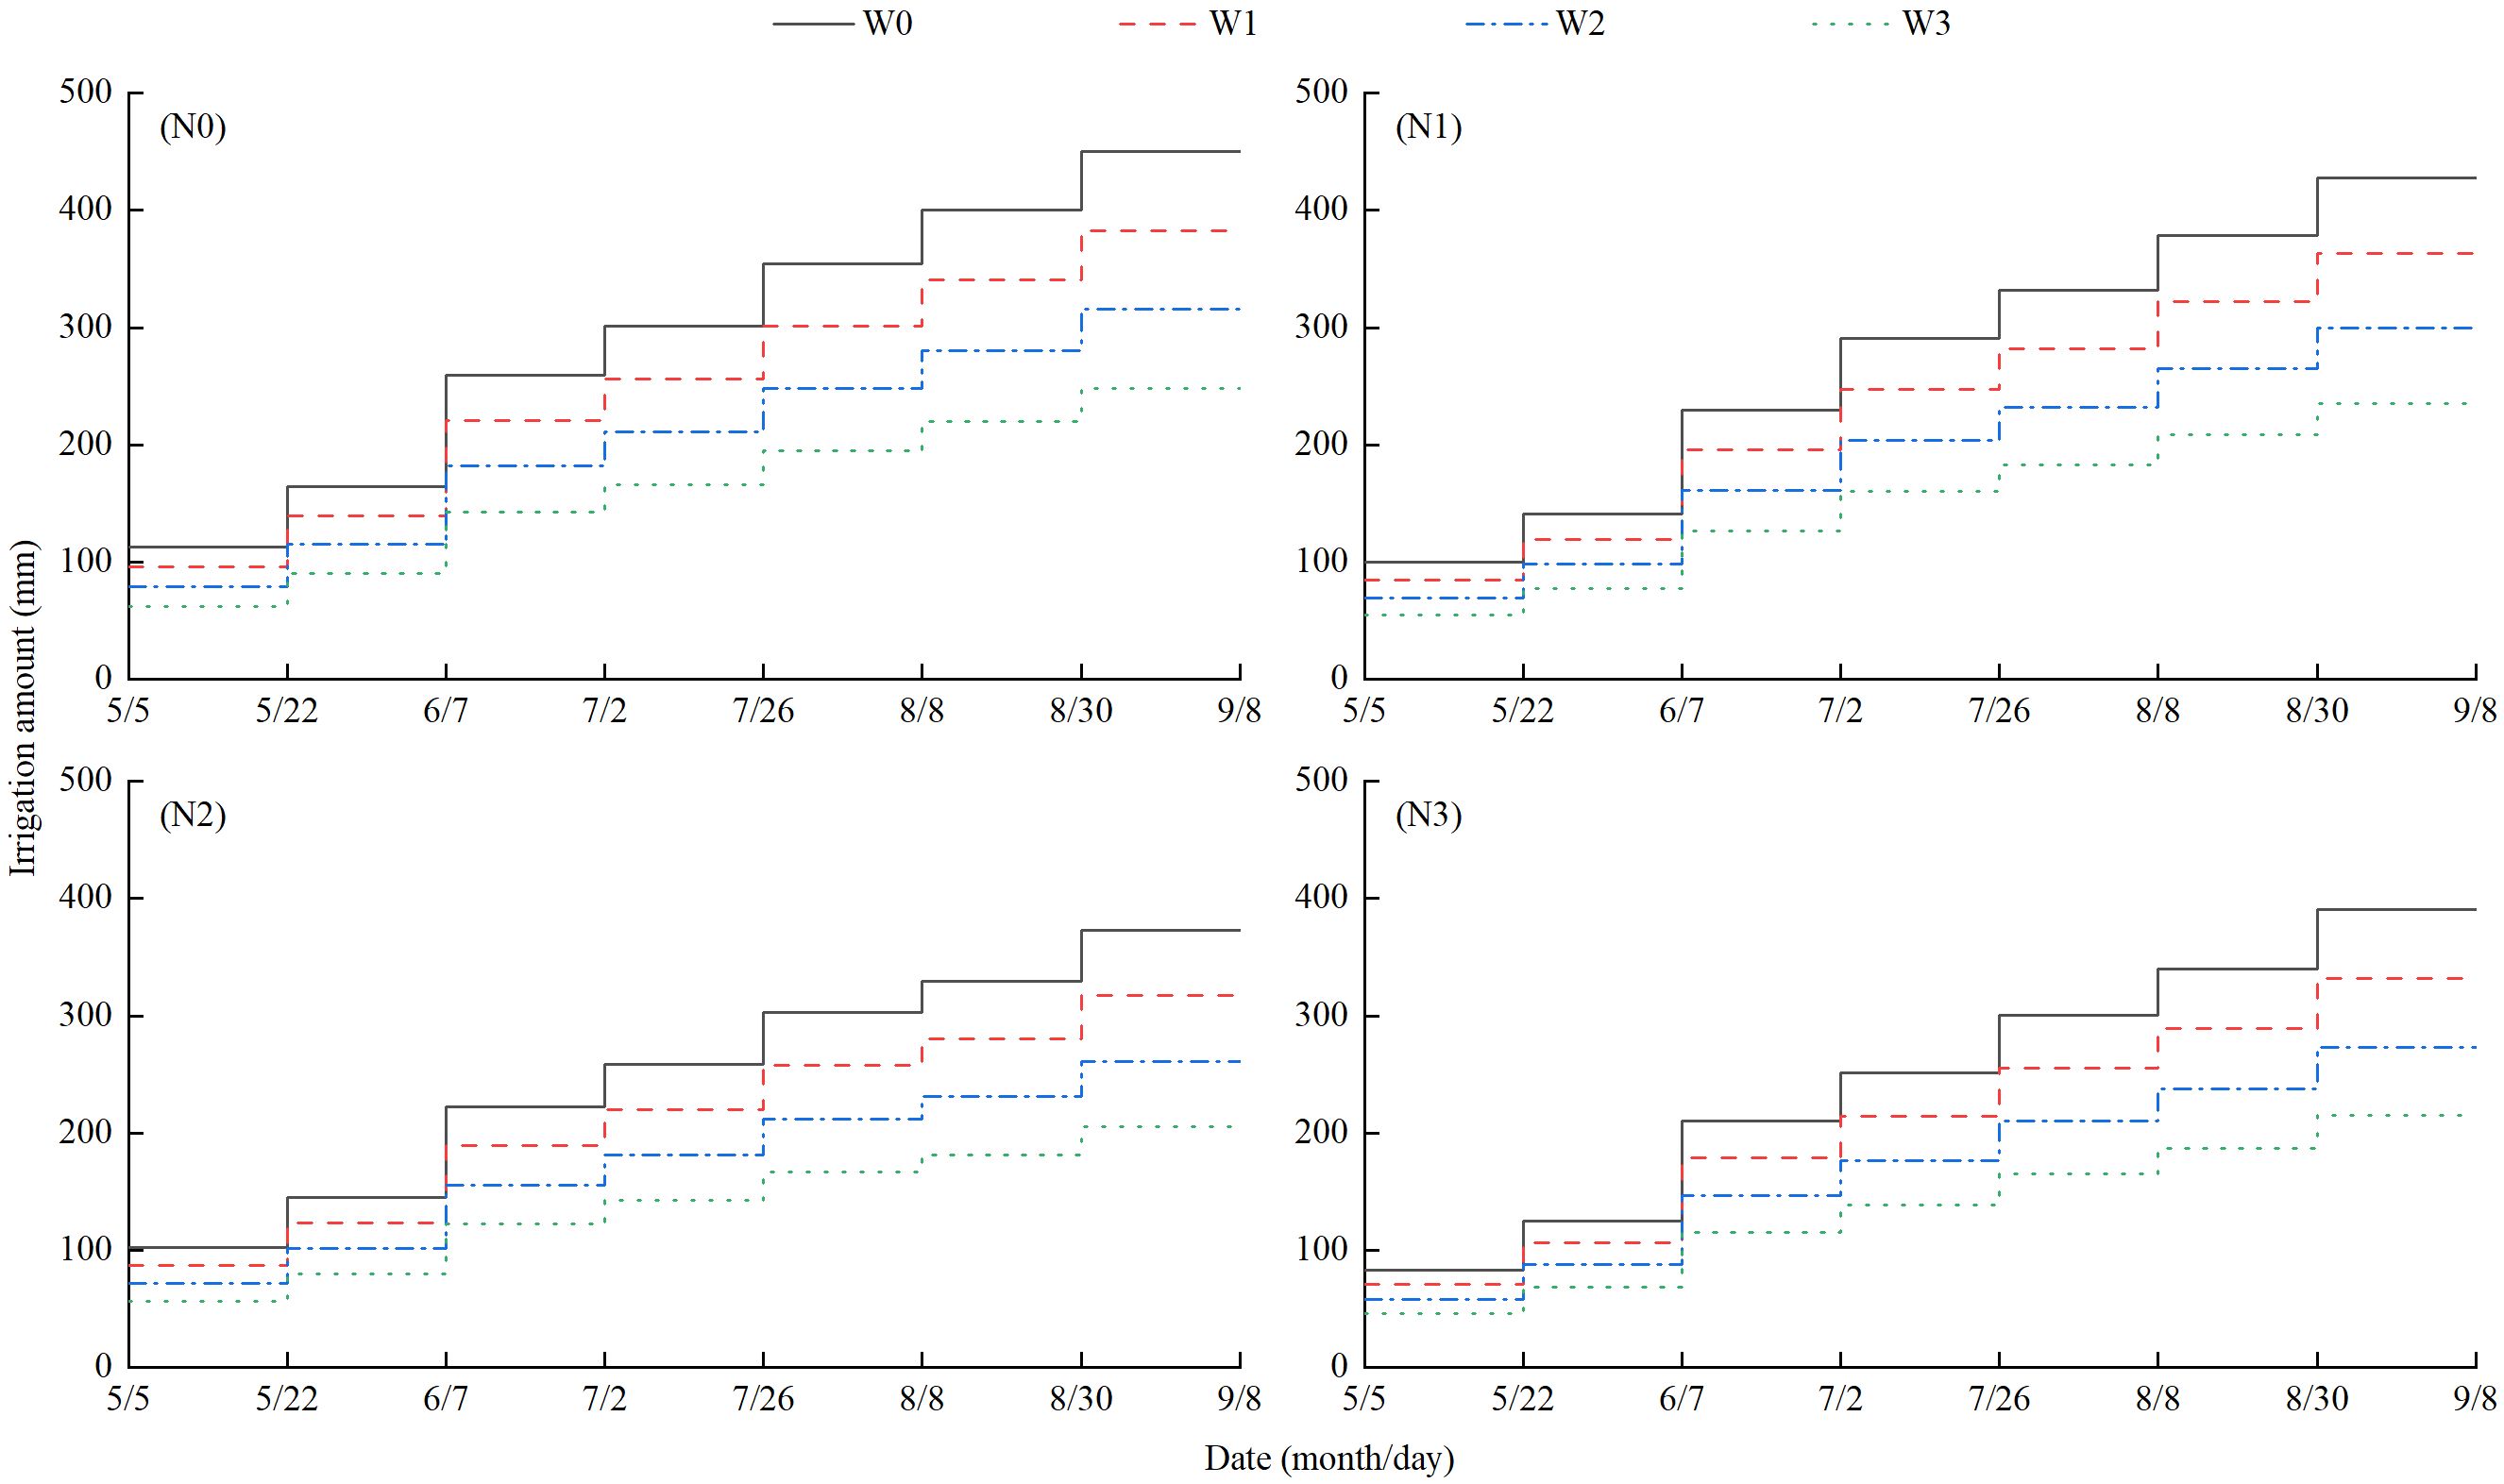
Figure 2 Irrigation process of each treatment during the growth of wolfberry.
2.3 Indicators and methods for measurement
2.3.1 Soil nitrate-nitrogen content (NO3−–N, mg·kg−1)
At the end of the autumn fruit period of wolfberry, soil samples were collected using the soil drilling method. Samples were collected at 10 cm intervals from depths ranging from 0–100 cm. The collection points were located at the distances of 0.3 m, 0.6 m, 0.9 m, 1.2 m, and 1.5 m from the trunk of the wolfberry in the center of the plot. After air-drying, the soil sample was sieved through a 2 mm screen and then extracted with a 2 mol·L−1 KCl solution at a mass ratio of 1:10 (5 g of dry soil to liquid). The concentration of NO3−–N in the soil was subsequently measured using a UV-visible spectrophotometer (Beijing Puxi General Instrument Co., Ltd., T6 New Century) (Wang et al., 2023).
Accumulation of soil nitrate-nitrogen (NR, kg·ha−1) (Cambouris et al., 2008):
where is the bulk density of the soil of layer i (g·cm−3), is the soil thickness of layer i (cm), and is the nitrate nitrogen content of the soil in layer i (mg·kg−1).
2.3.2 Total nitrogen content of wolfberry
Three representative wolfberry plants were selected from each plot for sampling during the harvest period (full fruit period and autumn fruit period). Plant samples were collected and separated into organs. They were then heated at 105 °C for 30 min, dried at 75 °C until reaching a constant weight (kg·ha−1), crushed, sifted through a 0.5 mm sieve, and subsequently treated with H2SO4-H2O2. The total nitrogen content of wolfberry plants was measured using the Kelley nitrogen determination method (Wu et al., 2023).
Organ nitrogen uptake of wolfberry plant (Nu, kg·ha−1):
where Nq represents the total nitrogen content in an organ of the wolfberry plant (%), and W is the dry weight of an organ of the wolfberry plant (kg·ha−1).
2.3.3 Wolfberry yield
After ripening, wolfberries were harvested every seven days based on the plot, naturally dried, weighed, and then converted to yield per unit area (kg·ha−1) according to the plot area.
2.3.4 Nitrous oxide emissions
Nitrous oxide gas (N2O) was collected and measured during the wolfberry harvest period using a closed static camera obscuru gas chromatography (Wu et al., 2022a).
2.3.5 Environmental factors
(1) Soil moisture content
Each time N2O was collected, soil samples were collected from the topsoil layer (0–15 cm) at multiple points in each plot, and soil moisture content was determined using the drying method (105°C for 12 hours) after thorough mixing (%).
Water-filled pore water content of soil (WFPS, %) (Hou et al., 2016):
where θ is the volumetric water content of the 0–15 cm soil layer (%), γ is the soil bulk weight (g·cm−3).
(2) Soil temperature
Each time N2O was collected, the soil temperature at a depth of 15 cm was measured next to the camera obscurum base (°C, right-angle geothermometer).
2.3.6 Relevant calculation formula
(1) N2O emission flux (F, ug·m−2·h−1) (Lu et al., 2022):
where ρ is the density of N2O gas in the standard state (ρ = 2 × 14/22.4 = 1.25) (kg·m−3), H is the height of the box (m), dc/dt is the rate of change of the N2O concentration in the box with time during the sampling process (ul·L−1·min−1), and T is the average temperature inside the gas collection box during the sampling process (°C).
(2) Total N2O emission (f, kg·ha−1) (Gao et al., 2013):
where i is the number of samples, t is the number of days between the i sampling time and the i+1 sampling time (d).
(3) N2O emission intensity (GHGI, kg·kg−1) (Cao et al., 2022):
where GWP is the global warming potential of N2O (kg·ha−1), f is the total N2O emissions (kg·ha−1), and Y is the wolfberry yield (kg·ha−1).
(4) N2O emission coefficient (EF, %) (Burton et al., 2008):
where fN is the total N2O emissions from the nitrogen application treatment (kg·ha−1), f0 is the total N2O emissions from the treatment without nitrogen application (kg·ha−1), and F is the amount of nitrogen applied (kg·ha−1).
2.3.7 CRITIC-entropy weights-TOPSIS model
(1) Consistency of indicator types (Ye et al., 2017; Zhou et al., 2023): Etremely large and small indicators:
Centering indicators:
Where is the transformed value of indicator j for treatment i to be evaluated, is the minimum value of , is the maximum value of , and m is the number of treatments to be evaluated and m=16 in this study.
(2) Data dimensionless (normalization):
In this study, the min-max standardization method was used to normalize the consistent data without dimension.
where is the dimensionless value of .
(1) CRITIC-entropy weighting method to determine the weights:
where is the contribution of treatment i to indicator j, is the information entropy value of the j indicator, is the standard deviation of indicator j, is the information utility value of indicator j, is the weight obtained for each indicator, is the correlation coefficient between indicator j and indicator k, and n is the number of evaluation indicators and n=7 in this study.
(4) Construct a weighted evaluation matrix:
(5) Calculate the relative closeness:
where is the maximum value of indicator j, and is the minimum value of indicator j.
where the values were sorted according to the value of . The larger values were closer to the ideal solution.
2.4 Data analysis
Microsoft Excel 2010 was used for data organization, Equations (1–20) were used to calculate the relevant indicators, and the CRITIC-entropy weights-TOPSIS model was used for comprehensive evaluation. IBM SPSS Statistics software (version 25.0) was used for statistical analysis. One-way ANOVA and the Duncan method were used for variance analysis and multiple comparison of indicators in different treatments (P < 0.05). Two-way ANOVA was performed to examine the effects of water and nitrogen, as well as their interactions, on soil NO3−–N accumulation, nitrogen uptake by wolfberry plants, and soil N2O emission characteristics (P < 0.05). The drawing was created using the Origin 2021 software.
3 Results
3.1 Soil NO3−–N distribution and accumulation under different water and nitrogen regulation
3.1.1 Soil NO3−–N distribution
In the horizontal direction, the NO3−–N content of the soil decreased gradually with increasing horizontal distance from the wolfberry plant, and obvious NO3−–N accumulation zones appeared at 30 cm, 60 cm, and 90 cm from the plant. In the vertical direction, the soil NO3−–N content initially decreased, then increased, and finally decreased with increasing soil depth. An obvious NO3−–N accumulation zone appeared within the 50–80 cm soil layer (Figure 3). At the same irrigation level, the average NO3−–N content in soil layers 0–100 cm away was N3 (6.36–13.29 mg·kg−1) > N2 (5.92–12.55 mg·kg−1) > N1 (5.19–11.53 mg·kg−1) > N0 (3.95–8.39 mg·kg−1). The average NO3−–N contents of N1, N2, and N3 increased by 8.88%–45.06%, 15.71–66.89%, and 47.55%–78.40%, respectively, compared with N0. Under the same level of nitrogen application, at horizontal distances of 30 cm and 60 cm, the average NO3−–N content in the 0–100 cm soil layer showed that W0 > W2 > W1 and W3 as irrigation amount increased, and the average NO3−–N content of W2 decreased by 9.25% and 6.04%, respectively, compared with W0. At horizontal distances of 90 cm, 120 cm, and 150 cm, the average NO3−–N content in the 0–100 cm soil layer showed an increasing trend with increasing irrigation amount, and the average NO3−–N content of W3 decreased by 20.48%, 18.86%, and 26.25%, respectively, compared with that of W0.
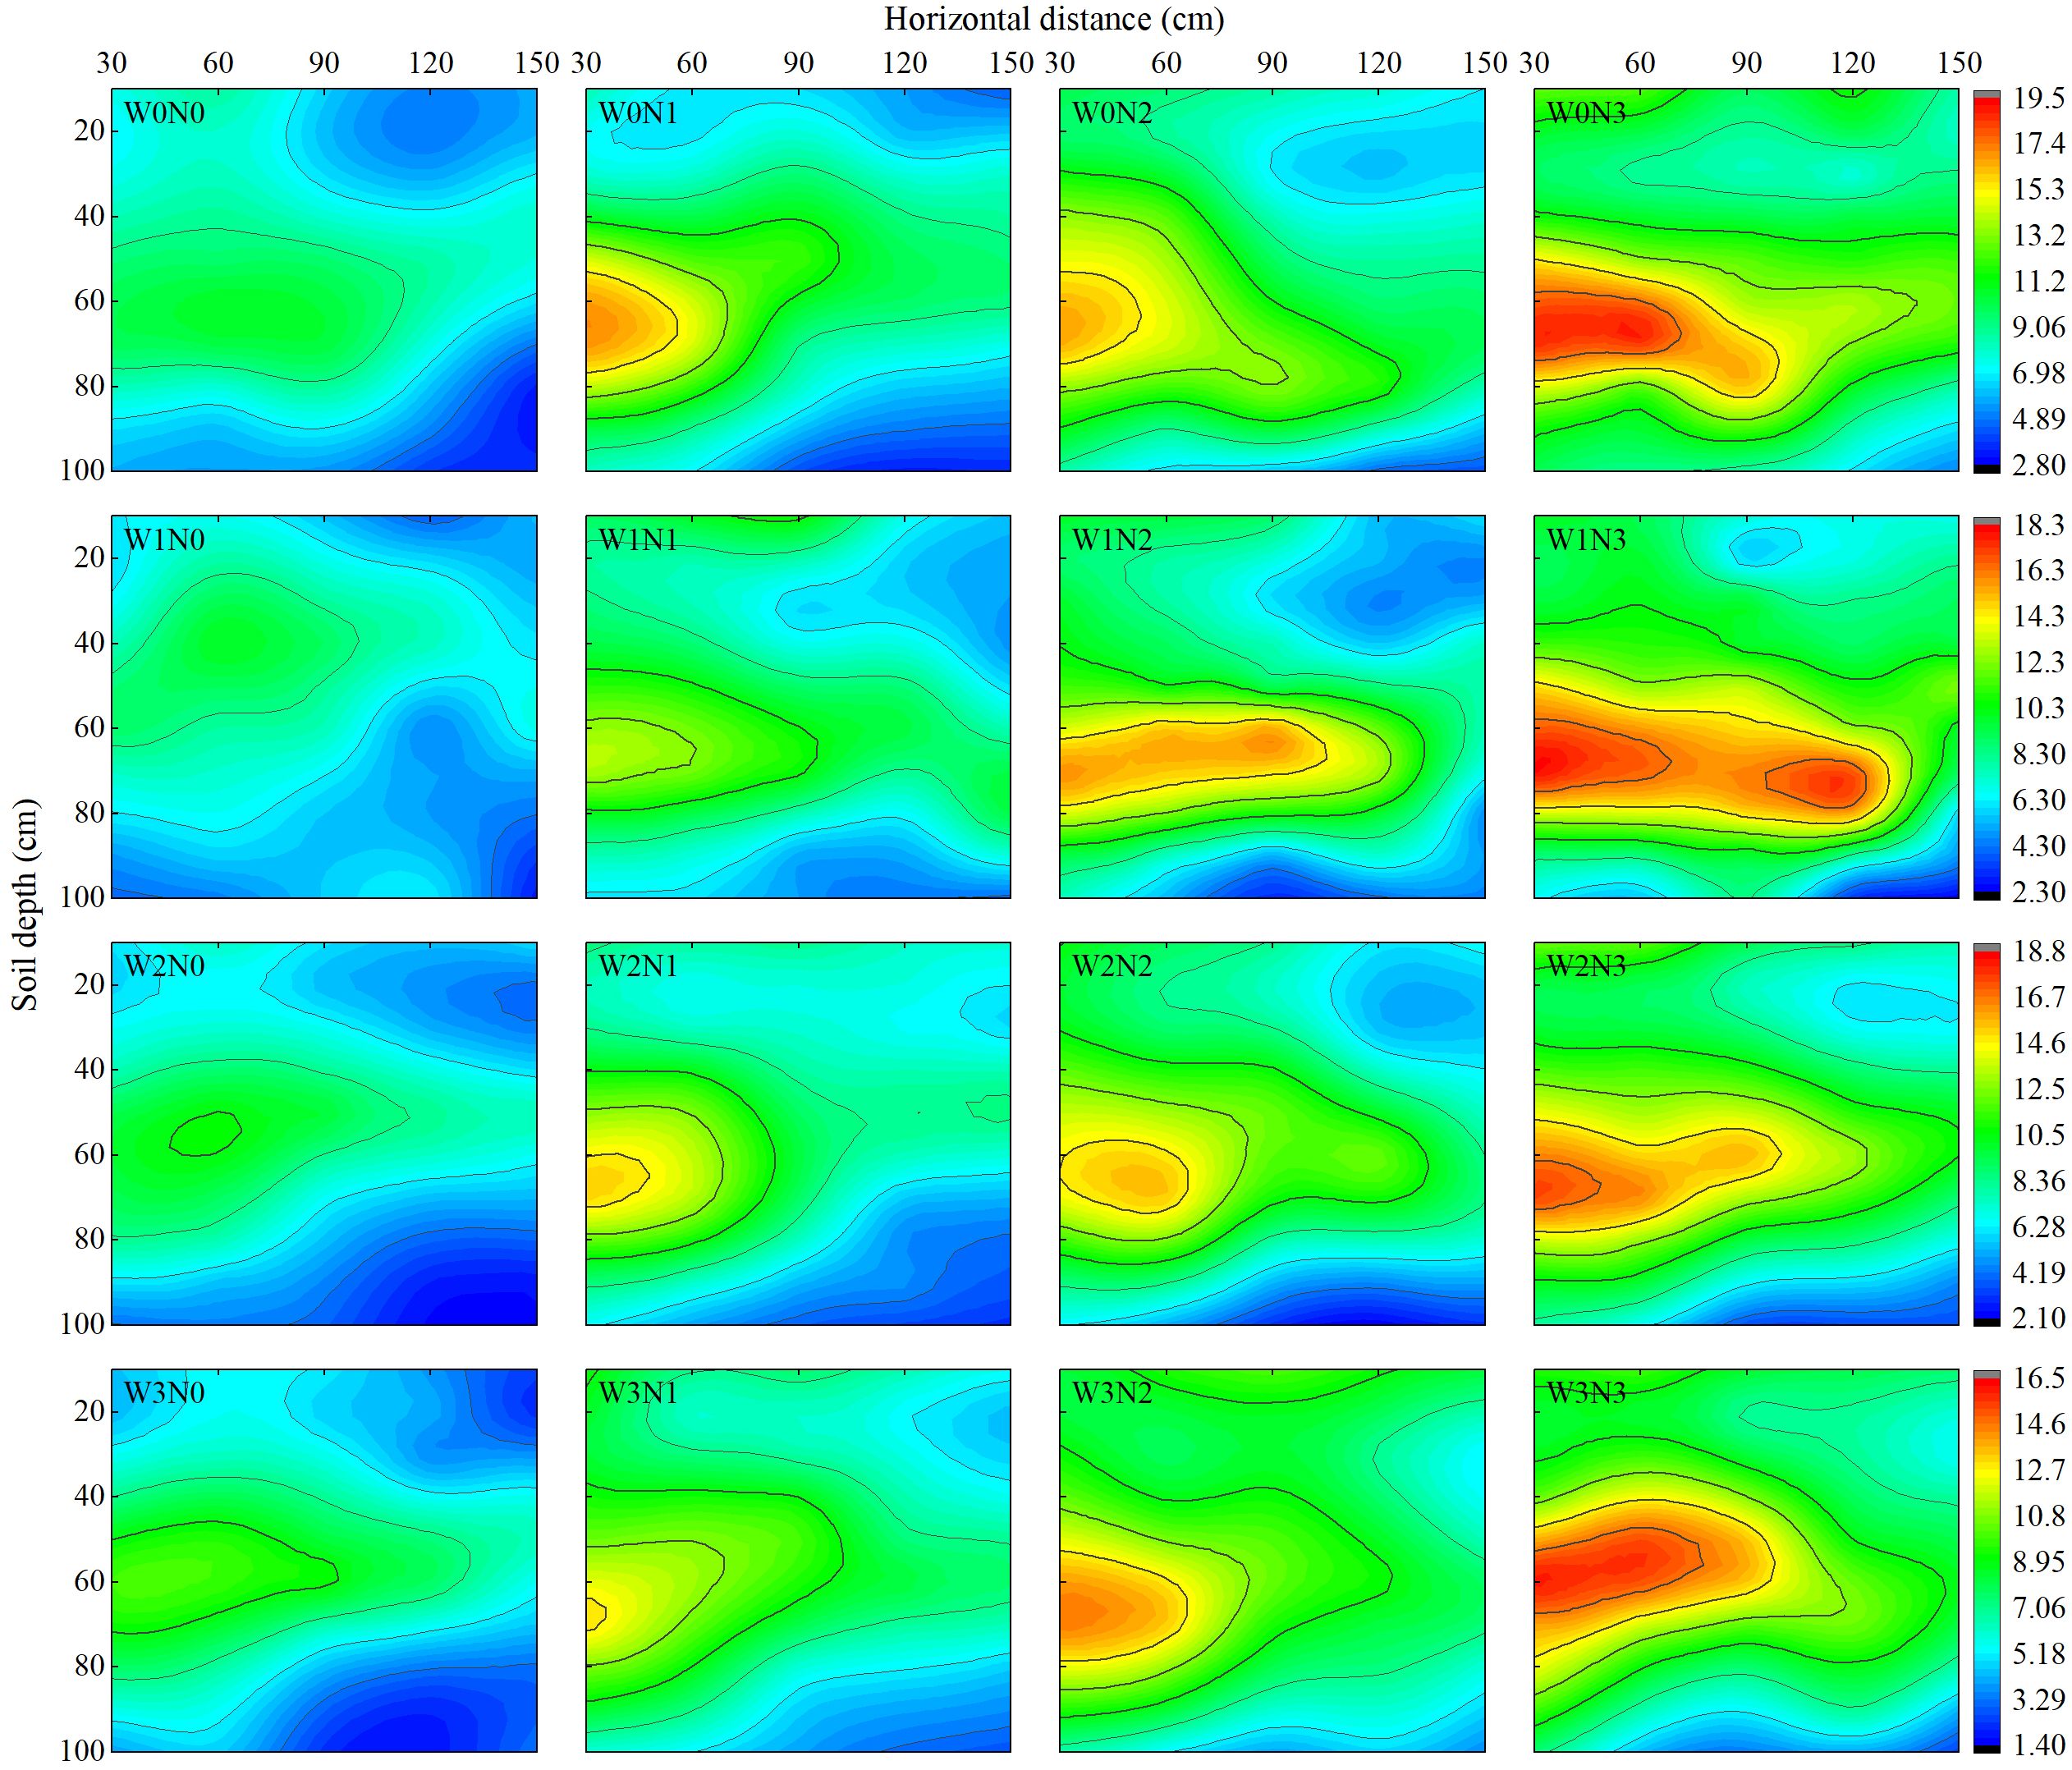
Figure 3 Effect of water and nitrogen regulation on NO3−–N distribution in soil. The legend on the right shows the soil NO3−–N content, unit: mg·kg−1. The horizontal distance represents the horizontal distance from the soil sampling point to the wolfberry plant. W0, W1, W2 and W3 refers to full irrigation (75%–85% θf), slight water deficit (65%–75% θf), moderate water deficit (55%–65% θf) and severe water deficit (45%–55% θf), respectively. N0, N1, N2 and N3 refers to the nitrogen application level is 0 kg·ha−1, 150 kg·ha−1, 300 kg·ha−1 and 450 kg·ha−1, respectively.
3.1.2 Soil NO3−–N accumulation
Irrigation and nitrogen application had extremely significant effects on the accumulation of NO3−–N in the soil layers from 0–100 cm at each horizontal distance. Their interaction effects only had extremely significant effects on NO3−–N accumulation in the soil layers from 30 cm horizontally (Table 2). Overall, the total NO3−–N content in the soil gradually decreased with increasing horizontal distance. The cumulative amount of NO3−–N at 150 cm was 22.57%–46.14% lower than that at 30 cm. With an increase in nitrogen application rate, the accumulation of NO3−–N at each horizontal distance significantly increased. The NO3−–N accumulation of N0, N1, and N2 decreased significantly by 32.22%–43.95%, 12.63%–32.71%, and 3.87%–29.97%, respectively, compared with N3. With an increase in the amount of irrigation, the accumulation of NO3−–N at different horizontal distances fluctuated and increased. The NO3−–N accumulation in W3 significantly decreased by 7.01%–31.79% compared with that of W0.
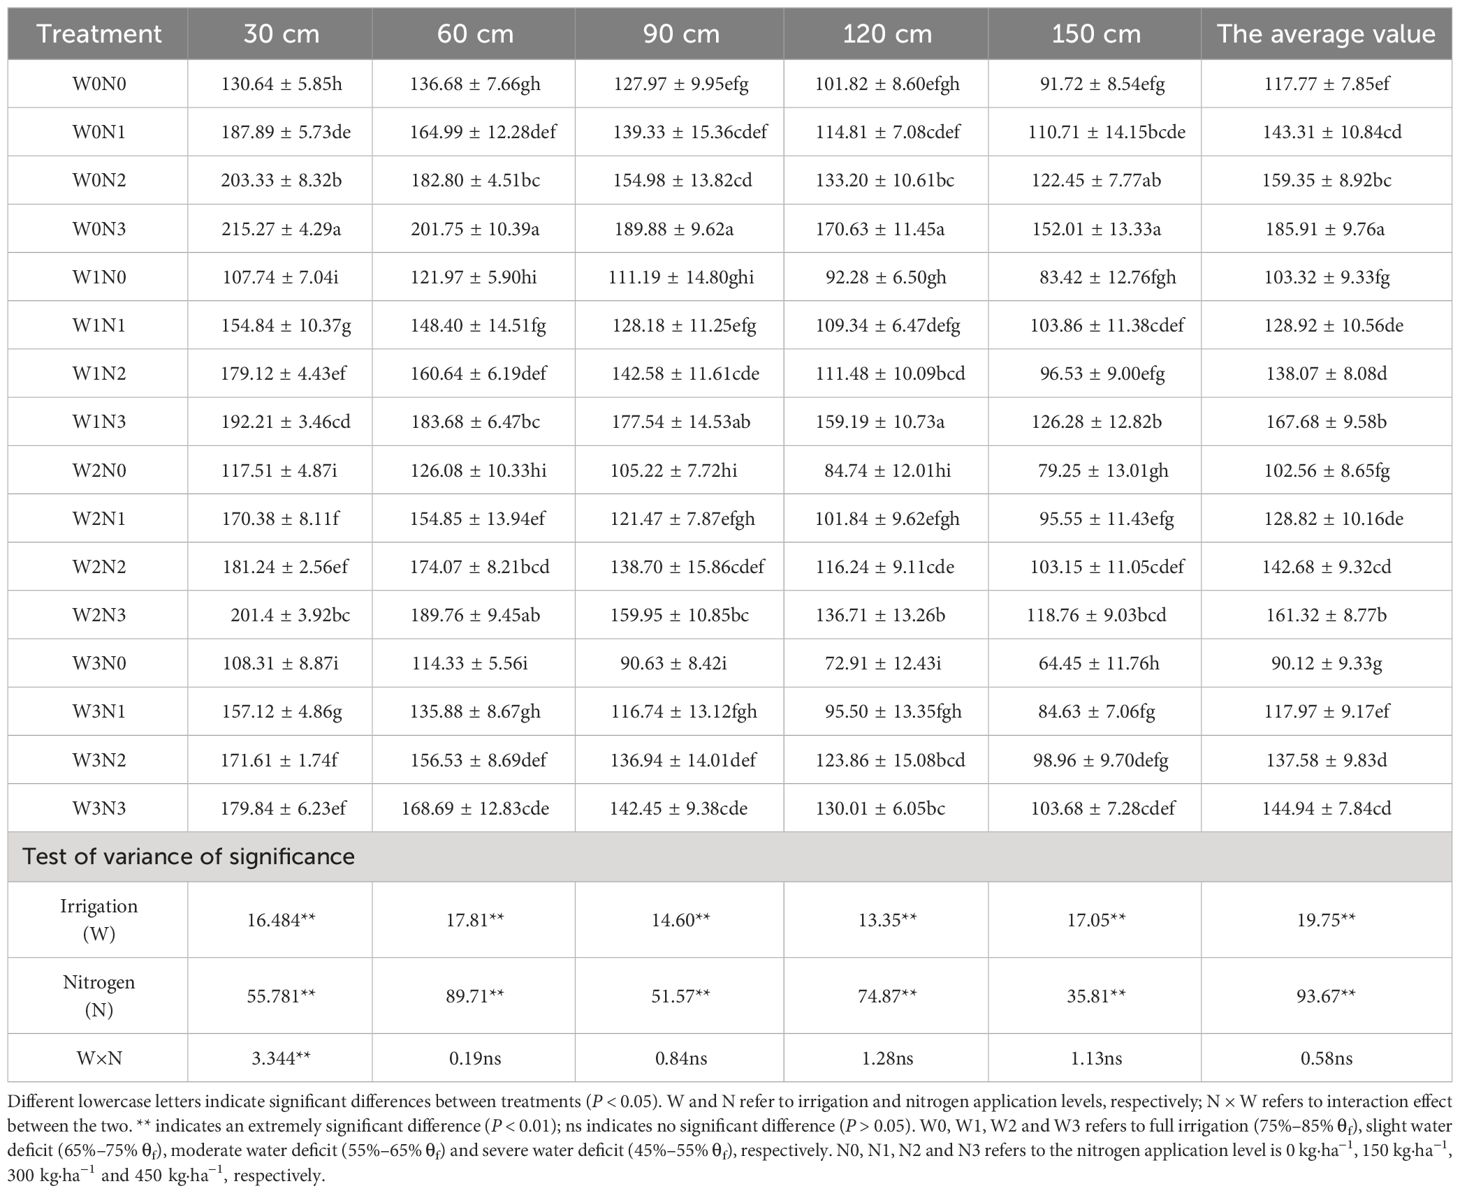
Table 2 Effects of water and nitrogen regulation on soil NO3−–N accumulation at different horizontal distances from wolfberry plants (kg·ha−1).
3.2 Nitrogen allocation and uptake of wolfberry plants under different water and nitrogen regulation
3.2.1 Nitrogen allocation
Irrigation and nitrogen application had a significant affect the total nitrogen content of each organ of the wolfberry, but their interaction did not have a significant effect on the total nitrogen content of each organ of the wolfberry (Figure 4). The total nitrogen content of each organ showed that leaves (3.22–3.91%) had higher levels than roots (2.29–3.25%), stems (1.83–3.30%), and fruits (1.73–2.42%). Under the same irrigation level, the total nitrogen content of the roots, stems, leaves, and fruits followed the order N2 > N3 > N1 > N0. The total nitrogen content of each organ in N2 increased by 17.21%–20.09%, 19.34%–38.80%, 10.56%–14.46%, and 12.12%–23.12%, respectively, compared with N0. Under the same level of nitrogen application, the total nitrogen content of roots, stems, leaves and fruits of wolfberry were in the order W1 > W0 > W2 > W3, and the total nitrogen content of each organ in W1 increased by 13.96%–18.18%, 20.35%–39.34%, 7.76%–11.62%, and 11.79%–21.39%, respectively, compared with W3.
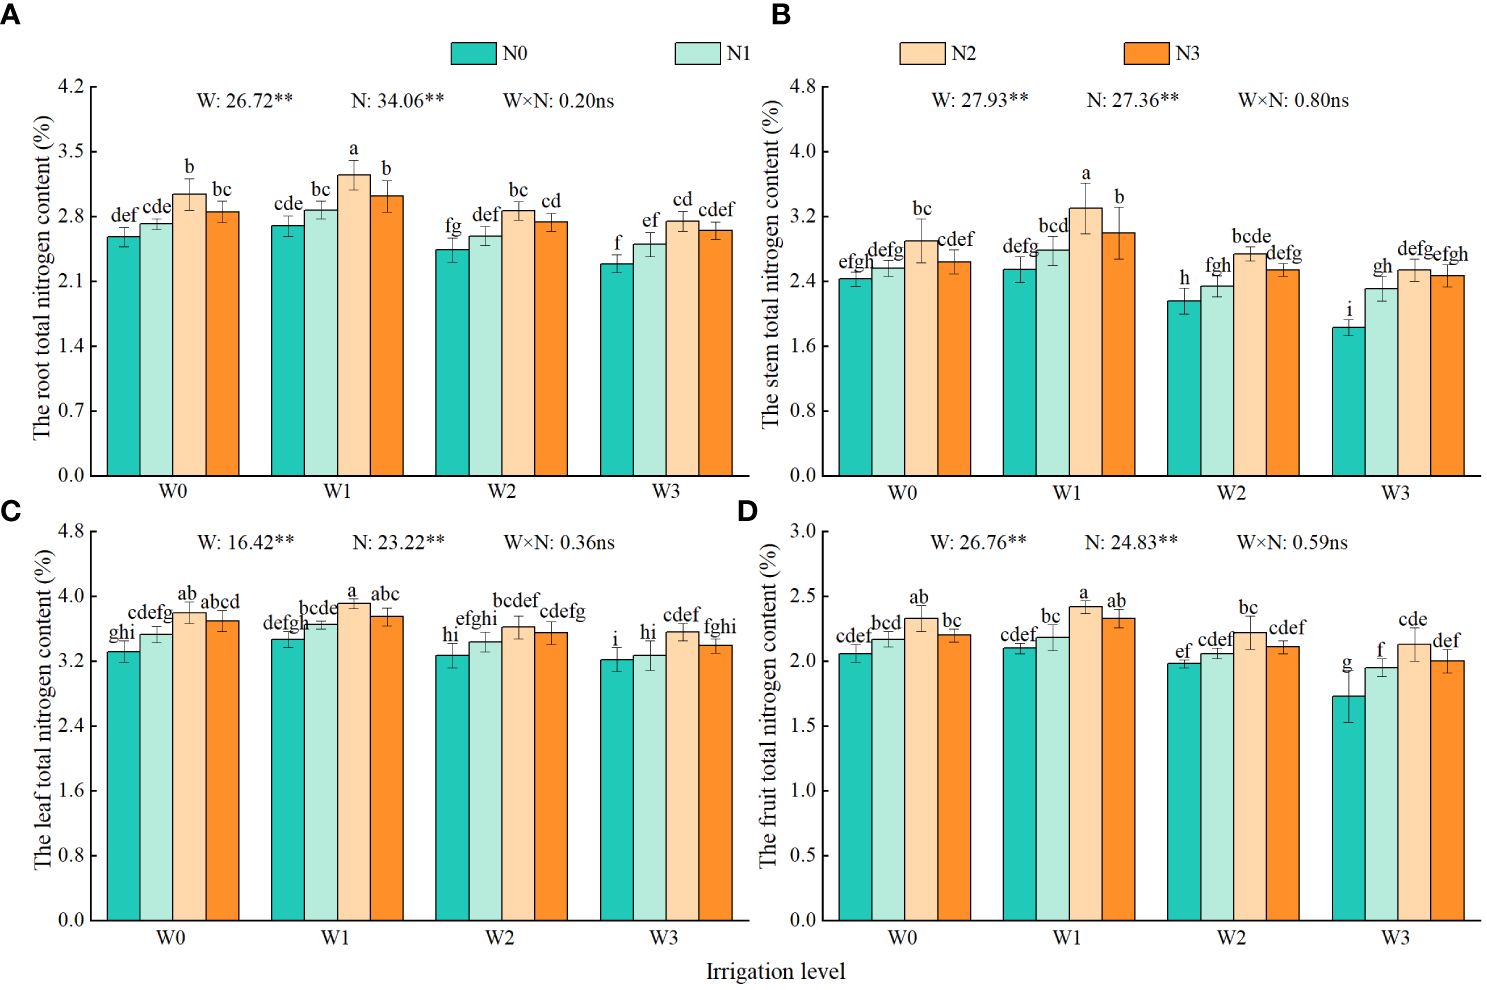
Figure 4 Effects of water and nitrogen regulation on total nitrogen content in each organ of wolfberry. Different lowercase letters indicate significant differences between treatments (P < 0.05). (A–D) represents the total nitrogen content of the root, stem, leaf and fruit of wolfberry, respectively. W and N refer to irrigation and nitrogen application levels, respectively; N × W refers to interaction effect between the two. ** indicates an extremely significant difference (P < 0.01); ns indicates no significant difference (P > 0.05). W0, W1, W2 and W3 refers to full irrigation (75%–85% θf), slight water deficit (65%–75% θf), moderate water deficit (55%–65% θf) and severe water deficit (45%–55% θf), respectively. N0, N1, N2 and N3 refers to the nitrogen application level is 0 kg·ha−1, 150 kg·ha−1, 300 kg·ha−1 and 450 kg·ha−1, respectively.
3.2.2 Nitrogen uptake
Irrigation and nitrogen application significantly affected the nitrogen uptake in each organ of the wolfberry. The interaction effects of these factors on nitrogen uptake varied across different organs (roots, stems, leaves, and fruits) (Figure 5). With an increase in irrigation and nitrogen application, the nitrogen uptake of wolfberry initially increased and then decreased. The nitrogen uptake showed that the stem and fruit had the highest uptake, followed by roots and leaves, accounting for 19.23%–87.73%, 31.04%–90.16%, 11.39%–40.80%, and 5.63%–16.78% of the total nitrogen uptake, respectively. From the perspective of total nitrogen absorption, W0, W2 and W3 decreased by 11.31%–12.50%, 19.22%–24.47%, and 34.87%–40.13%, respectively, compared with W1. N2 increased by 84.27%–94.63%, 25.51%–29.88%, and 12.70%–17.90% compared with N0, N1, and N3, respectively.
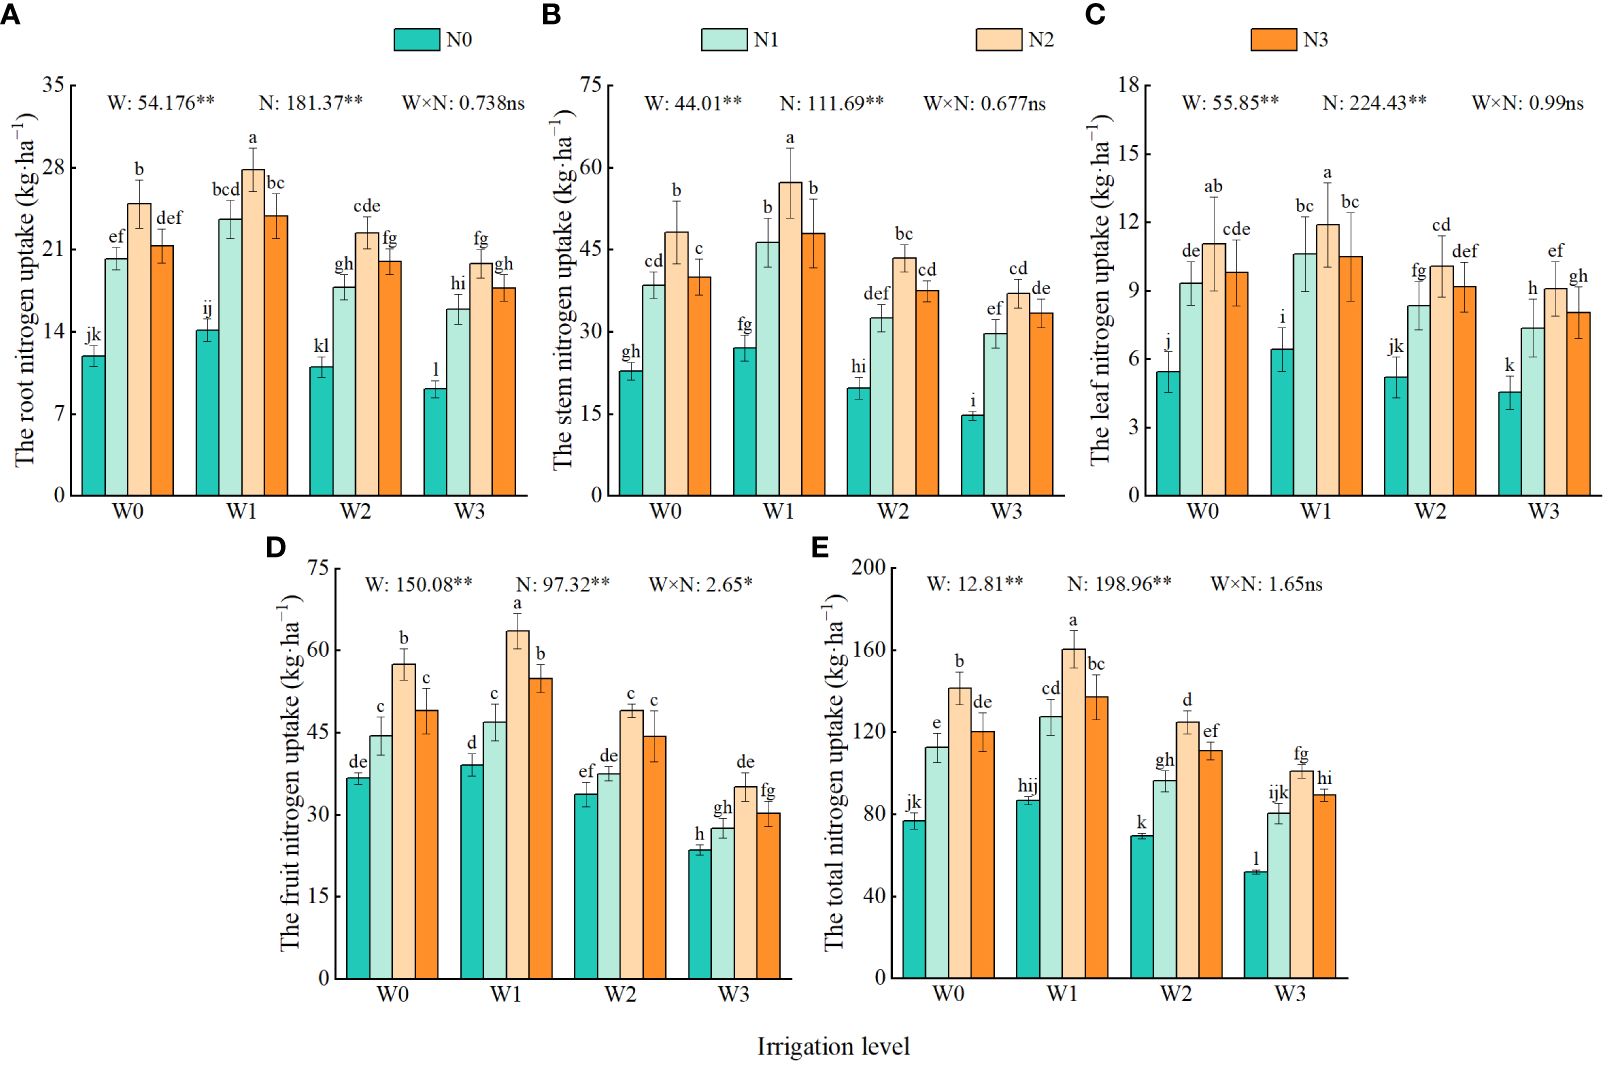
Figure 5 Effects of water and nitrogen regulation on nitrogen uptake of each organ of wolfberry. Different lowercase letters indicate significant differences between treatments (P < 0.05). (A–E) represents the root, stem, leaf, fruitf and total nitrogen uptake of wolfberry organs, respectively. W and N refer to irrigation and nitrogen application levels, respectively; N × W refers to interaction effect between the two. ** indicates an extremely significant difference (P < 0.01); * indicates a significant difference (P < 0.05); ns indicates no significant difference (P > 0.05). W0, W1, W2 and W3 refers to full irrigation (75%–85% θf), slight water deficit (65%–75% θf), moderate water deficit (55%–65% θf) and severe water deficit (45%–55% θf), respectively. N0, N1, N2 and N3 refers to the nitrogen application level is 0 kg·ha−1, 150 kg·ha−1, 300 kg·ha−1 and 450 kg·ha−1, respectively.
3.3 Soil N2O emission and its influencing factors under different water and nitrogen regulation
3.3.1 Soil N2O emission parameters
During the wolfberry harvest period, the soil N2O emission flux under different water and nitrogen treatments ranged from 28.68–177.91 ug·m−2·h−1. The pattern of change was consistent, with a peak occurring after irrigation, followed by a gradual decrease afterwards (Figure 6). In each period, under the same irrigation level, the soil N2O emission fluxes of N0, N1, and N2 decreased by 50.93%–68.38%, 8.77%–37.46%, and 2.95%–16.65% compared with N3. Under the same nitrogen application level, the soil N2O emission fluxes of W1, W2, and W3 decreased by 1.34%–20.89%, 13.00%–37.16%, and 17.34%–43.22% compared with W0. Among all treatments, W0N3 exhibited the highest soil N2O emission flux (116.39–177.91 ug·m−2·h−1), whereas W3N0 showed the lowest soil N2O emission flux (28.68–39.55 ug·m−2·h−1).
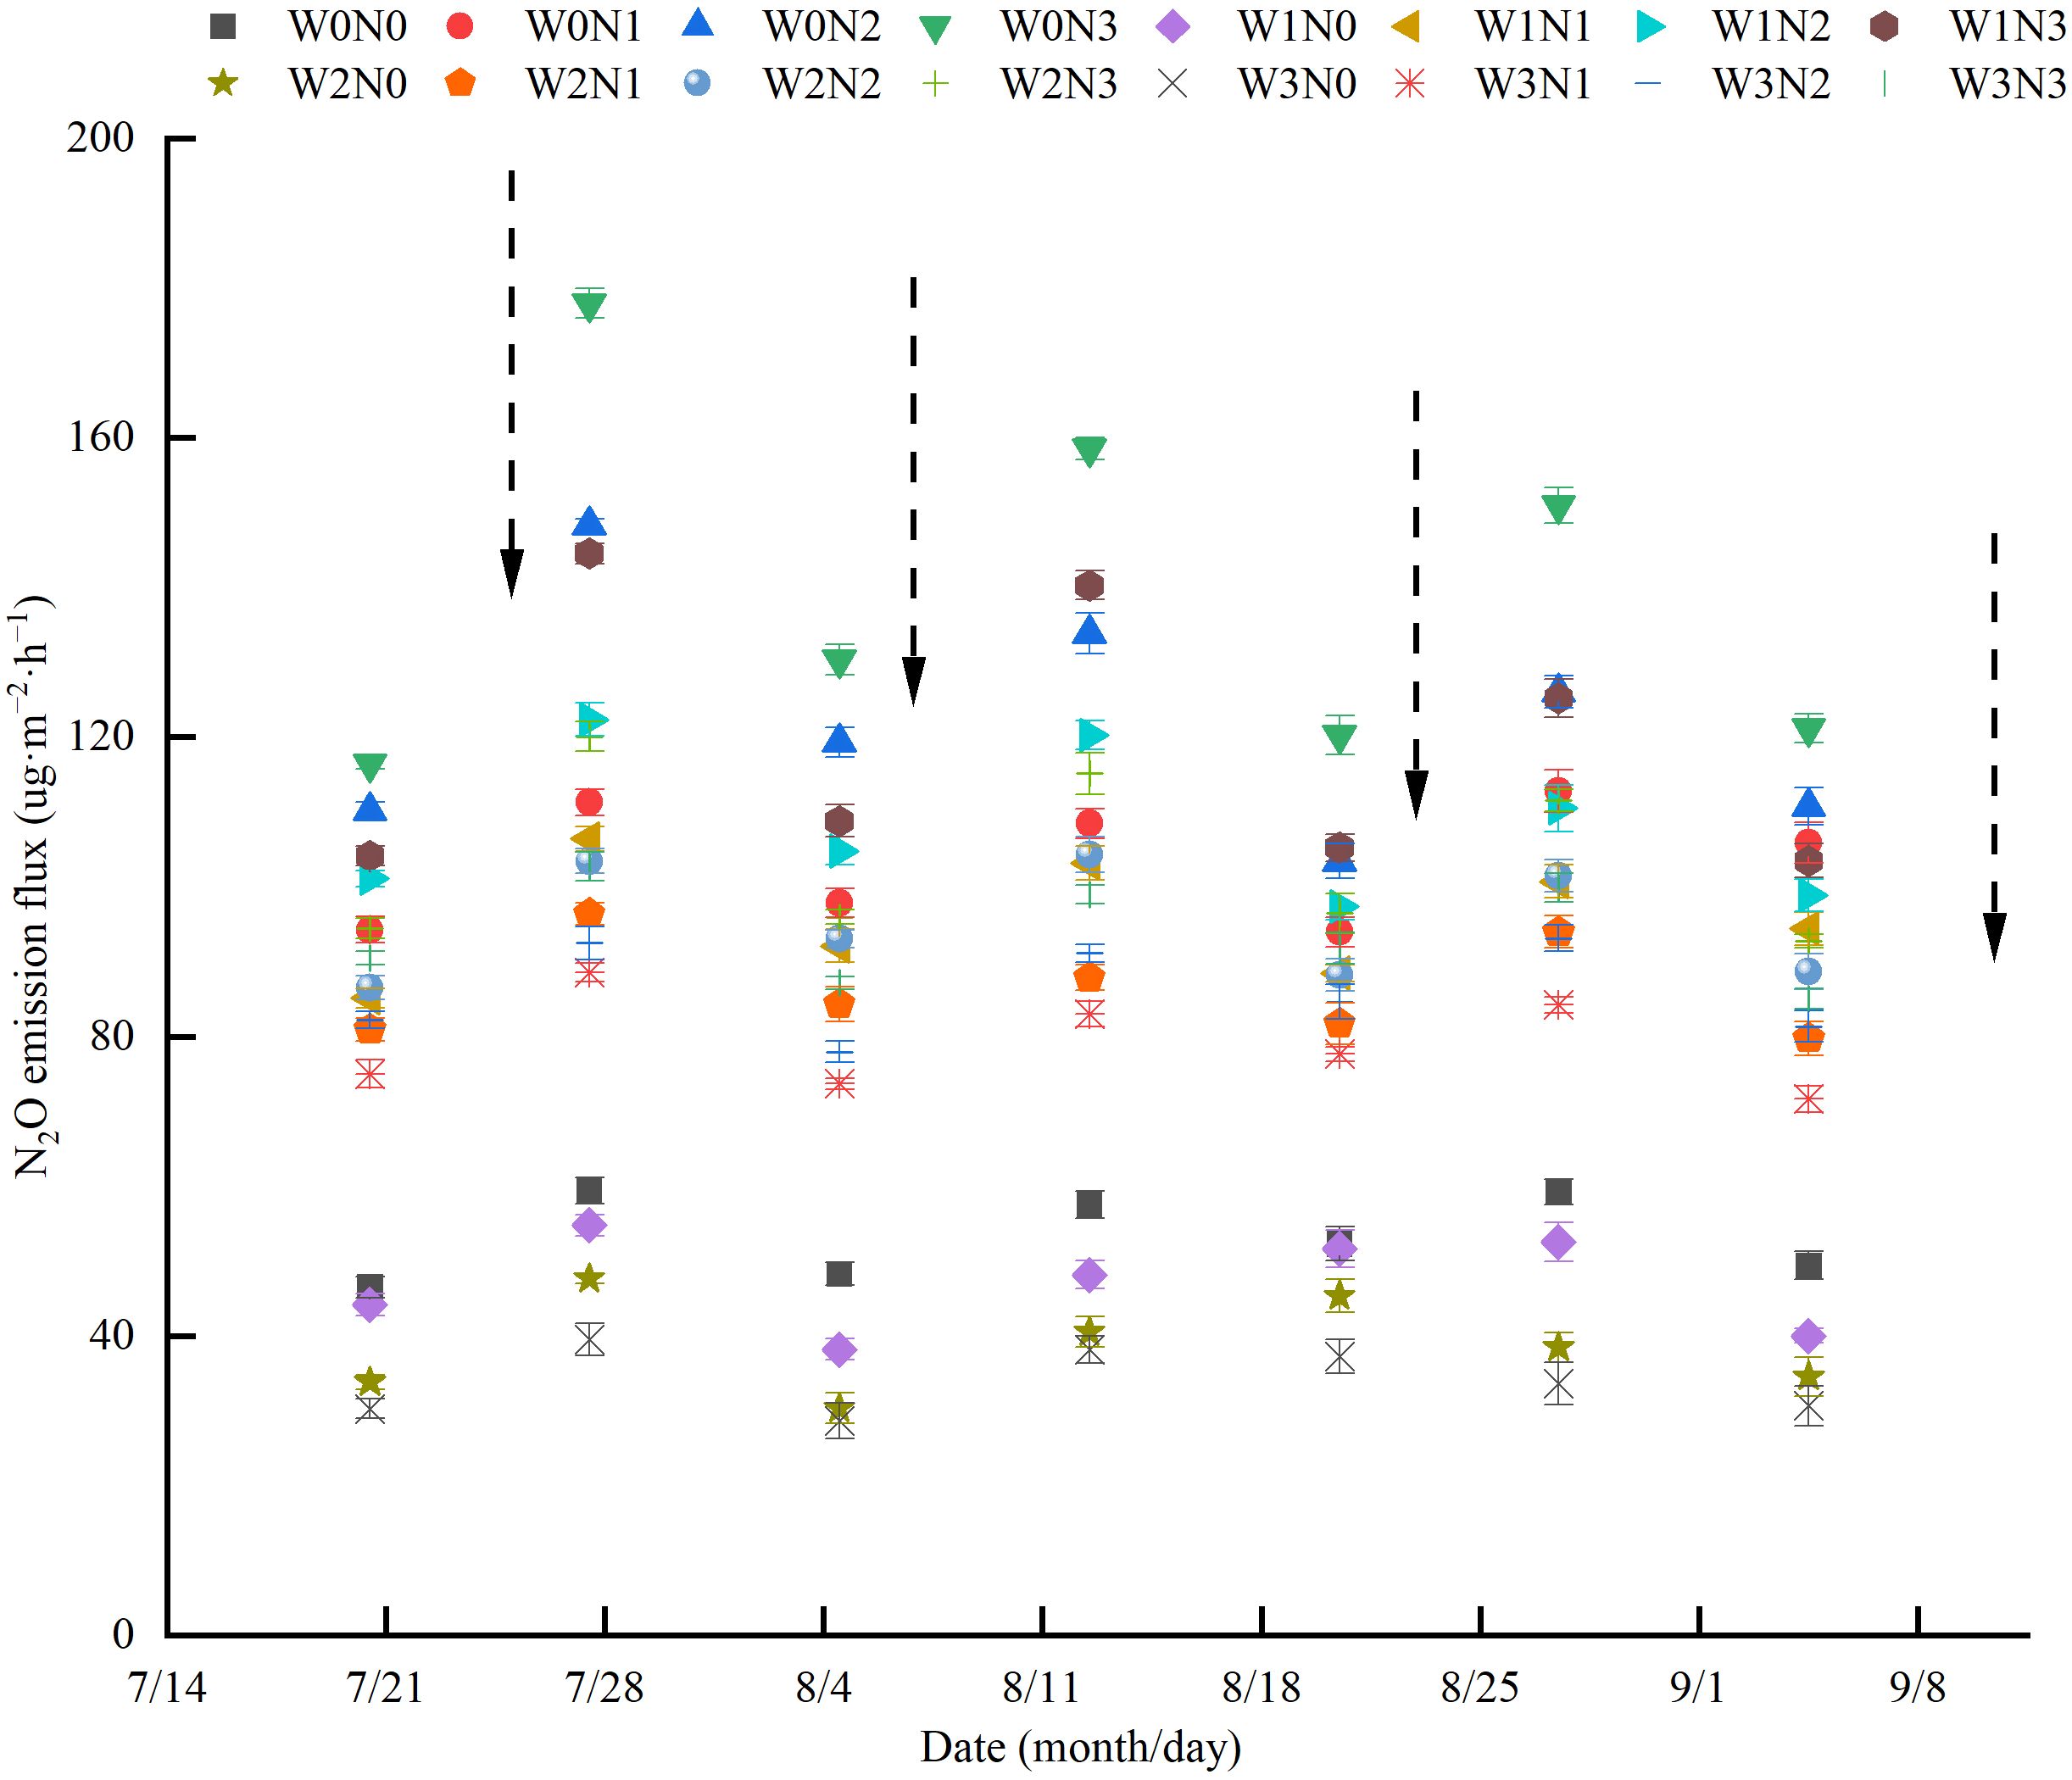
Figure 6 Effects of water and nitrogen regulation on soil N2O emission flux. Arrows indicate irrigation on the appropriate date. W0, W1, W2 and W3 refers to full irrigation (75%–85% θf), slight water deficit (65%–75% θf), moderate water deficit (55%–65% θf) and severe water deficit (45%–55% θf), respectively. N0, N1, N2 and N3 refers to the nitrogen application level is 0 kg·ha−1, 150 kg·ha−1, 300 kg·ha−1 and 450 kg·ha−1, respectively.
Irrigation, nitrogen application, and their interaction significantly affected the total amount, emission intensity, and emission coefficient of soil N2O (Figure 7). Overall, the total N2O emissions showed an increasing trend with increasing irrigation and nitrogen application. Compared with N0, the total N2O emissions from N1, N2, and N3 were increased by an average of 109.09%, 136.33%, and 163.73%, respectively. Compared with W0, the total N2O emissions from W1, W2, and W3 were reduced by an average of 11.60%, 22.63%, and 30.25%, respectively. Among all treatments, the total N2O emission of W0N3 was the highest (1.67 kg·ha−1), which was 0.22–1.27 kg·ha−1 higher than the other treatments.
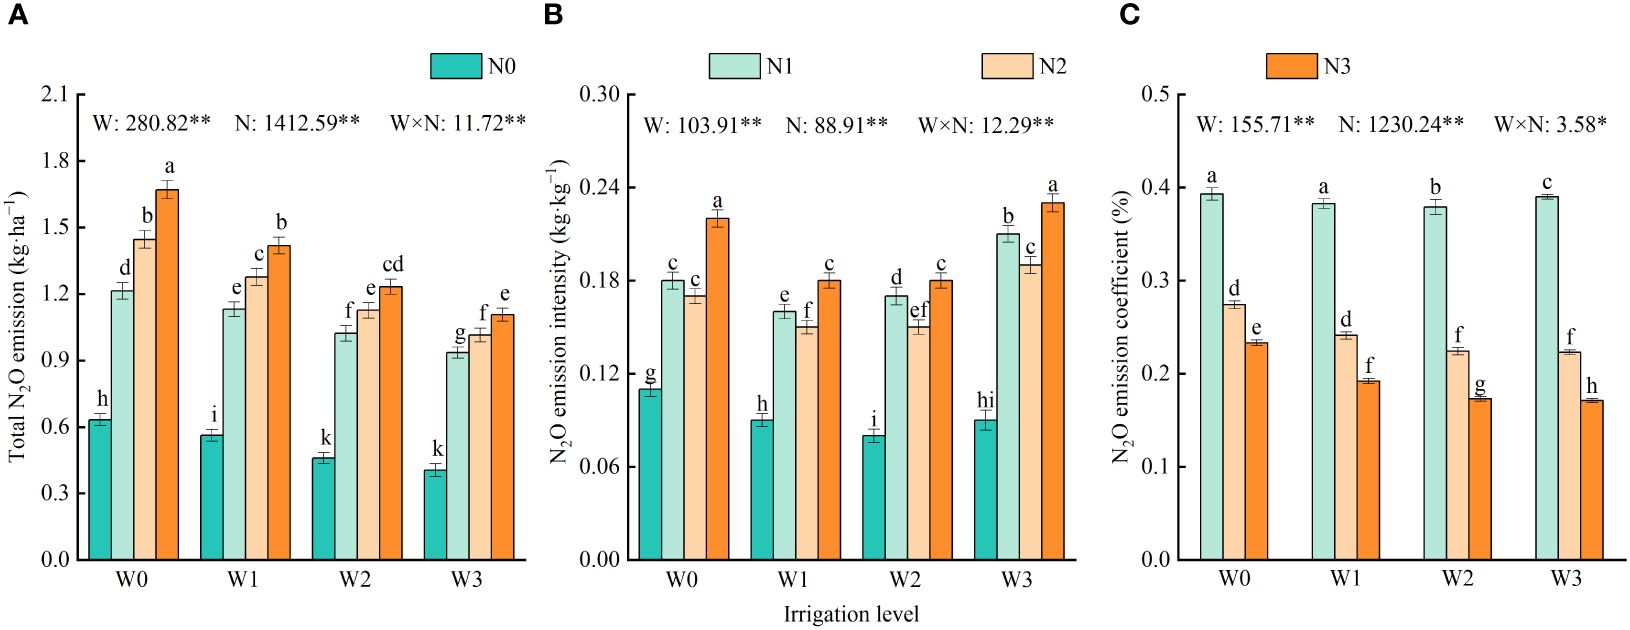
Figure 7 Effects of water and nitrogen regulation on total N2O emission, emission intensity and emission coefficient of soil. Different lowercase letters indicate significant differences between treatments (P < 0.05). (A–C) represents the total N2O emission, N2O emission intensity and N2O emission coefficient, respectively. W and N refer to irrigation and nitrogen application levels, respectively; N × W refers to interaction effect between the two. ** indicates an extremely significant difference (P < 0.01); * indicates a significant difference (P < 0.05). W0, W1, W2 and W3 refers to full irrigation (75%–85% θf), slight water deficit (65%–75% θf), moderate water deficit (55%–65% θf) and severe water deficit (45%–55% θf), respectively. N0, N1, N2 and N3 refers to the nitrogen application level is 0 kg·ha−1, 150 kg·ha−1, 300 kg·ha−1 and 450 kg·ha−1, respectively.
Under the same irrigation level, N2O emission intensity followed the order N3 > N1 > N2 > N0. The emission intensities of N0, N1, and N2 were significantly reduced by 50.00%–60.87%, 5.56% –18.18%, and 16.67%–22.73%, respectively, compared with N3. The N2O emission coefficient decreased significantly with increasing nitrogen application. Specifically, N3 decreased by 50.19% and 20.05% compared with N1 and N2, respectively. Under the same level of nitrogen application, the intensity of N2O emissions initially decreased and then increased with increasing irrigation amount. The emission intensity of W0 decreased by significantly -22.22%–14.29% compared with that of W3. At the N1 level, the N2O emission coefficient initially decreased and then increased with increasing irrigation amount. At the N2 and N3 levels, the emission coefficients of N2O were W0 > W1 > W2 > W3 with the increase of irrigation amount, and the emission coefficients of W1, W2, and W3 decreased by 14.59%, 21.71%, and 22.25%, respectively, compared with W0. Among all treatments, the emission intensity and emission coefficient of N2O reached the maximum in W3N3 (0.23 kg·kg−1) and W0N1 (0.39%). These values increased by 4.56%–187.50%, and 0.74%–129.62%, respectively, compared with the other treatments.
3.3.2 Relationship between soil N2O emission flux and environmental factors
According to the relationship between soil N2O emission flux and environmental factors under varying water and nitrogen conditions (Figure 8), soil N2O emission flux showed a positive correlation with the water-filled pore water content of the soil and NO3−–N content. The determination coefficients reached 0.19 and 0.64, respectively. However, the soil N2O emission flux decreased linearly as soil temperature increased, and there was no significant correlation between the two.
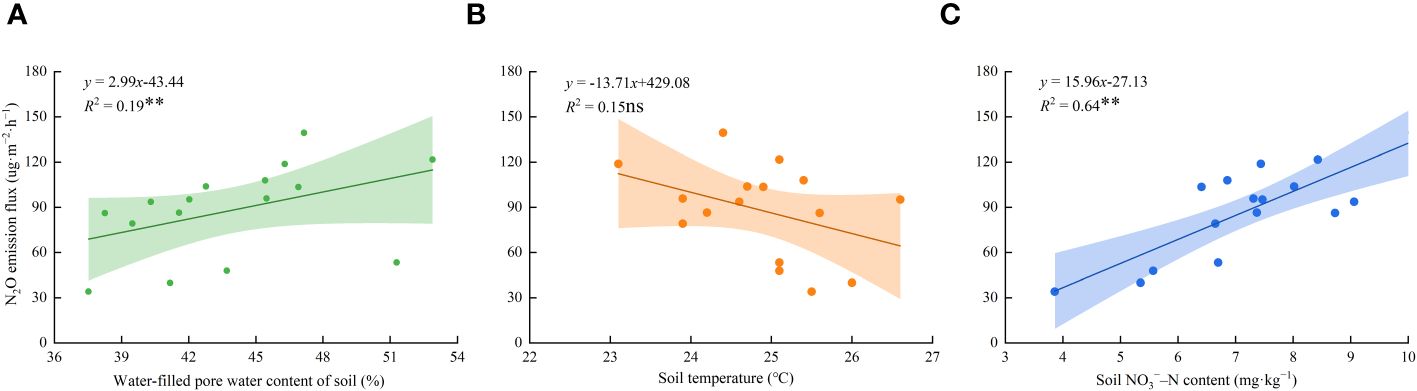
Figure 8 The relationship between soil N2O emission flux and environmental factors under different water and nitrogen regulation. The data in the figure are average values. (A–C) represents the water-filled pore water content of soil, soil temperature and soil NO3−–N content, respectively. Dots in the figure represent N2O emission fluxes; the linear line represents the linear fitting curve of N2O emission flux. The shaded band represents the 95% confidence band of the N2O emission flux.
3.4 Comprehensive evaluation based on CRITIC-entropy weights-TOPSIS model
The total nitrogen content and total nitrogen uptake of wolfberry plants, soil NO3−–N accumulation, soil temperature, water-filled pore water content of the soil, N2O emission flux, and other indicators were consistently analyzed (Table 3). The weights of the wolfberry indices based on the CRITIC-entropy weight method were as follows: F > Nua > NRa > Nia > f > GHGI > EF (Table 4). According to the comprehensive evaluation results of the CRITIC-entropy weights-TOPSIS model (Figure 9), the W1N2 treatment ranking was the best, followed by the W3N2 treatment. These results indicate that when a mild water deficit (W1, 65%–75% θf) was coupled with medium nitrogen application (N2, 300 kg·ha−1), the nitrogen uptake of wolfberry plants was higher, and the accumulation of NO3−–N and N2O emission in the soil was lower.
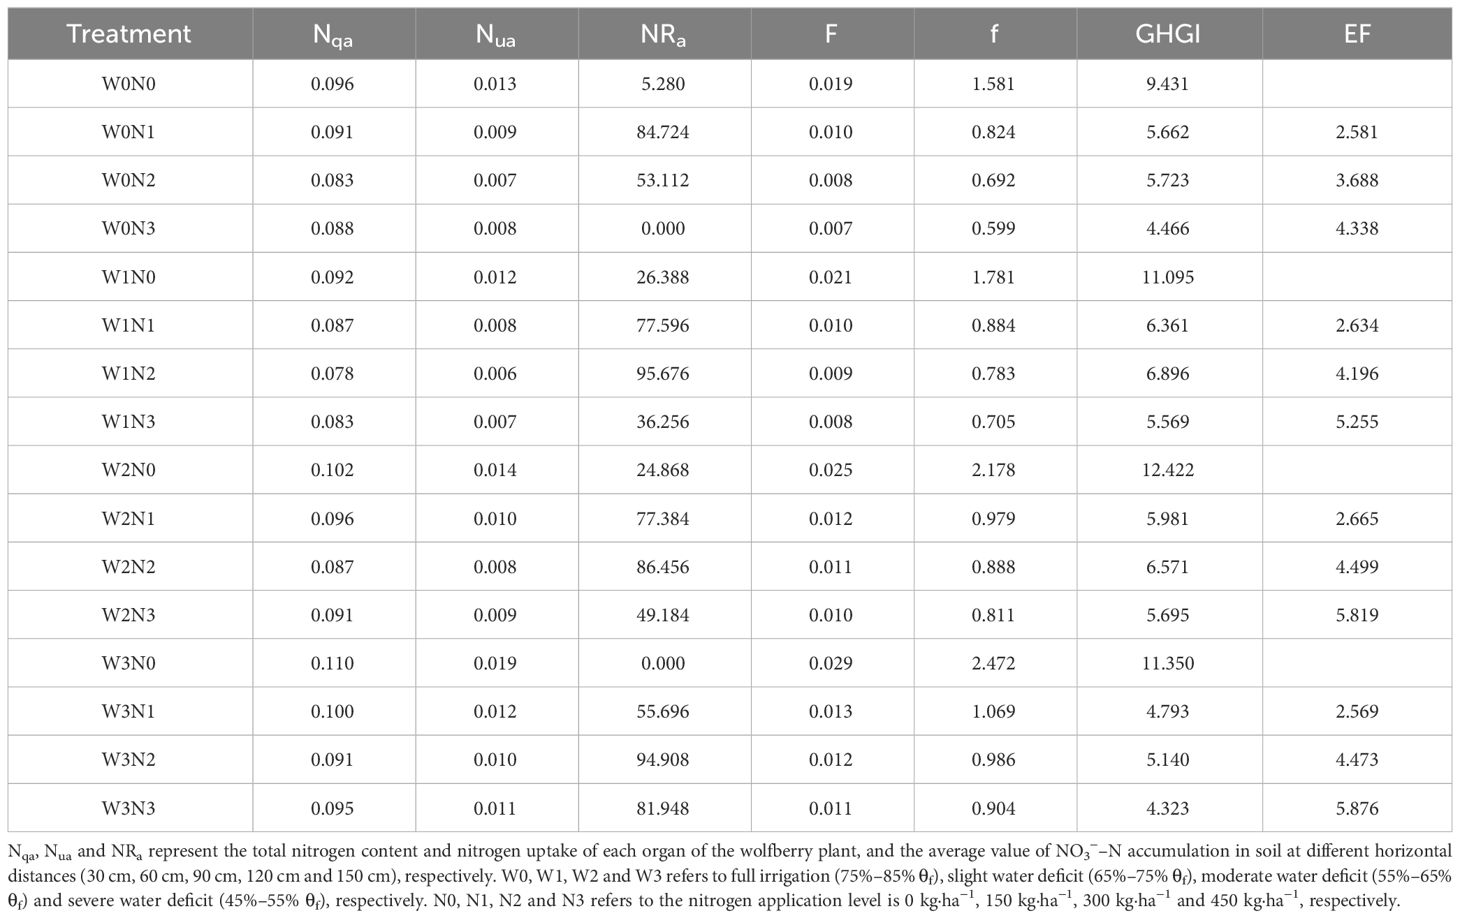
Table 3 Consistency of TOPSIS indicator types.
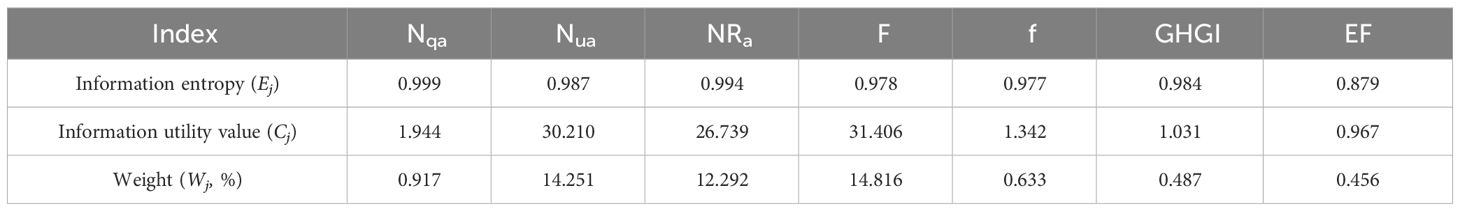
Table 4 Weights of each index based on CRITIC-entropy weight method.
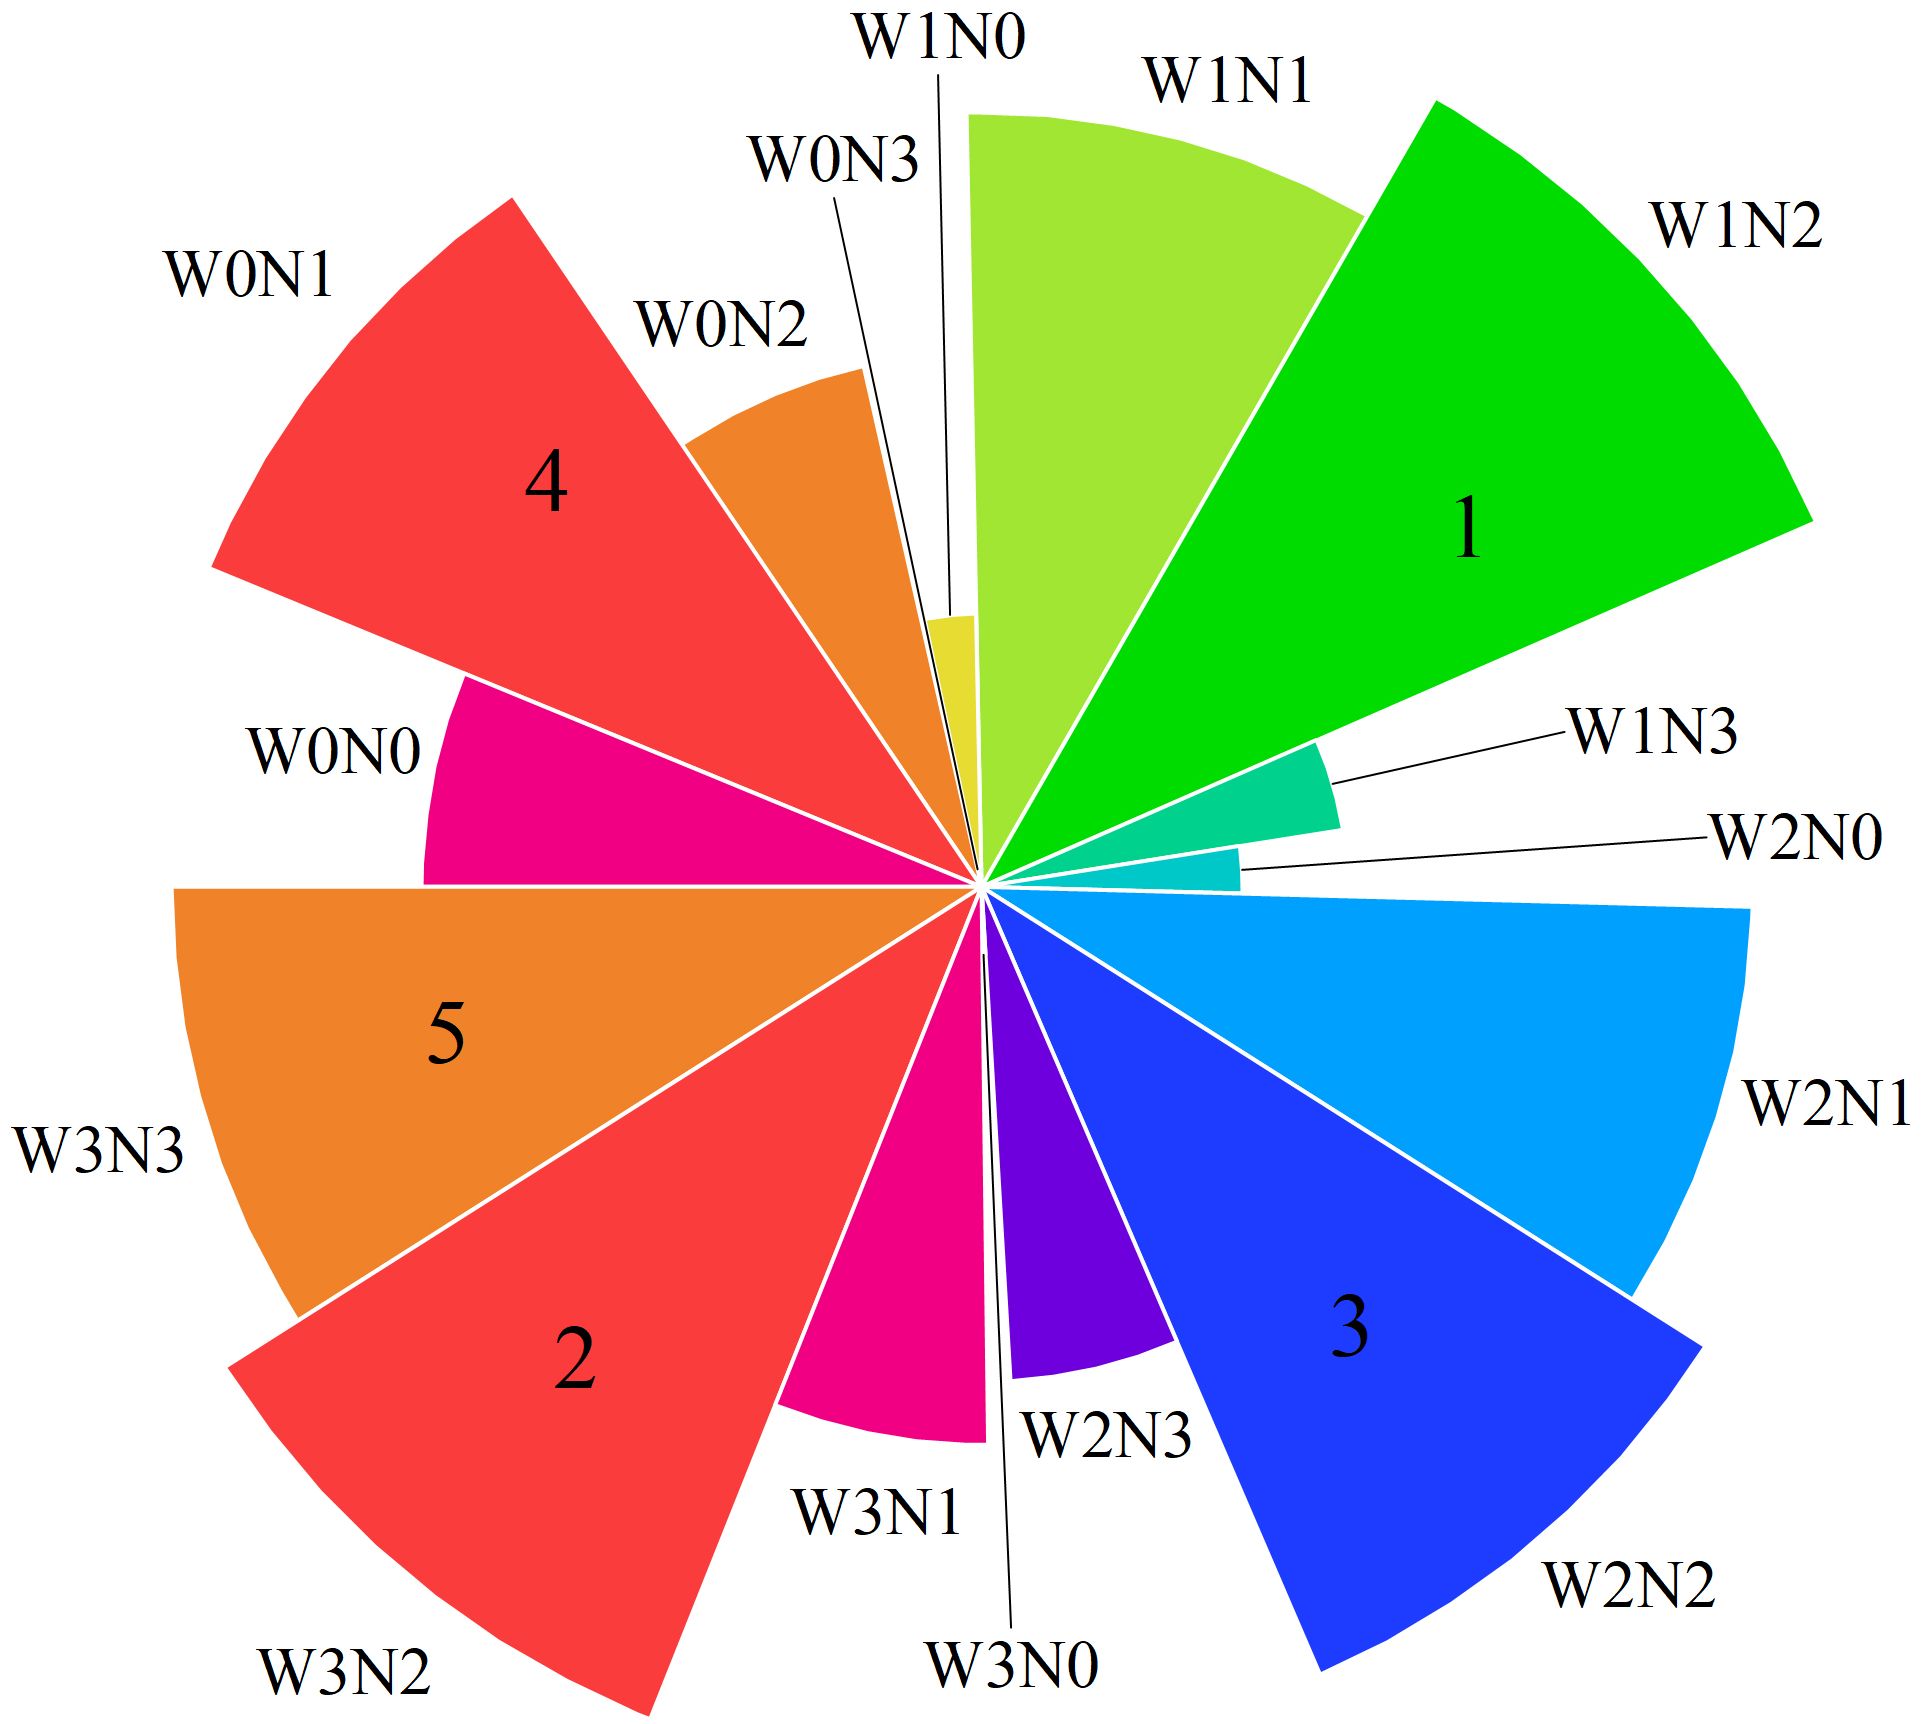
Figure 9 Comprehensive evaluation scores of different water and nitrogen regulation. The numbers 1, 2, 3, 4, and 5 in the figure represent W1N2, W3N2, W2N2, W0N1, and W3N3, respectively.
4 Discussion
4.1 Distribution and accumulation of soil NO3−–N under different water and nitrogen regulation
Soil NO3−–N is an important component of soil soluble nitrogen and serves as the primary mineral nitrogen source directly absorbed by crops. It is commonly used to assess the nitrogen supply capacity of the soil (Cui et al., 2013). This study revealed that the soil NO3−–N content in the 0–100 cm soil layer of each treatment decreased during the harvest period initially decreased, then increased, and finally decreased with increasing soil depth. Additionally, it decreased with increasing horizontal distance from the wolfberry plants. The soil NO3−–N content at 30 cm and 60 cm from the wolfberry followed the order of W0 > W2 > W1 and W3. This can be attributed to two factors: Firstly, the negative charge of the NO3− ions causes repulsion with the negatively charged soil colloidal particles, leading to the downward movement of NO3−–N through leaching and infiltration, thereby affecting the vertical redistribution of NO3−–N. Secondly, water migration and root absorption affect the vertical and horizontal redistribution process of NO3−–N, resulting in intensified NO3−–N leaching near the wet body in the drip irrigation zone and the phenomenon of “enrichment” near the roots (Vijayalakshmi et al., 2013). Furthermore, this study revealed a positive correlation between soil NO3−–N content and the amount of nitrogen applied. The NO3−–N content increased with the amount of irrigation and nitrogen application, and the peak value of NO3−–N increased and gradually moved downward. This finding was similar to that reported by Gu et al. (2018) for winter oilseed rape in the Guanzhong area of Shaanxi Province. This result indicated that urea applied to the soil through irrigation rapidly hydrolyzes into NH4+–N and is oxidized to NO3−–N under the action of ammonia oxidizing microorganisms. However, NO3−–N is highly soluble in water and tends to accumulate at a specific depth within soil pores (Wu et al., 2022b).
Crops absorb a portion of NO3−–N during their growth, whereas unabsorbed NO3−–N accumulates in the soil, thereby increasing the potential risk of groundwater pollution. In this study, the accumulation of soil NO3−–N in the 0–100 cm soil layer decreased as the horizontal distance increased under different water and nitrogen treatments (except for the N0 nitrogen application level). The average soil NO3−–N accumulation in the 0–100 cm soil layer at each horizontal distance followed the order of W0 > W1 > W2 > W3 (except for the N2 nitrogen application level), and N3 > N2 > N1 > N0. Both water and nitrogen affected the accumulation of NO3−–N in the soil, with nitrogen application having a greater influence on soil NO3−–N accumulation than the irrigation amount (Table 3). This contradicts the findings of Wang et al. (2008) in Shandong Province, which indicated that both irrigation and nitrogen application significantly affected NO3−–N accumulation in the 0–100 cm soil layer of wheat, and the contribution of irrigation to NO3−–N accumulation was greater than that of nitrogen application. This may be attributed to the more developed root system of wolfberry than that of wheat. Additionally, the soil resource endowment characteristics in the Yellow River irrigation region of Gansu Province may not fully support the growth and development of wolfberry, leading to the increased reliance on exogenous nutrients to maintain normal physiological growth activities of the plants (Dou et al., 2021). At the same time, this study concluded that the single factor of water and nitrogen significantly affected the accumulation of soil NO3−–N. The interaction effect of the two factors only had a significant impact on NO3−–N accumulation in the soil 30 cm away from the horizontal distance of the wolfberry (Table 2).This may be related to the root distribution of wolfberry plants, and multiple irrigations may have caused downward leaching of nitrogen accumulation. Nitrogen accumulation tends to decrease away from the drip irrigation belt, making wolfberry roots closer to the belt more sensitive to water and nitrogen responses (Iranzi et al., 2023).
4.2 Nitrogen allocation and uptake of wolfberry plants under different water and nitrogen regulation
A reasonable water and nitrogen supply pattern is beneficial for increasing nitrogen uptake by plants (Dai and Zhang, 2020). The results of this study revealed that the total nitrogen content of each organ of the wolfberry at the time of harvest followed the order leaves > roots and stems > fruits. The highest values were observed under the W1N2 treatment, with the nitrogen content reaching 3.25% in the roots, 3.30% in the stems, 3.91% in the leaves, and 2.42% in the fruits. This suggests that the appropriate water-nitrogen combination has a synergistic effect on nitrogen allocation and uptake in crops (Qin et al., 2021). In addition, this study found that the total nitrogen content of wolfberry leaves and fruits initially increased and then decreased with increasing irrigation and nitrogen application. This contradicts the findings of Zhen and Zhen (2006) and Qin et al. (2017) who concluded that the nitrogen content in wheat leaves and fruits is regulated by exogenous nitrogen and increases with increasing nitrogen application. The difference in absorption capacity between wolfberry and wheat could be attributed to the more developed roots and stronger absorption capacity of wolfberry. Additionally, nitrogen application in this experiment reached the absorption threshold of wolfberry (medium nitrogen application of 300 kg·ha−1). With an increasing in nitrogen application (high nitrogen application of 450 kg·ha−1), the antagonism between the absorbed elements and ions of wolfberry plants was enhanced. This leads to extravagant nitrogen absorption, by the plants, ultimately resulting in a decrease in the nitrogen content of crops (Filipović et al., 2016).
Irrigation and nitrogen application can affect the accumulation of plant nutrients by improving soil water and fertilizer conditions (Liu et al., 2007). In this study, it was concluded that the nitrogen uptake of wolfberry showed the following trend: N2 > N3 > N1 > N0. Specifically, N2 showed significant increases of 85.32%, 26.80%, and 15.39% compared with N0, N1, and N3, respectively. These finding are consistent with those of a study on cotton in the Xinjiang region conducted by Zhang et al. (2021). This may be due to the excessive application of nitrogen, which can lead to an imbalance in plant nutrient uptake, reduce plant nitrogen uptake and accumulation, and cause loss of nitrogen resources. However, appropriate nitrogen application can increase the levels of inorganic nitrogen, such as NO3−–N and NH4+–N in the soil of the root zone, and facilitate nitrogen uptake and accumulation in plants (Gu et al., 2018). The study concluded that the nitrogen uptake of wolfberry initially increased and then decreased with increasing irrigation amount. The total nitrogen uptake of W0 was significantly lower than that of W1 by 11.31%–12.50%. However, the accumulation of NO3−–N showed a fluctuating trend and W0 significantly increased by 7.54%–46.61% compared with W3. This suggests that a reasonable increase in irrigation can enhance crop nitrogen uptake, whereas excessive irrigation can lead to the “dilution effect” of crop nitrogen and exacerbate soil nitrogen loss, including the leaching of NO3−–N and NH4+–N, N2O emission, and NH4 volatilization (Ma et al., 2023). In addition, this study also revealed that the nitrogen uptake of wolfberry was the highest in the fruits, followed by the stems, roots, and leaves (except for the W3 treatment). Among these, the nitrogen absorption rate of wolfberry fruit (63.56 kg·ha−1) was the highest, and the total nitrogen absorption rate of wolfberry plants (160.45 kg·ha−1) was the highest under W1N2 treatment. It can be observed that using the appropriate water and nitrogen management strategy can produce a synergistic effect on water and nitrogen, enhancing the activity of nitrogen metabolism enzymes and the uptake of nitrogen by plants (Sun et al., 2009).
4.3 Soil N2O emission and its influencing factors under different water and nitrogen regulation
The application of irrigation and nitrogen not only affects the distribution and accumulation of NO3−–N in the soil and distribution and the absorption of nitrogen by plants, but also affects soil N2O emissions. The fluxes of N2O emission and total emissions during the harvest period of wolfberry were 28.68–177.91 ug·m−2·h−1 and 0.40–1.67 kg·ha−1, respectively. Moreover, three peaks of N2O emission flux (177.91 ug·m−2·h−1, 158.55 ug·m−2·h−1, and 150.93 ug·m−2·h−1) occurred after irrigation. This suggests that irrigation can increase soil microbial abundance and soil enzyme activity, leading to an increased mineralization rate of soil organic matter, higher soil nitrogen content, and consequently, greater release of N2O (Li et al., 2020). In line with Du et al. (2018), this study also found that the N2O emission flux from fully irrigated fields increased by an average of 7.97%–53.69% compared with deficit irrigation. This may be because higher soil moisture reduces soil porosity and soil O2 diffusion capacity, enhances soil denitrification, and promotes N2O emissions. The addition of exogenous nitrogen increases the substrate concentration for soil nitrification and denitrification, leading to enhanced N2O emissions (Stehfest and Bouwman, 2019). The results of this study revealed a significant positive correlation between total N2O emissions and nitrogen application (Figure 7A). Additionally, the total N2O emissions at 300 kg·ha−1 were 13.03% higher than those at 150 kg·ha−1. Similar results were also found by Zheng et al. (2021) in their study on wheat in Northwest China. This study also concluded that the interaction between water and nitrogen had a significant impact on the N2O emission intensity. The N2O emission intensity of the W1N2 treatment was significantly reduced by 31.8% and 11.76% compared with the W0N3 and W2N1 treatments (Figure 7B). These results indicate that the intensity of N2O emissions can be effectively reduced by appropriately reducing the amount of irrigation water and nitrogen application (Zhang et al., 2015). Previous studies found that the N2O emission coefficients of vegetable plots under different water and nitrogen supplies ranged from 1.09%–1.63% under different water and nitrogen conditions. Additionally, the N2O emission coefficients of orchards initially decreased and then increased with increasing nitrogen application (Cao et al., 2006; Wang et al., 2019). In this study, the N2O emission coefficient (0.17%–0.39%) for all treatments was generally low and decreased with increasing nitrogen application. This reason may be because the irrigation frequent during the growth period of wolfberry lower than that in vegetable fields, and frequent irrigation can lead to frequent alternations of dry and wet soil, promoting N2O emissions.
N2O emission fluxes are influenced by various factors, such as WFPS, soil temperature, and soil NO3−–N content. It has been found that soil wet-dry cycles promote the emission of N2O by stimulating nitrification and denitrification (Peyron et al., 2016). The emission flux of N2O is exponentially correlated with WFPS (Du et al., 2018). WFPS is maintained at 45%–75% when the N2O emission rate is at its maximum, during which soil nitrification-denitrification produces the same proportion of N2O (Shelton et al., 2000). This study demonstrated that soil WFPS in the 0–15 cm soil layer ranged from 37.53%–52.90% under varying water and nitrogen regulations. Additionally, a significant positive linear correlation was observed between N2O emission flux and WFPS (Figure 8A). This indicates that when WFPS was low, N2O emissions were mainly from the nitrification reaction, and WFPS gradually increased with increasing irrigation levels. When the WFPS exceeded a certain threshold, the denitrification rate gradually accelerated and contributed to N2O emissions along with the nitrification reaction. Soil temperature is an important factor that influences plant root respiration and soil microbial activity. Chen et al. (2018) found an exponential positive correlation between N2O emission flux and soil temperature in their study of greenhouse tomato in northwest China. This finding contradicted the conclusion of the present study, which found a linear and negative correlation between N2O emission flux and soil temperature (R2 = 0.15ns). The variation in soil temperature (23.1°C–26.6°C) during the wolfberry harvest period suggested a decrease in soil nitrogen mineralization and soil microorganism respiration. Simultaneously, the soil NO3−–N content can not only promote the denitrification rate but also inhibit the reduction of N2O to N2. In this study, it was found that soil NO3−–N increased with increasing nitrogen application (Figure 3; Table 2). Additionally, N2O emission flux showed a significant and linear positive correlation with soil NO3−–N content (R2 = 0.64**). This result further demonstrated that when the nitrogen application rate exceeds the nitrogen requirement of the plant, excess nitrogen remains in the soil and is eventually lost in the form of N2O. Therefore, water and nitrogen inputs should be properly controlled to minimize N2O emissions during agricultural production. In addition to WFPS, soil temperature, and soil NO3−–N content, the intermediate products of nitrification-denitrification, N2, and NH4, are also important factors that affect soil N2O emissions. Subsequent monitoring of N2 and NH4 should be conducted to further investigate the emission characteristics of soil N2O under different water nitrogen regulations.
5 Conclusions
Soil NO3−–N content exhibited a leaching trend with an increase in irrigation amount and an increasing trend with an increase in nitrogen application rate. Soil NO3−–N accumulation (90.13–185.91 kg·ha−1) gradually decreased with the increase in horizontal distance and increased with the increase in irrigation and nitrogen application. The total nitrogen content and uptake in all organs (roots, stems, leaves and fruits) exhibited threshold values in response to water and nitrogen, reaching their maximum under the W1N2 treatment. The maximum values were 3.25% and 27.82 kg·ha−1, 3.30% and 57.19 kg·ha−1, 3.91% and 11.88 kg·ha−1, 2.42% and 63.56 kg·ha−1, respectively. The flux of N2O emission ranged from 28.68–177.91 ug·m−2·h−1, with total emissions ranged from 0.40–1.67 kg·ha−1. The emission intensity varied from 0.08–0.23 kg·kg−1 and the emission coefficient ranged from 0.17%–0.39%. These values exhibited an increasing trend with increasing irrigation. The total emission, emission intensity and emission coefficient of N2O reached their highest values in the W0N3 treatment (1.67 kg·ha−1), W3N3 treatment (0.23 kg·kg−1) and W0N1 treatment (0.39%) treatments, respectively. Based on the comprehensive evaluation of the CRITIC-entropy weights-TOPSIS model, it was concluded that a slight water deficit (65%–75% θf) coupled with a nitrogen application rate (300 kg·ha−1) is an effective water and nitrogen control model to conserve water and reduce nitrogen in the production of wolfberry in the Yellow River irrigation region of Gansu Province.
Data availability statement
The raw data supporting the conclusions of this article will be made available by the authors, without undue reservation
Author contributions
RT: Conceptualization, Data curation, Formal analysis, Investigation, Methodology, Writing – original draft. JW: Conceptualization, Project administration, Supervision, Writing – review & editing. MY: Data curation, Formal analysis, Writing – review & editing. YM: Funding acquisition, Writing – review & editing. QJ: Funding acquisition, Writing – review & editing. YK: Funding acquisition, Writing – review & editing, Project administration. GQ: Formal analysis, Writing – review & editing. YG: Writing – review & editing, Investigation. YJ: Writing – review & editing, Methodology. HL: Writing – review & editing, Project administration. FX: Investigation, Writing – review & editing.
Funding
The author(s) declare that financial support was received for the research, authorship, and/or publication of this article. This study was funded by the National Natural Science Regional Foundation Project, China (Grant Nos. 51969003 and 52069001); the Industry Support Projects in Gansu Province Department of Education (2021CYZC-20); the Key Research and Development Project of Gansu Province, China (Grant No. 22YF7NA110); the Innovation Fund for Universities in Gansu Province, China (No. 2023A-054); the Science and Technology Program of Lanzhou City (2022-2-60); the Gansu Agricultural University youth mentor support fund project (Grant Nos. GAU-QDFC-2023-12 and GAU-QDFC-2022-22); the “Northwest arid region Collaborative Utilization of water and soil resources innovation team” of Gansu Agricultural University discipline team construction project (Grant No. GAU-XKTD-2022-09); the Agricultural Smart Water Saving Technology Innovation Center of Gansu Province; the Jingtai Wolfberry Science and Technology Academy of Gansu Province; the Harmless Wolfberry Cultivation Engineering Research Center of Gansu Province.
Acknowledgments
The authors would like to thank the Agricultural Smart Water Saving Technology Innovation Center of Gansu Province, the Jingtai Wolfberry Science and Technology Academy of Gansu Province, and the Harmless Wolfberry Cultivation Engineering Research Center of Gansu Province for their support of this study. We also gratefully acknowledge the editors and reviewers who put forward constructive comments on this article.
Conflict of interest
The authors declare that the research was conducted in the absence of any commercial or financial relationships that could be construed as a potential conflict of interest.
Publisher’s note
All claims expressed in this article are solely those of the authors and do not necessarily represent those of their affiliated organizations, or those of the publisher, the editors and the reviewers. Any product that may be evaluated in this article, or claim that may be made by its manufacturer, is not guaranteed or endorsed by the publisher.
References
Azad, N., Behmanesh, J., Rezaverdinejad, V., Abbasi, F., Navabian, M. (2020). An analysis of optimal fertigation implications in different soils on reducing environmental impacts of agricultural nitrate leaching. Sci. Rep. 10, 7797. doi: 10.1038/s41598-020-64856-x
Bai, Z. H., Lu, J., Zhao, H., Velthof, G. L., Oenema, O., Chadwick, D., et al. (2018). Designing vulnerable zones of nitrogen and phosphorus transfers to control water pollution in China. Environ. Sci. Technol. 52, 8987–8988. doi: 10.1021/acs.est.8b02651
Burton, D. L., Zebarth, B. J., Gillam, K. M., MacLeod, J. A. (2008). Effect of split application of fertilizer nitrogen on N2O emissions from potatoes. Can. J. Soil Sci. 88, 229–239. doi: 10.4141/CJSS06007
Cambouris, A. N., Zebarth, B. J., Nolin, M. C., Laverdière, M. R. (2008). Apparent fertilizer nitrogen recovery and residual soil nitrate under continuous potato cropping: Effect of N fertilization rate and timing. Can. J. Soil Sci. 88, 813–825. doi: 10.4141/CJSS07107
Cao, B., He, F. Y., Xu, Q. M., Yin, B., Cai, G. X. (2006). Denitrification losses and N2O emissions from nitrogen fertilizer applied to a vegetable field. Pedosphere 16, 390–397. doi: 10.1016/S1002-0160(06)60067-2
Cao, K. X., Zhao, K., Jin, W. F. F., Zhu, T. Y., Shan, X. L., Mei, H., et al. (2022). Effects of water-nitrogen interaction on greenhouse gas emissions in a paddy soil. Acta Pedol. Sin. 59, 1386–1396. doi: 10.11766/trxb202011250646
Chen, H., Hou, H. J., Hu, H. W., Shang, Z. H., Zhu, Y., Cai, H. J., et al. (2018). Aeration of different irrigation levels affects net global warming potential and carbon footprint for greenhouse tomato systems. Sci. Hortic-Amsterdam 242, 10–19. doi: 10.1016/j.scienta.2018.07.021
Chen, S. J., Li, F. S., Li, M. L. (2023). Effect of nitrogen fertigation management on soil nitrogen fractions and N2O emissions from ratoon sugarcane fields. J. South China Agric. Univ. 44, 230–238. doi: 10.7671/j.issn.1001-411X.202112032
Chen, Y. L., Zhang, P. P., Wang, L. F., Ma, G., Li, Z., Wang, C. Y. (2020). Interaction of nitrogen and phosphorus on wheat yield, N use efficiency and soil nitrate nitrogen distribution in the North China Plain. Int. J. Plant Prod. 14, 415–426. doi: 10.1007/s42106-020-00093-6
Cong, X., Pang, G. B., Zhang, L. Z., Xu, Z. H., Yang, J. L., Mou, X. Y. (2021). Effects of nitrogen-reducing and suitable wateron photosynthetic characteristics of winter wheat and distribution of soil water and nitrogen. Trans. Chin. Soc Agric. Mach. 52, 324–332. doi: 10.6041/j.issn.1000-1298.2021.06.034
Cui, Z. L., Chen, X. P., Zhang, F. S. (2013). Development of regional nitrogen rate guidelines for intensive cropping systems in China. Agron. J. 105, 1411–1416. doi: 10.2134/agronj2012.0398
Dai, M., Zhang, Y. M. (2020). Effects of coupling of water and nitrogen on the accumulation of soil nitrogen in root zone and yield of rice. Res. Soil Water Conserv. 27, 168–173. doi: 10.13869/j.cnki.rswc.2020.03.025
Danial, F., Luisa, M. A., Giancarlo, C. (2022). Quality of Goji Berry Fruit (Lycium barbarum L.) Stored at Different Temperatures. Foods 11, 3700. doi: 10.3390/FOODS11223700
Dou, X., Shi, H. B., Li, R. P., Miao, Q. F., Tian, F., Yu, D. D. (2021). Effect of controlled drainage on loss and utilization of Nitrogen in Hetao Irrigation District. Trans. Chin. Soc. Agric. Mach. 52, 315–322, 420. doi: 10.6041/j.issn.1000-1298.2021.11.034
Du, Y. D., Niu, W. Q., Gu, X. B., Zhang, Q., Cui, B. J. (2018). Water-and nitrogen-saving potentials in tomato production. A mete-analysis. Agr. Water Manage. 210, 296–303. doi: 10.1016/j.agwat.2018.08.035
Du, S. Y., Xue, F., Wu, H. Q., Zou, H. T., Zhang, Y. L., Zhang, Y. L., et al. (2019). Interactive effect of irrigation and nitrogen fertilization on greenhouse gas emissions from greenhouse soil. J. Agro-Environ. Sci. 38, 476–484. doi: 10.11654/jaes.2018-0408
Filipović, V., Romić, D., Romić, M., Borošić, J., Filipović, L., Mallmann, F. J. K., et al. (2016). Plastic mulch and nitrogen fertigation in growing vegetables modify soil temperature, water and nitrate dynamics: Experimental results and a modeling study. Agr. Water Manage. 176, 100–110. doi: 10.1016/j.agwat.2016.04.020
Gao, X. P., Tenuta, M., Nelson, A., Sparling, B., Tomasiewicz, D., Mohr, R. M., et al. (2013). Effect of nitrogen fertilizer rate on nitrous oxide emission from irrigated potato on a clay loam soil in Manitoba, Canada. Can. J. Soil Sci. 93, 1–11. doi: 10.4141/cjss2012-057
Gu, X. B., Li, Y. N., Huang, L., Du, Y. D., Chen, P. P., Fang, H. (2018). Effects of irrigation and nitrogen coupling on nitrogen absorption and soil nitrate content of winter oilseed rape. Sci. Agric. Sin. 51, 1283–1293. doi: 10.3864/j.issn.0578-1752.2018.07.006
Hou, H. J., Chen, H., Cai, H. J., Yang, F., Li, D., Wang, F. T. (2016). CO2 and N2O emissions from Lou soils of greenhouse tomato fields under aerated irrigation. Atmos Environ. 132, 69–76. doi: 10.1016/j.atmosenv.2016.02.027
Iranzi, E. R., Wang, W. M., Li, Y. T., Li., X. J. (2023). Translocation of nitrate in rice rhizosphere and total nitrogen uptake improvement under interactive effect of water and nitrogen supply. Commun. Soil Sci. Plan. 54, 378–391. doi: 10.1080/00103624.2022.2115059
Ju, X. T., Gu, B. J., Wu, Y. Y., Galloway, J. N. (2016). Reducing China’s fertilizer use by increasing farm size. GEC Advances. 41, 26–32. doi: 10.1016/j.gloenvcha.2016.08.005
Li, Q., Bian, C. Y., Liu, X. H., Ma, C. J., Liu, Q. R. (2015). Winter wheat grain yield and water use efficiency in wide-precision planting pattern under deficit irrigation in North China Plain. Agr. Water Manage. 153, 71–76. doi: 10.1016/j.agwat.2015.02.004
Li, J. Z., Wang, E. L., Wang, Y. C., Xing, H. T., Wang, D. L., Wang, L. G., et al. (2016). Reducing greenhouse gas emissions from a wheat-maize rotation system while still maintaining productivity. Agr. Syst. 145, 90–98. doi: 10.1016/j.agsy.2016.03.007
Li, L. F., Zheng, Z. Z., Wang, W. J., Biederman, J. A., Xu, X. L., Ran, Q. W., et al. (2020). Terrestrial N2O emissions and related functional genes under climate change: A global meta-analysis. Global Change Biol. 26, 931–943. doi: 10.1111/gcb.14847
Liao, H., Gan, H. T., Liu, K., Yin, X., Liu, S. H., Tang, X. Y., et al. (2021). Optimal water scheme and N rate for high N uptake and yield of machine-harvested cotton. Plant Nutr. Fert. Sci. 27, 2229–2242. doi: 10.11674/zwyf.2021180
Liu, P., Huang, J. H., Han, X. G., Sun, O. J., Zhou, Z. Y. (2006). Differential responses of litter decomposition to increased soil nutrients and water between two contrasting grassland plant species of Inner Mongolia, China. Appl. Soil .Ecol. 34, 266–275. doi: 10.1016/j.apsoil.2005.12.009
Liu, X. J., Mosier, A. R., Halvorson, A. D., Reule, C. A., Zhang, F. S. (2007). Dinitrogen and N2O emissions in arable soils effect of tillage, N source and soil moisture. Soil Biol. Biochem. 39, 2362–2370. doi: 10.1016/j.soilbio.2007.04.008
Lu, J. J., Nie, Y. F., Wei, J. J., Sheng, H. Y., Hua, M. X., Xu, M. C., et al. (2022). Effects of different nitrogen application measures on NH3 volatilization and N2O emissions in a wolfberry orchard. J. Agro-Environ. Sci. 41, 210–220. doi: 10.11654/jaes.2021-0702
Ma, X. C., Ma, G. C., Xuan, Z. Y., Min, H. Z., Qi, Z. W., Chen, H. Y., et al. (2023). Effects of water of nitrogen coupling on nutrient absorption and utilization of water and fertilizer in cucumber. China Soils Fert. 2023, 39–47. doi: 10.11838/sfsc.1673-6257.21650
Mahdi, G., Seyed, M. M., Mehdi, H., Mohammad, E. A., Gerrit, H. (2009). Nitrate leaching in a silage maize field under different irrigation and nitrogen fertilizer rates. Agr. Water Manage. 96, 946–954. doi: 10.1016/j.agwat.2009.01.005
Mario, C., Abraham., J., Ingrid, W., Rui, B., Ingmar, M. (2017). Response of maize root growth to irrigation and nitrogen management strategies in semi-arid loamy sandy soil. Field Crop Res. 200, 143–162. doi: 10.1016/j.fcr.2016.10.005
Mohkum, H. H., Farhat, A., Ashfaq, A., Wajid, F., Wilkerson, C. J., Gerrit, H. (2023). Water and nitrogen management influence on oil and protein concentration in maize. Agron. J. 115, 557–568. doi: 10.1002/agj2.21275
Peyron, M., Bertora, C., Pelissetti, S., Said, P. D., Celi, L., Miniotti, E., et al. (2016). Greenhouse gas emissions as affected by different water management practices in temperate rice paddies. Agric. Ecosyst. Environ. 232, 17–28. doi: 10.1016/j.agee.2016.07.021
Qin, S. S., Hou, Z. J., Wu, Z. D., Ma, D. H., Huang, P. (2017). Effects of water and nitrogen coupling on nitrogen absorption and yield of winter wheat. J. Drain. Irrig. Mach. Eng. 35, 440–447. doi: 10.3969/j.issn.1674-8530.16.0100
Qin, Z. Y., Zhang, Z. X., Sun, D., Song, J., Zhang, Z. H., Li, T. C. (2021). Effect of water and nitrogen coupling on rice yield and nitrogen absorption and utilization in black soil. Trans. Chin. Soc. Agric. Mach. 52, 324–335, 357. doi: 10.6041/j.issn.1000-1298.2021.12.034
Shelton, D. R., Sadeghi, A. M., Mcarty, G. W. (2000). Effect of soil water content on denitrification during cover crop decomposition. Soil Sci. 165, 365–371. doi: 10.1097/00010694-200004000-00007
Si, Z. Y., Gao, Y., Shen, X. J., Liu, H., Gong, X. W., Duan, A. W. (2017). Effects of nitrogen and irrigation water application on yield, water and nitrogen utilization and soil nitrate nitrogen accumulation in summer cotton. Chin. J. Appl. Ecol. 28, 3945–3954. doi: 10.13287/j.1001-9332.201712.022
Song, L. N., Zhang, Y. M., Hu, C. S., Zhang, X. Y., Dong, W. X., Wang, Y. Y., et al. (2013). Comprehensive analysis of emissions and global warming effects of greenhouse gases in winter-wheat fields in the high-yield agro-region of North China Plain. Chin. J. Eco-Agric. 21, 297–307. doi: 10.3724/SP.J.1011.2013.00297
Stehfest, E., Bouwman, L. F. (2019). N2O and NO emission from agricultural fields and soils under natural vegetation: summarizing available measurement data and modeling of global annual emissions. Nutr. Cycl Agroecosys. 74, 207–228. doi: 10.1007/s10705-006-9000-7
Sun, Y. J., Sun, Y. Y., Li, X. Y., Guo, X., Ma, J. (2009). Relationship of activities of key enzymes involved in nitrogen metabo-lism with nitrogen utilization in rice under water-nitrogen interaction. Acta Agron. Sin. 35, 2055–2063. doi: 10.3724/SP.J.1006.2009.02055
Tian, R. R., Qi, G. P., Kang, Y. X., Jia, Q., Wang, J. H., Xiao, F., et al. (2023). Effects of irrigation and nitrogen application on soil water and nitrogen distribution and water-nitrogen utilization of wolfberry in the Yellow River Irrigation Region of Gansu Province, China. Front. Plant Sci. 14. doi: 10.3389/fpls.2023.1309219
Vijayalakshmi, P., Kiran, T. V., Rao, Y. V., Srikanth, B., Rao, I. S., Sailaja, B., et al. (2013). Physiological approaches for increasing nitrogen use efficiency in rice. Plant Physiol. Res. 18, 208–222. doi: 10.1007/s40502-013-0042-y
Wang, C., Chen, B. L., Yu, S. F. J. Y. S. Y., Wang, Q. D., Chai, Z. P. (2019). Effect of nitrogen application rate on ammonia volatilization and nitrous oxide emission in Korla fragrant pear orchard. Agric. Res. Arid Areas. 37, 157–164. doi: 10.7606/j.issn.1000-7601.2019.05.23
Wang, X. Y., He, M. R., Liu, Y. H., Zhang, H. H., Li, F., Hua, F. X., et al. (2008). Interactive effects of irrigation and nitrogen fertilizer on nitrogen fertilizer recovery and nitrate-N movement across soil profile in a winter wheat field. Acta Ecol. Sin. 28, 685–694. doi: 10.3321/j.issn:1000-0933.2008.02.029
Wang, X., Li, W. Y., An, J. Q., Shi, H. Z., Tang, Z. J., Zhao, X., et al. (2023). Effects of nitrogen supply on dry matter accumulation, water-Nitrogen use efficiency and grain yield of soybean (Glycine max L.) under Different Mulching Methods. Agronomy. 13, 606. doi: 10.3390/AGRONOMY13020606
Wang, Y. Y., Li, X. X., Dong, W. X., Zhang, Y. M., Qin, S. P., Hu, C. S. (2018a). Review on greenhouse gas emission and reduction in wheat-maize double cropping system in the North China Plain. Chin. J. Eco-Agric. 682 (2), 167–174. doi: 10.13930/j.cnki.cjea.171117
Wang, D., Li, G. Y., Mo, Y., Cai, M. K., Bian, X. Y. (2018b). Evaluation of optimal nitrogen rate for corn production under mulched drip fertigation and economic benefits. Field Crop Res. 216, 225–233. doi: 10.1016/j.fcr.2017.10.002
Wang, A. X., Ma, Y. L., Qi, G. P., Kang, Y. X., Yin, M. H., Wang, J. H., et al. (2022). Water and nitrogen regulation patterns for productivity improvement of Bromus inermis and Alfalfa mixed grassland. J. Soil Water Conserv. 36, 322–330. doi: 10.13870/j.cnki.stbcxb.2022.02.041
Wu, P. D., Chen, C., Ren, X. M. (2022b). Effects of straw returning depth on soil nitrate nitrogen during wheat growth period. Environ. Sci. Tech. 45, 103–108. doi: 10.19672/j.cnki.1003-6504.1611.22.338
Wu, J. Z., Li, S. H., Li, G. Q., Huang, M., Fu, G. Z., Li, Y. J., et al. (2023). Effects of irrigation and topdressing nitrogen at jointing stage on grain yield and quality of furrow-seeding wheat in dryland. Acta Agric. Boreali-Sin. 38, 100–107. doi: 10.7668/hbnxb.20193771
Wu, M. K., Su, Q. W., Song, Z., Jiang, H., Li, Y. Z., Wei, X. S., et al. (2022a). Effects of water-nitrogen interaction coupled with straw addition on rice paddy field grain yield and greenhouse gas emissions. Int. J. Plant Prod. 16, 1–11. doi: 10.1007/s42106-022-00185-5
Xing, H. B., Cong, X., Pang, G. B. (2021). The optimal scheme of summer maize in Shandong under the control of water and fertilizer. IOP Conf. Ser.: Earth Environ. Sci. 784, 26–28. doi: 10.1088/1755-1315/784/1/012026
Yan, C. P., Zhang, Y. M., Hu, C. S., Dong, W. X., Wang, Y. Y., Li, X. X., et al. (2016). Greenhouse gas exchange and comprehensive global warming potential under different wheat-maize rotation patterns. Chin. J. Eco-Agric. 24, 704–715. doi: 10.13930/j.cnki.cjea.160261
Yang, S. C., Wang, C. B., Huo, L., Jiang, W. L., Wen, M. J. (2019). Effects of different tillage practices on soil organic carbon of cultivated land in Gansu Yellow River irrigation district. Trans. Chin. Soc Agric. Eng. 35, 114–121. doi: 10.11975/j.issn.1002-6819.2019.02.015
Ye, S., Li, C. Y., Qiu, X., Xiong, B., Sun, G. C., Huang, S. J., et al. (2017). Application of combination weighting based TOPSIS model in fruit quality evaluation. J. Northwest Sci-Tech Univ. Agric. For. (Nat. Sci. Ed.). 45, 111–121. doi: 10.13207/j.cnki.jnwafu.2017.10.014
Zhang, M., Chen, Z. Z., Li, Q. L., Chang, H. F., Zheng, Q. X. (2015). Quantitative relationship between nitrous oxide emissions and nitrogen application rate fora typical intensive vegetable cropping system in Southeastern China. CLEAN – Soil Air Water. 44, 1725–1732. doi: 10.1002/clen.201400266
Zhang, H., Zeng, X., Wang, A. L., Ha, L. H. S. Y. B. T., Li, Q. J., Zhang, Y. (2021). Effects of different nitrogen application rates on yield, nutrient uptake and nitrogen utilization of c0tton in Southern XinJiang. Xinjiang Agric. Sci. 58, 1656–1664. doi: 10.6048/j.issn.1001-4330.2021.09.011
Zhao, J. L., Dong, Z. Y., Chang, Z. F. (2019). Ecological compensation of a desert water-lifting project based on opportunity cost of ecosystem service value: A case study on Jingtaichuan water-lifting irrigation project. Arid Zone Res. 36, 743–751. doi: 10.13866/j.azr.2019.03.26
Zhen, Z. X., Zhen, W. Y. (2006). Nitrogen metabolism in flag leaf and grain of wheat in response to irrigation regimes. J. Plant Nutr. Soil Sci. 169, 118–126. doi: 10.1002/jpln.200420418
Zheng, J., Fan, J. L., Zhang, F. C., Guo, J. J., Yan, S. C., Zhuang, Q. L., et al. (2021). Interactive effects of mulching practice and nitrogen rate on grain yield, water productivity, fertilizer use efficiency and greenhouse gas emissions of rain fed summer maize in northwest China. Agr. Water Manage. 248, 106778. doi: 10.1016/j.agwat.2021.106778
Keywords: water and nitrogen regulation, soil NO3−–N, nitrogen uptake, N2O emission, CRITIC-entropy weights-TOPSIS model, wolfberry
Citation: Tian R, Wang J, Yin M, Ma Y, Jia Q, Kang Y, Qi G, Gao Y, Jiang Y, Li H and Xiao F (2024) Investigation of the regulatory effects of water and nitrogen supply on nitrogen transport and distribution in wolfberry fields. Front. Plant Sci. 15:1385980. doi: 10.3389/fpls.2024.1385980
Received: 14 February 2024; Accepted: 01 April 2024;
Published: 17 April 2024.
Edited by:
Jose R. Peralta-Videa, The University of Texas at El Paso, United StatesReviewed by:
Haidong Wang, Kunming University of Science and Technology, ChinaFucang Zhang, Northwest A&F University, China
Copyright © 2024 Tian, Wang, Yin, Ma, Jia, Kang, Qi, Gao, Jiang, Li and Xiao. This is an open-access article distributed under the terms of the Creative Commons Attribution License (CC BY). The use, distribution or reproduction in other forums is permitted, provided the original author(s) and the copyright owner(s) are credited and that the original publication in this journal is cited, in accordance with accepted academic practice. No use, distribution or reproduction is permitted which does not comply with these terms.
*Correspondence: Jinghai Wang, d2FuZ2poQGdzYXUuZWR1LmNu; Minhua Yin, eWlubWhAZ3NhdS5lZHUuY24=