 Caixia Yin
 Zhenyang Wang
 Xin Lv2
- 1College of Agriculture, Xinjiang Agricultural University, Urumqi, China
- 2Key Laboratory of Oasis Eco-Agriculture, Xinjiang Production and Construction Corps, Shihezi University, Shihezi, China
Introduction: Individual leaves in the image are partly veiled by other leaves, which create shadows on another leaf. To eliminate the interference of soil and leaf shadows on cotton spectra and create reliable monitoring of cotton nitrogen content, one classification method to unmanned aerial vehicle (UAV) image pixels is proposed.
Methods: In this work, green light (550 nm) is divided into 10 levels to limit soil and leaf shadows (LS) on cotton spectrum. How many shadow has an influence on cotton spectra may be determined by the strong correlation between the vegetation index (VI) and leaf nitrogen content (LNC). Several machine learning methods were utilized to predict LNC using less disturbed VI. R-Square (R2), root mean square error (RMSE), and mean absolute error (MAE) were used to evaluate the performance of the model.
Results: (i) after the spectrum were preprocessed by gaussian filter (GF), SG smooth (SG), and combination of GF and SG (GF&SG), the significant relationship between VI and LNC was greatly improved, so the Standard deviation of datasets was also decreased greatly; (ii) the image pixels were classified twice sequentially. Following the first classification, the influence of soil on vegetation index (VI) decreased. Following secondary classification, the influence of soil and LS to VI can be minimized. The relationship between the VI and LNC had improved significantly; (iii) After classifying the image pixels, the VI of 2-3, 2-4, and 2-5 have a stronger relationship with LNC accordingly. Correlation coefficients (r) can reach to 0.5. That optimizes monitoring performance when combined with GF&SG to predict LNC, support vector machine regression (SVMR) has the better performance, R2, RMSE, and MAE up to 0.86, 1.01, and 0.71, respectively. The UAV image classification technique in this study can minimize the negative effects of soil and LS on cotton spectrum, allowing for efficient and timely predict LNC.
1 Introduction
Nitrogen is an essential element for crop growth and development, and its abundance and deficiency have great influence on cotton yield and quality (Snider et al., 2021). Traditional nitrogen monitoring methods require human and material resources during sampling, determination, and data analysis, among other processes, and appear to be not commonly applied (Bacsa et al., 2019). The rapid development of spectral technology, particularly rapid non-destructive and spectrum integrated monitoring technology, has balanced the limitations of traditional nitrogen monitoring methods (Johnson et al., 2016).
Precision agriculture is vital for cotton nitrogen monitoring by gathering field data for precision management and decision making in big fields. Spectral technology has become an important direction and research hotspot in precision agriculture. Hyperspectral remote sensing extracts spectroscopic data from a target using electromagnetic spectra with extremely narrow wavelengths, generating a continuous and full spectral curve with spectral information perfectly reflecting the intrinsic features of the target (Govender et al., 2008). At present, remote sensing technology is divided into aerospace, aviation, low-altitude remote sensing, and near-ground remote sensing. Low-altitude remote sensing is the collection of data via unmanned aerial vehicle (UAV) photography (Sun et al., 2017). Compared with near-ground remote sensing, UAV remote sensing has higher temporal and spatial resolution (Zheng et al., 2018), tend to be highly flexible and relatively inexpensive, and is suitable for large-scale monitoring (Delavarpour et al., 2021), whereas remote sensing from aerospace and aviation has a time and space lag with crops (McConkey et al., 2004; Yang et al., 2014), in addition to several limitations due to cloud coverage and high costs, making UAV technology a complementary to near-ground and satellite technology (Manfreda et al., 2018). In agriculture, much of the work is done using UAV, including growth assessment (Tao et al., 2020; Gong et al., 2021) and nutrition assessment, among others (Kerkech et al., 2020; Das et al., 2022).
Academic research on nutrition assessment has been conducted on a variety of crops, such as winter wheat (Sun et al., 2018; Song et al., 2022), rice (Bacsa et al., 2019), corn (Xu et al., 2021), cotton (Chu et al., 2016; Volkova et al., 2018), and sorghum (Shafian et al., 2018). However, there are still significant barriers to agricultural nutrition monitoring, such as the complicated growing environment of field crops, which results in UAV images with a huge quantity of soil and leaf shadow, among others. According to Liu et al. (2020), the key elements influencing the accuracy of monitoring the aforementioned agricultural information include the specific vegetative growth stages, the vegetation cover, the crop canopy structure, and the crop types. This may be the result of non-static cotton leaf shadow or soil. Cotton has a dwarf form and more leaves. The lower leaves in the binary images are partially or entirely shaded by canopy leaves, casting shadows on another leaf. While the reflectance of shadows is likewise relatively lower, these areas are either explicitly directly deleted or ignored in target recognition, leading to the acquisition of vegetation spectra lower than the actual spectral reflectance (Tong et al., 2017; Liu et al., 2020). To increase the inversion performance, some researchers have used the canny edge detection technique to eliminate the soil background and leaf shadow (Zhang et al., 2018). Caturegli et al. (2015) claimed that the magnitude of the normalized difference vegetation index (NDVI) is vulnerable to the surrounding environment. To minimize as much as possible the influence of soil and leaf shadows on the cotton spectrum, a significant amount of research has been conducted by numerous experts on ways to lessen the interference of soil and leaf shadows on the spectrum, which is the most valuable information for precision farming. Three points are summarized below. Firstly, specific spectral pretreatment techniques can successfully minimize the disturbance of soil, such as the first-order derivative and Savitzky–Golay (SG) smoothing (Zhang et al., 2022; Yin et al., 2022). Secondly, the vegetation index (VI) is a product of the enhanced remote sensing image that can efficiently emphasize spectral features while reducing redundant information, which is more stable and dependable than spectral reflectance (Feng et al., 2014; Yao et al., 2014). For example, Chen et al. (2010) proposed that the double-peaked canopy nitrogen index (DCNI) could mitigate the effect of canopy structure. Stroppiana et al. (2009) claimed that the optimal normalized difference index (NDIopt) based on the blue/green regions has a smaller impact on the rice leaf area index (LAI) and canopy structure than the NDVI and is more sensitive to changes in the plant N concentration. Zhu et al. (2007) demonstrated that the link between various VIs and N changed with crop type and crop phenology. As a result, the VI may be more stable for target detection than spectral reflection information. Thirdly, strategies to reduce the interference of soil and shadow have been developed by many scholars. Woebbecke et al. (1995) evaluated the capacity of various color indices to differentiate the vegetation from the background and hypothesized that the excess green (ExG) vegetation index may offer a near-binary intensity image to highlight a plant area of interest. M-Desa et al. (2022) performed picture shadow and non-shadow discrimination using color characteristics and supervised classification. There are numerous studies on the shadow rejection of buildings in UAV images; however, for agricultural images, these studies have all focused on trees with simple canopy structures (Prado Osco et al., 2019), such as apples and oranges, where shadows are easy to reject (Khekade and Bhoyar, 2015). Therefore, leaf shadows are difficult to remove completely. With advancement of the phenological stage of cotton, cotton leaves will gradually expand and the soil in the captured image could be covered. Therefore, the impact of soil on cotton field nutrient monitoring can be easily removed than the leaf shadow. Thus, rejecting cotton leaf shadowing is sophisticated compared with cotton nitrogen monitoring. Woebbecke et al. (1995) proposed that the color difference coordinates of green were significantly higher than those of other colors and used red–green–blue (RGB) primary colors to determine a color index that best distinguishes between the various color images of plant materials, weeds, soil, residues, and background light conditions. Guyer et al. (1986) discovered that the intensity of the pixels in the plant images was higher than that of the soil pixels by shining visible light on the plants.
Undeniably, in addition to these factors that might affect the cotton leaf spectra, modeling methods can also directly contribute to the precision of forecasts. Miphokasap et al. (2012) provided proof that, in comparison to narrow-band multiple linear regression (MLR)-based model applications, the model model developed by SMLR demonstrated a higher correlation coefficient with nitrogen content than the model based on narrow vegetation indices. In recent decades, numerous nonlinear and nonparametric methods that go beyond linear regression and linear transformation have been developed. These methods are also known as machine learning regression algorithms (Verrelst et al., 2015). Therefore, this study classified image pixels to eliminate redundant information and to reduce the impact of leaf shading and soil on the drone spectra. Machine learning methods were used to improve the accuracy of the large-scale monitoring of cotton leaf nitrogen content (LNC) in order to provide guidance for the rational application of nitrogen fertilizer.
2 Materials and methods
2.1 Experimental area
This experiment was carried out in July of 2020 at the experimental station of Shihezi University (44°19′53.83″ N, 85°59.65″ E). Figure 1 depicts the map of the experimental area. Various amounts of N fertilizer were randomly applied to each plot, resulting in a total of 6 N fertilizer gradients and three repetitions. There were 18 pilot zones.
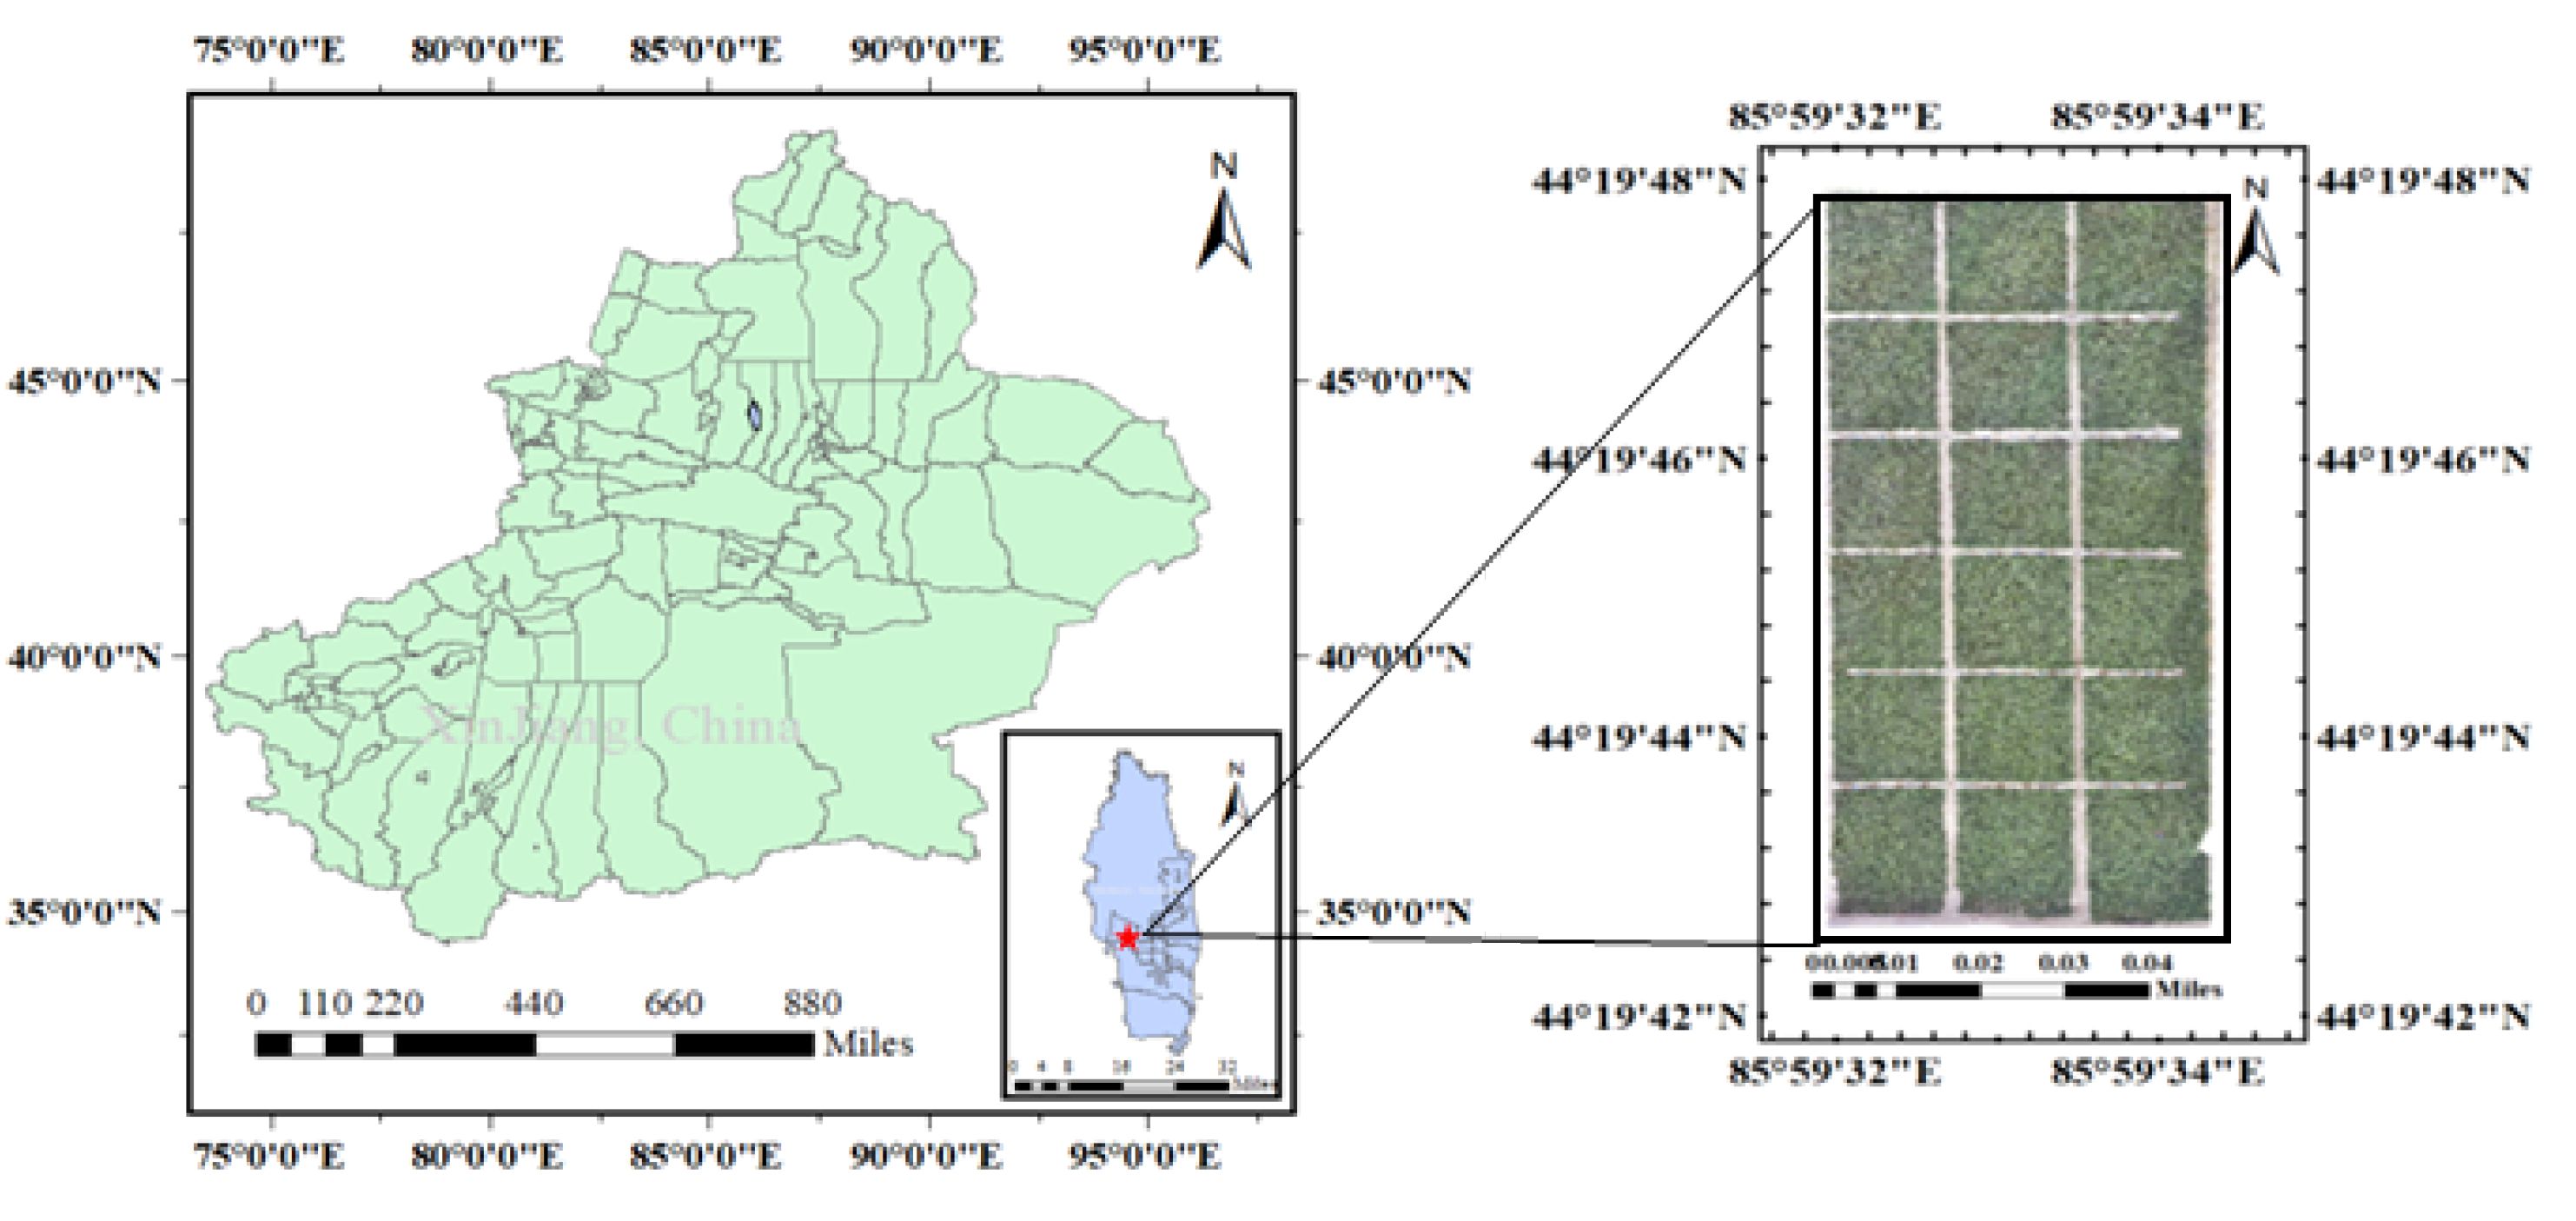
Figure 1. Experimental area.
The application of six N fertilizers was intended to enhance the presence of numerous N fertilizers. The nitrogen fertilizer gradients were 0, 120, 240, 360, and 480 kg ha−1 to ensure the stability of the model estimates, which were correspondingly indicated as N0, N120, N240, N360, and N480. Cotton was the first plant to be cultivated at the experimental site. Prior to planting, 30% N fertilizer was applied to the cotton. The second half of April was used to grow cotton. Of the N fertilizer, 70% was sprayed on June 22, July 9, July 18, August 5, and August 15 at respective rates of 10%, 10%, 20%, 20%, and 10%. The water was irrigated on June 13, June 23, July 14, July 25, August 5, and August 16 according to the combined local standard drip irrigation.
2.2 Data collection
2.2.1 Hyperspectral images using an unmanned aerial vehicle
The UAV images were captured at 100 m above the cotton canopy on July 16, 2020. Clear weather and the absence of wind and clouds are essential for capturing the images. The flight was scheduled to depart between 1200 and 1400 hours local time.
When the UAV was flying at 100 m altitude, the ground spatial resolution was 0.03 m. The UAV is an aircraft in the domestically DJI M600 series (Supplementary Figure 1). The sensor used was Nano-Hyperspec (Supplementary Figure 2). The sensor has a GPS integrated inertial measurement unit (IMU). The GPS and IMU signals were used for orthorectification. The parameters are listed in Table 1.
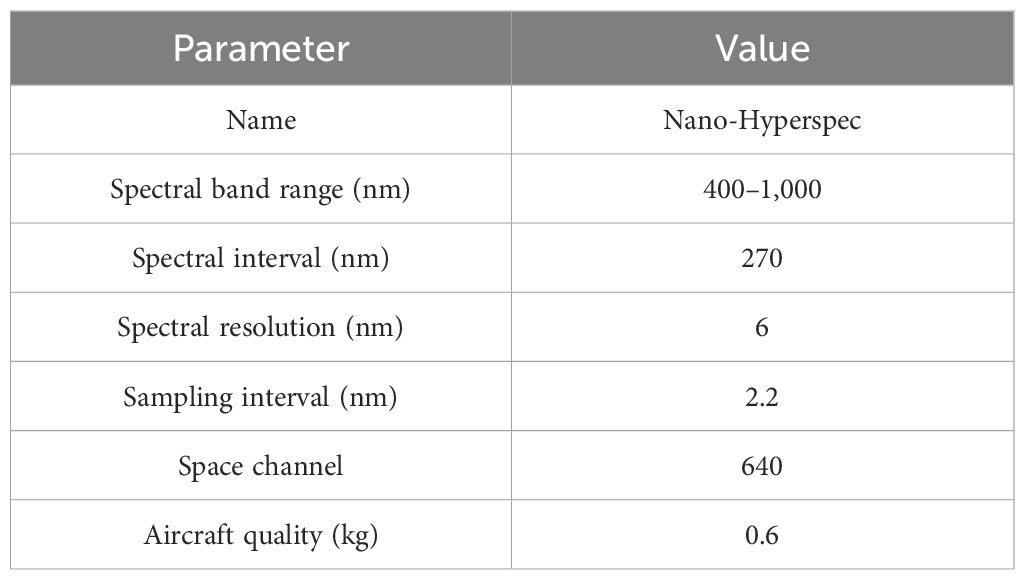
Table 1. Main parameters of the nano-imaging spectrometer.
2.2.2 Cotton leaf nitrogen content
For this study, cotton plants were destructively sampled during their bud phase. The chopped leaves were placed in ice trays and returned to the laboratory for LNC measurements. The leaves were oven-dried to constant weight at 80°C and then crushed using a crusher. The cotton LNC was determined through micro-Kjeldahl analysis (Tian et al., 2014).
2.3 Data processing methods
2.3.1 UAV image pre-processing
The acquired UAV images were pre-processed with the instrument’s own software, “Spectral View,” which also included atmospheric and orthorectification adjustments. ENVI 5.3 was used to complete the image mosaic and radiometric calibration procedures. Radiometric calibration is the conversion of the normalized difference (ND) values into spectral reflectance. The reflectance of UAV at the same physical position as the LNC sample point was extracted. Before extraction, the soils that can be seen with the naked eye were excluded via unsupervised classification, leaving just the vegetation for further investigation (Figure 2).
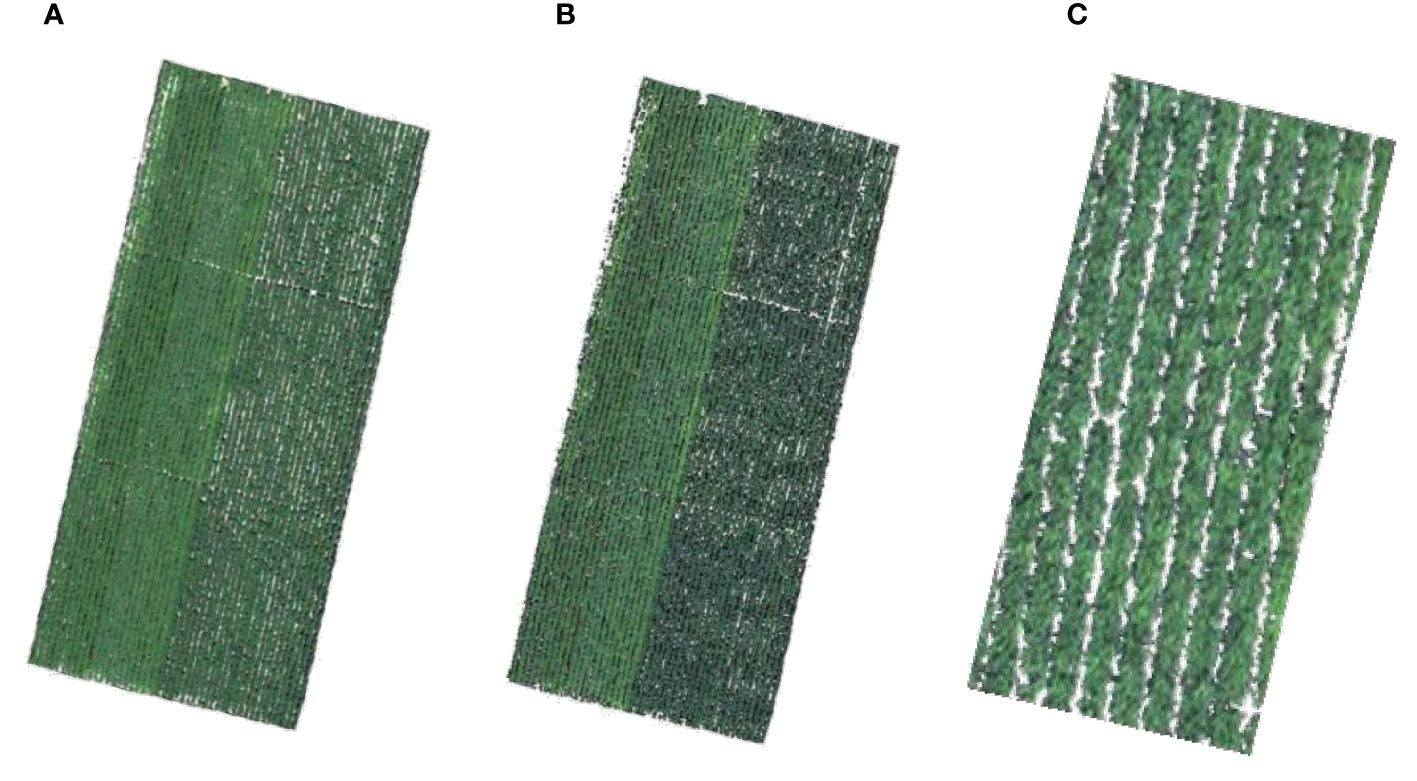
Figure 2. (A) Red–green–blue (RGB) map of cotton in the experiment area. (B) True color map after removing the soil visible to the naked eye, with white displaying the soil and the background and green representing the cotton. (C) Enlargement of the cotton in (B).
2.3.2 Classification method of the image pixels
As the image is susceptible to shadow interference (Figure 3), in this study, green light was extracted for image pixel classification. Refer to Figure 4 for the classification process. Focusing on the green light value, all image pixels were classified into 10 categories.

Figure 3. Non-shaded leaf and shaded leaf.
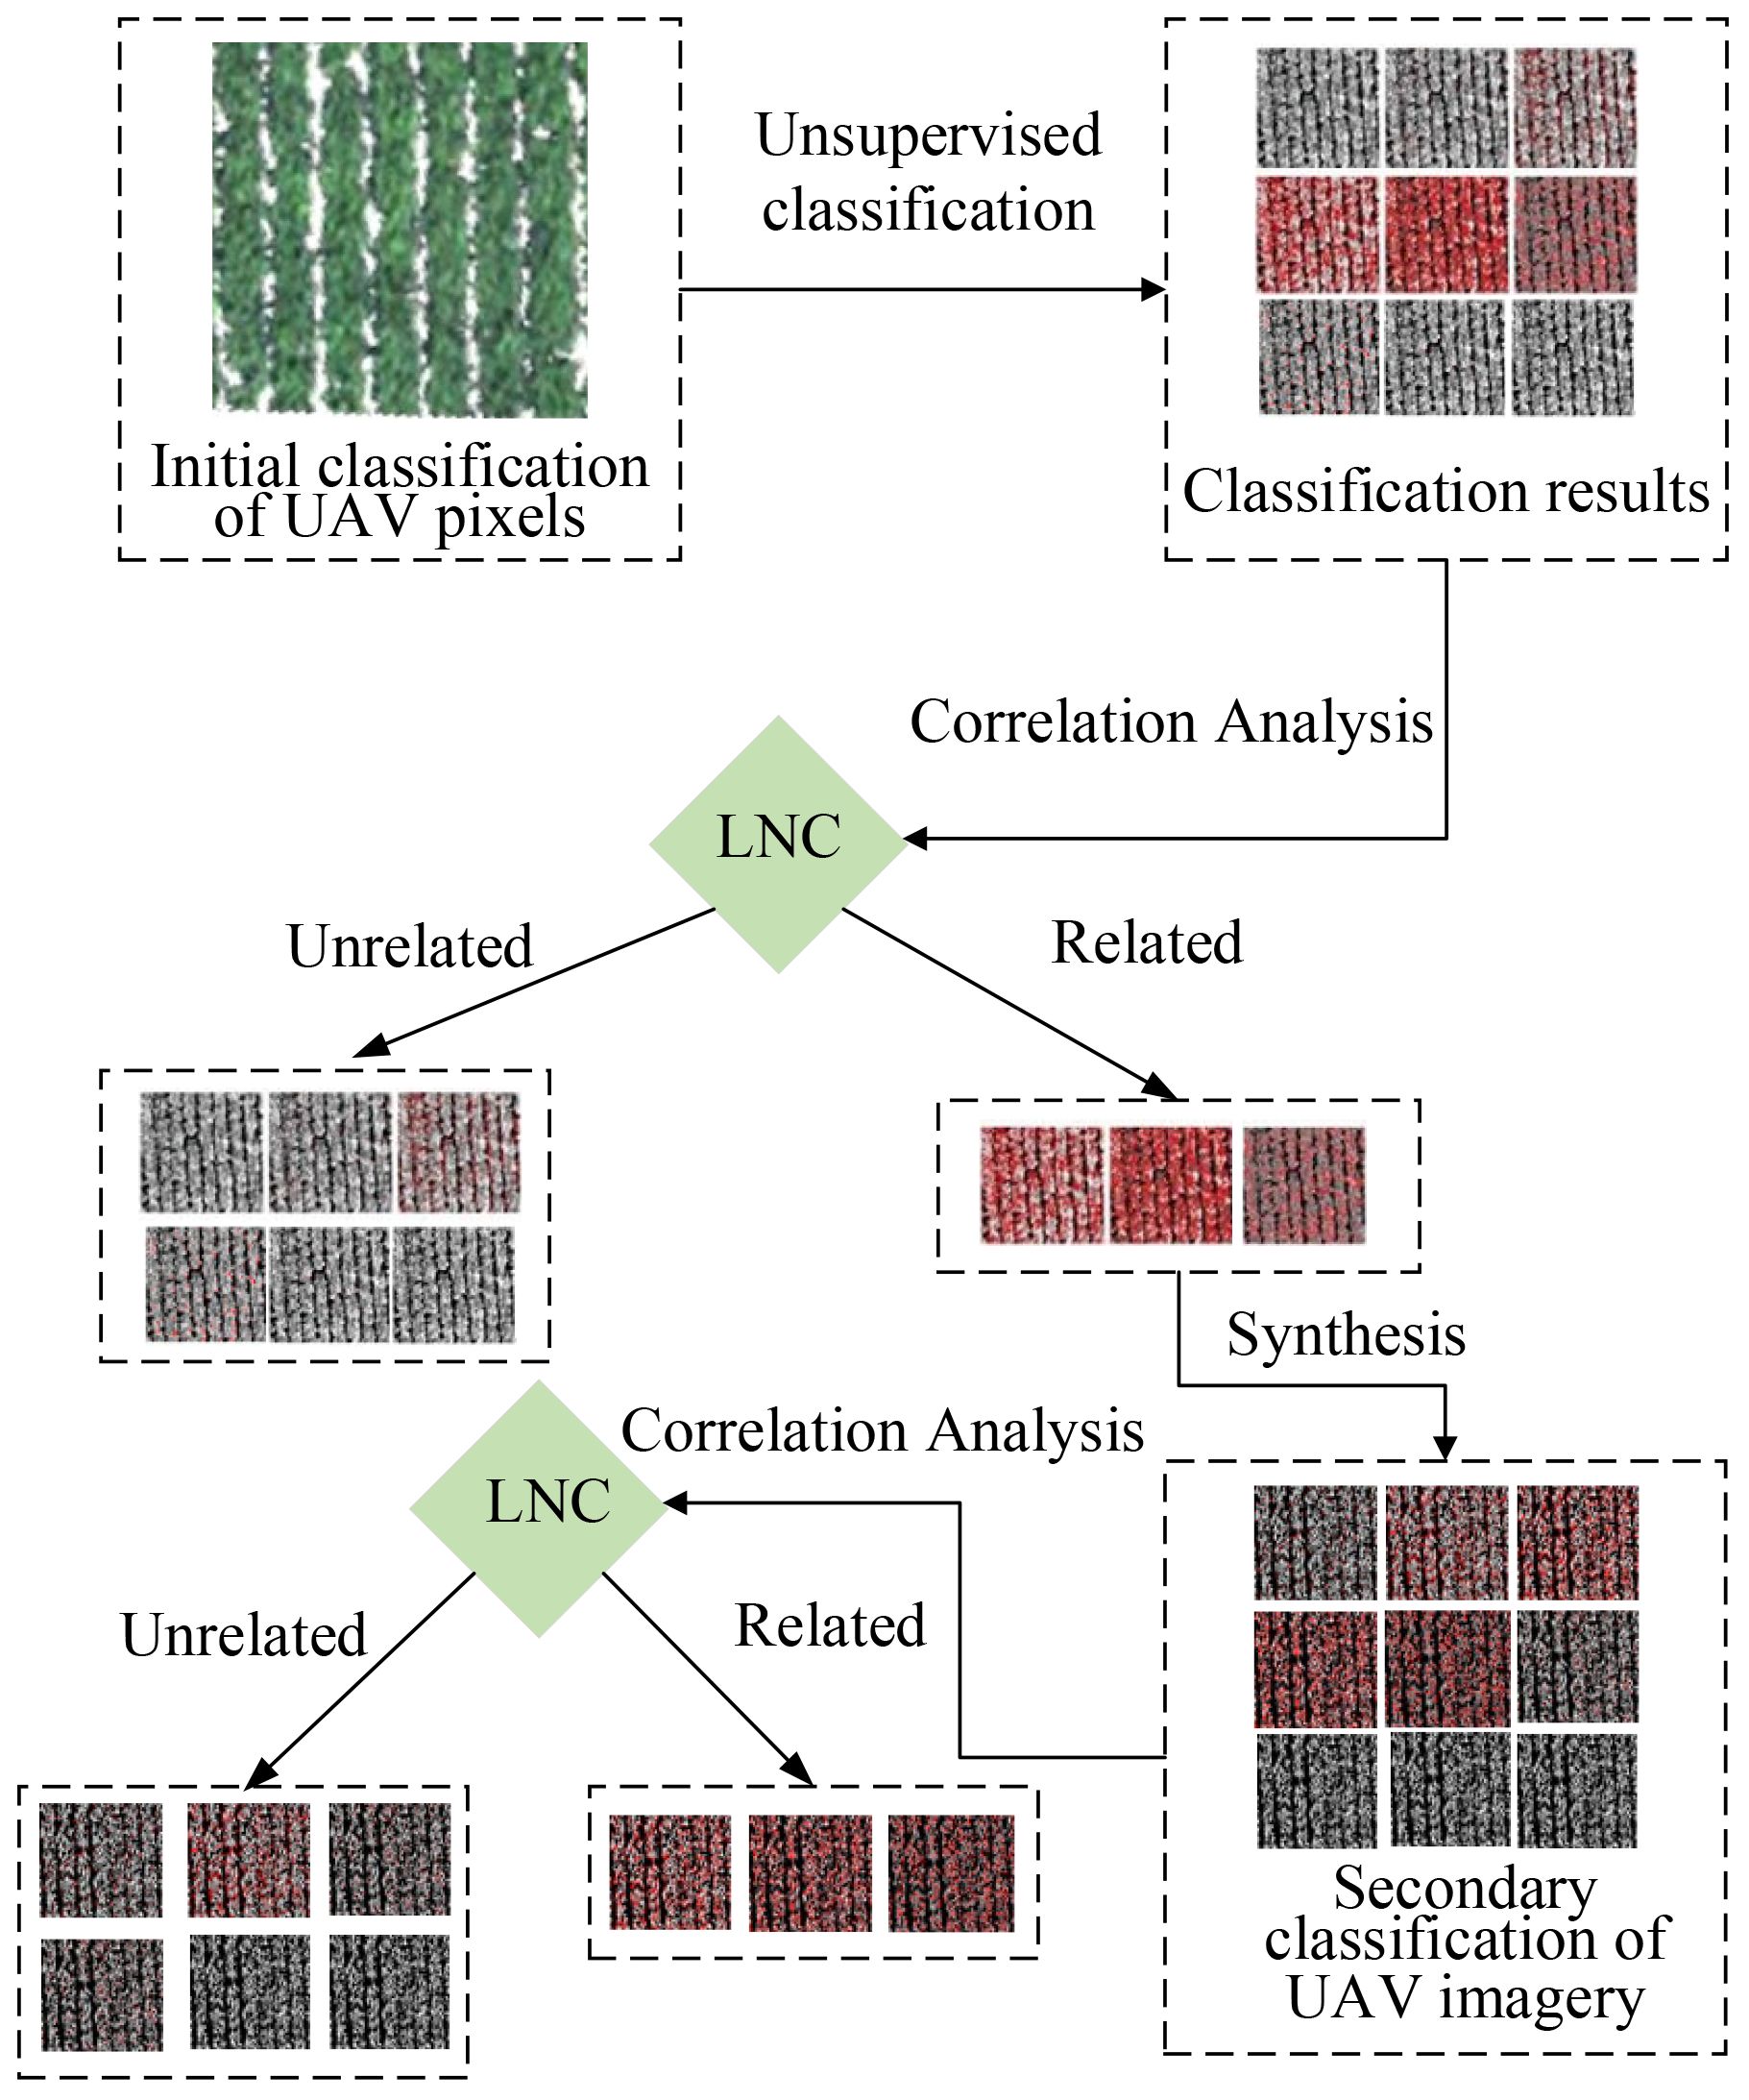
Figure 4. Classification flowchart.
In this study, two classifications were performed, and the 10 categories for the first classification were labeled as follows: 1-0, 1-1, 1-2, 1-3, 1-4, 1-5, 1-6, 1-7, 1-8, and 1-9. After determining that 1-4, 1-5, and 1-6 adequately represented the cotton canopy, a second classification was performed in conjunction with 1-4 and 1-5, which were labeled as 2-0, 2-1, 2-2, 2-3, 2-4, 2-5, 2-6, 2-7, 2-8, and 2-9. Following classification, the extracted hyperspectral reflectance corresponding to each group was used to generate the VI. The results are listed in Table 2. In this investigation, 20 spectral indices with the highest association with N were chosen from the available literature for content analysis and model development. Refer to Table 2 for the index results.
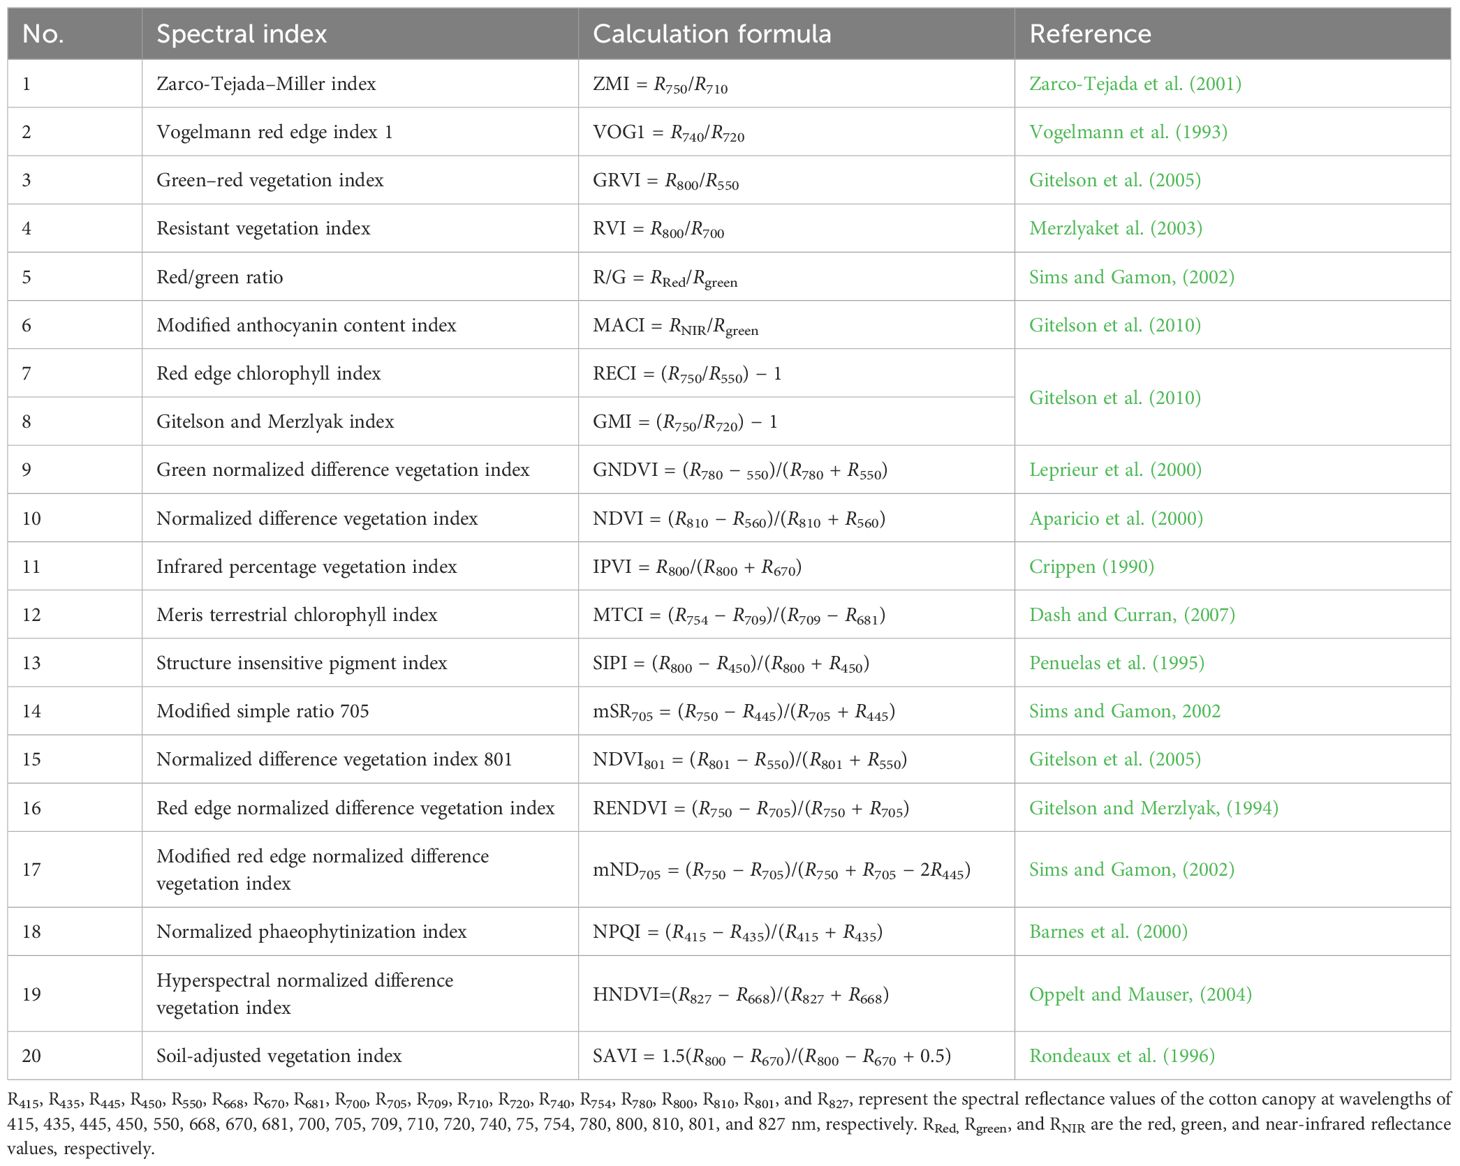
Table 2. Vegetation indices used in this study.
2.3.3 Extraction of spectral reflectance
The region of interest (ROI) was divided on the corresponding position of the UAV image, and the average spectral information of ROI was used as the spectral value of this sampling point. There were two types of ROI. The first ROI was for acquiring 900 (30 × 30) pixels around the sampling point, which was 0.9 m × 0.9 m and covered an entire row of cotton. Supplementary Figure 3 shows a schematic representation. The second ROI was for obtaining the mean values of all spectra within 900 pixels at each sampling point after identification of the image pixels.
2.3.4 Spectral pre-processing
In order to minimize the influence of noise and soil on the collected spectra, three pretreatments were applied to the original spectrum (OS) reflectance. The OS was without pre-processing.
Gaussian filter (GF) is a linear smoothing filter used to remove Gaussian noise in image processing. Application of a GF to UAV spectral reflectance generates the appropriate VI for modeling. Savitzky and Golay invented SG smoothing, also called convolutional smoothing. The signal form and width are preserved while the noise is removed. After SG smoothing of the UAV spectral reflectance, the appropriate VI is produced for modeling. Gaussian and SG (GF&SG) means that the Gaussian-processed spectrum was further smoothed with SG.
2.3.5 Methods for predicting LNC
Based on the Pearson’s coefficient of correlation approach to define the VI substantially correlated with the nitrogen content as the independent variable of the model, partial least squares regression (PLSR), MLR, principal component regression (PCR), and support vector machine regression (SVMR) were used to develop cotton nitrogen content estimation models. R2, the root mean square error (RMSE), and the mean absolute error (MAE) were used to evaluate the performance of the model (Yin et al., 2022).
3 Results
3.1 De-interference effect of spectral pretreatment
In this paper, reflectance was obtained from the UAV hyperspectral images and pre-processed using GF, SG, and GF&SG. After pre-processing of the spectra, the indices were calculated and compared (Figure 5). The results revealed that all 20 VIs demonstrated significant correlations with the cotton LNC. The correlation coefficients between the pretreated spectral indices calculated using GF, SG, and GF&SG and the LNC of cotton were successively increased. There were seven indices with correlation coefficients above 0.4 between the OS and the cotton LNC: the green–red vegetation index (GRVI), the resistant vegetation index (RVI), the modified anthocyanin content index (MACI), the NDVI (780, 550) (810, 660), the green normalized difference vegetation index (GNDVI), and the modified red edge normalized difference vegetation index (mND705), with correlation coefficients of −0.44**, −0.43**, −0.41**, −0.41**, −0.44**, and −0.43**, respectively. The correlation coefficients of these seven indices with the cotton LNC were improved by 0.02, 0.03, 0.02, 0.02, 0.02, 0.02, and 0.03, respectively, after GF pretreatment. After pretreatment with SG, these indices were improved by 0.04, 0.08, 0.04, 0.04, 0.04, 0.04, and 0.07, respectively. After pretreatment with GF&SG, the correlation coefficients improved by 0.05, 0.09, 0.04, 0.04, 0.04, 0.05, and 0.08, respectively. Therefore, pretreatment with GF&SG significantly improved the association between VI and cotton LNC.
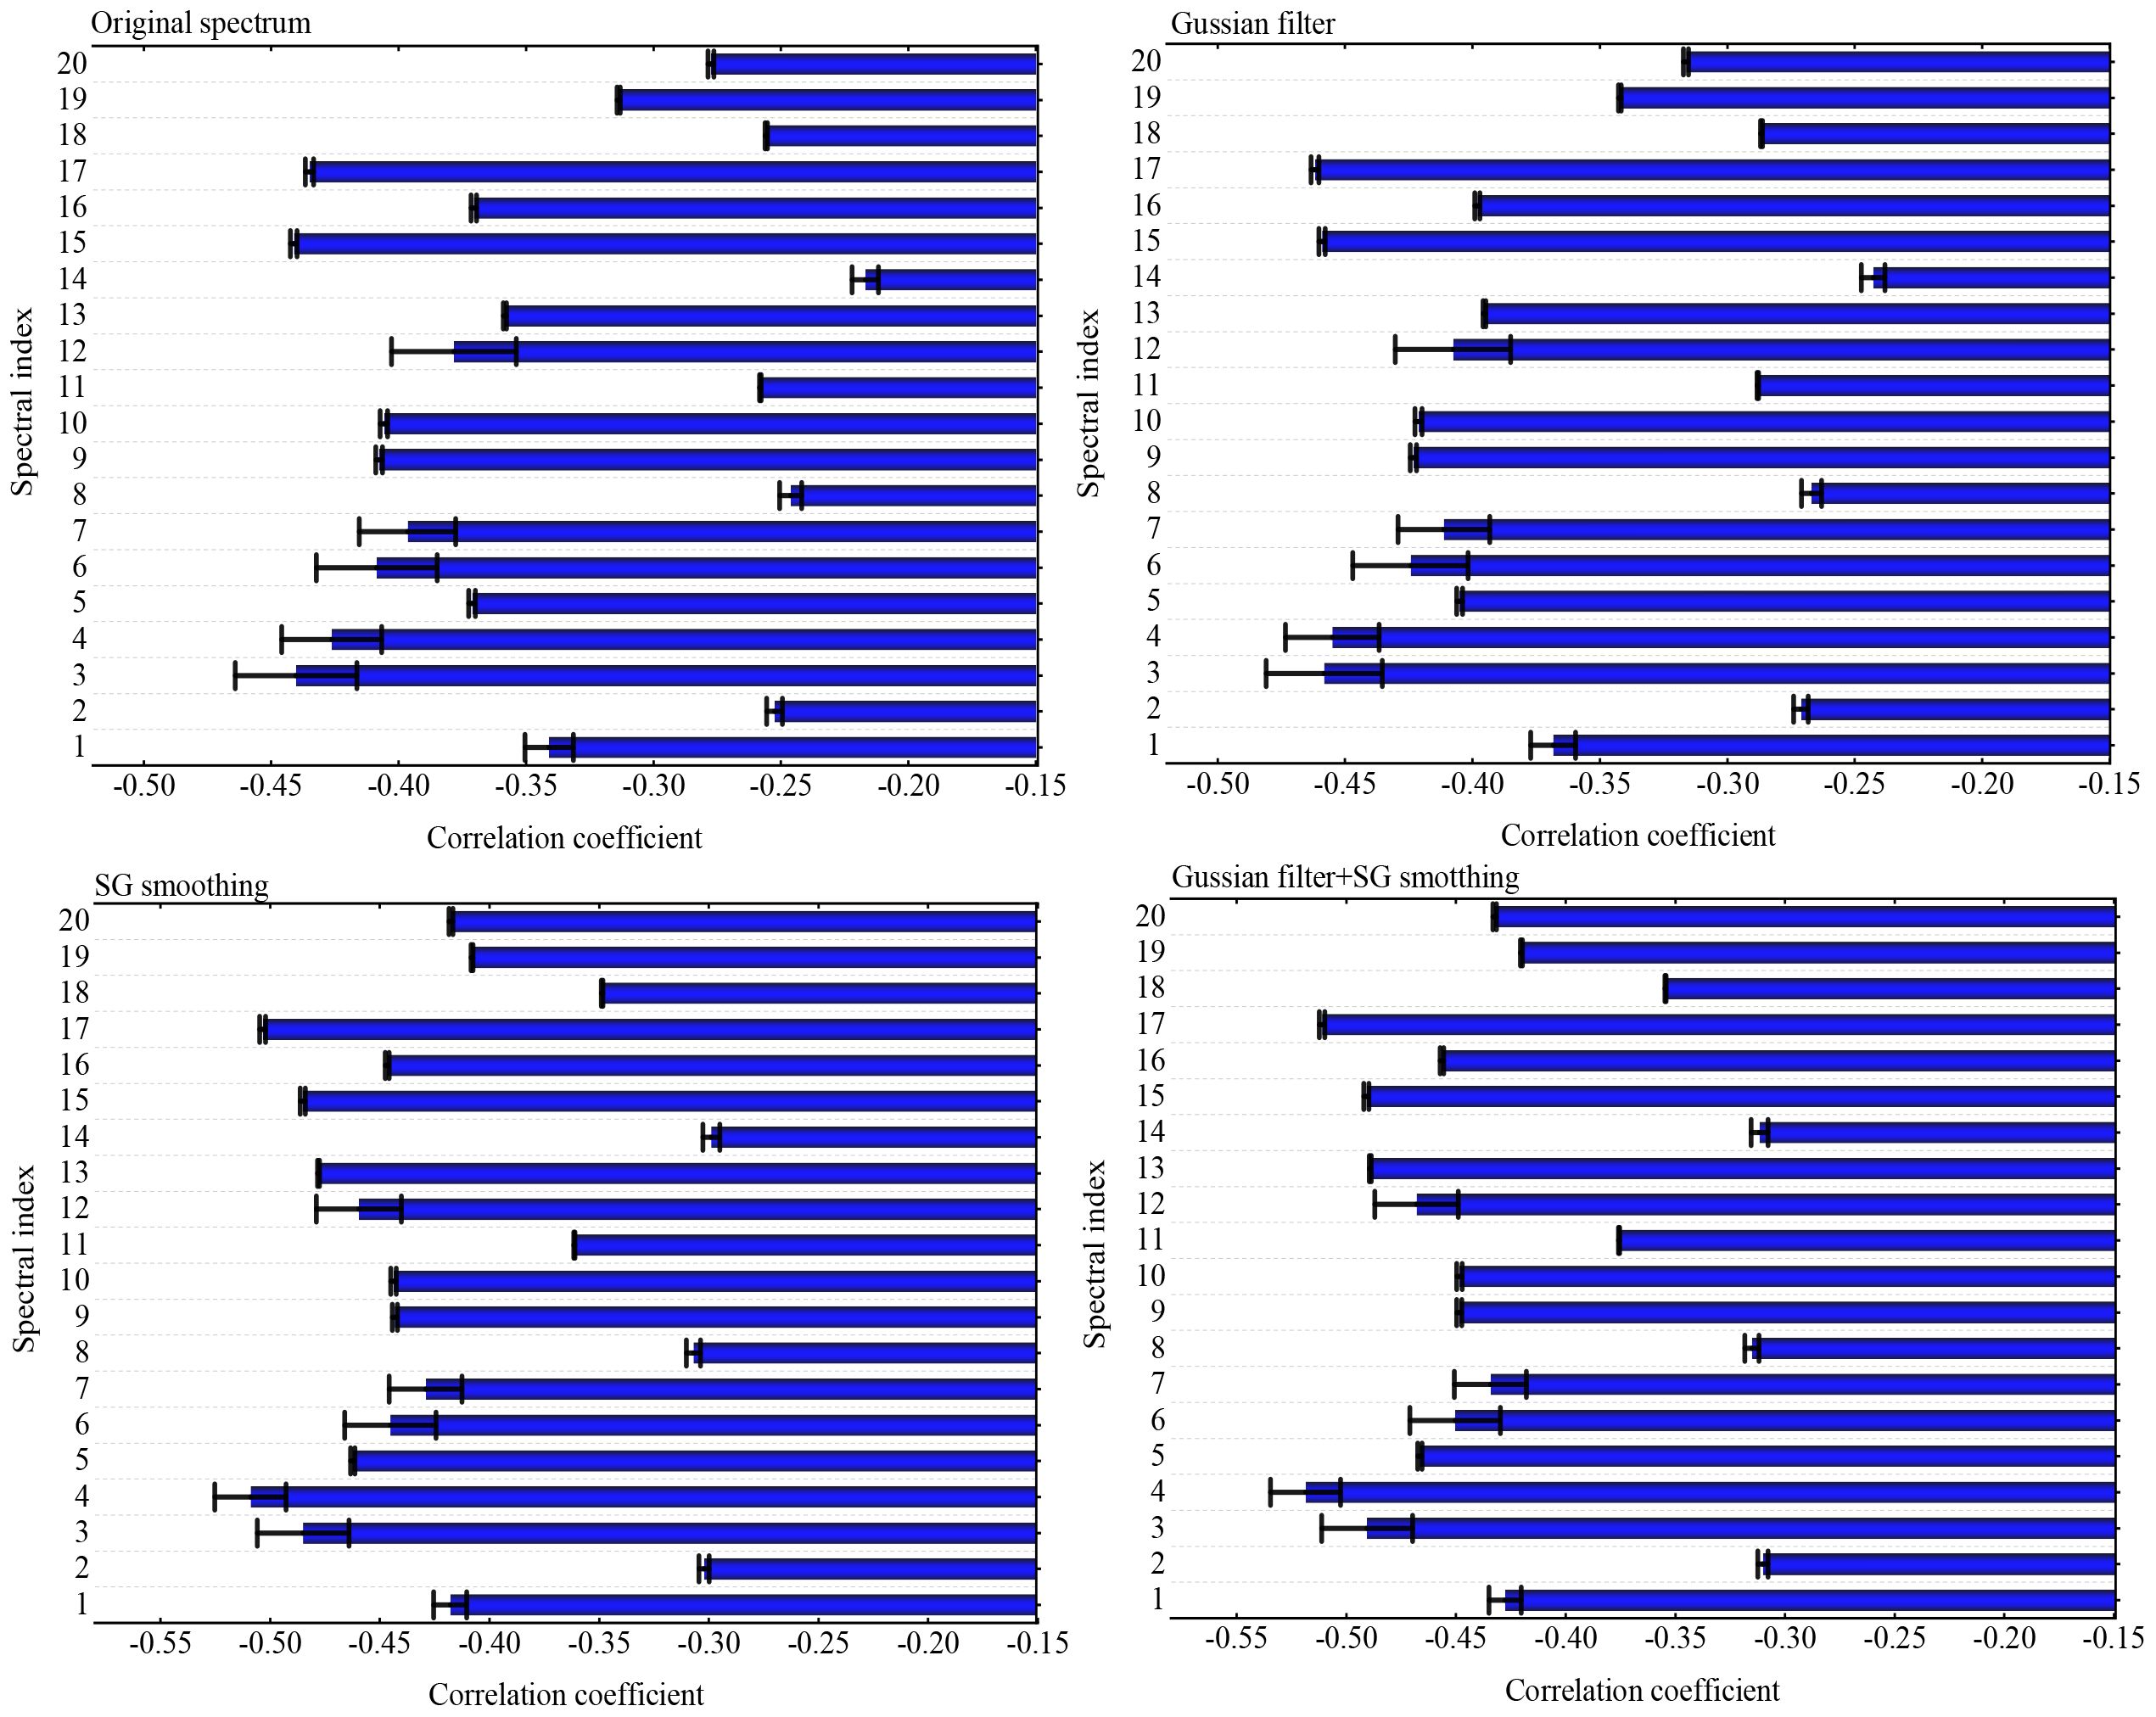
Figure 5. Correlation coefficients between the leaf nitrogen content (LNC) and the vegetation index (VI) with pretreatments.
This study analyzed the changes in sample errors following pretreatment of 108 samples (Figure 6). A number of spectrum samples had higher standard errors, including GRVI, RVI, MACI, the Gitelson and Merzlyak index (GMI), and the Meris terrestrial chlorophyll index (MTCI), which reached roughly 0.02, whereas the other indices had less change before and after pretreatment. These five indices with substantial standard error variations are susceptible to environmental conditions such as soil, while the others are not. After several pretreatments, the standard errors were dramatically reduced, indicating that pretreatment can eliminate the effect of soil on the index.
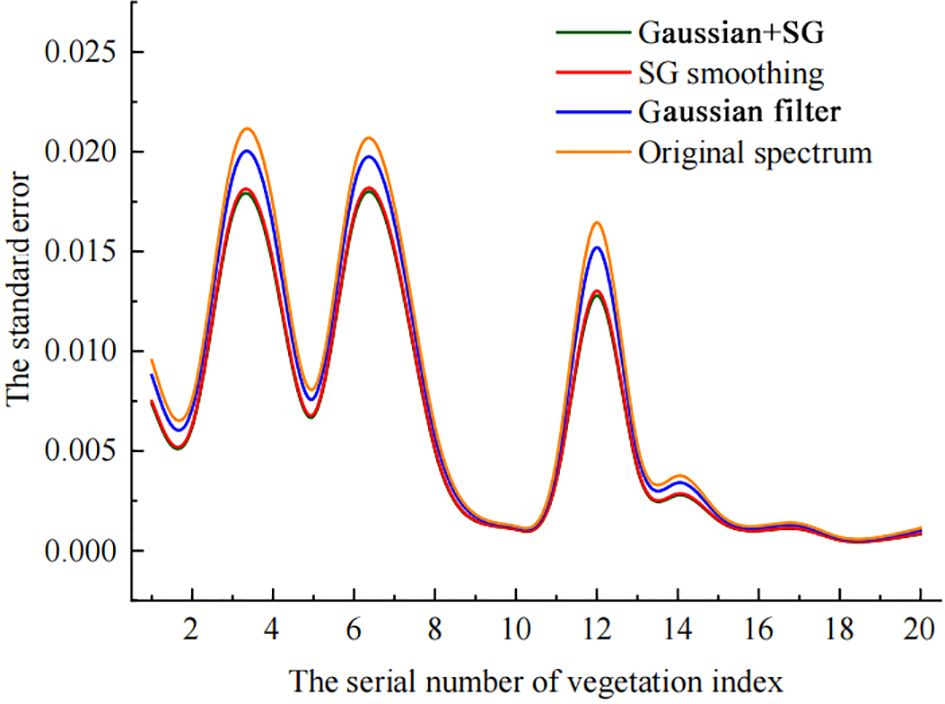
Figure 6. Standard errors of the vegetation indices with pretreatments.
Table 3 displays the results of the significance tests of the derived indices for the OS and after three pretreatments. After pretreatment, the VIs were significantly different from the OS. No substantial difference exists between the indices for GF and SG, indicating that they have similar functions. The indices computed after GF&SG were significantly different from those calculated with the single treatment, indicating that the overlap of the GF&SG can significantly increase the single pretreatment effect in reducing the interference of soil.
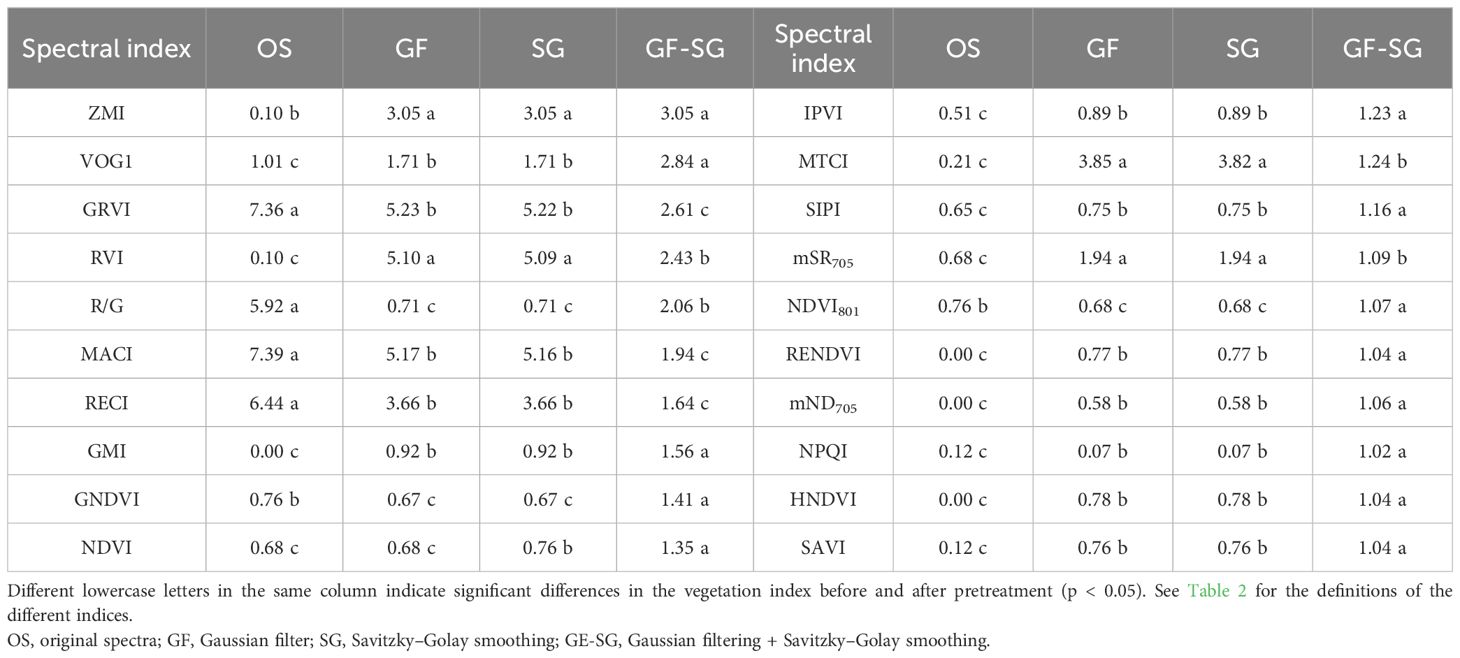
Table 3. Significance test of the vegetation indices before and after pretreatment.
3.2 Pixel classification
The results of the classification of the image pixels into cotton and others are displayed in Table 4. Cotton comprised a total of 1,273,202 image pixels, or 65.74% of the total image pixels.
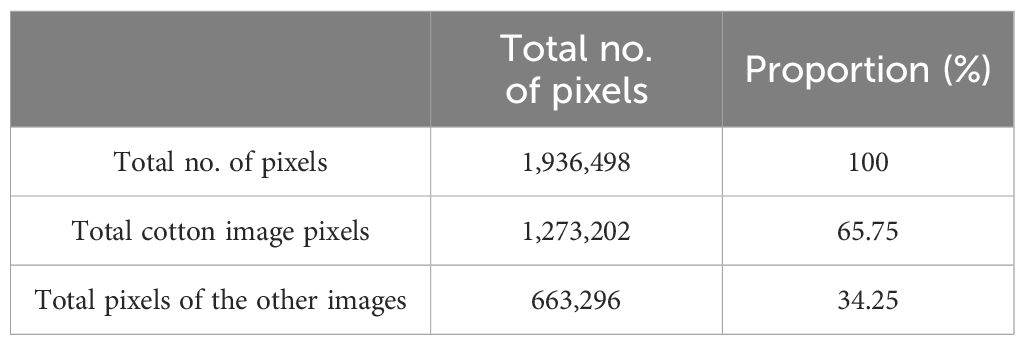
Table 4. Statistics on image pixel information.
Consequently, this study focused on green light and separated it into 10 classes proportional to its intensity. The spectral reflectance corresponding to each class was then determined and labeled as 1-0, 1-1, 1-2, 1-3, 1-4, 1-5, 1-6, 1-7, 1-8, and 1-9 (Figure 7). Viewed in conjunction with the classification results in Figure 7, among them, the result for 1-0 was the same as that for 1-1 and, considering the layout, was not included in the figure. It was apparent that 1-4, 1-5, and 1-6 were all at the edge position of the cotton and soil and that the soil can be effectively reduced. Moreover, 1-1, 1-7, 1-8, and 1-9 indicate that the image pixels accounted for very little information and that almost none was expressed.
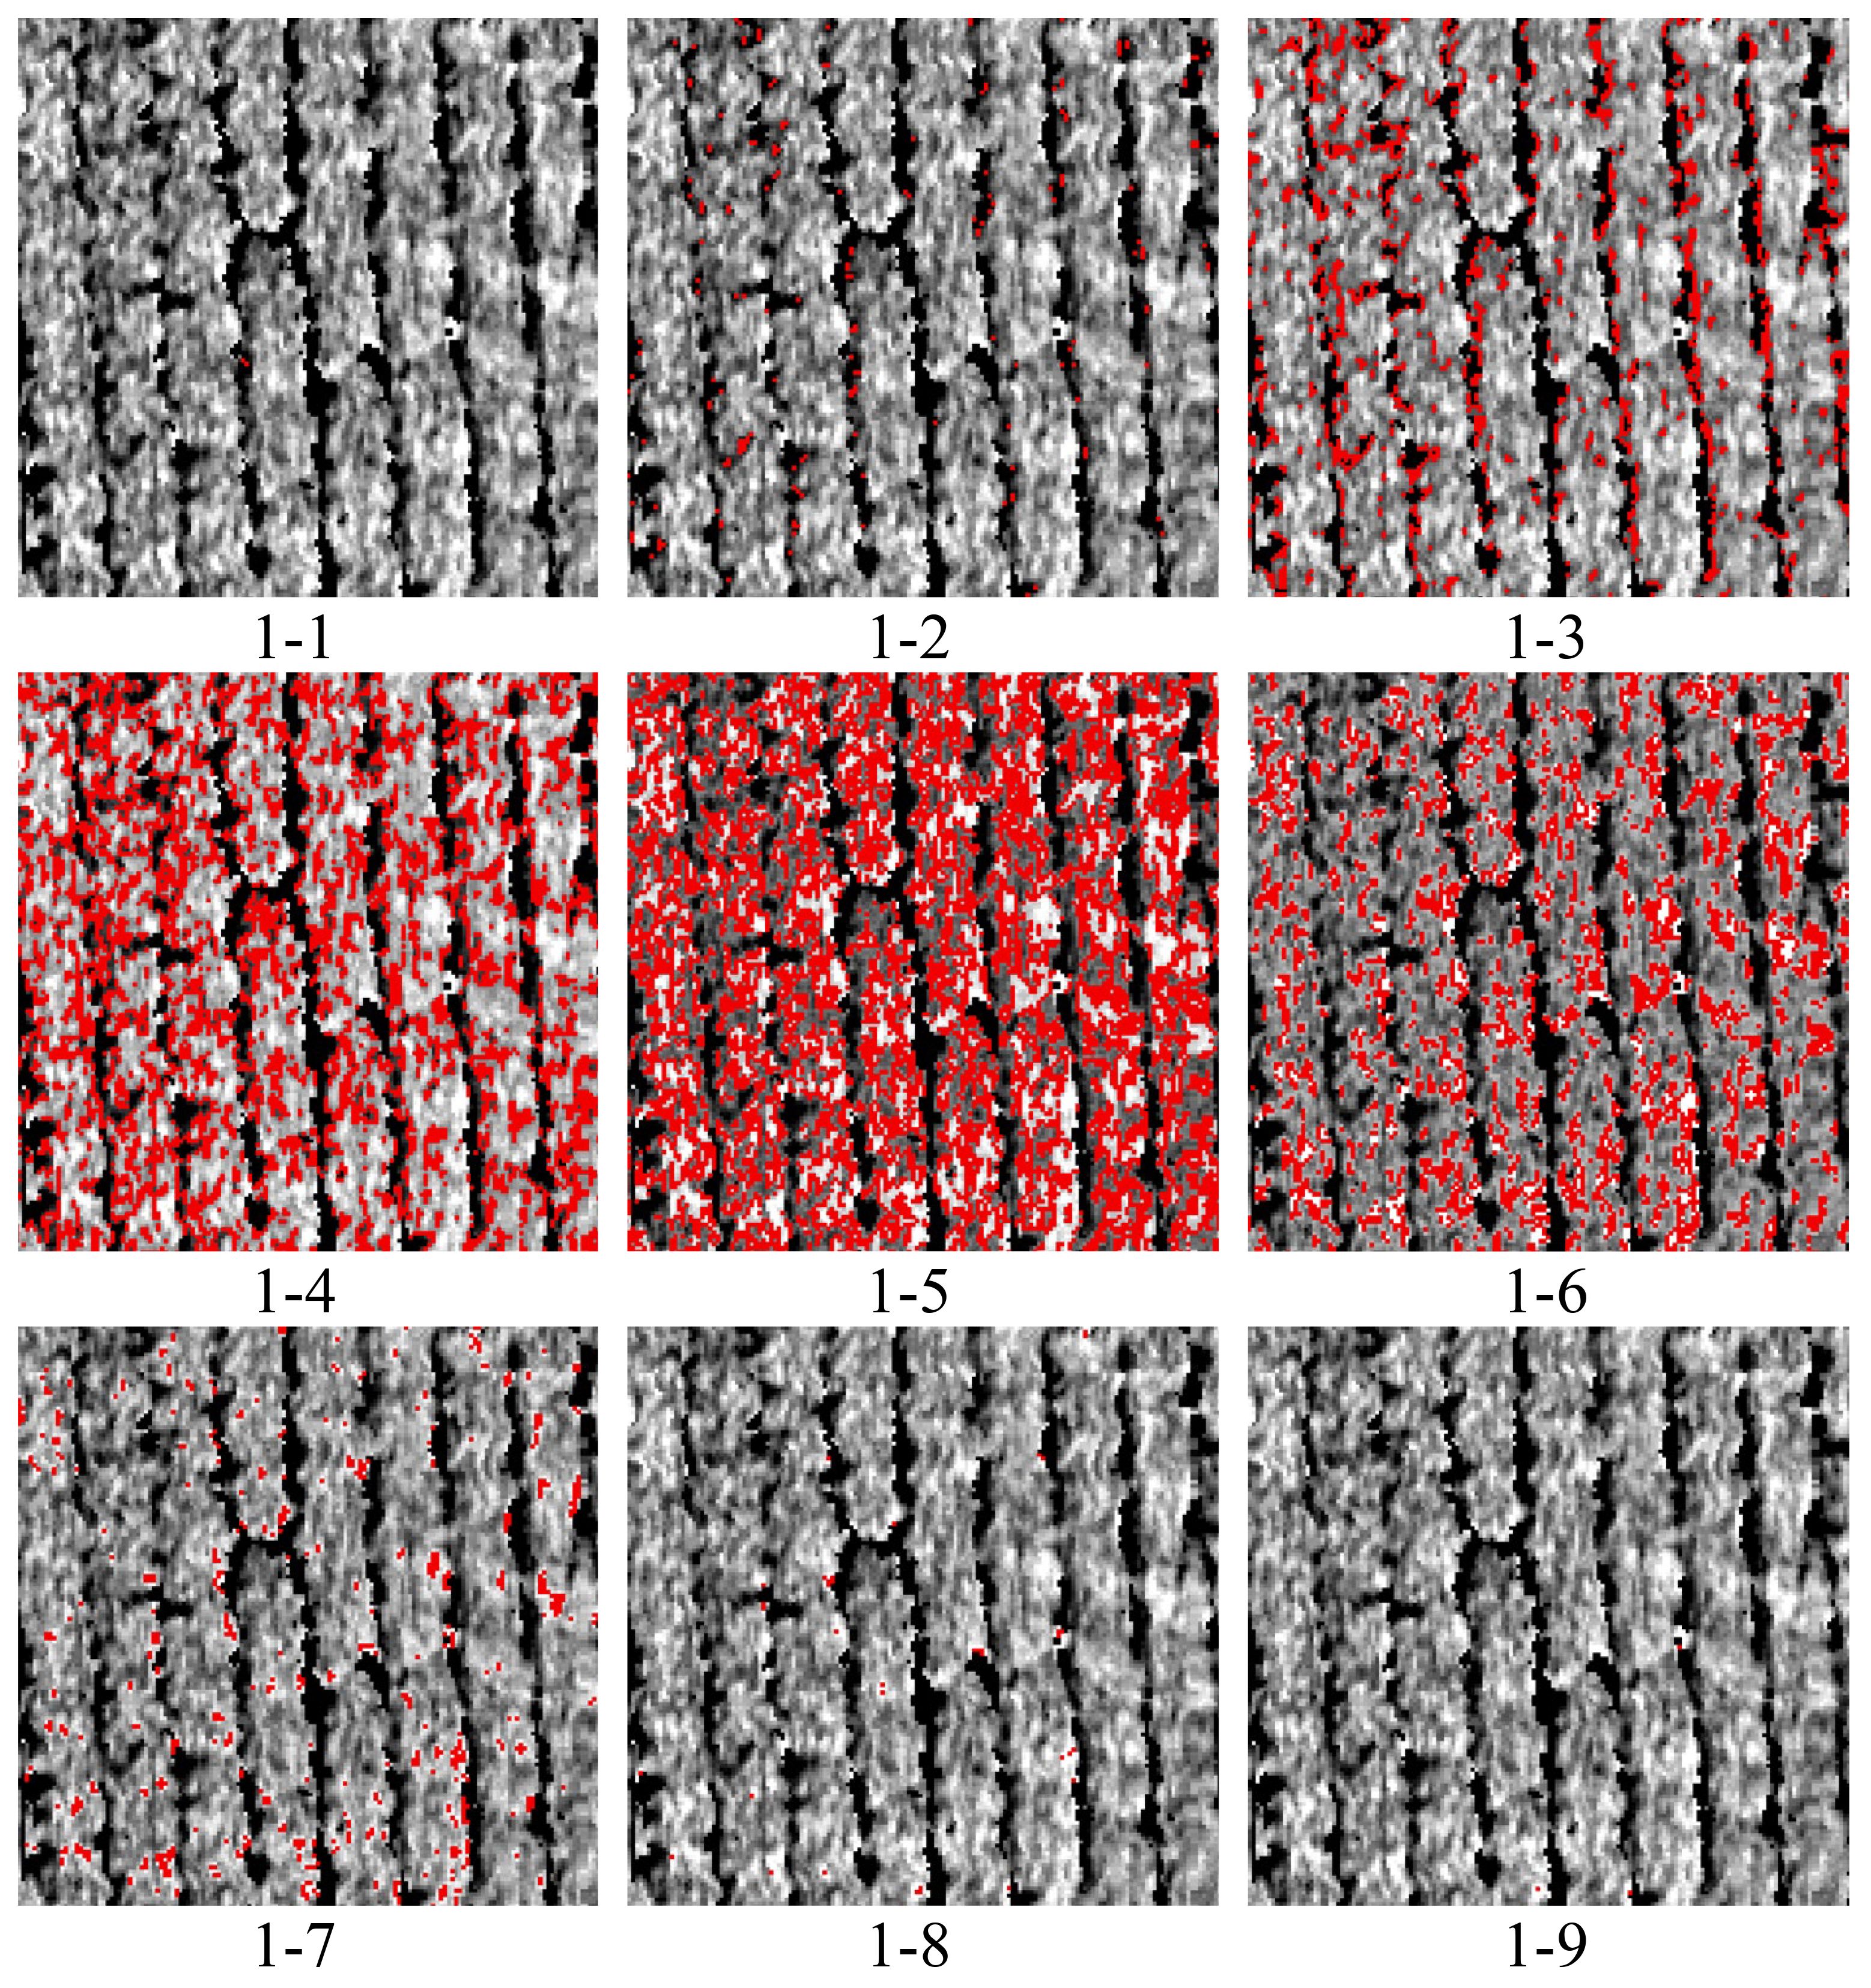
Figure 7. Classification results.
As a result, after classification, the spectral indices of 1-4, 1-5, and 1-6 were obtained for this investigation. The results revealed that the index values corresponding to each class after classification differed significantly. The correlation coefficients were calculated for each category of VIs. Figure 8 shows that the indices were highly correlated with each other. In general, the normalized phaeophytinization index (NPQI) of 1-4 and 1-6 had low correlation coefficients with the other indices. None of them exceeded 0.4, while the maximum correlation coefficient between the NPQI of 1-5 and the other indices was close to 0.6. This is because NPQI is a normalized index with two bands, 415 and 435 nm, while all other indices had reflectance in the near-infrared region (NIR) [at around 780 nm, except for the red/green ratio (R/G)]. The correlation coefficients among the other indices were consequently high. The correlation coefficients of R/G determined in 1-5 and 1-6 were similarly relatively negative with the other indices, as R/G is a ratio index derived from the reflectance of the red and green bands and therefore had a negative correlation with the other indices. Overall, the correlation coefficients between indices 1-4, 1-5, and 1-6 were high, but those among the individual indices were low. For instance, the correlation coefficients between the Zarco-Tejada–Miller index (ZMI) and Vogelmann red edge index 1 (VOG1) for 1-6 did not reach 0.4 with R/G, MACI, the red edge chlorophyll index (RECI), GNDVI, infrared percentage vegetation index (IPVI), structure insensitive pigment index (SIPI), NPQI, the hyperspectral normalized difference vegetation index (HNDVI), and the soil-adjusted vegetation index (SAVI), although the correlation coefficients of 1-4 and 1-5 all increased. This shows that the picture pixel classification method had a significant impact on the index.

Figure 8. Correlation analysis of the vegetation indices. SG, Savitzky–Golay smoothing.
The coefficients of correlation were computed between the VI and the cotton LNC (Figure 9). The results indicated that the ZMI, VOG1, RVI, GMI, MTCI, the modified simple ratio 705 (mSR705), the red edge normalized difference vegetation index (RENDVI), and the modified red edge normalized difference vegetation index (mND705) of 1-4, ZMI, GMI, MTCI, RENDVI, mND705, NPQI, HNDVI exhibited a significant relationship with the cotton LNC, whereas the GRVI, R/G, MACI, RECI, GNDVI, NDVI, IPVI, SIPI, and SAVI were not substantially correlated with the cotton nitrogen content. Therefore, 1-6 was excluded from this study, and 1-4 was paired with 1-5 (C4&5) for reclassification.
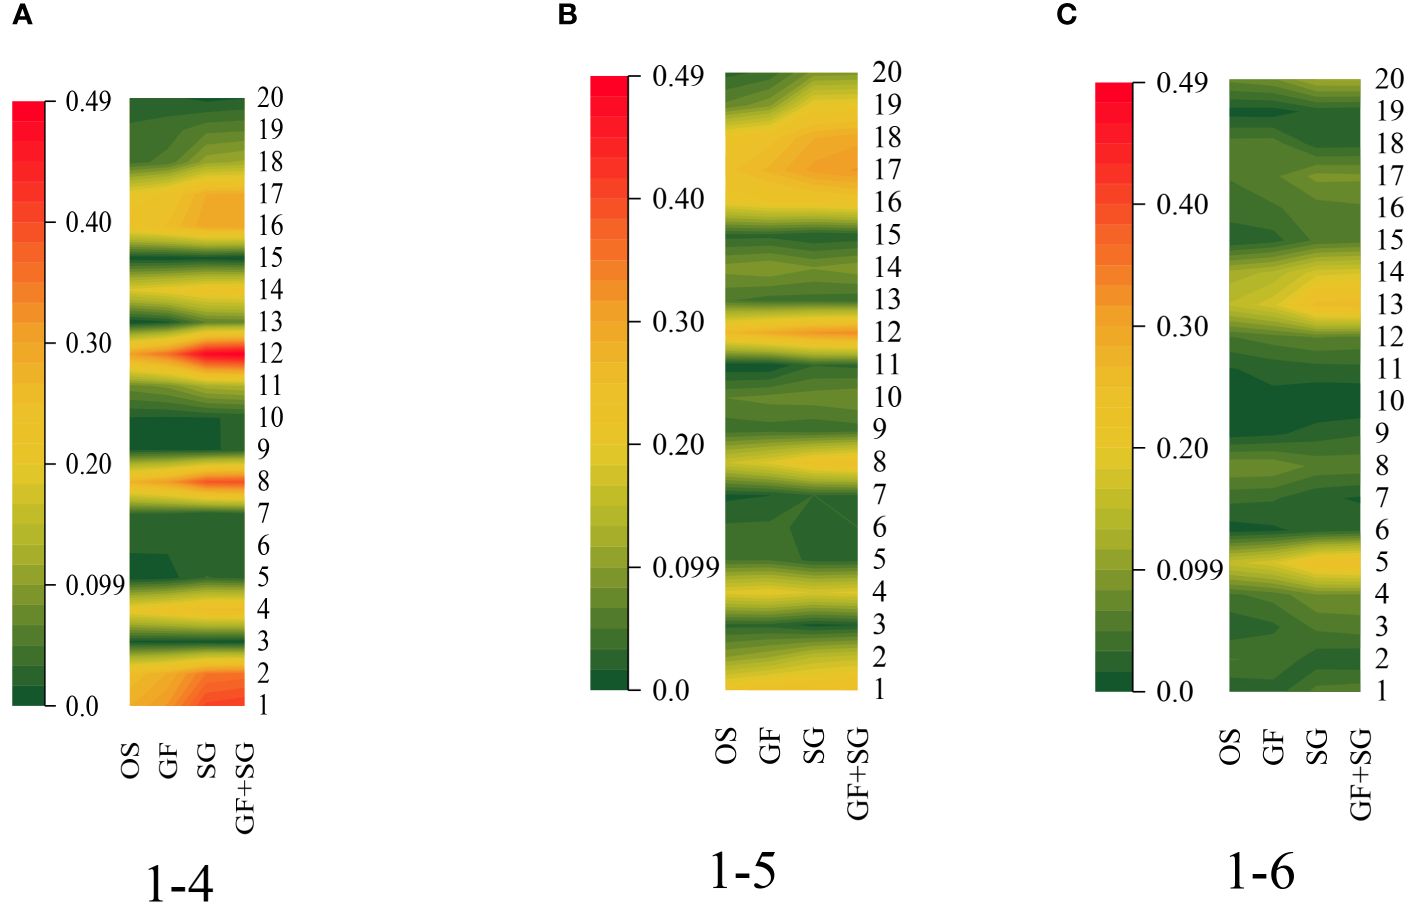
Figure 9. Relationship between the vegetation index (VI) and the leaf nitrogen content (LNC). (A) 1-4. (B) 1-5. (C) 1-6.
3.3 Quadratic classification of images
Observation of the second classification results (Figure 10) revealed that the result for 2-0 was the same as that for 2-1 and, considering the layout, was therefore not included in the figure. It was also found that 2-3 (category 4), 2-4 (category 5), and 2-5 (category 6) might have been more representative of cotton.
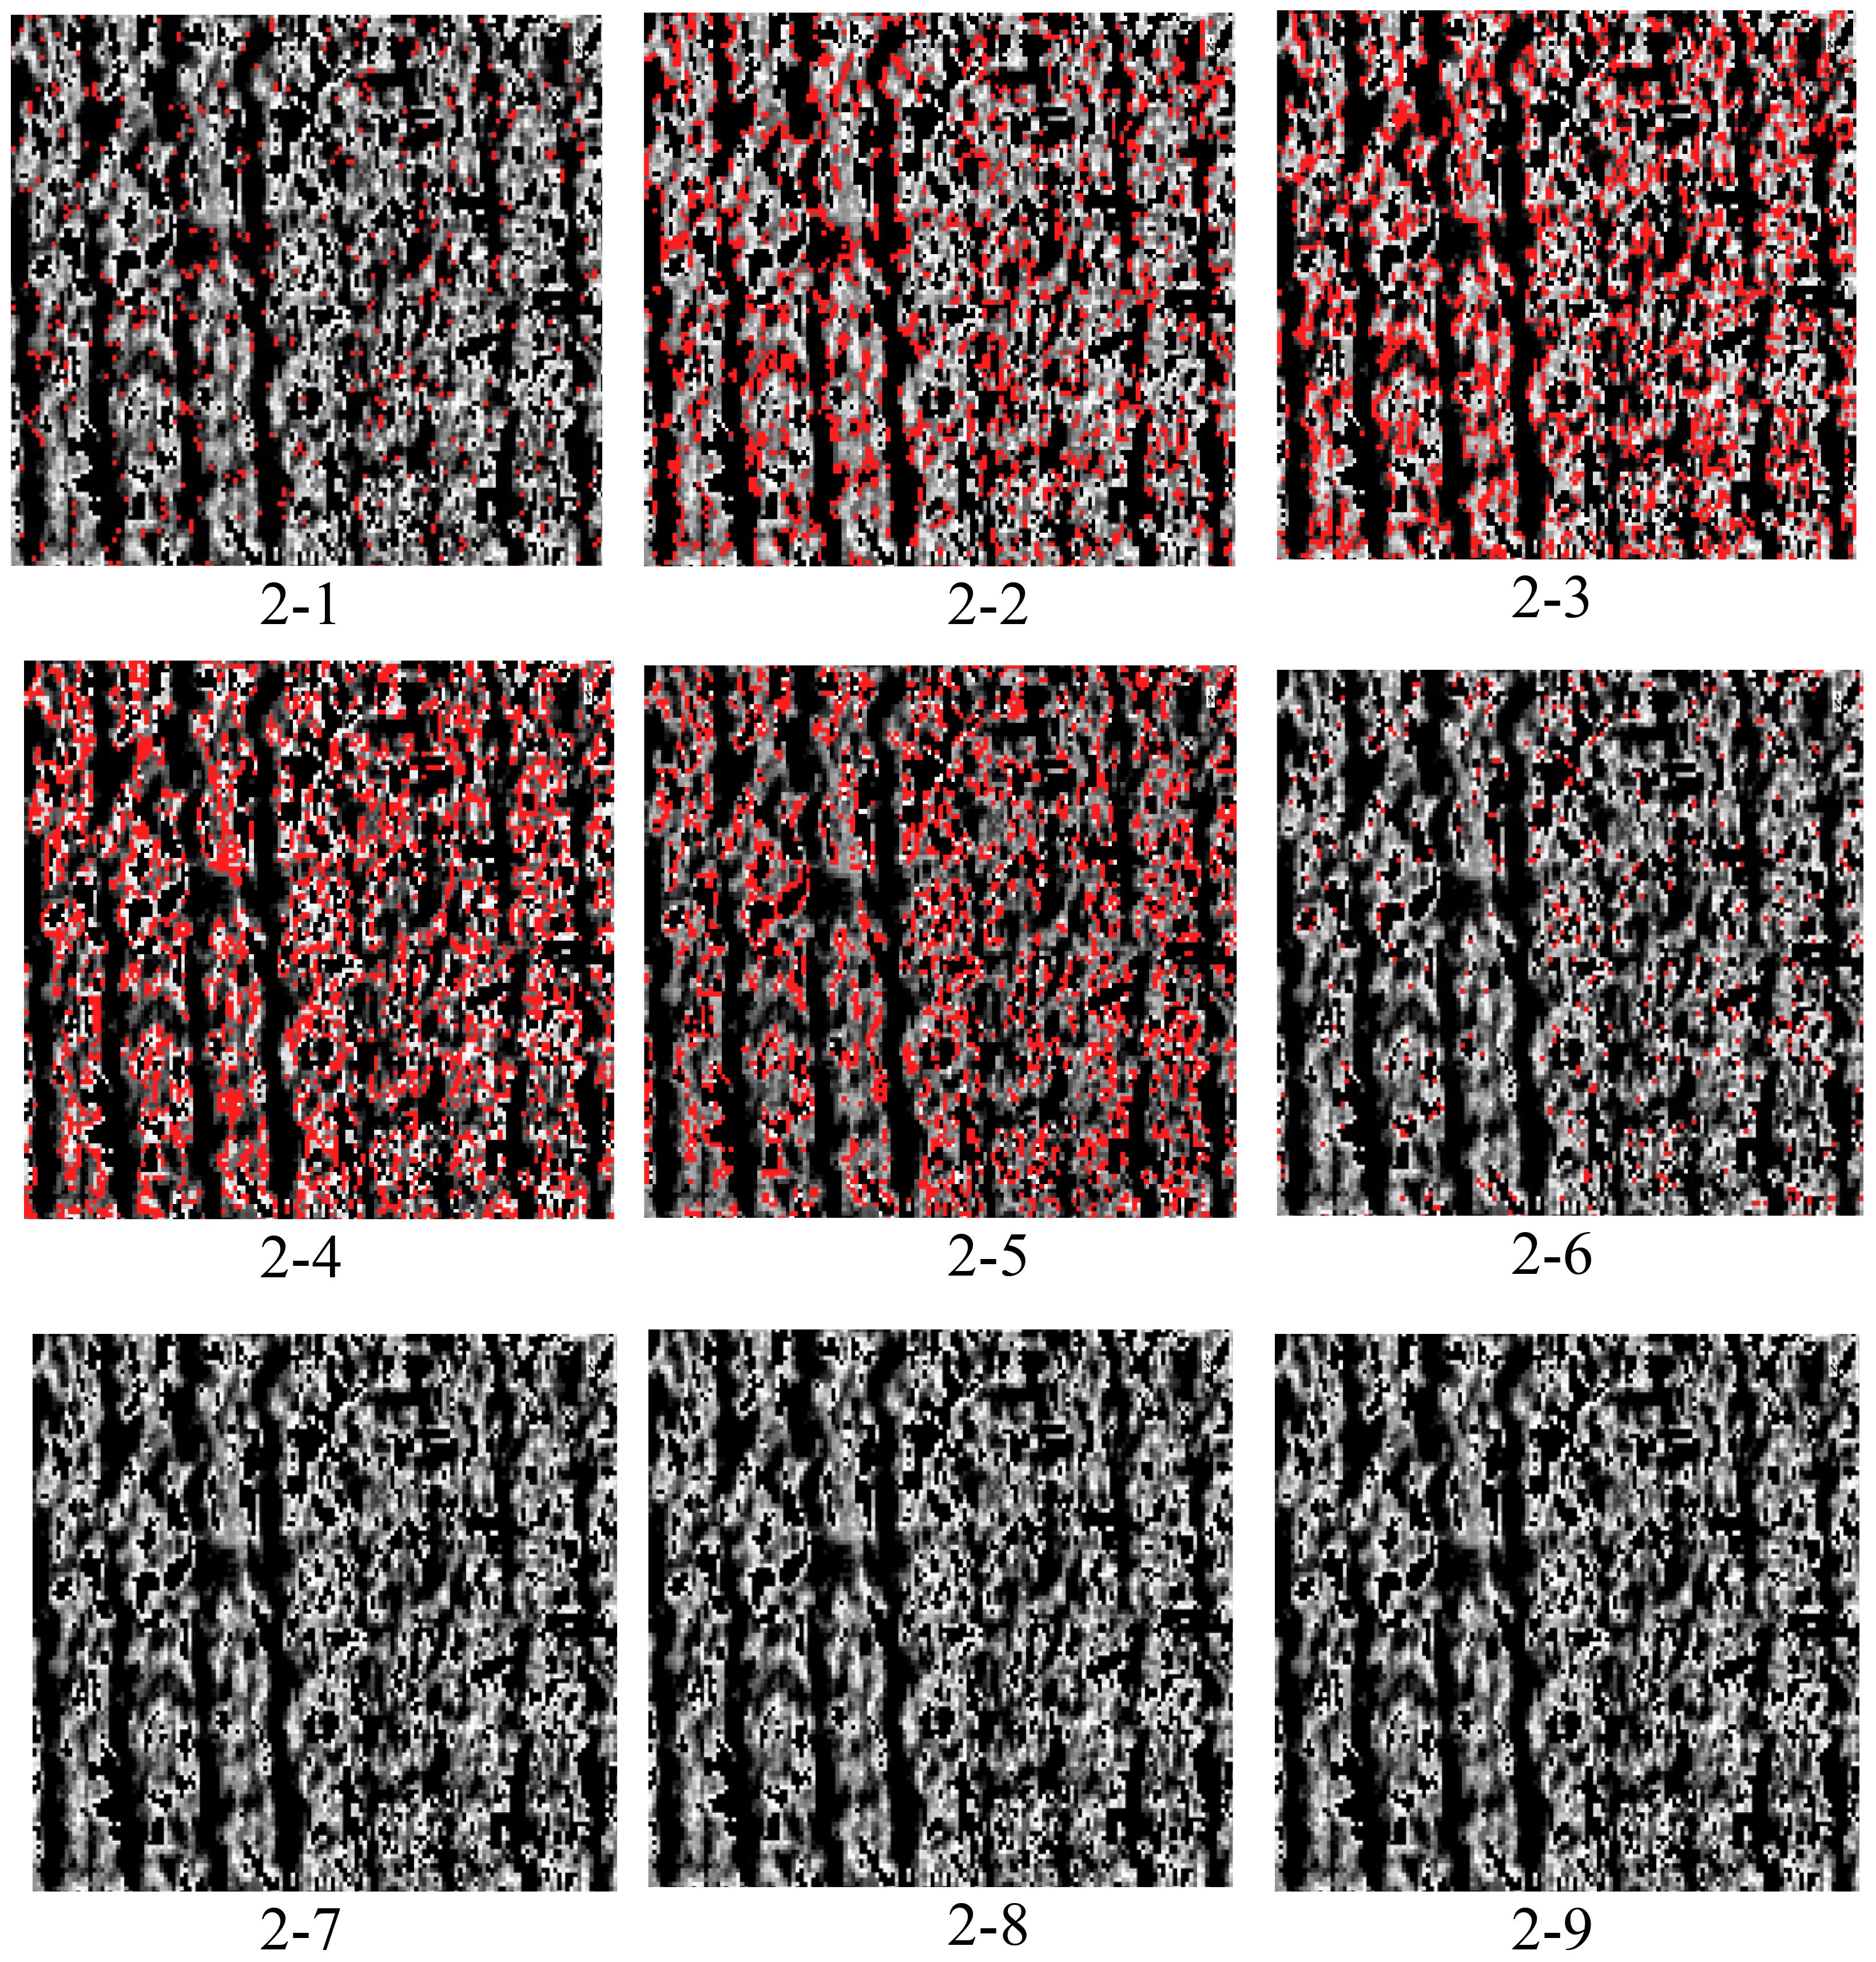
Figure 10. Reclassification results. For the classification outcomes for C4&5, the results are 2-3, 2-4, and 2-5. The correlation coefficients were calculated for each category of vegetation indices.
The correlation coefficients among the indices dropped since the initial categorization, as seen in Figure 11. Overall, the correlation coefficients between index 18 and index 5 and the other indices were modest and did not surpass 0.4, in general, for the same reason as that of the first categorization results. The other indicators showed strong relationships with each other, with the majority of the values being greater than 0.4. The correlation coefficients among a few particular individual indices were also lower; for instance, the correlation coefficients between MACI or RECI and mND705 did not exceed 0.6, and the correlation coefficients among the individual indices of 2-6 were lower than those of the other two categories. Table 5 displays the results of the significance tests conducted on the indices. It can be inferred that the indices calculated by the three classes showed substantial discrepancies; however, VOGI, SIPI, NPQI, and HNDVI did not, indicating that these indices were more stable and less susceptible to external influences. The rest of the indices exhibited substantial variance, indicating that they were less stable than the four aforementioned indices.
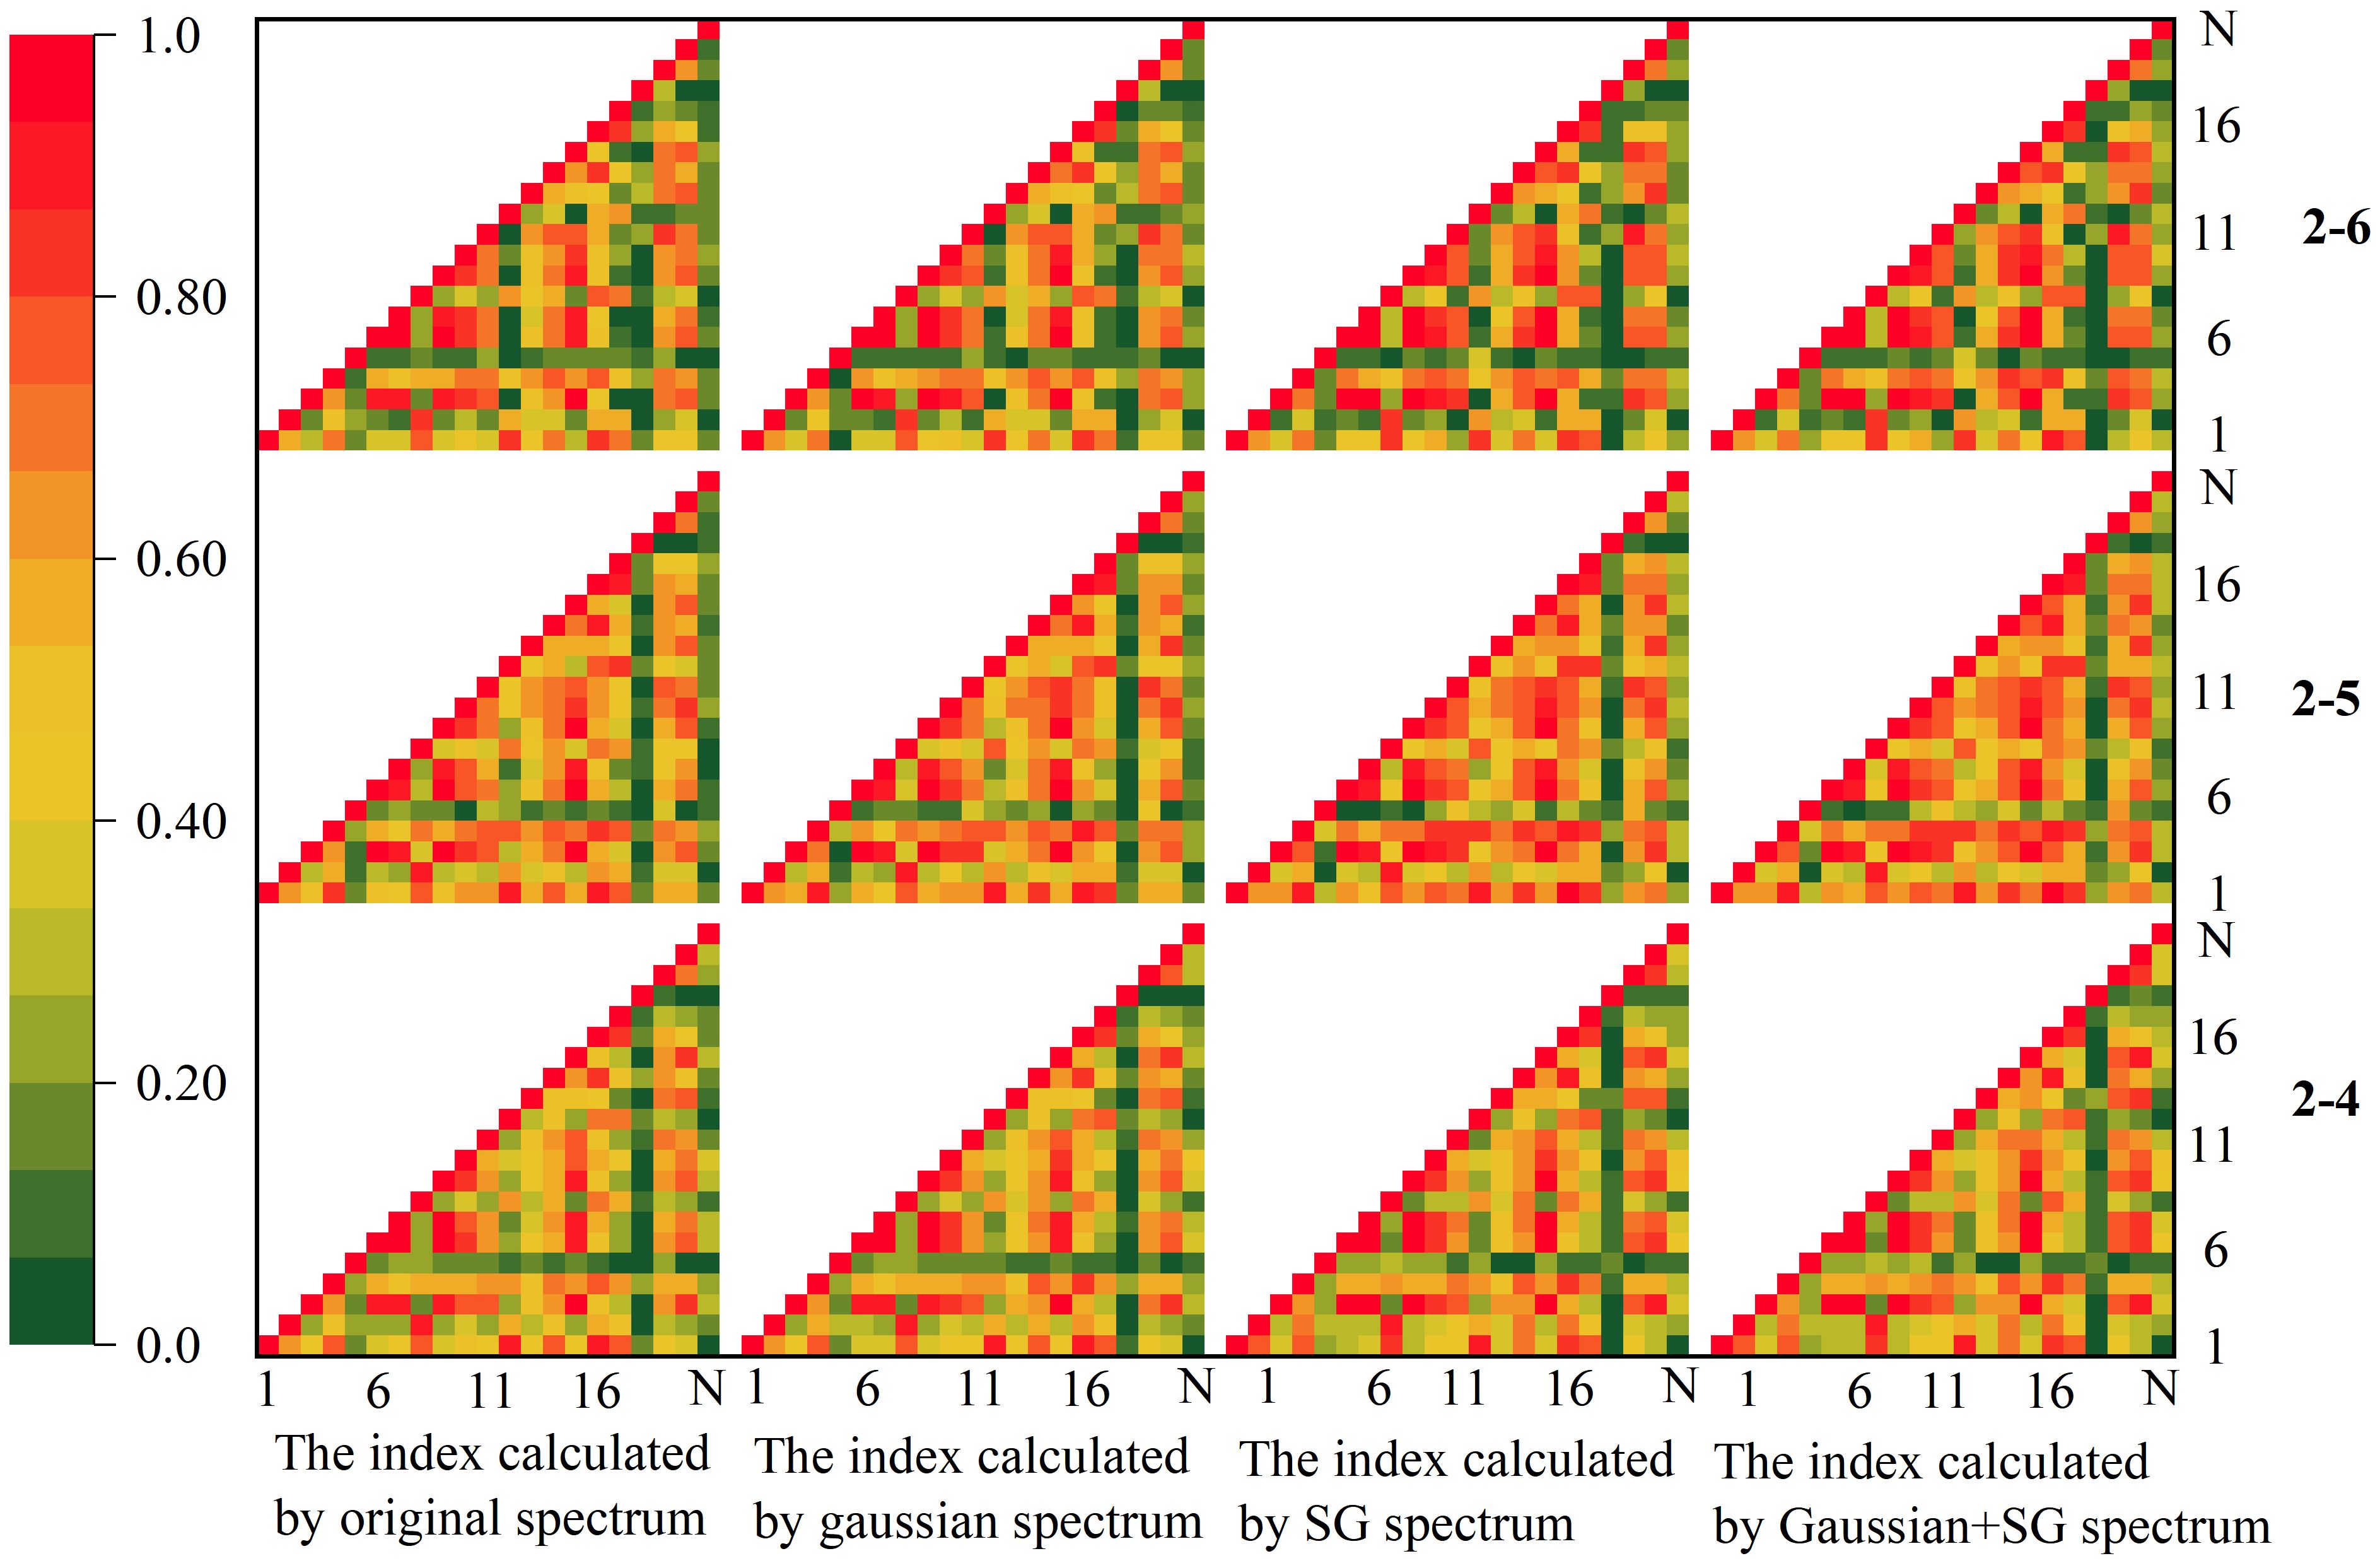
Figure 11. Correlation analysis on the vegetation indices classified as secondary. SG, Savitzky–Golay smoothing.
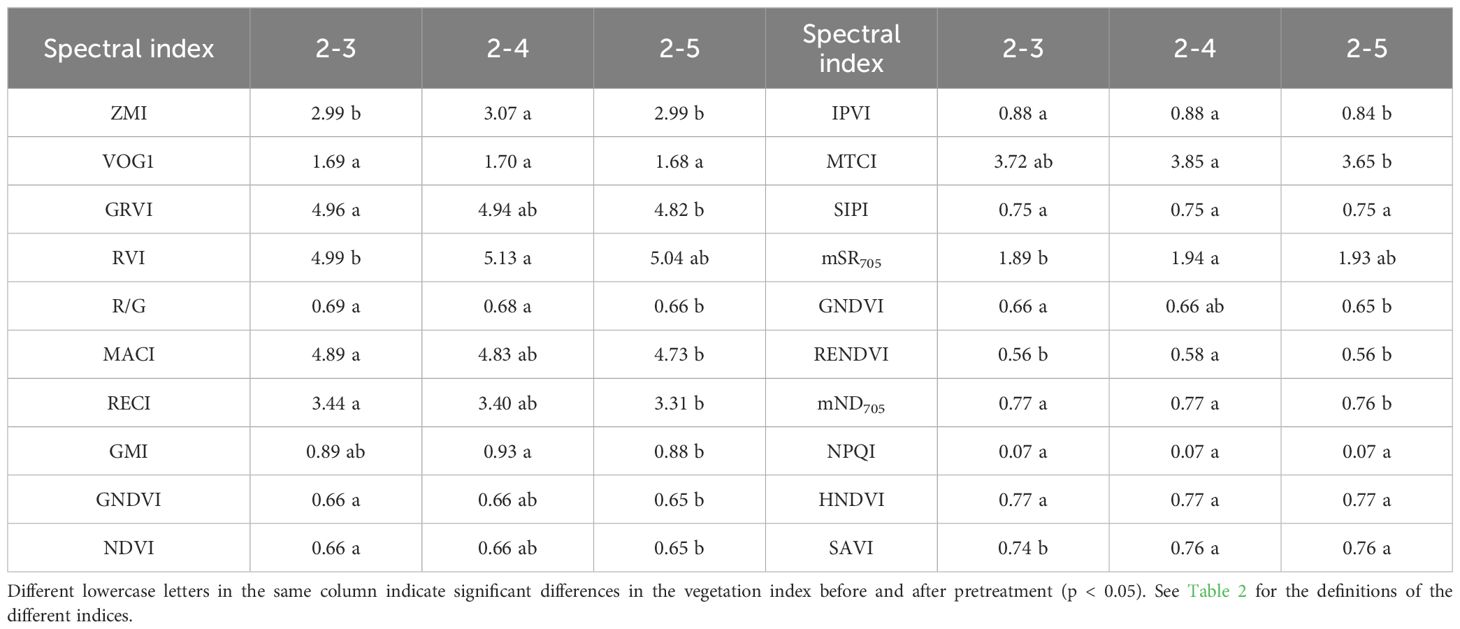
Table 5. Significance test of the vegetation indices after the second classification.
The calculated correlation coefficients between the VIs and cotton LNC are shown in Figure 12. The results indicated that VOGI, GRVI, RVI, MACI, RECI, GNDVI, NDVI, IPVI, mSR705, RENDVI, mND705, HNDVI, and SAVI were significantly correlated with LNC (r > 0.2). There was a substantial link between LNC and the ZMI, GRVI, RVI, MACI, GNDVI, NDVI, IPVI, MTCI, SIPI, RENDVI, mND705, HNDVI, and SAVI of 2-5 and the ZMI, GRVI, RVI, MACI, GNDVI, NDVI, IPVI, MTCI, SIPI, mSR705, and RENDV of 2-6. In contrast, R/G, GMI, and NPQI had no significant relationship with LNC. Nonetheless, the initial categorization findings revealed that R/G, GMI, and NPQI had a substantial relationship with LNC. All 20 VIs demonstrated a significant association with the cotton LNC in various picture pixel conditions. In general, the correlation coefficients between the indices and N in classifications 2 through 4 were higher than those in the other two categories. Spectral pre-processing greatly enhanced the correlation coefficients between the indices and LNC. The correlation between the OS and LNC was poor, but the correlation coefficient improved greatly after Gaussian filtering + SG smoothing, with GF&SG > SG > GF > OS offering the superior effect. GF&SG, SG, and GF all calculated indices with a superior link to LNC.
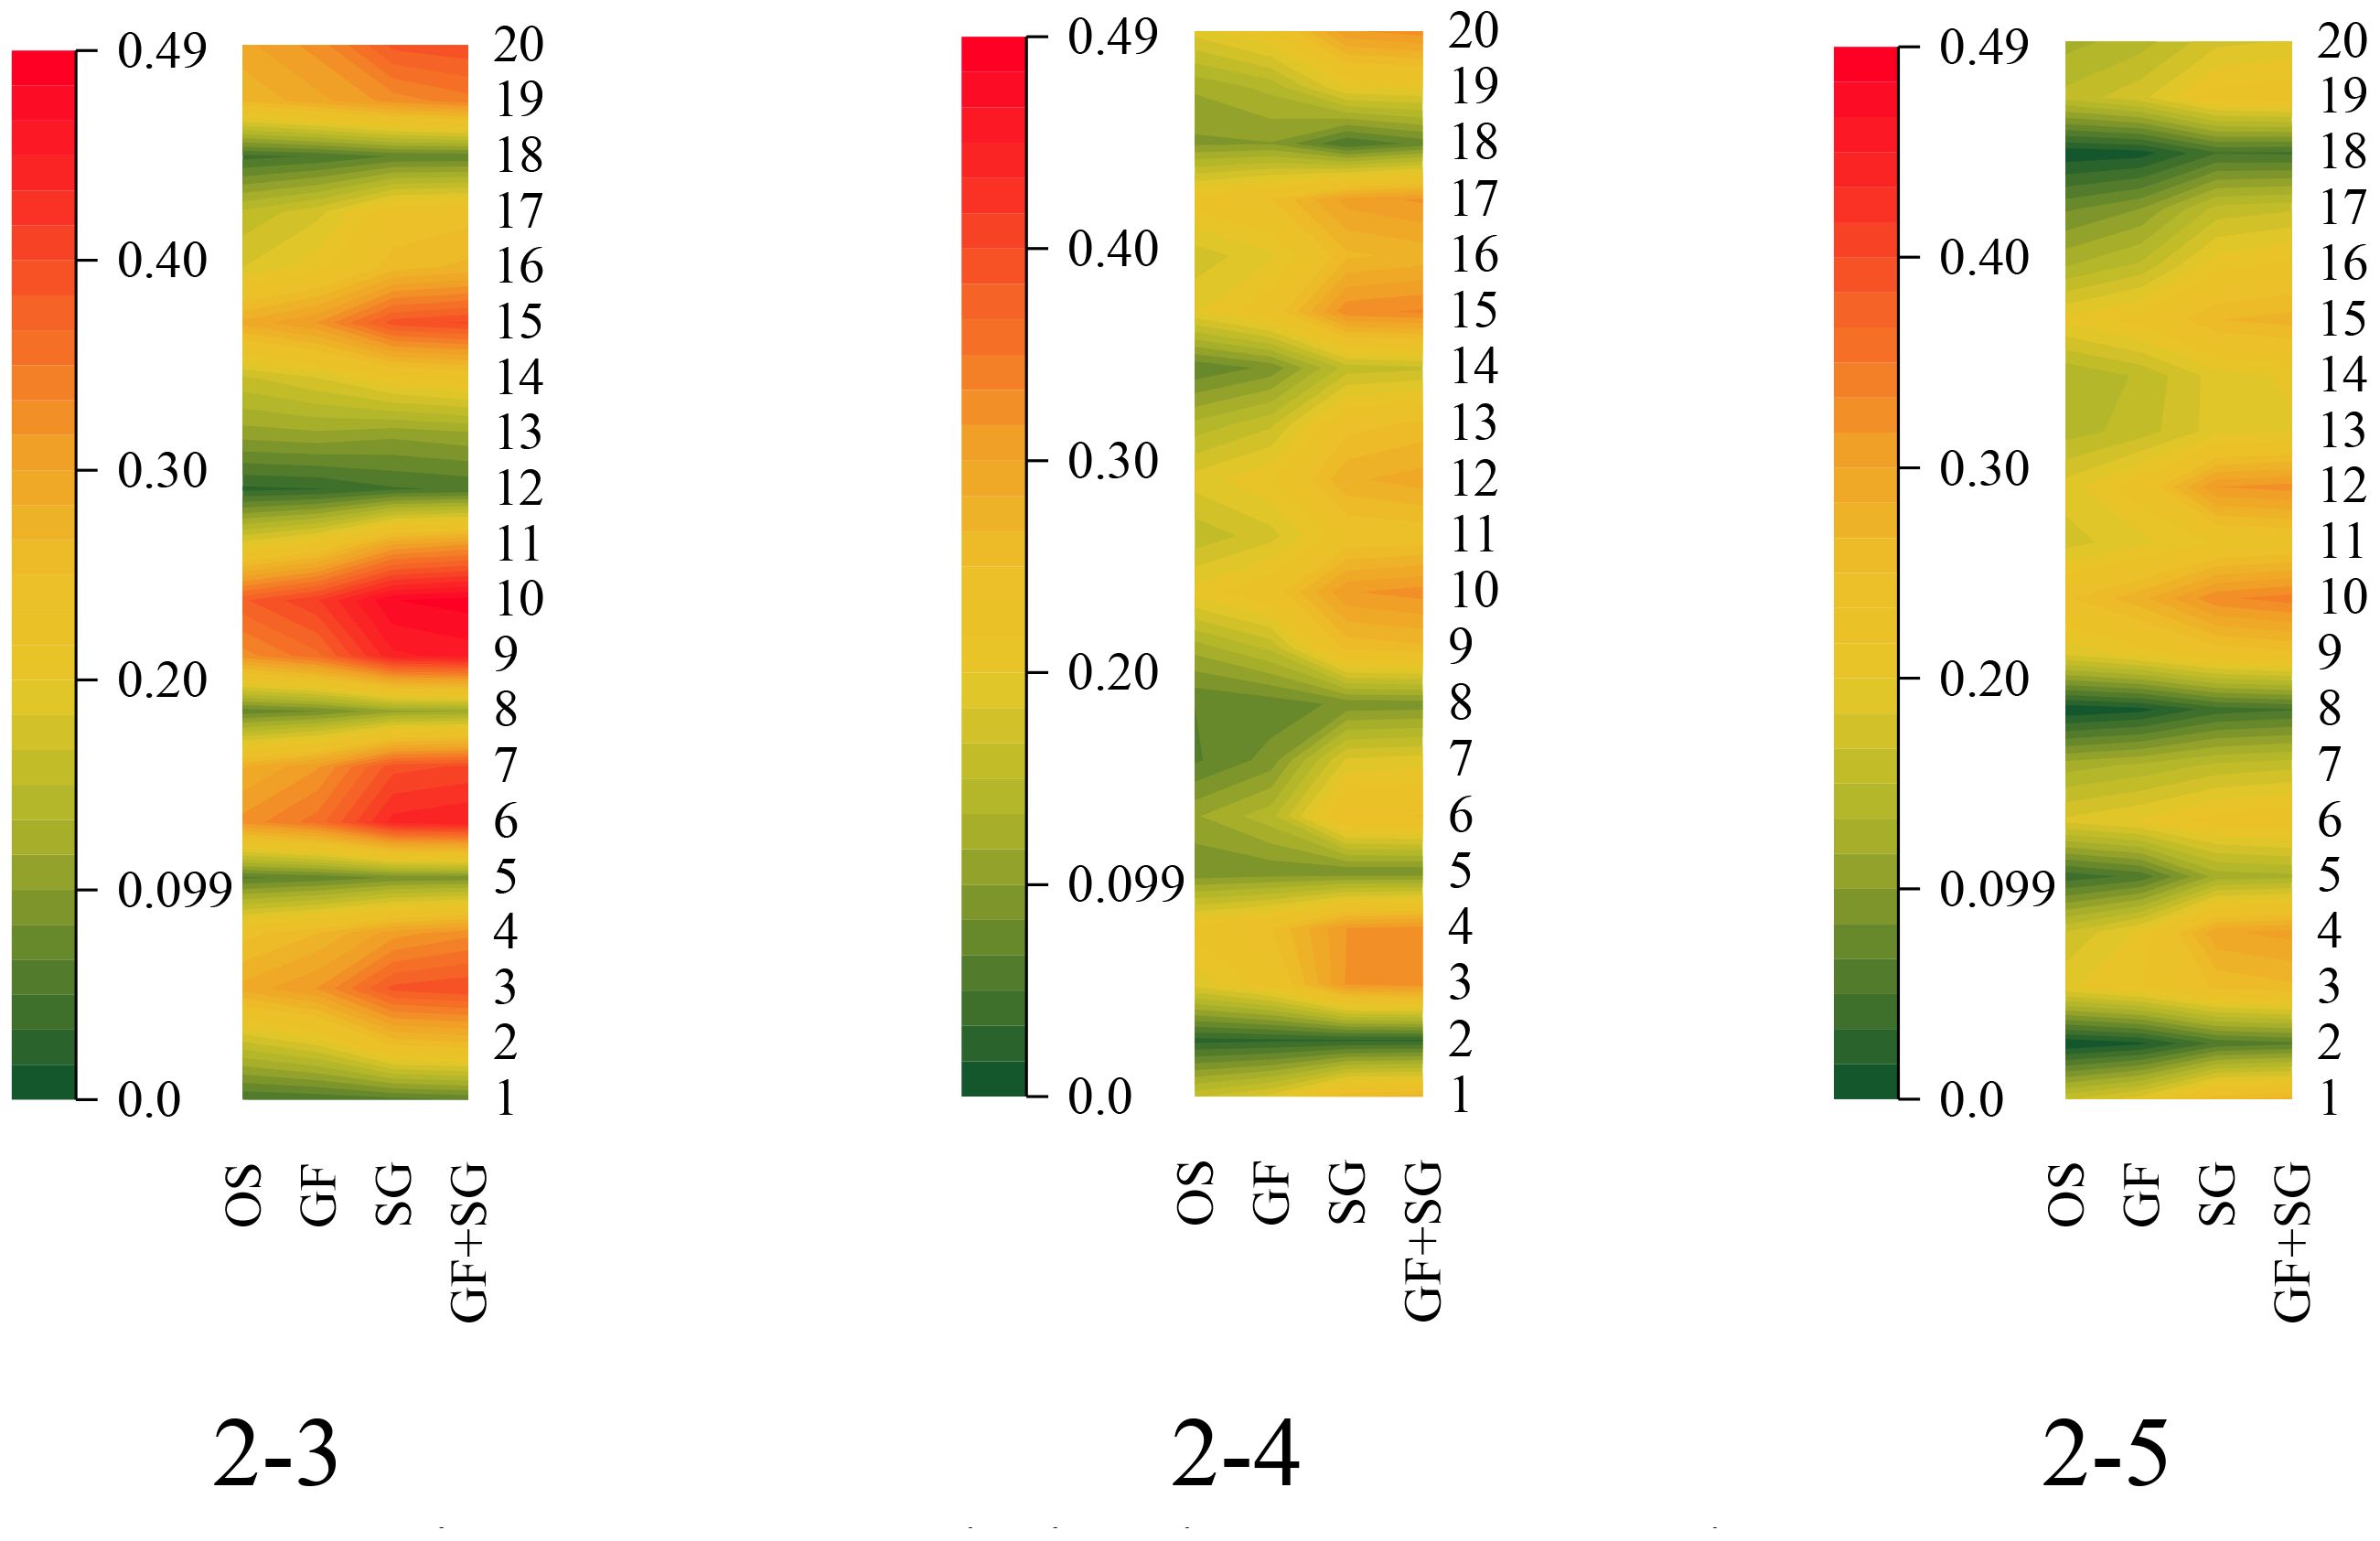
Figure 12. Correlations between the vegetation indices (VIs) and the leaf nitrogen content (LNC).
In conclusion, it can be seen that soil (1-2, 1-3, 1-7, 2-1, and 2-2) and shading (1-6) were effectively eliminated following the initial classification. After classifying the image pixels twice, the influence of soil on nitrogen monitoring was effectively minimized, and the link between the VIs and the cotton LNC was greatly improved.
The correlation coefficients of the indices with each other were greatly reduced after two classifications; however, the correlation coefficients of the indices with LNC were significantly increased. Consequently, this study will be an additional attempt to analyze the LNC based on a triple result of 2-3, 2-4, and 2-5 and with Pearson’s correlation coefficient to filter the sensitivity indices (Table 6).
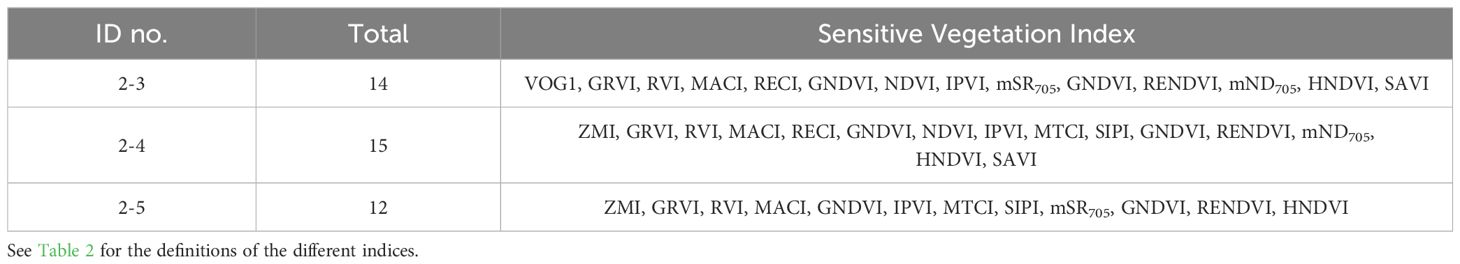
Table 6. Sensitivity indices.
3.4 Cotton nitrogen monitoring with machine learning
Based on the VIs shown in Section 3.2, we used several machine learning methods to build a cotton nitrogen monitoring model. Because the same indices corresponding to 2-3, 2-4, and 2-5 had substantial differences, the indices in the three classifications were mixed at random to generate LNC models (Figure 13).
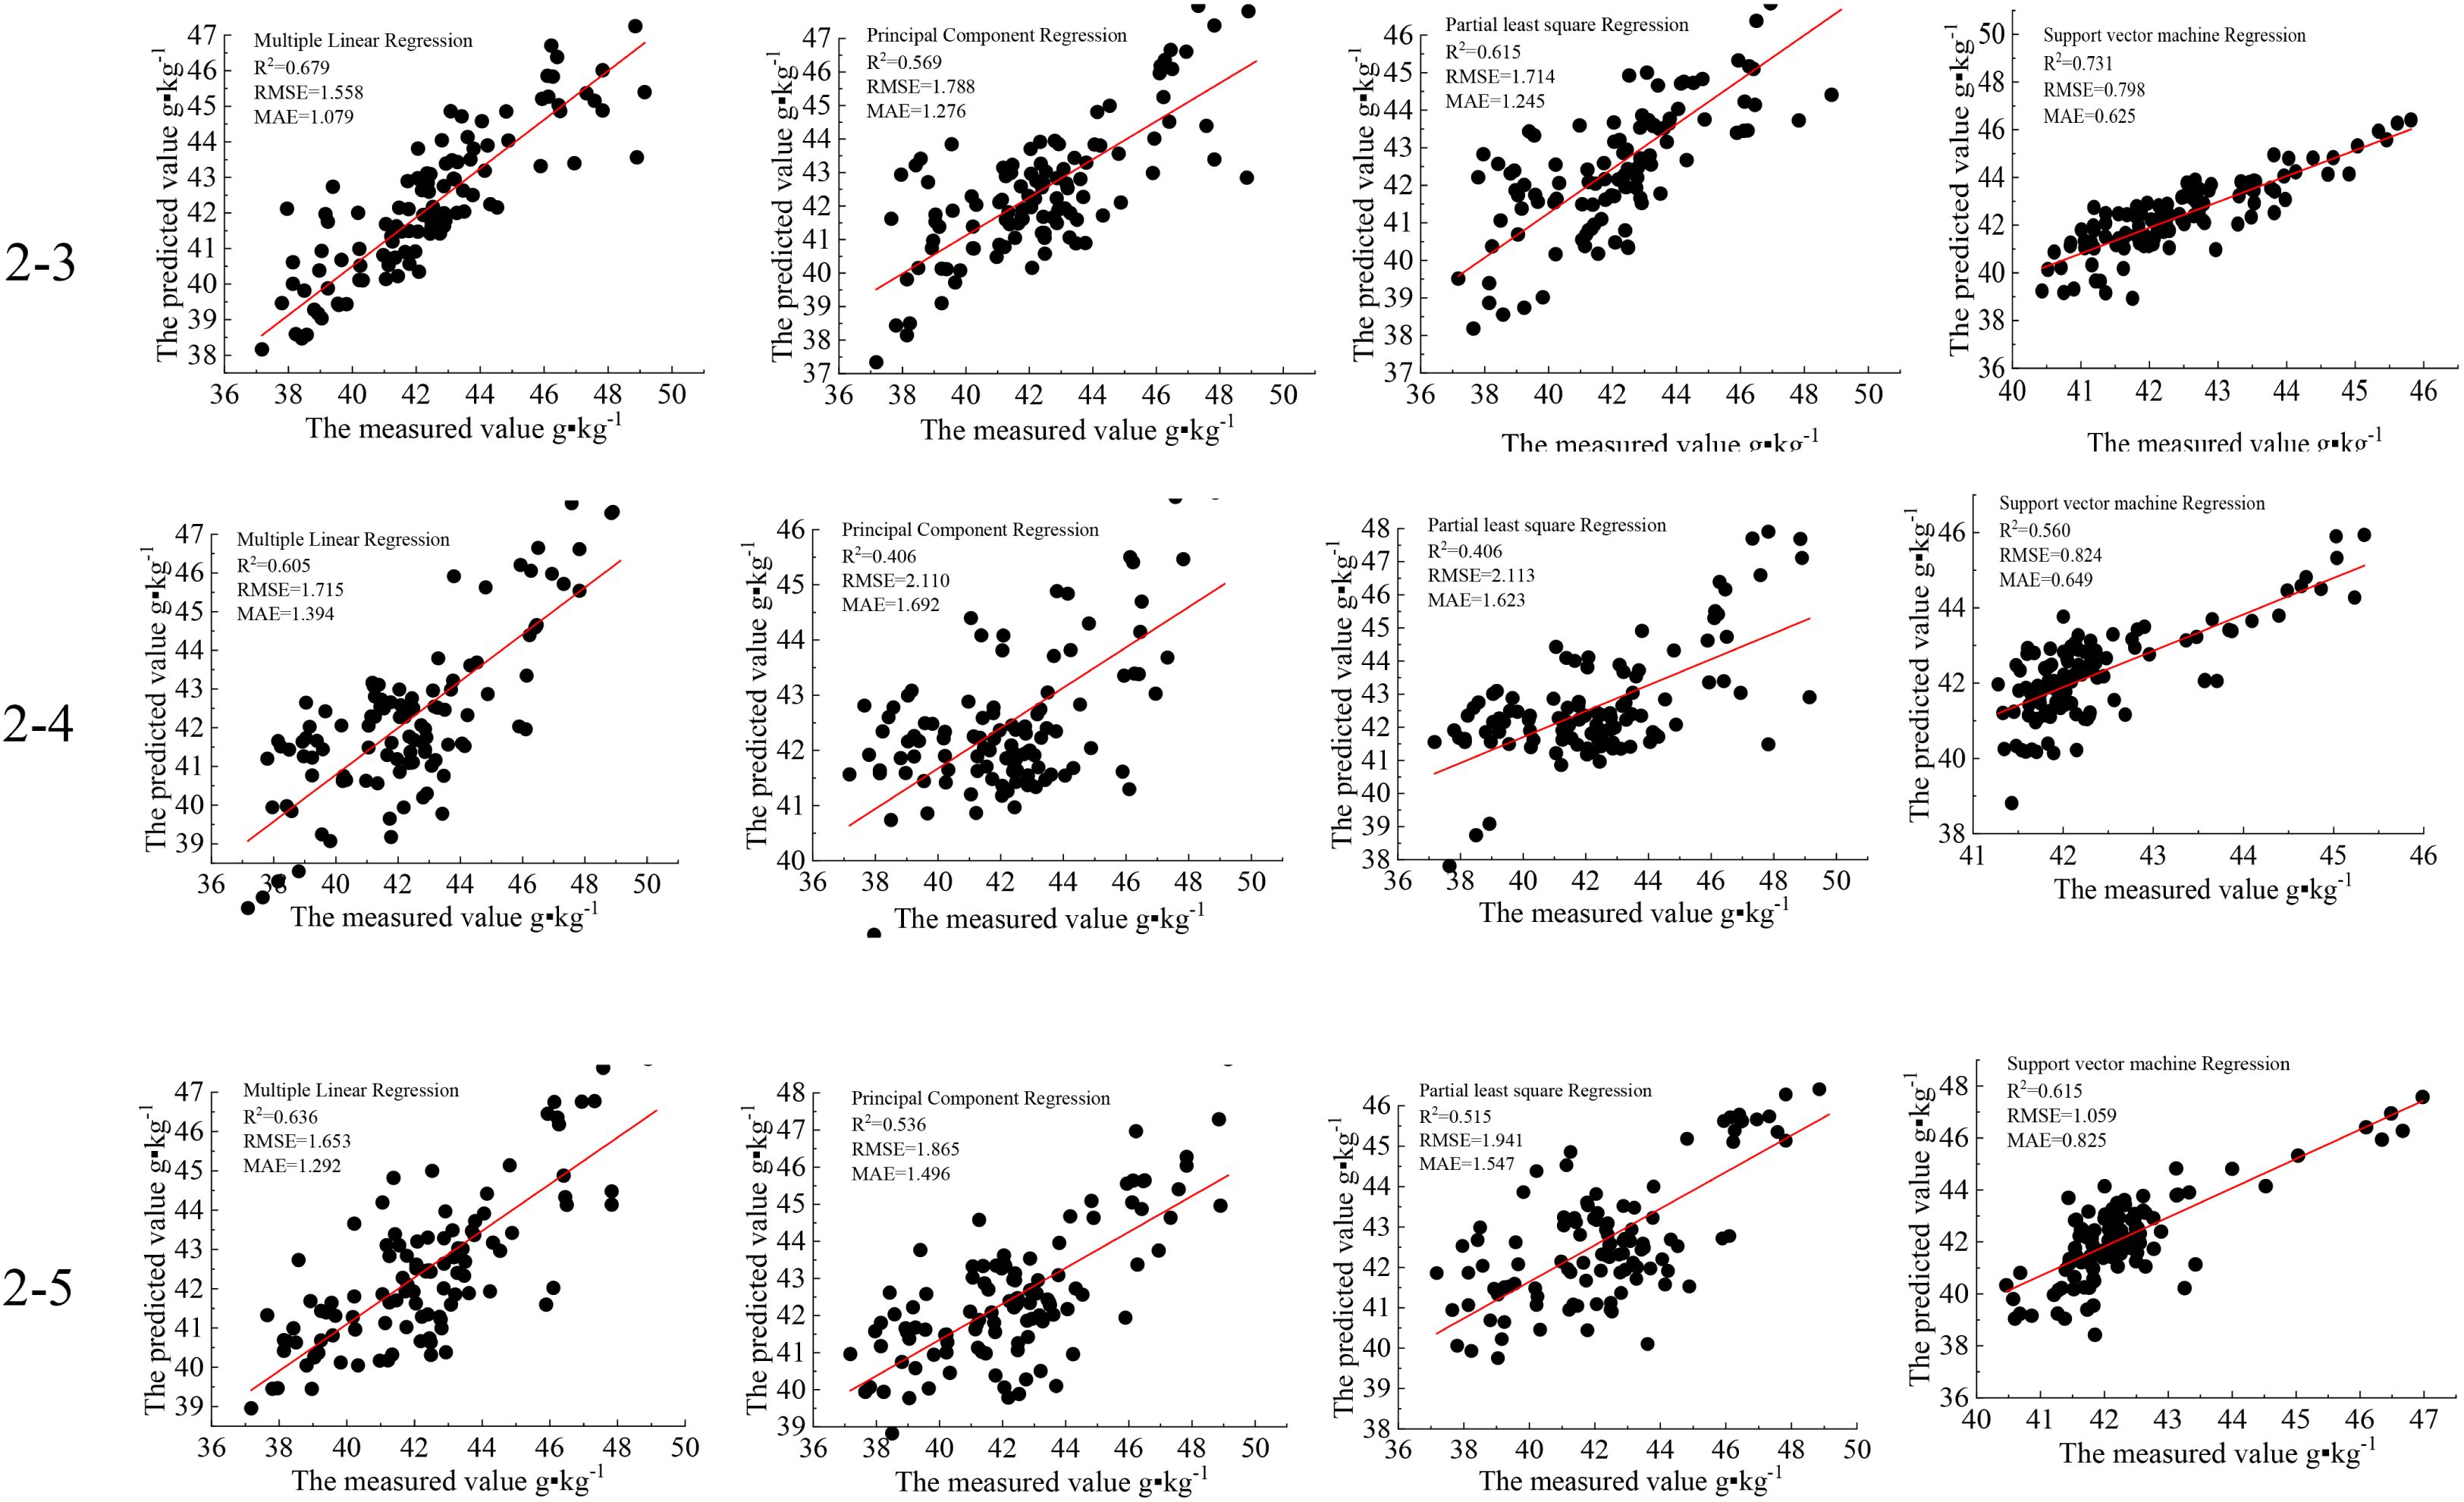
Figure 13. Results of cotton nitrogen monitoring.
It was determined that the accuracy of the model could be improved, particularly for the combination of VIs among the three categories, indicating that classed image pixels have a better performance in forecasting the LNC (Figure 14). This suggests that the categorized picture pixels are more capable of predicting N. It also demonstrates that the categorization presented in this research is an efficient method for N monitoring. Multiple linear regression showed the best prediction accuracy, followed by SVM.
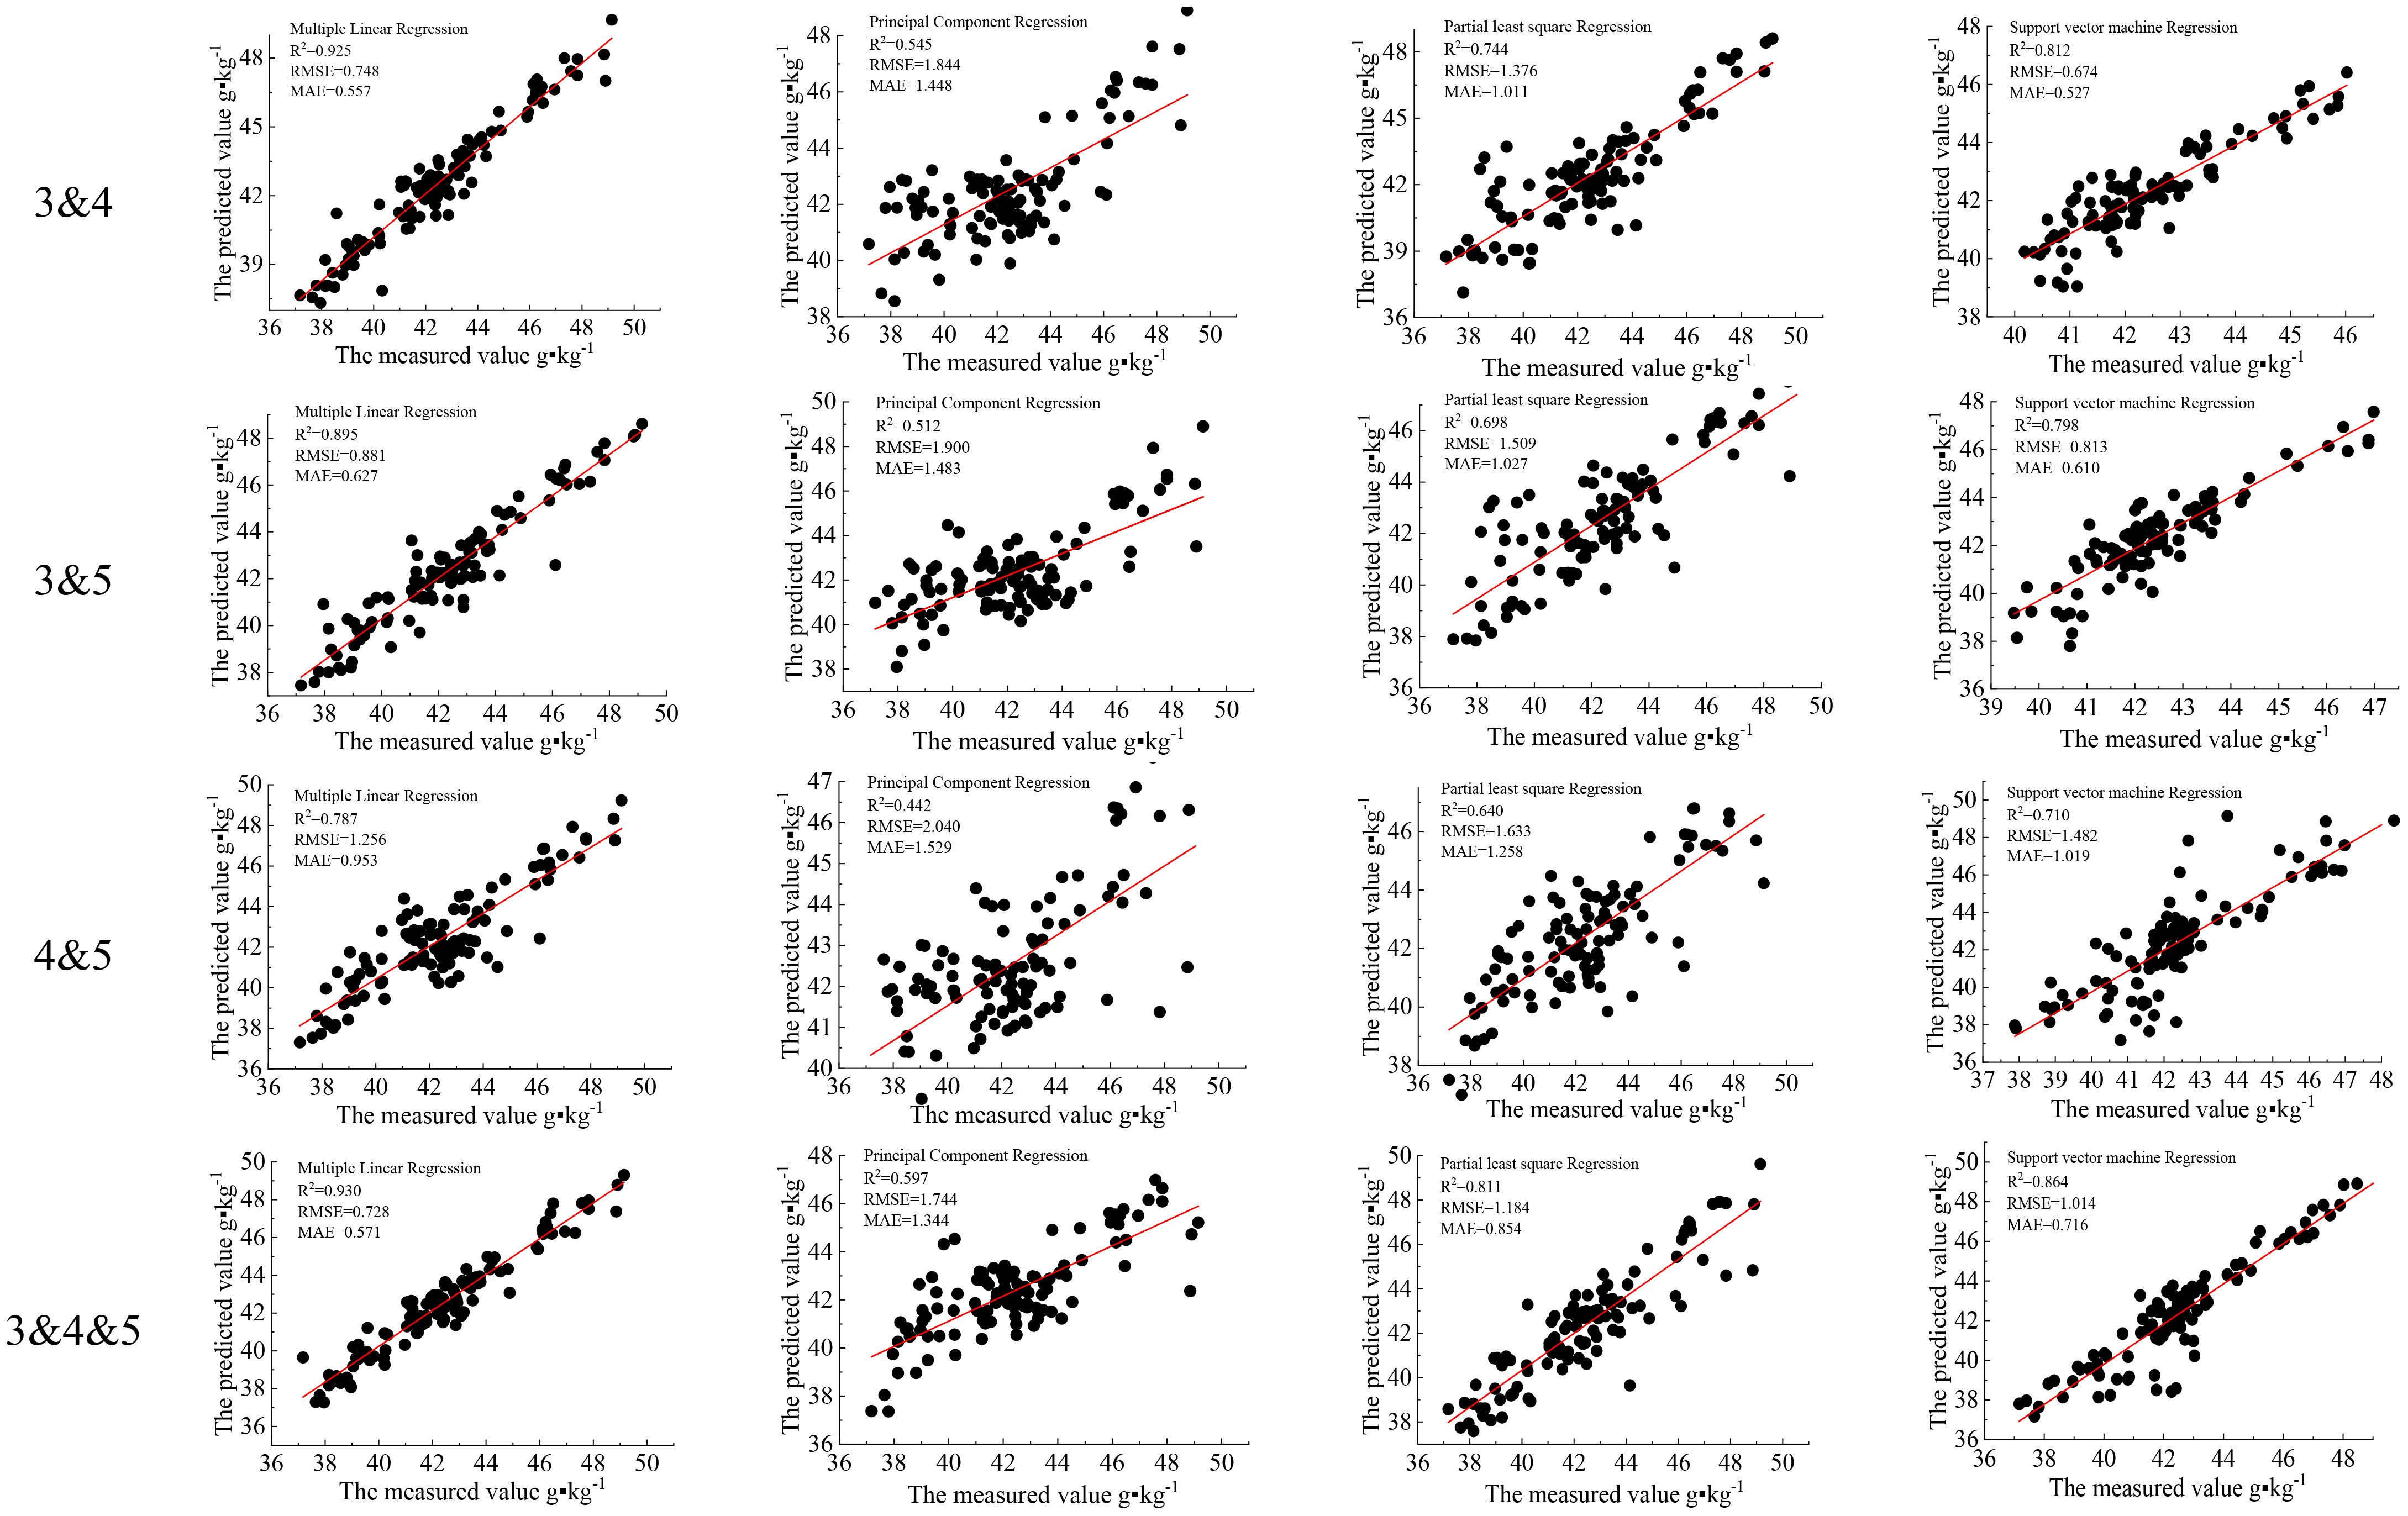
Figure 14. Monitoring of the leaf nitrogen content (LNC) of cotton after classification and combination.
4 Discussion and conclusion
4.1 Discussion
Currently, remote sensing images are popular for target detection in agriculture, but there are numerous challenges. Moharana and Dutta (2022) noted that one of the challenges of crop nutrient monitoring is the complexity of the farm environment, which interferes with spectral information due to the soil, leaf angle, and leaf shadow, among others. Sophisticated scenarios have been the focus of anti-interference research. The spectrometer consists mainly of an optoelectronic conversion, transmission, and processing system. Each module within the system produces noise at different levels, and the spectrum information of the true object is influenced by noises that are inevitable; hence, it is extremely essential to pre-process the spectrum (Jin et al., 2016). Wang et al. (2018) showed that the relationship between the UAV vegetation index and the soil water content could be improved after spectral pretreatment. In this study, after the spectra were pre-processed using Gaussian filtering, SG smoothing, and GF&SG, the correlations between the calculated spectral indices and the LNC increased gradually. Sun et al. (2017) performed pretreatment of the spectra for wheat flour gluten detection, and it was concluded that the model established after SG better matches the requirements of production detection than the OS. This is in agreement with the results of this study. When collecting spectral data for the monitoring of farmland information, spectral influence factors should be considered and the spectrum pre-processed purposefully.
Selected combinations of wavelength bands can be used to distinguish the plants from the soil background (Franz et al., 1991). In this study, GRVI, RVI, MACI, GMI, and MTCI were more susceptible than others to the disturbances of the surrounding environment, which may be due to the fact that these indices have common features that are made up of red edges, which is one of the distinctive characteristics of plants, whereas the four indices, VOG1, SIPI, NPQI, and HNDVI, were relatively stable than the others. Caturegli et al. (2015) pointed out that the size of the NDVI values are easily influenced by the surrounding environment. In this study, only 20 VIs proposed by previous authors were selected. The index found to be easily influenced by the surrounding environment was the ratio index. The normalized VIs had a more stable effect. There are various VIs that are prone to saturation, and their role in crop responsiveness to disturbance is unclear. Therefore, the use of more vegetation indices with clearer functions can be attempted at a later time. An index that can significantly distinguish shading and vegetation is important for agricultural information monitoring. In addition to VIs, disturbance rejection has been studied by other researchers. For instance, Woebbecke et al. (1995) used reflectance and field-of-view analysis to create a straightforward optical plant sensor that can distinguish plants from their surroundings, including soil and plant garbage. It is suggested that an RGB master system-based color scheme is used to distinguish plants from their natural environment.
There are currently many studies related to shadow detection. The shadow regions in a hyperspectral image have extremely low values. Therefore, these regions are either directly deleted or ignored in target detection or classification (Liu et al., 2020). Consequently, there are some studies focused on improving the reflectivity of the shadow regions; however, it remains difficult to determine the actual substances contained in these shadow regions. M-Desa et al. (2022) proposed that shadow recognition in digital images is an essential step in pre-processing for computer vision as the shadows in images can hide the features of the target objects in detail. However, there are only a few studies on crop shadow detection. Therefore, it is necessary to focus on the impact of shadows on the monitoring of farmland information in future studies. For example, Imai et al. (2019) used a UAV to obtain hyperspectral images of orange plantations in multiple wavelengths. Wavelength information near blue light and long-wave NIR has been proposed to be able to identify farmland and shadows well. Li et al. (2022) divided the apple canopy into shade and canopy using the threshold method. However, the canopy shading of orange and apple is not as complex as that of agricultural field shading. Hence, efficient distinction between the agricultural shadow and the plant cover will be one of the issues that should be resolved in agricultural research. In this study, the image pixels were classified into shadows based on the greenness of plant growth, while the soil and a number of useless shadows were removed. Cotton is a dynamic crop, which makes shading more complex; therefore, the canopy spectra of cotton are easily impacted by shadow. This study provides a method for classifying image pixels based on the intensity of green light. On the one hand, this is due to the fact that chlorophyll has a significant association with nitrogen (Barker and Sawyer, 2010; Schmidt et al., 2011). Traditional nitrogen monitoring involves assessment of the quantity of nitrogen fertilizer based on the leaf color, mostly due to the intensity of the leaf color being correlated with nitrogen (Bacsa et al., 2019). Chlorophyll is directly proportional to the intensity of the leaf color in plants. On the other hand, green light, the greatest distinguishing element of green plants, can be used to clearly differentiate vegetation from other backdrops. In this study, the vegetation image pixels were classified using the green light, and the image pixels were classified twice based on the level of vegetation greenness. The correlations among the VIs were obviously decreased after the second classification, while the correlations between the indices and nitrogen were improved. This indicates that the spectral reflectance and vegetation indices of the image pixels each have great differences and that the classification can effectively eliminate the interference of soil and shadow. In the 1980s, Guyer et al. discovered that the intensity of the pixels in the plant images was higher than that of the soil pixels by shining visible light on the plants. This indicates that grading the intensity of green light is significantly effective for soil and shadow rejection. The classification should be further improved in the future, so that shadows can be distinguished more clearly.
In this study, several monitoring models were developed based on the classification results using common methods. It was found that the results showed good performance. Among them, MLR and random forest regression had the most positive results. Manfreda et al. (2018) proposed that the random forest algorithm combined with VIs has superior performance in predicting the canopy nitrogen in citrus. Moreover, since the indices of each classification reached a significant relationship with nitrogen after two classifications, in this study, the indices of three classifications were combined for modeling. The contributions of each classification to nitrogen should be considered, and weights should be assigned to each of the indices in a future study, which might reach better results.
4.2 Conclusion
In this study, we employed a UAV hyperspectrum to acquire hyperspectral images, classified the image pixels twice to green light, and then excluded the unrelated image pixels to capture the relevant image pixels. Vegetation indicators were retrieved using multiple pretreatment methods to construct an LNC monitoring model. The results demonstrated that the classification proposed in this study can successfully eliminate the mixing spectra from the shadows of cotton leaves and soil, as well as improve the relationship between LNC and VI. In addition, GF&SG served as a de-interference mechanism for the UAV spectra. The LNC of cotton could be well known when combined with various machine learning techniques. Consequently, while monitoring nitrogen using UAV hyperspectral images, it is crucial to consider extracting the pertinent properties of the imaging spectra, such that the spectrum captured is more indicative of the cotton leaf spectrum reflection and nitrogen monitoring accuracy.
Data availability statement
The original contributions presented in the study are included in the article/Supplementary Material. Further inquiries can be directed to the corresponding authors.
Author contributions
CY: Writing – original draft, Writing – review & editing, Conceptualization, Data curation, Formal analysis, Investigation, Methodology, Project administration, Software, Validation. ZW: Writing – review & editing. XL: Supervision, Writing – review & editing. SQ: Data curation, Methodology, Software, Supervision, Validation, Writing – review & editing. LM: Formal analysis, Project administration, Writing – review & editing. ZZ: Funding acquisition, Methodology, Supervision, Writing – review & editing. QT: Funding acquisition, Methodology, Resources, Visualization, Writing – review & editing.
Funding
The author(s) declare financial support was received for the research, authorship, and/or publication of this article. [China Agriculture Research System ] (Grant numbers ([CARS-15-13]), [XinJiang Agriculture Research System] (Grant numbers [XIARS-03]), [Corps Strong Youth Project] (Grant numbers [2022CB002-01]), [Xinjiang 'Tianshan Elite' Training Program (Grant numbers [2023TSYCCX0019]) and [The Major Science and Technology Special Project of the Xinjiang Uyghur Autonomous Region - Research on Key Technologies for Farm Digitalization and Intelligence] (Grant numbers [2022A02011-2-1]).
Acknowledgments
Thanks to my tutors and classmates for contributions. Thanks to everyone who helped me finish the experiment. Thanks to the journal editor and all experts for their suggestions.
Conflict of interest
The authors declare that the research was conducted in the absence of any commercial or financial relationships that could be construed as a potential conflict of interest.
Publisher’s note
All claims expressed in this article are solely those of the authors and do not necessarily represent those of their affiliated organizations, or those of the publisher, the editors and the reviewers. Any product that may be evaluated in this article, or claim that may be made by its manufacturer, is not guaranteed or endorsed by the publisher.
Supplementary material
The Supplementary Material for this article can be found online at: https://www.frontiersin.org/articles/10.3389/fpls.2024.1380306/full#supplementary-material
Supplementary Figure 1 | DJI M600.
Supplementary Figure 2 | Sensor.
Supplementary Figure 3 | Region of interest (ROI). The first ROI, 900 image pixels, excluding the soil between the cotton rows, was rejected in Figure 2.
References
Aparicio, N., Villegas, D., Casadesus, J., Araus, J. L., Royo, C. (2000). Spectral vegetation indices as nondestructive tools for determining durum wheat yield. Agron. J. 92 (1), 83–91.
Bacsa, C. M., Martorillas, R. M., Balicanta, L. P., Tamondong, A. M. (2019). Correlation of Uav-based multispectral vegetation indices and leaf color chart observations for nitrogen concentration assessment on rice crops. Int. Arch. Photogramm. Remote Sens. Spat. Inf. Sci. 19, 31–38. doi: 10.5194/isprs-archives-XLII-4-W19-31-2019
Barker, D. W., Sawyer, J. E. (2010). Using active canopy sensors to quantify corn nitrogen stress and nitrogen application rate. Agron. J. 102, 964–971. doi: 10.2134/agronj2010.0004
Barnes, E. M., Clarke, T. R., Richards, S. E., Colaizzi, P., Haberland, J., Kostrzewski, M., et al. (2000). Coincident detection of crop water stress, nitrogen status, and canopy density using ground based multispectral data. Proceedings of the 5th International Conference on Precision Agriculture and other resource management July 16-19, 2000 (Bloomington, MN USA).
Caturegli, L., Grossi, N., Saltari, M., Gaetani, M., Magni, S., Volterrani, M. (2015). Spectral reflectance of tall fescue (Festuca Arundinacea Schreb.) under different irrigation and nitrogen conditions. Agric. Agric. Sci. Proc. 4, 59–67. doi: 10.1016/j.aaspro.2015.03.008
Chen, P., Haboudane, D., Tremblay, N., Wang, J., Vigneault, P., Li, B. (2010). New spectral indicator assessing the efficiency of crop nitrogen treatment in corn and wheat. Remote Sens. Environ. 114, 1987–1997. doi: 10.1016/j.rse.2010.04.006
Chu, T., Chen, R., Landivar, J. A., Maeda, M. M., Yang, C., Starek, M. J. (2016). Cotton growth modeling and assessment using unmanned aircraft system visual-band imagery. J. Appl. Remote Sens. 10, 036018. doi: 10.1117/1.JRS.10.036018
Dash, J., Curran, P. J. (2007). Evaluation of the MERIS terrestrial chlorophyll index. Adv. Space Res. 39 (01), 100–104.
Das, A. K., Mathew, J., Zhang, Z., Friskop, A., Huang, Y., Han, X., et al. (2022). “Corn Goss’s Wilt Disease Assessment Based on UAV Imagery,” in Unmanned Aerial Systems in Precision Agriculture (Springer, Singapore), 123–136.
Delavarpour, N., Koparan, C., Nowatzki, J., Bajwa, S., Sun, X. (2021). A technical study on UAV characteristics for precision agriculture applications and associated practical challenges. Remote Sens. 13, 1204. doi: 10.3390/rs13061204
Feng, W., Guo, B. B., Wang, Z. J., He, L., Song, X., Wang, Y. H., et al. (2014). Measuring leaf nitrogen concentration in winter wheat using double-peak spectral reflection remote sensing data. Field Crops Res. 159, 43–52. doi: 10.1016/j.fcr.2014.01.010
Franz, E., Gebhardt, M. R., Unklesbay, K. B. (1991). The use of local spectral properties of leaves as an aid for identifying weed seedlings in digital images. Trans. ASAE 34, 682–687. doi: 10.13031/2013.31717
Gitelson, A., Merzlyak, M. N. (1994). Quantitative estimation of chlorophyll-a using reflectance spectra: Experiments with autumn chestnut and maple leaves. J. Photochem. Photobiol. B Biol. 22 (03), 247–252.
Gitelson, A. A., Merzlyak, M. N., Chivkunova, O. B. (2010). Optical properties and nondestructive estimation of anthocyanin content in plant leaves. Photochem. Photobiol. 74 (01), 38–45.
Gitelson, A. A., Stark, R., Grits, U., Rundquist, D., Kaufman, Y., Derry, D. (2002). Vegetation and soil lines in visible spectral space: A concept and technique for remote estimation of vegetation fraction. Int. J. Remote Sens. 23 (13), 2537–2562.
Gitelson, A. A., Vina, A., Ciganda, V., Rundquist, D. C., Arkebauer, T. J. (2005). Remote estimation of canopy chlorophyll content in crops. Geophysical Res. Lett. 32 (08), 4031–4034.
Gong, Y., Yang, K., Lin, Z., Fang, S., Wu, X., Zhu, R., et al. (2021). Remote estimation of leaf area index (LAI) with unmanned aerial vehicle (UAV) imaging for different rice cultivars throughout the entire growing season. Plant Methods 17, 1–16. doi: 10.1186/s13007-021-00789-4
Govender, M., Chetty, K., Naiken, V., Bulcock, H. (2008). A comparison of satellite hyperspectral and multispectral remote sensing imagery for improved classification and mapping of vegetation. Water sa 34, 147–154. doi: 10.4314/wsa.v34i2.183634
Guyer, D. E., Miles, G. E., Schreiber, M. M., Mitchell, O. R., Vanderbilt, V. C. (1986). Machine vision and image processing for plant identification. Trans. ASAE 29, 1500–1507. doi: 10.13031/2013.30344
Imai, N. N., Tommaselli, A. M. G., Berveglieri, A., Moriya, E. A. S. (2019). Shadow detection in hyperspectral images acquired by UAV. Int. Arch. Photogrammetry Remote Sens. Spatial Inf. Sci. 42, 371–377. doi: 10.5194
Jin, X., Du, J., Liu, H., Wang, Z., Song, K. (2016). Remote estimation of soil organic matter content in the Sanjiang Plain, Northest China: The optimal band algorithm versus the GRA-ANN model. Agric. For. Meteorol 218, 250–260. doi: 10.1016/j.agrformet.2015.12.062
Johnson, M. D., Hsieh, W. W., Cannon, A. J., Davidson, A., Bédard, F. (2016). Crop yield forecasting on the Canadian Prairies by remotely sensed vegetation indices and machine learning methods. Agric. For. meteorol 218, 74–84. doi: 10.1016/j.agrformet.2015.11.003
Kerkech, M., Hafiane, A., Canals, R. (2020). Vine disease detection in UAV multispectral images using optimized image registration and deep learning segmentation approach. Comput. Electron. Agric. 174, 105446. doi: 10.1016/j.compag.2020.105446
Khekade, A., Bhoyar, K. (2015). “Shadow detection based on RGB and YIQ color models in color aerial images,” in 2015 International Conference on Futuristic Trends on Computational Analysis and Knowledge Management (ABLAZE). 144–147.
Leprieur, C., Kerr, Y. H., Mastorchio, S., Meunier, J. C. (2000). Monitoring vegetation cover across semi-arid regions: comparison of remote observations from various scales. Int. J. Remote Sens. 21 (2), 281–300.
Liu, H., Zhu, H., Li, Z., Yang, G. (2020). Quantitative analysis and hyperspectral remote sensing of the nitrogen nutrition index in winter wheat. Int. J. Remote Sens. 41 (3), 858–881. doi: 10.1080/01431161.2019.1650984
Li, M., Zhu, X., Li, W., Tang, X., Yu, X., Jiang, Y. (2022). Retrieval of nitrogen content in apple canopy based on unmanned aerial vehicle hyperspectral images using a modified correlation coefficient method. Sustainability 14 (04), 1992–2008. doi: 10.3390/su14041992
Manfreda, S., McCabe, M. F., Miller, P. E., Lucas, R., Pajuelo Madrigal, V., Toth, B. (2018). On the use of unmanned aerial systems for environmental monitoring. Remote Sens. 10, 641. doi: 10.3390/rs10040641
McConkey, B., Basnyat, P., Lafond, G. P., Moulin, A., Pelcat, Y. (2004). Optimal time for remote sensing to relate to crop grain yield on the Canadian prairies. Can. J. Plant Sci. 84, 97–103. doi: 10.4141/P03-070
M-Desa, S., Zali, S. A., Mohd-Isa, W. N., Che-Embi, Z. (2022). Color-based shadow detection method in aerial images. J. Physics: Conf. Ser. 2312, 012081. doi: 10.1088/1742-6596/2312/1/012081
Merzlyak, M. N., Solovchenko, A. E., Gitelson, A. A. (2003). Reflectance spectral features and non-destructive estimation of chlorophyll, carotenoid and anthocyanin content in apple fruit. Postharvest Biol. Technol. 27 (02), 197–211.
Miphokasap, P., Honda, K., Vaiphasa, C., Souris, M., Nagai, M. (2012). Estimating canopy nitrogen concentration in sugarcane using field imaging spectroscopy. Remote Sens. 4, 1651–1670. doi: 10.3390/rs4061651
Moharana, S., Dutta, S. (2022). Retrieval of paddy crop nutrient content at plot scale using optimal synthetic bands of high spectral and spatial resolution satellite imagery. J. Ind. Soc. Remote Sens. 50 (6), 949–959.
Oppelt, N., Mauser, W. (2004). Hyperspectral monitoring of physiological parameters of wheat during a vegetation period using AVIS data. Int. J. Remote Sens. 25 (01), 145–159.
Penuelas, J., Baret, F., Filella, I. (1995). Semiempirical indexes to assess carotenoids chlorophyll-a ratio from leaf spectral reflectance. Photosynthetica 31 (02), 221–230.
Prado Osco, L., Marques Ramos, A. P., Roberto Pereira, D., Akemi Saito Moriya, É., Nobuhiro Imai, N., Takashi Matsubara, E., et al. (2019). Predicting canopy nitrogen content in citrus-trees using random forest algorithm associated to spectral vegetation indices from UAV-imagery. Remote Sens. 11, 2925. doi: 10.3390/rs11242925
Rondeaux, G., Steven, M., Baret, F. (1996). Optimization of soil-adjusted vegetation indices. Remote Sens. Environ. 55 (02), 95–107.
Schmidt, J., Beegle, D., Zhu, Q., Sripada, R. (2011). Improving in-season nitrogen recommendations for maize using an active sensor. Field Crops Res. 120, 94–101. doi: 10.1016/j.fcr.2010.09.005
Shafian, S., Rajan, N., Schnell, R., Bagavathiannan, M., Valasek, J., Shi, Y., et al. (2018). Unmanned aerial systems-based remote sensing for monitoring sorghum growth and development. PloS One 13, e0196605. doi: 10.1371/journal.pone.0196605
Sims, D. A., Gamon, J. A. (2002). Relationships between leaf pigment content and spectral reflectance across a wide range of species, leaf structures and developmental stages. Remote Sens. Environ. 81 (2–3), 337–354.
Snider, J., Harris, G., Roberts, P., Meeks, C., Chastain, D., Bange, M., et al. (2021). Cotton physiological and agronomic response to nitrogen application rate. Field Crops Res. 270, 108194. doi: 10.1016/j.fcr.2021.108194
Song, X., Yang, G., Xu, X., Zhang, D., Yang, C., Feng, H. (2022). Winter wheat nitrogen estimation based on ground-level and UAV-mounted sensors. Sensors 22, 549. doi: 10.3390/s22020549
Stroppiana, D., Boschetti, M., Brivio, P. A., Bocchi, S. (2009). Plant nitrogen concentration in paddy rice from field canopy hyperspectral radiometry. Field Crops Res. 111, 119–129. doi: 10.1016/j.fcr.2008.11.004
Sun, Z. Y., Chen, Y. Q., Yang, L., Tang, G. L., Yuan, S. X., Lin, Z. W. (2017). Small unmanned aerial vehicles for low-altitude remote sensing and its application progress in ecology. J. Appl. Ecol. 28, 528–536. doi: 10.13287/j.1001-9332.201702.030
Sun, X., Zhou, Z., Liu, C., Fu, X., Dou, Y. (2018). Near infrared spectroscopic detection of gluten content in wheat flour based on spectral pretreatment and simulated annealing algorithm. Shipin Kexue/Food Sci. 39, 222–226. doi: 10.1016/j.foodchem.2020.127419
Tao, H., Feng, H., Xu, L., Miao, M., Yang, G., Fan, L. (2020). Estimation of the yield and plant height of winter wheat using UAV-based hyperspectral images. Sensors 20, 1231. doi: 10.3390/s20041231
Tian, Y. C., Gu, K. J., Chu, X., Yao, X., Cao, W. X., Zhu, Y. (2014). Comparison of different hyperspectral vegetation indices for canopy leaf nitrogen concentration estimation in rice. Plant Soil 376, 193–209. doi: 10.1007/s11104-013-1937-0
Tong, X. C., Qin, Z. Y., Wu, B., Li, H., Lai, G. L., Ding, L. (2017). Impact of infrared sensor scanning control12 X. LIU ET AL. accuracy on super-resolution reconstruction. J. Appl. Remote Sens. 11, 016031. doi: 10.1117/1.JRS.11.016031
Verrelst, J., Camps-Valls, G., Muñoz-Marí, J., Rivera, J. P., Veroustraete, F., Clevers, J. G., et al. (2015). Optical remote sensing and the retrieval of terrestrial vegetation bio-geophysical properties–A review. ISPRS J. Photogrammetry Remote Sens. 108, 273–290. doi: 10.1016/j.isprsjprs.2015.05.005
Vogelmann, J. E., Rock, B. N., Moss, D. M. (1993). Red edge spectral measurements from sugar maple leaves. Int. J. Remote Sens. 14 (8), 1563–1575. doi: 10.1080/01431169308953986
Volkova, A., Baird, J., Wajchman, I., Guinane, J. (2018). “Comparison of aerial hyperspectral and multispectral imagery: case study of nitrogen mapping in Australian cotton,” in 2018 9th Workshop on Hyperspectral Image and Signal Processing: Evolution in Remote Sensing (WHISPERS). 1–5 (IEEE).
Wang, J., Ding, J., Ma, X., Ge, X., Liu, B., Liang, J. (2018). Detection of soil moisture content based on UAV-derived hyperspectral imagery and spectral index in oasis cropland. Trans. Chin. Soc Agric. Mach. 49, 164–172. doi: 10.6041/j.issn.1000-1298.2018.11.019
Woebbecke, D. M., Meyer, G. E., Von Bargen, K., Mortensen, D. A. (1995). Color indices for weed identification under various soil, residue, and lighting conditions. Trans. ASAE 38, 259–269. doi: 10.13031/2013.27838
Xu, X., Fan, L., Li, Z., Meng, Y., Feng, H., Yang, H., et al. (2021). Estimating leaf nitrogen content in corn based on information fusion of multiple-sensor imagery from UAV. Remote Sens. 13, 340. doi: 10.3390/rs13030340
Yang, C., Westbrook, J. K., Suh, C. P. C., Martin, D. E., Hoffmann, W. C., Goolsby, J. A. (2014). An airborne multispectral imaging system based on two consumer-grade cameras for agricultural remote sensing. Remote Sens. 6, 5257–5278. doi: 10.3390/rs6065257
Yao, X., Ren, H., Cao, Z., Tian, Y., Cao, W., Zhu, Y., et al. (2014). Detecting leaf nitrogen content in wheat with canopy hyperspectrum under different soil backgrounds. Int. J. Appl. Earth Observation Geoinformation 32, 114–124. doi: 10.1016/j.jag.2014.03.014
Yin, C., Lv, X., Zhang, L., Ma, L., Wang, H., Zhang, L., et al. (2022). Hyperspectral UAV images at different altitudes for monitoring the leaf nitrogen content in cotton crops. Remote Sens. 14 (11), 2576. doi: 10.3390/rs14112576
Zarco-Tejada, P. J., Miller, J. R., Noland, T. L., Mohammed, G. H., Sampson, P. H. (2001). Scaling-up and model inversion methods with narrowband optical indices for chlorophyll content estimation in closed forest canopies with hyperspectral data. IEEE Trans. Geosci. Remote Sens. 39 (7), 1491–1507.
Zhang, Z., Bian, J., Han, W., Fu, Q., Chen, S., Cui, T. (2018). Cotton moisture stress diagnosis based on canopy temperature characteristics calculated from UAV thermal infrared image. Trans. Chin. Soc. Agric. Eng. 34, 77–84. doi: 10.15302/J-SSCAE-2018.05.012
Zhang, L., Zhang, H., Han, W., Niu, Y., Chávez, J. L., Ma, W. (2022). Effects of image spatial resolution and statistical scale on water stress estimation performance of MGDEXG: A new crop water stress indicator derived from RGB images. Agric. Water Manage. 264, 107506.
Zheng, H., Cheng, T., Li, D., Zhou, X., Yao, X., Zhu, Y. (2018). Evaluation of RGB, color-infrared and multispectral images acquired from unmanned aerial systems for the estimation of nitrogen accumulation in rice. Remote Sens. 10, 824. doi: 10.3390/rs10060824
Keywords: UAV, image pixels, vegetation index, leaf nitrogen content, hyperspectral
Citation: Yin C, Wang Z, Lv X, Qin S, Ma L, Zhang Z and Tang Q (2024) Reducing soil and leaf shadow interference in UAV imagery for cotton nitrogen monitoring. Front. Plant Sci. 15:1380306. doi: 10.3389/fpls.2024.1380306
Received: 01 February 2024; Accepted: 25 June 2024;
Published: 16 August 2024.
Edited by:
Maribela Pestana, University of Algarve, PortugalReviewed by:
Roxana Vidican, University of Agricultural Sciences and Veterinary Medicine of Cluj-Napoca, RomaniaYahui Guo, Central China Normal University, China
Copyright © 2024 Yin, Wang, Lv, Qin, Ma, Zhang and Tang. This is an open-access article distributed under the terms of the Creative Commons Attribution License (CC BY). The use, distribution or reproduction in other forums is permitted, provided the original author(s) and the copyright owner(s) are credited and that the original publication in this journal is cited, in accordance with accepted academic practice. No use, distribution or reproduction is permitted which does not comply with these terms.
*Correspondence: Qiuxiang Tang, NzkwMDU4ODI4QHFxLmNvbQ==; Ze Zhang, Wmhhbmd6ZTEyMjdAMTYzLmNvbQ==
†These authors share first authorship