 Suyud Warno Utomo1
 Fatma Lestari
 Andrio Adiwibowo
 Fatmah
94% of researchers rate our articles as excellent or good
Learn more about the work of our research integrity team to safeguard the quality of each article we publish.
Find out more
ORIGINAL RESEARCH article
Front. Plant Sci., 30 April 2024
Sec. Sustainable and Intelligent Phytoprotection
Volume 15 - 2024 | https://doi.org/10.3389/fpls.2024.1363153
Artocarpus altilis, commonly known as breadfruit, is a potential crop adapted to a wide variety of climates and widely spread, including in Indonesia. However, information on how this species can adapt to climate change, in particular in Central Java, is still limited. In Indonesia, Central Java is the center for cultivation areas for many crop species to support the 145 million people living on Java Island. One of the potential crops being developed in Central Java is breadfruit. To assess the suitable cultivation areas for breadfruit, species distribution modeling (SDM) was used to predict the current and future (2050–2070) distribution of breadfruit. Two climate change scenarios, including optimistic RCP2.6 and pessimistic RCP8.5 models, were considered to represent future climate change impacts. Based on the results for both optimistic and pessimistic scenarios, the breadfruit’s suitable cultivation areas will expand eastward. Implementing a mitigation climate change scenario and limiting the temperature increase to only 1°C under RCP2.6 will provide 270.967 km2 more of suitable cultivation areas for breadfruit in 2050 and 133.296 km2 in 2070. To conclude, this study provides important information on the status and potential cultivation areas for breadfruit, mainly in the Southeast Asia region. The identification of suitable areas will guide land conservation for breadfruit to support food security in this region.
Artocarpus (around 70 species) is a plant genus of Moraceae native to South and Southeast Asia, with Borneo serving as a diversification hotspot. The genus contains numerous well-known medium to large tropical tree species. One of the well-known species is breadfruit [Artocarpus altilis (Parkinson ex F.A. Zorn) Fosberg]. This species is a horticultural plant (Rahmah and Waluyo, 2019). with nutritional properties similar to rice, and it is sometimes used as a substitute for rice in some regions of the world (USDA, 2018a, b). Breadfruit trees, in addition to being a prolific producer of nutritious fruits, have the potential not only to adapt, but also to thrive in conditions where other crops would perish. This plant is a staple food in the Pacific Belt and an important component of socio-cultural rituals and the medical system. Under present production standards, breadfruit growing delivers numerous environmental benefits. Breadfruit tree crops in general have been shown to provide numerous benefits, which are amplified in agroforestry settings (Barthel et al., 2013). Agroforestry can renew the soil’s litter layer, improve and maintain soil quality, retain soil nutrients, and reduce soil erosion (Gao et al., 2014; Langston and Lincoln, 2018). Artocarpus is an important staple crop that has been grown for centuries throughout Oceania under agroforestry systems. The crop’s long history and significance are reflected in language, art, and cultures. Breadfruit was recently included in Annex 1 of the International Treaty on Plant Genetic Resources (ITPGR) as one of 35 crops identified for their importance for food security and interdependence, and it is classified as a priority crop by the Global Crop Diversity Trust (http://www.croptrust.org/main/lprioritycrops.php) (Jones et al., 2012).
However, the recent trend toward deforestation, climate changes, and the inclusion of non-traditional cuisines has reduced breadfruit dependency in many Oceanian regions and influence either the breadfruit productivity or nutrient content (Erland et al., 2023). As reliance on bread fruit declines, the threat of genetic erosion grows, and many of these geographically confined cultivars face extinction. Agroforestry land uses are required for sustainable breadfruit production. In fact, current land use change has resulted in the rapid growth of deforestation due to settlement development, which has threatened and reduced the land available for agroforestry practices (Munjeb et al., 2020; Shapla et al., 2022). Deforestation can affect the breadfruit crops in indirect way through climate change impacts. Lima et al. (2022) predicted that climate change following land use changes and deforestation threatens native potential crop species as can be seen in Brazil. Climate change following deforestation is projected to cause a crop species to lose an average of 65% of its original environmentally suitable habitat (Gomes et al., 2019). According to the IPCC study (Tuddenham and Robert, 2022), human activities raise global temperatures by 1 0C over preindustrial levels. Climate change (Ma and Sun, 2018) affects crop species distribution by altering climate parameters such as temperature seasonality, yearly precipitation, and annual mean temperature, resulting in abnormally dry months. The climate has an important role in limiting crop species spread by affecting the life cycle of the crop species by lowering or increasing temperature, precipitation, and wind speed factors. These changes can have an immediate impact on crop species ecology or induce population declines, which can lead to extinction (Masson-Delmotte et al., 2019). Climate change may pose an irrevocable threat to fauna and flora, as well as humans, in the long run.
In Indonesia, breadfruits are distributed all over the country. It is known as a versatile crop since all parts of breadfruit are consumable and can be used by humans (Estalansa et al., 2018). In Indonesia, breadfruit crops were also cultivated within agroforestry systems (Elevitch and Ragone, 2018; Adinugraha et al., 2021). Breadfruit is an important crop since its production is increasing from 35,435 metric tons to 92,014 in just within seven years, covering 13,359 ha. Areas in Indonesia used for breadfruit cultivations to deal with the food security issues covering Sumatra Island, including South Sumatera, Lampung, and Jambi, and Java Island, including West, Central, East Java, D.I Yogyakarta, East Kalimantan, and eastern Indonesia, including East Nusa Tenggara and South Sulawesi (Widowati, 2009). One of the areas with potential in Indonesia for growing breadfruit crops is Central Java. Currently, the existence of agroforestry and crop species in Indonesia is threatened by rapid climate change (Santika et al., 2017; Kemen et al., 2019). One of the areas in Indonesia that is currently threatened by rapid climate change is Java Island (Higginbottom et al., 2018). Central Java is one of the areas on Java Island known for its agroforestry potential and diverse crop species (Rozaki et al., 2021), as well as for breadfruit agroforestry (Purwaningsih et al., 2020), which is recently threatened by climate change. This climate change has the potential to threaten the existence of breadfruit crops and food security. The current study on breadfruit in Indonesia and Java Island focuses mainly on diversity aspects (Rahmah and Waluyo, 2019) (Estalansa et al., 2018), and growth performance (Adinugraha et al., 2021), yet a study on how climate change can impact the potential adaptation of breadfruit is still limited.
Currently, there are a growing variety of methods for estimating habitat appropriateness and suitability, known as species distribution modeling (SDM), including MaxEnt (maximum entropy), BIOCLIM, DOMAIN, generalized additive model (GAM), GLM, and BIOMAPPER. Each tool is unique, with its own set of advantages and disadvantages. According to Marcer et al. (2013), several advantages of SDM include the need for only species presence data, the capacity to run with a limited quantity of data, the high accuracy of prediction results, the high reproducibility, and the ability to predict the most discriminating bioclimatic factors (Fois et al., 2018).
In Indonesia, SDM has been used to estimate several plant species. SDM has been used to simulate Baccaurea angulata Merr. or ‘Belimbing Dayak,’ an underutilized fruit by indigenous people in Kalimantan. This species has the potential to be exploited as both an edible fruit and a therapeutic plant. Unfortunately, the conversion of forests to oil palm and rubber plantations has affect climatic variables and reduces the habitat of B. angulata. The findings indicate that four bioclimatic variables, namely solar radiation in October, altitude, precipitation in the warmest quarter, and slope, are important in determining B. angulata’s suitable environment. The location of acceptable habitat for B. angulata corresponds to its current distribution. The potential appropriate region was substantially larger than the current distribution of B. angulata in Kalimantan. West Kalimantan and South Kalimantan were found as the most suitable places in this study. They comprised sections of Sambas, Landak, Sanggau, Sekadau, and Bengkayang in West Kalimantan Provinces, and Tanah Laut and Banjar in South Kalimantan Provinces. It is shown that the SDM was extremely accurate and informative for B. angulata habitat suitability and potential distribution. The anticipated model of appropriate sites can be used for B. angulata management, monitoring, cultivation, and future conservation (Gunawan et al., 2021). Then SDM method has potential to be used to assess the potential cultivation areas for breadfruit.
Despite the potential of breadfruit agroforestry, particularly in Central Java, there is very little information on this crop species’ potential cultivation areas and how it is whether threatened or supported by current climate changes. This information is very important considering there are 145 million people living on Java Island, and the food security of the people depends on the available crops. Here, we used a SDM approach to (1) quantify potential breadfruit cultivation areas and then (2) assess potential cultivation areas that were impacted by climate change. The results will contribute significantly to sustaining the agroforestry practices of this species over the long term.
The study area was Central Java Province located in 108.000 - 111.000 east longitude and 6.000 – 8.000 south latitude (Figure 1). Central Java sizing 32,800.69 km2 is largely hilly especially in the middle. The slope level of land in Central Java is as follows: 38% has a slope of 0-2%, 31% has a slope of 2-15%, 19% has a slope of 15-40%, and the remaining 12% has a slope of more than 40%. Central Java is primarily an agricultural region. Wet rice is the main food crop in here. Other crops farmed on small landholdings in lowland areas include corn (maize), cassava, peanuts (groundnuts), soybeans, and sweet potatoes. Terraced hillslopes and irrigated paddy fields are common landscape characteristics. For local consumption, kapok, sesame, vegetables, bananas, mangoes, durian fruits, citrus fruits, and vegetable oils are grown. Exports include tea, coffee, tobacco, rubber, sugarcane, kapok, and coconuts. The average temperature of Central Java is between 18 and 28°C, with a relative humidity of 73% to 94%. While humidity is high in most of the province’s low-lying areas, it lowers dramatically in the highest highlands. Salatiga in the middle had the highest average annual rainfall of 3990 mm, with 195 rainy days. This study covers numerous districts (Figure 1), including Indramayu, Sumedang, Majalengka, Cirebon Demak, Kendal, Batang, Semarang, and Pekalongan Districts, representing northern coastal areas, and Tasikmalaya, Ciamis, Cilacap, Kebumen, Purworejo, Kulon Progo, and Bantul, representing southern coastal areas. The interior of the studied areas, dominated by hillslopes, is represented by Boyolali, Salatiga, Magelang, Temanggung, Wonosobo, Purbalingga, Brebes, and Kuningan Districts.
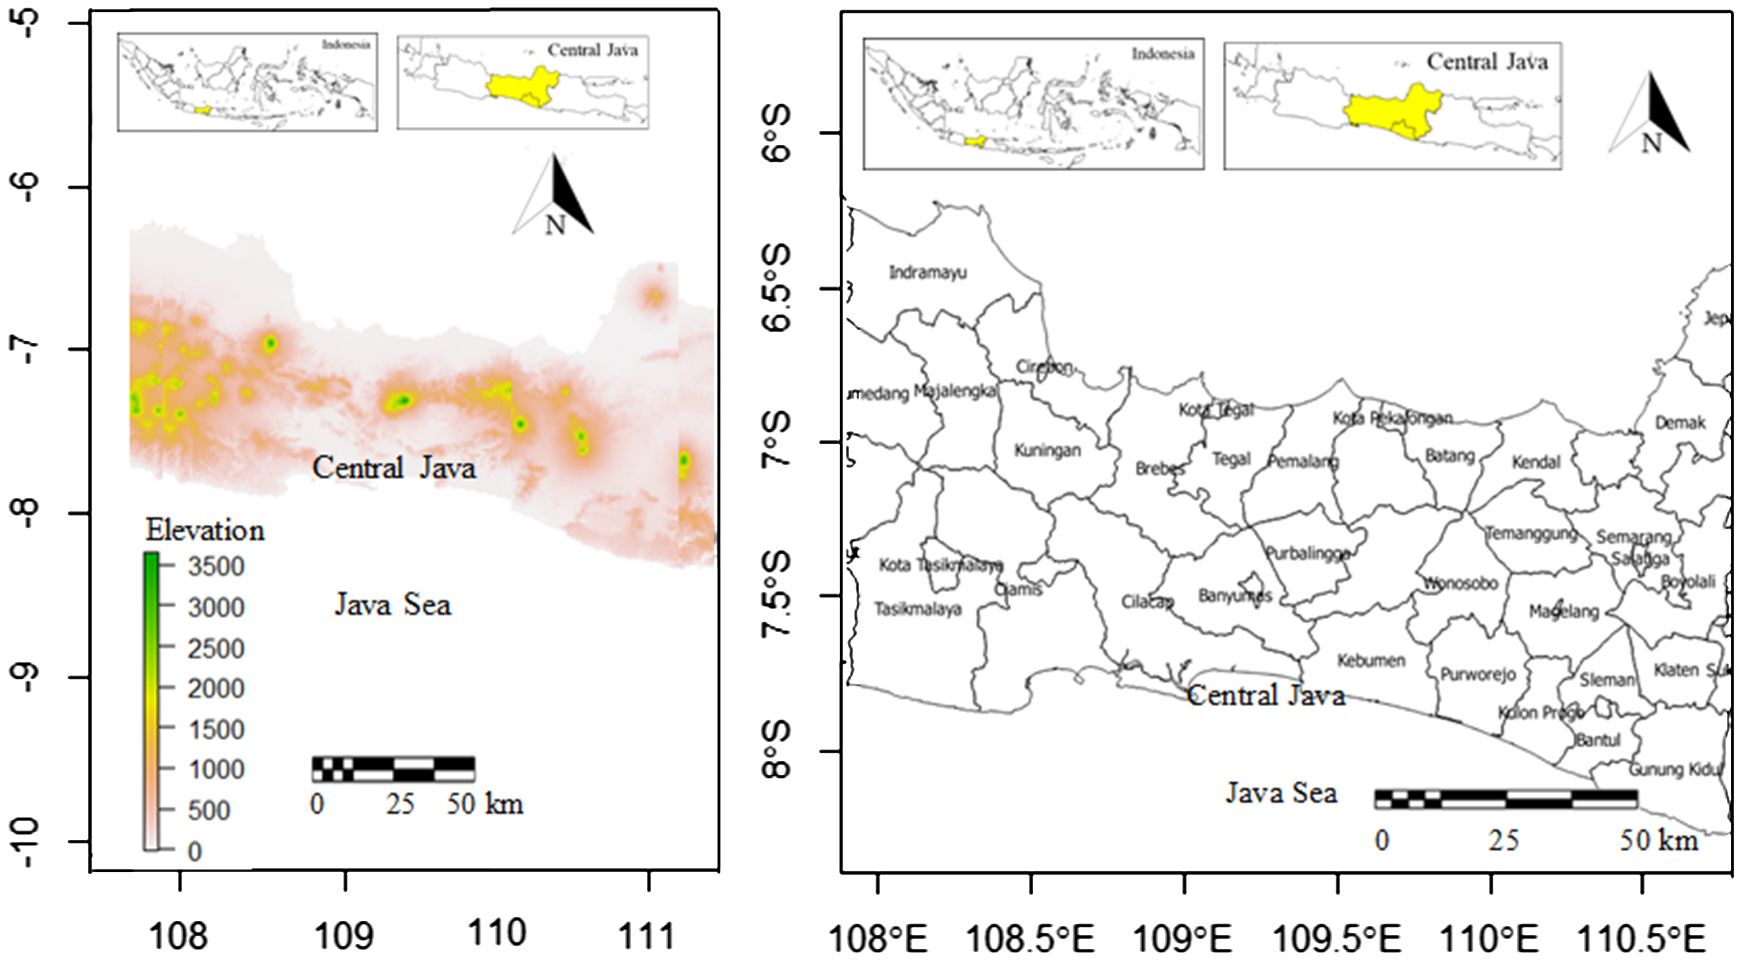
Figure 1 Locations and elevations (m) of study areas in Central Java Province, Java Island, Indonesia (left) and districts in study areas (right).
The topography of Central Java is available in Figure 1. It is clear that most of the middle parts of Central Java were dominated by mountain ranges with elevation ranges of 1500 – 3500 m. The north was dominated by the shore, and more hilly areas dominated the south of the middle parts of Central Java. The western parts have more mountainous areas in comparison to the eastern parts. The south was bordered by Java Sea.
Explorations or crop field surveys (Scrivanti and Anton, 2020; Gufi et al., 2023) were conducted in all areas of Central Java, Indonesia, to record the existence of A. altilis (Figure 2) in real time. The field location was chosen using information from the Herbarium Bogoriense and a database provided and gathered from literature reviews and the Agency for Agriculture and Forestry of Ministry for Agriculture and Forestry, Indonesia. The geographical coordinates of A. altilis occurrences in the field were recorded using the Garmin Etrex 30 type Global Position System (GPS). The data were converted into Microsoft Excel and saved in CSV format for use in SDM habitat suitability modeling.
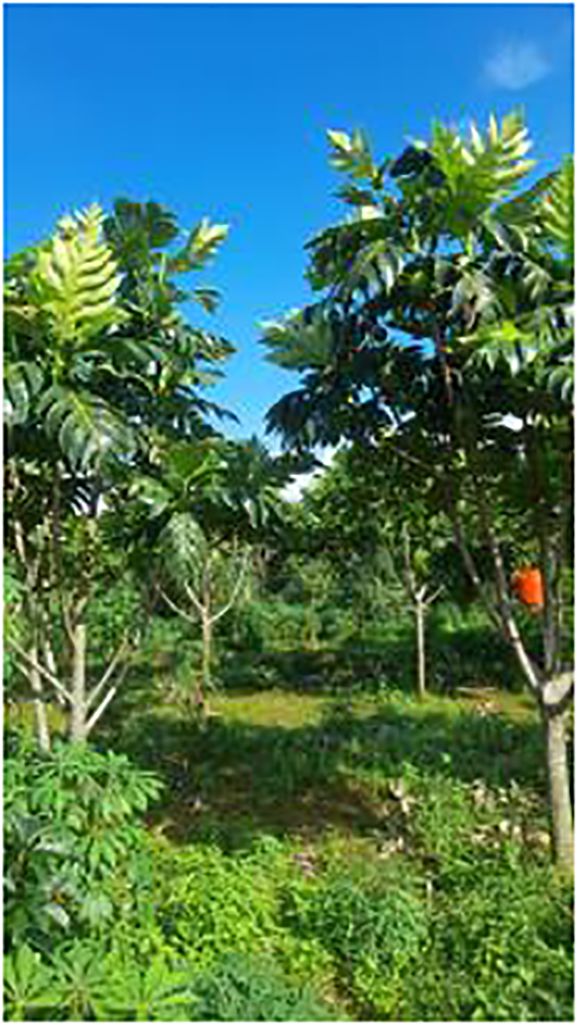
Figure 2 A. altilis crop trees in Central Java Province, Java Island, Indonesia (Photo: Suyud Warno Utomo).
This study included various bioclimatic variables (Table 1) following Dong et al. (2023) and Arshad et al. (2022). For the recent time, bioclimatic variables (Bio 1 – Bio 19) were retrieved from the global climate database WordClim (www.worldclim.org, the new version 2.0) (Hijmans et al., 2005). This database has been employed extensively in habitat suitability modeling (Khanum et al., 2013) and widely used in the Asian region (Rana et al., 2017). Bioclimatic variables were visualized as grids. These grids commonly referred to as 1-km spatial resolution and have a 30 arc-seconds spatial resolution equals to about 0.86 km2 at the equator and less elsewhere (Fick and Hijmans, 2017).
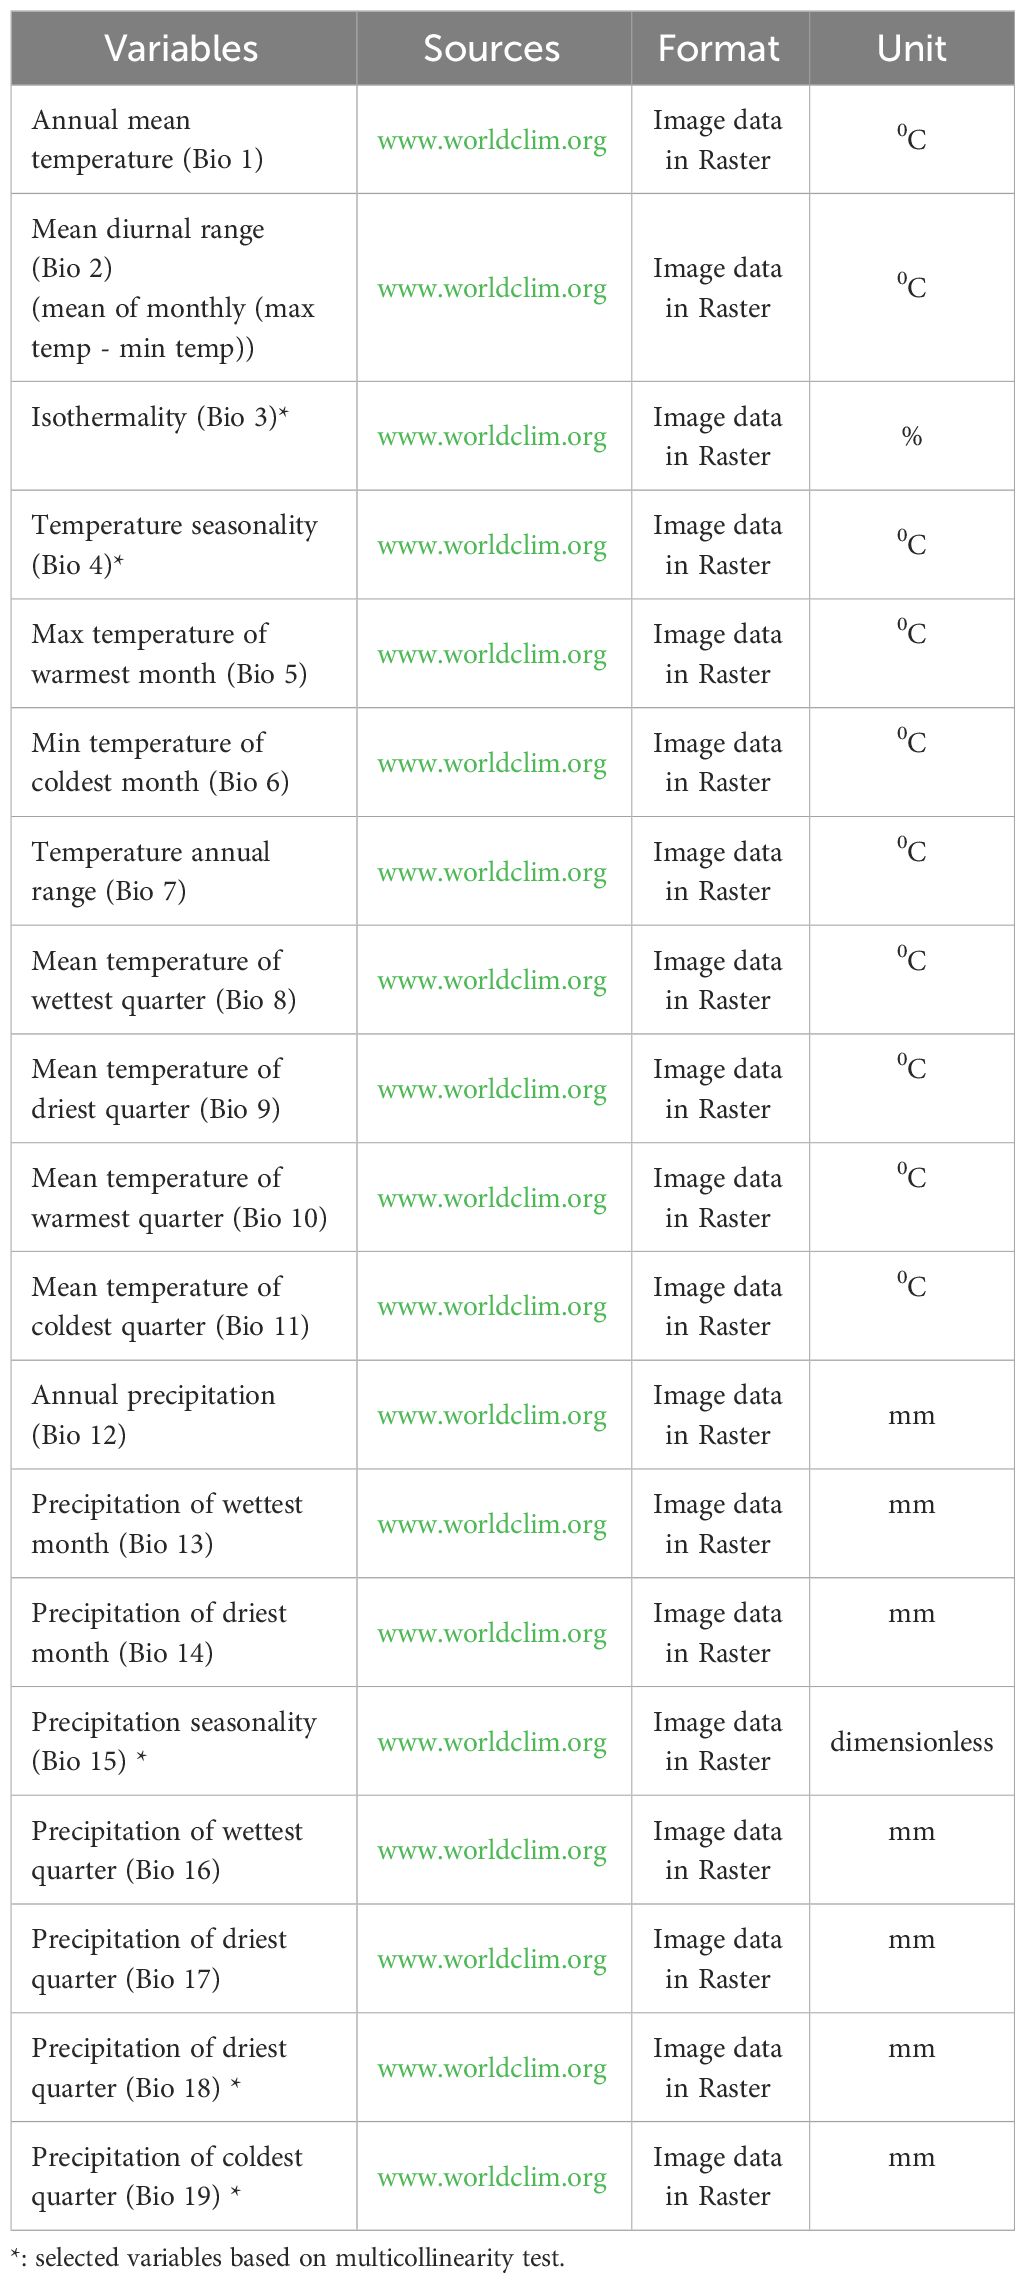
Table 1 Bioclimatic variables used in this study (Ulak and Paudel, 2021).
Those bioclimatic variables were chosen based on selection and utilization of bioclimatic variables having a significant influence in order to obtain an accurate and informative habitat suitability model. Jackknife analysis (gam_jacknife package) was used to evaluate the contribution of each bioclimatic variable to the resulting model. Some bioclimatic variables were not used due to the lack of contribution to the model making (percent contribution = 0). Those bioclimatic variables were variables with a small average contribution (<6%) or permutation importance (<6%) (Wei et al., 2018). The contribution percentage and permutation are two important factors for understanding and measuring the bioclimatic variable’s contribution as well as importance to the machine learning, geoclimate, and statistical based model.
To establish a model that has better performance with fewer variables and to avoid collinearity between the variable, a multicollinearity test using mctest package (Imdadullah et al., 2016) was performed using Pearson’s correlation tests (Préau et al., 2018) on 19 bioclimatic variables (Bio 1 – Bio 19). The variables that have highly cross-correlated variables (r2 > 0.8) were excluded and variables having r2 < 0.8 were kept for further analysis for geographical distribution modeling. If multicollinearity occurs, then a variable is strongly correlated with other variables in the model, and its predictive power is unreliable and unstable (As’ary et al., 2022). Based on the multicollinearity test, the selected environmental variables to be used were Bio 3, 4, 15, 18, and 19 (Table 1).
This study employed machine learning, geoclimate, and statistical based analysis using species modeling packages (Table 2) (Dolci and Peruzzi, 2022) within R platform version 3.6.3 (Mao et al., 2021) to generate predicted suitability cultivation areas of breadfruit across Central Java, Java Island, Indonesia. Several R packages required to develop the suitability maps include library (“sp”), library (“dismo”) (Khan et al., 2022), library (“rgdal”) (Bivand, 2022). and library (“raster”) (Lemenkova, 2020). SDM analysis is using dismo package. The inputs for model included Bio 3, 4, 15, 18, and 19 as selected variables.
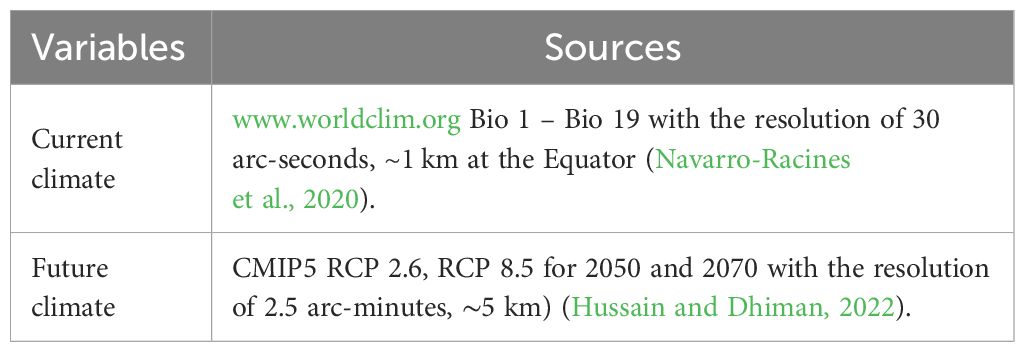
Table 2 Evaluated climate change variables in this study.
Within the model, the contribution and impact of each bioclimatic variable on the breadfruit suitable cultivation areas model were determined using a jackknife test K (Promnikorn et al., 2019), and the receiving operating curve (AUC) area was used to evaluate the performance model. According to Zhu et al. (2017), AUC values range from 0 (least appropriateness) to 1, with a value less than 0.5 indicating that the resultant model is not better than random and uninformative data, and a value greater than 1.0 indicating that the resulting model is highly good and informative.
Following that, the analysis findings from machine learning models predicting breadfruit suitable cultivation area ranges were imported into GIS for presentation and additional study (Hijmans et al., 2012). The QGIS platform version 2.16 was used in this study. According to Wei et al. (2018), habitat suitability levels on the employed machine learning model map can be classified into five suitability level included 0: unsuitable, 0-1: low suitability, 1-2: medium suitability, 2-3: high suitability, 3-4: very high suitability.
This study’s climate change analyses were based on Representative concentration pathways (RCPs). RCPs are four greenhouse gas concentration and not emission trajectories, according to the Intergovernmental Panel on Climate Change (IPCC) in its AR5 in 2014 (IPOC, 2008). This replaces the forecasts in the Special Report on Emissions Scenarios (SRES) issued in 2000 (Vuuren et al., 2009). These Coupled Model Inter-comparison Project-phase 5 (CMIP5) pathways are used in climate modeling and research to represent four possible future climates, all of which are deemed possible depending on how much greenhouse gas is emitted in the near future. The four RCPs are called after a hypothetical range of Radiative Forcing values in the year 2100 relative to pre-industrial levels ranging from + 2.6, + 4.5, + 6.0, to + 8.5 W/m2 (Weyant et al., 2009). RCP2.6 is optimistic scenario estimating about 1°C increase before the end of XXI century, RCP4.5 is moderate scenario estimating 1.8°C increase, and RCP8.5 is pessimistic, scenario estimating about 3.7°C increase (Collins et al., 2013; Alipour and Walas, 2023). Here, we selected the RCP2.6 as the minimum emission representative and RCP8.5 as the maximum emission representative models to simulate habitat suitability distributions of A. altilis in the 2050s and 2070s (Beaumont et al., 2008). SDM output for crop cultivation area suitability distribution of A. altilis were reclassified in QGIS with spatial analyst to reclassify and calculate the sizes of suitable cultivation areas in km2 based on five suitability levels.
Model evaluation and validation guarantee the reliability of modeling results, as expressed by the area under the receiver-operating characteristic (ROC) curve (AUC) obtained by the accuracy test of the ROC curve analysis method. The AUC values were between 0 and 1 and divided into several value classes. When the AUC value was lower than 0.5, the model executed was worse than contingency. When the AUC value ranges from 0.5 to 0.6, the model performance is considered poor; 0.6–0.7 is considered fair; 0.7–0.8 is considered good; 0.8–0.9 is considered very good; and 0.9–1 is considered excellent. The closer the AUC test value is to 1, the better the discrimination and the more precise and descriptive the model.
In this study, as can be seen in Table 3, all climate scenarios have the AUC greater than 0.8, among which the RCP8.5 model has the highest values. The lowest AUC value was recorded for current scenario model and RCP2.6 for 2050. The AUC results suggest that the model’s prediction accuracy could be rated as excellent. This result can therefore be used to identify the best models to represent the cultivation area suitability of breadfruit in Central Java.
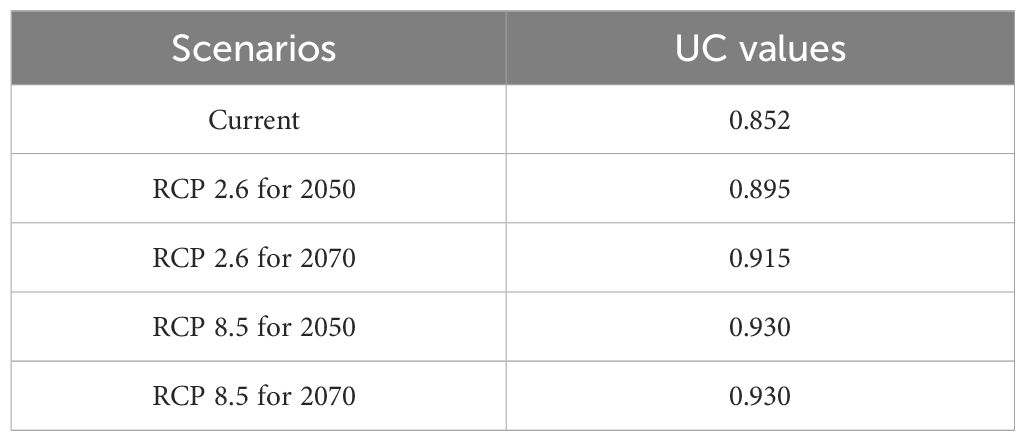
Table 3 AUC values of current and future climate scenario models for breadfruit crops Artocarpus altilis in Central Java, Indonesia.
The multicollinearity tests have resulted in selecting five determinant bioclimatic variables including Bio 3, 4, 15, 18, and 19. Those selected bioclimatic variables have varied contribution to the suitable cultivation areas of Artocarpus altilis in Central Java, Indonesia as can be seen in Table 4. From the results, precipitation seasonality followed by the precipitation of driest quarter was the bioclimatic variables that have the most contribution to the suitable cultivation areas of breadfruit with the values of 42.24% and 25.28%. While precipitation of coldest quarter followed by isothermality with the values of 2.29% and 9.19% have the lowest contribution to the distributions of suitable cultivation areas (Table 4).
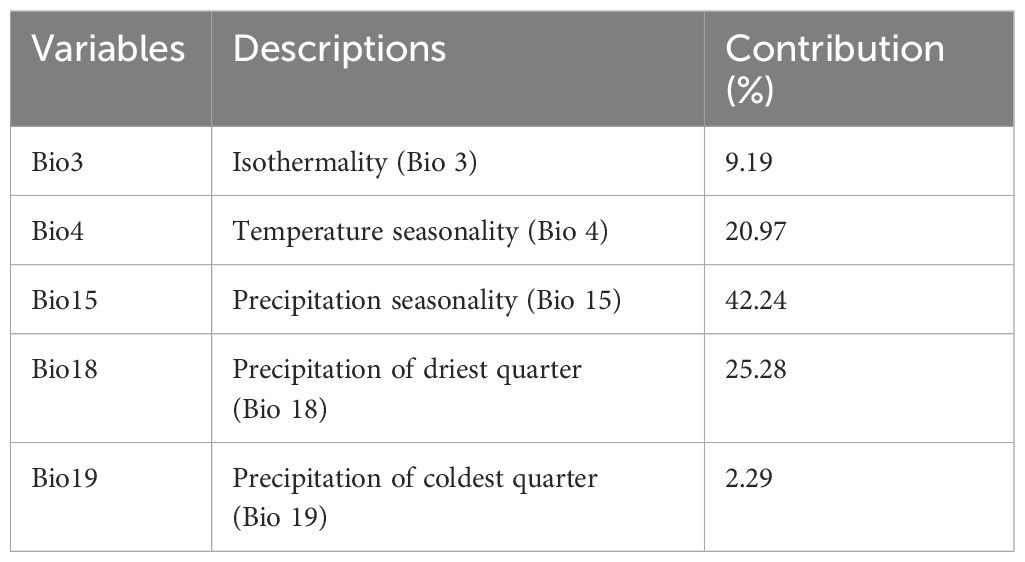
Table 4 Relative contributions of selected climatic variable to the SDM model for breadfruit crops Artocarpus altilis in Central Java, Indonesia.
The response curves show the relationships between probability of occurrence and habitat suitability level of breadfruit with each bioclimatic variable (Figure 3). The response curves of the suitable cultivation areas of breadfruit were drawn for the selected five bioclimatic factors. The existence probability of each bioclimatic factor to breadfruit showed that with the increase in the bioclimatic factor value, the existence probability showed a trend of first increasing rapidly and then decreasing slowly. In this study, the range of bioclimatic factors when the probability of suitability is greater than 0.6 was used to represent the climate characteristics of the breadfruit the suitable cultivation areas. The climate characteristics of the distribution area of breadfruit are as follows: the isothermality (Bio 3) is 77–82%, the temperature seasonality (Bio 4) is 37.0–47.0°C, the precipitation seasonality (Bio 15) is 55–65, the precipitation of driest quarter (Bio18) is 50-90 mm, and the precipitation of coldest quarter (Bio19) is 10-45 mm.
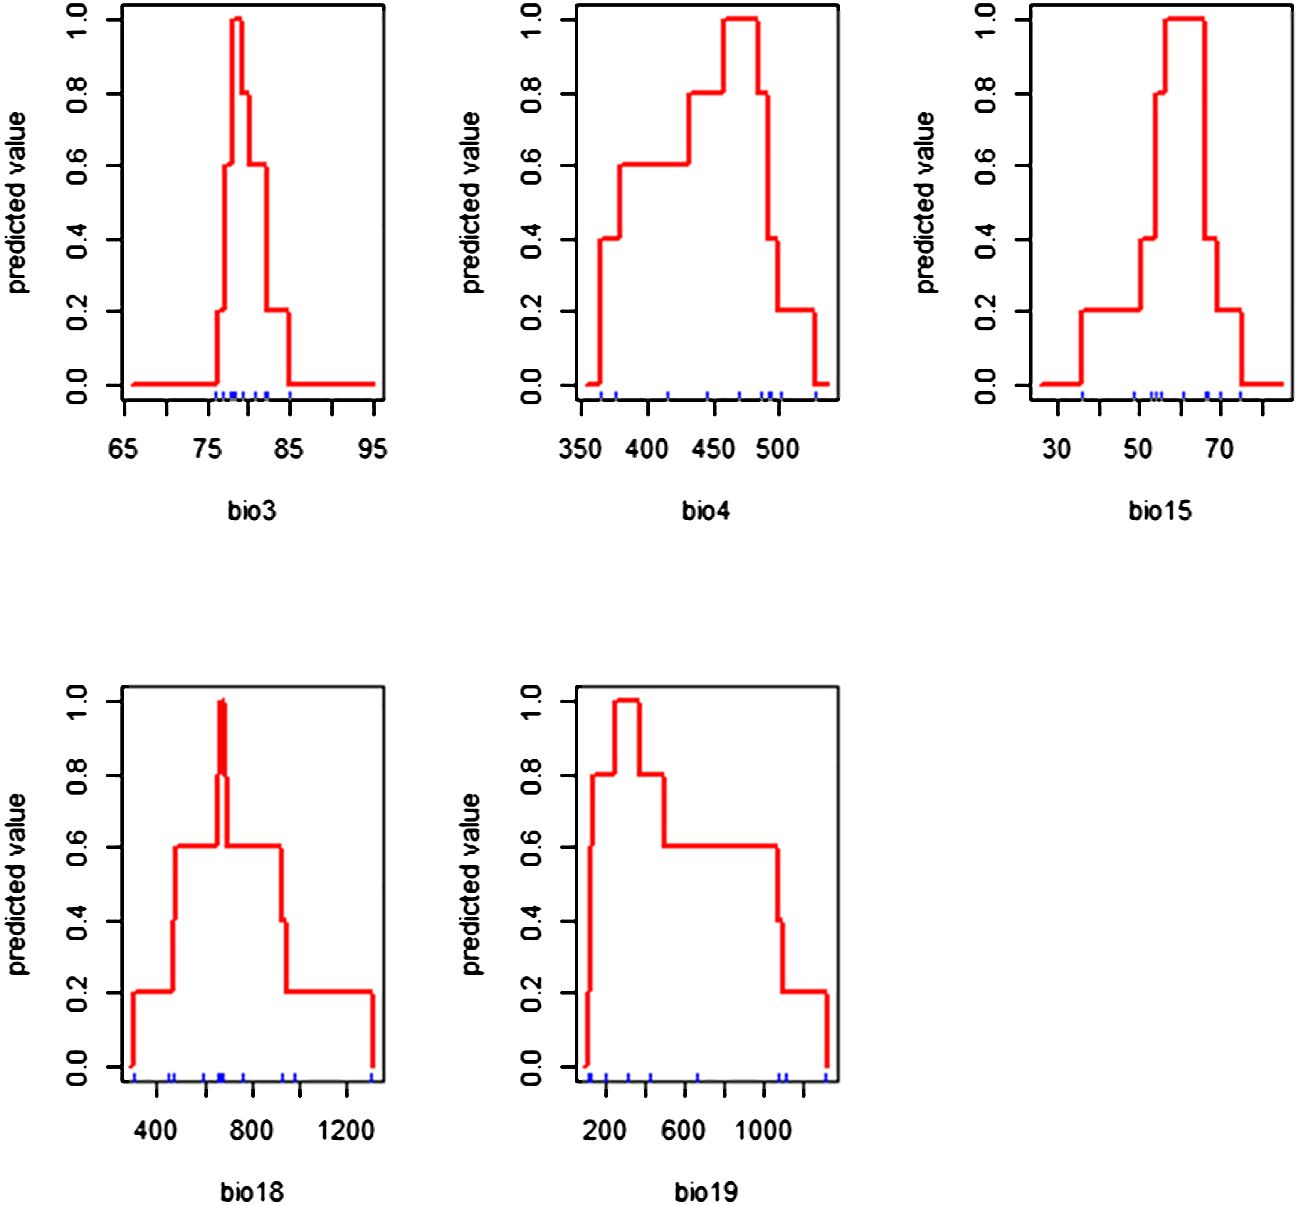
Figure 3 Response curves of Artocarpus altilis to the selected bioclimatic variables.
The potentially suitable cultivation areas of breadfruit are currently mainly distributed on the north, east, west, and south of Central Java, except in the central parts. In the west, districts classified as having very high suitability are observed in Sumedang and Majalengka, Brebes and Tegal in the north, Wonosobo, and Temanggung in the east. Large, very suitable areas are observed in the southeast, covering Magelang, Purworejo, Sleman, Boyolali, and Kulon Progo Districts. Districts located in the central parts rarely had suitable areas. The central parts of Central Java were characterized by highlands and mountainous ranges. Based on the model, this highland was not suitable for cultivating breadfruit (Figure 4). Based on the calculation, as can be seen in Table 5, suitable cultivation areas for breadfruit account for 9737.778 km2, or 28.35% of Central Java’s total area. Within size, areas categorized as high suitability were dominant and accounted for 6282.672 km2.
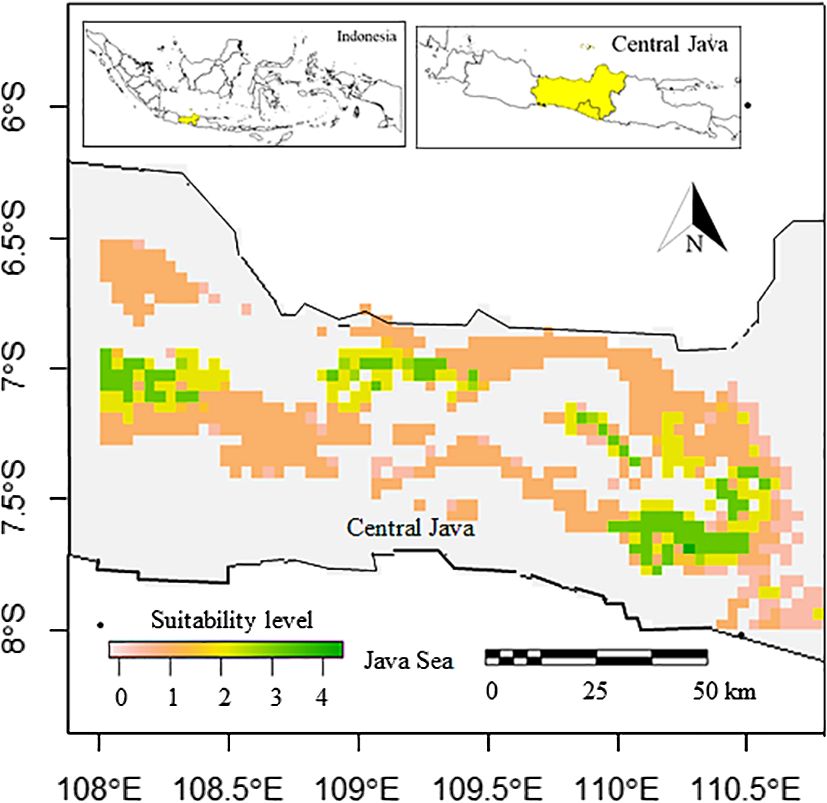
Figure 4 Current suitable cultivation areas of breadfruit crops Artocarpus altilis in several districts in Central Java, Indonesia (0-1: low suitability, 1-2: medium suitability, 2-3: high suitability, 3-4: very high suitability).
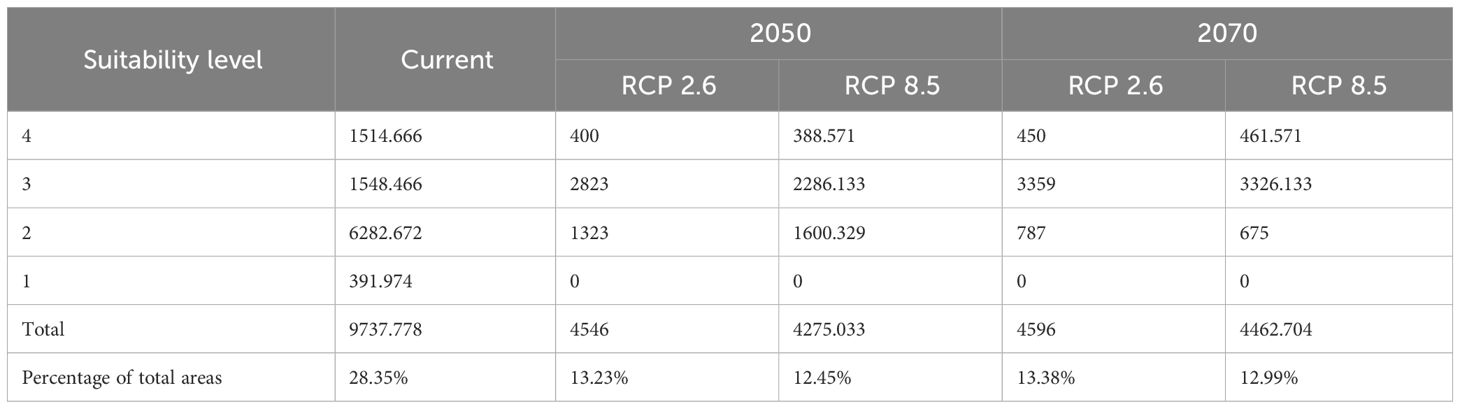
Table 5 Current and under 2070 RCP 8.5 scenario suitable cultivation areas in km2 of breadfruit crops Artocarpus altilis in Central Java, Indonesia, (1: low suitability, 2: medium suitability, 3: high suitability, 4: very high suitability levels).
The potentially suitable cultivation areas for breadfruit in 2050 were estimated to be reduced. This reduction was observed for both optimistic scenario and pessimistic scenarios. Under optimistic scenarios (Figure 5; Table 5) or known as RCP 2.6, the suitable cultivation areas currently were only available for 13.23%. The suitable areas were only limited to north, east, and southeast parts of Central Java. All districts previously suitable for breadfruit in the west were not suitable and shifted eastward to the Kendal District on the north coast and Kulon Progo District in the southeast. While, under pesimistic scenarios or known as RCP8.5, the suitable cultivation areas currently were only available for 12.45% or lower than optimistic RCP2.6 scenario. The suitable areas were only limited to north and east parts of Central Java. For both scenarios and contrast to current scenarios, areas categorized as medium suitability were dominating and larger than other suitability levels. Implementing mitigation climate change scenario and limit the temperature increase to only 1°C will provide 270.967 km2 more of suitable cultivation areas for breadfruit.
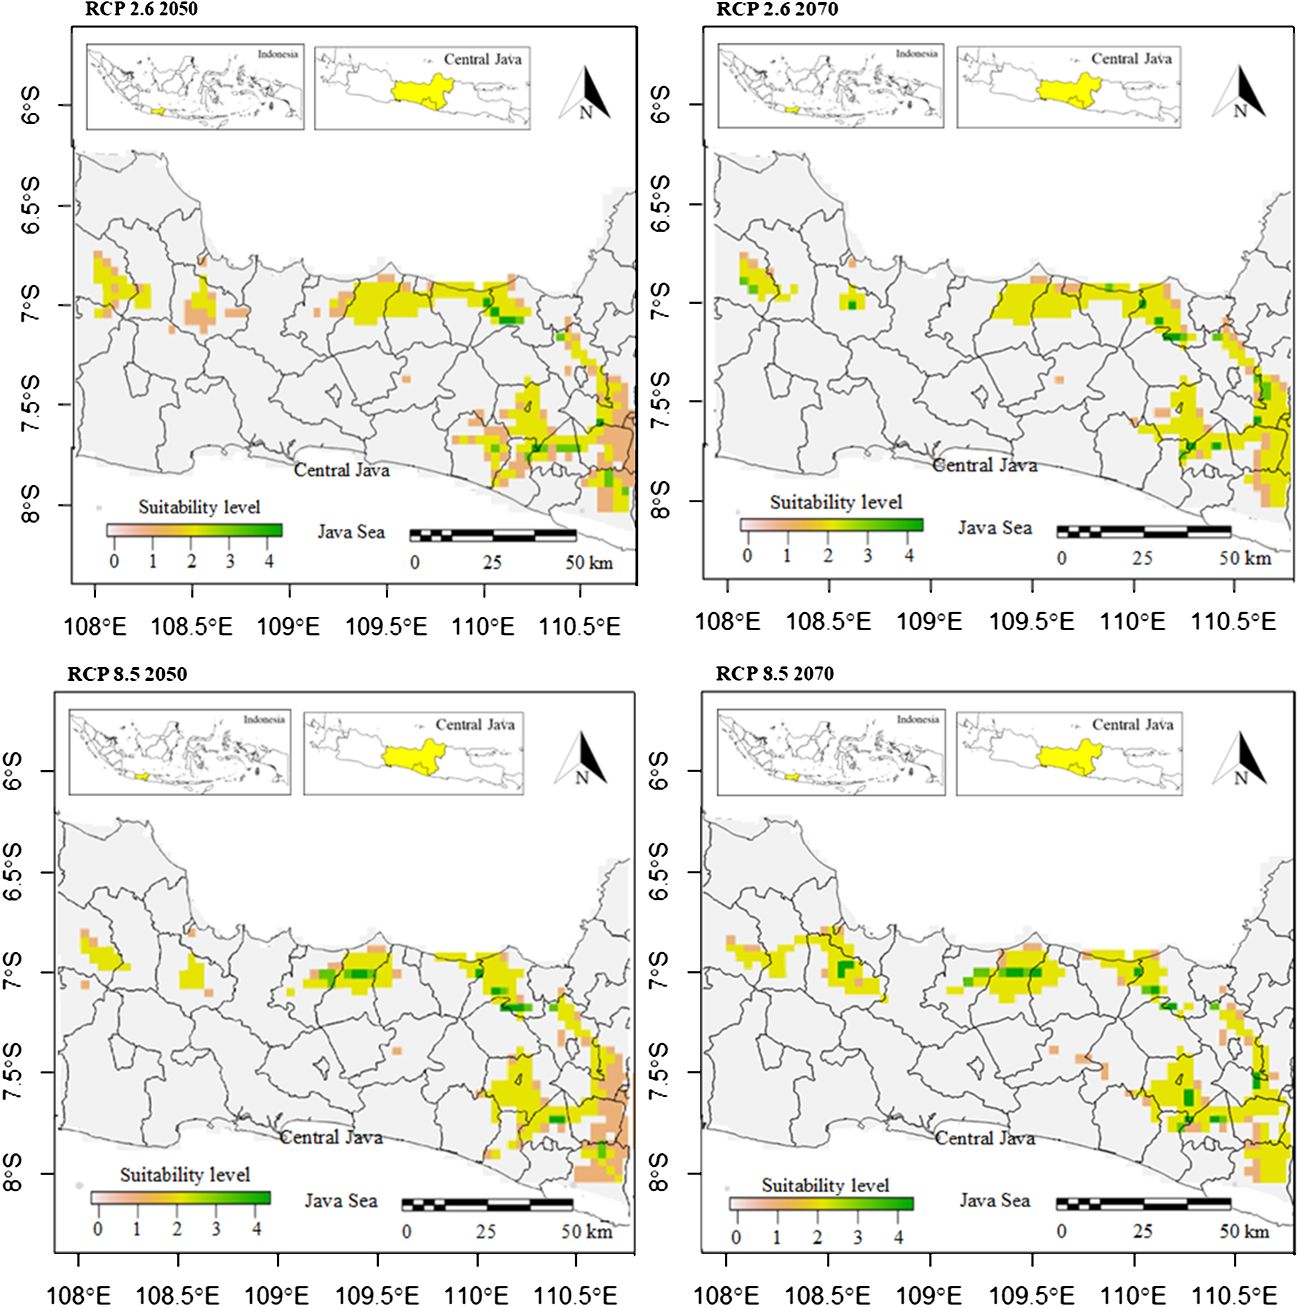
Figure 5 Future suitable cultivation areas of breadfruit crops Artocarpus altilis in several districts in Central Java, Indonesia under current and future 2050-2070 RCP2.6 and 2050-2070 RCP8.5 scenarios (0-1: low suitability, 1-2: medium suitability, 2-3: high suitability, 3-4: very high suitability).
The potentially suitable cultivation areas for breadfruit in 2070 were estimated to increase. This increase was observed for both optimistic and pessimistic scenarios. Under optimistic scenarios (Figure 5; Table 5) or known as RCP2.6, the suitable cultivation areas are currently only available for 13.38% or will increase up to 50 km2 by 2050. While, under pessimistic scenarios, known as RCP8.5, the suitable cultivation areas are currently only available for 12.99% or lower than the optimistic RCP2.6 scenario. The suitable areas were only limited to the north and east parts of Central Java. Kulon Progo District in the southeast, which was previously considered suitable for breadfruit in 2050, is now not considered suitable in 2070. Under RCP8.5, the suitable cultivation areas increased by 187.671 km2. Implementing a mitigation climate change scenario and limiting the temperature increase to only 1°C will provide 133.296 km2 more of suitable cultivation areas for breadfruit in 2070. In the year 2070, for both scenarios, the medium suitable areas were reduced and replaced with high suitable areas (Figure 6). This condition was observed in the eastern parts of Central Java. Highlands in Boyolali that were suitable for breadfruit under the current scenario now, in 2070, become suitable again. Under the optimistic model, high suitability areas increased up to 536 km2 and 1040 km2 for the pessimistic model, replacing the medium suitability areas in the east parts.
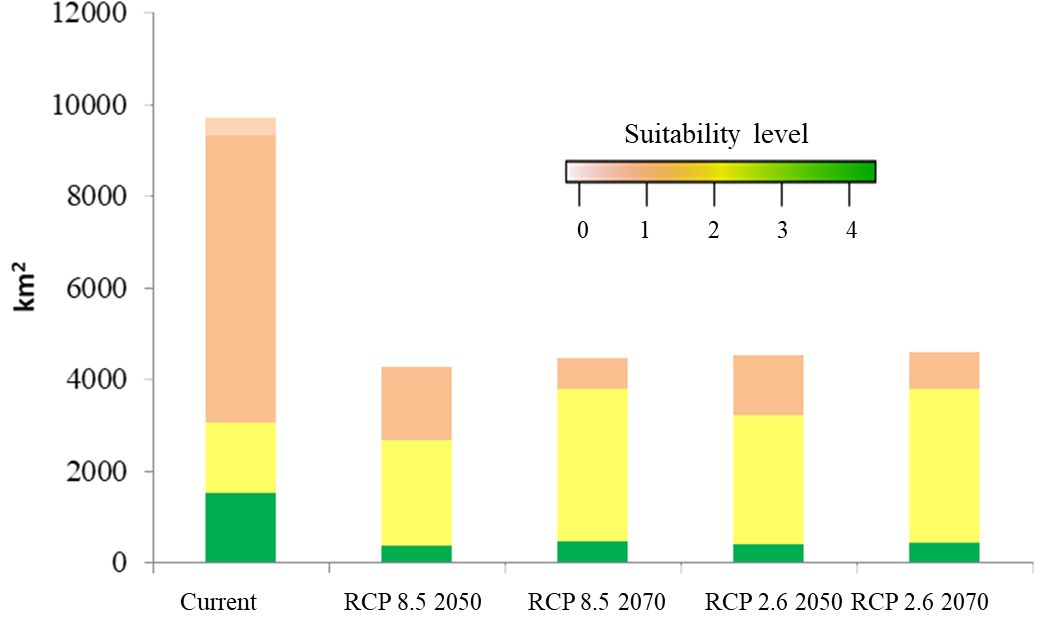
Figure 6 Compositions of suitable cultivation areas of breadfruit crops Artocarpus altilis in Central Java, Indonesia under current and future 2050-2070 RCP2.6 and 2050-2070 RCP8.5 scenarios (0-1: low suitability, 1-2: medium suitability, 2-3: high suitability, 3-4: very high suitability).
The A. altilis presences recorded during the surveys were parts of the agroforestry systems. This finding is in agreement with previous study that clarifies agroforestry are crucial for the breadfruit cultivation practices (Siarudin et al., 2021). In this study, the method to assess the potential cultivation areas for expanding breadfruit is using SDM. The use of this method contributed to better conserve breadfruit habitat using the following approach, first it provided key bioclimatic variables highly correlated with breadfruit distribution. Second, SDM model was developed to quantify the relationship between breadfruit presence and the selected bioclimatic variables including its inverse variables, as reported in this study was climate change (Yi et al., 2016). The uses of SDM in this study to assess the impacts of climate changes on the potential distribution of vegetation were in agreement with the previous study (Ali et al., 2023; Daï et al., 2023).
This study confirmed that Bio 3, Bio 4, Bio 15, and Bio 18 are some fundamental bioclimatic variables shaping the tree species distribution, as reported before (Ali et al., 2023). Those bioclimatic variables were related to the temperature and precipitation aspects. The roles of these climatic variables are very prominent in the distribution of breadfruit in Central Java. Precipitation in the warmest quarter was detected as the leading variable in the distribution of tree species (Rathore et al., 2019). Similarly, isothermality represents the proportion of the mean diurnal range to the annual temperature range. Hence, day and night and summer and winter temperature differences strongly influence the considered tree species. This means that the predicted eastward niche shift for breadfruit in the Central Java region would be chiefly influenced by temperature and precipitation variations. Similar findings were also reported by Su et al. (2005) and Li et al. (2019), who communicated the role of temperature and precipitation factors in tree species distribution. Breadfruit-suitable cultivation areas are expected to expand due to precipitation. Increased precipitation during the driest quarter and overall increases in annual precipitation cause the prospective expansion of suitable breadfruit areas at the periphery of the baseline acceptable range (Zhao et al., 2020; Yang et al., 2022).
Temporal and climate change dimensions can have potential impacts on vegetation spatial distributions. The impacts can increase the size of distributions or reduce them. In this study, the temporal variation causes an increase in suitable cultivation areas by the year 2070 for both climate change scenarios. By comparing the emission strategies, lowering the emissions will lead to more suitable cultivation areas. This finding confirming the implementation of RCP2.6 will increase suitable areas and RCP8.5 will cause decline was in accordance with the precious study on vegetation (Yu et al., 2023) and particular breadfruit (Yang et al., 2022). According to recent studies, in Southeast Asia, 80.7% of the region, or 3.6 million km2, is considered good for breadfruit, while 77.4%, or 2.8 million km2, is considered fair. A recent study also confirmed the adaptability of breadfruit against climate change scenarios. In the Southeast Asia region, the breadfruit-suitable area primarily persists and even increases by 0.7%, or equal to 23000 km2, under the RCP2.6 scenario and by 0.8%, or 30000 km2, under the RCP8.5 scenario. A study from the tropical Hawaii Islands (Mausio et al., 2020) confirmed successive increases in breadfruit suitability in the RCP4.5 and RCP8.5 scenarios, with an increase of 27% for RCP4.5 and 89% and for RCP8.5, respectively. Then, it concludes that breadfruit is a potential crop at least until 2070 that can adapt to climate change situations in which the optimum results can be gained by investing more in climate change mitigation strategies.
The shifting of breadfruit to the east under climate change, where eastern parts of central Java have higher temperatures, is in agreement with the current predictions. Breadfruit is considered a crop that can deal with the warming environment due to climate change. However, the potential areas are fragmented. Despite the fact that the east and southeast of central Java are predicted to provide suitable habitats for breadfruit, this area is dominated by mountain ranges. These mountain ranges can provide physical barriers to breadfruit seed dispersal (Qiong et al., 2017). Despite that, the mountain environment has specific local climate characteristics (Porceddu et al., 2020) that limit the presence of breadfruit in some mountainous areas in central Java. The shifting of breadfruit to the east, followed by a reduction some potential habitats, is in agreement with previous studies. In low-altitude areas that are located in the subtropical and tropical regions, climate change will significantly contribute to the reduction of suitable areas of staple crops compared to the crops raised in the higher latitudes (Levis et al., 2018).
The shifting of breadfruit expansions as modeled in this study will lead to ecological and socioeconomic impacts. The model shows that some areas that were previously suitable for breadfruit will disappear, especially in the western region. The reduction of suitable areas will then impose food security in certain areas. In contrast, the expansion of breadfruit eastward will provide opportunities for using breadfruit as an alternative crop in the eastern regions of Southeast Asia. This will mitigate the food security issues in those areas.
In this study, we selected Central Java as the study area, considering that the A. altilis grown in this area has been recognized as an agricultural geographical indication product by the Ministry of Agriculture of Indonesia’s Government, and the high quality of breadfruit grown in this area has been recognized by the market and community. Despite the fact that this study has identified a vast potential area suitable for breadfruit, the Central Java areas were threatened by land conversions and deforestations (Prasetyo et al., 2013), which resulted in potential agricultural lands being converted into settlements. This study does not include the land conversion variables. This may result in a vast potential area for breadfruit, which may be reduced significantly due to those land conversions.
In this study, we modeled the current spatial distribution of A. altilis potential cultivation areas, tested the key bioclimatic indicators combined with climate change that could potentially affect distribution, and simulated its suitable cultivation areas. Our results show that the potential cultivation areas of A. altilis follow mostly the precipitation seasonality (Bio 15), precipitation of the driest quarter (Bio 18), and temperature seasonality (Bio 4) gradients. As hypothesized by previous studies, the spatial distribution of A. altilis has the potential to expand by the year 2070 despite its area reductions in the current climate. As can be seen under both optimistic and pessimistic scenarios, the suitable cultivation areas categorized as having high suitability will expand eastward. These expansions will add 536 km2 of high-suitability areas under RCP2.6 and 1040 km2 for RCP8.5 in 2070. Implementing a mitigation climate change scenario and limiting the temperature increase to only 1°C will provide 270.967 km2 more of suitable cultivation areas for breadfruit in 2050 and 133.296 km2 in 2070.
The model indicating the potential habitats for breadfruit that are resilient to climate change is mostly in the east of central Java. Then, to anticipate this, the local agriculture authorities are urged to have some preparation. Considering that Java Island is threatened by rapid deforestation and land use changes, regions in the eastern parts considered to have high suitability should be protected immediately from logging, mainly in Kendal District, which is predicted to have the most suitable habitats under climate change. Due to the fact that intensive breadfruit plantations may also lead to logging, alternative solutions should be considered. One alternative that can be taken is agroforestry. In this scenario, breadfruit is grown together with the native woody species.
The original contributions presented in the study are included in the article/supplementary material. Further inquiries can be directed to the corresponding author.
SU: Conceptualization, Writing – review & editing. FL: Conceptualization, Writing – review & editing. AA: Software, Writing – original draft. F: Conceptualization, Writing – review & editing. MRF: Conceptualization, Writing – review & editing. HQ: Project administration, Writing – review & editing.
The author(s) declare financial support was received for the research, authorship, and/or publication of this article. This research was funded by Universitas Indonesia through PUTI Q2 scheme with grant number of NKB-1288/UN2.RST/HKP.05.00/2022.
The authors declare that the research was conducted in the absence of any commercial or financial relationships that could be construed as a potential conflict of interest.
All claims expressed in this article are solely those of the authors and do not necessarily represent those of their affiliated organizations, or those of the publisher, the editors and the reviewers. Any product that may be evaluated in this article, or claim that may be made by its manufacturer, is not guaranteed or endorsed by the publisher.
Adinugraha, H. A., Setiadi, D., Santoso, H. B., Kartikawati, N. K. (2021). Growth performance and fruiting of breadfruit (Artocarpus altilis) clonal plantation at vertic soil area in Gunungkidul, Yogyakarta for conservation strategy. IOP. Conf. Ser.: Earth Environ. Sci. 739, 12067. doi: 10.1088/1755-1315/739/1/012067
Ali, F., Khan, N., Khan, A. M., Ali, K., Abbas, F. (2023). Species distribution modelling of Monotheca buxifolia (Falc.) A. DC.: Present distribution and impacts of potential climate change. Heliyon 9, e13417. doi: 10.1016/j.heliyon.2023.e13417
Alipour, S., Walas, Ł. (2023). The influence of climate and population density on Buxus hyrcana potential distribution and habitat connectivity. J. Plant Res. 136, 501–514. doi: 10.1007/s10265-023-01457-5
Arshad, F., Waheed, M., Fatima, K., Harun, N., Iqbal, M., Fatima, K., et al. (2022). Predicting the suitable current and future potential distribution of the native endangered tree Tecomella undulata (Sm.) Seem. in Pakistan. Sustainability 14, 7215. doi: 10.3390/SU1412721
As’ary, M., Setiawan, Y., Rinaldi, D. (2022). Analysis of changes in habitat suitability of the Javan Leopard 2000–2020. Diversity 15, 529. doi: 10.3390/d15040529
Barthel, S., Crumley, C., Svedin, U. (2013). Bio-Cultural Refugia—safeguarding diversity of practices for food security and biodiversity. Glob. Environ. Change 23, 1142–1152. doi: 10.1016/j.gloenvcha.2013.05.001
Beaumont, L. J., Hughes, L., Pitman, A. J. (2008). Why is the choice of future climate scenarios for species distribution modelling important? Ecol. Lett. 11, 1135–1146. doi: 10.1111/j.1461-0248.2008.01231.x
Bivand, R. (2022). R packages for analyzing spatial data: a comparative case study with areal data. Geographical. Anal. 54. doi: 10.1111/GEAN.12319
Collins, M., Knutti, R., Arblaster, J., Dufresne, J. L., Fichefet, T., Friedlingstein, P., et al. (2013). “Long-term climate change: projections, commitments and irreversibility,” in Intergovernmental panel on climate change. Climate change 2013-the physical science basis: contribution of working group I to the fifth assessment report of the intergovernmental panel on climate change. Eds. Stocker, T. F., Qin, D., Plattner, G. K., Tignor, M., Allen, S. K., Boschung, J., et al (New York: Cambridge University Press), 1029–1113.
Daï, E. H., Houndonougbo, J. S. H., Idohou, R., Ou´edraogo, A., Kakaï, R. G., Hotes, S. A., et al. (2023). Modeling current and future distribution patterns of Uvaria chamae in Benin (West Africa): Challenges and opportunities for its sustainable management. Heliyon 9, e13658. doi: 10.1016/j.heliyon.2023.e13658
Dolci, D., Peruzzi, L. (2022). Assessing the effectiveness of correlative ecological niche model temporal projection through floristic data. Biology 11, 1219. doi: 10.3390/biology11081219
Dong, H., Zhang, N., Shen, S., Zhu, S., Fan, S., Lu, Y. (2023). Effects of climate change on the spatial distribution of the threatened species Rhododendron purdomii in Qinling-Daba Mountains of Central China: implications for conservation. Sustainability 15, 3181. doi: 10.3390/su15043181
Elevitch, C., Ragone, D. (2018). Breadfruit Agroforestry Guide: Planning and implementation of regenerative organic methods. (Holualoa, Hawaii: Breadfruit Institute of the National Tropical Botanical Garden, Kalaheo, Hawaii and Permanent Agriculture Resources), 72.
Erland, L., Needham, A., Kehinde, A., debowale, A., Lincoln, N., Ragone, D., et al. (2023). Impact of microclimate on Artocarpus altilis (Parkinson) Fosberg var Ma’afala fruit and nutritional quality. J. Food Composition. Anal. 115, 104983. doi: 10.1016/j.jfca.2022.104983
Estalansa, H., Yuniastuti, E., Hartati, S. (2018). The diversity of breadfruit plants (Artocarpus altilis) based on morphological characters. Agrotech. Res. J. 2, 80–85. doi: 10.20961/agrotechresj.v2i2.21800
Fick, S. E., Hijmans, R. J. (2017). WorldClim 2: new 1 km spatial resolution climate surfaces for global land areas. Int. J. Climatol. 37, 4302–4431. doi: 10.1002/joc.5086
Fois, M., Cuena-Lombraña, A., Fenu, G., Bacchetta, G. (2018). Using species distribution models at a local scale to guide poorly known species, review: methodological issues and future directions. Ecol. Model. 385, 124–132. doi: 10.1016/j.ecolmodel.2018.07.018
Gao, J., Barbieri, C., Valdivia, C. (2014). A socio-demographic examination of the perceived benefits of agroforestry. Agrofor. Syst. 88, 301–309. doi: 10.1007/s10457-014-9683-8
Gomes, V. H. F., Vieira, I. C. G., Salomão, R. P. (2019). Amazonian tree species threatened by deforestation and climate change. Nat. Clim. Change 9, 547–553. doi: 10.1038/s41558-019-0500-2
Gufi, Y., Manaye, A., Tesfamariam, B., Abrha, H., Tesfaye, M., Hintsa, S. (2023). Modeling impacts of climate change on the geographic distribution and abundances of Tamarindus indica in Tigray region, Ethiopia. Heliyon 9, e17471. doi: 10.1016/j.heliyon.2023.e17471
Gunawan, S., Chikmawati, T., Sobir (2021). Predicting suitable areas for Baccaurea angulata in Kalimantan, Indonesia using MaxEnt Modelling. Biodiversitas 22, 2646–2653. doi: 10.13057/biodiv/d220523
Higginbottom, T., Collar, N., Symeonakis, E., Marsden, S. (2018). Deforestation dynamics in an endemic-rich mountain system: Conservation successes and challenges in West Java 1990–2015. Biol. Conserv. 229, 152–159. doi: 10.1016/j.biocon.2018.11.017
Hijmans, R. J., Cameron, S. E., Parra, J. L., Jones, P. G., Jarvis, A. (2005). Very high resolution interpolated climate surfaces for global land areas. Int. J. Climatol. 25, 1965–1978. doi: 10.1002/JOC.1276
Hijmans, R. J., Guarino, L., Mathur., P. (2012). Diva-GIS Version 7.5 Manual. Accessed from: https://www.diva-gis.org/docs/DIVA-GIS_manual_7.pdf. Publisher: DIVA-GIS.
Hussain, S. A., Dhiman, R. C. (2022). Distribution expansion of dengue vectors and climate change in India. Geohealth 6, 1–11. doi: 10.1029/2021GH000477
Imdadullah, M., Aslam, M., Altaf, S. (2016). mctest: An R package for detection of collinearity among regressors. R. J. 8, 495–505. doi: 10.32614/RJ-2016-062
IPOC (2008). Towards new scenarios for analysis of emissions, climate change, impacts, and response strategies. Environ. Policy Collect. (Geneva, Switzerland: The Intergovernmental Panel on Climate Change (IPCC)) 5, 399–406. Available at: https://archive.ipcc.ch/pdf/supporting-material/expert-meeting-report-scenarios.pdf.
Jones, A., Murch, S., Wiseman, J., D. Ragone, D. (2012). Morphological diversity in breadfruit (Artocarpus, Moraceae): Insights into domestication, conservation, and cultivar identification. Genet. Resour. Crop Evol. 60, 175–192. doi: 10.1007/s10722-012-9824-8
Kemen, G. A., Schwantes, A., Gu, Y., Kasibhatla, P. S. (2019). What causes deforestation in Indonesia? Environ. Res. Lett. 14, 024007. doi: 10.1088/1748-9326/aaf6db
Khan, A. M., Li, Q., Saqib, Z., Khan, N., Habib, T., Khalid, N., et al. (2022). Maxent modelling and impact of climate change on habitat suitability variations of economically important Chilgoza pine (Pinus gerardiana Wall.) in South Asia. Forests 13, 715. doi: 10.3390/F13050715
Khanum, R., Mumtaz, A., Kumar, S. (2013). Predicting impacts of climate change on medicinal asclepiads of Pakistan using Maxent modeling. Acta Oecol. 49, 23–31. doi: 10.1016/J.ACTAO.2013.02.007
Langston, B. J., Lincoln, N. K. (2018). The role of breadfruit in biocultural restoration and sustainability in Hawai’i. Sustainability 10, 3965. doi: 10.3390/su10113965
Lemenkova, P. (2020). Using R Packages ‘tmap’, ‘raster’ and ‘ggmap’ for cartographic visualization: an example of DEM-based terrain modelling of Italy, Apennine Peninsula. ZbornikRadova. – Geografski. FakultetUniverziteta. U. Beogradu. 68, 99–116. doi: 10.5937/ZRGFUB2068099L
Levis, S., Badger, A., Drewniak, B., Nevison, C., Ren, X. (2018). CLMcrop yields and water requirements: avoided impacts by choosing RCP 4.5 over 8.5. Climatic. Change 146, 501–515. doi: 10.1007/s10584-016-1654-9
Li, P., Zhu, W., Xie, Z., Qiao, K. (2019). Integration of multiple climate models to predict range shifts and identify management priorities of the endangered Taxus wallichiana in the Himalaya–Hengduan Mountain region. J. For. Res. 31, 2255–2272. doi: 10.1007/s11676-019-01009-5
Lima, V. P., de Lima, R. A. F., Joner, F. (2022). Climate change threatens native potential agroforestry plant species in Brazil. Sci. Rep. 12, 2267. doi: 10.1038/s41598-022-06234-3
Ma, B., Sun, J. (2018). Predicting the distribution of Stipa purpurea across the Tibetan Plateau via the MaxEnt model. BMC Ecol. 18, 10. doi: 10.1186/s12898-018-0165-0
Mao, M., Chen, S., Qian, Z., Xu, Y. (2021). Using Maxent to predict the potential distribution of the little fire ant (Wasmannia auropunctata) in China. Insects 13, 8. doi: 10.3390/INSECTS13111008
Marcer, A., Sáe, L., Molowny-Horas, R., Pons, X., Pino, J. (2013). Using species distribution modelling to disentangle realised versus potential distributions for rare species conservation. Biol. Cons. 166, 221–230. doi: 10.1016/j.biocon.2013.07.001
Masson-Delmotte, V., Pörtner, H. O., Skea, J., Zhai, P., Roberts, D., Shukla, P. R. (2019). Réchauffement planétaire de 1, 5 C. Rapport spécial du GIEC sur les conséquences d’un réchauffement planétaire de 1, 5 C par rapport aux niveaux préindustriels et les trajectoires associées d’émissions mondiales de gaz à effet de serre dans le contexte du renforcement de la parade mondiale au changement climatique, du développement durable et de la lutte contre la pauvreté. Résumé à l’intention des décideurs. (Geneva, Switzerland: The Intergovernmental Panel on Climate Change (IPCC)). Available at: https://www.ipcc.ch/site/assets/uploads/sites/2/2019/09/IPCC-Special-Report-1.5-SPM_fr.pdf.
Mausio, K., Miura, T., Lincon, N. K. (2020). Cultivation potential projections of breadfruit (Artocarpus altilis) under climate change scenarios using an empirically validated suitability model calibrated in Hawai’i. PloS One 15, e0228552. doi: 10.1371/journal.pone.0228552
Munjeb, N., Louise, A., Nfor, J., Kfuban, Y., Harmand, J. (2020). Dynamics of land use and the evolution of agroforestry practices in the Dja Biosphere Reserve (DBR) Southeast Cameroon. J. Geosci. Environ. Prot. 8, 346–358. doi: 10.4236/gep.2020.85022
Navarro-Racines, C., Tarapues, J., Thornton, P. (2020). High-resolution and bias-corrected CMIP5 projections for climate change impact assessments. Sci. Data 7, 7. doi: 10.1038/s41597-019-0343-8
Porceddu, M., Pritchard, H. W., Mattana, E., Bacchetta, G. (2020). Differential interpretation of mountain temperatures by endospermic seeds of three endemic species impacts the timing of in situ germination. Plants (Basel Switzerland). 9, 1382. doi: 10.3390/plants9101382
Prasetyo, L. B., Wijaya, C. I., Setiawan, Y. (2013). Spatial model approach for deforestation: case study in Java Island, Indonesia. Geographic Information Systems: Concepts, Methodologies, Tools, and Applications (Hershey, Pennsylvania, USA: Information Resources Management Association, IGI Global), 1901–1912. doi: 10.4018/978-1-4666-2038-4.ch113
Préau, C., Trochet, A., Bertrand, R., Isselin-Nondedeu, F. (2018). Modeling potential distributions of three European amphibian species comparing ENFA and Maxent. Herpetol. Conserv. Biol. 13, 91–104.
Promnikorn, K., Jutamanee, K., Kraichak, E. (2019). Maxent model for predicting potential distribution of Vitex glabratar. Br. in Thailand. Agr. Nat. Resour. 53, 44–48.
Purwaningsih, R., Sartohadi, J., Setiawan, M. A. (2020). Trees and crops arrangement in the agroforestry system based on slope units to control landslide reactivation on volcanic foot slopes in Java, Indonesia. Land 9, 327. doi: 10.3390/land9090327
Qiong, L., Zhang, W., Wang, H., Zeng, L., Birks, H. J. B., Zhong, Y. (2017). Testing the effect of the Himalayan mountains as a physical barrier to gene flow in Hippophae tibetana Schlect.(Elaeagnaceae). PloS One 12, e0172948. doi: 10.1371/journal.pone.0172948
Rahmah, W., Waluyo, B. (2019). Genetic distance and diversity of breadfruit (Artocarpus altilis) based on morphological characters in Bawean Island, Indonesia. Biodiversitas 20, 3284–3291. doi: 10.13057/biodiv/d201122
Rana, S. K., Rana, H. K., Ghimire, S. K., Shrestha, K. K., Ranjitkar, S. (2017). Predicting the impact of climate change on the distribution of two threatened Himalayan medicinal plants of liliaceae in Nepal. J. Mt. Sci. 14, 558–570. doi: 10.1007/s11629-015-3822-1
Rathore, P., Roy, A., Karnatak, H. (2019). Modelling the vulnerability of Taxus wallichiana to climate change scenarios in South East Asia. Ecol. Indicat. 102, 199–207. doi: 10.1016/j.ecolind.2019.02.020
Rozaki, Z., Rahmawati, N., Wijaya, O., Mubarok, A. F., Senge, M., Kamarudin, M. F. (2021). A case study of agroforestry practices and challenges in Mt. Merapi risk and hazard prone area of Indonesia. Biodiversitas 22, 2511–2518. doi: 10.13057/biodiv/d220661
Santika, T., Meijaard, E., Budiharta, E., Law, A., Kusworo, A., Hutabarat, J., et al. (2017). Community forest management in Indonesia: Avoided deforestation in the context of anthropogenic and climate complexities. Global Environ. Change 46, 60–71. doi: 10.1016/j.gloenvcha.2017.08.002
Scrivanti, L. R., Anton, A. M. (2020). Spatial distribution of Poa scaberula (poaceae) along the Andes. Heliyon 6, e17471. doi: 10.1016/j.heliyon.2020.e05220
Shapla, T., Myers, M., Sengupta, R. (2022). Sustainable land-use recommendations in light of agroforestry systems in response to the changing scenario of land-cover. Adv. Remote Sens. 11, 38–48. doi: 10.4236/ars.2022.112003
Siarudin, M., Rahman, S. A., Artati, Y., Indrajaya, Y., Narulita, S., Ardha, M. J., et al. (2021). Carbon sequestration potential of agroforestry systems in degraded landscapes in West Java, Indonesia. Forests 12, (714). doi: 10.3390/f12060714
Su, J. R., Zhang, Z. J., Deng, J., Li, G. S. (2005). Relationships between geographical distribution of Taxus wallichiana and climate in China. For. Res. 18, 510–515.
Tuddenham, M., Robert, C. (2022). 6e rapport d’évaluation du Groupe d’experts intergouvernemental sur l’évolution du climat (Giec) 3e volume: attenuation. (Paris, France: Citepa org.) 1–54. Available at: https://www.citepa.org/wp-content/uploads/Citepa_2022_05_d01_INT_GIEC_Attenuation_AR6_Vol3_VF.pdf.
Ulak, S., Paudel, P. (2021). Maxent modelling for habitat suitability of vulnerable tree Dalbergia latifolia in Nepal. Silva Fennica. 55, 17. doi: 10.14214/sf.10441
USDA (2018a). Basic Report 09059, Breadfruit, raw (Washington, DC: Natl. Nutr. Database Stand. USDA).
USDA (2018b). Basic Report 20050, Rice, white, medium-grain, raw, enriched (Washington, DC: Natl. Nutr. Database Stand. USDA).
Vuuren, D. P. V., Edmonds, J., Kainuma, M., Riahi, K., Thomson, A. K., Hurtt, G. C., et al. (2009). The representative concentration pathways: an overview. Clim. Change. 109, 5–31. doi: 10.1007/s10584-011-0148-z
Wei, B., Wang, R., Hou, K., Wang, X., Wu, W. (2018). Predicting the current and future cultivation regions of Carthamus tinctorius using Maxent model under climate change in China. Global Ecol. Conserv. 16, E00477. doi: 10.1016/J.GECCO.2018.E00477
Weyant, J., Azar, C., Kainuma, M., Kejun, J., Nakicenovic, N., Shukla, P. R., et al. (2009). Report of 2.6 Versus 2.9 Watts/m2 RCPP evaluation panel (Geneva: IPCC Secretariat).
Widowati, R. (2009). Prospect of breadfruit (Artocarpus communis) as a carbohydrate source to support staple diversification. Pangan 56, 67–75.
Yang, L., Zerega, N., Montgomery, A., Horton, D. E. (2022). Potential of breadfruit cultivation to contribute to climate-resilient low latitude food systems. PloS Climate. 1(8), e0000062. doi: 10.1371/journal.pclm.0000062
Yi, Y., Cheng, X., Yang, Z., Zhang, S. (2016). MaxEnt modeling for predicting the potential distribution of endangered medicinal plant (H. riparia Lour) in Yunnan, China. Ecol. Eng. 92, 260–269. doi: 10.1016/j.ecoleng.2016.04.010
Yu, X., Zhu, R., Gao, L., Huang, D., Fan, Y., Liu, C., et al. (2023). Predicting the current and future distributions of Pennisetum alopecuroides (L.) in China under climate change based on the MaxEnt model. PloS One 18, e0281254. doi: 10.1371/journal.pone.0281254
Zhao, H., Zhang, H., Xu, C. (2020). Study on Taiwania cryptomerioides under climate change: MaxEnt modeling for predicting the potential geographical distribution. Global Ecol. Conserv. 24, e01313. doi: 10.1016/j.gecco.2020.e01313
Keywords: breadfruit, Central Java, RCP 2.6, RCP 8.5, species distribution modeling
Citation: Utomo SW, Lestari F, Adiwibowo A, Fatmah, Fisher MR and Qadriina HI (2024) Predicting the suitable cultivation areas of breadfruit crops Artocarpus altilis (Moraceae) under future climate scenarios in Central Java, Indonesia. Front. Plant Sci. 15:1363153. doi: 10.3389/fpls.2024.1363153
Received: 29 December 2023; Accepted: 11 April 2024;
Published: 30 April 2024.
Edited by:
Bugao Xu, University of North Texas, United StatesReviewed by:
Heba Bedair, University of Wisconsin-Madison, United StatesCopyright © 2024 Utomo, Lestari, Adiwibowo, Fatmah, Fisher and Qadriina. This is an open-access article distributed under the terms of the Creative Commons Attribution License (CC BY). The use, distribution or reproduction in other forums is permitted, provided the original author(s) and the copyright owner(s) are credited and that the original publication in this journal is cited, in accordance with accepted academic practice. No use, distribution or reproduction is permitted which does not comply with these terms.
*Correspondence: Andrio Adiwibowo, YW5kcmlvYXdpYm93b0B1aS5hYy5pZA==
Disclaimer: All claims expressed in this article are solely those of the authors and do not necessarily represent those of their affiliated organizations, or those of the publisher, the editors and the reviewers. Any product that may be evaluated in this article or claim that may be made by its manufacturer is not guaranteed or endorsed by the publisher.
Research integrity at Frontiers
Learn more about the work of our research integrity team to safeguard the quality of each article we publish.