 Brian M. Ohsowski
 Cassidy Redding
 Pamela Geddes
 Shane C. Lishawa
- 1School of Environmental Sustainability, Loyola University Chicago, Chicago, IL, United States
- 2Department of Biology and Environmental Science Program, Northeastern Illinois University, Chicago, IL, United States
Two species of clonal Typha [T. latifolia (native) and T. angustifolia (exotic)] hybridize to form the highly invasive, heterotic (high vigor) T. × glauca in North American wetlands leading to increased primary production, litter accumulation, and biodiversity loss. Conservation of T. latifolia has become critical as invasive Typha has overwhelmed wetlands. In the field, Typha taxa identification is difficult due to subtle differences in morphology, and molecular identification is often unfeasible for managers. Furthermore, improved methods to non-destructively estimate Typha biomass is imperative to enhance ecological impact assessments. To address field-based Typha ID limitations, our study developed a predictive model from 14 Typha characters in 7 northern Michigan wetlands to accurately distinguish Typha taxa (n = 33) via linear discriminant analysis (LDA) of molecularly identified specimens. In addition, our study developed a partial least squares regression (PLS) model to predict Typha biomass from field collected measurements (n = 75). Results indicate that two field measurements [Leaf Counts, Longest Leaf] can accurately differentiate the three Typha taxa and advanced-generation hybrids. The LDA model had a 100% correct prediction rate of T. latifolia. The selected PLS biomass prediction model (sqrt[Typha Dry Mass] ~ log[Ramet Area at 30 cm] + Inflorescence Presence + Total Ramet Height + sqrt[Organic Matter Depth]) improved upon existing simple linear regression (SLR) height-to-biomass predictions. The rapid field-based Typha identification and biomass assessment tools presented in this study advance targeted management for regional conservation of T. latifolia and ecological restoration of wetlands impacted by invasive Typha taxa.
1 Introduction
Hybridization is a common and important evolutionary mechanism that drives phenotypic diversity, environmental adaptation capacity, and speciation (Mallet, 2005; Goulet et al., 2017). In some cases, plants exhibit heterosis (i.e., hybrid vigor) where hybrid offspring show increased fitness resulting in increased biomass, yield, and root density compared to parental counterparts (Hochholdinger and Baldauf, 2018). Path analysis models suggest plant taxa hybridization propensity at the genus level is significantly correlated with a perennial life cycle, woodiness, and reliance on vegetative reproduction systems (Mitchell et al., 2019). An invasive plant case study also documented that hybridization is often associated with perennial plants exhibiting clonal growth habits as a mechanism leading to fixed heterotic genotypes (Ellstrand and Schierenbeck, 2000). Thus, plant introductions exhibiting hybridization potential with closely related endemic plant populations and clonal growth habits may serve as a precursor to stimulate invasiveness (Ellstrand and Schierenbeck, 2000). In wetland systems, herbaceous wetland plants with clonal growth habits are common among the most highly invasive taxa (Galatowitsch et al., 1999; Zedler and Kercher, 2004).
In North America, two species within the clonal Typha (cattail) genus [native T. latifolia, non-native T. angustifolia (Ciotir et al., 2013)] have hybridized to form T. × glauca (Godron) (Smith, 1967). In wetlands, T. × glauca exhibits heterosis which typically results in more productive, taller, and faster growing clones that become more dominant compared to either parent species (Zapfe and Freeland, 2015; Bansal et al., 2019). Backcrossing and advanced-generation hybrids are also common (Travis et al., 2010; Kirk et al., 2011; Freeland et al., 2013; Geddes et al., 2021), complicating Typha genetic identity in the region (hereafter we will refer to all taxa as Typha unless otherwise specified).
The complicated genetics of Typha presents a problem for both the management of invasive Typha and the conservation of native T. latifolia. In the Great Lakes, Typha taxa classified as invasive [T. × glauca and T. angustifolia; hereafter, “invasive Typha”] are dominant in more than 13% of the total area of ecologically critical coastal wetland ecosystems (Carson et al., 2018). Along with its continued spread, management of invasive Typha has increasingly become a restoration priority (Bansal et al., 2019). Conservation of T. latifolia has simultaneously become imperative, due to increased dominance by invasive taxa, hybridization, and backcrossing of hybrids to T. latifolia (Pieper et al., 2017; Bansal et al., 2019; Geddes et al., 2021), which could result in extinction by demographic or genetic swamping (Todesco et al., 2016).
Unfortunately, field identification of the three taxa and advanced-generation hybrids using standard morphological characters (e.g., leaf width, gap between inflorescences) can be unreliable due to wide trait variability (Geddes et al., 2021). Molecular methods to identify Typha taxa may be impractical, if not entirely unfeasible, for many field practitioners managing invasive species populations and practicing conservation. Although the cost of molecular methods has been decreasing due to technological advancements, application of these techniques is still unrealistic for many practitioners (Hauser and Seeb, 2008; Sagarin et al., 2009). Thus, identifying field morphological characteristics that allow for the accurate differentiation of Typha is critical to advance the conservation of T. latifolia and the continued management of invasive Typha.
Invasive Typha taxa are associated with a range of ecological impacts to wetlands. They tend to thrive in wetlands with anthropogenically disturbed hydrology (Boers and Zedler, 2008; Hall and Zedler, 2010; Bunbury-Blanchette et al., 2015). They also outcompete native sedge species (i.e., Carex stricta, C. lacustris, C. lasiocarpa) in wetlands experiencing nutrient enrichment (Woo and Zedler, 2002). Furthermore, invasive Typha magnifies nutrient availability by increasing sediment retention (Horppila and Nurminen, 2001) and enhancing internal nutrient cycling (Currie et al., 2014), thus compounding the effects of nutrient enrichment. Invasive Typha forms monodominant stands in wetlands by outcompeting native plants and creating a thick layer of slowly decomposing leaf litter (Larkin et al., 2012). Further, they can more than double annual productivity in invaded wetlands (Woo and Zedler, 2002; Angeloni et al., 2006). Once established, invasive Typha reduces biodiversity and productivity of native plants (Tuchman et al., 2009), fishes (Schrank and Lishawa, 2019), and aquatic macroinvertebrates (Lawrence et al., 2016).
Accurate and stable methods to estimate productivity are necessary when quantifying metrics of plant dominance, population change, and drivers of biodiversity loss in invasion research (Crystal-Ornelas and Lockwood, 2020). Increased prediction accuracy is also highly desirable when integrating plot-level results (e.g., plant stock concentrations of nutrients, carbon, and heavy metals) across biological scales. Furthermore, plant biomass analyses can confirm and calibrate remote sensing estimates to improve model development for ecological management (Vaz et al., 2018).
Simple linear regression (SLR) standard curves of height-to-biomass have been used to non-destructively predict Typha biomass from field traits (Lishawa et al., 2015). Allometric equations are commonly used to non-destructively estimate biomass from forest systems (Henry et al., 2013), but tend to be less robust for herbaceous species with varied morphology and large environmental gradients (Niklas and Enquist, 2002; Pottier and Jabot, 2017). A two-step approach employing Bayesian information criterion (BIC) model selection of plant traits followed by multivariate partial least squares regression (PLS) modeling can produce highly accurate biomass predictions (Ohsowski et al., 2016). This PLS method avoids the pitfalls of excessive destructive sampling, accounts for collinearity among predictor variables, and can employ categorical and continuous data (Ohsowski et al., 2016).
Our study developed new methods that use easily quantified field measurements to accurately identify Typha taxa and accurately quantify Typha biomass to the benefit of conservation and ecological restoration. Our specific objectives developed prediction models that selected simple field measurements to: 1) accurately classify Typha taxa determined by diagnostic microsatellite markers using linear discriminant analysis, and 2) improve Typha taxa biomass assessment using BIC model selection and PLS. Additionally, we compared historically employed height-to-biomass SLR model predictions with PLS prediction.
2 Materials and methods
2.1 Study site selection and experimental design
In July 2021, we identified seven wetlands in northern Michigan (U.S.A.) to conduct the study [eastern Upper Peninsula (3 sites); northern Lower Peninsula (4 sites)]. Six of the seven wetland sites are classified as Great Lakes coastal wetlands (Munuscong Marsh, Mackinaw Bay, St. Ignace Marsh, Cecil Bay, Cheboygan Marsh, and Duncan Bay) and the remaining site was an inland emergent marsh (Alpena Wildlife Sanctuary) (Figure 1). All wetlands in the study had Typha stands within emergent vegetation zones.
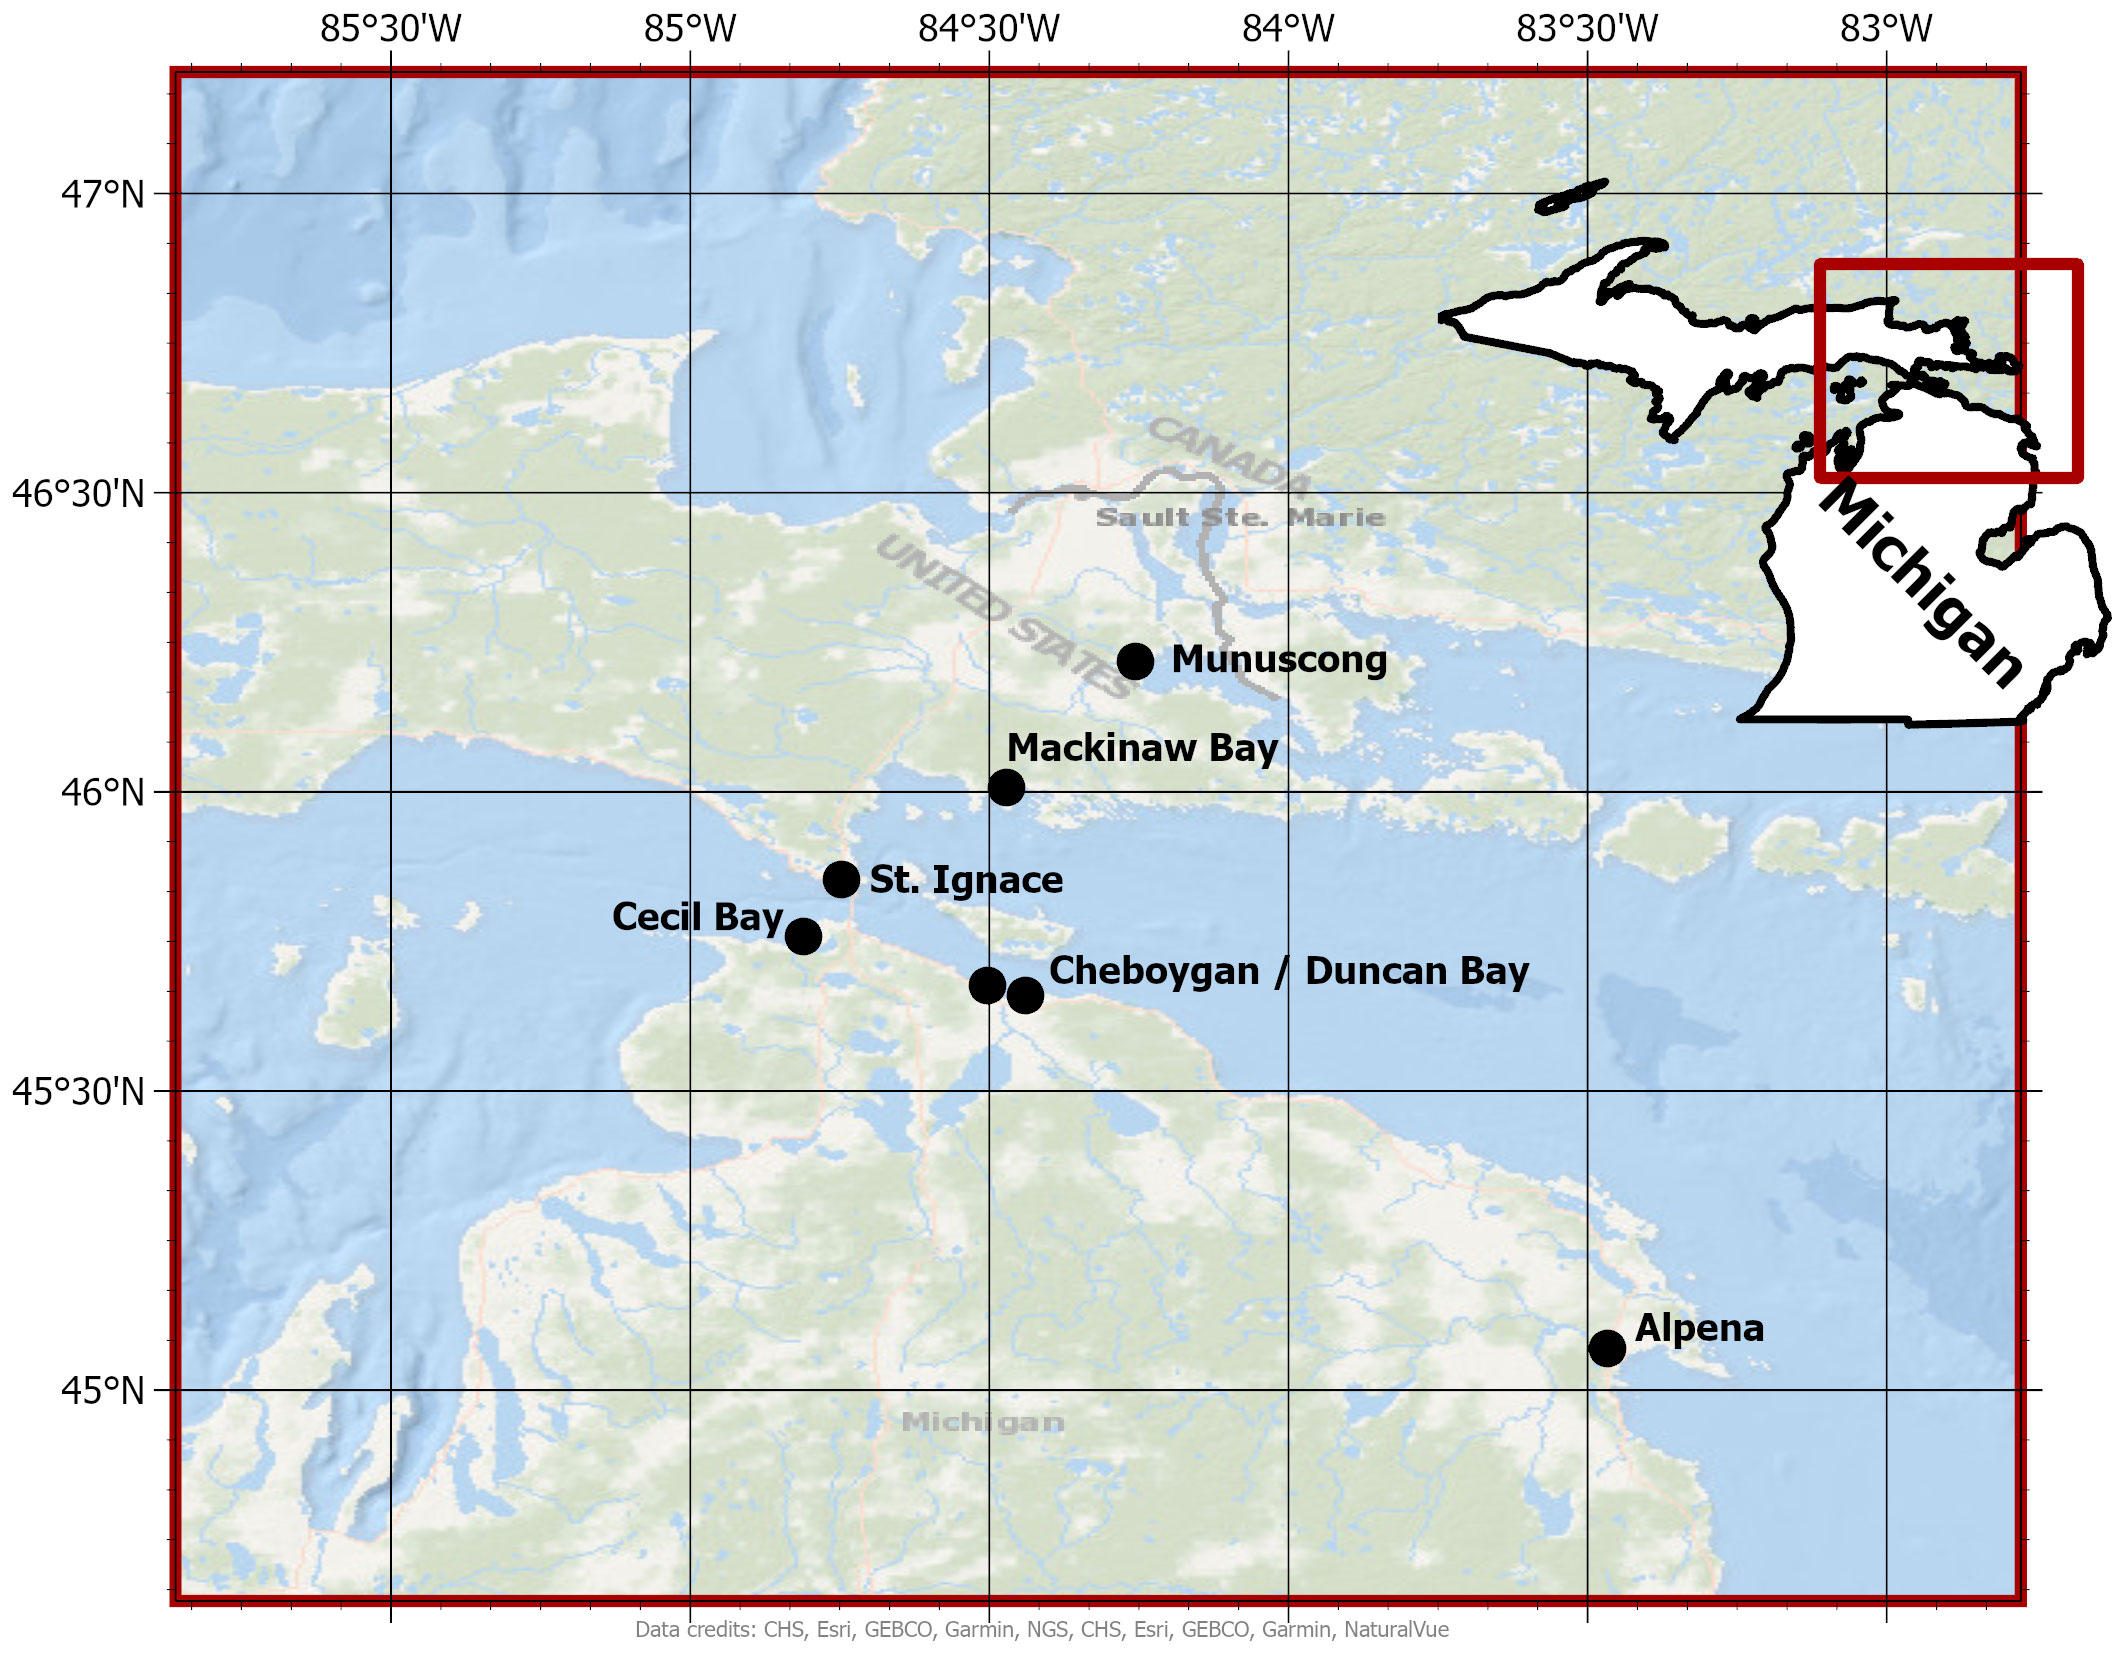
Figure 1 Wetland sites where Typha were sampled in northern Michigan (U.S.A.). Black dots represent the geographic center of each wetland site selected for the study.
In each wetland, we established a minimum of one continuous transect through the geographic center of established Typha stands. In two expansive wetlands with varied water levels and lake exposures (Cheboygan Marsh and St. Ignace Marsh), we increased the number of transects to 3 to capture environmental heterogeneity, resulting in 11 transects total. Nine of 11 transects had a standardized design to include 7 plots (1 m2 quadrats) equidistant along a varied transect length depending upon stand extent. The remaining 2 stands were small (< 10 m diameter) but included in the study because we identified the plants as likely T. latifolia based on morphology (wide leaves and no separation between staminate and pistillate inflorescences) (Voss and Reznicek, 2012).
2.2 Field data collection: morphological characteristics
At each plot, we visually estimated areal coverage (< 1 – 100%) for plant community living vegetation, Typha living vegetation, and Typha standing-detritus above the water surface at all plots (Figures 2I–IV). We also collected total Typha ramet count in each plot to estimate ramet density. Water depth was estimated from the organic matter surface to water surface (Figure 2G). Organic matter depth was collected by firmly pushing a graduated PVC pole (1.9 cm diameter) through the decomposed organic layer until contacting mineral sediment (Figure 2H).
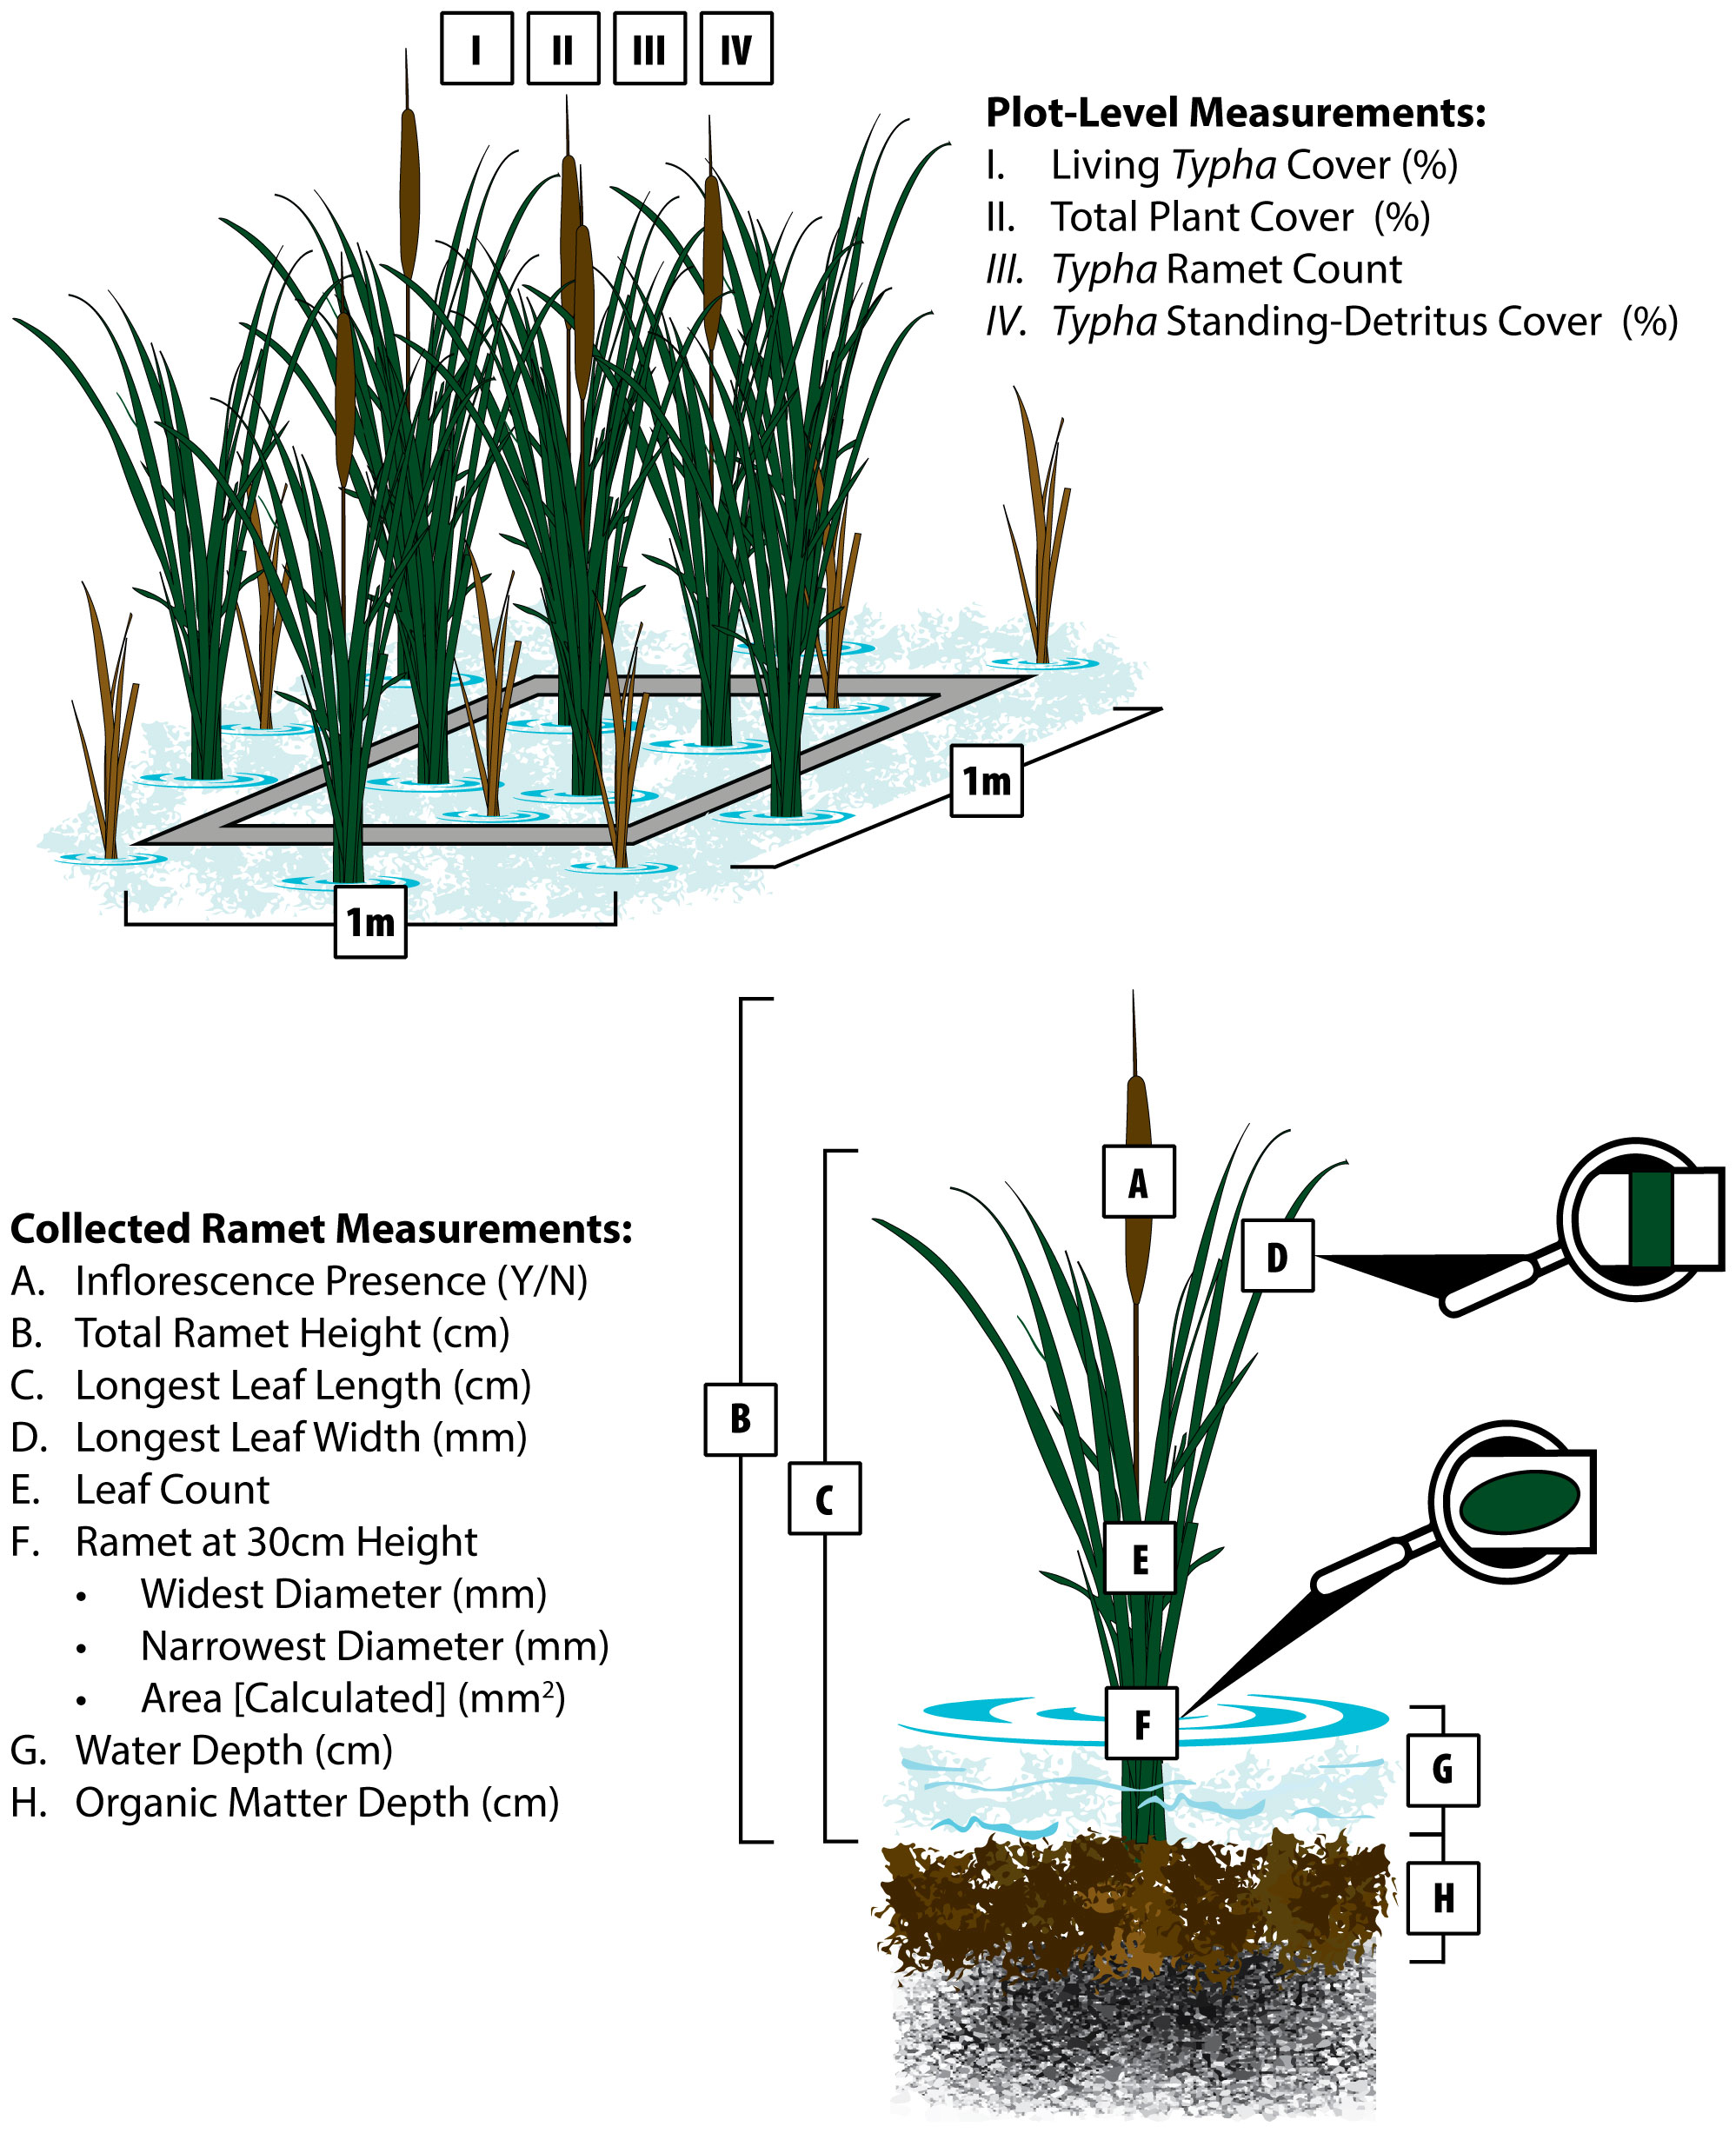
Figure 2 Field measurements collected at each plot (1.0 m2 quadrat) and the centermost identified Typha ramet. Units are given in parentheses next to each variable listed. Variables (I.-IV.) were collected at the plot scale to assess areal cover and Typha ramet density. Plant morphological measurements (A–F) and environmental variables (G, H) were collected from the centermost Typha ramet that was subsequently collected for dry mass and genetic analysis.
Following plot-level estimations, we unbiasedly selected the centermost Typha ramet to measure variables that potentially predict Typha biomass and discriminate Typha taxa. Adapted from Ohsowski et al. (2016), we collected the following measurements (Figures 2A–F): 1) inflorescence presence (yes/no), 2) total ramet height from organic matter surface (including inflorescence if present), 3) longest leaf length from organic matter surface, 4) maximum leaf width on the identified longest leaf (or longest leaf width), 5) ramet green leaf count, 6) widest ramet diameter at 30 cm, and 7) narrowest ramet diameter at 30 cm. We calculated ramet cross-section area at 30 cm assuming an oval: Area = pi ∗ widest cross-section/2 ∗ narrowest cross-section/2. When present, we measured the gap between pistillate and staminate inflorescences. Following all field measurements, each selected ramet was collected, dried at 60° C, and weighed.
2.3 Field data collection: molecular analysis
We established a priori Typha leaf tissue collection for molecular analysis from three non-adjacent plots per transect to minimize the probability of collecting clones; for the 2 small stands, tissue was collected from each plot (total replication = 33). Green leaf tissue (length = 10 cm) from the centermost ramet was clipped, bagged, and stored on ice (Geddes et al., 2021). Each leaf sample was then flash frozen in liquid nitrogen in the lab and stored in a cryogenic freezer (-80° C) until molecular analysis. The collected leaf tissue sample wet mass was converted to dry mass and added to total Typha dry mass described in Section 2.2.
2.4 Molecular analysis
Frozen Typha leaf tissue samples were ground with dry ice followed by DNA extraction using Qiagen DNEasy Plant kits. We selected six diagnostic microsatellite markers [TA 3, TA 5, TA 8, and TA 16 (Tsyusko-Omeltchenko et al., 2003), and TM 4 and TM 11 (Csencsics et al., 2010)], shown to be accurate in distinguishing Typha species, backcrosses, and advanced-generation hybrids (Geddes et al., 2021 and references therein). PCR amplification of microsatellite primers was accomplished following established protocols (Geddes et al., 2021) using 2-step PCR (Schuelke, 2000), after which a 1.4% agarose gel electrophoresis confirmed successful microsatellite amplification.
We performed microsatellite analyses on a Beckman Coulter gene sequencer with fragment sizing (400 bp ladder), scoring, and microsatellite interpretation analyzed using Beckman Coulter software. Following microsatellite scoring, each of the six microsatellite markers per tissue sample were separated into one of four molecular ID classes: T. latifolia, T. angustifolia, T. × glauca, or advanced-generation hybrid (AGH). A sample was categorized as an F1 hybrid (i.e., T. × glauca) if one allele from each parental species (T. latifolia and T. angustifolia) was present. The final taxonomic classification used for statistical analyses was determined when at least 5 of 6 diagnostic microsatellite markers agreed in the molecular ID classification. If diagnostic microsatellite markers did not meet the minimum 5 of 6 consensus among hybrid and/or both parental loci, the sample molecular ID was classified as AGH (Snow et al., 2010; Travis et al., 2010; Travis et al., 2011).
2.5 Statistical analysis: Typha molecular ID classification
Plot-level Typha ramet measurements (Figure 2) were used to separate Typha molecular ID classes (T. latifolia, T. angustifolia, T. × glauca, AGH) using linear discriminant analysis (LDA) (replication = 33). Typha dry mass and all predictor variables in Figure 2 were transformed (when required), centered, and scaled to meet statistical assumptions. We used Spearman’s rank correlation coefficients to determine highly collinear variables (rs > 0.90) and remove one of the variable pairs from the analysis. We employed recursive feature elimination with 10-fold cross-validation to select the most relevant class separation variables using the rfe() function in R’s caret package (Kuhn, 2008; Chen et al., 2020). The selected LDA model was built with the lda() function in R’s MASS package (Venables and Ripley, 2013). Model and class prediction performance metrics were generated using a confusion matrix in R’s caret package (Kuhn, 2008).
We developed an LDA permutation model to estimate test data prediction performance for Typha molecular ID classes. For each permutation (n = 1,000), the full dataset (replication = 33) was randomly split into a training data set (replication = 26) to establish an LDA model. The remaining test data (replication = 7) were classified into molecular ID classes by the trained LDA model. We calculated an agreement percentage for predicted within-model training data and external model test data for each iteration as % correctly predicted cases/total cases predicted.
2.6 Statistical analysis: biomass prediction
We used plot-level and Typha ramet measurements (Figure 2) to develop Typha dry mass prediction models (replication = 75). Variable standardization, Bayesian Information Criterion (BIC) model selection, and model dry mass prediction workflow followed Ohsowski et al. (2016) and references within. All predictor variable combinations and associated 2nd order polynomial terms were scored with BIC model selection with the dredge function in R’s MuMin package (Bartoń, 2023). Equivalent multi-variate prediction models (ΔBIC ≤ 2) were averaged using the model.avg() function in MuMin to provide our selected statistical model employed for Typha dry mass prediction.
We trained the selected multi-variate model using partial least squares regression (PLS) (replication = 75) in R’s pls package (Liland et al., 2023). Four model components were retained as determined by lowest root mean squared error of cross-validation (RMSECV) calculated from 10-fold cross-validation. For comparison, we developed a simple linear regression (SLR) model for sqrt[Typha Dry Mass] ~ Total Ramet Height (replication = 75) using the lm function in R’s base package (R Core Team, 2023). RMSECV estimates for the SLR model were calculated with 10-fold cross-validation with the errorest() function in R’s ipred package (Peters and Hothorn, 2023). Similar to Ohsowski et al. (2016), we calculated a simple DIFF term for all Typha dry mass predictions with the following formula to assess model prediction performance: DIFF = predicted Typha dry mass – reference Typha dry mass.
We developed a permutation model for the PLS and SLR models to estimate test data (i.e., external data) prediction performance for Typha dry mass, thus assessing model robustness and real-world model applicability. For each permutation (n = 1,000), the full dataset (replication = 75) was randomly split into training data (replication = 63) to develop the PLS and SLR models. The remaining test data (replication = 12) were predicted by the trained PLS and SLR models, back-transformed, and DIFF term was calculated for the resulting permutation model.
3 Results
3.1 Variable selection: molecular ID classification
We developed a linear discriminant analysis (LDA) to predict Typha molecular ID classes: T. latifolia, T. angustifolia, T. × glauca, and AGH. To meet test assumptions, we dropped three collinear variables from the analysis using Spearman’s rank correlation coefficients: Longest Leaf Length (collinear with Total Ramet Height, rs = 0.996), Widest Ramet Diameter at 30 cm (collinear with Ramet Area at 30 cm, rs = 0.974), and Narrowest Ramet Diameter at 30 cm (collinear with Ramet Area at 30 cm, rs = 0.928). Total ramet height was selected over longest leaf length as this character is a very simple field measurement. We also dropped the widest and narrowest ramet diameter measurements as they were highly collinear with the calculated ramet areas due to formula inclusion. In total, ten variables were used to determine the most parsimonious LDA model via recursive feature elimination with 10-fold cross-validation: sqrt[Organic Matter Depth], sqrt[Water Depth], sqrt[Living Typha Cover], log[Typha Detritus Cover], sqrt[Leaf Count], sqrt[Longest Leaf Width], sqrt[Longest Leaf Length], sqrt[Typha Ramet Count], Typha Height, log[Ramet Area at 30 cm].
We determined the most relevant LDA class separation variables for the final LDA model: Molecular ID Class ~ sqrt[Leaf Count] + sqrt[Longest Leaf Width]. Note that sqrt[Water Depth] was retained in the initial selected recursive feature elimination model but removed from this analysis. We determined that including water level measurements may lead to unreliability for future application of the presented model by increasing uncertainty (see Discussion).
3.2 Diagnostic microsatellite markers: molecular ID classification
Agreement among the six microsatellite markers resulted in four molecular ID classes: T. latifolia, T. angustifolia, T. × glauca, and AGH. Out of the 33 molecular samples, 66.3% had complete diagnostic microsatellite agreement among all six molecular markers [count]: T. angustifolia [3], T. × glauca [15], T. latifolia [3]. Additionally, 30.3% of the samples had consensus in 5 out of 6 markers resulting in molecular ID classification [count] of T. angustifolia [5], T. × glauca [3], and T. latifolia [2]. Two samples were classified as AGH because the six microsatellite markers were split in the molecular ID: one of the samples had 3 markers identifying it as T. × glauca and 3 markers as T. angustifolia, while the other sample had 2 markers identifying it as T. × glauca and 4 markers as T. angustifolia. These two latter samples likely represent backcrosses to one of the parental species (in this case T. angustifolia). Given our relatively low sample size for molecular analyses (n = 33), we categorized all hybrids beyond the F1 hybrid as advanced-generation hybrids. Overall, molecular ID analyses prevalence revealed that 15.2% of our samples were classified as T. latifolia, 24.2% as T. angustifolia, 54.6% as T. × glauca, and 6.1% as AGH (Table 1).
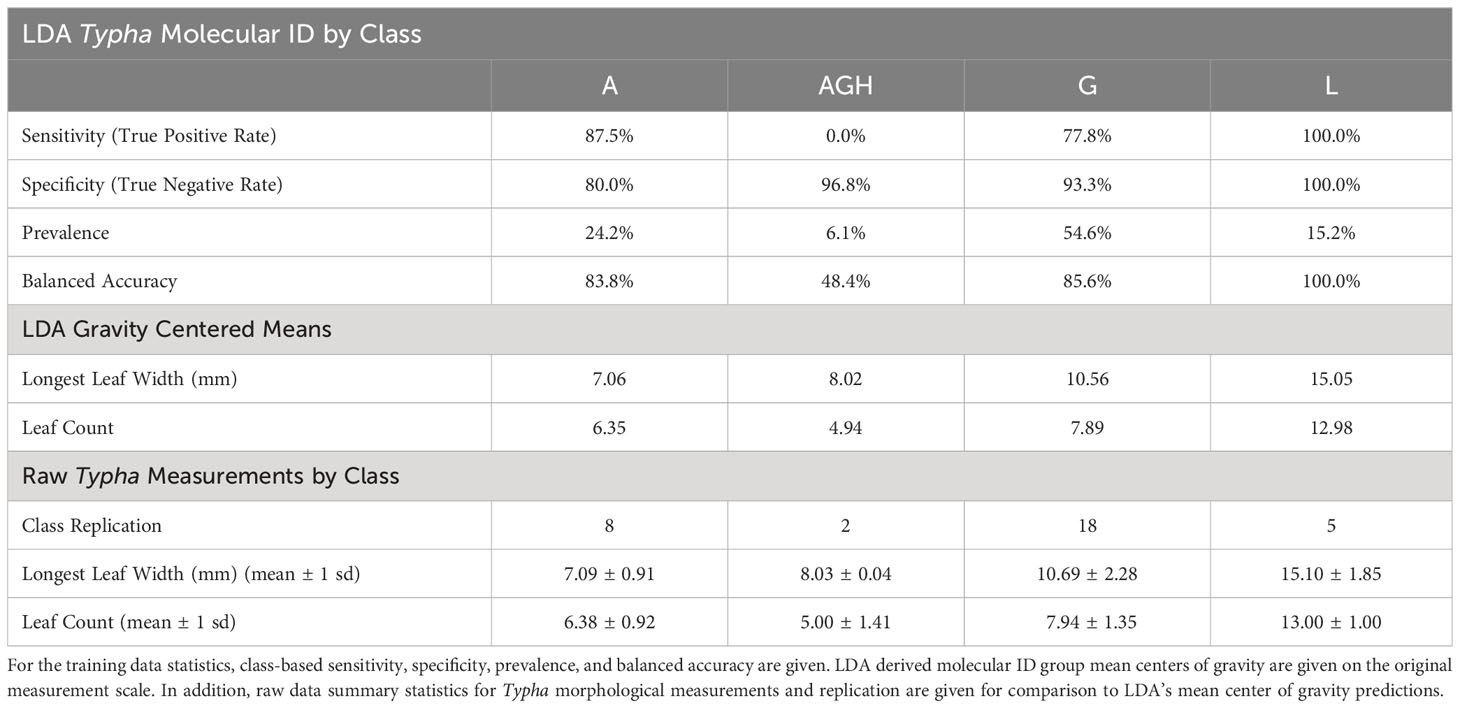
Table 1 Linear discriminant analysis (LDA) model performance metrics by class for training data to separate the four Typha molecular ID classes: Typha angustifolia [A], Advanced Generation Hybrid [AGH], Typha × glauca [G], and Typha latifolia [L].
3.3 Molecular ID class separation
The overall linear discriminant analysis model had high statistical accuracy when predicting the four Typha molecular classes. LDA training data confusion matrix statistics revealed high confidence for internal prediction model accuracy [correct % prediction (± 95% CI): 78.8% (61.1%, 91.0%), Kappa = 66.8%]. The LDA model significantly outperformed the no information rate (i.e., null) model (p = 0.003) (Table 2). The two most descriptive linear discriminant functions (LD1: explained variance 96.8%; LD2: explained variance 3.2%) successfully separated the molecular ID classes driven by the leaf count and longest leaf width variables (Figure 3). The 95% T. angustifolia confidence intervals more strongly overlapped with T. × glauca compared to the clear class separation between T. × glauca and T. latifolia (Figure 3). T. latifolia and T. angustifolia had no 95% confidence interval overlap indicating clear molecular ID class separation between the two taxa (Figure 3). AGH had only two classification instances (6.1% of data set) leading to instability in predicting the class (Table 1) and unresolved 95% confidence intervals (Figure 3) due to low replication. LDA models revealed 100% accurate classification of T. latifolia, 85.6% for T. × glauca, and 83.8% for T. angustifolia (Table 1). Molecular class gravity centered mean measurement values were back-transformed and presented for leaf count and longest leaf width in Table 1.
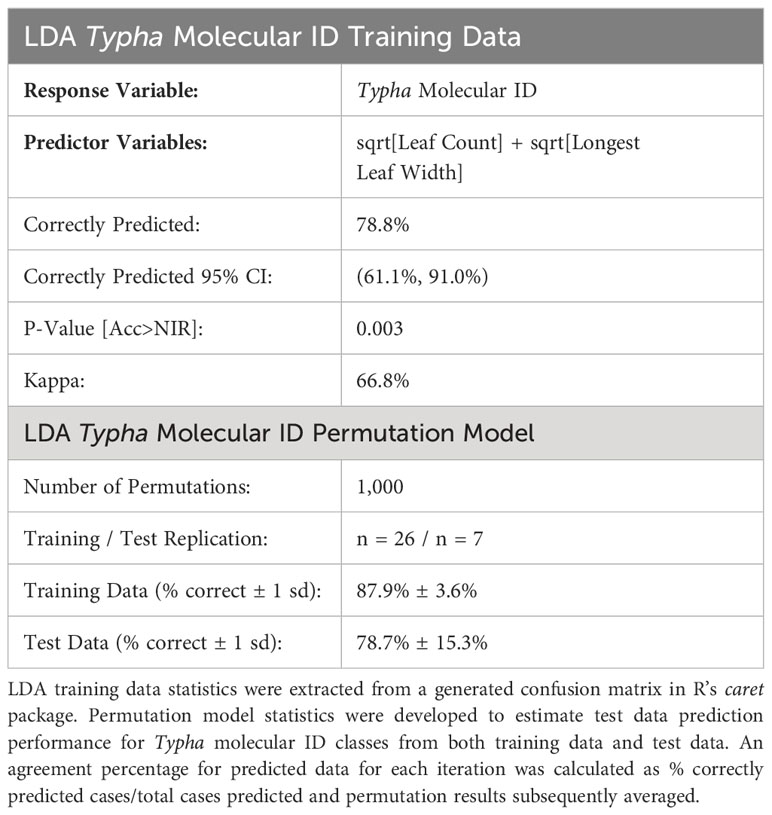
Table 2 Overall linear discriminant analysis (LDA) model performance metrics to separate the four Typha molecular ID classes.
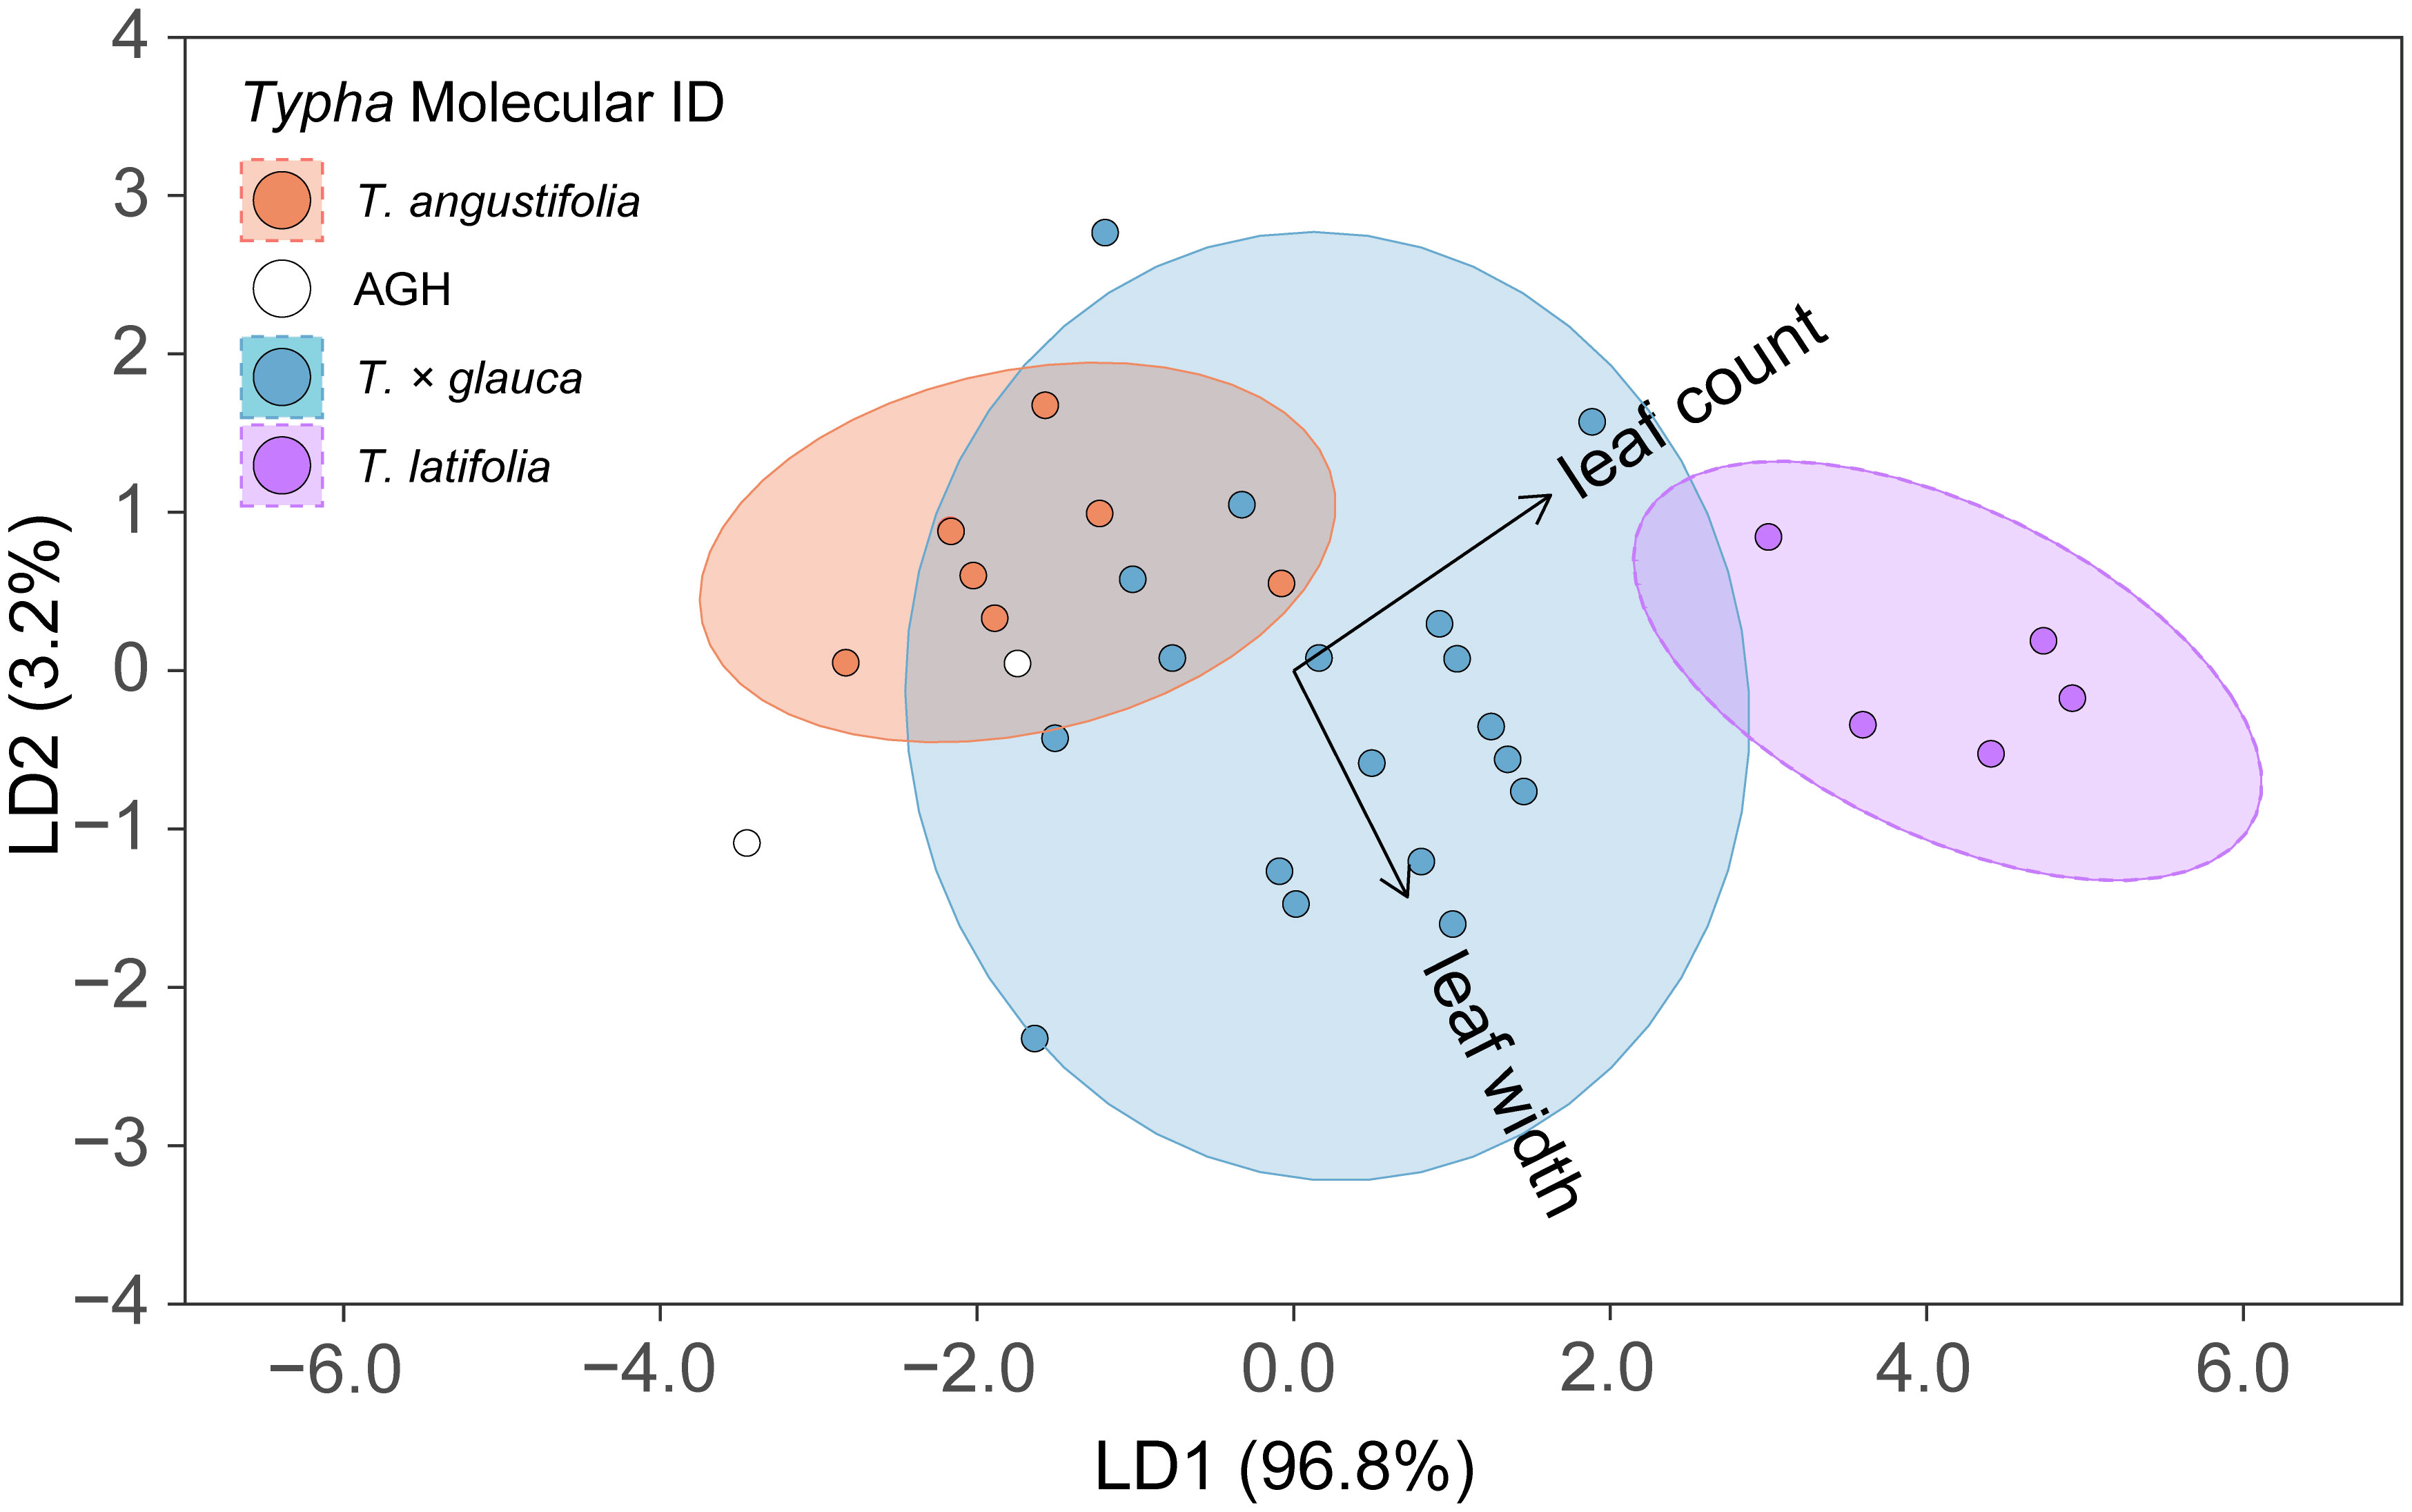
Figure 3 Linear discriminant analysis (LDA) results displaying linear discriminant function 1 (LD1) vs. linear discriminant function 2 (LD2) to separate the four Typha molecular ID classes: Typha angustifolia, advanced generation hybrid [AGH], Typha × glauca, and Typha latifolia. LD1 vs. LD2 maximized class separation given with parenthetic values for Proportion of Trace describing discriminant function explained variation. Respective ellipses represent 95% confidence intervals for each predicted class. Arrows represent the contribution direction and magnitude of each predictor variable. Final LDA model: sqrt[Typha Dry Mass] ~ sqrt[Leaf Count] + sqrt[Longest Leaf Width]. AGH had insufficient data to provide model confidence intervals.
The permutation LDA model result confirmed high prediction agreement for training data and test data of molecular ID classes. For each permutation iteration (n = 1,000), 78.8% of the full data set trained the LDA model to externally predict 21.2% of the test data. The average % correct molecular ID prediction for each permutation iteration confirmed model accuracy for internal training data (mean ± 1 sd % correct: 87.9% ± 3.6%) and test data (mean ± 1 sd % correct: 78.7% ± 15.3%) (Table 2).
3.4 Variable selection: Typha dry mass prediction
We used 14 predictor variables (and associated polynomial terms) for BIC model selection. Model selection resulted in 11 equivalent models that predicted Typha dry mass in the study (Table 3). Following BIC model averaging, the final PLS prediction model was reduced to 4 predictor variables: sqrt[Typha Dry Mass] ~ log[Ramet Area at 30 cm] + Inflorescence Presence + Total Ramet Height + sqrt[Organic Matter Depth].
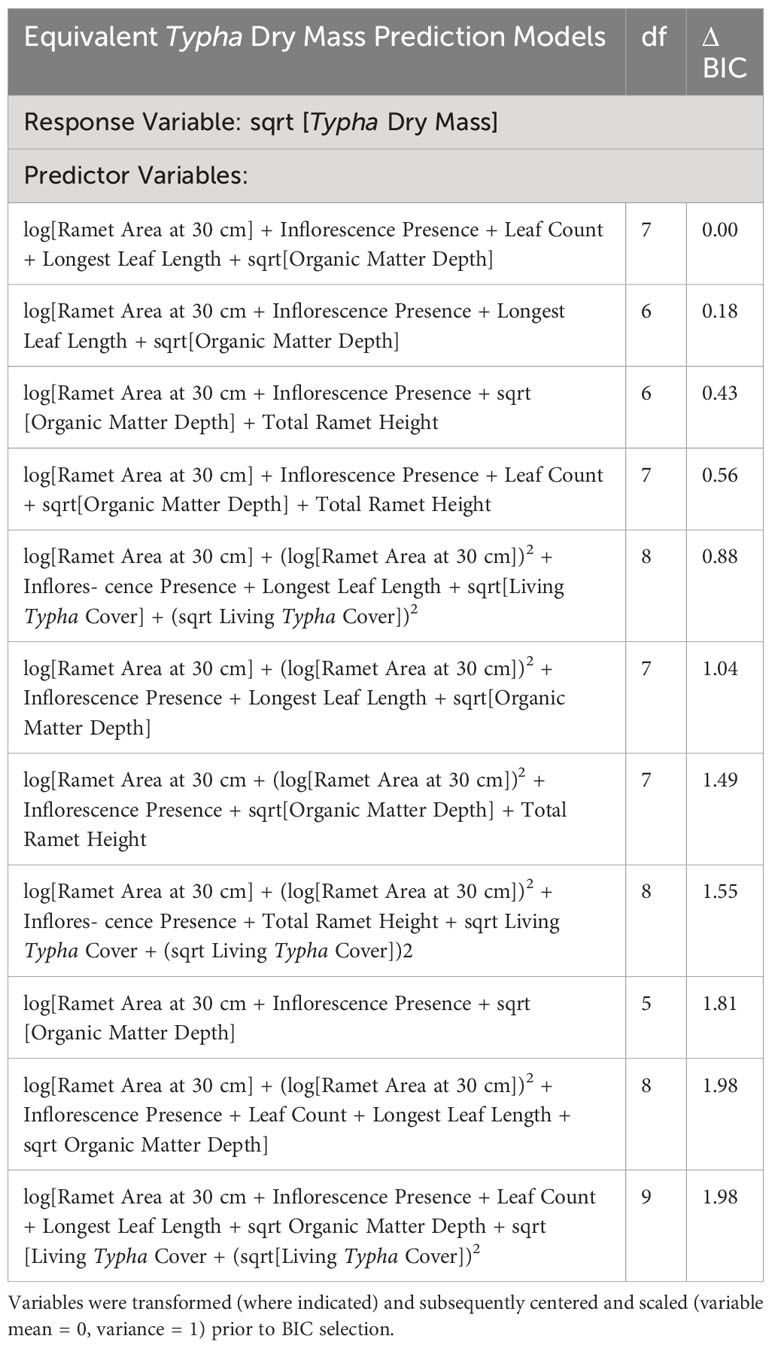
Table 3 Equivalent BIC selected models (ΔBIC ≤ 2) and associated degrees of freedom (df) generated to predict Typha dry mass.
Six of 14 potential predictor variables (and associated polynomial terms) in Figure 2 were not selected in any equivalent ΔBIC ≤ 2 models: Typha standing-detritus cover, widest ramet diameter at 30 cm, narrowest ramet diameter at 30 cm, maximum leaf width on the longest leaf (i.e., longest leaf width), ramet green leaf count, and water depth (Table 3). Prevalent variables selected within ΔBIC ≤ 2 models (% occurrence across ΔBIC ≤ 2 models, n = 11) were: ramet area at 30 cm (100%), inflorescence presence (100%), and organic matter depth (81.8%). Longest leaf length (54.5%) and total ramet height (36.3%) were never selected for the same ΔBIC ≤ 2 equivalent model. Although longest leaf length was selected more frequently, total ramet height (36.3%) was chosen as a preferred PLS predictive variable because of the relative ease of collecting ramet height data in the field without compromised predictive power. Curvilinear relationships (i.e., 2nd order polynomial terms) were infrequently included to predict Typha dry mass for ramet area at 30 cm and living Typha cover (Table 3). Polynomial terms were not influential after BIC model averaging.
3.5 PLS and SLR Typha dry mass prediction
Typha dry mass descriptive statistics (min: 4.78 g; max: 102.62 g; mean ± 1 sd: 34.52 g ± 19.22 g) successfully characterized plant population size class ranges encountered in the study’s wetlands. To this end, the multi-variate partial least squares regression (PLS) Typha dry mass prediction model vastly outperformed the simple linear regression (SLR) prediction model developed for sqrt[Typha Dry Mass] ~ Total Ramet Height. The trained PLS prediction model [Root mean squared error of cross validation (RMSECV): 0.47 g, explained variance: 85.01%, replication = 75] had higher accuracy and precision when validating model performance compared to the trained SLR model [RMSECV: 2.27 g, explained variance: 18.38%, replication = 75] (Table 4). Thus, utilizing the selected PLS model instead of the simple SLR resulted in greater accuracy in predicting Typha dry mass (Figure 4). For clarity in Figure 4, the slope = 1 reference line indicates a perfect prediction between predicted and reference dry mass. In Figure 4A, the linear regression of predicted PLS Typha dry mass ~ reference Typha dry mass (p < 0.001, R2 = 0.832) had high agreement and low unexplained variation with slope = 1 and the regression fit. Compared to slope = 1, the PLS model slightly underpredicted the reference dry mass of Typha within the higher biomass ranges. In contrast (Figure 4B), the linear regression of predicted SLR Typha dry mass ~ reference Typha dry mass (p < 0.001, R2 = 0.180) displayed strong skew, low agreement, and high unexplained variation when compared to slope = 1 and the regression fit. The SLR vastly underpredicted Typha dry mass as reference dry mass increased, resulting in lower model confidence compared to the PLS model.
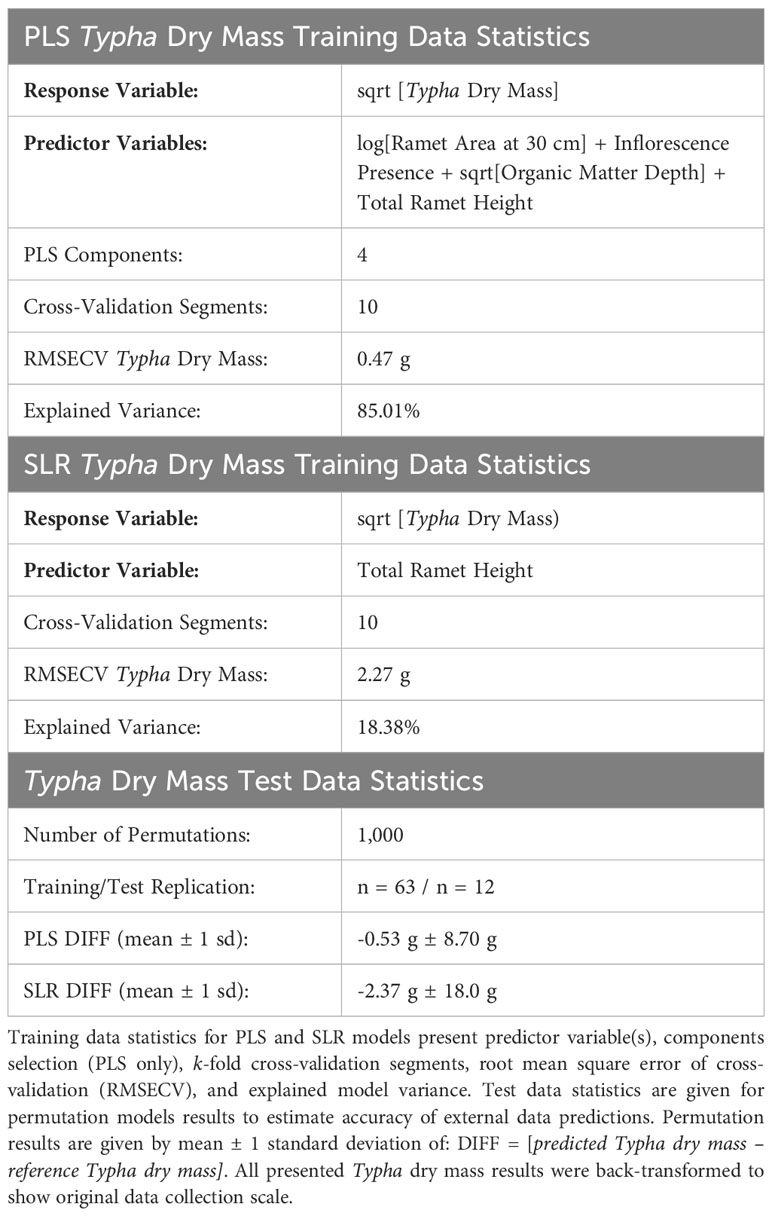
Table 4 Partial least squares regression (PLS) and simple linear regression (SLR) model performance metrics for Typha dry mass predictions.
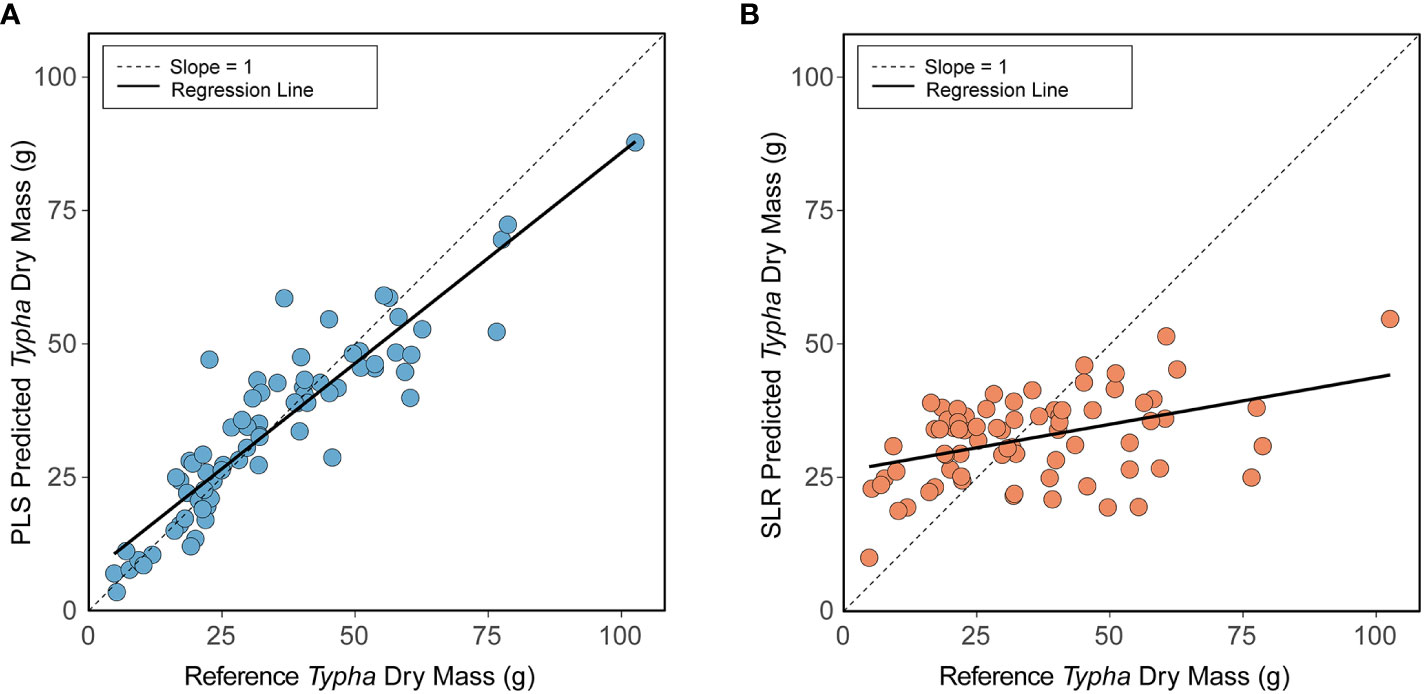
Figure 4 Partial least squares regression (PLS) (A) and simple linear regression (SLR) (B) model results for predicted Typha dry mass (training data) vs. reference Typha dry mass. Panel (A) Training data predicted from final PLS model generated from BIC model selection: sqrt[Typha Dry Mass] ~ log[Ramet Area at 30 cm] + Inflorescence Presence + Total Ramet Height + sqrt[Organic Sediment Depth]. Panel (B) Training data predicted from final SLR prediction model: sqrt[Typha Dry Mass] ~ Total Ramet Height. In both panels, the dashed line (—) represents a slope = 1 indicating a perfect prediction between reference Typha dry mass and predicted Typha dry mass. The solid black line (—) represents the actual best fit regression line between predicted Typha dry mass and reference Typha dry mass.
The permutation model results further confirmed superior PLS model performance compared to SLR model performance. For each permutation iteration (n = 1,000), 84.0% of the full data set trained the respective PLS and SLR model to externally predict 16% of the test data. Calculated DIFF confirmed high PLS model accuracy for test data (mean DIFF ± 1 sd: -0.53 g ± 8.70 g) compared to the more highly variable SLR model test data (mean DIFF ± 1 sd: -2.37 g ± 18.00 g).
4 Discussion
Our study emphasized field applicability from simple aboveground Typha morphological measurements to support rapid ecological management decisions for wetland plant conservation and restoration. Contextually, field data collected in this study occurred during peak growing season in northern Michigan (July-August). Thus, our predictive models will have widest applicability to fully mature Typha ramets prior to senescence. Overall, we are confident that both of our developed techniques can be employed with high precision and accuracy to generate reliable data for researchers and land managers combatting invasive Typha populations and implementing conservation strategies to protect T. latifolia in North America.
Molecular marker results indicate that hybridization is common across the study region and that introgression (e.g., hybridization beyond the F1 hybrids) may not be as prevalent in this study area compared with others (e.g., Geddes et al., 2021 and references therein). Specifically, we only identified advanced-generation hybrids twice across all samples. However, we contend that the discrepancy in classified molecular cases was not necessarily a major limitation of this study. This study’s design did not prioritize quantification of occurrence frequency of Typha in the region as we did not specifically target equal population sizes with the intent for balanced replication or a comprehensive wetland selection protocol of all regional extant Typha stands. Thus, direct comparisons with prior studies that address prevalence or occurrence frequency of Typha taxa in North America should be avoided.
In our sampled wetlands, LDA model selection revealed that simple field measurements exhibited good taxa separation. Morphological measurements of T. × glauca fell in between T. angustifolia and T. latifolia in both LDA mean center of gravity and raw data summary statistics (Table 1). These results agree with Snow et al. (2010) who found that microsatellite markers sorted samples by measured traits into three distinct clusters represented by T. latifolia, T. × glauca, and T. angustifolia. Similar to our study, the results of Snow et al. (2010) located T. × glauca in the middle of the parental species clusters. Furthermore, our results agree with those of Kirk et al. (2011) and those of Kuehn and White (1999) who found that principal component analysis (PCA) of microsatellite markers and discriminant analyses of randomly amplified polymorphic DNA (RAPD) markers, respectively, categorized Typha samples into three distinct clusters (T. latifolia, T. × glauca, and T. angustifolia) by measured plant traits.
We assert that our capacity to identify T. latifolia is timely and crucial when detecting and distinguishing the increasingly rare T. latifolia from invasive Typha. Our study successfully showed that the molecular ID of T. latifolia was strongly separated from the remaining Typha taxa with slight 95% confidence interval overlap with T. × glauca and no overlap with T. angustifolia (Figure 3). Our method to accurately identify T. latifolia with two measurements will allow field biologists to differentiate populations of the native species quickly and accurately from the invasive taxa to improve conservation efforts.
In our study, LDA longest leaf width mean center of gravity for T. latifolia (15.05 mm) was reliably distinguished from longest leaf width for T. angustifolia (6.35 mm) and T. × glauca (10.56 mm) (Figure 2; Table 1). In Snow et al. (2010), cluster classification corresponded well with several plant field measurements that included: log(leaf length/leaf width), length of gap between inflorescences, inflorescence length, and stem diameter. In confirmation with our results, a measurement metric including leaf width [i.e., log(leaf length/leaf width)] was most useful in distinguishing between parental species and the F1 hybrid (Snow et al., 2010). In contrast, our LDA model did not select a diagnostic stem measurement (e.g., ramet area at 30 cm) as a strong predictor of class separation. In Kirk et al. (2011), Typha taxa clustering was also significantly driven by leaf width measurements from a random subset of selected leaves. Given the high variability of leaf width within a particular ramet based on position, size, or age, our selection of a ramet’s longest leaf width will increase measurement consistency to yield a more robust metric. Lastly, in Kuehn and White (1999), cluster classification of the three Typha taxa corresponded with stigma width, length of inflorescence spike, gap between inflorescences, leaf width, and inflorescence width. However, they concluded that no single character or sets of characters were diagnostic due to considerable overlap among parental species and the hybrid. In addition, 4 of 5 characters used by Kuehn and White (1999) relied on the presence of inflorescences and included more complex, microscope-assisted measurements of stigma widths.
Our second LDA selected character (leaf count), is, to our knowledge, a novel measurement not previously identified as a Typha taxa classification trait. In our study, LDA leaf count mean center of gravity for T. latifolia (12.98 leaves) far surpassed leaf count for T. angustifolia (6.35 leaves) and T. × glauca (7.89 leaves) suggesting a simple measurement metric can be used in combination with longest leaf width to improve classification prediction (Figure 2; Table 1). Wasko et al. (2022) employed mean leaf-apex angle measured for Typha ramet leaves (range: 2-9 leaves; mean: 5.3 leaves per ramet) to successfully match Typha ID to microsatellite markers. In contrast to leaf count, the mean leaf-apex angle metric in Wasko et al. (2022) requires a labor investment in the field. As our study did not include mean leaf-apex angle, future models could include this trait to determine if its contribution greatly improves predictive class separation.
We still argue that field-based characters related to Typha inflorescence measurements are extremely helpful in taxa differentiation, specifically the gap between the staminate and pistillate inflorescences. Yet, we caution that relying on inflorescence trait measurements may be problematic. Typha clonal vegetative growth, which allows spread via rhizomes, can be highly plastic regarding inflorescence production (Grace and Wetzel, 1982). In our current study, this was evidenced by the fact that 73% (55 of 75) of the randomly collected centermost ramets lacked an inflorescence. Wasko et al. (2022) also found that less than 50% (22 of 45) of their sampled Typha ramets had inflorescences. Furthermore, large-scale management focused on aboveground biomass removal via harvesting has resulted in stark reduction in inflorescence frequency in subsequent years post-harvest. For instance, following two consecutive years of invasive Typha harvest at Shiawassee National Wildlife Refuge (MI, USA), 0.22% of Typha ramets produced an inflorescence, compared with 16.66% of Typha ramets in unharvested control plots (Lishawa et al., 2020). Our field-based Typha measurements investigated in this study relied solely upon vegetative growth characteristics, thus providing a wider applicability for land managers and researchers in the field.
As noted in the results, the water depth variable in the LDA model improved Typha class separation accuracy by approximately 9.1%. We removed this variable as a potential predictor variable as 6 of the 7 sampled wetlands were classified as Great Lakes coastal wetlands. As water levels fluctuate considerably in the Great Lakes (Gronewold and Rood, 2019), small predictive gains for variable retention were determined to not outweigh the potentially erroneous predictive conclusions. In Great Lakes coastal wetland systems, daily water level ranges exceeding 20 cm are common due to seiche events (Trebitz, 2006). The static LDA predictive model assumes stability in water levels to separate the molecular ID classes. Future model improvement may consider including water level measurement in less dynamic, inland wetlands and/or with greater sampling breadth of T. latifolia populations. As T. latifolia populations are increasingly rare in the region, population sampling was limited to two small T. latifolia stands (< 10 m diameter) in this study. Summary statistics suggest that water level for T. latifolia (mean ± 1 sd: 7.90 cm ± 5.81 cm) may be a viable indicator in future studies but remains unreliable in this study due to high variation in T. × glauca and T. angustifolia (mean ± 1 sd: 31.03 cm ± 16.93 cm; 63.31 cm ± 40.05 cm, respectively). Furthermore, evidence from Lake Ontario wetlands with co-occurring Typha taxa suggests that the three dominant taxa do not tend to sort along a water depth gradient, but instead occupy similar habitats (McKenzie-Gopsill et al., 2012). Taken together, this evidence provided additional justification for dropping water depth from our model.
Variables selected for our PLS equations incorporated total ramet height, organic matter depth, inflorescence presence, and ramet area at 30 cm. The resulting PLS model was 85.01% accurate at predicting Typha dry mass training data, thus improving upon published allometric equations for Typha (Lishawa et al., 2015). Furthermore, our PLS model was robust to test (i.e., external) data predictions leading to high confidence in our model prediction applicability (Table 4, PLS DIFF: 0.53 g ± 8.70 g). Comparatively, SLR models solely using total ramet height performed poorly when predicting test data Typha dry mass (Table 4, PLS DIFF: -2.37 g ± 18.0 g). Similar to Ohsowski et al. (2016), model predictive performance with multi-variate traits vastly improved both precision and accuracy for training and test data predictions. Unsurprisingly, plant height has been used as a variable to create plant biomass predictive standard curves or as a proxy for plant biomass (Catchpole and Wheeler, 1992). Our PLS model highlights that the sole use of plant height measurements contributes to a high level of model uncertainty, especially at higher biomass values for Typha specifically. Our study further affirms that plant height does provide predictive power when used in conjunction with multi-variate model predictors.
Interestingly, our proposed PLS model provides researchers with additional novel morphological measurements to accurately predict Typha biomass. In this context, ramet area at 30 cm was a consistently selected variable to improve Typha dry mass prediction. Ramet area at 30 cm alludes to the thickness and shape of the culm calculated from widest ramet diameter and narrowest ramet diameter. In their molecular ID study, Snow et al. (2010) found that stem diameter helped explain the separation of the parental species and the F1 hybrid. Here, we provide evidence that ramet area is also useful in explaining predicted Typha dry mass. At first glance, this trait may seem challenging to measure in the field. In our experience, integrating ramet area measurement can be accomplished with common fieldwork tools such as calipers or a flexible measuring tape. We assert that including this variable is essential despite minor increases in time and labor since the multi-variate PLS model substantially increased explained variance and test data prediction precision.
Another unexpected, but reasonable, predictor of Typha dry mass was organic matter depth. Organic depth has been correlated with measures of Typha dominance. For example, in 14 Great Lakes coastal wetlands in our project region organic matter depth was more than 3-times greater and sediment ammonium was over 10-times greater where Typha was present (Lishawa et al., 2010). Further, Typha ramet density was positively correlated with organic matter depth (Lishawa et al., 2010). Organic sediments in these freshwater coastal systems are likely a strong proxy for sediment nutrient availability. Typha has been shown to increase sediment retention (Horppila and Nurminen, 2001), thereby creating a nutrient retention positive feedback. Corroborating these results, reviewed research indicates that roots of stoloniferous and rhizomatous species clones proliferate rapidly under conditions of increased nutrient resource availability (de Kroons and Hutchings, 1995). Thus, organic matter depth should be expected to drive plant vigor.
In conclusion, our results will benefit the work of land managers and conservation biologists by enabling the rapid identification of Typha taxa with minimal effort in the field. Furthermore, our biomass prediction models will lend greater confidence in non-destructive field-based measurements to improve scaled-up plot level data to the landscape level. As intended, we are confident that this study will help North American land managers parse subtle morphological trait variation in Typha, enhancing wetland conservation and ecological restoration efforts.
Data availability statement
The original contributions presented in the study are publicly available. This data can be found here: https://osf.io/74yvr.
Author contributions
BO: Conceptualization, Data curation, Formal analysis, Funding acquisition, Methodology, Project administration, Writing – original draft, Writing – review & editing. CR: Data curation, Methodology, Writing – original draft. PG: Conceptualization, Data curation, Formal analysis, Funding acquisition, Methodology, Writing – original draft, Writing – review & editing. SL: Conceptualization, Data curation, Formal analysis, Funding acquisition, Investigation, Methodology, Writing – original draft, Writing – review & editing.
Funding
The author(s) declare financial support was received for the research, authorship, and/or publication of this article. Funding was provided by Loyola University Chicago: The Loyola Undergraduate Research Opportunities Program and the Lee Botts Great Lakes Research and Advocacy Fellowship provided field research support for CR’s undergraduate research project. Loyola’s School of Environmental Sustainability and the Office of Research Services provided publication fee support for the manuscript.
Conflict of interest
The authors declare that the research was conducted in the absence of any commercial or financial relationships that could be construed as a potential conflict of interest.
Publisher’s note
All claims expressed in this article are solely those of the authors and do not necessarily represent those of their affiliated organizations, or those of the publisher, the editors and the reviewers. Any product that may be evaluated in this article, or claim that may be made by its manufacturer, is not guaranteed or endorsed by the publisher.
References
Angeloni, N. L., Jankowski, K. J., Tuchman, N. C., Kelly, J. J. (2006). Effects of an invasive cattail species (Typha × glauca) on sediment nitrogen and microbial community composition in a freshwater wetland. FEMS Microbiol. Lett. 263, 86–92. doi: 10.1111/fml.2006.263.issue-1
Bansal, S., Lishawa, S. C., Newman, S., Tangen, B. A., Wilcox, D., Albert, D., et al. (2019). Typha (Cattail) invasion in North American wetlands: Biology, regional problems, impacts, ecosystem services, and management. Wetlands 39, 645–684. doi: 10.1007/s13157-019-01174-7
Bartoń, K. (2023) MuMIn: Multi-Model Inference. R package version 1.47.5. Available online at: https://CRAN.R-project.org/package=MuMIn.
Boers, A. M., Zedler, J. B. (2008). Stabilized water levels and Typha invasiveness. Wetlands 28, 676–685. doi: 10.1672/07-223.1
Bunbury-Blanchette, A. L., Freeland, J. R., Dorken, M. E. (2015). Hybrid Typha×glauca outperforms native T. latifolia under contrasting water depths in a common garden. Basic Appl. Ecol. 16, 394–402. doi: 10.1016/j.baae.2015.04.006
Carson, B. D., Lishawa, S. C., Tuchman, N. C., Monks, A. M., Lawrence, B. A., Albert, D. A. (2018). Harvesting invasive plants to reduce nutrient loads and produce bioenergy: An assessment of Great Lakes coastal wetlands. Ecosphere 9, e02320. doi: 10.1002/ecs2.2320
Catchpole, W. R., Wheeler, C. J. (1992). Estimating plant biomass: A review of techniques. Aust. J. Ecol. 17, 121–131. doi: 10.1111/j.1442-9993.1992.tb00790.x
Chen, R.-C., Dewi, C., Huang, S.-W., Caraka, R. E. (2020). Selecting critical features for data classification based on machine learning methods. J. Big Data 7, 52. doi: 10.1186/s40537-020-00327-4
Ciotir, C., Kirk, H., Row, J. R., Freeland, J. R. (2013). Intercontinental dispersal of Typha angustifolia and T. latifolia between Europe and North America has implications for Typha invasions. Biol. Invasions 15, 1377–1390. doi: 10.1007/s10530-012-0377-8
Crystal-Ornelas, R., Lockwood, J. L. (2020). The ‘known unknowns’ of invasive species impact measurement. Biol. Invasions 22, 1513–1525. doi: 10.1007/s10530-020-02200-0
Csencsics, D., Brodbeck, S., Holderegger, R. (2010). Cost-effective, species-specific microsatellite development for the endangered dwarf bulrush (Typha minima) using Next-Generation Sequencing Technology. J. Heredity 101, 789–793. doi: 10.1093/jhered/esq069
Currie, W. S., Goldberg, D. E., Martina, J., Wildova, R., Farrer, E., Elgersma, K. J. (2014). Emergence of nutrient-cycling feedbacks related to plant size and invasion success in a wetland community–ecosystem model. Ecol. Model. 282, 69–82. doi: 10.1016/j.ecolmodel.2014.01.010
de Kroons, H., Hutchings, M. J. (1995). Morphological Plasticity in clonal plants: The foraging concept reconsidered. J. Ecol. 83, 143–152. doi: 10.2307/2261158
Ellstrand, N. C., Schierenbeck, K. A. (2000). Hybridization as a stimulus for the evolution of invasiveness in plants? Proc. Natl. Acad. Sci. 97, 7043–7050. doi: 10.1073/pnas.97.13.7043
Freeland, J., Ciotir, C., Kirk, H. (2013). Regional differences in the abundance of native, introduced, and hybrid Typha spp. In northeastern North America influence wetland invasions. Biol. Invasions 15, 2651–2665. doi: 10.1007/s10530-013-0481-4
Galatowitsch, S. M., Anderson, N. O., Ascher, P. D. (1999). Invasiveness in wetland plants in temperate North America. Wetlands 19, 733–755. doi: 10.1007/BF03161781
Geddes, P., Murphy, L., Astudillo-Scalia, Y., Blasini, D., Nugent, S., Ríos, M. J., et al. (2021). Microsatellite markers reveal unprecedented high frequencies of hybridization among Typha species in the Midwestern US. Wetlands 41, 24. doi: 10.1007/s13157-021-01429-2
Goulet, B. E., Roda, F., Hopkins, R. (2017). Hybridization in plants: Old ideas, new techniques. Plant Physiol. 173, 65–78. doi: 10.1104/pp.16.01340
Grace, J. B., Wetzel, R. G. (1982). Niche differentiation between two rhizomatous plant species: Typha latifolia and Typha angustifolia. Can. J. Bot. 60, 46–57. doi: 10.1139/b82-007
Gronewold, A. D., Rood, R. B. (2019). Recent water level changes across Earth’s largest lake system and implications for future variability. J. Great Lakes Res. 45, 1–3. doi: 10.1016/j.jglr.2018.10.012
Hall, S. J., Zedler, J. B. (2010). Constraints on sedge meadow self-restoration in urban wetlands. Restor. Ecol. 18, 671–680. doi: 10.1111/j.1526-100X.2008.00498.x
Hauser, L., Seeb, J. E. (2008). Advances in molecular technology and their impact on fisheries genetics. Fish Fisheries 9, 473–486. doi: 10.1111/j.1467-2979.2008.00306.x
Henry, M., Bombelli, A., Trotta, C., Alessandrini, A., Birigazzi, L., Sola, G., et al. (2013). GlobAllomeTree: International platform for tree allometric equations to support volume, biomass and carbon assessment. iForest - Biogeosciences Forestry 6, 326. doi: 10.3832/ifor0901-006
Hochholdinger, F., Baldauf, J. A. (2018). Heterosis in plants. Curr. Biol. 28, R1089–R1092. doi: 10.1016/j.cub.2018.06.041
Horppila, J., Nurminen, L. (2001). The effect of an emergent macrophyte (Typha angustifolia) on sediment resuspension in a shallow north temperate lake. Freshw. Biol. 46, 1447–1455. doi: 10.1046/j.1365-2427.2001.00765.x
Kirk, H., Connolly, C., Freeland, J. R. (2011). Molecular genetic data reveal hybridization between Typha angustifolia and Typha latifolia across a broad spatial scale in eastern North America. Aquat. Bot. 95, 189–193. doi: 10.1016/j.aquabot.2011.05.007
Kuehn, M. M., White, B. N. (1999). Morphological analysis of genetically identified cattails Typha latifolia, Typha angustifolia, and Typha ×glauca. Can. J. Bot. 77, 906–912. doi: 10.1139/b99-037
Kuhn, M. (2008). Building predictive models in R using the caret package. J. Stat. Software 28, 1–26. doi: 10.18637/jss.v028.i05
Larkin, D. J., Freyman, M. J., Lishawa, S. C., Geddes, P., Tuchman, N. C. (2012). Mechanisms of dominance by the invasive hybrid cattail Typha × glauca. Biol. Invasions 14, 65–77. doi: 10.1007/s10530-011-0059-y
Lawrence, B. A., Bourke, K., Lishawa, S. C., Tuchman, N. C. (2016). Typha invasion associated with reduced aquatic macroinvertebrate abundance in northern Lake Huron coastal wetlands. J. Great Lakes Res. 42, 1412–1419. doi: 10.1016/j.jglr.2016.08.009
Liland, K. H., Mevik, B.-H., Wehrens, R. (2023) Pls: Partial Least Squares and Principal Component Regression. R package version 2.8-2. Available online at: https://CRAN.R-project.org/package=pls.
Lishawa, S. C., Albert, D. A., Tuchman, N. C. (2010). Water level decline promotes Typha X glauca establishment and vegetation change in Great Lakes coastal wetlands. Wetlands 30, 1085–1096. doi: 10.1007/s13157-010-0113-z
Lishawa, S. C., Dunton, E. M., Pearsall, D. R., Monks, A. M., Himmler, K. B., Carson, B. D., et al. (2020). Wetland waterbird food resources increased by harvesting invasive cattails. J. Wildlife Manage. 84, 1326–1337. doi: 10.1002/jwmg.21912
Lishawa, S. C., Lawrence, B. A., Albert, D. A., Tuchman, N. C. (2015). Biomass harvest of invasive Typha promotes plant diversity in a Great Lakes coastal wetland. Restor. Ecol. 23, 228–237. doi: 10.1111/rec.12167
Mallet, J. (2005). Hybridization as an invasion of the genome. Trends Ecol. Evol. 20, 229–237. doi: 10.1016/j.tree.2005.02.010
McKenzie-Gopsill, A., Kirk, H., Drunen, W. V., Freeland, J. R., Dorken, M. E. (2012). No evidence for niche segregation in a North American Cattail (Typha) species complex. Ecol. Evol. 2, 952–961. doi: 10.1002/ece3.225
Mitchell, N., Campbell, L. G., Ahern, J. R., Paine, K. C., Giroldo, A. B., Whitney, K. D. (2019). Correlates of hybridization in plants. Evol. Lett. 3, 570–585. doi: 10.1002/evl3.146
Niklas, K. J., Enquist, B. J. (2002). On the vegetative biomass partitioning of seed plant leaves, stems, and roots. Am. Nat. 159, 482–497. doi: 10.1086/339459
Ohsowski, B. M., Dunfield, K. E., Klironomos, J. N., Hart, M. M. (2016). Improving plant biomass estimation in the field using partial least squares regression and ridge regression. Botany 94, 501–508. doi: 10.1139/cjb-2016-0009
Peters, A., Hothorn, T. (2023) Ipred: Improved Predictors. R package version 0.9-14. Available online at: https://CRAN.R-project.org/package=ipred.
Pieper, S. J., Nicholls, A. A., Freeland, J. R., Dorken, M. E. (2017). Asymmetric hybridization in cattails (Typha spp.) and its implications for the evolutionary maintenance of native Typha latifolia. J. Heredity 108, 479–487. doi: 10.1093/jhered/esx036
Pottier, J., Jabot, F. (2017). Non-destructive biomass estimation of herbaceous plant individuals: A transferable method between contrasted environments. Ecol. Indic. 72, 769–776. doi: 10.1016/j.ecolind.2016.08.030
R Core Team (2023). R: A Language and Environment for Statistical Computing (Vienna: R Foundation for Statistical Computing). Available at: https://www.R-project.org/.
Sagarin, R., Carlsson, J., Duval, M., Freshwater, W., Godfrey, M. H., Litaker, W., et al. (2009). Bringing molecular tools into environmental resource management: Untangling the molecules to policy pathway. PloS Biol. 7, e1000069. doi: 10.1371/journal.pbio.1000069
Schrank, A. J., Lishawa, S. C. (2019). Invasive cattail reduces fish diversity and abundance in the emergent marsh of a Great Lakes coastal wetland. J. Great Lakes Res. 45, 1251–1259. doi: 10.1016/j.jglr.2019.09.013
Schuelke, M. (2000). An economic method for the fluorescent labeling of PCR fragments. Nat. Biotechnol. 18, 233–234. doi: 10.1038/72708
Smith, S. G. (1967). Experimental and natural hybrids in North American Typha (Typhaceae). Am. Midland Nat. 78, 257–287. doi: 10.2307/2485231
Snow, A. A., Travis, S. E., Wildová, R., Fér, T., Sweeney, P. M., Marburger, J. E., et al. (2010). Species-specific SSR alleles for studies of hybrid cattails (Typha latifolia × T. angustifolia; Typhaceae) in North America. Am. J. Bot. 97, 2061–2067. doi: 10.3732/ajb.1000187
Todesco, M., Pascual, M. A., Owens, G. L., Ostevik, K. L., Moyers, B. T., Hübner, S., et al. (2016). Hybridization and extinction. Evolutionary Appl. 9, 892–908. doi: 10.1111/eva.12367
Travis, S. E., Marburger, J. E., Windels, S., Kubátová, B. (2010). Hybridization dynamics of invasive cattail (Typhaceae) stands in the Western Great Lakes Region of North America: A molecular analysis. J. Ecol. 98, 7–16. doi: 10.1111/j.1365-2745.2009.01596.x
Travis, S. E., Marburger, J. E., Windels, S. K., Kubátová, B. (2011). Clonal structure of invasive cattail (Typhaceae) stands in the Upper Midwest region of the US. Wetlands 31, 221–228. doi: 10.1007/s13157-010-0142-7
Trebitz, A. S. (2006). Characterizing seiche and tide-driven daily water level fluctuations affecting coastal ecosystems of the Great Lakes. J. Great Lakes Res. 32, 102–116. doi: 10.3394/0380-1330(2006)32[102:CSATDW]2.0.CO;2
Tsyusko-Omeltchenko, O. V., Schable, N. A., Smith, M. H., Glenn, T. C. (2003). Microsatellite loci isolated from narrow-leaved cattail Typha angustifolia. Mol. Ecol. Notes 3, 535–538. doi: 10.1046/j.1471-8286.2003.00502.x
Tuchman, N. C., Larkin, D. J., Geddes, P., Wildova, R., Jankowski, K., Goldberg, D. E. (2009). Patterns of environmental change associated with Typha x glauca invasion in a Great Lakes coastal wetland. Wetlands 29, 964–975. doi: 10.1672/08-71.1
Vaz, A. S., Alcaraz-Segura, D., Campos, J. C., Vicente, J. R., Honrado, J. P. (2018). Managing plant invasions through the lens of remote sensing: A review of progress and the way forward. Science of The Total Environment. 642, 1328–1339. doi: 10.1016/j.scitotenv.2018.06.134
Venables, W. N., Ripley, B. D. (2013). Modern Applied Statistics with S-PLUS (New York: Springer Science & Business Media).
Voss, E. G., Reznicek, A. A. (2012). Field Manual of Michigan Flora (Ann Arbor: University of Michigan Press). doi: 10.3998/mpub.345399
Wasko, J. D., McGonigle, T. P., Goldsborough, L. G., Wrubleski, D. A., Badiou, P. H., Armstrong, L. M. (2022). Use of shoot dimensions and microscopic analysis of leaves to distinguish Typha latifolia, Typha angustifolia, and their invasive hybrid Typha xglauca. Wetlands Ecol. Manage. 30, 19–33. doi: 10.1007/s11273-021-09836-2
Woo, I., Zedler, J. B. (2002). Can nutrients alone shift a sedge meadow towards dominance by the invasive Typha × glauca. Wetlands 22, 509–521. doi: 10.1672/0277-5212(2002)022[0509:CNASAS]2.0.CO;2
Zapfe, L., Freeland, J. R. (2015). Heterosis in invasive F1 cattail hybrids (Typha × glauca). Aquat. Bot. 125, 44–47. doi: 10.1016/j.aquabot.2015.05.004
Keywords: Typha identification, biomass prediction, field assessment, Typha latifolia, ecological restoration, Typha × glauca, conservation
Citation: Ohsowski BM, Redding C, Geddes P and Lishawa SC (2024) Field-based measurement tools to distinguish clonal Typha taxa and estimate biomass: a resource for conservation and restoration. Front. Plant Sci. 15:1348144. doi: 10.3389/fpls.2024.1348144
Received: 01 December 2023; Accepted: 27 February 2024;
Published: 12 March 2024.
Edited by:
Jianping Tao, Southwest University, ChinaReviewed by:
P. E. Rajasekharan, Indian Institute of Horticultural Research (ICAR), IndiaSuresh Chandra Subedi, Arkansas Tech University, United States
Copyright © 2024 Ohsowski, Redding, Geddes and Lishawa. This is an open-access article distributed under the terms of the Creative Commons Attribution License (CC BY). The use, distribution or reproduction in other forums is permitted, provided the original author(s) and the copyright owner(s) are credited and that the original publication in this journal is cited, in accordance with accepted academic practice. No use, distribution or reproduction is permitted which does not comply with these terms.
*Correspondence: Brian M. Ohsowski, Ym9oc293c2tpQGx1Yy5lZHU=