 Pierre-Mathieu Pélissier1,2
 Boris Parizot1,2
 Letian Jia3
 Alexa De Knijf1,2Vera Goossens4,5
 Pascal Gantet6
 Antony Champion6Dominique Audenaert4,5
 Wei Xuan3Tom Beeckman1,2*
 Hans Motte1,2*
- 1Department of Plant Biotechnology and Bioinformatics, Ghent University, Ghent, Belgium
- 2VIB Center for Plant Systems Biology, Ghent, Belgium
- 3State Key Laboratory of Crop Genetics & Germplasm Enhancement and MOA Key Laboratory of Plant Nutrition and Fertilization in Lower Middle Reaches of the Yangtze River, Nanjing Agricultural University, Nanjing, China
- 4Center for Bioassay Development and Screening (C-BIOS), Ghent University, Ghent, Belgium
- 5VIB Screening Core, Ghent, Belgium
- 6UMR DIADE, Université de Montpellier, IRD, CIRAD, Montpellier, France
Nitrogen is an essential nutrient for plants and a major determinant of plant growth and crop yield. Plants acquire nitrogen mainly in the form of nitrate and ammonium. Both nitrogen sources affect plant responses and signaling pathways in a different way, but these signaling pathways interact, complicating the study of nitrogen responses. Extensive transcriptome analyses and the construction of gene regulatory networks, mainly in response to nitrate, have significantly advanced our understanding of nitrogen signaling and responses in model plants and crops. In this study, we aimed to generate a more comprehensive gene regulatory network for the major crop, rice, by incorporating the interactions between ammonium and nitrate. To achieve this, we assessed transcriptome changes in rice roots and shoots over an extensive time course under single or combined applications of the two nitrogen sources. This dataset enabled us to construct a holistic co-expression network and identify potential key regulators of nitrogen responses. Next to known transcription factors, we identified multiple new candidates, including the transcription factors OsRLI and OsEIL1, which we demonstrated to induce the primary nitrate-responsive genes OsNRT1.1b and OsNIR1. Our network thus serves as a valuable resource to obtain novel insights in nitrogen signaling.
Introduction
Nitrogen, mainly in the form of nitrate (NO3-) or ammonium (NH4+), is a key nutrient for plant development and a limiting factor for crop yield and grain quality (Makino, 2011). Nitrogen application soared with the green revolution and is expected to keep growing (Good et al., 2004; Food and Agriculture Organization of the United Nations [FAO], 2017). However, major staple crops use less than half of the nitrogen applied through fertilizers, the rest being lost by leaching or volatilization, causing economic losses and ecological damages such as eutrophication and greenhouse gas emissions (Raun and Johnson, 1999; Bouwman et al., 2002; Robertson and Vitousek, 2009; Sutton et al., 2011; Coskun et al., 2017; Beeckman et al., 2018, Beeckman et al., 2024). Therefore, a better understanding of how plants respond and assimilate nitrogen is of great interest to improve their nitrogen use efficiency (NUE). Attempts to improve NUE have often targeted single genes involved in nitrogen metabolism or transport (McAllister et al., 2012). In contrast, transcription-factor-centered approaches yielded promising results, as one transcription factor can potentially regulate several genes Past research has elucidated complex nitrogen-related pathways governed by transcription factors. However, further exploration is warranted to advance our understanding of regulatory networks involved in NUE, particularly in crops (Ueda and Yanagisawa, 2018).
NUE is a complex trait not only because of complex signaling, but also because plants react differently to nitrate and ammonium. Most plants prefer nitrate over ammonium and are stressed when ammonium is provided alone or in high quantities (Kronzucker et al., 2001; Britto and Kronzucker, 2013; Bittsanszky et al., 2015; Hachiya and Sakakibara, 2016), but rice is tolerating ammonium reasonably well (Sasakawa and Yamamoto, 1978). Besides fulfilling its role as a nutrient, nitrate also acts as a signaling molecule at the local and the systemic level (Crawford, 1995; Krouk et al., 2010; Xuan et al., 2017; Pélissier et al., 2021), inducing responses in Arabidopsis as early as 3 minutes after treatment (Krouk et al., 2010) while this appears to not be the case for ammonium. At least in Arabidopsis, and to some extent in rice, knowledge on nitrate response regulation increased considerably due to systems biology approaches aiming at characterizing transcriptional networks (Gaudinier et al., 2018; Varala et al., 2018; Ueda et al., 2020). Both in rice and Arabidopsis, nitrate binds to NITRATE TRANSPORTER (NRT) transceptors (OsNRT1.1b or AtNRT1.1 in rice or Arabidopsis, respectively), which trigger Ca2+ signaling and activate different Ca2+-sensor protein kinases (CPKs) that phosphorylate NIN-LIKE PROTEIN (NLP) transcription factors: AtNLP6 and AtNLP7 in Arabidopsis or OsNLP3 in rice. As a result, NLPs are retained in the nucleus and regulate hundreds of nitrate responsive genes triggering a complex cascade of systemic signaling and feedback loops (Marchive et al., 2013; Guan et al., 2017; Liu et al., 2017; Hu et al., 2019; Alvarez et al., 2020). Nitrate is also perceived directly by AtNLP7, which leads to a de-repression of this transcription factor (Liu et al., 2022).
In contrast to nitrate, no ammonium signaling mechanism has been discovered, at least not in plants. Ammonium-induced changes in the root system architecture or other responses seemed to be primarily caused by changes in internal cellular pH and auxin mobility rather than changes induced by a biochemical signaling pathway (Jia et al., 2020; Meier et al., 2020; Hachiya et al., 2021). These results argue that ammonium, in contrast to nitrate, does not directly affect a transcriptional pathway. Notably, nitrate and nitrate signaling affect ammonium responses and NRT1.1-dependent signaling plays crucial roles in controlling ammonium uptake and assimilation (Jian et al., 2018; Wu et al., 2019; Fang et al., 2021; Yan et al., 2023), while nitrate is reduced to ammonium during assimilation and partially elicits an ammonium response (Wang et al., 2004). Conversely ammonium affect nitrate uptakes and other responses (Wang et al., 2009b; Hachiya and Sakakibara, 2016). Hence, there is a clear interaction between these two nitrogen sources and variations in one will inevitably affect the overall response. This interplay is important to consider in network analysis, and could help to uncover regulatory mechanisms that might be overlooked if only one nitrogen source is considered. Genes that respond to both nitrogen sources, for example, can complicate the identification of specific responses to one nitrogen source. Considering both allows for distinguishing between the different responses, can refine network analysis and is potentially instrumental in elucidating otherwise overlooked regulatory mechanisms. Although several studies investigated the responses to nitrate, ammonium and their co-application in Arabidopsis (Patterson et al., 2010; Ristova et al., 2016) and rice (Obertello et al., 2015; Chandran et al., 2016; Yang et al., 2017; Fu et al., 2023), they often lack an extensive time-course necessary for construction of gene regulatory networks.
Here, to enable a better view on the nitrogen response and its regulatory network in rice, we conducted an extensive time-course and genome-wide transcriptional analysis both in roots and shoots and in responses to ammonium, nitrate, or the combination of both. We used this dataset to construct a gene co-expression network which allowed us to reveal several transcription factors with a possible role in nitrogen signaling, and showed that the transcription factors OsRLI1 and OsEIL1 are sufficient to activate a nitrate response. As such, our dataset does not only provide a new resource to retrieve the genome-wide gene expression in response to different nitrogen sources, but is also valuable to get insights into nitrogen signaling in rice, and by extension, in crops.
Results
Phenotypic responses of rice to different nitrogen forms
To investigate the response of rice to different nitrogen forms, we used a hydroponic system in which ammonium and/or nitrate could be supplemented to the medium. 5mM of nitrate (NO3- as KNO3), 5mM of ammonium (NH4+ as (NH4)2SO4), an equimolar combination of both nitrogen forms (2.5mM of NH4NO3) or a control (5mM K+ as K2SO4) with potassium (K+) balanced at 5mM among all treatments as K2SO4, were supplemented into the nitrogen-free growing media of the rice seedlings 5 days after germination and the seedlings were let grown for 10 more days before phenotyping (see Materials & Methods for details on the procedure). In our set-up, supplementation with ammonium and nitrate had a similar positive effect on shoot biomass, while co-application of both forms showed a synergistic positive effect (Figure 1A). The lateral root density positively correlated with the shoot biomass and showed a similar synergistic response to the combined treatment. The root system treated with nitrate had a long primary root with long lateral roots close to the root-hypocotyl junction, while the ammonium-supplemented root system had a dense network of small lateral roots evenly spread over the primary root (Figures 1B–E). Co-application seemed to result in a combination of the two phenotypes. Finally, we observed an increase in leaf chlorophyll content upon treatment by ammonium or ammonium-nitrate but not by nitrate alone (Figure 1F).
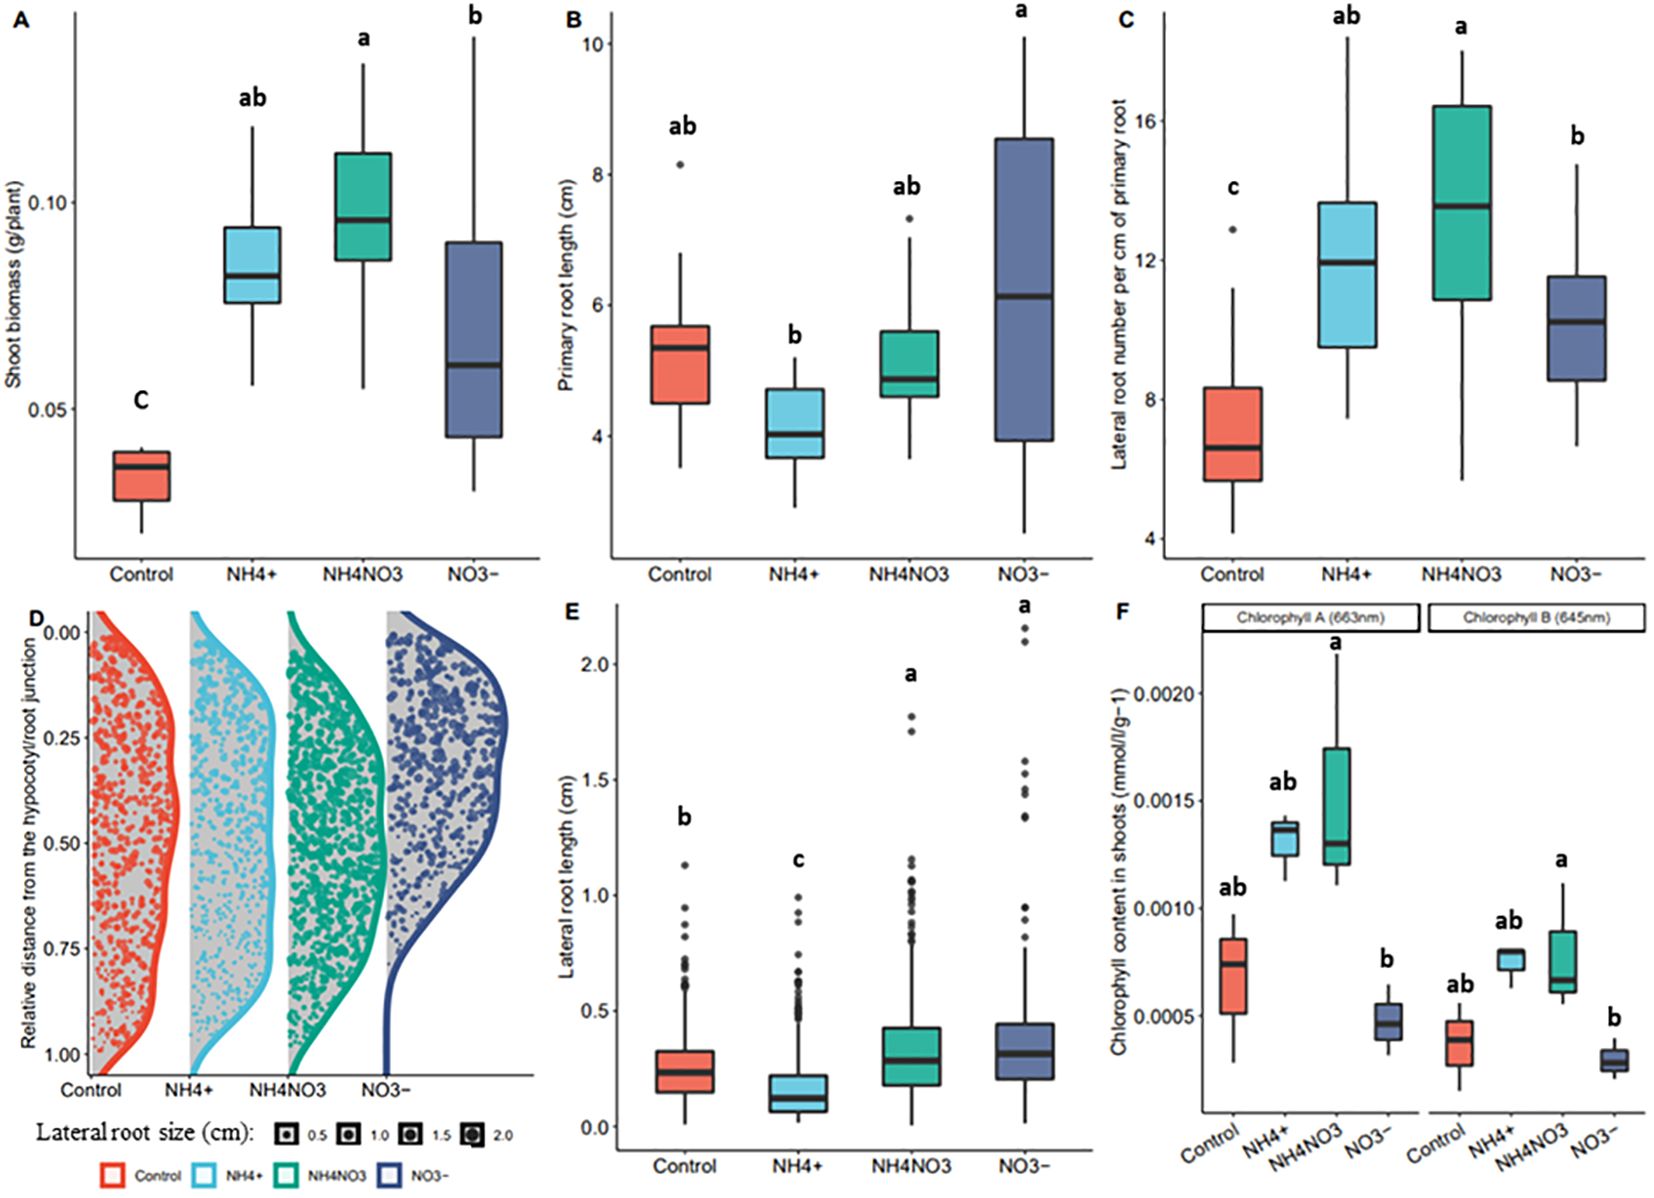
Figure 1. Rice phenotype in response to different nitrogen forms. Effects of nitrate (NO3-), ammonium (NH4+) and equimolar combination of both forms (NH4NO3) on rice seedlings grown for 5 days on nitrogen free medium and supplemented with the different treatments for 10 days. Boxplots lower side, middle line and upper side represent the median, the 25th and 75th percentiles, respectively (interquartile range or IQR). Boxplots whiskers represent data falling within a 1.5xIQR distance, measurements beyond this distance are plotted as single points. (A) fresh shoot biomass per plant (n=15). (B) Primary root length (n=15) (C) Emerged lateral root density (n=15) (D) Density plot of the distribution of lateral roots over the primary root. On the Y axis, 0.00 represents the root-hypocotyl junction, and 1.00 represents the root tip. The data is normalized on the primary root length. The length of each lateral root is represented by the size of the dots. (E) Average lateral root length (n=15) (F) Leaf blade chlorophyll content (samples (n) are 5 seedlings pooled together, n=3). Different letters correspond to the post-hoc Tuckey’s test significance (p.value=0.05), performed after an ANOVA test, and showing significant differences between the samples.
Dynamic rice nitrogen transcriptome
We used the same hydroponic system as described above to collect samples for the transcriptomic analysis, but rice tissues were harvested soon after the nitrogen supplementation (see Material and Methods for details). In Arabidopsis, early response genes are induced as early as 12 minutes (NITRITE REDUCTASE1 (NIR1)), 15 minutes (NRT2.1 and NITRATE REDUCTASE1 (NIA1)) or 20 minutes (NITRATE TRANSPORTER1.1 (NRT1.1)) after nitrate treatment (Krouk et al., 2010). Therefore, to capture relevant transcriptional profiles, we sampled root and shoot tissue separately immediately (0h), 15 minutes, 1h, 2h, 4h, 12h, 24h and 48h after treatment and used these samples for RNA sequencing (RNA-seq) thereby generating an extensive dataset covering the nitrogen transcriptional responses in rice (Figure 2).
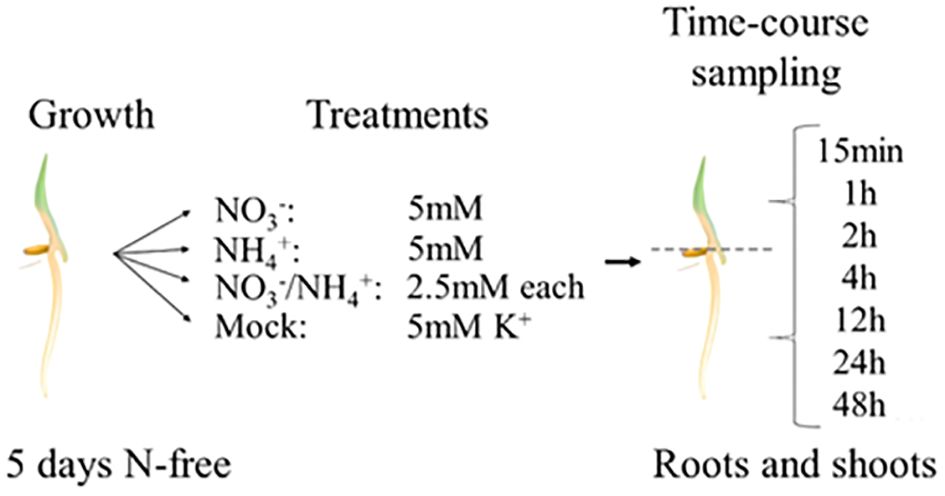
Figure 2. Experimental set-up of the RNA-seq.
We performed a pair-wise differential analysis to assess differential expression for each time point and treatment (Supplementary Dataset S1, Supplementary Dataset S2). Considering an absolute fold-change >2, and an adjusted p.value (FDR) < 0.05, a significant number of genes were differentially expressed by the treatments in the shoot or root and over the time-course (Supplementary Figures S1–S3; Supplementary Dataset S1, Supplementary Dataset S2). Nitrate, alone or in combination with ammonium, rapidly induced over 250 genes in the roots within 15 minutes (Supplementary Figures S1). This list includes homologues of Arabidopsis primary nitrate response genes such as LOB DOMAIN-CONTAINING PROTEIN37/38/39 (LBD37/38/39), NITRATE-INDUCIBLE GARP-TYPE TRANSCRIPTIONAL REPRESSOR1 (NIGT1), NRT1.1, nitrate and nitrite reductases, GLUCOSE-6-PHOSPHATE DEHYDROGENASE3 (G6PDH3) and ARABIDOPSIS NAC DOMAIN-CONTAINING protein 4 (NAC4) (Supplementary Dataset S1). In contrast, the response to ammonium was very weak at the 15 minutes-timepoint but a high number of differentially expressed genes was observed after 1h (Supplementary Figures S1, S3; Supplementary Dataset S1), including the transporter-encoding AMMONIUM TRANSPORTER1.2 (OsAMT1.2) and OsAMT2.2 or the amino acid assimilation enzyme-encoding ALANINE AMINOTRANSFERASE1 (OsAlaAT1), OsAlaAT2, ASPARAGINE SYNTHETASE1 (OsASN1), PHOSPHOENOL PYRUVATE CARBOXYKINASE1 (OsPPCK1), and GLUTAMATESYNTHASE1 (OsGLT1). The highest number of differentially expressed genes was in general observed with the combined treatment of ammonium and nitrate. The majority of these genes were also affected by either the ammonium or nitrate treatment (Supplementary Figure S1). Hence, the combined ammonium-nitrate response seems to largely reflect the sum of the individual responses.
In the shoot, a strong response only occurred from 4h onwards, primarily attributable to the nitrate treatment. The ammonium treatment resulted in a slower response, but from 12h onwards, large transcriptomic changes were observed as well (Supplementary Dataset S2, Supplementary Figure S2).
Co-expression network analysis identifies unique gene clusters responsive to nitrate and ammonium treatments in roots and shoots
To analyze the gene response profiles towards the different treatments, we built a co-expression network using the R package WGCNA (Langfelder and Horvath, 2008) for the most varying genes in the roots (18457) and shoots (18343). The network revealed 54 co-expression clusters in the roots and 55 in the shoots (Supplementary Figures S4, S5; Supplementary Datasets S1, S2). The accompanying edge and node tables, compatible with network visualization tools such as Cytoscape or Gephi can be downloaded at https://osf.io/2uzd3/. To provide access to these resources, we generated a Shiny app Supplementary Figure S6), https://www.psb.ugent.be/shiny/rice-response-to-nitrogen/). The user can query any of the 42189 rice genes to display the expression profile in response to the different nitrogen treatments. If the gene is also included in the 18457 genes or 18343 genes used for the co-expression network, the Eigengene of its WGNCA cluster and a correlation coefficient with highly correlated genes (biweight midcorrelation, computed during the gene co-expression network creation) is also displayed. The latter is also shown in Supplementary Datasets S3 and Supplementary Dataset S4, which facilitate the identification of highly co-expressed gene pairs. The cluster membership and associated p values indicating the contribution to the cluster profile for each gene as well as the number of connections to other genes within the same cluster are indicated in Supplementary Datasets S1, S2.
In the roots, we identified clusters specifically and early induced by nitrate (nitrate and ammonium-nitrate treatments only) containing transiently (‘green3’) or constitutively induced genes (‘thistle3’) (Figure 3; Supplementary Figure S4). We identified two clusters specifically induced by ammonium (‘darkslateblue’ and ‘deeppink1’). Two clusters of genes were induced by ammonium and with an approximately 4h delay by nitrate or weaker induction by nitrate, possibly due to the nitrate to ammonium reduction (‘mediumorchid’, ‘thistle4’). We identified small clusters with a specific response to ammonium (‘yellow3’) or nitrate (‘indianred3’), but no or very weak response to the combination of the two nitrogen forms, indicative for a countereffect of the other nitrogen form on these genes. Vice versa, we did not identify clusters of genes induced by the ammonium-nitrate treatment only. Some other clusters show a similar response to all nitrogen forms, and are likely related to the nitrogen nutrition. Most other clusters showed a high response in the mock as well or show irregular or variable expression profiles (Supplementary Figure S4).
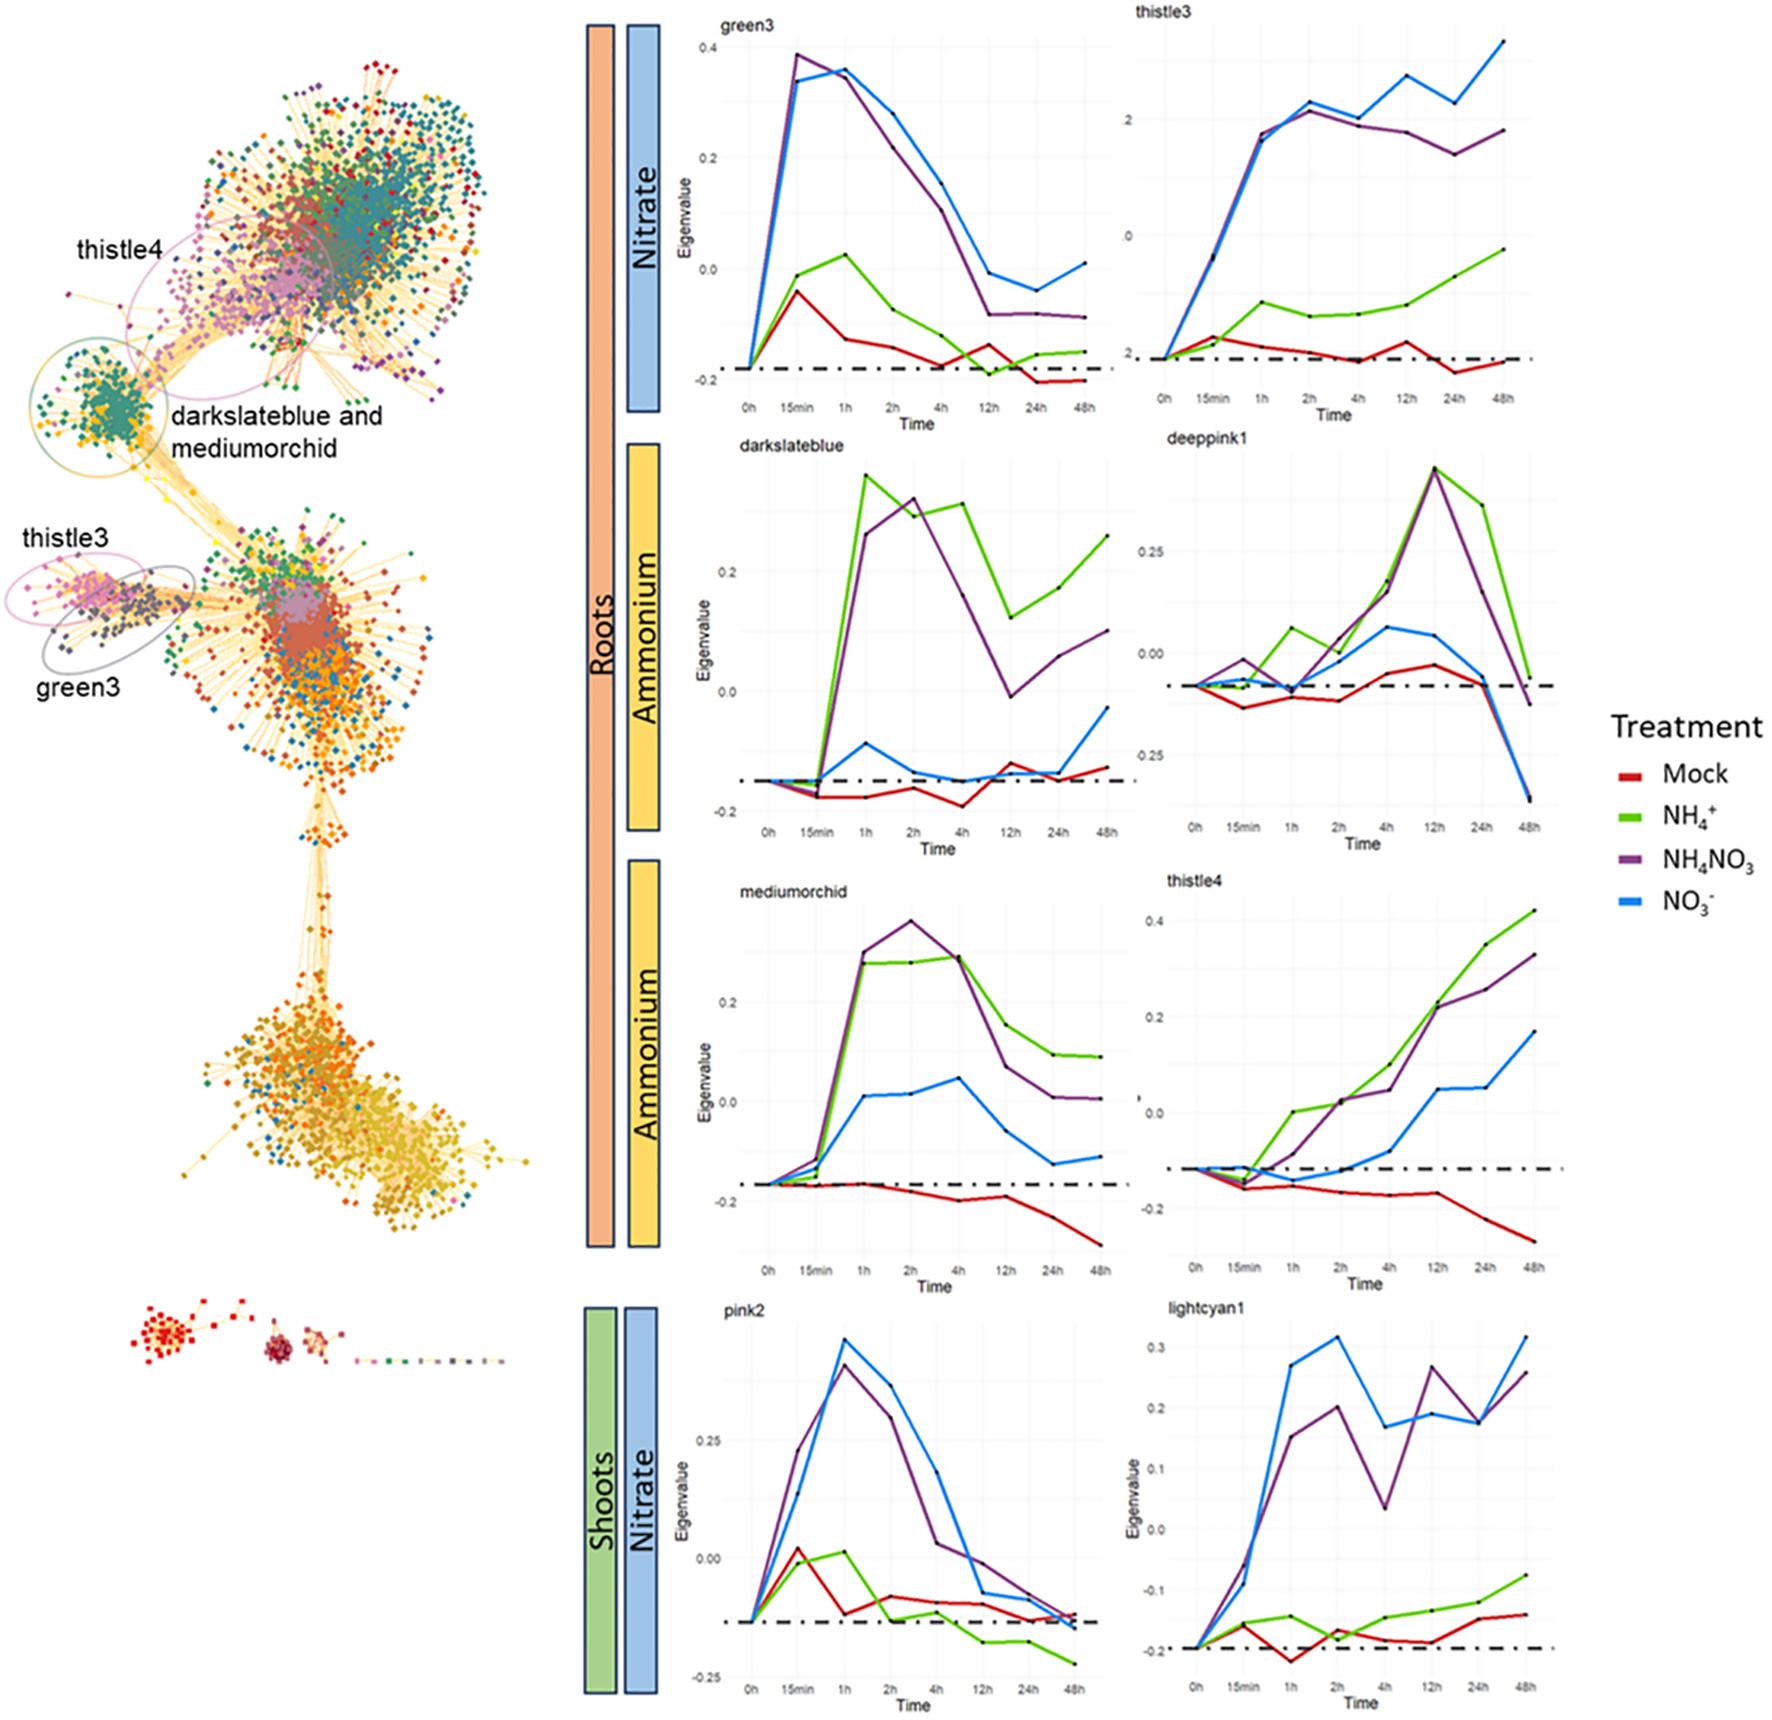
Figure 3. WGNCA co-expression network in the root and examples of WGNCA clusters in roots and shoots with a specific response to nitrate or ammonium. The expression profile of the clusters is shown by the eigengene, a representative for the overall expression and calculated as the first principal component of the gene expression data in the respective cluster. Root-specific clusters are indicated in the network. The cluster deeppink1, which is a relative small cluster, is not indicated.
In the shoots, we identified early responsive and nitrate-specific clusters that are similar to the nitrate-specific clusters in the roots, including a transient (‘pink2’, similar to ‘green3’) and a constitutive cluster of upregulated genes (‘lightcyan1’, similar to ‘thistle3’). Also a cluster of genes exclusively induced by nitrate could be observed (‘plum4’), similar as the ‘indianred3’ cluster in the roots. Contrary to the roots, we did not identify an ammonium-specific cluster in the shoots. Moreover, many more shoot clusters exhibit irregular patterns or show similar responses in the mock as in the treatments, making them of less interest. Overall, our co-expression networks revealed clusters of genes illustrating strong temporal and differential biological responses to the different forms of nitrogen provided.
To further investigate the clusters nature, we conducted a gene-ontology enrichment analysis (Supplementary Datasets S5, S6). We first compared the nitrate-specific clusters in the roots (‘green3’, ‘thistle3’) and the shoots (‘pink2’, ‘lightcyan1’). The genes ontologies enriched in both roots and shoots nitrate-specific clusters are highly similar and many genes are retrieved in both clusters: 72.8% of the 125 genes composing the nitrate-specific shoot clusters are retrieved in the 414 genes composing the nitrate-specific root clusters. The genes present in all these clusters are primarily related to nitrate assimilation and nitrate transport.
Highly enriched terms for the ammonium-specific clusters in the roots ‘darkslateblue’ and ‘deeppink1’ are mainly related to ammonium or amino acid assimilation and cellular respiration or ATP production. The ‘indianred3’ root cluster and the ‘plum4’ shoot cluster, containing genes that are exclusively induced by nitrate alone, are both highly enriched in iron-related terms. The root cluster ‘yellow3’ showing an exclusive response to ammonium alone, mainly concerns genes related to oxidative stress (Supplementary Datasets S3, S4).
Nitrogen network highlight known and novel transcription factors involved in the nitrate specific response
For further analysis of the co-expression network, we zoomed in on the two main nitrate-specific clusters in the root network (‘green3’ and ‘thistle3’) containing genes that were rapidly induced upon nitrate (Figure 4; Supplementary Table S1). With for example OsNRT1.1B (Os10g40600) and NITRATE REDUCTASE1 (OsNR1) (Os08g36480), this group contains typical nitrate sentinel genes. In the same group, we identified 38 transcription factors based on PlantTFDB v5.0 (https://planttfdb.gao-lab.org/) (Tian et al., 2019) (Supplementary Dataset S1). Several of these transcription factors have a high module membership and a high number of connections within one of the two clusters and could be designated as ‘hub’ genes with potentially an important role in the nitrate response or signaling (Figure 4, Table 1). A highly connected transcription factor in ‘green3’ is OsLBD38 (Os03g41330) which homologues were shown to be involved in nitrogen signaling in Arabidopsis or other species (Rubin et al., 2009; Teng et al., 2022), while OsLBD38 seems to be part of a conserved regulatory cluster between Arabidopsis and rice (Obertello et al., 2015). OsLBD38 is also the most connected transcription factor in the shoot cluster ‘lightcyan1’ (Supplementary Dataset S2). OsNIGT1 (Os02g22020), known to be an important transcriptional regulator of the nitrate signaling as well, is also present in ‘thistle3’ (Figure 4, Table 1; Supplementary Dataset S1) (Maeda et al., 2018). Several transcription factors have come forward that have not been previously related to nitrate response. OsGRAS49 (Os11g47890) for instance, which is to our knowledge not reported to have a role in the nitrate response, is a potential ‘hub’ transcription factor in the nitrate specific clusters in both roots and shoots (Supplementary Dataset S1, S2).
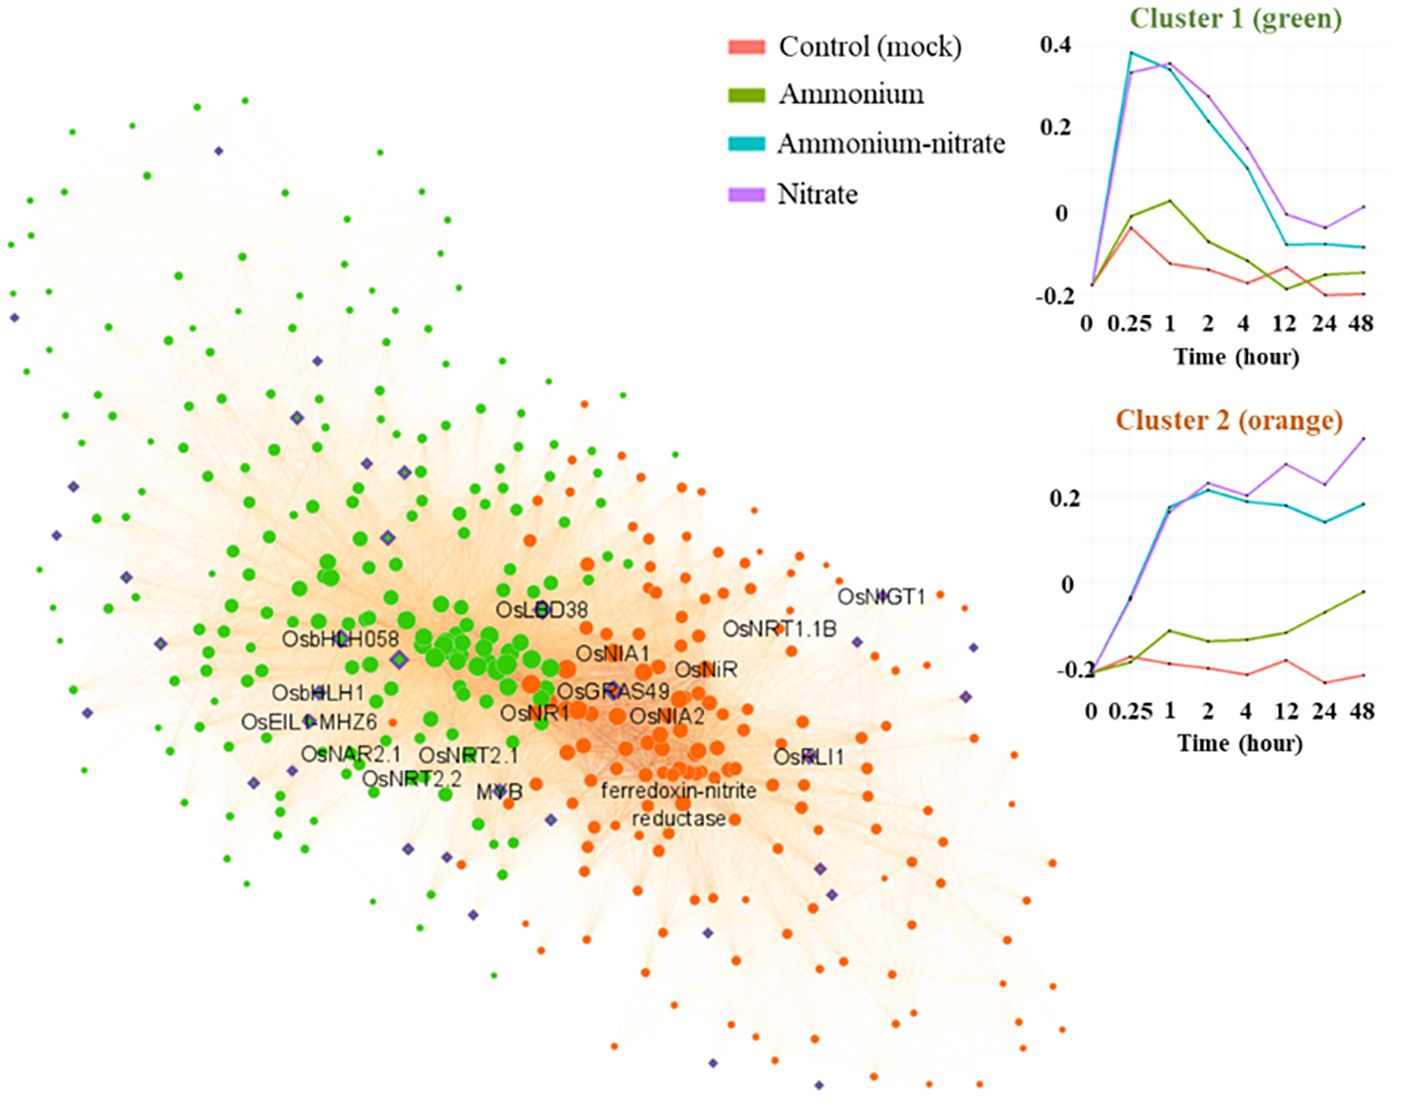
Figure 4. Co-expression network for the two main nitrate specific clusters. The green genes belong to the cluster ‘green3”, the orange ones to ‘thistle3’. The purple genes correspond to transcription factors. The transcription factors present in these clusters, together with their number of connections to other genes, are available in Table 1.
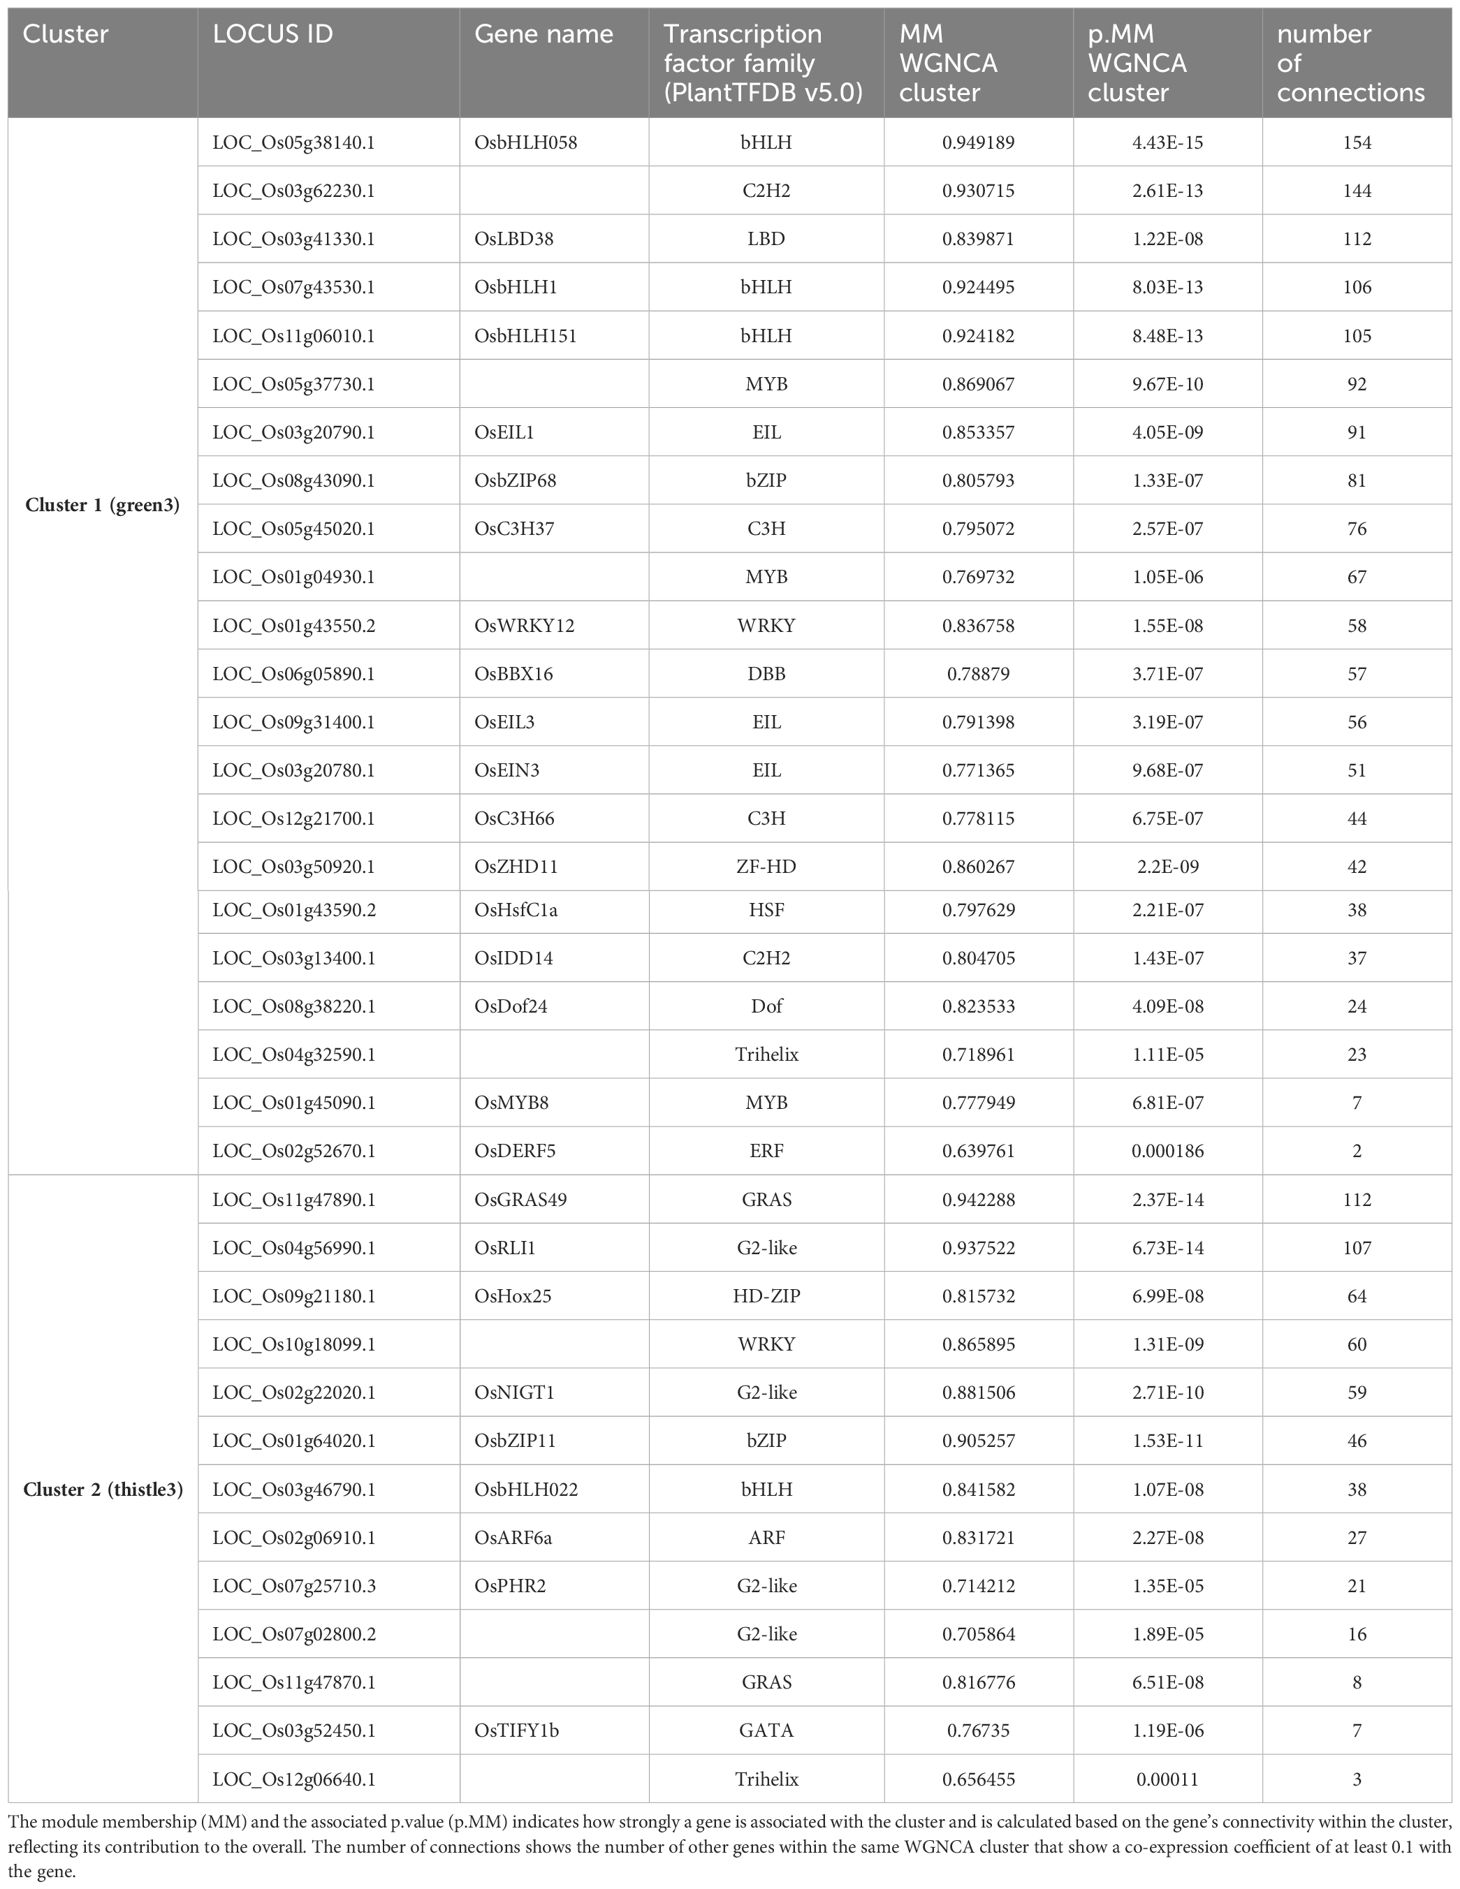
Table 1. Transcription factors with at least one connection in the clusters green3 or thistle3 as presented in Figure 4.
OsEIL1 and OsRLI1 affect the expression of core nitrate responsive genes
To assess these transcription factors possible role in nitrate signaling, we selected the top hub transcription factors in ‘green3’ and ‘thistle3’ (Figure 4; Supplementary Dataset S1) and tested whether they could induce the expression of the nitrate sentinel genes OsNRT1.1B and OsNR1. We used a rice protoplast transactivation assay to perform in vivo validation of the inferred regulatory relationships (Figure 5; Supplementary Figure S4): a reporter plasmid harboring the mEGFP gene under the control of the promoter of a putative target gene was co-transfected with an expression vector harboring the coding sequence of one of the selected transcription factor downstream of a constitutive promoter (p35s).
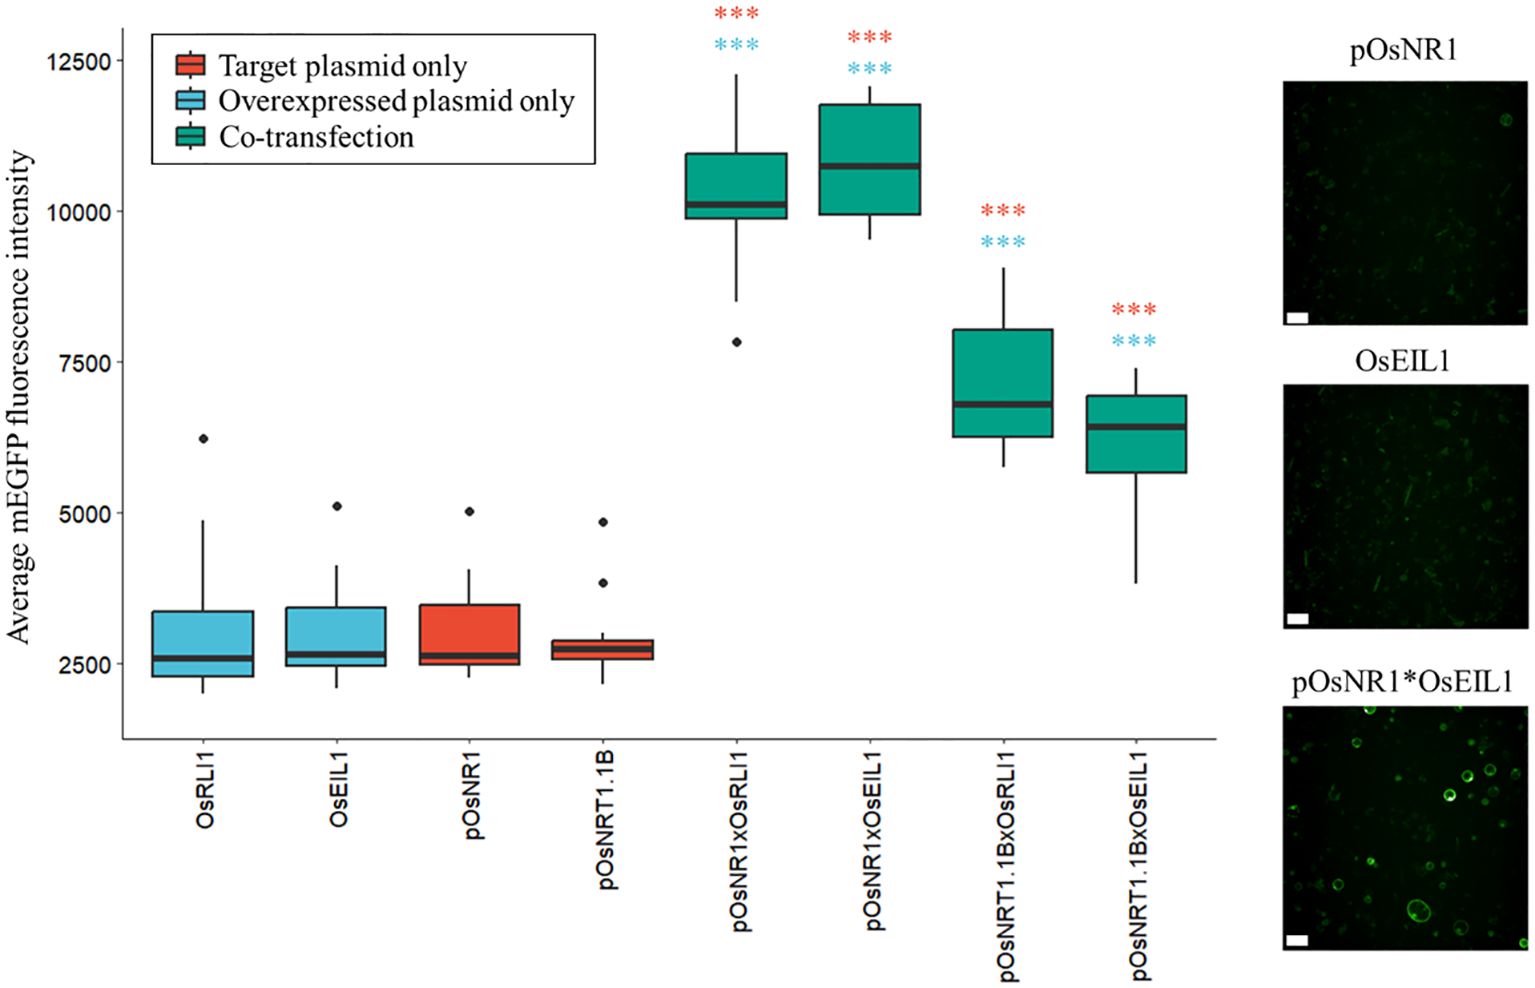
Figure 5. Protoplast transactivation assay. Induction of nitrate response genes by the two selected transcription factors in a rice protoplast transactivation assay. The boxplots show the average mEGFP fluorescence intensity per transfected protoplast (min. 118 protoplasts per condition, average 408) in one well (n=16). Samples (green) are co-transfected with the indicated combinations of inducer and target plasmids. The negative controls are only transfected with the inducer plasmid (blue) or with the target plasmids (red). Significance was determined by a one-way ANOVA followed by a Tukey’s post-hoc test (***p < 1.10-6, blue: sample versus the transcription factor control, red: versus the promoter of the reporter control). Confocal images show negative controls (pOsNR1 and pOsEIL1) and activation of OsNR1 by OsEIL1 (pOsNR1*OsEIL1) in the mEGFP channel (emission: 522nm, excitation: 488nm). Scale bars: 50µm.
We found two transcription factors that strongly induced the expression of OsNR1 and OsNRT1.1B: ETHYLENE INSENSITIVE3 (EIN3)-LIKE1 (OsEIL1)/MAHOHUZI6 (MHZ6) (Os03g20790) and REGULATOR OF LEAF INCLINATION1 (OsRLI1)/HIGHLY INDUCED BY NITRATE GENE1 (HINGE1) (Os04g56990) (Figure 5; Supplementary Figure S4).
To further investigate the role of OsRLI1 and OsEIL1 in rice nitrate response, we generated or acquired the mutant rice lines of oseil1 and osrli1. Both mutants showed a small increase in lateral root number and primary root length, but this phenotype was independent of the different nitrogen treatments (Supplementary Figure S5). To assess the importance of the transcription factors for the nitrate response, we treated the mutants with nitrate and tracked OsNRT1.1B and OsNR1 expression over time (Figure 6). The expression of OsNRT1.1B and OsNR1 was less induced by nitrate in the oseil1 mutant background than in the wild-type line (Figure 6A), which further supports a role of OsEIL1 for the induction of nitrate responsive genes and hence in the nitrate regulatory pathway. In contrast, we did not detect a significant difference of the nitrate responsive genes in the osrli1 background (Figure 6B).
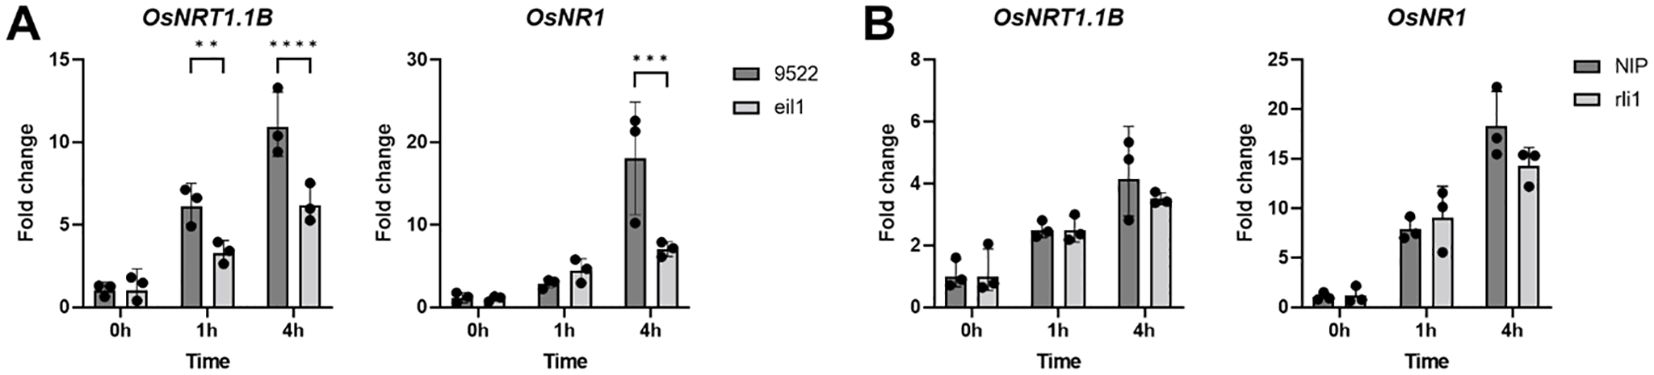
Figure 6. Gene expression of OsNRT1.1B and OsNR1 in osrli1 (A) or oseil1 (B) mutants or their respective wild-type background in roots of rice supplemented with NO3 in the form of KNO3. Significance was determined by a one-way ANOVA followed by a Tukey’s post-hoc test (**p < 0.01; ***p < 0.001; ****p < 0.0001).
Discussion
Co-expression network identifies novel candidates in nitrogen signaling
In this study, we provided a detailed overview of the transcriptional response of rice in roots and shoots to different nitrogen forms and generated a resource with the expression profile of any rice gene of interest in response to nitrate, ammonium, or the combination of both (all expressions profiles are available on https://www.psb.ugent.be/shiny/rice-response-to-nitrogen/). We used this dataset to generate a co-expression network, and identified clusters with a specific response to nitrogen in both roots and shoots. Furthermore, the co-expression network created the possibility to infer putative transcription factors/target genes relationships. As the different nitrogen treatments lead to distinct variations due to unique interactions, we anticipated uncovering otherwise overlooked regulatory relationships. We illustrated this by identifying new transcription factors with a role in nitrate signaling and showing the potential effect of two transcription factors, OsRLI1 and OsEIL1, on the induction of nitrate response.
OsRLI1 is a transcription factor involved in phosphate starvation signaling (Zhang et al., 2021). As a matter of fact, nitrate is known to affect the phosphate signaling pathway (Hu et al., 2019). Supporting this, our co-expression network revealed that OsRLI1 expression is correlated with the expression of several phosphate-starvation signature induced genes: INOSITOL-3-PHOSPHATE SYNTHASE ISOZYME1 (OsIPS1) (often used as a phosphate starvation reporter (Hou et al., 2005; Wang et al., 2009a; Dai et al., 2012)), 1-AMINOCYCLOPROPANE-1-CARBOXYLIC ACID SYNTHASE (OsACS) [involved in tolerance to phosphate starvation in rice (Lee et al., 2019)], SPX-MAJOR FACILITY SUPERFAMILY2 (OsSPX-MSF2) (involved in phosphate signaling/transport and induced by phosphate starvation (Wang et al., 2012)), and finally PHOSPHATE STARVATION RESPONSE2 (OsPHR2) which is the main regulator of phosphate starvation responses (Zhou et al., 2008) and inducer of OsRLI1 (Zhou et al., 2008; Wu and Wang, 2011; Zhang et al., 2021). OsRLI1 is moreover a close homologue of OsPHR2 and AtPHR1 and interacts just as these with SPX-domain containing proteins (Puga et al., 2014; Wang et al., 2014; Ruan et al., 2018; Zhang et al., 2021). OsPHR2 binds to OsSPX1/2/4 upon high phosphate. A low cellular inositol phosphate level, which depends on the phosphate level of the cell, disrupts the SPX retention of OsPHR2 which then is free to migrate to the nucleus where it binds to phosphate starvation inducible genes promoters (Wild et al., 2016; Crombez et al., 2019; Hu et al., 2019). At least the interaction with OsSPX4 depends also on nitrate levels: the transceptor OsNRT1.1B can promote OsSPX4 protein degradation in a nitrate-dependent manner, impacting directly the phosphate signaling pathway (Hu et al., 2019). OsRLI1 was shown to be induced by nitrate to induce the phosphate starvation response and finetune the N-P balance (Zhang et al., 2021). Our results show that it may also induce nitrate responsive genes, further complicating the phosphate-nitrate crosstalk.
OsEIL1 is a transcription factor involved in ethylene signaling (Yang et al., 2015a, Yang et al., 2015b) and regulates various genes such as transcription factors and metabolic genes (Dolgikh et al., 2019) and hormonal pathways (Chang et al., 2013). Here, we showed that OsEIL1 upregulation by nitrate correlates with OsNRT1.1B induction in rice. In Arabidopsis, nitrate induces ethylene production via induction of 1‐aminocyclopropane‐1‐carboxylic acid (ACC) synthases (ACS) and ACC oxidases (ACO), key enzymes in the ethylene biosynthesis pathway (Kende, 1993; Khan et al., 2015). Moreover, nitrate-induced expression of NRT1.1 requires ethylene signaling (Tian et al., 2009), but it is not known how these pathways exactly connect to each other. Additionally, certain nitrate transporters were shown to be directly controlled by ethylene (Zheng et al., 2013; Zhang et al., 2014). As in Arabidopsis, multiple ACS genes are in our dataset induced upon nitrate in our rice dataset, including OsACS2, OsACS5 and OsACS6, supporting a comparable pathway in rice and Arabidopsis. However, the absence of binding motifs for the OsEIL1 transcription factor (Hiraga et al., 2009) or ethylene response factors ERFs (Ohme-Takagi and Shinshi, 1995) in the promoters of OsNRT1.1B and OsNR1 argue for an indirect impact on these genes by OsEIL1. Still, our results show that OsEIL1 is not only able to – possibly indirectly – induce OsNRT1.1B and OsNR1, but also that OsEIL1 is important for the nitrate-induced expression of those genes, featuring OsEIL1 as a central transcription factor in the ethylene signaling-dependent nitrate response in rice.
Ammonium as a signal?
While we focused on the nitrate-specific clusters to investigate new candidate regulators, other parts of the co-expression network can be explored as well. For instance, the ammonium-specific cluster may provide valuable insights into ammonium signaling, although this could be more challenging due to the generally slower transcriptional response compared to nitrate. This slow transcriptional response indicates that ammonium does not directly activate a transcriptionally regulated signaling pathway. Still, ammonium is suggested to be signaling molecule (Liu and von Wirén, 2017). Bacteria have even been shown to possess an ammonium-sensing histidine kinase (Pflüger et al., 2018, Pflüger et al., 2024), but similar mechanisms have not yet been demonstrated in plants. Interestingly, the bacterial sensor is part of the ammonium transporter/methylamine permease/Rhesus family, which also includes plant AMT proteins that have been proposed to function as ammonium receptors (Liu and von Wirén, 2017). The fact that ammonium does not induce rapid transcriptional changes in rice does not exclude that ammonium can act as a potential signaling molecule via another biochemical pathway and indirectly trigger a transcriptional response. In this respect, it is important to note that we observed a strong transcriptional response starting 1 hour after treatment, with a considerable number of transcription factors identified in the ammonium-specific clusters, including for example MONOCULM1 (OsMOC1, Os04g35250), OsNAC5 (Os11g08210) and OsNLP6 (Os02g04340) that showed high expression levels (FC > 8) after 1 hour of treatment. Interestingly, OsNLP6 is a homolog of OsNLP1, OsNLP3, and OsNLP4 which are all known for their implication in nitrate and ammonium responses or in nitrogen use efficiency (Hu et al., 2019; Alfatih et al., 2020; Wang et al., 2021; Wu et al., 2021). OsNLP6 is only known for having a very low basal expression and not responding to various stress tested in previous studies, but was never characterized further (Jagadhesan et al., 2020; Wu et al., 2021). The high expression of OsMOC1 is somewhat surprising as it is mainly known for its critical role in regulating tiller number and plant architecture (Liao et al., 2019). Finally, OsNAC5 is an abiotic stress-responsive gene (Takasaki et al., 2010), which might indicate that a stress induce the transcriptional response. Ammonium is known to affect rapidly the internal and external pH of roots, which may be the chemical cue resulting in this response (Jia et al., 2020; Motte and Beeckman, 2020). We also observed that ammonium upregulated alanine aminotransferases expression, indicating an accumulation of alanine in planta. Such responses are usually observed in stress conditions to store nitrogen and to provide energy and reductants under for instance anoxia situations in the cell (Vanlerberghe et al., 1991; Miyashita et al., 2007). Alanine biosynthesis is a known ammonium detoxification process with alanine serving as a nitrogen store (Esteban et al., 2016). In Arabidopsis roots, hypoxia induces AlaAT1 and AlaAT2 as early as 2h after stress application with a peak at 8h, followed by a decrease after 24h, which corresponds to what we and others observed in rice upon ammonium treatment (Miyashita et al., 2007) and was also observed in maize (Muench et al., 1998). Gene ontology enrichment for the ammonium-specific cluster (‘darkslateblue’) revealed an increase in proton related ATPase activity terms potentially indicating a response to counteract cytoplasmic acidification caused by ammonium uptake, thereby contributing to ammonium tolerance in rice. The enrichment of the pyruvate metabolic process term suggests a higher demand for energy production or amino acid biosynthesis, as pyruvate is a central metabolite connecting glycolysis, the TCA cycle, and the amino acid synthesis pathways. Overall, this suggests that the response is more likely related to acidification or stress rather than ammonium acting as a signaling molecule. In any case, the poor overlap in response to ammonium in the shoot and root supports a local effect.
Synergistic effects: dual action or mitigation of stress?
Both in our and previous studies, co-application of ammonium-nitrate resulted in more growth compared to both forms individually (Figure 1) (Kronzucker et al., 1999). Our data showed a broader transcriptional response to the combined nitrogen treatment, encompassing responses that are otherwise only elicited by either ammonium or nitrate alone. This is particularly clear in the cluster analysis, where the ammonium-nitrate profile closely follows either the ammonium or nitrate expression patterns, but rarely exhibits a distinct profile. Hence, the combined provision may elicit a dual action that translate into improved growth. This was specifically observed in lateral root density, where the spatial distribution resulting from the combined treatment resembled the cumulative distribution patterns observed under each individual nitrogen form. Additionally, the ammonium treatment resulted in higher leaf chlorophyll content, which is in line with the positive effect of ammonium on photosynthesis activity as reported in Arabidopsis (Sanchez-Zabala et al., 2015). This effect was also observed with the ammonium-nitrate combination, but not with nitrate alone, further illustrating that the action of one of the forms is preserved within the combined treatment.
An alternative explanation for the differences in growth between co-application and single application is that the provision of only one nitrogen form could trigger a stress response, which is absent when both forms are present. Indeed, despite rice being considered as an ammonium-tolerant plant, we observed that ammonium supplementation alone reduces the size of the rice root system, a phenotype typically associated with ammonium toxicity (Liu and von Wirén, 2017). Accumulation of chlorophyll is in Arabidopsis associated with a mild ammonium stress (Sanchez-Zabala et al., 2015). Likewise, the ‘yellow3’ co-expression cluster that group genes induced by ammonium but not by ammonium-nitrate shows an oxidative stress signature, while a number of stress-related genes are induced upon ammonium treatment (see above). Hence, while considered to be ammonium tolerant, rice clearly displays toxicity-related phenotypes, as also observed in other recent studies (Jia et al., 2020; Xie et al., 2023; Yan et al., 2023). The presumed ammonium tolerance likely originates from observations of paddy field-grown rice, where ammonium is partially converted to nitrate, and rice at the end perceives both ammonium and nitrate. Furthermore, genes in the ‘indianred3’ and ‘plum4’ clusters that are exclusively induced by nitrate only and by none of the other treatments are primarily linked to iron homeostasis and transport as illustrated by the GO enrichment. Such genes, including OsIRO2, OsIRO3, OsNRAMP1, OsPOT, OsOPT7 and OsMIR are typically upregulated upon iron starvation (Zheng et al., 2009; Zhang et al., 2017), which is known to occur when nitrate is the sole nitrogen form provided (Chen et al., 2018). Hence, the observed improvement in growth with the combined treatment may be attributed to the mitigation of stress effects that are typically induced by the individual nitrogen forms.
Nitrogen network for data mining
By focusing on a few nitrate-specific clusters, we demonstrated that our dataset, which includes responses to both ammonium and nitrate, can be utilized to identify candidate transcription factors involved in nitrogen signaling. Other clusters with different nitrogen response profiles presented in this study can be investigated as well, either to identify novel regulators or to predict functions for unknown genes. For instance, uncharacterized putative transporter encoding genes that were identified as strongly co-expressed with nitrate transporters in our network might encode transporters with a role in nitrate transport. Overall, our present study provides the research community with an extensive dataset describing how rice, a major staple crop, responds at the transcriptional level to two main nitrogen feedstocks. A better understanding of how plants sense, take up and process the two main forms of nitrogen provided by fertilization is an important field of study within the contemporary context of the increasing need to breed crop plants with enhanced nitrogen use efficiency.
Material and methods
Root and shoot treatment and sampling for transcriptomics
Rice seedlings [Oryza sativa Nipponbare cultivar (#GSOR100, USDA-ARS)] were dehulled and sterilized with ethanol 70% for 5 minutes, followed by immersion in bleach 6% with Tween-20 for 30 minutes. Seedlings were imbibed by immersion in sterile water for 12h to synchronize germination at 30 degrees. Germinating seeds were transferred on a hydroponic system, and roots were immersed in a nitrogen-free basal salt medium composed of K2SO4 0.7mM, KH2PO4 0.3mM, CaCl2.2H2O 1mM, MgSO4.7H2O 1mM, Na2SiO3.9H2O, Na2-Fe-EDTA 20µM for macronutrients, and MnCl2.4H2O 9µM, Na2MoO4.2H2O 0.39µM, H3BO3 20µM, ZnSO4.7H2O 0.77µM, CuSO4.5H2O 0.32µM for micronutrients (pH 5.8). Seedlings were then transferred to a growth cabinet in the dark at 30 degrees for 3 days in a randomized block design. The light was then turned on after 72h and let on for 48h before treatment occurred. Nitrogen treatments consisted of injection with 5mM KNO3 (5mM NO3- treatment), 2.5mM (NH4)2SO4 + 2.5mM K2SO4 (5mM NH4+ treatment), 2.5mM KNO3 + 1.25mM (NH4)2SO4 + 1.25mM K2SO4 (2.5mM NH4+ and 2.5mM NO3- treatment) or 2.5mM K2SO4 (mock treatment) in this basal medium. K2SO4 was used to balance potassium (K+) equimolarly to 5mM in each of the treatments. Rice seedlings were extracted 15min, 1h, 2h, 4h, 12h, 24h and 48h after nitrogen treatments. A supplemental control without treatment was extracted at the 0h time point in 3 biological replicates for roots and shoots, to estimate the impact of the manipulation of the samples (referred to as “Control 0h”). At the extraction time-point, shoots and roots were cut with a razor blade and frozen in liquid nitrogen. The remaining seeds were discarded. Three different boxes were used for each treatment and for each time-point, for a total of 87 boxes. At least 10 germinated seedlings were sampled per box.
Root and shoot phenotyping
For the phenotyping experiments, the same procedure as described above was followed but seedlings were let grown in the hydroponic media for 10 days after treatment and the medium was refreshed daily. Chlorophyll was extracted with DMSO and measured by absorbance at 663nm (Chlorophyll A) and 645nm (Chlorophyll B). Chlorophyll content was measured as:
RNA extraction
Frozen roots and shoot samples were grinded with one 3mm metal bead into Eppendorf tubes. RNA was extracted with Trizol (Life Technologies) and the RNeasy Mini Kit (Qiagen) following the manufacturer instructions. An extra DNase step was performed with RNase-Free DNase Set (Qiagen). RNA samples were resuspended in RNAse free water. RNA concentration and purity were determined spectrophotometrically using the Nanodrop ND-1000 (Nanodrop Technologies) and RNA integrity was assessed using a Bioanalyzer 2100 (Agilent).
RNA-seq library preparation
The sequencing and library preparation was performed by the VIB Nucleomics Core Facility (Leuven, Belgium; www.nucleomics.be). Per sample, 500ng of total RNA was used as input. Using the Illumina TruSeq® Stranded mRNA Sample Prep Kit (protocol version: Part # 15031047 Rev. E - October 2013), poly-A containing mRNA molecules were purified from the total RNA input using poly-T oligo-attached magnetic beads. In a reverse transcription reaction using random primers, RNA was converted into first strand cDNA and subsequently converted into double-stranded cDNA in a second strand cDNA synthesis reaction using DNA PolymeraseI and RNAse H. The cDNA fragments were extended with a single ‘A’ base to the 3’ ends of the blunt-ended cDNA fragments after which multiple indexing adapters were ligated introducing different barcodes for each sample. Finally, PCR enrichment was conducted to enrich those DNA fragments that have adapter molecules on both ends and to amplify the amount of DNA in the library. Sequence-libraries of each sample were equimolarly pooled and sequenced on Illumina NextSeq 500 (High Output, 75 bp, Single Reads, v2). The raw transcriptomic data (fastq files) have been deposited in the functional genomics data collection ArrayExpress under the accession number E-MTAB-13146.
Sequence mapping
All analyses were done on the VIB-UGent Plant System Biology Galaxy platform (Afgan et al., 2018). The Trimmomatic tool (Bolger et al., 2014) was used to trim the reads for low-quality read-ends with the following options: raw fastq file, type TrueSeq3 adapter sequences. Data quality was assessed with the FastQC tool before and after trimming with the Trimmomatic tool. The output of Trimmomatic was processed by the Salmon tool (Patro et al., 2017). Salmon was used for transcript-level quantification estimates of RNAseq data. The reads were mapped on the coding sequences of release 7 of the MSU Rice Genome Annotation Project (Kawahara et al., 2013) with the following options: stranded reads and reads derived from the reverse strand, with an Incompatible Prior setting of 1x10-20. Salmon acts in two steps: the indexation of the reference genome (Oryza sativa japonica v7JGI) and the mapping of the reads trimmed by Trimmomatic to this reference genome, followed by their quantification. The output is an estimated number of reads in transcript per millions. The package txtimport 1.14.0 (Soneson et al., 2015) in the R Statistical software version 3.4.3 was used to process the Salmon output data (transcript-level abundance) and summarize it into matrices of counts of reads/fragments (gene-level abundance).
Differential expression analysis
DESeq2 data preparation and cleaning
The txtimport output was then processed with the DESeq2 version 1.26.0 package for differential analysis (Love et al., 2014). A DESeqDataSet was created using the function ‘DESeqDataSetFromTximport’ with a design (~time + treatment + time:treatment), with time and treatment as categorical variables. We then used the DESeq() function to estimate size factors and dispersion values, fit a negative binomial model to the count data, and perform differential gene expression analysis. The resulting DESeqDataset was normalized using the varianceStabilizingTransfomation() (VSD) function. A heatmap of sample-to-sample distance comparison was built for roots and shoots independently to identify outliers samples, using the VSD-transformed data as recommended by the WGCNA developers. Two outliers were detected with the heatmap: one outlier in the roots (2h after NH4+ treatment, replicate 3) and one in the shoots (1h after NO3- treatment, replicate 2). These samples were discarded for further analysis. The samples correlation was assessed by PCA analysis once outliers were removed (Supplementary Figures S6, S7) and illustrate a good clustering of the samples.
Pair-wise differential analysis
For the pair-wise differential analysis, the same DESeqDataSet was used as input; the DESeq() function was used repeatedly with contrasts set manually between each treatment and the control for each time points independently. Genes with an absolute fold-change > 2 and an FDR < 0.05 were considered as differentially expressed.
Gene co-expression construction
The gene co-expression network and clusters were built using the WGCNA package (Langfelder and Horvath, 2008). We used the varianceStabilizingTransformation() (VSD) function of the package DESeq2 to transform and normalize the DESeqDataSet data described above without the outliers, as recommended for big experiments containing more than 100 samples, and averaged the 3 biological samples per treatment, per time-point. Only genes with more than 5 counts in at least 2 repetitions per treatment per time point were kept, removing non or very lowly expressed genes. This first threshold reduced the total number of genes to around 26000 for roots and shoots. For computational reasons and to remove noise background, a second threshold removing the 30% least-varying genes based on their expression variance between the treatments as recommended by the WGCNA developers was applied. The final input for the gene co-expression network construction was 18343 genes for the shoots and 18457 genes for the roots. DatasetGene connectivity was determined with a power β (soft thresholding) of 7 for the roots and to 8 for the shoots, chosen with the function pickSoftThreshold() with the following options: networkType = “signed hybrid”, corFnc = “bicor”, maxPOutliers = 0.02. The function ‘adjacency()’ was used with the same options. The options used to design the network with the function cutreeDynamic were deepSplit = 3, and minModuleSize = 20. For every cluster generated, a cluster eigengene is computed; this eigengene (first principal component of a cluster) can be seen as representative of all the genes that compose the cluster. Eigengenes with a correlation with another eigengene higher than 80% (R2 = 0.8) were merged into one cluster. Network visualization was done with Cytoscape 3.7.2 (Shannon et al., 2003)
Gene ontology enrichment analysis
To identify enriched biological processes, molecular functions, and cellular components within co-expression clusters, a Gene Ontology (GO) enrichment analysis was performed using the GO enrichment tool of the Plaza Monocots 4.0 Platform (Van Bel et al., 2018) using the Locus ID and the publicly available Rice v7.0JGI database with the whole annotated genome as the reference set. The significance threshold for enriched GO terms was set at a p-value of 0.01.
Plasmid construction
Transcription factor coding sequences were isolated by PCR from rice shoots or root cDNA and used to generate the ‘inducers plasmids’. Promoter sequences of the target genes were isolated from genomic DNA and correspond to the -2000bp sequence upstream of the start codon of the target gene or were limited by the presence of another gene downstream and used to generate the ‘target plasmids’. The plasmids were constructed with the Golden Gateway assembly system: in the inducer plasmids, the coding sequences of the transcription factors were combined with a constitutive promoter (p35s) followed by a nuclear localization sequence. A NOST terminator was placed downstream of the gene coding sequence. In the target plasmids, the genes promoters were cloned upstream of a nuclear localization sequence followed by the fluorescent protein mEGFP coding sequence and a NOST terminator. The inducers plasmids structure can be summarized as “p35s::NLS::transcription-factor-CDS::NOST”. The target plasmids structure can be summarized as “gene-promoter::NLS::mEGFP::NOST”. Sequences were validated by sequencing (Eurofins Genomics, Belgium) and reference sequences were extracted from the Plaza Monocots 4.0 Platform (Van Bel et al., 2018). The list of primers used for the genes coding sequences and promoter isolation is available in Supplementary Table S1.
Extraction and transformation of rice protoplasts
14-days old rice seedlings (#GSOR100 USDA-ARS) grown in the dark in sterile vitro-vent boxes on a solid media containing 0.305g/l Murashige & Skoog Modified Basal Salt Mixture Nitrogen-free salts (Phytotech Labs #M407), 0.6mM KH2PO4, 9.4mM K2SO4, 1mM NH4NO3, 1.6mM Na2SiO3.9H2O, 8g/l agar and 0.025g/l MES at pH 5.7, were harvested by cutting the stem above the seed and the aerial part kept for protoplast isolation. The protoplasts extraction and transformation followed the protocol described in other studies with few adaptations (Abel and Theologis, 1994; Yoo et al., 2007; Zhang et al., 2011). Briefly, once extracted, the protoplasts were mixed with different combinations of one inducer plasmid and one target plasmid. Addition of PEG-4000 to the mix induced the transient transformation of the protoplasts which assimilated the different combinations of the two types of plasmids, and transformation was stopped after 15 minutes. After incubation overnight, the protoplasts in solution were distributed in a 90-well plate and mEGFP fluorescence intensity (excitation: 488nm, emission: 522nm) was measured by confocal microscopy.
Generation of the oseil1 and osrli1 mutants
The OsEIL1 knock-out mutant was generated in a Japonica variety Wuyunjing-7 (9522) using the CRISPR-Cas9 technique, while OsRLI1 knock-out mutant is Japonica variety Nipponbare background and was generated in a previous study (Ruan et al., 2018). Homozygous mutant lines were used for subsequent analysis.
Phenotyping and RT-qPCR of the oseil1 and osrli1 mutants
Rice seeds of wild-type and mutant lines were sterilized with 70% (v/v) ethanol for 1 min, followed by 30% (v/v) sodium hypochlorite solution for 30 min. Seedlings were imbibed by immersion in sterile water for 12h to synchronize their germination and let grown in the dark on nitrogen free solution for 3 days, and then transferred to the growth chamber (30 degrees, continuous light) for another 3 days. Seedlings with ~2 cm seminal root were selected for different nitrogen treatments with modified Kimura B solution: high nitrogen (1.5 mM (NH4+)2SO4, or 3 mM KNO3-, HN) and nitrogen free (- N or N-free). The time course started at the moment of the transfer. 20 seedlings roots per technical replicate where harvested, and samples were processed as described above for the transcriptome experiment. The RNA was synthetized into cDNA, and the primers presented in Supplementary Table S1 were used for the RT-qPCR as previously described (Xie et al., 2023)
Phenotyping of the oseil1 and osrli1 mutants
Geminated rice seedlings were first grown in water for 3 days in a growth chamber under a photoperiod of 14 h light (200μmol m-2 s-2 light density and 70% humidity) and a temperature of 28 degrees, and rice seedlings with ~2 cm long seminal root were then transferred to the hydroponic culture supplied with modified Kimura B solution (500 mL volume for each cup with 10 seedlings) for different nitrogen treatments. For nitrogen -free treatment, nitrogen sources (NH4)2SO4 and KNO3 was replaced with K2SO4 at a concentration of 1.5 mM; for NH4+ treatment alone, KNO3 was replaced with K2SO4 at the same concentration; for NO3- treatment alone, (NH4)2SO4 was replaced with 3 mM KNO3. The 2-[morpholino]ethane sulfonic acid (MES) was supplied to hydroponic cultures to buffer pH of the medium when mentioned. The rice seedlings were treated for 4 days, and the nutrient solution was renewed every two days.
Data availability statement
The datasets presented in this study can be found in online repositories. The names of the repository/repositories and accession number(s) can be found in the article/Supplementary Material.
Author contributions
P-MP: Conceptualization, Data curation, Formal analysis, Investigation, Methodology, Project administration, Visualization, Writing – original draft, Writing – review & editing. BP: Conceptualization, Data curation, Formal analysis, Investigation, Methodology, Supervision, Writing – original draft, Writing – review & editing. LJ: Formal analysis, Resources, Writing – original draft. AD: Investigation, Methodology, Resources, Writing – original draft. VG: Formal analysis, Resources, Visualization, Writing – original draft. PG: Methodology, Resources, Writing – original draft. AC: Methodology, Resources, Writing – original draft. DA: Conceptualization, Resources, Writing – original draft. WX: Investigation, Resources, Writing – original draft. TB: Conceptualization, Funding acquisition, Investigation, Project administration, Resources, Supervision, Writing – original draft, Writing – review & editing. HM: Investigation, Project administration, Resources, Supervision, Writing – original draft, Writing – review & editing, Conceptualization.
Funding
The author(s) declare financial support was received for the research, authorship, and/or publication of this article. Funding for this study was provided by EuroChem Agro, the China National Key Program for Research and Development, the Chinese Ministry of Science and Technology, and the Research Foundation-Flanders (FWO). The funders had no role in the execution of the study or the decision to publish the findings.
Acknowledgments
The authors thank Wouter Smet for critical reading and discussions on the manuscript. We would also like to thank Ignacio Eguinoa, Lieven Sterck and Frederik Coppens for their help and support for the use of bioinformatic tools. We also thank Keke Yi for sharing rice osrli1 seeds.
Conflict of interest
The authors declare that the research was conducted in the absence of any commercial or financial relationships that could be construed as a potential conflict of interest.
Publisher’s note
All claims expressed in this article are solely those of the authors and do not necessarily represent those of their affiliated organizations, or those of the publisher, the editors and the reviewers. Any product that may be evaluated in this article, or claim that may be made by its manufacturer, is not guaranteed or endorsed by the publisher.
Supplementary material
The Supplementary Material for this article can be found online at: https://www.frontiersin.org/articles/10.3389/fpls.2024.1343073/full#supplementary-material
Supplementary Figure 1 | Number of differentially expressed genes (FDR < 0.05, absolute fold-change > 2), for each time point in the roots. The bar represents the number of genes present at the intersection indicated by the dot in the bottom of the graph. The Gene/Treatments graph represent the total number of genes differentially regulated per treatment. Brown: genes differentially expressed by NH4NO3 only. Yellow: genes differentially expressed by NH4+ only. Red: genes differentially expressed by NO3- only. Grey: other combinations as presented below the graph.
Supplementary Figure 2 | Number of differentially expressed genes (FDR < 0.05, absolute fold-change > 2), for each time point in the shoots. The bar represents the number of genes present at the intersection indicated by the dot in the bottom of the graph. The Gene/Treatments graph represent the total number of genes differentially regulated per treatment. Brown: genes differentially expressed by NH4NO3 only. Yellow: genes differentially expressed by NH4+ only. Red: genes differentially expressed by NO3- only. Grey: other combinations as presented below the graph.
Supplementary Figure 3 | Number of differentially expressed genes (FDR < 0.05, absolute fold-change > 2), for each time point in the roots (A) and shoots (B). The histogram plot represents the number of genes present at the intersection indicated by the dot in the bottom of the graph. The Gene/Time points graph represent the total number of genes differentially regulated per treatment. Blue: genes that are differentially regulated from the first time point (15 minutes after treatment) after treatment and that remain differentially regulated at each time point until the end of the time course (48h after treatment). Yellow: genes that are differentially regulated from 1h after treatment and that remain differentially regulated at each time point until the end of the time course (48h after treatment).
Supplementary Figure 4 | WGNCA co-expression clusters in the root. Overview of the expression profile of all clusters. The average expression of all the genes composing the cluster is presented in red, individual gene expression is shown in black. Within each plot, the profile of mock, ammonium (NH4), ammonium-nitrate (NN) and nitrate (NO3) is shown from left to right. The name and number of genes per cluster is indicated at the top of each plot.
Supplementary Figure 5 | WGNCA co-expression clusters in the shoot. Overview of the expression profile of all clusters. The average expression of all the genes composing the cluster is presented in red, individual gene expression is shown in black. Within each plot, the profile of mock, ammonium (NH4), ammonium-nitrate (NN) and nitrate (NO3) is shown from left to right. The name and number of genes per cluster is indicated at the top of each plot.
Supplementary Figure 6 | Screenshot of Shiny app enabling access to the rice gene expression profiles in response to different nitrogen treatments and the co-expression analysis. 1: User selected gene of interest. 2: Option to select a threshold for the co-expression coefficient in the table 5 and 6. 3: Gene expression profile in response to different forms of nitrogen over a time-course in the roots or the shoots. 4: Eigengene of the WGCNA cluster of the selected gene in the roots or the shoots. 5,6: List of genes co-expressed with the gene of interest in the roots or the shoots. The co-expression coefficient corresponds to the adjacency table (biweight midcorrelation) constructed with WGCNA. Available at https://www.psb.ugent.be/shiny/rice-response-to-nitrogen/.
Supplementary Figure 7 | Complete protoplast transactivation assay. Induction of nitrate response genes by the different transcription factors in a rice protoplast transactivation assay. The boxplots show the average mEGFP fluorescence intensity per transfected protoplast (min. 118 protoplasts per condition, average 408) in one well (n=16). Samples (green) are co-transfected with the indicated combinations of inducer and target plasmids. The negative controls are only transfected with the inducer plasmid (blue) or with the target plasmids (red). Significance was determined by a one-way ANOVA followed by a Tukey’s post-hoc test (*** p < 1.10-6, blue: sample versus the transcription factor control, red: versus the promoter of the reporter control).
Supplementary Figure 8 | Phenotypes under different nitrogen treatments of oseil1 mutants and osrli1 mutants. (A): Images of the oseil1 mutant and its 9522 background, with measurements of the seminal and lateral roots number. 9522 is the genetic background in which the oseil1 mutant has been constructed. (B): Images of the osrli1 mutant and its NIP background, with measurements of the seminal and lateral roots number. NIP is the genetic background in which the osrli1 mutant has been constructed. The orange dotted line indicates the position of the root tip when the seedlings were transferred to medium supplied with different N. The white dotted line indicates the position of the root tip when the seedlings were treated for 4 days. Different letters correspond to the post-hoc Tuckey’s test significance (p.value=0.05), performed after a two-way ANOVA test, and show significant differences between the samples.
Supplementary Figure 9 | Principal component analysis of the roots RNA-seq samples. Principal component analysis of the of the DESeq2 output normalized with the varianceStabilizingtransFormation() function in roots.
Supplementary Figure 10 | Principal component analysis of the shoots RNA-seq samples. Principal component analysis of the of the DESeq2 output normalized with the varianceStabilizingTransformation() function in shoots.
Supplementary Table 1 | Primers used in this study
Supplementary Data Sheet 1 | Genome-wide differential gene expression analysis upon different nitrogen treatments in rice roots
Supplementary Data Sheet 2 | Genome-wide differential gene expression analysis upon different nitrogen treatments in rice shoots.
Supplementary Data Sheet 3 | Co-expression coefficients between gene pairs corresponding to the adjacency table (biweight midcorrelation) of the roots co-expression network constructed with the WGCNA tool.
Supplementary Data Sheet 4 | Co-expression coefficients between gene pairs corresponding to the adjacency table (biweight midcorrelation) of the shoots co-expression network constructed with the WGCNA tool.
Supplementary Data Sheet 5 | Gene ontology enrichment of the WGNCA root co-expression clusters.
Supplementary Data Sheet 6 | Gene ontology enrichment of the WGNCA shoot co-expression clusters.
References
Abel, S., Theologis, A. (1994). Transient transformation of Arabidopsis leaf protoplasts: a versatile experimental system to study gene expression. Plant J. 5, 421–427. doi: 10.1111/j.1365-313X.1994.00421.x
Afgan, E., Baker, D., Batut, B., van den Beek, M., Bouvier, D., Cech, M., et al. (2018). The Galaxy platform for accessible, reproducible and collaborative biomedical analyses: 2018 update. Nucleic Acids Res. 46, W537–W544. doi: 10.1093/nar/gky379
Alfatih, A., Wu, J., Zhang, Z.-S., Xia, J.-Q., Jan, S. U., Yu, L.-H., et al. (2020). Rice NIN-LIKE PROTEIN 1 rapidly responds to nitrogen deficiency and improves yield and nitrogen use efficiency. J. Exp. Bot. 71, 6032–6042. doi: 10.1093/jxb/eraa292
Alvarez, J. M., Schinke, A. L., Brooks, M. D., Pasquino, A., Leonelli, L., Varala, K., et al. (2020). Transient genome-wide interactions of the master transcription factor NLP7 initiate a rapid nitrogen-response cascade. Nat. Commun. 11, 1157. doi: 10.1038/s41467-020-14979-6
Beeckman, F., Annetta, L., Corrochano-Monsalve, M., Beeckman, T., Motte, H. (2024). Enhancing agroecosystem nitrogen management: microbial insights for improved nitrification inhibition. Trends Microbiol. 32, 590–601. doi: 10.1016/j.tim.2023.10.009
Beeckman, F., Motte, H., Beeckman, T. (2018). Nitrification in agricultural soils: impact, actors and mitigation. Curr. Opin. Biotechnol. 50, 166–173. doi: 10.1016/j.copbio.2018.01.014
Bittsanszky, A., Pilinszky, K., Gyulai, G., Komives, T. (2015). Overcoming ammonium toxicity. Plant Sci. 231, 184–190. doi: 10.1016/j.plantsci.2014.12.005
Bolger, A. M., Lohse, M., Usadel, B. (2014). Trimmomatic: a flexible trimmer for Illumina sequence data. Bioinformatics 30, 2114–2120. doi: 10.1093/bioinformatics/btu170
Bouwman, A. F., Boumans, L. J. M., Batjes, N. H. (2002). Emissions of N2O and NO from fertilized fields: Summary of available measurement data. Global Biogeochemical Cycles 16, 6–1-6-13. doi: 10.1029/2001GB001811
Britto, D. T., Kronzucker, H. J. (2013). Ecological significance and complexity of N-source preference in plants. Ann. Bot. 112, 957–963. doi: 10.1093/aob/mct157
Chandran, A. K., Priatama, R. A., Kumar, V., Xuan, Y., Je, B. I., Kim, C. M., et al. (2016). Genome-wide transcriptome analysis of expression in rice seedling roots in response to supplemental nitrogen. J. Plant Physiol. 200, 62–75. doi: 10.1016/j.jplph.2016.06.005
Chang, K. N., Zhong, S., Weirauch, M. T., Hon, G., Pelizzola, M., Li, H., et al. (2013). Temporal transcriptional response to ethylene gas drives growth hormone cross-regulation in Arabidopsis. Elife 2, e0, 0675. doi: 10.7554/eLife.00675
Chen, H., Zhang, Q., Cai, H., Zhou, W., Xu, F. (2018). H2 O2 mediates nitrate-induced iron chlorosis by regulating iron homeostasis in rice. Plant Cell Environ. 41, 767–781. doi: 10.1111/pce.13145
Coskun, D., Britto, D. T., Shi, W., Kronzucker, H. J. (2017). Nitrogen transformations in modern agriculture and the role of biological nitrification inhibition. Nat. Plants 3, 17074. doi: 10.1038/nplants.2017.74
Crawford, N. M. (1995). Nitrate: nutrient and signal for plant growth. Plant Cell 7, 859–868. doi: 10.1105/tpc.7.7.859
Crombez, H., Motte, H., Beeckman, T. (2019). Tackling plant phosphate starvation by the roots. Dev. Cell 48, 599–615. doi: 10.1016/j.devcel.2019.01.002
Dai, X., Wang, Y., Yang, A., Zhang, W. H. (2012). OsMYB2P-1, an R2R3 MYB transcription factor, is involved in the regulation of phosphate-starvation responses and root architecture in rice. Plant Physiol. 159, 169–183. doi: 10.1104/pp.112.194217
Dolgikh, V. A., Pukhovaya, E. M., Zemlyanskaya, E. V. (2019). Shaping ethylene response: the role of EIN3/EIL1 transcription factors. Front. Plant Sci. 10. doi: 10.3389/fpls.2019.01030
Esteban, R., Ariz, I., Cruz, C., Moran, J. F. (2016). Review: Mechanisms of ammonium toxicity and the quest for tolerance. Plant Sci. 248, 92–101. doi: 10.1016/j.plantsci.2016.04.008
Fang, X. Z., Fang, S. Q., Ye, Z. Q., Liu, D., Zhao, K. L., Jin, C. W. (2021). NRT1.1 dual-affinity nitrate transport/signalling and its roles in plant abiotic stress resistance. Front. Plant Sci. 12. doi: 10.3389/fpls.2021.715694
Food and Agriculture Organization of the United Nations [FAO]. (2017). World fertilizer trends and outlook to 2020. Summary report.
Fu, Y., Zhong, X., Lu, C., Liang, K., Pan, J., Hu, X., et al. (2023). Growth, nutrient uptake and transcriptome profiling of rice seedlings in response to mixed provision of ammonium- and nitrate-nitrogen. J. Plant Physiol. 284, 153976. doi: 10.1016/j.jplph.2023.153976
Gaudinier, A., Rodriguez-Medina, J., Zhang, L., Olson, A., Liseron-Monfils, C., Bågman, A.-M., et al. (2018). Transcriptional regulation of nitrogen-associated metabolism and growth. Nature 563, 259–264. doi: 10.1038/s41586-018-0656-3
Good, A. G., Shrawat, A. K., Muench, D. G. (2004). Can less yield more? Is reducing nutrient input into the environment compatible with maintaining crop production? Trends Plant Sci. 9, 597–605. doi: 10.1016/j.tplants.2004.10.008
Guan, P., Ripoll, J. J., Wang, R., Vuong, L., Bailey-Steinitz, L. J., Ye, D., et al. (2017). Interacting TCP and NLP transcription factors control plant responses to nitrate availability. Proc. Natl. Acad. Sci. U.S.A. 114, 2419–2424. doi: 10.1073/pnas.1615676114
Hachiya, T., Inaba, J., Wakazaki, M., Sato, M., Toyooka, K., Miyagi, A., et al. (2021). Excessive ammonium assimilation by plastidic glutamine synthetase causes ammonium toxicity in Arabidopsis thaliana. Nat. Commun. 12, 4944. doi: 10.1038/s41467-021-25238-7
Hachiya, T., Sakakibara, H. (2016). Interactions between nitrate and ammonium in their uptake, allocation, assimilation, and signaling in plants. J. Exp. Botany. 68, 2501–2512. doi: 10.1093/jxb/erw449
Hiraga, S., Sasaki, K., Hibi, T., Yoshida, H., Uchida, E., Kosugi, S., et al. (2009). Involvement of two rice ETHYLENE INSENSITIVE3-LIKE genes in wound signaling. Mol. Genet. Genomics 282, 517–529. doi: 10.1007/s00438-009-0483-1
Hou, X. L., WU, P., JIAO, F. C., JIA, Q. J., CHEN, H. M., YU, J., et al. (2005). Regulation of the expression of OsIPS1 and OsIPS2 in rice via systemic and local Pi signalling and hormones. Plant Cell Environ. 28, 353–364. doi: 10.1111/j.1365-3040.2005.01272.x
Hu, B., Jiang, Z., Wang, W., Qiu, Y., Zhang, Z., Liu, Y., et al. (2019). Nitrate-NRT1.1B-SPX4 cascade integrates nitrogen and phosphorus signalling networks in plants. Nat. Plants 5, 401–413. doi: 10.1038/s41477-019-0384-1
Jagadhesan, B., Sathee, L., Meena, H. S., Jha, S. K., Chinnusamy, V., Kumar, A., et al. (2020). Genome wide analysis of NLP transcription factors reveals their role in nitrogen stress tolerance of rice. Sci. Rep. 10, 9368. doi: 10.1038/s41598-020-66338-6
Jia, L., Xie, Y., Wang, Z., Luo, L., Zhang, C., Pélissier, P. M., et al. (2020). Rice plants respond to ammonium stress by adopting a helical root growth pattern. Plant J. 104, 1023–1037. doi: 10.1111/tpj.14978
Jian, S., Liao, Q., Song, H., Liu, Q., Lepo, J. E., Guan, C., et al. (2018). NRT1.1-related NH4+ Toxicity is associated with a disturbed balance between NH4+ Uptake and assimilation. Plant Physiol. 178, 1473–1488. doi: 10.1104/pp.18.00410
Kawahara, Y., de la Bastide, M., Hamilton, J. P., Kanamori, H., McCombie, W. R., Ouyang, S., et al. (2013). Improvement of the Oryza sativa Nipponbare reference genome using next generation sequence and optical map data. Rice 6, 4. doi: 10.1186/1939-8433-6-4
Kende, H. (1993). Ethylene biosynthesis. Annu. Rev. Plant Biol. 44, 283–307. doi: 10.1146/annurev.pp.44.060193.001435
Khan, M. I., Trivellini, A., Fatma, M., Masood, A., Francini, A., Iqbal, N., et al. (2015). Role of ethylene in responses of plants to nitrogen availability. Front. Plant Sci. 6. doi: 10.3389/fpls.2015.00927
Kronzucker, H. J., Britto, D. T., Davenport, R. J., Tester, M. (2001). Ammonium toxicity and the real cost of transport. Trends Plant Sci. 6, 335–337. doi: 10.1016/S1360-1385(01)02022-2
Kronzucker, H. J., Siddiqi, M. Y., Glass, A. D., Kirk, G. J. (1999). Nitrate-ammonium synergism in rice. A subcellular flux analysis. Plant Physiol. 119, 1041–1046. doi: 10.1104/pp.119.3.1041
Krouk, G., Mirowski, P., LeCun, Y., Shasha, D. E., Coruzzi, G. M. (2010). Predictive network modeling of the high-resolution dynamic plant transcriptome in response to nitrate. Genome Biol. 11, R123. doi: 10.1186/gb-2010-11-12-r123
Langfelder, P., Horvath, S. (2008). WGCNA: an R package for weighted correlation network analysis. BMC Bioinf. 9, 559. doi: 10.1186/1471-2105-9-559
Lee, H. Y., Chen, Z., Zhang, C., Yoon, G. M. (2019). Editing of the OsACS locus alters phosphate deficiency-induced adaptive responses in rice seedlings. J. Exp. Bot. 70, 1927–1940. doi: 10.1093/jxb/erz074
Liao, Z., Yu, H., Duan, J., Yuan, K., Yu, C., Meng, X., et al. (2019). SLR1 inhibits MOC1 degradation to coordinate tiller number and plant height in rice. Nat. Commun. 10, 2738. doi: 10.1038/s41467-019-10667-2
Liu, K.-H., Liu, M., Lin, Z., Wang, Z.-F., Chen, B., Liu, C., et al. (2022). NIN-like protein 7 transcription factor is a plant nitrate sensor. Science 377, 1419–1425. doi: 10.1126/science.add1104
Liu, K.-h., Niu, Y., Konishi, M., Wu, Y., Du, H., Sun Chung, H., et al. (2017). Discovery of nitrate–CPK–NLP signalling in central nutrient–growth networks. Nature 545, 311–316. doi: 10.1038/nature22077
Liu, Y., von Wirén, N. (2017). Ammonium as a signal for physiological and morphological responses in plants. J. Exp. Bot. 68, 2581–2592. doi: 10.1093/jxb/erx086
Love, M. I., Huber, W., Anders, S. (2014). Moderated estimation of fold change and dispersion for RNA-seq data with DESeq2. Genome Biol. 15, 550. doi: 10.1186/s13059-014-0550-8
Maeda, Y., Konishi, M., Kiba, T., Sakuraba, Y., Sawaki, N., Kurai, T., et al. (2018). A NIGT1-centred transcriptional cascade regulates nitrate signalling and incorporates phosphorus starvation signals in Arabidopsis. Nat. Commun. 9, 1376. doi: 10.1038/s41467-018-03832-6
Makino, A. (2011). Photosynthesis, grain yield, and nitrogen utilization in rice and wheat. Plant Physiol. 155, 125–129. doi: 10.1104/pp.110.165076
Marchive, C., Roudier, F., Castaings, L., Brehaut, V., Blondet, E., Colot, V., et al. (2013). Nuclear retention of the transcription factor NLP7 orchestrates the early response to nitrate in plants. Nat. Commun. 4, 1713. doi: 10.1038/ncomms2650
McAllister, C. H., Beatty, P. H., Good, A. G. (2012). Engineering nitrogen use efficient crop plants: the current status. Plant Biotechnol. J. 10, 1011–1025. doi: 10.1111/j.1467-7652.2012.00700.x
Meier, M., Liu, Y., Lay-Pruitt, K. S., Takahashi, H., von Wirén, N. (2020). Auxin-mediated root branching is determined by the form of available nitrogen. Nat. Plants 6, 1136–1145. doi: 10.1038/s41477-020-00756-2
Miyashita, Y., Dolferus, R., Ismond, K. P., Good, A. G. (2007). Alanine aminotransferase catalyses the breakdown of alanine after hypoxia in Arabidopsis thaliana. Plant J. 49, 1108–1121. doi: 10.1111/j.1365-313X.2006.03023.x
Motte, H., Beeckman, T. (2020). A pHantastic ammonium response. Nat. Plants 6, 1080–1081. doi: 10.1038/s41477-020-00765-1
Muench, D. G., Christopher, M. E., Good, A. G. (1998). Cloning and expression of a hypoxic and nitrogen inducible maize alanine aminotransferase gene. Physiologia Plantarum 103, 503–512. doi: 10.1034/j.1399-3054.1998.1030409.x
Obertello, M., Shrivastava, S., Katari, M. S., Coruzzi, G. M. (2015). Cross-species network analysis uncovers conserved nitrogen-regulated network modules in rice. Plant Physiol. 168, 1830–1843. doi: 10.1104/pp.114.255877
Ohme-Takagi, M., Shinshi, H. (1995). Ethylene-inducible DNA binding proteins that interact with an ethylene-responsive element. Plant Cell 7, 173–182. doi: 10.1105/tpc.7.2.173
Patro, R., Duggal, G., Love, M. I., Irizarry, R. A., Kingsford, C. (2017). Salmon provides fast and bias-aware quantification of transcript expression. Nat. Methods 14, 417–419. doi: 10.1038/nmeth.4197
Patterson, K., Cakmak, T., Cooper, A., Lager, I., Rasmusson, A. G., Escobar, M. A. (2010). Distinct signalling pathways and transcriptome response signatures differentiate ammonium- and nitrate-supplied plants. Plant Cell Environ. 33, 1486–1501. doi: 10.1111/j.1365-3040.2010.02158.x
Pélissier, P.-M., Motte, H., Beeckman, T. (2021). Lateral root formation and nutrients: nitrogen in the spotlight. Plant Physiol. 187, 1104–1116. doi: 10.1093/plphys/kiab145
Pflüger, T., Gschell, M., Zhang, L., Shnitsar, V., Zabadné, A. J., Zierep, P., et al. (2024). How sensor Amt-like proteins integrate ammonium signals. Sci. Adv. 10, eadm9441. doi: 10.1126/sciadv.adm9441
Pflüger, T., Hernández, C. F., Lewe, P., Frank, F., Mertens, H., Svergun, D., et al. (2018). Signaling ammonium across membranes through an ammonium sensor histidine kinase. Nat. Commun. 9, 164. doi: 10.1038/s41467-017-02637-3
Puga, M. I., Mateos, I., Charukesi, R., Wang, Z., Franco-Zorrilla, J. M., de Lorenzo, L., et al. (2014). SPX1 is a phosphate-dependent inhibitor of Phosphate Starvation Response 1 in Arabidopsis. Proc. Natl. Acad. Sci. U.S.A. 111, 14947–14952. doi: 10.1073/pnas.1404654111
Raun, W. R., Johnson, G. V. (1999). Improving nitrogen use efficiency for cereal production. Agron. J. 91, 357–363. doi: 10.2134/agronj1999.00021962009100030001x
Ristova, D., Carre, C., Pervent, M., Medici, A., Kim, G. J., Scalia, D., et al. (2016). Combinatorial interaction network of transcriptomic and phenotypic responses to nitrogen and hormones in the Arabidopsis thaliana root. Sci. Signal 9, rs13. doi: 10.1126/scisignal.aaf2768
Robertson, G. P., Vitousek, P. M. (2009). Nitrogen in agriculture: balancing the cost of an essential resource. Annu. Rev. Environ. Resour. 34, 97–125. doi: 10.1146/annurev.environ.032108.105046
Ruan, W., Guo, M., Xu, L., Wang, X., Zhao, H., Wang, J., et al. (2018). An SPX-RLI1 module regulates leaf inclination in response to phosphate availability in rice. Plant Cell 30, 853–870. doi: 10.1105/tpc.17.00738
Rubin, G., Tohge, T., Matsuda, F., Saito, K., Scheible, W. R. (2009). Members of the LBD family of transcription factors repress anthocyanin synthesis and affect additional nitrogen responses in Arabidopsis. Plant Cell 21, 3567–3584. doi: 10.1105/tpc.109.067041
Sanchez-Zabala, J., Gonzalez-Murua, C., Marino, D. (2015). Mild ammonium stress increases chlorophyll content in Arabidopsis thaliana. Plant Signal Behav. 10, e991596. doi: 10.4161/15592324.2014.991596
Sasakawa, H., Yamamoto, Y. (1978). Comparison of the uptake of nitrate and ammonium by rice seedlings: influences of light, temperature, oxygen concentration, exogenous sucrose, and metabolic inhibitors. Plant Physiol. 62, 665–669. doi: 10.1104/pp.62.4.665
Shannon, P., Markiel, A., Ozier, O., Baliga, N. S., Wang, J. T., Ramage, D., et al. (2003). Cytoscape: a software environment for integrated models of biomolecular interaction networks. Genome Res. 13, 2498–2504. doi: 10.1101/gr.1239303
Soneson, C., Love, M. I., Robinson, M. D. (2015). Differential analyses for RNA-seq: transcript-level estimates improve gene-level inferences. F1000Res 4, 1521. doi: 10.12688/f1000research.7563.2
Sutton, M. A., Oenema, O., Erisman, J. W., Leip, A., van Grinsven, H., Winiwarter, W. (2011). Too much of a good thing. Nature 472, 159–161. doi: 10.1038/472159a
Takasaki, H., Maruyama, K., Kidokoro, S., Ito, Y., Fujita, Y., Shinozaki, K., et al. (2010). The abiotic stress-responsive NAC-type transcription factor OsNAC5 regulates stress-inducible genes and stress tolerance in rice. Mol. Genet. Genomics 284, 173–183. doi: 10.1007/s00438-010-0557-0
Teng, R. M., Yang, N., Li, J. W., Liu, C. F., Chen, Y., Li, T., et al. (2022). Isolation and characterization of an LBD transcription factor csLBD39 from tea plant (Camellia sinensis) and its roles in modulating nitrate content by regulating nitrate-metabolism-related genes. Int. J. Mol. Sci. 23, 9294. doi: 10.3390/ijms23169294
Tian, Q. Y., Sun, P., Zhang, W. H. (2009). Ethylene is involved in nitrate-dependent root growth and branching in Arabidopsis thaliana. New Phytol. 184, 918–931. doi: 10.1111/j.1469-8137.2009.03004.x
Tian, F., Yang, D.-C., Meng, Y.-Q., Jin, J., Gao, G. (2019). PlantRegMap: charting functional regulatory maps in plants. Nucleic Acids Res. 48, D1104–D1113. doi: 10.1093/nar/gkz1020
Ueda, Y., Ohtsuki, N., Kadota, K., Tezuka, A., Nagano, A. J., Kadowaki, T., et al. (2020). Gene regulatory network and its constituent transcription factors that control nitrogen-deficiency responses in rice. New Phytol. 227, 1434–1452. doi: 10.1111/nph.16627
Ueda, Y., Yanagisawa, S. (2018). “Transcription factor-based genetic engineering to increase nitrogen use efficiency,” in Engineering nitrogen utilization in crop plants. Eds. Shrawat, A., Zayed, A., Lightfoot, D. A. (Springer International Publishing, Cham), 37–55.
Van Bel, M., Diels, T., Vancaester, E., Kreft, L., Botzki, A., Van de Peer, Y., et al. (2018). PLAZA 4.0: an integrative resource for functional, evolutionary and comparative plant genomics. Nucleic Acids Res. 46, D1190–D1196. doi: 10.1093/nar/gkx1002
Vanlerberghe, G. C., Joy, K. W., Turpin, D. H. (1991). Anaerobic metabolism in the N-limited green alga selenastrum minutum: III. Alanine is the product of anaerobic ammonium assimilation. Plant Physiol. 95, 655–658. doi: 10.1104/pp.95.2.655
Varala, K., Marshall-Colon, A., Cirrone, J., Brooks, M. D., Pasquino, A. V., Leran, S., et al. (2018). Temporal transcriptional logic of dynamic regulatory networks underlying nitrogen signaling and use in plants. Proc. Natl. Acad. Sci. U.S.A. 115, 6494–6499. doi: 10.1073/pnas.1721487115
Wang, M., Hasegawa, T., Beier, M., Hayashi, M., Ohmori, Y., Yano, K., et al. (2021). Growth and nitrate reductase activity are impaired in rice osnlp4 mutants supplied with nitrate. Plant Cell Physiol. 62, 1156–1167. doi: 10.1093/pcp/pcab035
Wang, C., Huang, W., Ying, Y., Li, S., Secco, D., Tyerman, S., et al. (2012). Functional characterization of the rice SPX-MFS family reveals a key role of OsSPX-MFS1 in controlling phosphate homeostasis in leaves. New Phytol. 196, 139–148. doi: 10.1111/j.1469-8137.2012.04227.x
Wang, Z., Ruan, W., Shi, J., Zhang, L., Xiang, D., Yang, C., et al. (2014). Rice SPX1 and SPX2 inhibit phosphate starvation responses through interacting with PHR2 in a phosphate-dependent manner. Proc. Natl. Acad. Sci. U.S.A. 111, 14953–14958. doi: 10.1073/pnas.1404680111
Wang, R., Tischner, R., Gutiérrez, R. A., Hoffman, M., Xing, X., Chen, M., et al. (2004). Genomic analysis of the nitrate response using a nitrate reductase-null mutant of arabidopsis. Plant Physiol. 136, 2512–2522. doi: 10.1104/pp.104.044610
Wang, R., Xing, X., Wang, Y., Tran, A., Crawford, N. M. (2009b). A genetic screen for nitrate regulatory mutants captures the nitrate transporter gene NRT1.1. Plant Physiol. 151, 472–478. doi: 10.1104/pp.109.140434
Wang, C., Ying, S., Huang, H., Li, K., Wu, P., Shou, H. (2009a). Involvement of OsSPX1 in phosphate homeostasis in rice. Plant J. 57, 895–904. doi: 10.1111/j.1365-313X.2008.03734.x
Wild, R., Gerasimaite, R., Jung, J. Y., Truffault, V., Pavlovic, I., Schmidt, A., et al. (2016). Control of eukaryotic phosphate homeostasis by inositol polyphosphate sensor domains. Science 352, 986–990. doi: 10.1126/science.aad9858
Wu, X., Liu, T., Zhang, Y., Duan, F., Neuhäuser, B., Ludewig, U., et al. (2019). Ammonium and nitrate regulate NH4+ uptake activity of Arabidopsis ammonium transporter AtAMT1;3 via phosphorylation at multiple C-terminal sites. J. Exp. Bot. 70, 4919–4930. doi: 10.1093/jxb/erz230
Wu, P., Wang, Z. (2011). Molecular mechanisms regulating Pi-signaling and Pi homeostasis under OsPHR2, a central Pi-signaling regulator, in rice. Front. Biol. 6, 242–245. doi: 10.1007/s11515-011-1050-9
Wu, J., Zhang, Z. S., Xia, J. Q., Alfatih, A., Song, Y., Huang, Y. J., et al. (2021). Rice Nin-Like Protein 4 plays a pivotal role in nitrogen use efficiency. Plant Biotechnol. J. 19, 448–461. doi: 10.1111/pbi.13475
Xie, Y., Lv, Y., Jia, L., Zheng, L., Li, Y., Zhu, M., et al. (2023). Plastid-localized amino acid metabolism coordinates rice ammonium tolerance and nitrogen use efficiency. Nat. Plants 9, 1514–1529. doi: 10.1038/s41477-023-01494-x
Xuan, W., Beeckman, T., Xu, G. (2017). Plant nitrogen nutrition: sensing and signaling. Curr. Opin. Plant Biol. 39, 57–65. doi: 10.1016/j.pbi.2017.05.010
Yan, Y., Zhang, Z., Sun, H., Liu, X., Xie, J., Qiu, Y., et al. (2023). Nitrate confers rice adaptation to high ammonium by suppressing its uptake but promoting its assimilation. Mol. Plant 16, 1871–1874. doi: 10.1016/j.molp.2023.11.008
Yang, H. C., Kan, C. C., Hung, T. H., Hsieh, P. H., Wang, S. Y., Hsieh, W. Y., et al. (2017). Identification of early ammonium nitrate-responsive genes in rice roots. Sci. Rep. 7, 16885. doi: 10.1038/s41598-017-17173-9
Yang, C., Lu, X., Ma, B., Chen, S. Y., Zhang, J. S. (2015a). Ethylene signaling in rice and Arabidopsis: conserved and diverged aspects. Mol. Plant 8, 495–505. doi: 10.1016/j.molp.2015.01.003
Yang, C., Ma, B., He, S.-J., Xiong, Q., Duan, K.-X., Yin, C.-C., et al. (2015b). Maohuzi6/ethylene insensitive3-like1 and ethylene insensitive3-like2 regulate ethylene response of roots and coleoptiles and negatively affect salt tolerance in rice. Plant Physiol. 169, 148–165. doi: 10.1104/pp.15.00353
Yoo, S. D., Cho, Y. H., Sheen, J. (2007). Arabidopsis mesophyll protoplasts: a versatile cell system for transient gene expression analysis. Nat. Protoc. 2, 1565–1572. doi: 10.1038/nprot.2007.199
Zhang, Z., Li, Z., Wang, W., Jiang, Z., Guo, L., Wang, X., et al. (2021). Modulation of nitrate-induced phosphate response by the MYB transcription factor RLI1/HINGE1 in the nucleus. Mol. Plant 14, 517–529. doi: 10.1016/j.molp.2020.12.005
Zhang, H., Li, Y., Yao, X., Liang, G., Yu, D. (2017). Positive regulator of iron homeostasis1, ospri1, facilitates iron homeostasis. Plant Physiol. 175, 543–554. doi: 10.1104/pp.17.00794
Zhang, Y., Su, J., Duan, S., Ao, Y., Dai, J., Liu, J., et al. (2011). A highly efficient rice green tissue protoplast system for transient gene expression and studying light/chloroplast-related processes. Plant Methods 7, 30. doi: 10.1186/1746-4811-7-30
Zhang, G. B., Yi, H. Y., Gong, J. M. (2014). The Arabidopsis ethylene/jasmonic acid-NRT signaling module coordinates nitrate reallocation and the trade-off between growth and environmental adaptation. Plant Cell 26, 3984–3998. doi: 10.1105/tpc.114.129296
Zheng, D., Han, X., An, Y. I., Guo, H., Xia, X., Yin, W. (2013). The nitrate transporter NRT2.1 functions in the ethylene response to nitrate deficiency in Arabidopsis. Plant Cell Environ. 36, 1328–1337. doi: 10.1111/pce.12062
Zheng, L., Huang, F., Narsai, R., Wu, J., Giraud, E., He, F., et al. (2009). Physiological and transcriptome analysis of iron and phosphorus interaction in rice seedlings. Plant Physiol. 151, 262–274. doi: 10.1104/pp.109.141051
Keywords: transcriptome, rice, co-expression network, nitrogen, OsRLI1, OsEIL1
Citation: Pélissier P-M, Parizot B, Jia L, De Knijf A, Goossens V, Gantet P, Champion A, Audenaert D, Xuan W, Beeckman T and Motte H (2024) Nitrate and ammonium, the yin and yang of nitrogen uptake: a time-course transcriptomic study in rice. Front. Plant Sci. 15:1343073. doi: 10.3389/fpls.2024.1343073
Received: 22 November 2023; Accepted: 29 July 2024;
Published: 23 August 2024.
Edited by:
Enrique Ostria-Gallardo, University of Concepcion, ChileReviewed by:
Jian Fu Zhang, Fujian Academy of Agricultural Sciences, ChinaSatoru Naganawa Kinoshita, University of Münster, Germany
Copyright © 2024 Pélissier, Parizot, Jia, De Knijf, Goossens, Gantet, Champion, Audenaert, Xuan, Beeckman and Motte. This is an open-access article distributed under the terms of the Creative Commons Attribution License (CC BY). The use, distribution or reproduction in other forums is permitted, provided the original author(s) and the copyright owner(s) are credited and that the original publication in this journal is cited, in accordance with accepted academic practice. No use, distribution or reproduction is permitted which does not comply with these terms.
*Correspondence: Tom Beeckman, dG9tLmJlZWNrbWFuQHBzYi51Z2VudC5iZQ==; Hans Motte, aGFucy5tb3R0ZUBwc2IudWdlbnQuYmU=