
94% of researchers rate our articles as excellent or good
Learn more about the work of our research integrity team to safeguard the quality of each article we publish.
Find out more
ORIGINAL RESEARCH article
Front. Plant Sci., 11 March 2024
Sec. Crop and Product Physiology
Volume 15 - 2024 | https://doi.org/10.3389/fpls.2024.1335744
 Guangyi Chen1†
 Qiang Duan1,2†Chaoyue Wu1Xingmei He1
 Mingming Hu3Congmei Li3Yuyuan Ouyang1,4Ligong Peng1Hong Yang1Qiuqiu Zhang1Qinggui Jiang5Yan Lan6*Tian Li1*
Reasonable nitrogen (N) and potassium (K) application rates can effectively improve fertilizer use efficiency, rice yield and quality. A two-year field experiment was conducted with combined application of three N rates (135, 180, and 225 kg ha-1, denoted as N1-N3) and four K rates (0, 90, 135, and 180 kg ha-1, denoted as K0-K3) using super indica hybrid rice cultivar Yixiangyou (YXY) 2115 to explore the effects of co-application of N and K on rice growth and development. The results indicated that the combined application of N and K had significantly interactive effects on dry matter (DM) accumulation, nutrients absorption, N harvest index (NHI), K harvest index (KHI), spikelets per panicle and most rice quality indexes. The highest total DM accumulation (17998.17-19432.47 kg ha-1) at maturity stage was obtained under N3K2. The effect of co-application of N and K on nutrients absorption and utilization varied between the two years and within each year. The highest total N and K accumulations at maturity stage were observed under N3K1 and N3K2, respectively, while the highest N recovery efficiency (NRE) and K recovery efficiency (KRE) were observed under N1K3. High expression levels of N and K metabolism-related genes in rice grains were observed under N3K2 or N3K3, consistent with N and K uptake. Co-application of N and K increased rice yield significantly and the highest yield (6745.02-7010.27 kg ha-1) was obtained under N2K2. As more N was gradually applied, rice appearance quality improved but milling, cooking and eating quality decreased. Although appropriate application of K could improve rice milling, cooking and eating quality, it reduced appearance quality. The optimal milling, cooking and eating quality were obtained under N1K2, while the best appearance quality was obtained under N3K0. Overall, a combination of 135-210 kg ha-1 N and 115-137 kg ha-1 K application rates was recommended for achieving relatively higher yield and better quality in rice production.
Rice (Oryza sativa L.) stands as a primary global food, with China playing a prominent role as both a major producer and consumer of this essential crop. Over half of China’s population relies on rice as their staple food. Consequently, the advancement of rice production holds paramount significance in meeting the living needs of population and ensuring food security (Karthika et al., 2023). Nowadays, fertilizers have evolved into the principle source of soil nutrient provision. The enhancement of crop yield is inseparable from the application of chemical fertilizers, no exception for rice production. Approximately 30-50% of global increase in crop yield can be attributed to fertilizer input (Erisman et al., 2008), while the increase rate for rice yield can attain a notable 57.4% (Wang et al., 2010a).
N and K are essential nutrients for rice growth and development, and play important roles in the determination of both yield and quality. The amount of N input in rice production in China significantly surpasses the global average level (Ludemann et al., 2022). However, there is a discernible decline in the utilization rate of N, possibly attributed to the persistent escalation of N application rates (Ju et al., 2015). The application rate of N in rice production in southwest China reaches approximately 180 kg ha-1, yet the absorption and utilization rate of N hovers between 32-37% (Zhang et al., 2015). However, due to the more apparent immediate effects of N fertilizer application, it is a prominent problem that the preference for higher N inputs over the combined application of N and K in Chinese rice production (Li, 2017). In contrast to N, the application of K in rice production is often insufficient. Rice is a crop that requires a high amount of K, with an uptake ranging from 150-300 kg ha-1 per season, comparable to or even exceeding the N uptake (Xu et al., 2015; Zhu et al., 2019). Improper application of fertilizer will lead to the diminished nutrients utilization efficiency, yield reduction, deterioration of rice quality and environmental pollution, which may have the potential to impact human living condition and the sustainable development of agriculture and ecology (Li et al., 2018; Zhang et al., 2019). Hence, the efficiency of fertilizer absorption and utilization after application, as well as optimization of fertilization methods, should be taken into consideration to mitigate the adverse impacts associated with fertilization.
The hybrid indica rice cultivar Yixiangyou 2115 is currently extensively cultivated in southwest China, acclaimed for its high quality, substantial yield and resistance to multiple stresses. It was identified as “Super Rice” in 2015 by the Ministry of Agriculture. So far, it has been widely promoted and applied for more than 1.3 million hectares and become a representative cultivar of hybrid rice in China. However, limited studies can be found on the cultivation techniques aimed at achieving both high yield and high quality for this specific rice cultivar. N and K have certain regulatory effects on rice growth and development. The rational application of N and K can significantly enhance fertilizer utilization efficiency, thereby positively influencing both rice yield and quality. The phenomenon of heavy application of N with a comparably lighter application of K is common due to the relative lower cost of N fertilizer and the established fertilization habits, which leads to high yield but low efficiency in rice production. Numerous studies have explored the individual effects of N or K on rice growth and development. A comprehensive understanding of the combined effects of N and K on nutrient absorption, utilization, as well as their impact on rice yield and quality, remains an area requiring further systematic investigation. Therefore, field experiments were conducted with combined application of three N rates (135, 180, and 225 kg ha-1) and four K rates (0, 90, 135, and 180 kg ha-1) using super indica hybrid rice cultivar YXY 2115 to explore the interactive effects of N and K on rice nutrients absorption and utilization, yield and quality. The objective of this study was to clarify the optimal ration of N and K conducive to achieving both high yield and high quality for YXY 2115. Also, the expression levels of N and K metabolism-related key genes OsNRT1.1B, OsAMT2;1, OsNR2, OsHAK1, OsHAK5 and OsAKT1 were quantified to assess the molecular response of rice grains to different fertilizer application rates. This study was expected to provide a theoretical basis for the optimization and improvement of cultivation methods to achieve high yield, high quality, and reduce fertilizer input for rice production in southwest China, as well as the large-scale promotion and application of this cultivar.
Field experiments were conducted during the growing seasons of 2019 and 2020 at the research farm of Sichuan Agricultural University, Wenjiang city, Sichuan Province, China (30°70′ N, 103°83′ E). The soil of the plot was clay soil. Prior to the establishment of the field experiment, soil samples from the topsoil layer (0-0.20 m) were analyzed. The climate data and analysis results of the top soil layer were shown in Figure 1 and Table 1, respectively. During rice growth period in two years, the daily average temperature and rainfall were 22.78 °C and 3.69 mm in 2019, and 23.31 °C and 6.53 mm in 2020, respectively. Super indica hybrid rice cultivar Yixiangyou 2115 (Sichuan Agricultural University), which is widely cultivated in southwest China with high yield and quality with the whole growth period of 146 days, was chosen and used as the test material.
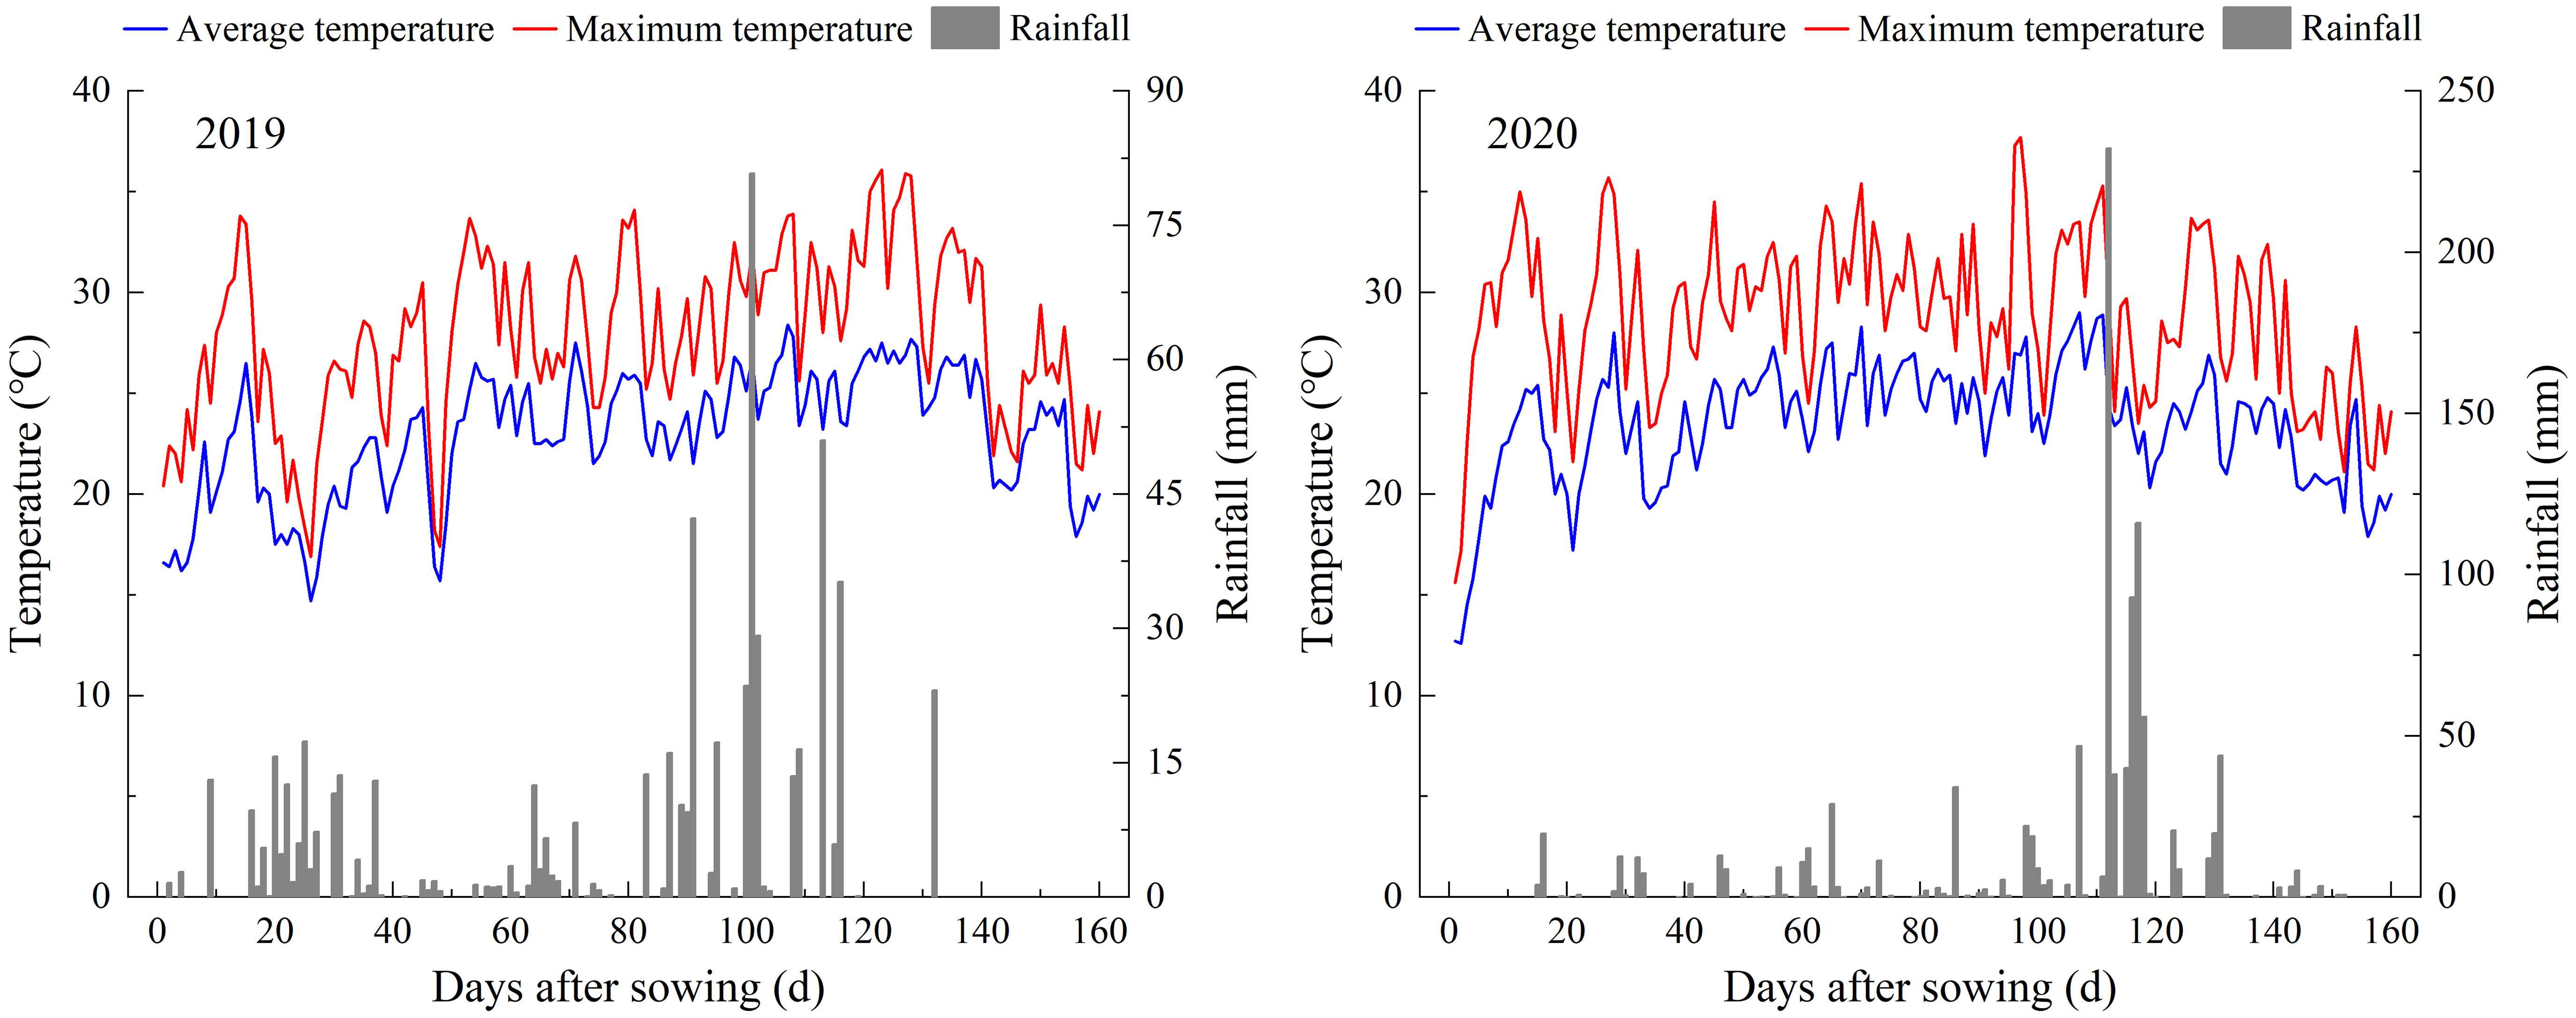
Figure 1 Climate data during the experimental periods.
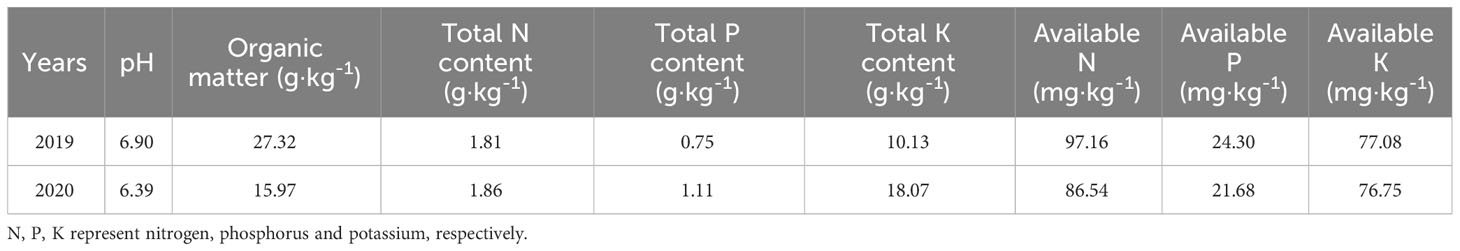
Table 1 Soil properties of the top soil layer (0-0.20 m) at the experimental sites.
Two factor factorial field trials with three levels of N and four levels of K were conducted in two years, using a randomized complete block design with three replicates. Twelve treatments were established by the complete combination of three N application rates (135, 180 and 225 kg ha-1, denoted as N1, N2 and N3, respectively) and four K application rates (0, 90, 135 and 180 kg ha-1, denoted as K0, K1, K2 and K3, respectively). No nitrogen application treatment was established and used to calculate the nutrients absorption and utilization only.
Seeds were sown on 12 April 2019 and 14 April 2020, and the seedlings were transplanted on 27 May 2019 and 26 May 2020, and rice was harvested on 19 Sept 2019 and 20 Sept 2020, respectively. The area of each test plot was 5.0 m×5.0 m, and the transplant density was 30 cm×25 cm (row spacing × plant spacing) with one seedling per hill. Urea (N, 46.4%) was used as the N source, superphosphate (P2O5, 12.0%) was used as the phosphorus (P) source, and potassium chloride (K2O, 60.0%) was used as the K source. N fertilizer was used as basal manure and top dressing (twenty days after transplanting) at a 6:4 ratio. Basal N, P (90 kg ha-1) and K were applied to the soil one day before transplanting. For the fertilizer treatments, ridges with plastic film were used for separation, and protection lines were established between the treatment blocks to ensure the isolation of the experimental plots. During the whole growing season, rice was continuously flooded with the river water. Field management, including the prevention and control of pests and weeds, was conducted according to the local cultural practices.
Ten representative hills were sampled from each plot based on the average number of tillers at full heading stage (9 Aug 2019 and 13 Aug 2020) and maturity stage (14 Sept 2019 and 15 Sept 2020), respectively. Samples were then separated into different parts, and were oven-dried at 105°C for 30 min and then to constant weight at 80°C to determine the dry weight. DM of stem-sheath, leaf, panicle, and total biomass were recorded.
After weighted, all dried samples were ground to make powder, passed through a 0.20 mm sieve, and digested with a mixture of concentrated H2SO4 and H2O2 to determine N and K concentrations. The N concentration was determined using a continuous flow analyzer (AA3, Seal Analytical Inc., Southampton, UK) while K was determined using flame photometer (M-410, Sherwood Scientific Ltd., Cambridge, UK). The nutrients absorption and utilization efficiency were analyzed as below (Wang et al., 2004, 2009).
Total RNA samples were obtained from rice grains at mid-filling stage (15 days after flowering) using RNA Trizol reagent (Invitrogen, Carlsbad, CA, USA) and reverse-transcribed into cDNA using Revertase Transcription kit (Nanjing Vazyme Medical Technology Co., Ltd., Nanjing, China). The products were quantified using a real-time PCR detection system, following the manufacturer’s instructions (SYBR Green Master Mix, Vazyme). The rice Actin gene was used as an internal control. Treatment without nitrogen fertilizer was used as CK. The PCR primers used were listed in Supplementary Table S5.
Rice was harvested at maturity stage and the yield in each experimental plot was recorded after measuring moisture content and removing impurities. Grain yield was adjusted to a moisture content of 13.5%. The number of effective tillers per hill was determined before harvest using 30 plants per plot. A total of 10 selected plants were separated into single tillers according to the marked date, and were used to measure 1000-grain weight, seed-setting rate, and filled grain number per panicle.
At harvest, 10 plants from each plot were sampled randomly and allowed to dry naturally in the sun to assess rice milling quality, appearance quality, eating quality and rapid visco-analyzer (RVA) value after the material was stored at room temperature for 3 months.
About 100.0 g rice grains were processed using a rice huller (JLG-2118, Taizhou Food Instrument Co., Ltd., Zhejiang, China) to obtain brown rice. The brown rice was polished using a rice milling machine (JNMJ-3, Taizhou Food Instrument Co., Ltd., Zhejiang, China) to obtain milled rice. In order to obtain head rice, grain with a length longer than 3/4 of its total length was separated from the milled rice using a broken rice separator (FQS-13X20, Taizhou Food Instrument Co., Ltd., Zhejiang, China). The brown rice, milled rice, and head rice are expressed as percentages of the total grain weight.
The grain length, width, length/width, chalkiness rate and chalkiness degree were determined using a grain appearance analyzer (JMWT12, Dongfu Jiuheng Instrument Technology Co., Ltd., Beijing, China).
A 3.00 g sample and 25.0 mL of distilled water were added to a test tube. Pasting properties were measured using an RVA device (3-D, Newport Scientific, Sydney, Australia) and analyzed with Thermal Cycle for Windows software. Viscosity values were measured in a rapid viscosity analyzer unit (RVU).
The sensory properties of the cooked rice were measured using a rice sensory analyzer (STA 1B, Satake Asia Co., Ltd., Tokyo, Japan). Milled rice (30.00 g) was washed in a stainless-steel container and then transferred into a 50 mL aluminum box containing 40 mL of water. The milled rice was cooked in a multifunctional, timed food steamer (GF-339, Goodway Electrical Enterprise Ltd., Hong Kong, China). After the cooking, the sensory properties of the cooked rice were determined. Cooked rice texture properties were measured using a rice texture analyzer (RHS 1A, Satake Asia Co., Ltd., Tokyo, Japan).
Data were analyzed by using analysis of variance (ANOVA), and means were compared based on the least significant difference (LSD) test at the 0.05 probability level by using SPSS 25.0 (Statistical Product and Service Solutions Inc., Chicago, IL, USA). The assumptions of variance analysis were tested by ensuring that the residuals were random, homogenous, with a normal distribution about/above a mean of zero (Ali et al., 2013; Abolfazl et al., 2017). Origin Pro 2020 (OriginLab, Northampton, MA, USA) was used to draw the figures. Matlab (Mathworks, Natick, MA, USA) was used to establish the binary quadratic fitting equation and figures.
DM accumulation in the aboveground organs of rice could be enhanced by increasing N application, and could be further increased by applying appropriate K application at high N level (Figure 2). The maximum values of DM accumulation in stem-sheath, leaf and panicle were observed under N3 at both full heading stage and maturity stage. Compared with other treatments, the maximum increases of total DM accumulation were obtained under N3K2, which were 57.54-66.62% at maturity stage. Variance analysis showed that co-application of N and K had extremely significant interactive effects on the DM accumulation in the aboveground organs of rice (except panicle at full heading stage) (Supplementary Table S1).
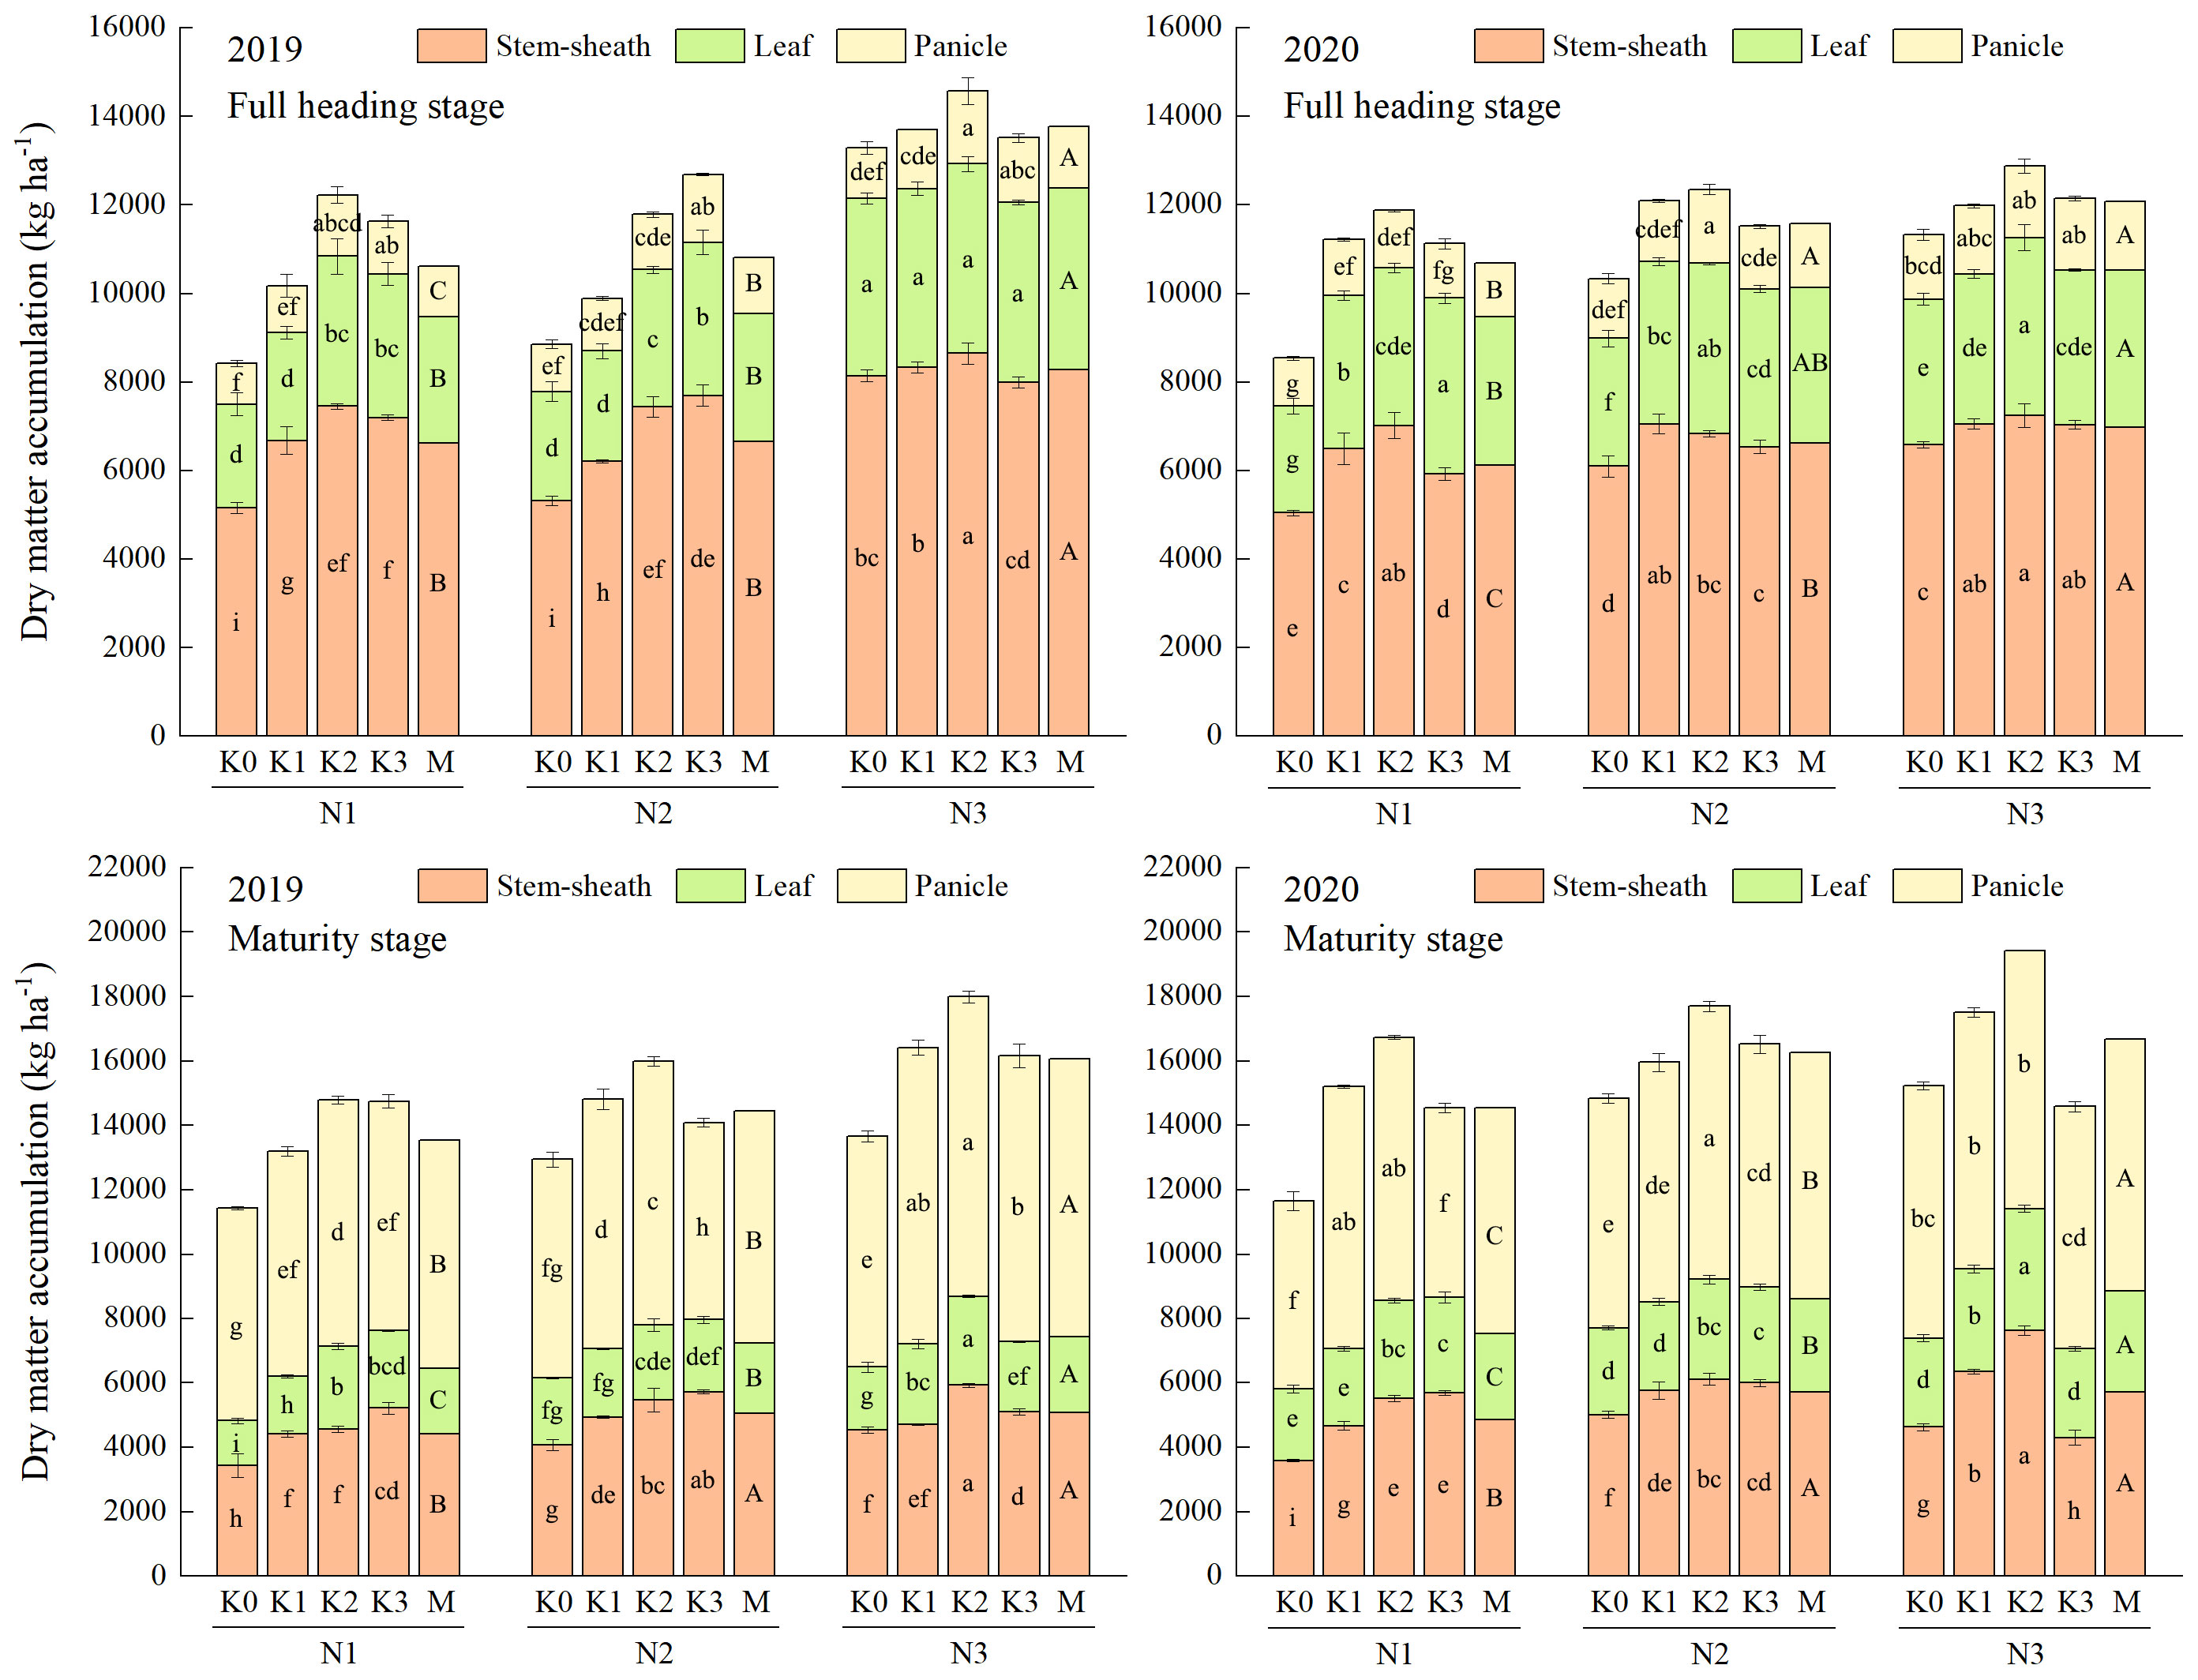
Figure 2 Effects of combined application of N and K on dry matter accumulation of YXY 2115 at full heading stage (above) and maturity stage (below). K0, K1, K2 and K3 refer to the different potassium fertilizer treatments (0, 90, 135 and 180 kg ha-1, respectively). N1, N2 and N3 refer to the different nitrogen fertilizer treatments (135, 180 and 225 kg ha-1, respectively). M represents the average of different potassium fertilizer levels under the same nitrogen fertilizer level. Different lowercase (uppercase) letters in the same color column mean the significant difference between treatments at p < 0.05. The data presented are the mean ± standard deviation, n = 3.
Increasing application of N could improve the uptake of both N and K (except K uptake in stem-sheath and leaf in 2020). The uptake of N and K could be further increased by applying appropriate K application, with a more obvious effect observed at high N level (Figures 3, 4). Co-application of N and K had extremely significant interactive effects on the uptake of N and K in the aboveground organs of rice (Supplementary Table S2). The highest uptakes of N and K in stem-sheath, leaf and panicle were observed under N3 at both full heading stage and maturity stage.
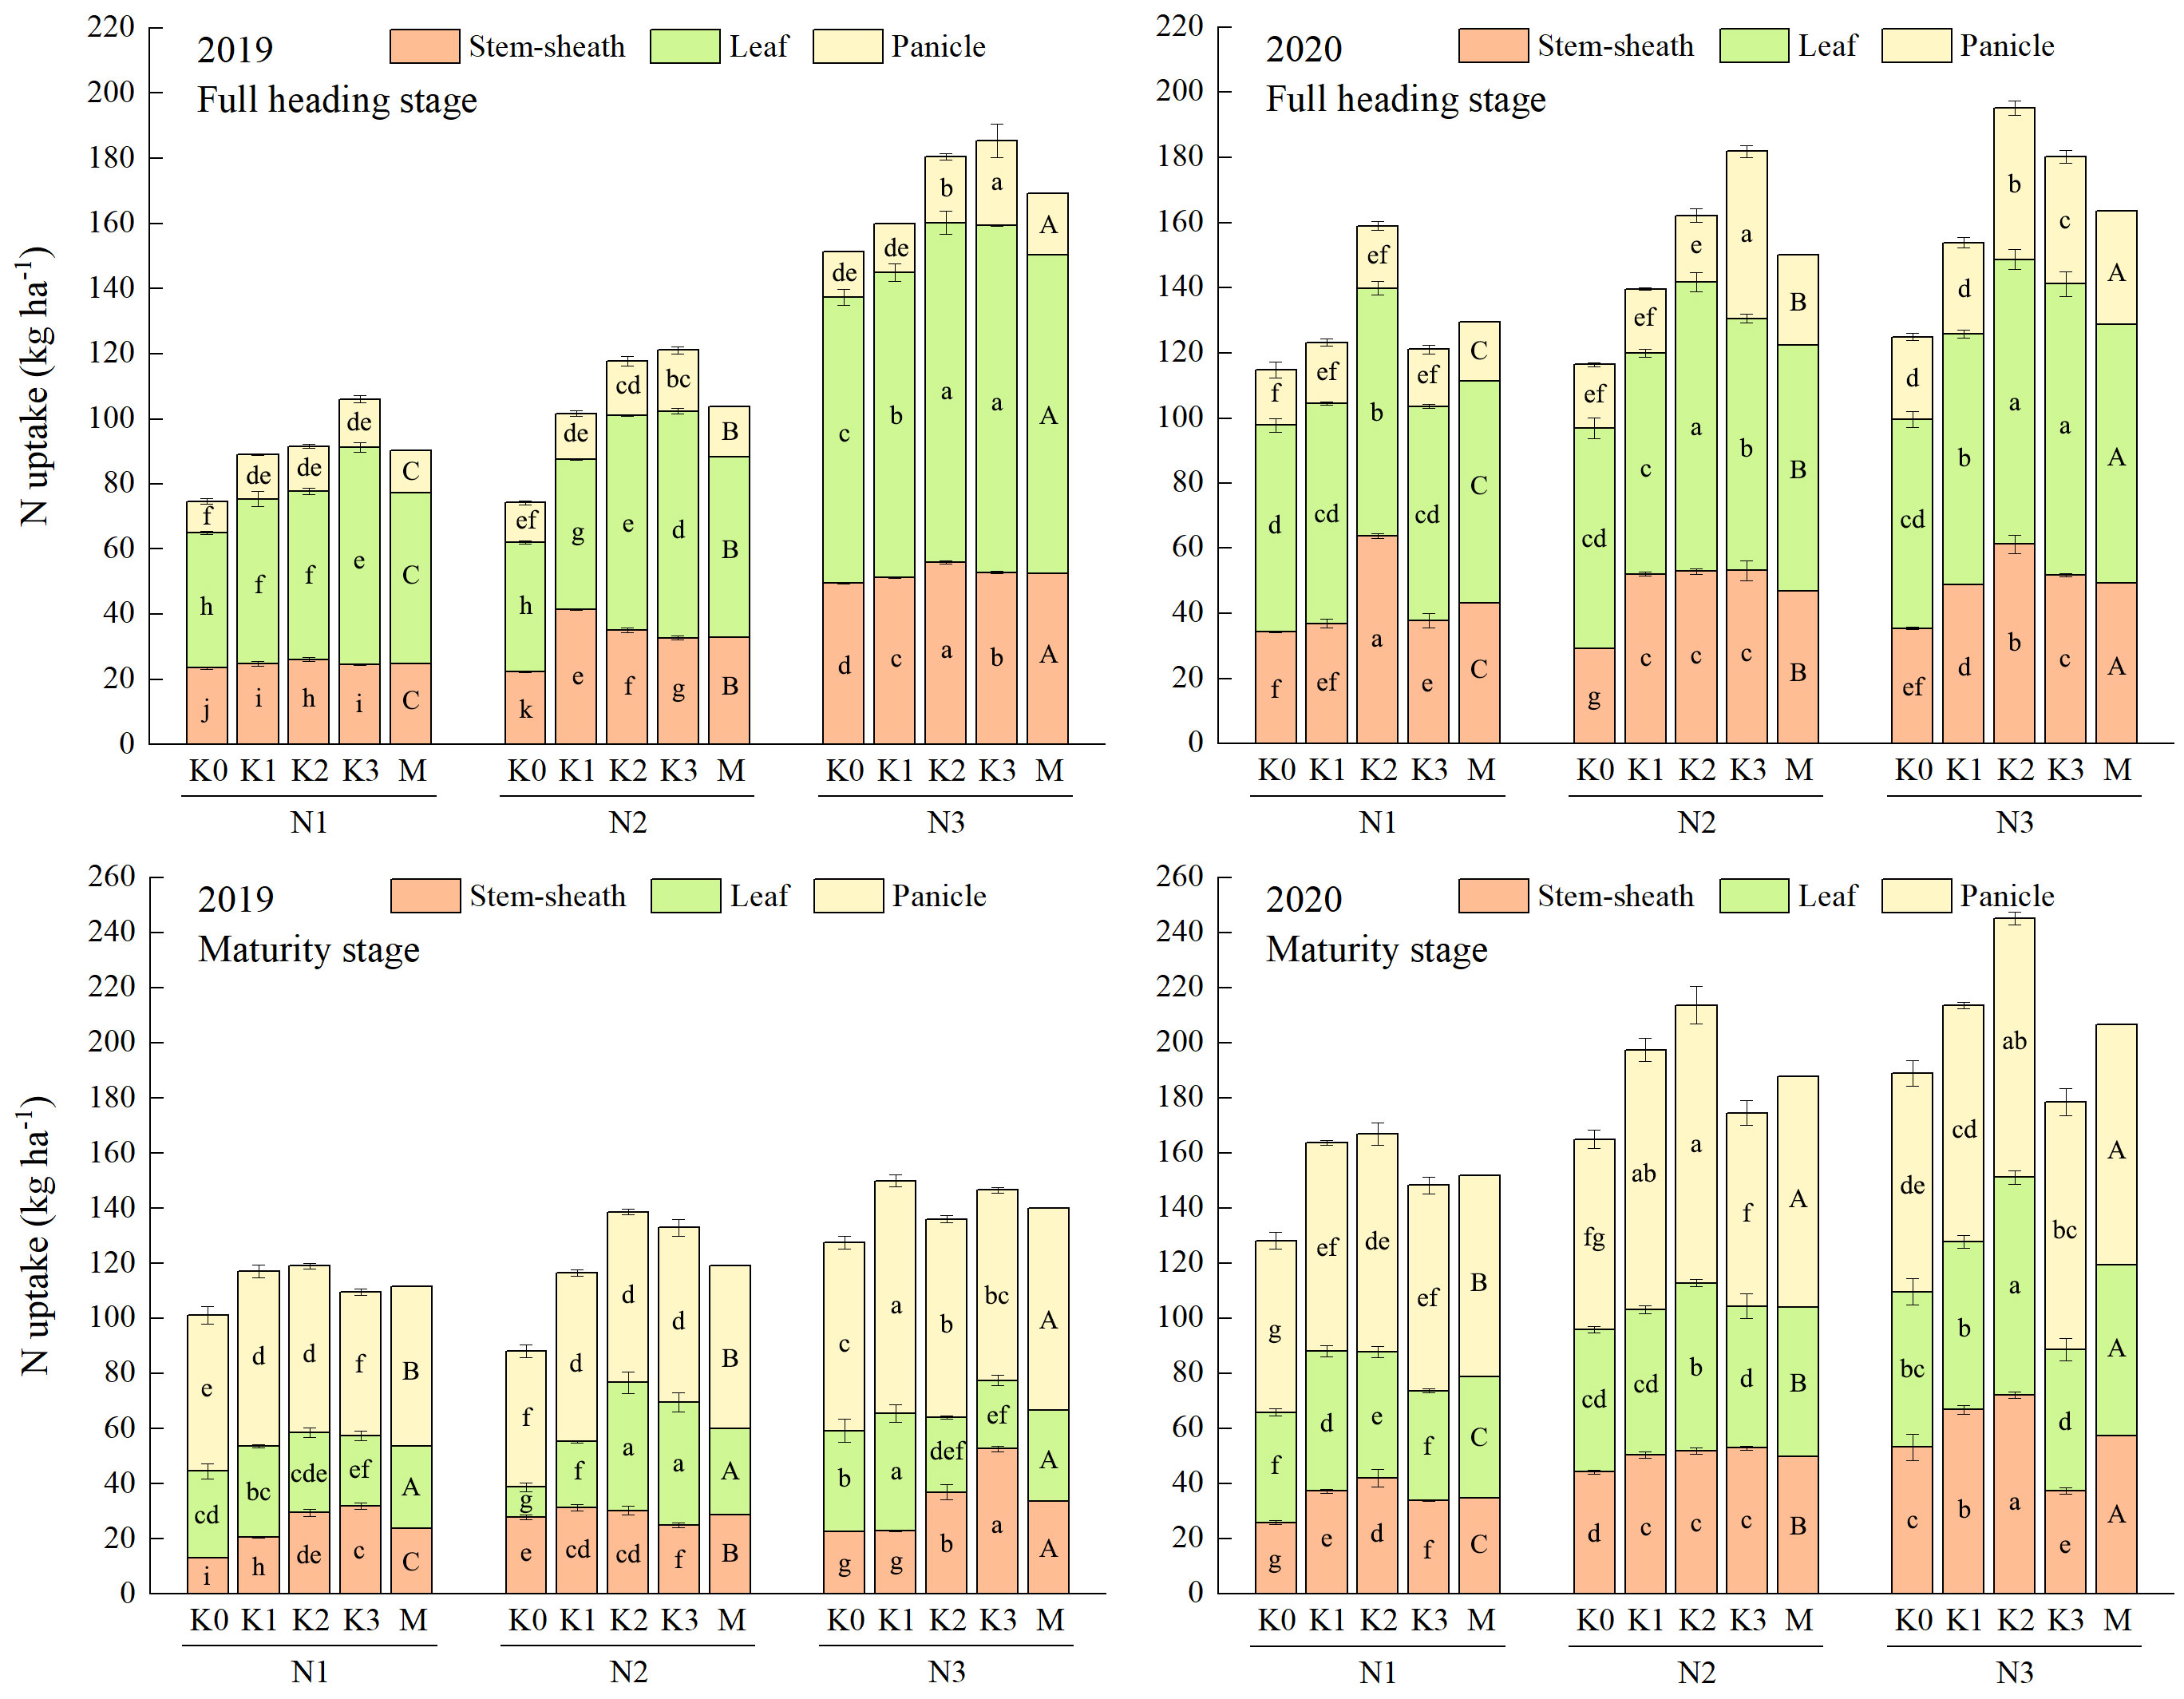
Figure 3 Effects of combined application of N and K on N uptake of YXY 2115 at full heading stage (above) and maturity stage (below). K0, K1, K2 and K3 refer to the different potassium fertilizer treatments (0, 90, 135 and 180 kg ha-1, respectively). N1, N2 and N3 refer to the different nitrogen fertilizer treatments (135, 180 and 225 kg ha-1, respectively). M represents the average of different potassium fertilizer levels under the same nitrogen fertilizer level. Different lowercase (uppercase) letters in the same color column mean the significant difference between treatments at p < 0.05. The data presented are the mean ± standard deviation, n = 3.
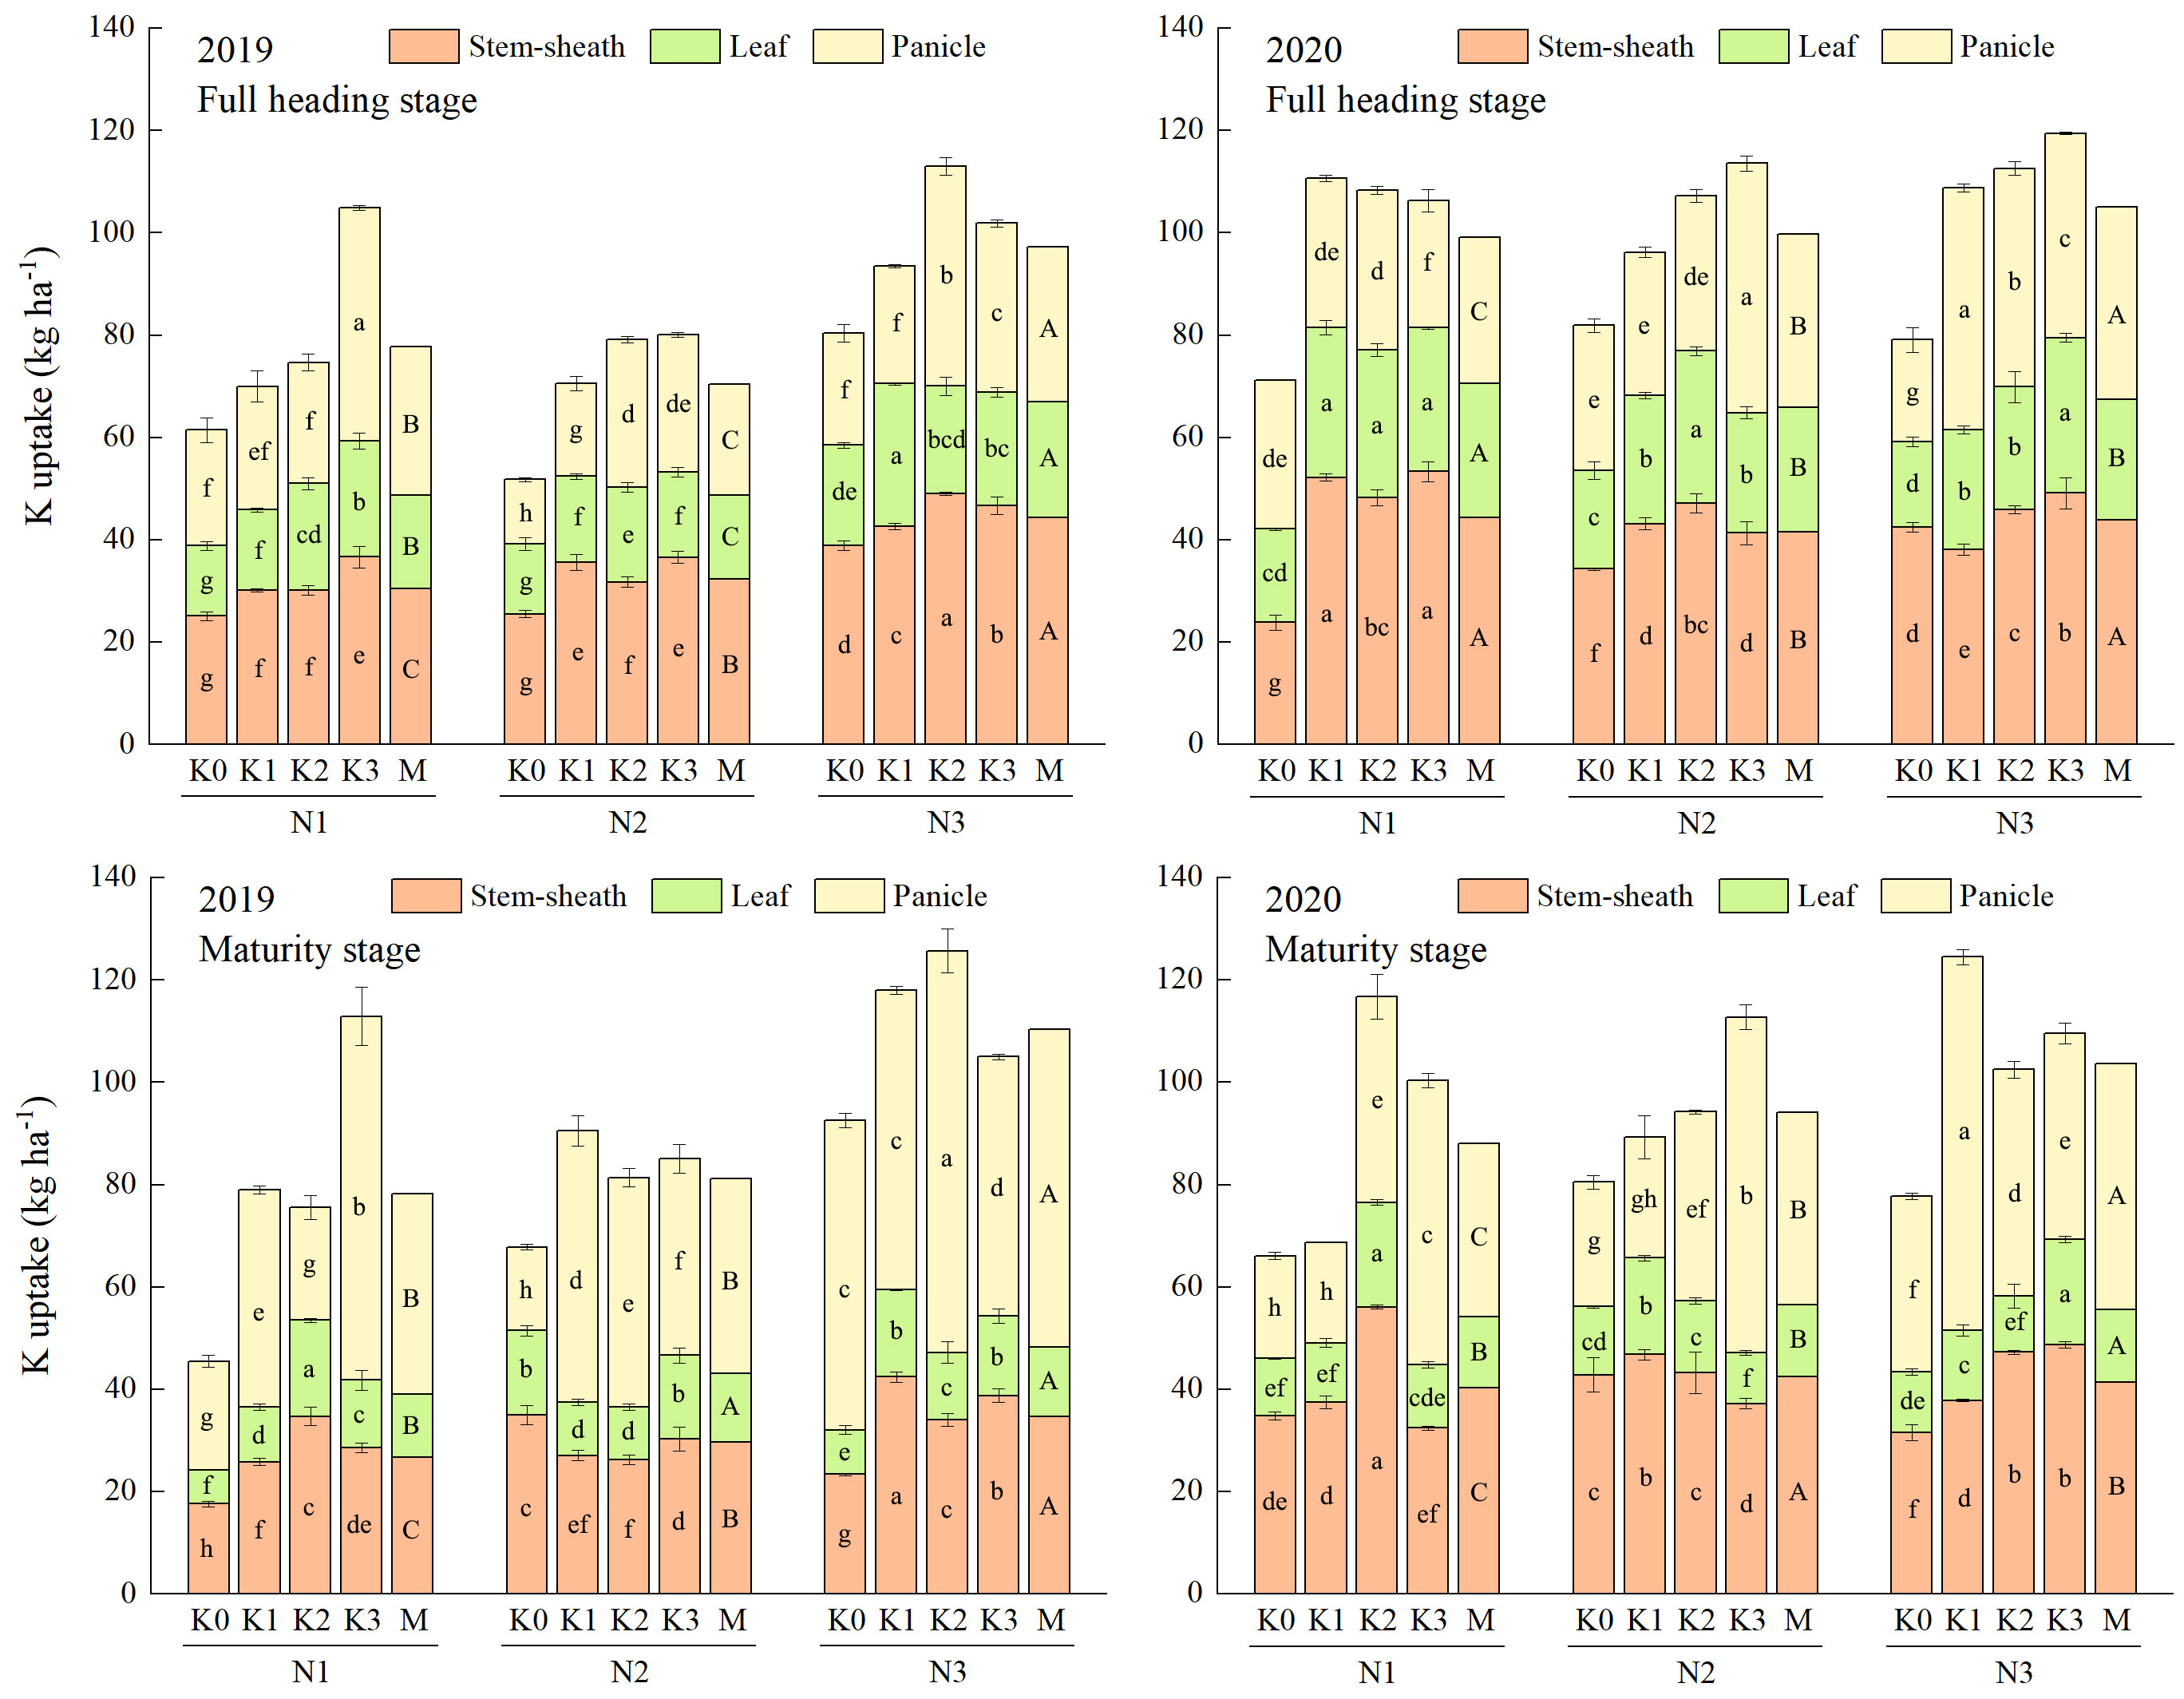
Figure 4 Effects of combined application of N and K on K uptake of YXY 2115 at full heading stage (above) and maturity stage (below). K0, K1, K2 and K3 refer to the different potassium fertilizer treatments (0, 90, 135 and 180 kg ha-1, respectively). N1, N2 and N3 refer to the different nitrogen fertilizer treatments (135, 180 and 225 kg ha-1, respectively). M represents the average of different potassium fertilizer levels under the same nitrogen fertilizer level. Different lowercase (uppercase) letters in the same color column mean the significant difference between treatments levels at p < 0.05. The data presented are the mean ± standard deviation, n = 3.
At maturity stage, the maximum increases were obtained under N3K1 (48.20%) in 2019 and N3K2 (91.29%) in 2020 for the total uptake of N, and under N3K2 (176.30%) in 2019 and N3K1 (88.21%) in 2020 for the total uptake of K, respectively, when compared with other treatments.
No obvious and consistent changes were observed in the response of N and K use efficiency indexes to the combined application of N and K in two years test results. NRE decreased but KHI increased with increasing N levels. Although the application of K could increase NRE, NAE, NCR and KCR within a certain range, it resulted in a decrease KAE (Tables 2, 3). Variance analysis showed that co-application of N and K had extremely significant interactive effects only on recovery efficiency and harvest index of N and K.
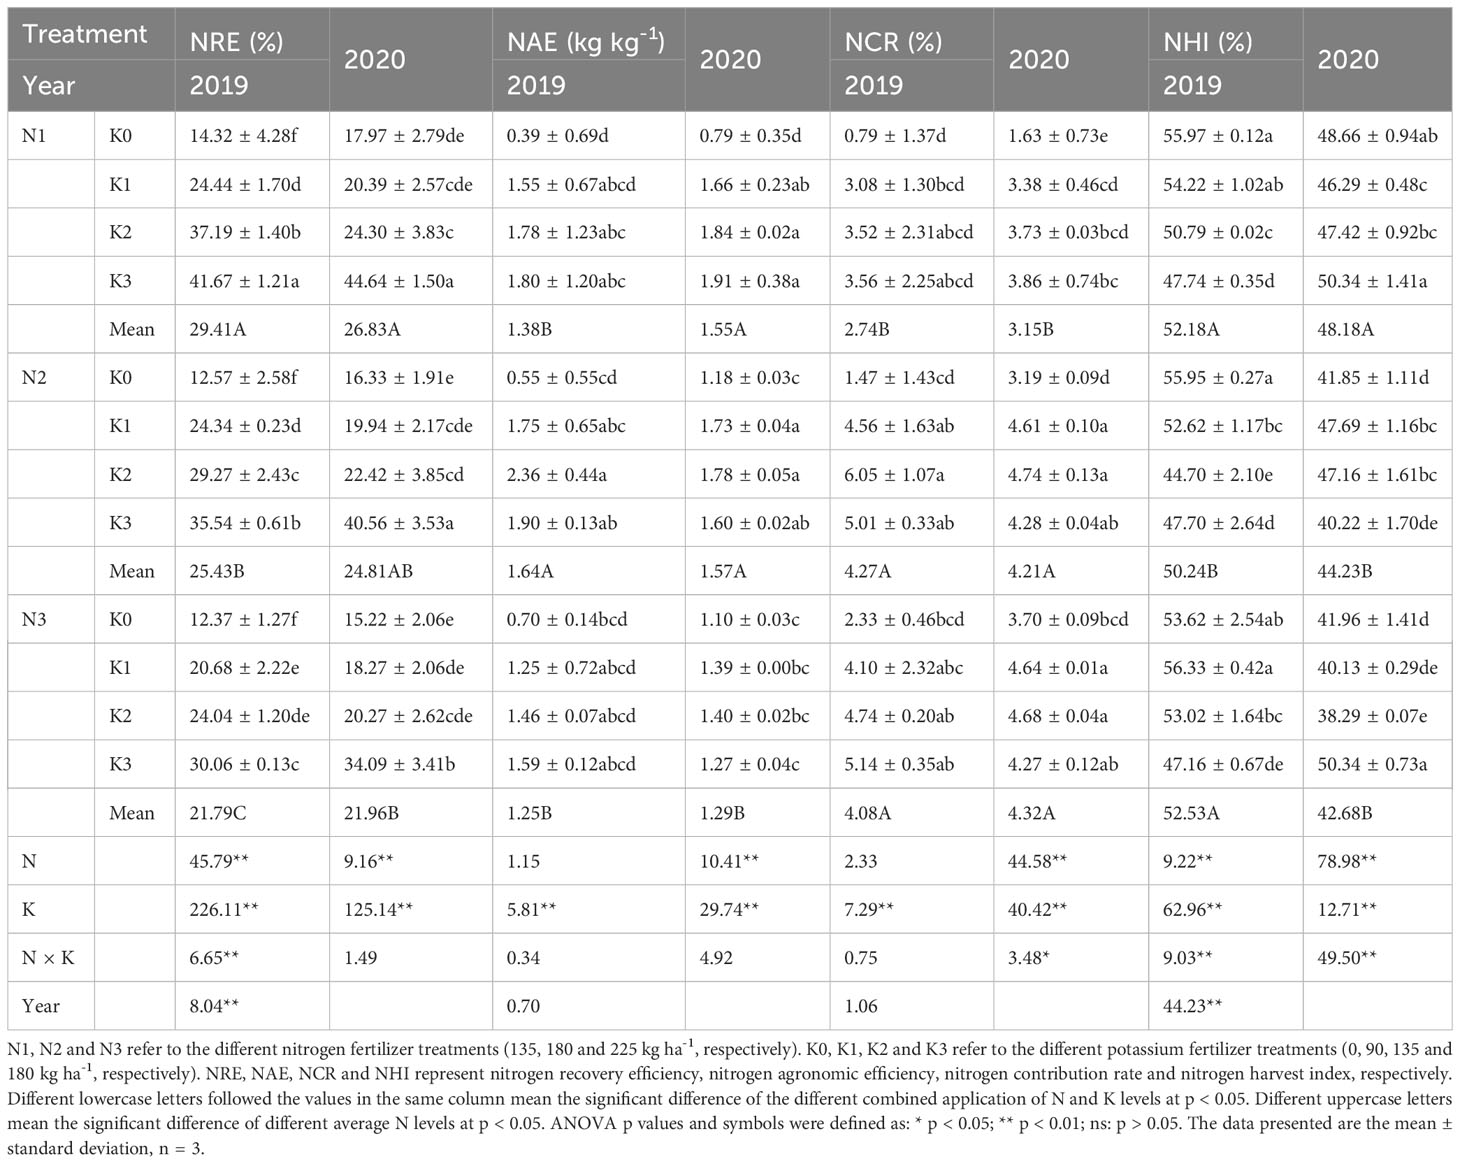
Table 2 Effects of combined application of N and K on N use efficiency of YXY 2115.
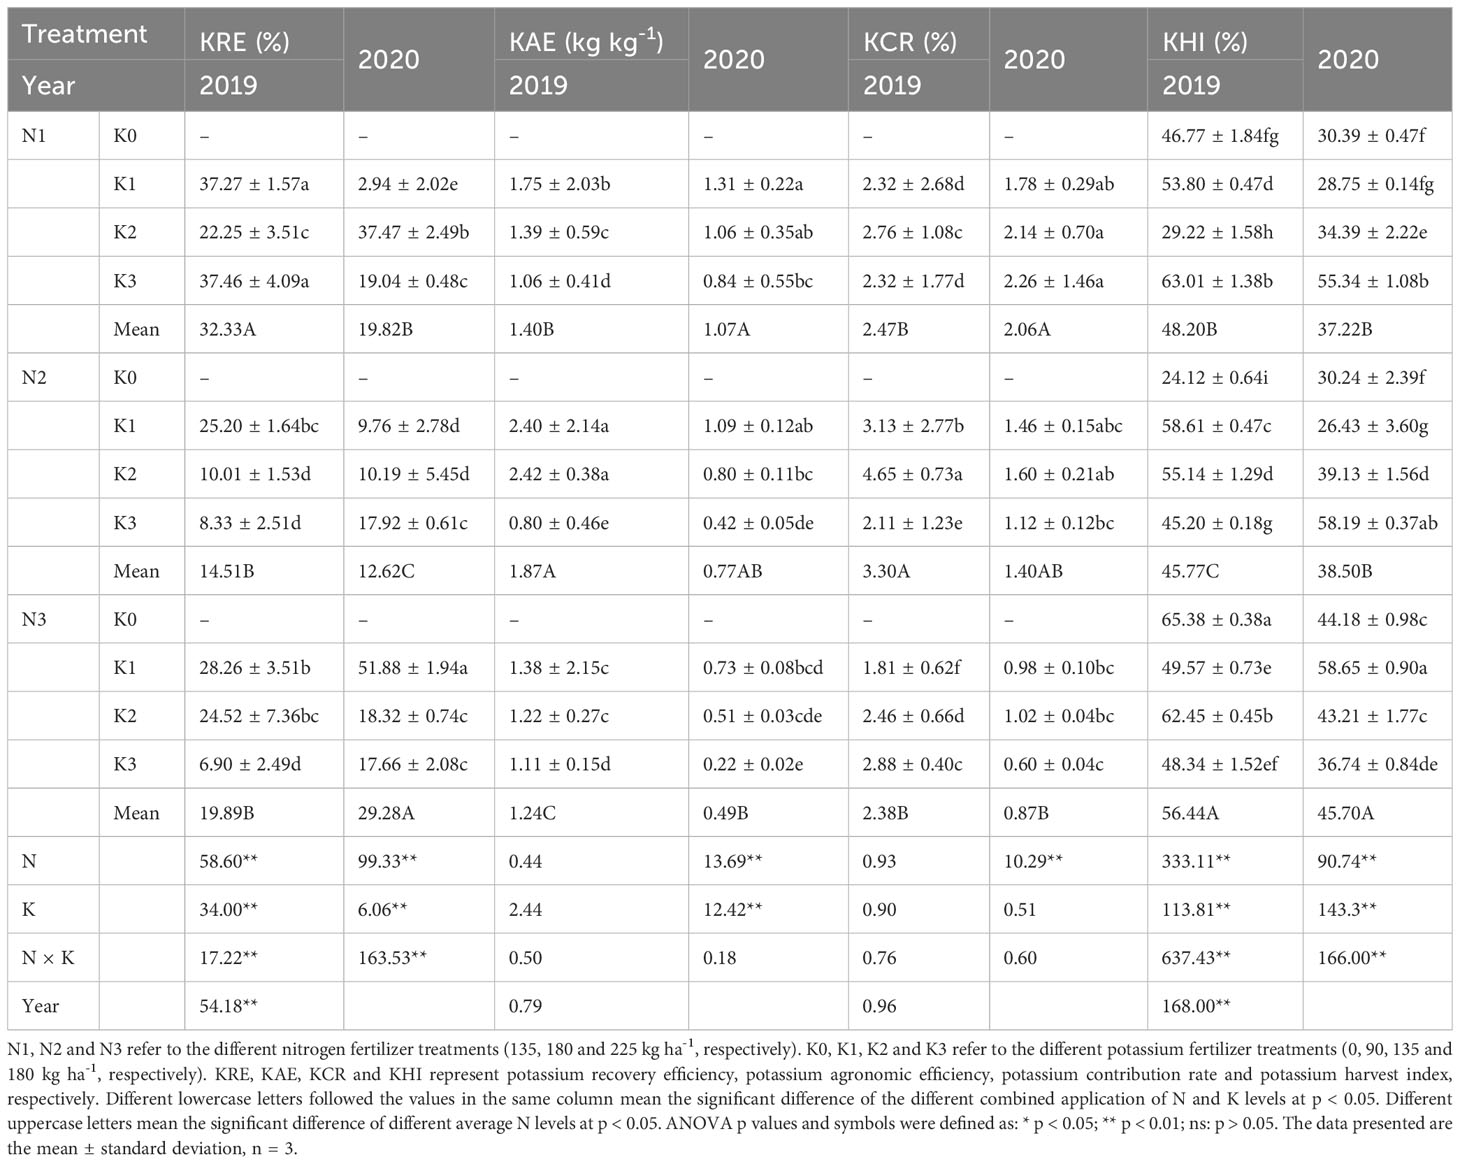
Table 3 Effects of combined application of N and K on K use efficiency of YXY 2115.
Compared with other treatments, the maximum increases were obtained under N1K3 (193.30-236.86%) in both years for NRE, and under N1K3 (442.90%) in 2019 and N3K1 (1664.63%) in 2020 for KRE. And the maximum increases were obtained under N3K1 (19.44%) in 2019 and N3K3 (31.47%) in 2020 for NHI, and under N3K0 (171.06%) in 2019 and N3K1 (121.91%) in 2020 for KHI.
Six genes were selected for analysis in response to the different fertilizer application rates in hybrid rice cultivar YXY 2115, considering their significant roles in N and K metabolism. The results showed that OsNRT1.1B, OsNR2, OsHAK1, OsHAK5 and OsAKT1 had high expression level under high application rates of both N and K except OsAMT2;1, which were consistent with the above results of N and K uptake (Figure 5). The peak expression levels of OsNRT1.1B and OsAMT2;1 were obtained under N3K1 and N3K0, respectively. OsNR2 and OsHAK5 got their highest expression levels under N3K2. Meanwhile, OsHAK1 and OsAKT1 achieved the highest expression levels under N3K3.
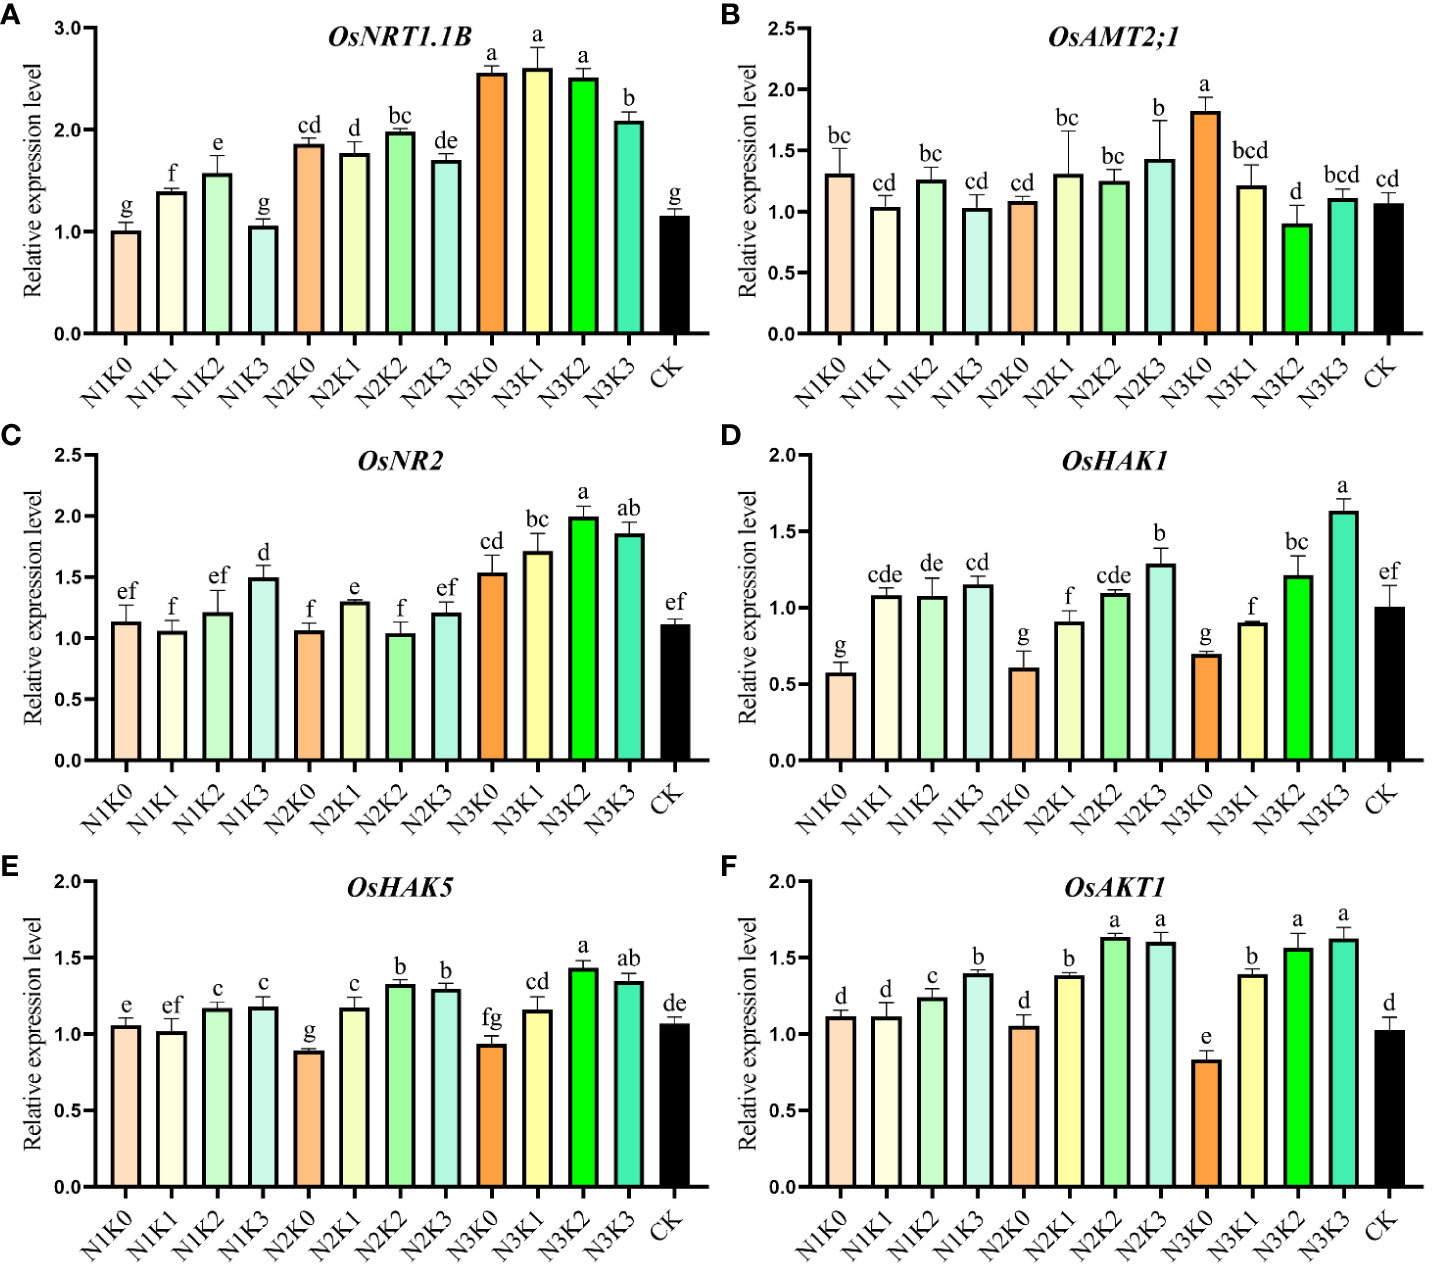
Figure 5 Effects of combined application of N and K on expression levels of N and K metabolism-related genes in rice grains at mid-filling stage. N1, N2 and N3 refer to the different nitrogen fertilizer treatments (135, 180 and 225 kg ha-1, respectively). K0, K1, K2 and K3 refer to the different potassium fertilizer treatments (0, 90, 135 and 180 kg ha-1, respectively). Different lowercase letters mean the significant difference between treatments levels at p < 0.05. The data presented are the mean ± standard deviation, n = 3.
With increasing N levels, grain yield (GY), panicle number (PN) and spikelet per panicle (SP) increased, while seed setting rate (SR) showed the opposite trend. No significant difference was found in 1000-grain weight (GW) among different treatments. The combination of appropriate N levels with a high K level could further improve yield and yield components (Table 4). Variance analysis showed that co-application of N and K had extremely significant interactive effects on SP. The highest GY, PN and SP were observed under N3. Compared with other treatments, the maximum increases of GY and SR were obtained under N2K2 (3.27-5.61%) and N1K3 (16.32-20.53%), respectively. And the maximum increases were obtained under N2K3 (117.97%) in 2019 and N3K3 (39.06%) in 2020 for PN, and under N3K2 (29.10%) in 2019 and N2K3 (30.78%) in 2020 for SP.
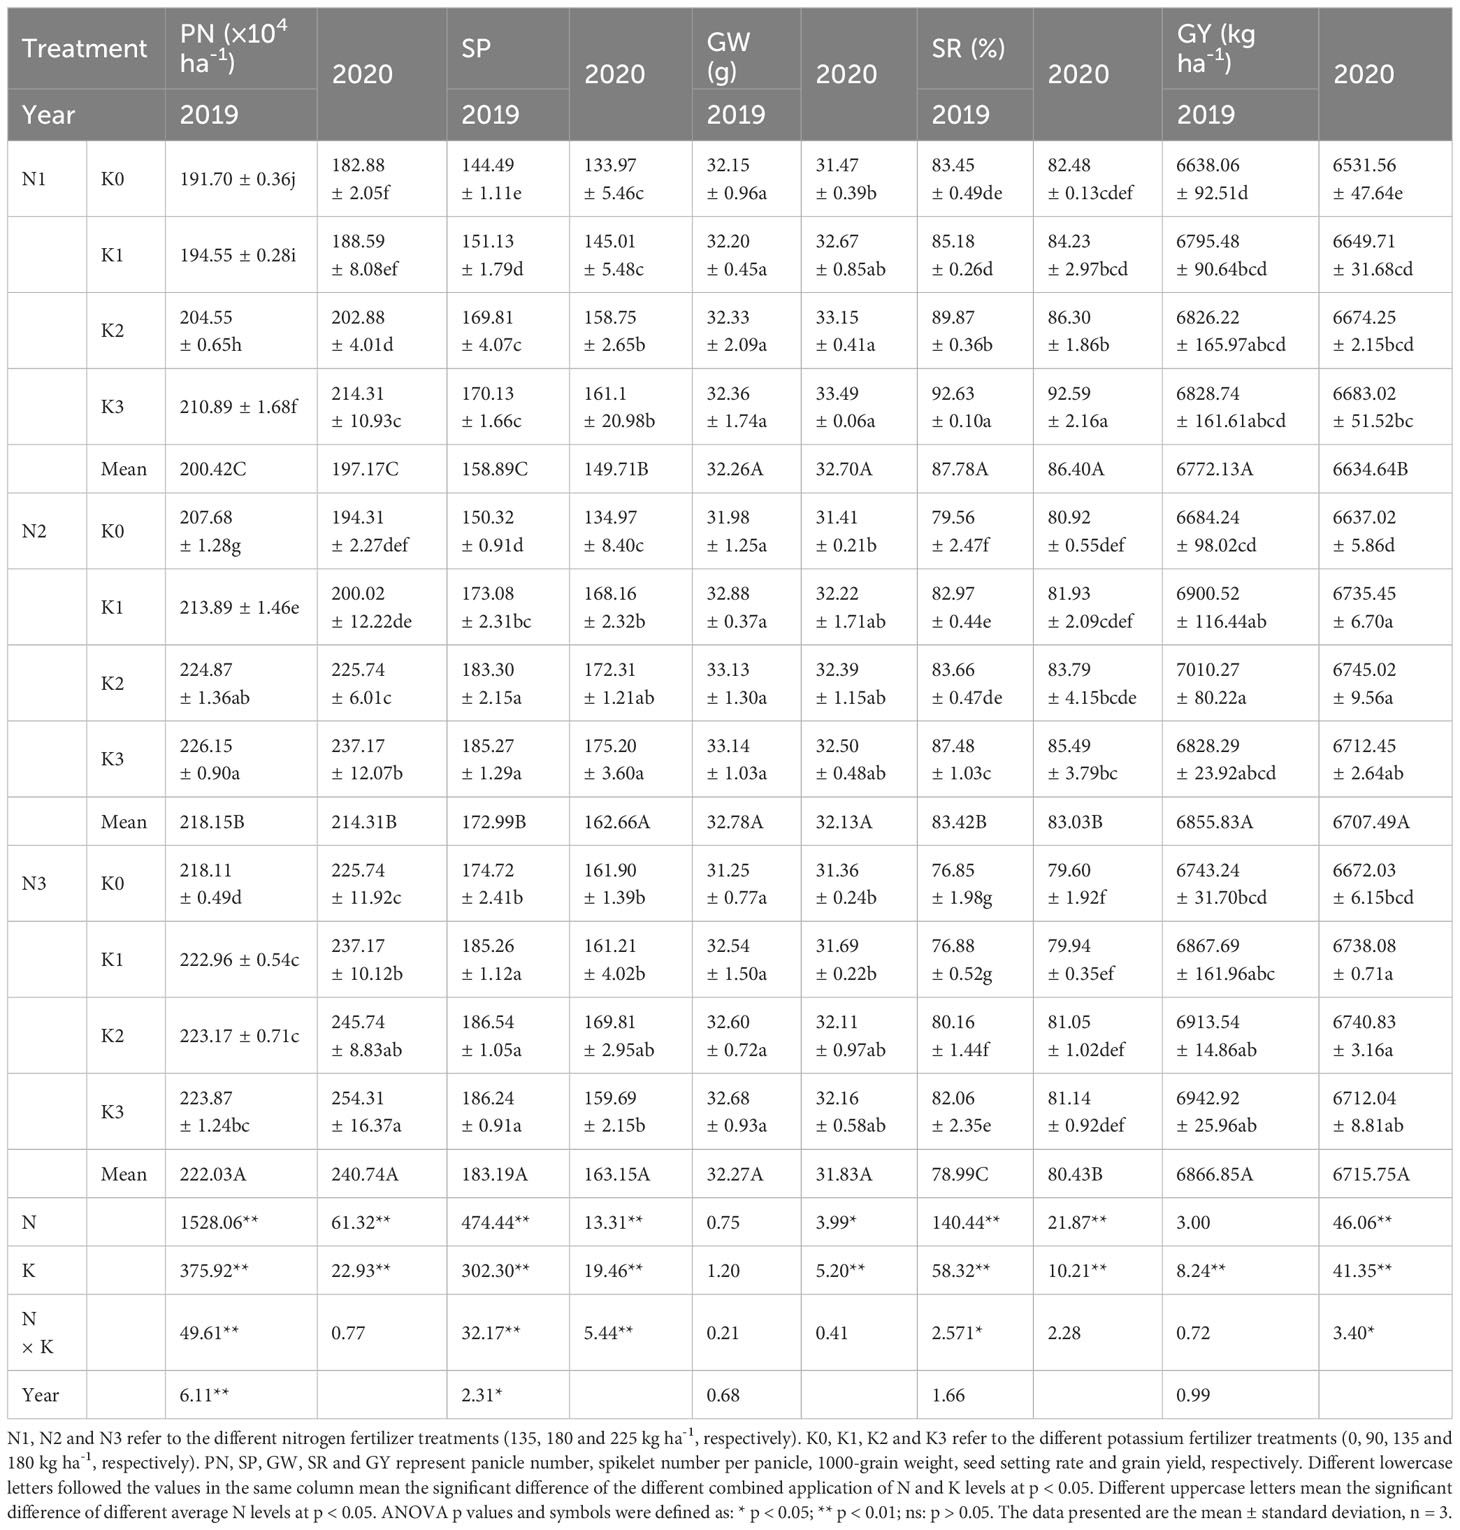
Table 4 Effects of combined application of N and K on yield and yield components of YXY 2115.
Regression analysis of N and K application rates and yield was carried out. By establishing a binary quadratic equation, the fertilizer response function equation between N and K application rates and yield was obtained.
Here: Y represents the yield (kg ha-1), N represents the nitrogen application rate (kg ha-1), K represents the potassium application rate (kg ha-1).
The results showed that the relationship between N and K application rates and yield could be described by binary quadratic equations, with each index exhibiting a maximum value (Figure 6). Considering both economic benefits and yield, in conjunction with the fertilizer response function equation, the optimal yield reached 6936.58 kg ha-1 in 2019. The recommended application rates for N and K were 210.18 kg ha-1 and 136.90 kg ha-1, respectively. In 2020, the highest yield achieved was 6750.54 kg ha-1 in 2020, with the suggested application rates of N and K being 205.98 kg ha-1 and 115.02 kg ha-1, respectively.
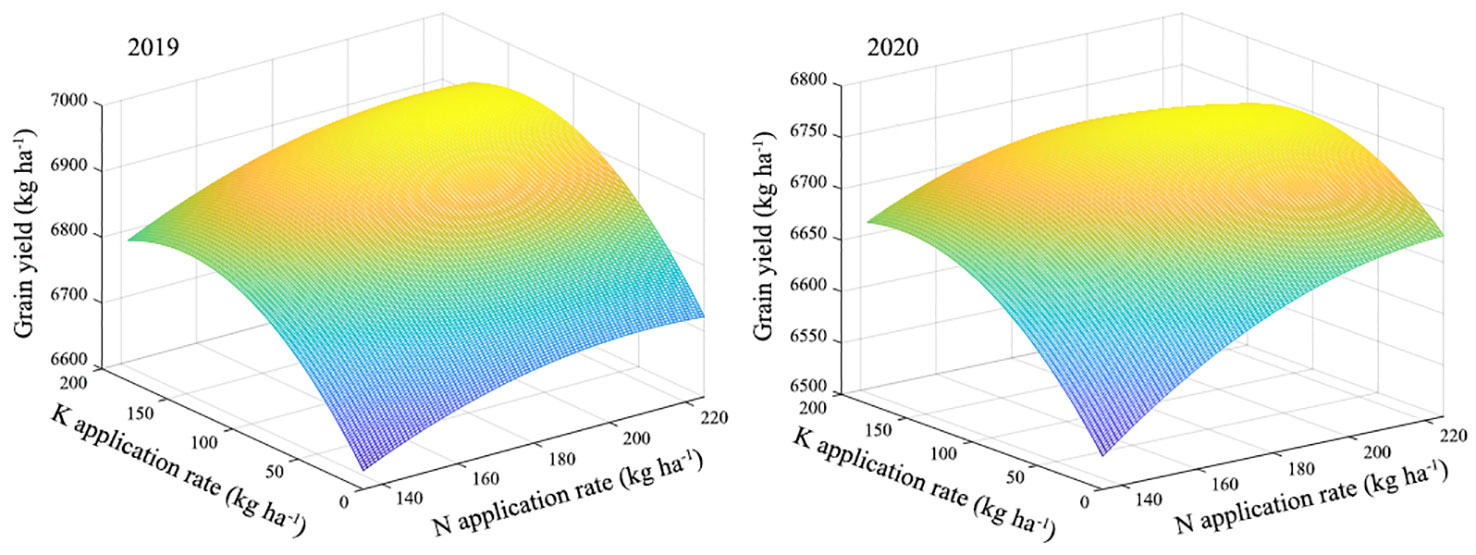
Figure 6 The fertilizer response function equation of relationship between rice yield and combined application of N and K. N and K represent nitrogen and potassium, respectively.
The application of N could improve rice appearance quality, but decreased milling quality, as well as cooking and eating quality. Conversely, the application of K had the opposite effect. Co-application of N and K had extremely significant interactive effects on various rice quality indexes, including milled rice rate (MR), head rice rate (HR), chalkiness rate (CR), chalkiness degree (CD), peak viscosity (PV), breakdown viscosity (BV), setback viscosity (SV) and taste value (TV) (Tables 5, 6). The complete data for rice cooking and eating quality is available in Supplementary Tables S1, S2. However, there were no obvious changes in the response of RVA profile characters to the combined application of N and K. The highest MR, HR and TV were observed under N1, while the lowest CR and CD were observed under N1. The optimal rice milling quality and cooking and eating quality were obtained under N1K2, while the best rice appearance quality was obtained under N3K0. Compared with other treatments, the maximum increases in MR, HR, TV, CR and CD were 10.67-13.11%, 15.86-36.93%, 11.25-12.24%, 36.84-38.02% and 47.06-47.46%, respectively.
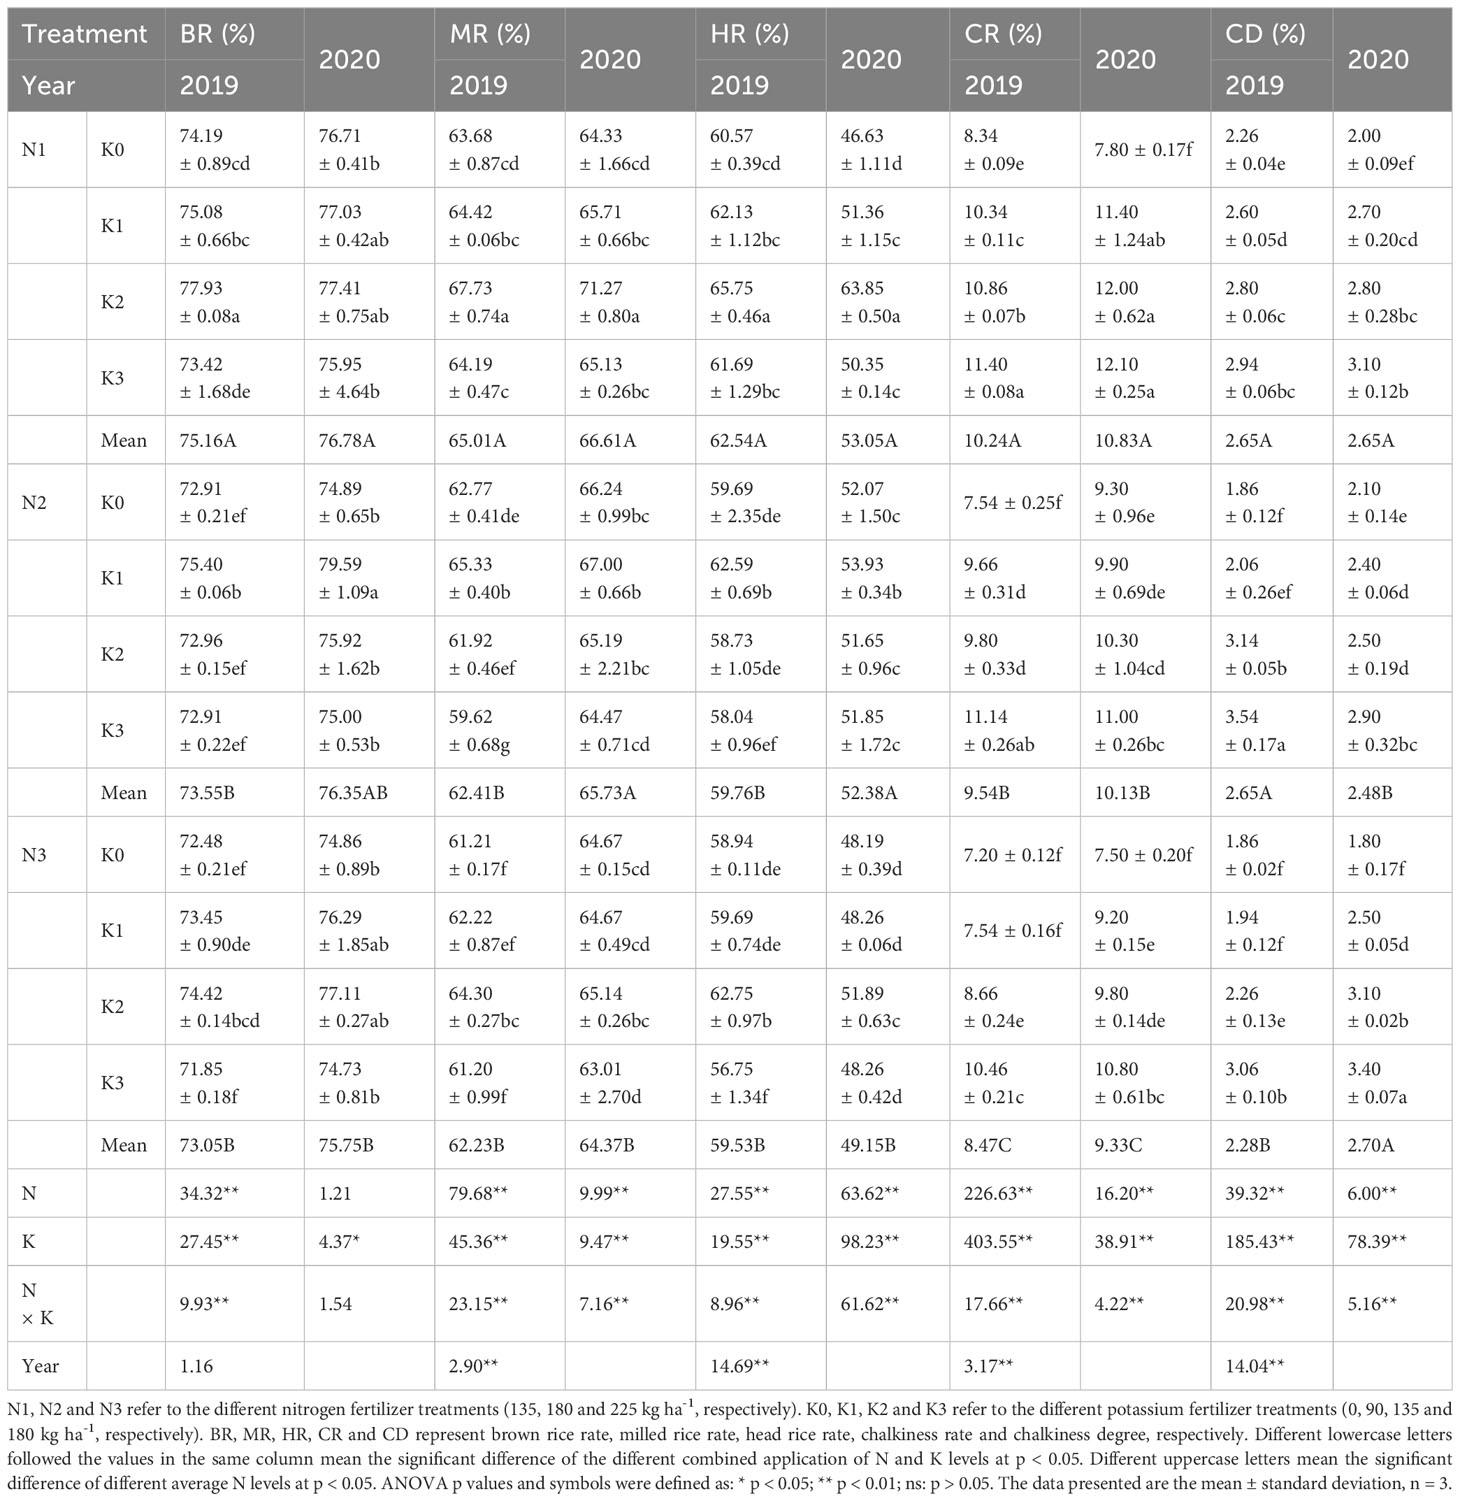
Table 5 Effects of combined application of N and K on milling and appearance quality of YXY 2115.
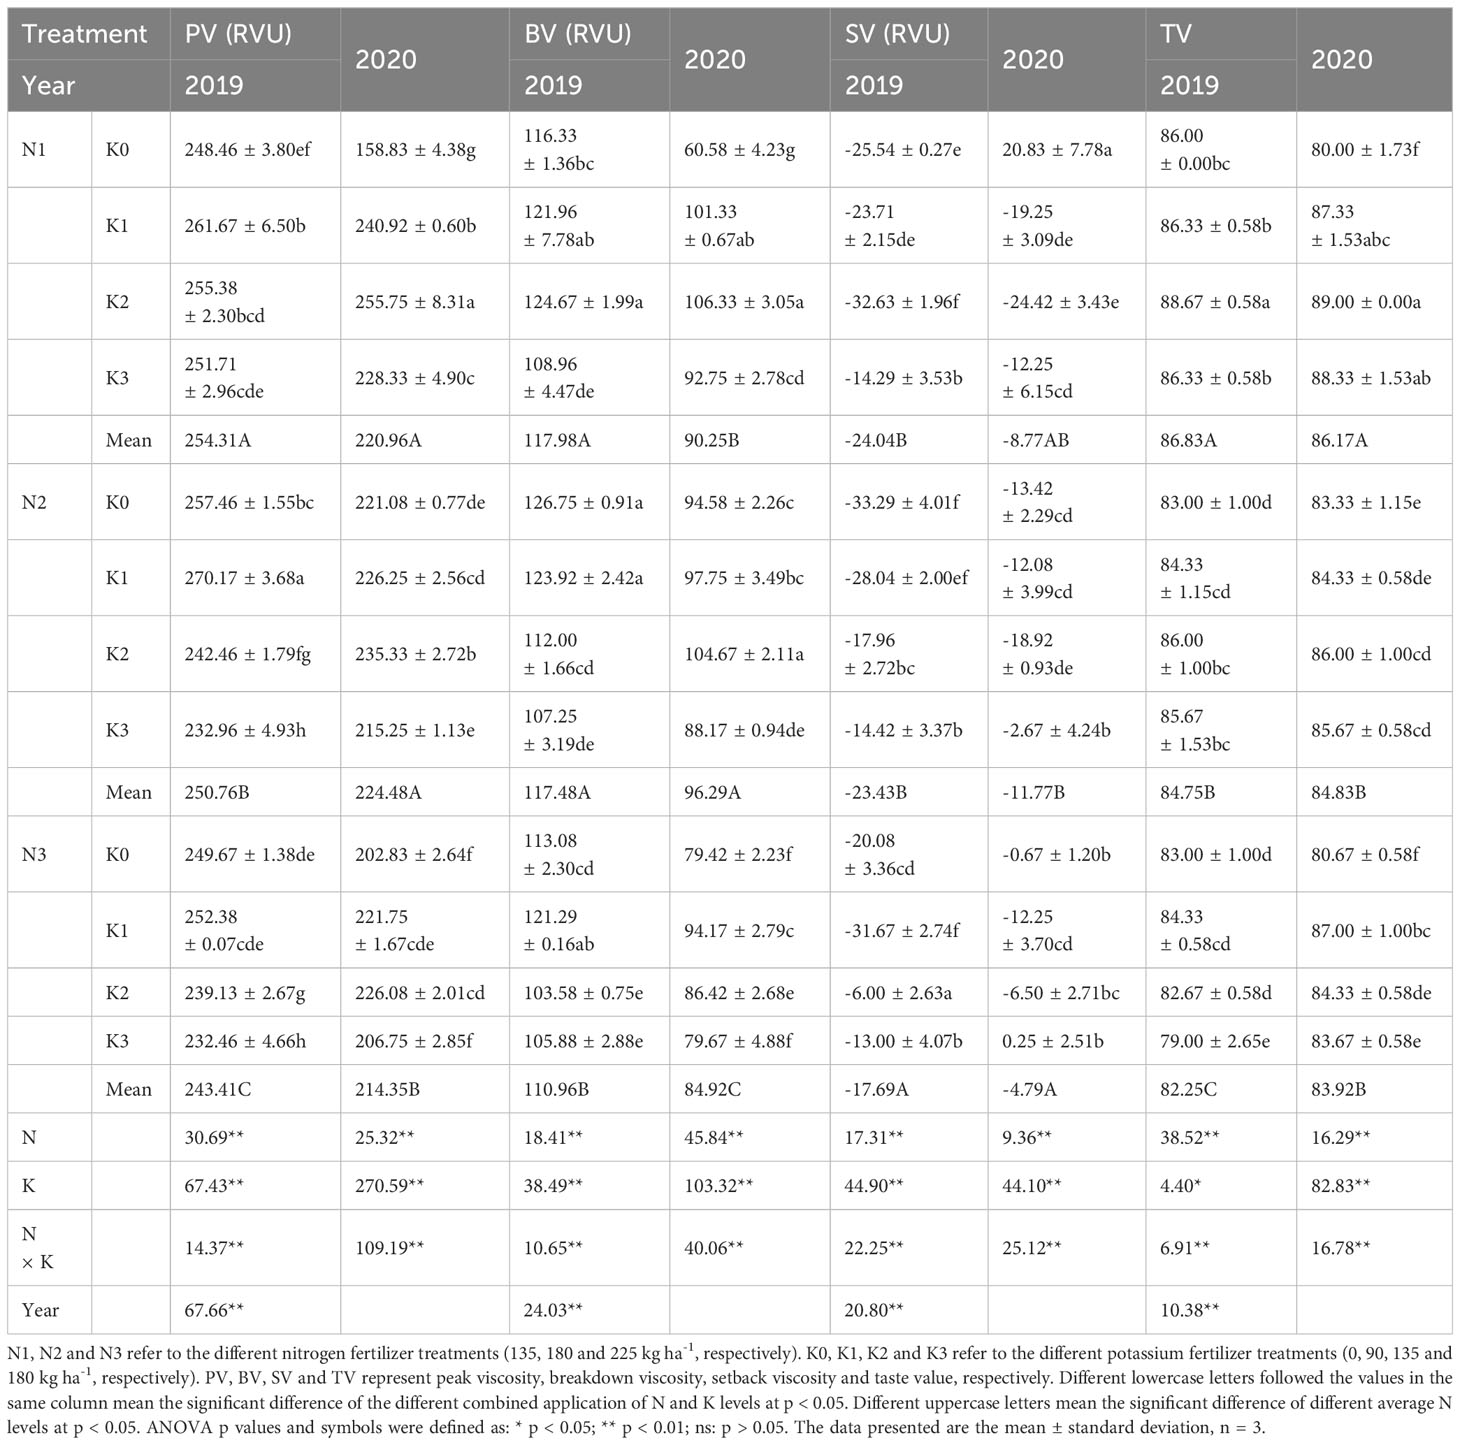
Table 6 Effects of combined application of N and K on cooking and eating quality of YXY 2115. .
The growth of rice and the formation of rice yield are closely linked to nutrient uptake. Studies have reported that the accumulation of DM increased with increasing N levels (Sun, 2019), and the N accumulation of rice all increased at each growth stage (Tang et al., 2019). The combined application of N and K could significantly alleviate the limitations to photosynthesis, especially the biological constraints (Hou et al., 2018). In the present study, the DM accumulation of each vegetative organ in the aboveground part of YXY 2115 increased with increasing N levels at both full heading stage and maturity stage. Notably, the uptakes of N and K in stem-sheaths and leaves decreased, while showing a significantly increase in panicles, in agreement with the previous studies (Li et al., 2014; Yan, 2018; Jiang et al., 2020). Compared with N1, the total DM accumulation at maturity stage increased by 14.79-18.64%%. As more N was gradually applied, the uptakes of N and K in stem-sheaths, leaves and panicles all increased. Compared with N1, the total uptake of N and K under N3 at maturity stage increased by 5.89-24.94%% and 17.68-40.99%, respectively. The enhancement of N and K uptake could be further optimized through the appropriate application of K, with a more pronounced effect observed under high N levels. However, the DM accumulation showed a trend of first increasing and then decreasing with increasing K under moderate and higher N levels, indicating that while appropriate application of K under high N levels increased DM accumulation, excessively high N and K levels may hinder this process. This phenomenon might be attributed to the decrease in leaf Rubisco enzyme activity under high N levels, subsequently limiting the photosynthetic N use efficiency (Li, 2011). Correlation analysis is statistical method that is used to discover if there is a relationship between two variables, and how strong that relationship may be. Hence, correlation analysis was conducted on indexes that were relatively important in terms of rice nutrient absorption and utilization, yield, and quality, as well as those exhibiting significant interactive effects when N and K were applied together. Correlation analysis showed that GY was significantly positively correlated with TDA, TNA and TKA at maturity stage (Figure 7). These results indicated that rational co-application of N (225 kg ha-1) and K (90-135 kg ha-1) could promote the N and K uptake and the N and K accumulation in the aboveground parts, thereby maintaining or increasing yield. As DM accumulation forms the foundation for rice yield. Taken together, high N levels (180-225 kg ha-1) combined with appropriate application of K (135 kg ha-1) could not only mitigate fertilizer waste but also facilitate the establishment of a high-yield population in rice production.
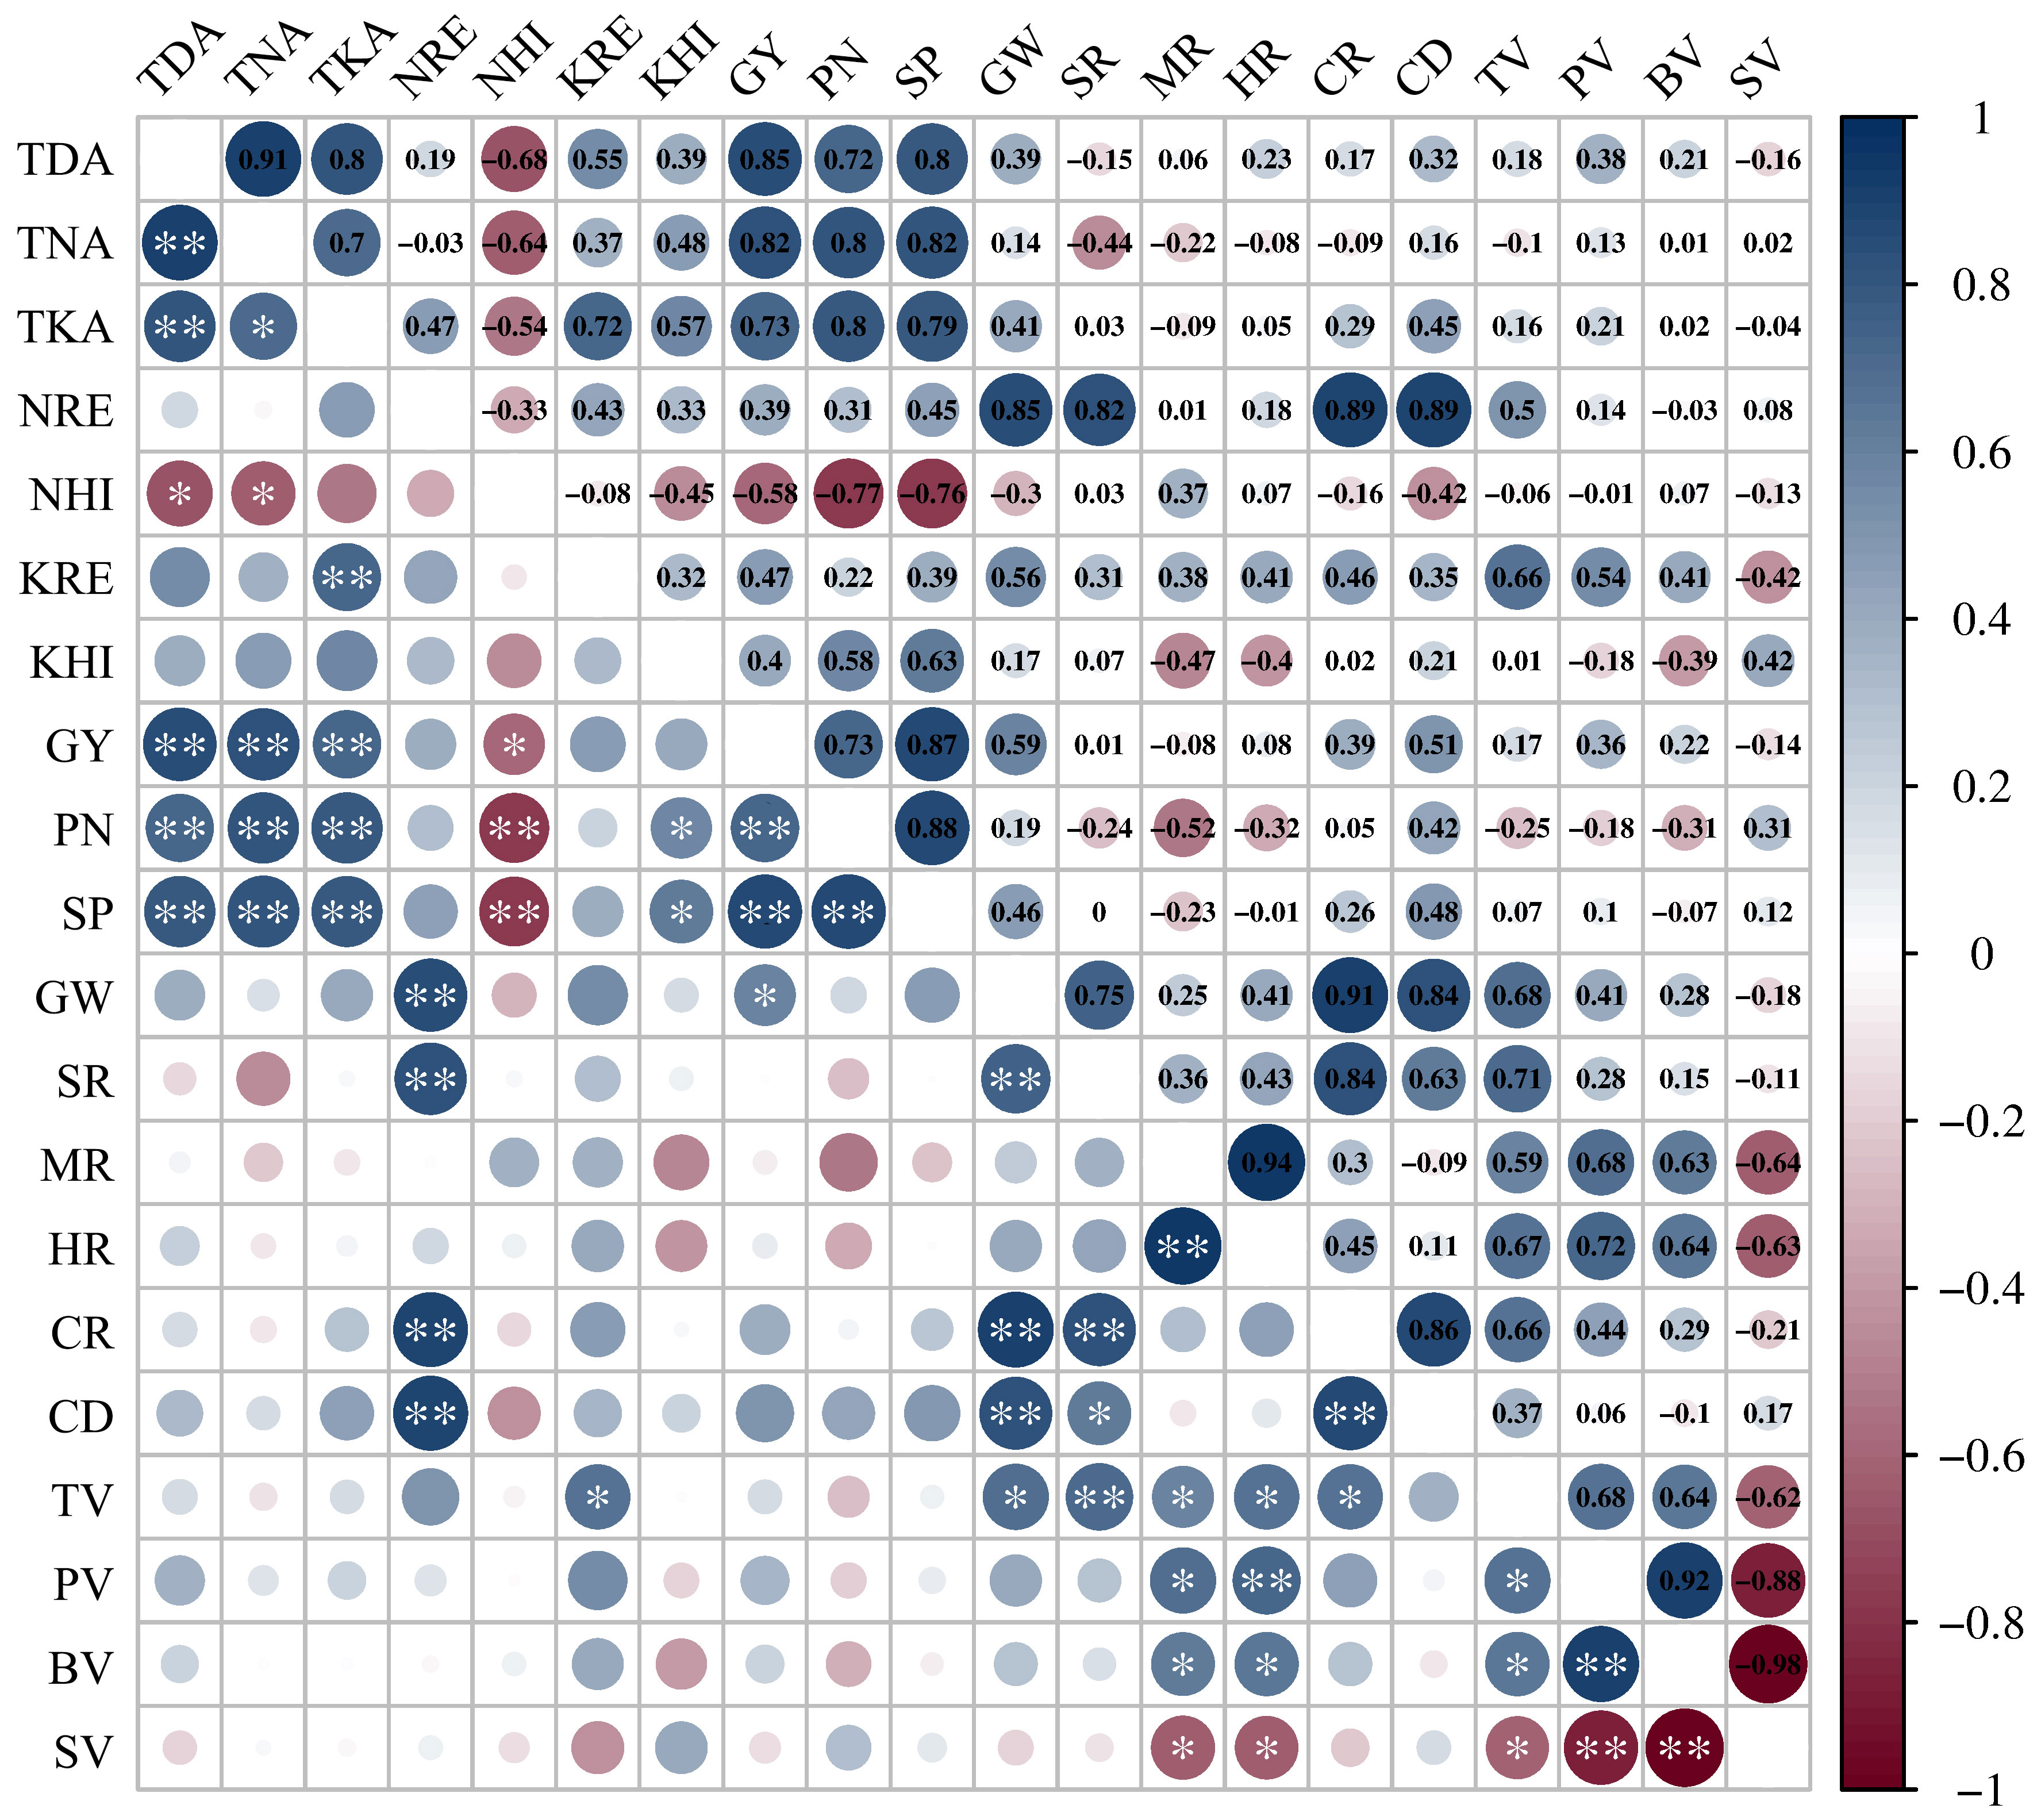
Figure 7 Correlation coefficients of nutrients absorption and utilization characteristics with rice yield, yield components and rice quality. TDA, TNA, TKA, NRE, NHI, KRE, KHI, GY, PN,SP, GW, SR, MR, HR, CR, CD, TV, PV, BV and SV represent total dry matter accumulation at maturity stage, total nitrogen accumulation at maturity stage, total potassium accumulation at maturity stage, nitrogen recovery efficiency, nitrogen harvest index, potassium recovery efficiency, potassium harvest index, grain yield, panicle number, spikelet number per panicle, 1000-grain weight, seed setting rate, milled rice rate, head rice rate, chalkiness rate, chalkiness degree, taste value, peak viscosity, breakdown viscosity and setback viscosity, respectively. ANOVA p values and symbols were defined as: * p < 0.05; ** p < 0.01; ns: p > 0.05.
Fertilizer use efficiency is an important indicator for assessing the transportation and distribution of nutrients in plant organs (Zhou et al., 2020). The application rate of N has a significant effect on NRE, NAE and NHI. As N levels increased, N accumulation in rice increased significantly. However, the proportion of N in panicles decreased while its proportion in stem-sheaths increased, resulting in a decrease in NRE, NAE and NHI (Dong et al., 2015; Cheng et al., 2018). K has been observed to enhance the activities of nitrate reductase and aminotransferases, indicating a positive role of K in N metabolism (Ahanger et al., 2015; Hu et al., 2016). In our study, as more N was gradually applied, NRE decreased and KHI increased. Simultaneously, NRE, NAE, NCR and KCR increased, while KAE decreased with increasing K at the same N level. The observed changes in nutrients use efficiency and yield aligned with the principle of diminishing returns for fertilizer (Lu, 2003). Most researchers addressed that the application of N within a certain range could lead to a decrease in NRE, which was consistent with our results. However, variations in other indexes in the two-year field experiments were either inconsistent or not conspicuous, which differed with the results of previous studies. This might be related to the unique characteristics of the YXY 2115 cultivar. The varying sensitivity of different rice cultivars to N and K could potentially be a key factor affecting fertilizer absorption and utilization (Qiu et al., 2016), necessitating further research for a comprehensive understanding.
There are two main pathways through which plants acquire nutrients: direct nutrient absorption, where plant roots directly assimilate nutrients via ion channels or transporters from the soil; and indirect nutrient absorption, through which plants obtain nutrients from the environment through symbiosis with microorganisms (Chu et al., 2021). However, researches on the expression of genes related to N and K metabolism are mainly focused on rice roots, shoots, stems and leaves.
Previous studies have identified LOC_Os10g40600 as encoding a nitrate transporter NRT1.1B which has been demonstrated to mediate nitrate signal transduction. In this study, the expression level of OsNRT1.1B in rice grains increased as more N was gradually applied, while the impact of K application rate on OsNRT1.1B expression was limited (Figure 5A). These findings provided evidence that NRT1.1B expression was substantially induced by nitrate and was directly involved in nitrate uptake and nitrate transport (Hu et al., 2015). Ammonium uptake from the soil solution is mediated by ammonium transporters, such as the OsAMT2;1 gene, which encodes a functional ammonium transporter and is a key gene in ammonium ion absorption pathway. It has been reported that the expression level of OsAMT2;1 in rice cultivars with different N use efficiency varied under different N application rates. High N use efficiency rice cultivar showed higher gene expression levels in leaves under low N application levels (Yang, 2021). However, no obviously changes were observed in OsAMT2;1 expression level in rice grains under different N and K application rates, except for N3K0, which requires further study (Figure 5B). Nitrate reductase (NR) is an important enzyme in plant N metabolism, playing a key role in N absorption and utilization. Bioinformatic analysis revealed two members of NR gene family in rice genome, NR1 and NR2, with over 70% similarity between their protein sequences (Zhao, 2010). During the grain filling process, NR activity in leaves first increased and then decreased. The activity of NR increased with increasing N levels (Lan, 2022). Consistent with this trend, the present study found that the expression level of OsNR2 in rice grains increased with increasing N levels, and could be further enhanced by applying appropriate K application at high N levels (Figure 5C).
K plays irreplaceable roles in plant growth and development. The KUP/HAK/KT family, with the largest family members and diverse functions, is involved in nutrient metabolism, growth regulation and stress tolerance (Chai et al., 2019). Studies suggest that OsHAK1, OsHAK5, and OsAKT1 are crucial for K+ uptake at both low and high concentrations, as well as for K+ translocation from root to shoot. OsHAK1 and OsAKT1 exhibit high expression levels in all cell types of roots and low levels in shoots (Manuel et al., 2016). Additionally, the transcription levels of HAK genes are regulated by the level of K nutrition. Overexpressing HAK1 or HAK5 in rice and maize increased K+ uptake, thereby increasing grain yield (Qin et al., 2019). In our studies, higher expression levels of OsHAK1, OsHAK5, and OsAKT1 in rice grains were observed under N3K2 or N3K3, which were consistent with the above results of K uptake, indicating that a high N application level combined with a high K application level was beneficial to K absorption in rice (Figures 5D–F).
Different N application patterns need to be combined with appropriate application of K to achieve optimal yields. Excessive application of either N or K not only results in fertilizer waste and environment pollution but also decrease fertilizer use efficiency (Wang et al., 2010b). Our results were corroborated with previous studies indicating that rice yield exhibited an incremental trend with increasing N application. However, beyond a certain threshold of N application, the yield increase became statistically insignificant (Hu et al., 2012). Over a two-year field experiment, our results demonstrated that co-application of N and K yielded a higher rice output compared to sole application of either N or K. These results indicated that appropriate combined application of N (180 kg ha-1) and K (135 kg ha-1) could not only improve GY but also reduced the fertilizer input. However, an increase in K application did not exhibit a pronounced effect on the improvement of yield at the same N level. Correlation analysis showed that GY was significantly positively correlated with PN and SP (Figure 7), indicating that the increase of PN and SP might be the primary factors contributing to the increased GY from N and K application (Yang and Zhang, 2011). Furthermore, the positive impact of K application on rice yield components might be attributed to its promotion of root development, subsequently enhancing nutrient uptake by plants. Despite N application leading to a decrease in seed setting rate (SR), K application had a counteractive effect, compensating for the overall grain yield formation. The decrease in SR might be attributed to the substantial enhancement of PN and SP induced by N application, expanding the capacity of “sink” rapidly. Nevertheless, the grain filling process could not be carried out or complete timely due to the limited supply of “source”, which in turn led to the decrease in SR (Sun et al., 2012).
It is widely reported that reasonable application of N can reduce CR and CD of rice, thus improving the appearance quality of rice (Zhang, 2017). And the appropriate application of K under conditions that meet the N requirements for rice growth can effectively increase HR and reduce CR and CD, thereby enhancing both the milling quality and appearance quality of rice (Zhang et al., 2018). Besides, the contribution rate affecting rice quality tended to be in the order of N > K > P, with the interactive effect of N and K surpassing that of N and P (Xie et al., 2014). In the present study, milling quality of YXY 2115 decreased with increasing N levels. As more K was gradually applied at the same N level, both MR and HR first increased and then decreased. The above results indicated that N and K mutually promoted each other, and their combined application was beneficial for improving the milling quality of rice. The appearance quality of YXY 2115 increased with increasing N levels. However, as more K was gradually applied at the same N level, obvious increases in CR and CD were found. This result was not consistent with the previous studies (Wang, 2015). The possible reason for this difference could be the relatively high content of available K in the experimental field soil, causing a decrease in the appearance quality of rice when additional K was applied. In general, higher fertilizer application tends to result in increased rice yield, but may reduce rice eating quality. Parts of rice quality indexes can be significantly enhanced within a certain level of K application (Ye, 2021). Co-application of N and K can increase protein content of rice, thereby improve rice nutritional quality. However, the lack of K will lead to a decline in both the eating quality and nutritional value of rice (Zhang, 2017). In our study, the cooking and eating quality of YXY 2115 decreased with increasing N levels. As more K was gradually applied at the same N level, the taste value, appearance and mouthfeel all first increased and then decreased, in agreement with the previous studies (Zhang and Qian, 2017). It is widely recognized that rice cultivars with high eating quality normally show higher peak viscosity and breakdown viscosity, coupled with lower setback viscosity, as determined by the RVA. Variance analysis showed that co-application of N and K had significant interactive effects on PV, BV and SV. However, no significant differences or prominent impacts were found in the response of RVA profile characters to co-application of N and K over a two-year field experiment, indicating that the combined application of N and K had limited effects on rice starch viscosity (Zhang, 2017). Taken together, in order to improve the appearance, milling, and cooking and eating quality of rice, a reasonable nitrogen-potassium ratio becomes particularly important. The optimal milling, cooking and eating quality were obtained under N1K2, while the best appearance quality was obtained under N3K0.
Reasonable combined application of N and K can mitigate fertilizer waste, reduce environmental pollution, lower production costs and increase economic benefits by improving fertilizer use efficiency, rice yield and quality, thereby achieving the sustainable development of agriculture. The present study investigated the effects of co-application of N and K on rice yield, quality and nutrients absorption and utilization through a two-year field experiment. The results revealed the feasibility of enhancing rice production efficiency and yield through co-application of N and K, which might provide an important reference for the large-scale promotion and application of Yixiangyou 2115. The highest rice yield was obtained under N2K2, while the optimal rice quality was obtained under N1K2. Thus, we recommended appropriate N application levels ranging from 206 kg ha-1 to 210 kg ha-1, combined with K application levels ranging from 115 kg ha-1 to 137 kg ha-1 as a preferable approach to achieve high yield for super hybrid indica rice cultivar Yixiangyou 2115 in southwest China. A combination of 135 kg ha-1 N and 135 kg ha-1 K application rates was recommended for achieving better quality in rice production.
The original contributions presented in the study are included in the article/Supplementary Material. Further inquiries can be directed to the corresponding authors.
GC: Writing – original draft, Writing – review & editing. QD: Writing – review & editing, Writing – original draft. CW: Conceptualization, Writing – review & editing. XH: Investigation, Writing – review & editing. MH: Investigation, Writing – review & editing. CL: Data curation, Writing – review & editing. YO: Methodology, Writing – review & editing. LP: Formal analysis, Writing – review & editing. HY: Software, Writing – review & editing. QZ: Software, Writing – review & editing. QJ: Resources, Writing – review & editing. YL: Supervision, Validation, Writing – review & editing. TL: Funding acquisition, Project administration, Writing – review & editing.
The author(s) declare financial support was received for the research, authorship, and/or publication of this article. This work was supported by funds from the Sichuan Science and Technology Program, China (2021YFYZ0020 and 2022YFH0029).
We would like to thank our teacher for carefully reading and correcting our manuscript and providing technical assistance and financial support for the study, as well as our scientific research team for their contribution to this paper.
The authors declare that the research was conducted in the absence of any commercial or financial relationships that could be construed as a potential conflict of interest.
All claims expressed in this article are solely those of the authors and do not necessarily represent those of their affiliated organizations, or those of the publisher, the editors and the reviewers. Any product that may be evaluated in this article, or claim that may be made by its manufacturer, is not guaranteed or endorsed by the publisher.
The Supplementary Material for this article can be found online at: https://www.frontiersin.org/articles/10.3389/fpls.2024.1335744/full#supplementary-material
Supplementary Table 1 | Variance analysis of dry matter accumulation under different combined application of N and K.
Supplementary Table 2 | Variance analysis of nutrients uptake under different combined application of N and K.
Supplementary Table 3 | Effects of combined application of N and K on RVA profile characters of YXY 2115.
Supplementary Table 4 | Effects of combined application of N and K on eating and cooking quality of YXY 2115.
Supplementary Table 5 | Gene primers used for PCR amplification.
Abolfazl, B. A., Seyed, A. M. M. S., Masood, M. A. B., Ali, M. B. (2017). Towards improving the agronomic performance, chlorophyll fluorescence parameters and pigments in fenugreek using zeolite and vermicompost under deficit water stress. Ind. Crop Prod. 109, 346–357. doi: 10.1016/j.indcrop.2017.08.049
Ahanger, M. A., Agarwal, R. M., Tomar, N. S., Shrivastava, M. (2015). Potassium induces positive changes in nitrogen metabolism and antioxidant system of oat (Avena Sativa L. cultivar Kent). J. Plant Interact. 10, 1–33. doi: 10.1080/17429145.2015.1056260
Ali, M. B., Majid, A., Mehdi, N. M., Eskandar, Z., Jose, L. G. A., Arman., A. (2013). Agronomic performance, seed quality and nitrogen uptake of Descurainia Sophia in response to different nitrogen rates and water regimes. Ind. Crop Prod. 44, 583–592. doi: 10.1016/j.indcrop.2012.09.018
Chai, W. W., Wang, W. Y., Cui, Y. N., Wang, S. M. (2019). Research progress of function on KUP/HAK/KT family in plants. Plant Physiol. J. 55, 1747–1761. doi: 10.13592/j.cnki.ppj.2019.0133
Cheng, C., Zeng, Y. J., Wang, Q., Tan, X. M., Shang, Q. Y., Zeng, Y. H., et al. (2018). Effects of nitrogen application rates on japonica rice yield, quality, and nitrogen uptake and utilization during the late-rice cropping seasons in Southern China. J. Soil Water Conserv. 32, 222–228. doi: 10.13870/j.cnki.stbcxb.2018.05.036
Chu, C. C., Wang, Y., Wang, E. T. (2021). Improving the utilization efficiency of nitrogen, phosphorus and potassium: current situation and future perspectives. Sci. Chin. 51, 1415–1423. doi: 10.1360/SSV-2021-0163
Dong, Z. Z., Wu, L. H., Cai, J., Chen, Y. L., Zhu, Y. Z. (2015). Effects of different nitrogen, phosphorus and potassium treatments on rice yield, quality, nutrient absorption-utilization and economic benefit of Zhongzheyou 1 in Central Zhejiang Province, China. Chin. J. Rice Sci. 29, 399–407. doi: 10.3969/j.issn.1001-7216.2015.04.009
Hou, W. F., Yan, J. Y., Jákli, B., Lu, J. W., Ren, T., Cong, R. H., et al. (2018). Synergistic effects of nitrogen and potassium on quantitative limitations to photosynthesis in rice (Oryza sativa L.). J. Agric. Food Chem. 66, 5125–5132. doi: 10.1021/acs.jafc.8b01135
Hu, B., Wang, W., Ou, S. J., Tang, J. Y., Li, H., Che, R. H., et al. (2015). Variation in NRT1.1B contributes to nitrate-use divergence between rice subspecies. Nat. Genet. 47, 834–838. doi: 10.1038/ng.3337
Hu, C. H., Xie, L. S., Fu, C. L., Zeng, J. H. (2012). The effects different fertilizer levels on super rice yield and fertilizer utilization. Chin. Agric. Sci. Bull. 28, 106–110. doi: 10.3969/j.issn.1000-6850.2012.24.020
Hu, W., Jiang, N., Yang, J. S., Meng, Y. L., Wang, Y. H., Chen, B. L., et al. (2016). Potassium (K) supply affects K accumulation and photosynthetic physiology in two cotton (Gossypium hirsutum L.) cultivars with different K sensitivities. Field Crops Res. 196, 51–63. doi: 10.1016/j.fcr.2016.06.005
Jiang, H. F., Lan, Y. C., Wang, H. Y., Xu, L. Q., Li, M., Zhao, Y., et al. (2020). Effects of nitrogen fertilizer applications on nutrient accumulation, translocation and distribution of rice in saline-alkali soil. Soil Fert. Sci. China 289, 45–55. doi: 10.11838/sfsc.1673-6257.19440
Ju, C. X., Buresh, R. J., Wang, Z. Q., Zhang, H., Liu, L. J., Yang, J. C., et al. (2015). Root and shoot traits for rice varieties with higher grain yield and higher nitrogen use efficiency at lower nitrogen rates application. Field Crops Res. 175, 47–55. doi: 10.1016/j.fcr.2015.02.007
Karthika, M., Sanjay, K. C., Shiveshwar, P. S., Rajan, K., Mahesh, N. (2023). Combined application of chemical fertilizers, organics and foliar spray of zinc and iron on yield, quality and water productivity of aerobically grown rice (Oryza sativa) in calcareous soil. J. Plant Nutr. 46, 2990–3001. doi: 10.1080/01904167.2022.2161390
Lan, Y. (2022). Effects of nitrogen and potassium fertilizers on protein components and its regulatory mechanism of low-gluten rice (Chengdu, Sichuan: Doctoral Dissertation of Sichuan Agricultural University).
Li, Y. (2011). Studies on mechanisms of the effects of different nitrogen supplies on photosynthesis and photosynthetic nitrogen use efficiency of rice plants (Nanjing, Jiangsu: Doctoral Dissertation of Nanjing Agricultural University).
Li, X. (2017). Effect of nitrogen and potassium on rice quality of Kongyu 131. Heilongjiang Agric. Sci. 1, 34–38. doi: 10.11942/j.issn1002-2767.2017.01.0034
Li, M. Y., Chen, Z. P., Shi, Q. H., Pan, X. H., Tan, X. M. (2014). Effects of different proportions of nitrogen and potassium amounts on the potassium absorption and utilization efficiency in direct-seeded rice. Acta Agric. Univ. Jiangxiensis 36, 1–7. doi: 10.3969/j.issn.1000-2286.2014.01.001
Li, P. F., Lu, J. W., Wang, Y., Wang, S., Hussain, S., Ren, T., et al. (2018). Nitrogen losses, use efficiency, and productivity of early rice under controlled-release urea. Agric. Eco. Environ. 251, 78–87. doi: 10.1016/j.agee.2017.09.020
Ludemann, C., Gruere, A., Heffer, P., Dobermann, A. (2022). Global data on fertilizer use by crop and by country. Sci. Data 9, 501. doi: 10.1038/s41597-022-01592-z
Manuel, N. C., Vicente, M., Begona, B., Francisco, R. (2016). Comparison between Arabidopsis and Rice for main pathways of K+ and Na+ uptake by roots. Front. Plant Sci. 7. doi: 10.3389/fpls.2016.00992
Qin, Y. J., Wu, W. H., Wang, Y. (2019). ZmHAK5 and ZmHAK1 function in K+ uptake and distribution in maize under low K+ conditions. J. Integr. Plant Bio. 61, 691–705. doi: 10.1111/jipb.12756
Qiu, Y., Yang, X. P., Yu, Z. M., Wu, S. B. (2016). Field experiment on fertilizer utilization rate of rice. Chin. Agric. Abs. Agric. Engin. 28, 40–41.
Sun, Z. G. (2019). Effects of nitrogen application on tiller characteristics and yield of mechanical transplanted rice in Jianghan Plain (Jingzhou, Hubei: Master’s thesis of Yangtze University).
Sun, Y. J., Ma, J., Sun, Y. Y., Xu, H., Yang, Z. Y., Liu, S. J., et al. (2012). The effects of different water and nitrogen managements on yield and nitrogen use efficiency in hybrid rice of China. Field Crops Res. 127, 85–98. doi: 10.1016/j.fcr.2011.11.015
Tang, L. Z., Shi, Q., Wang, X. Y., Chen, P. P., Zhou, W. X., Tu, N. M., et al. (2019). Nitrogen rate and planning mode affect yield and nitrogen utilization efficiency of early rice in Southern Hunan. Chin. Agric. Sci. Bull. 35, 72–81.
Wang, H. Z. (2015). Studies on accumulation of nitrogen and potassium fertilizer in rice plants and their reasonable application rates. Acta Agric. Jiangxi 27, 28–32. doi: 10.3969/j.issn.1001-8581.2015.04.008
Wang, Q. S., Ding, Y. F., Zhu, Y., Wang, S. H., Cao, W. X. (2009). Physiological response of potassium absorption and utilization of different genotypes rice to potassium application rates. J. Soil Water Conserv. 23, 190–194. doi: 10.13870/j.cnki.stbcxb.2009.04.039
Wang, W. N., Li, X. K., Lu, J. W., Li, H., Lu, M. X., Dai, Z. G. (2010b). Effects of combined application of N, P, K on nutrient uptake and distribution of rice. J. Huazhong Agric. Univ. 29, 710–714.
Wang, W. N., Lu, J. W., Chen, F., Lu, M. X., Li, H., Li, X. K. (2010a). Study on fertilization effect and fertilizer use efficiency of rice in Hubei Province. J. Plant Nutr. Fert. 16, 289–295.
Wang, Q. S., Zhen, R. H., Ding, Y. F., Ji, Z. J., Cao, W. X., Huang, P. S. (2004). Effects of potassium fertilizer application rates on plant potassium accumulation and grain quality of japonica rice. Sci. Agric. Sin. 37, 1444–1450. doi: 10.3321/j.issn:0578-1752.2004.10.007
Xie, Z. Y., Shen, J. K., Yin, M., He, Z. Z. (2014). Effects of different fertilizer application rates on uptake of nitrogen, phosphorus and potassium of hybrid rice. Chin. J. Trop. Agric. 9, 1–5. doi: 10.3969/j.issn.1009-2196.2014.09.001
Xu, X. P., Xie, J. G., Hou, Y. P., He, P., Pampolino, M. F., Zhao, S. C., et al. (2015). Estimating nutrient uptake requirements for rice in China. Field Crops Res. 180, 37–45. doi: 10.1016/j.fcr.2015.05.008
Yan, K. (2018). Effects of nitrogen application and planting density on yield formation and quality of rice in coastal saline alkali land (Yangzhou, Jiangsu: Master’s thesis of Yangzhou University).
Yang, G. T. (2021). Effect of nitrogen and phosphorus coupling on yield, nitrogen metabolism, quality and environment of rice with different nitrogen efficiency (Chengdu, Sichuan: Doctoral Dissertation of Sichuan Agricultural University).
Yang, J. C., Zhang, J. H. (2011). Crop management techniques to enhance harvest index in rice. J. Exp. Bot. 61, 3177–3189. doi: 10.1093/jxb/erq112
Ye, T. H. (2021). Effects of potassium application rate on grain yield, potassium absorption and utilization, and quality of rice (Wuhan, Hubei: Master’s thesis of Huazhong Agricultural University).
Zhang, Z. D. (2017). Effects of nitrogen and potassium on rice yield and quality of Longgeng 31 (Daqin, Heilongjiang: Master’s thesis of Heilongjiang Bayi Agricultural University).
Zhang, Z. L., Liu, F., Hou, T. Y. (2019). Current status of nitrogen and phosphorus losses and related factors in Chinese paddy fields: A review. Chin. J. Appl. Ecol. 30, 3292–3302. doi: 10.13287/j.1001-9332.201910.029
Zhang, G. L., Liu, Y. T., Zhao, R., Xiong, Y. D., Tang, W. B. (2018). Effects of different amount of potassium fertilization on grain yield and quality of late hybrid rice. Hybrid Rice. 33, 51–55. doi: 10.16267/j.cnki.1005-3956.20180201.048
Zhang, Z. D., Qian, Y. D. (2017). Effects of nitrogen and potassium on rice nutrition and eating quality of Longgeng 31. South China Agric. 11, 16–17. doi: 10.19415/j.cnki.1673-890x.2017.08.02
Zhang, Z., Wang, W. N., Li, K., Ma, H. J., Gou, X., Lu, J. W., et al. (2015). Effects of nitrogen fertilization on rice in different regions of Sichuan Province. Acta Pedol. Sin. 52, 234–241. doi: 10.11766/trxb201311060519
Zhao, L. H. (2010). Cloning and functional study of two nitrate reductase genes in rice (Lanzhou, Gansu: Master’s thesis of Lanzhou University).
Zhou, W. W., Jia, H. R., Zhang, Y., Li, W., Li, B. T., Tang, L. M. (2020). Effects of different new types of fertilizer on yield, nitrogen use efficiency and economic benefit of double cropping rice. J. Plant Nutr. Fert. 26, 657–668. doi: 10.11674/zwyf.19269
Keywords: rice, combined application of nitrogen and potassium, nutrient absorption-utilization, yield, quality
Citation: Chen G, Duan Q, Wu C, He X, Hu M, Li C, Ouyang Y, Peng L, Yang H, Zhang Q, Jiang Q, Lan Y and Li T (2024) Optimizing rice yield, quality and nutrient use efficiency through combined application of nitrogen and potassium. Front. Plant Sci. 15:1335744. doi: 10.3389/fpls.2024.1335744
Received: 09 November 2023; Accepted: 27 February 2024;
Published: 11 March 2024.
Edited by:
Gaetano Pandino, University of Catania, ItalyReviewed by:
Zhaowen Mo, South China Agricultural University, ChinaCopyright © 2024 Chen, Duan, Wu, He, Hu, Li, Ouyang, Peng, Yang, Zhang, Jiang, Lan and Li. This is an open-access article distributed under the terms of the Creative Commons Attribution License (CC BY). The use, distribution or reproduction in other forums is permitted, provided the original author(s) and the copyright owner(s) are credited and that the original publication in this journal is cited, in accordance with accepted academic practice. No use, distribution or reproduction is permitted which does not comply with these terms.
*Correspondence: Yan Lan, bGFueWFuQHN0dS5zaWNhdS5lZHUuY24=; Tian Li, bGl0QHNpY2F1LmVkdS5jbg==
†These authors have contributed equally to this work and share first authorship
Disclaimer: All claims expressed in this article are solely those of the authors and do not necessarily represent those of their affiliated organizations, or those of the publisher, the editors and the reviewers. Any product that may be evaluated in this article or claim that may be made by its manufacturer is not guaranteed or endorsed by the publisher.
Research integrity at Frontiers
Learn more about the work of our research integrity team to safeguard the quality of each article we publish.