- 1School of Pharmacy, Baotou Medical College, Baotou, Inner Mongolia, China
- 2School of Ecology and Nature Conservation, Beijing Forestry University, Beijing, China
- 3State Key Laboratory of Systematic and Evolutionary Botany, Institute of Botany, Chinese Academy of Sciences, Beijing, China
- 4Germplasm Bank of Wild Species, Kunming Institute of Botany, Chinese Academy of Sciences, Kunming, Yunnan, China
Trollius, a genus in the Ranunculaceae family, has significant medicinal and ornamental value. It is widely distributed in China with 16 different species accepted. However, due to the lack of enough samples and information sites, the molecular phylogenetic relationships of Trollius have been unresolved till now. Here we sequenced, assembled and annotated the plastomes of 16 Trollius species to investigate their genomic characteristics, inverted repeat (IR) boundaries, sequence repeats, and hypervariable loci. In addition, the phylogenetic relationships of this genus was reconstructed based on the whole plastomes and the protein-coding sequences data-sets. The plastomes of Trollius ranged between 159,597 bp and 160,202 bp in length, and contained 113 unique genes, including 79 protein coding, 30 tRNA, and 4 rRNA. The IR boundaries were relatively conserved within the genus Trollius. 959 simple sequence repeats and 657 long sequence repeats were detected in the Trollius plastomes. We identified 12 highly polymorphic loci (Pi > 0.0115) that can be used as plastid markers in molecular identification and phylogenetic investigation of the genus. Besides, Trollius was a monophyletic group with the earliest divergence clade being Trollius lilacinus Bunge, and the remaining species were divided into two strongly-supported clades. The phylogeny in our study supported the traditional classification systems based on the color of sepal, but not the previous classification system based on the types and relative lengths of the nectaries, and distribution. The genomic resources provided in our study can be used in the taxonomy of the genus Trollius, promoting the development and utilization of this genus.
1 Introduction
Trollius L. are perennial herbs of the Ranunculaceae family, with more than 30 identified species distributed mainly in the temperate and cold temperate zones of the Northern Hemisphere (Doroszewska, 1974). East Asia is considered the center of distribution for this genus (Heo and Suh, 2008; Kadota, 2016), with 16 species found in alpine mountains of northeast, north, northwest, and southwest China (Ding et al., 2003), eight of which are endemic. The species Trollius chinensis Bunge, T. macropetalus Fr., T. ledebourii Reichenbach, and others in the genus have high medicinal value in traditional Chinese and Mongolian medicine (Yu, 2016). They were reported as effective remedies for oral issues, throat swelling, earache, and eye brightening in ancient China (He et al., 2023). In modern pharmacological investigations, chemical components found in Trollius are mostly anti-inflammatory, anti-viral, antioxidant, anti-tumor, and hypoglycemic (Witkowska-Banaszczak, 2015; Feng et al., 2022a), which offer promising applications in pharmacology. In addition, Trollius plants are commonly used for ornamental purposes due to their aesthetic appeal in landscaping and gardening (Zhang et al., 2016).
The genus Trollius was characterized by high morphological variability and frequent natural hybridization, which posed challenges to the classification based on traditional methods such as morphology and geographic distribution (Li, 1995). Prantl (1891) grouped 16 species of Trollius distributed in China into two sections based on the color of the sepal, sect. Hegemone (light purple or light blue sepals) and sect. Trollius (yellow sepals). Of these, the sect. Hegemone contained only one species T. lilacinus, and the sect. Hegemone included the rest 15 species. This treatment was adopted in Flora Republicae Popularis Sinicae by Wang (1979). Trollius was divided into seven sections (Pumilotrollius, Acaulitrollius, Yunnanotrollius, Longipetala, Trollius, Insulaetrollius and Laxotrollius) based on the types and relative lengths of the nectaries, distribution, and some other floral characters (Doroszewska, 1974). Three pollen types within Trollius were suggested by the palynological results (Lee and Blackmore, 1992). However, most characters were proved to be homoplasious and variable within species (Pellmyr, 1992). The subsequent researchers attempted to use molecular markers to address these issues. Després et al. (2003) used multiple markers, including nuclear DNA sequences (ITS1, 5.8S and ITS2) and plastid DNA sequences (trnL intron and trnL-F) as well as AFLP, to resolve the phylogenetic relationships of Trollius; Wang et al. (2010) combined plastid DNA markers (matK and trnL-F), nuclear DNA marker (ITS) and 17 morphological characters to investigate the phylogenetic relationships of Trollius. However, due to insufficient information of those markers, the phylogenetic relationships within the genus have not been well resolved yet.
Plastomes are multifunctional organelles in terrestrial plants, algae and a few protozoa, and a place for photosynthesis, which carry out photosynthesis as well as perform functions such as the synthesis of proteins, starches, and pigments (Zheng et al., 2020). In angiosperm plants, plastomes are generally 107_218 kb in size, encoding about 110_130 genes in a closed-loop tetrameric structure: two inverted repeats (IRa and IRb), one large single-copy (LSC) region and one small single-copy (SSC) region (Kolodner and Tewari, 1979; Asaf et al., 2017). Compared with the nuclear genome, the plastomes are inherited from one parent (maternal inheritance in most angiosperms) and have evolved more slowly. Taken together, the plastomic sequence has obvious advantages such as conserved composition and structure, relatively small genome for easy sequencing, uniparental inheritance, and moderate base variation rate. With the rapid development of high-throughput technology, plastomic data was widely used as a potentially useful tool in studies of population genetics, phylogeography, phylogeny, and species identification (Daniell et al., 2016; Xiong et al., 2021; Yang et al., 2023). A series of studies have shown that the plastomic data is effective in addressing the phylogenetic relationships among Ranunculaceae members at different taxonomic levels (Kong et al., 2017; Liu et al., 2018; He et al., 2019; Zhai et al., 2019; Li et al., 2020). In this study, we sequenced the plastomes from 16 species of Trollius, conducted comparative genomics and phylogenomic analyses based on these data. The main objectives of this study were: (1) to study the plastome characteristics of the genus Trollius; (2) to investigate variations of simple sequence repeats (SSRs) and long sequence repeats (LSRs) throughout the genus; (3) to screen highly variable regions from the plastomes as candidate DNA barcodes for the identification of species in the genus Trollius; (4) to construct a phylogenetic tree to elucidate the phylogenetic relationships of the genus Trollius.
2 Materials and methods
2.1 Sample collection, DNA extraction and sequencing
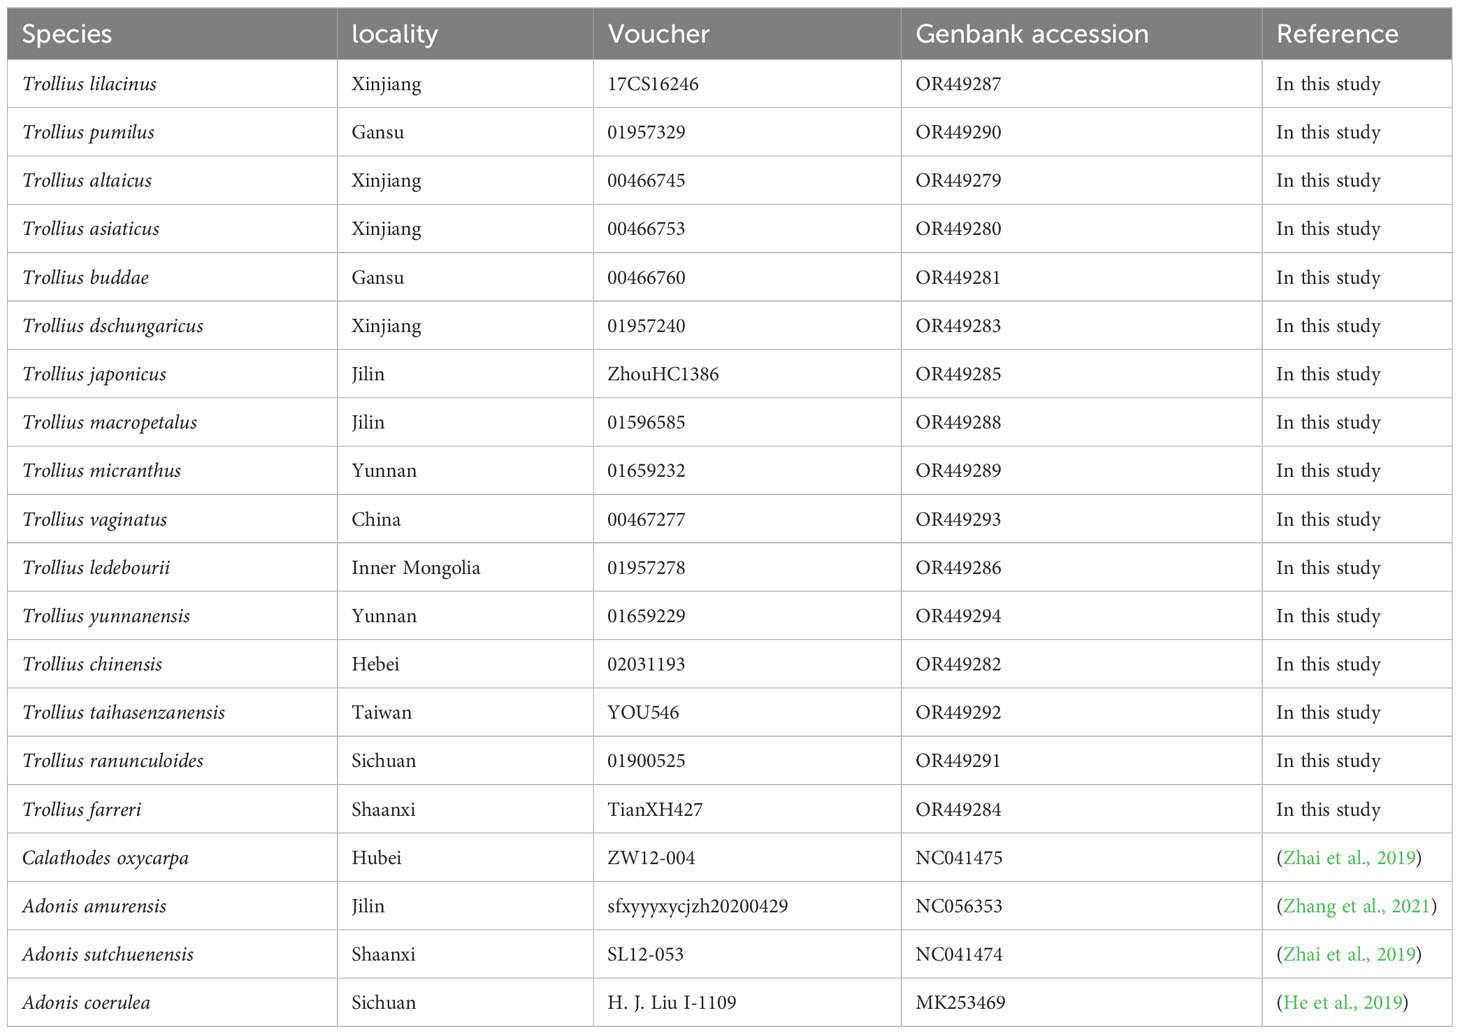
The materials of 16 Trollius species were obtained from the wild, herbarium of PE (Herbarium, Institute of Botany, CAS) and KUN (Herbarium, Kunming Institute of Botany, CAS), which covers six (Pumilotrollius, Acaulitrollius, Yunnanotrollius, Longipetala, Trollius and Insulaetrollius) of the seven sections in Doroszewska’s (1974) classification system. A list of the sources of plastome sequences was provided in Table 1. Total DNA extraction was performed using the Plant DNA Extraction Kit (TIANGEN). The quality of DNA was assessed by 1.0% agarose gel electrophoresis, and the concentration was measured using the Qubit 3.0 fluorescence quantifier (Thermo Fisher Scientific, USA). The total genomic DNA was assayed, and an insert library of approximately 350 bp in length was constructed. Paired-end sequencing with a read length of 150 bp was performed using the DNBSEQ-T7 platform. The raw reads underwent quality control using the NGS QC ToolKit (Patel and Jain, 2012) with default parameters. Adapters and low-quality reads were filtered out to obtain clean reads for further analysis.
2.2 Plastome assembly and annotation
The plastomes were assembled using the GetOrganelle v. 1.7.5 (Jin et al., 2020) and were annotated by CPGAVAS2 (Shi et al., 2019) with T. chinensis (NC_031849) as a reference. The annotation errors were manually corrected according to plastomes of congeneric species in Geneious v. 9.0.2 (Kearse et al., 2012). The assembled and annotated sequences of the whole plastomes of 16 Trollius species were submitted to the GenBank database (Table 1). Finally, the maps of annotated plastomes were drawn using the online program OGDRAW v. 1.3.1 (Greiner et al., 2019).
2.3 Comparative genomic analysis
Analysis of the boundaries of plastomes was conducted using the IRscope tool (Amiryousefi et al., 2018) to visualize the inverted repeats. The reference genome used for this analysis was the plastome of T. chinensis. Pairwise alignments were performed using the online tool mVISTA (Frazer et al., 2004) in Shuffle-LAGAN mode. Subsequently, the aligned plastome sequences were analyzed to compute the nucleotide diversity (Pi) using DnaSP v. 6.12.03 (Rozas et al., 2017). A window length of 600 bp with a step size of 200 bp was employed, and a plot was generated based on the computed data.
2.4 Sequence repeats analysis
Simple sequence repeats (SSRs) in the 16 plastome sequences of Trollius were examined using the Perl script in MISA (Beier et al., 2017). Minimum thresholds were set for different types of SSRs: mononucleotide, dinucleotide and trinucleotide SSRs required at least ten, five and four repeat units respectively, and tetra-, penta-, and hexa-nucleotide SSRs all required at least three repeat units. The detection of long sequence repeats (LSRs), including forward (F), reverse (R), palindromic (P) and complementary repeats (C), was performed using the online software REPuter (Kurtz et al., 2001). The settings were configured to identify repeat sizes greater than 30 bp with a Hamming distance of 3.
2.5 Phylogenetic analysis
Calathodes oxycarpa Sprague, Adonis amurensis Regel et Radde, A. sutchuenensis Franch., and A. coerulea Maxim. were selected as outgroups according to the phylogenetic framework provided by Zhai et al. (2019). Phylogenetic trees were inferred using the maximum parsimony (MP), maximum likelihood (ML), and Bayesian inference (BI) based on the following three data sets: (1) the whole plastome sequences, (2) the extracted sequences representing all protein-coding sequences (CDS), (3) the nuclear ribosomal DNA (nrDNA). To find more promising DNA markers, we also constructed the phylogenetic tree using maximum likelihood (ML) method based on the 11 individual matrices representing 11 highly polymorphic loci identified. Another highly polymorphic locus ycf1-ndhF was excluded because some sites in this region are ambiguously aligned. Sequence alignment was performed with MAFFT v. 7.40 (Katoh and Standley, 2013). Phylogenetic relationships reconstruction analysis was conducted using RAxML (Stamatakis, 2014) with ML, employing the GTR+G nucleotide substitution model and 1000 bootstrap replicates. MP analysis was performed using PAUP 4.0b10 (Wilgenbusch and Swofford, 2003) with a heuristic search algorithm using TBR branch exchange, with 100 repetitions. The analysis produced 50% majority-rule consensus trees and strict consensus trees, and bootstrap analysis was performed with 1000 replicates. Bayesian inference (BI) analysis was carried out using MrBayes v. 3.2 (Ronquist et al., 2012) software. The best model and parameters were determined using Modeltest v. 3.7 (Posada and Buckley, 2004). Four MCMC chains were run simultaneously for 10,000,000 generations, with tree sampling every 1000 generations. After discarding the first 25% samples as burn-in, posterior probabilities (PP) were calculated for a consensus tree. The average standard deviation of split frequencies between the two runs was 0.008, and ESS values were above 200 for all individual MCMC runs.
3 Results
3.1 Plastome features of Trollius
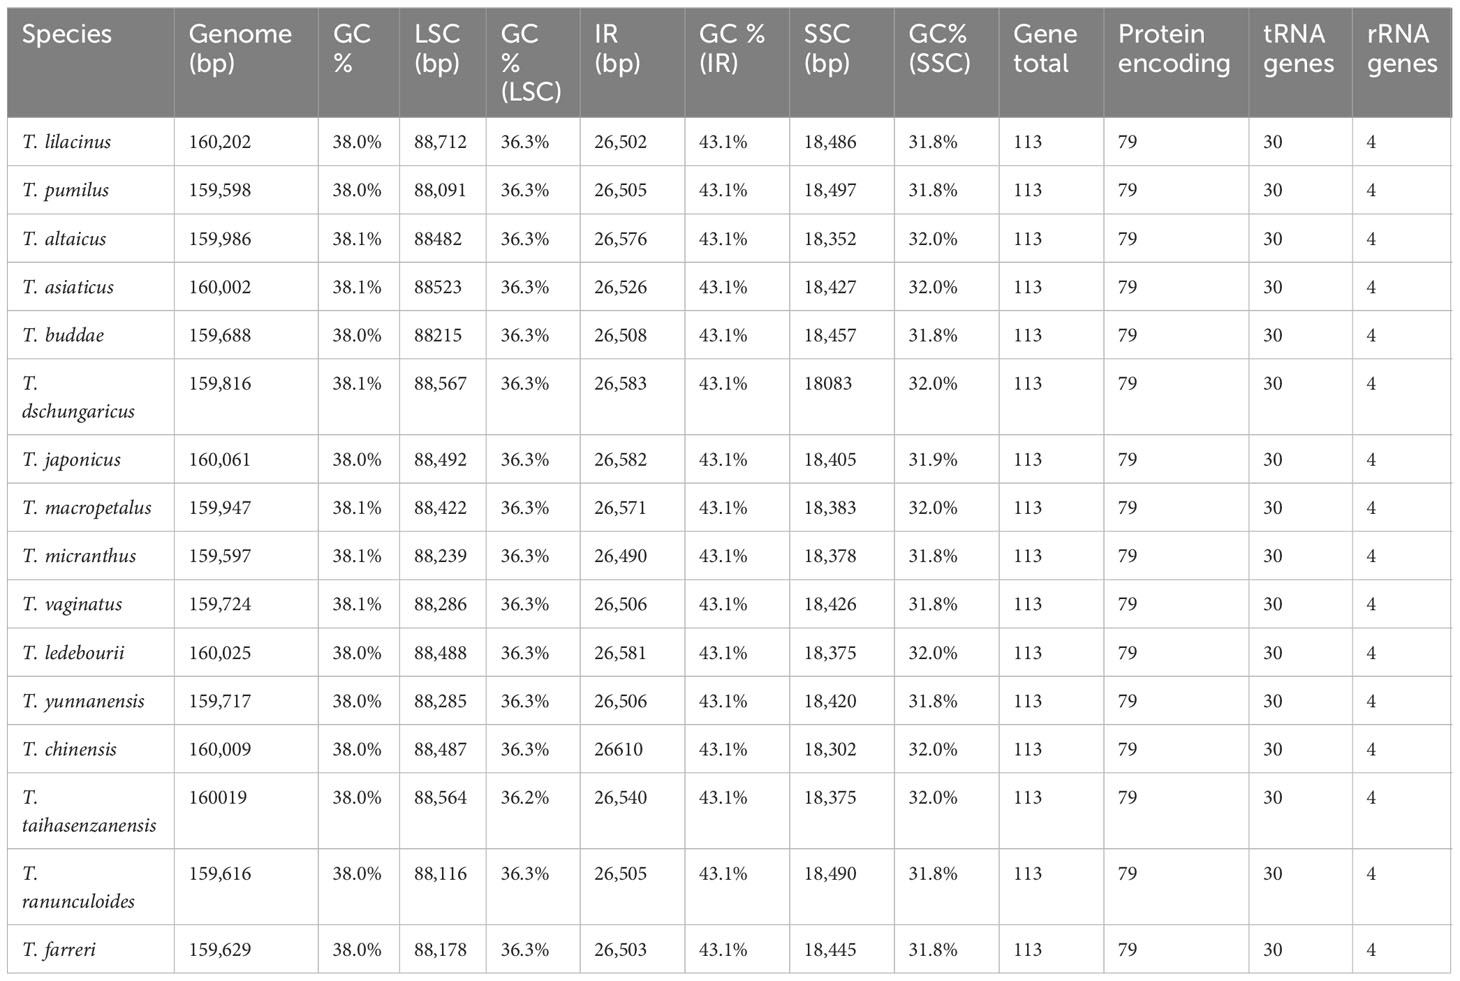
The length of the plastomes varied slightly among the 16 species that were analyzed, ranging from 159,597 bp of T. micranthus Hand.-Mazz. to 160,202 bp of T. lilacinus Bunge (Figure 1; Table 2). The 16 Trollius plastomes were all four-part in structure: a pair of inverted repeat regions (IRa and IRb) of 26,490_26,610 bp separated by one large single copy (LSC) region of 88,091_88,712 bp and one small single copy (SSC) region of 18,083_18,497 bp. The GC content in the whole plastomes of Trollius ranged from 38.0 to 38.1%, with a uniform percentage of 43.1% in IRs, 36.2-36.3% in LSC, and 31.8_32.0% in SSC. These findings indicated that the plastomes of Trollius species have nearly identical in terms of GC content. In addition, the GC content of IR regions was higher than that of LSC region and SSC region.
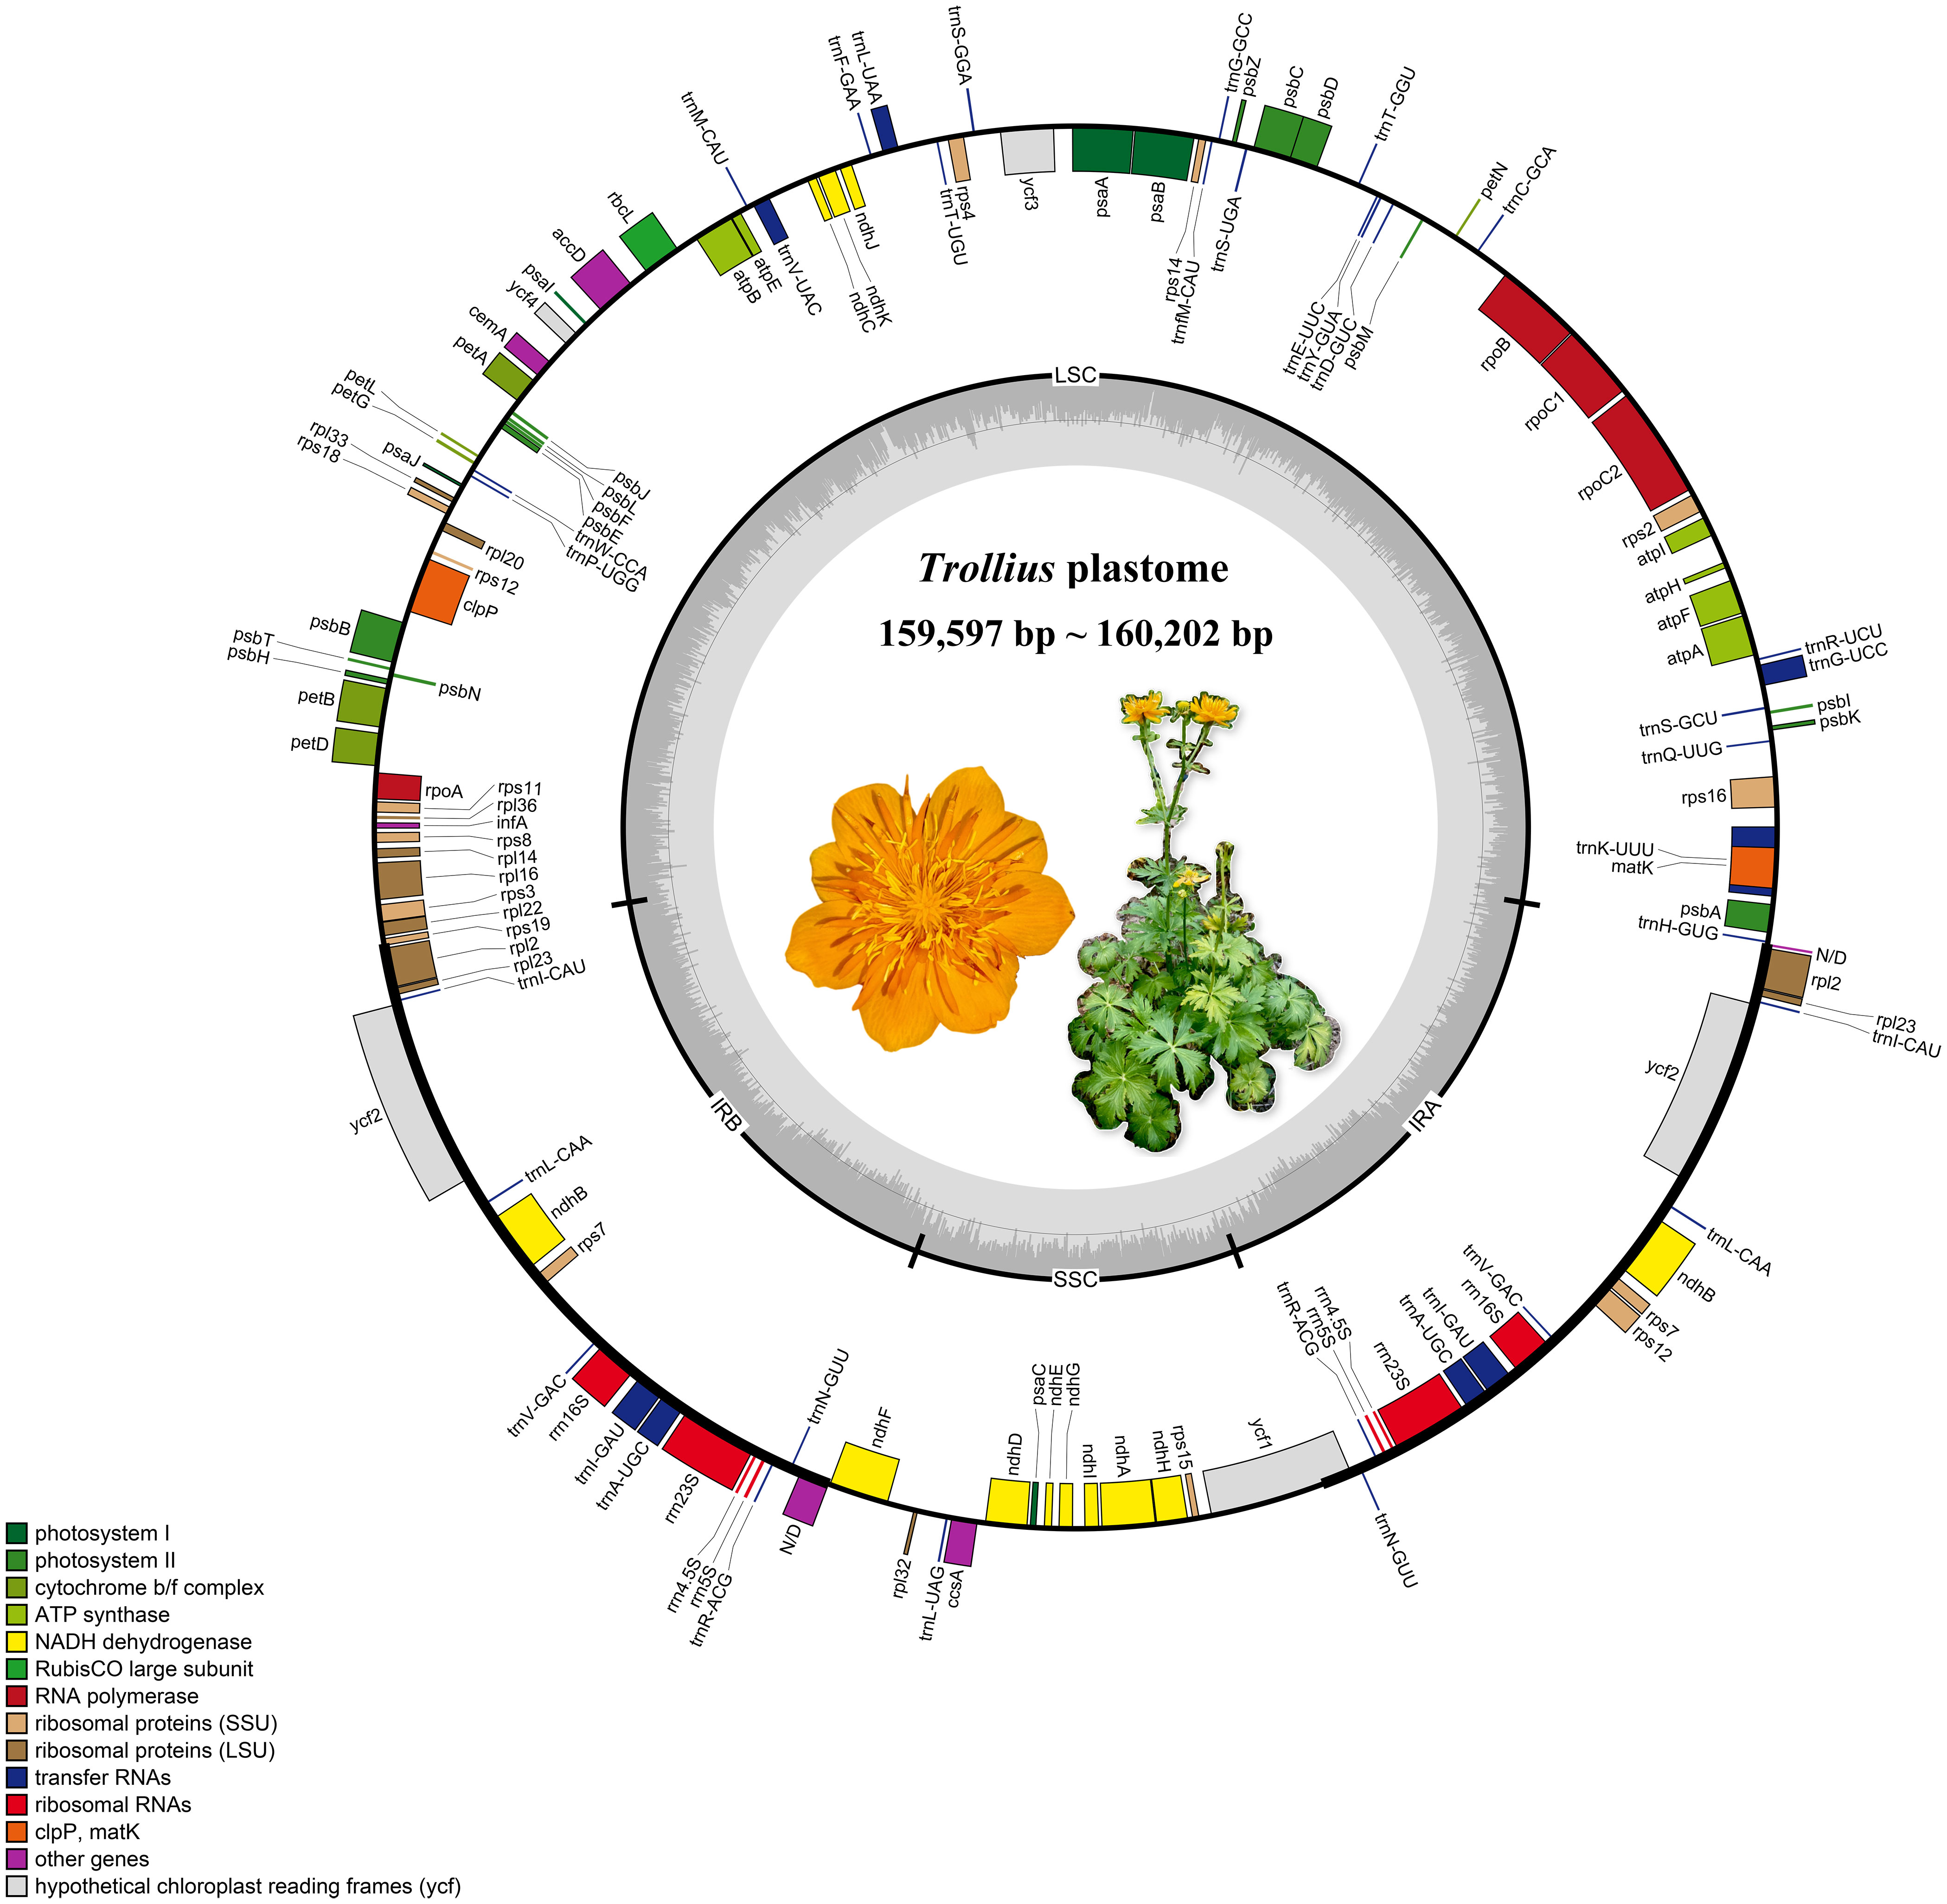
Figure 1 The plastomes gene map of Trollius. The genes transcribed clockwise and counterclockwise are on the inner and outer side the circle of the map, respectively. Gene functions labeled on the legend and the gray dashed line in the inner circle reflects the GC content. It is a color image of Trollius chinensis in the circle, a representative species of the genus.
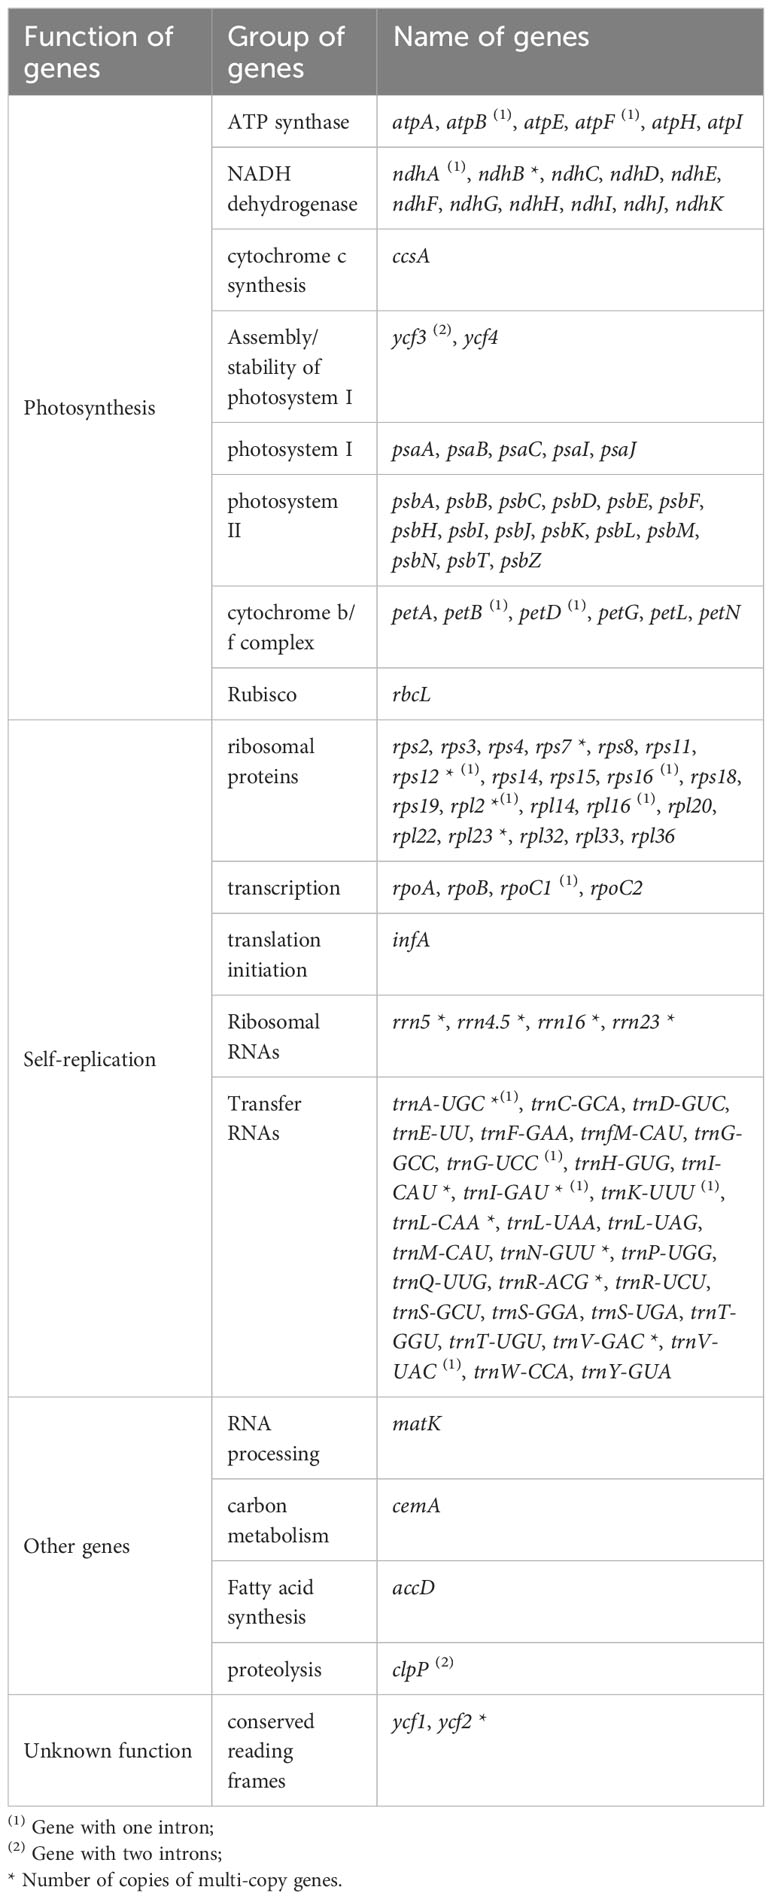
There were 113 genes in the plastomes of Trollius, including 79 protein-encoding genes, 30 transfer RNA genes and 4 ribosomal RNA genes (Tables 2, 3). The following genes have been duplicated in the IR regions: six protein-coding genes (ndhB, rpl23, rps7, rps12, ycf2 and rpl2), seven tRNA genes (trnI-CAU, trnL-CAA, trnV-GAC, trnI-GAU, trnA-UGC, trnR-ACG and trnN-GUU) and all four rRNA genes. 15 genes (atpF, ndhA, ndhB, petB, petD, rpl2, rpl16, rpoC1, rps12, rps16, trnA-UGC, trnG-UCC, trnI-GAU, trnK-UUU, trnV-UAC) contained one intron, and two genes (clpP and ycf3) contained two introns.
3.2 Inverted repeat expansion and contraction
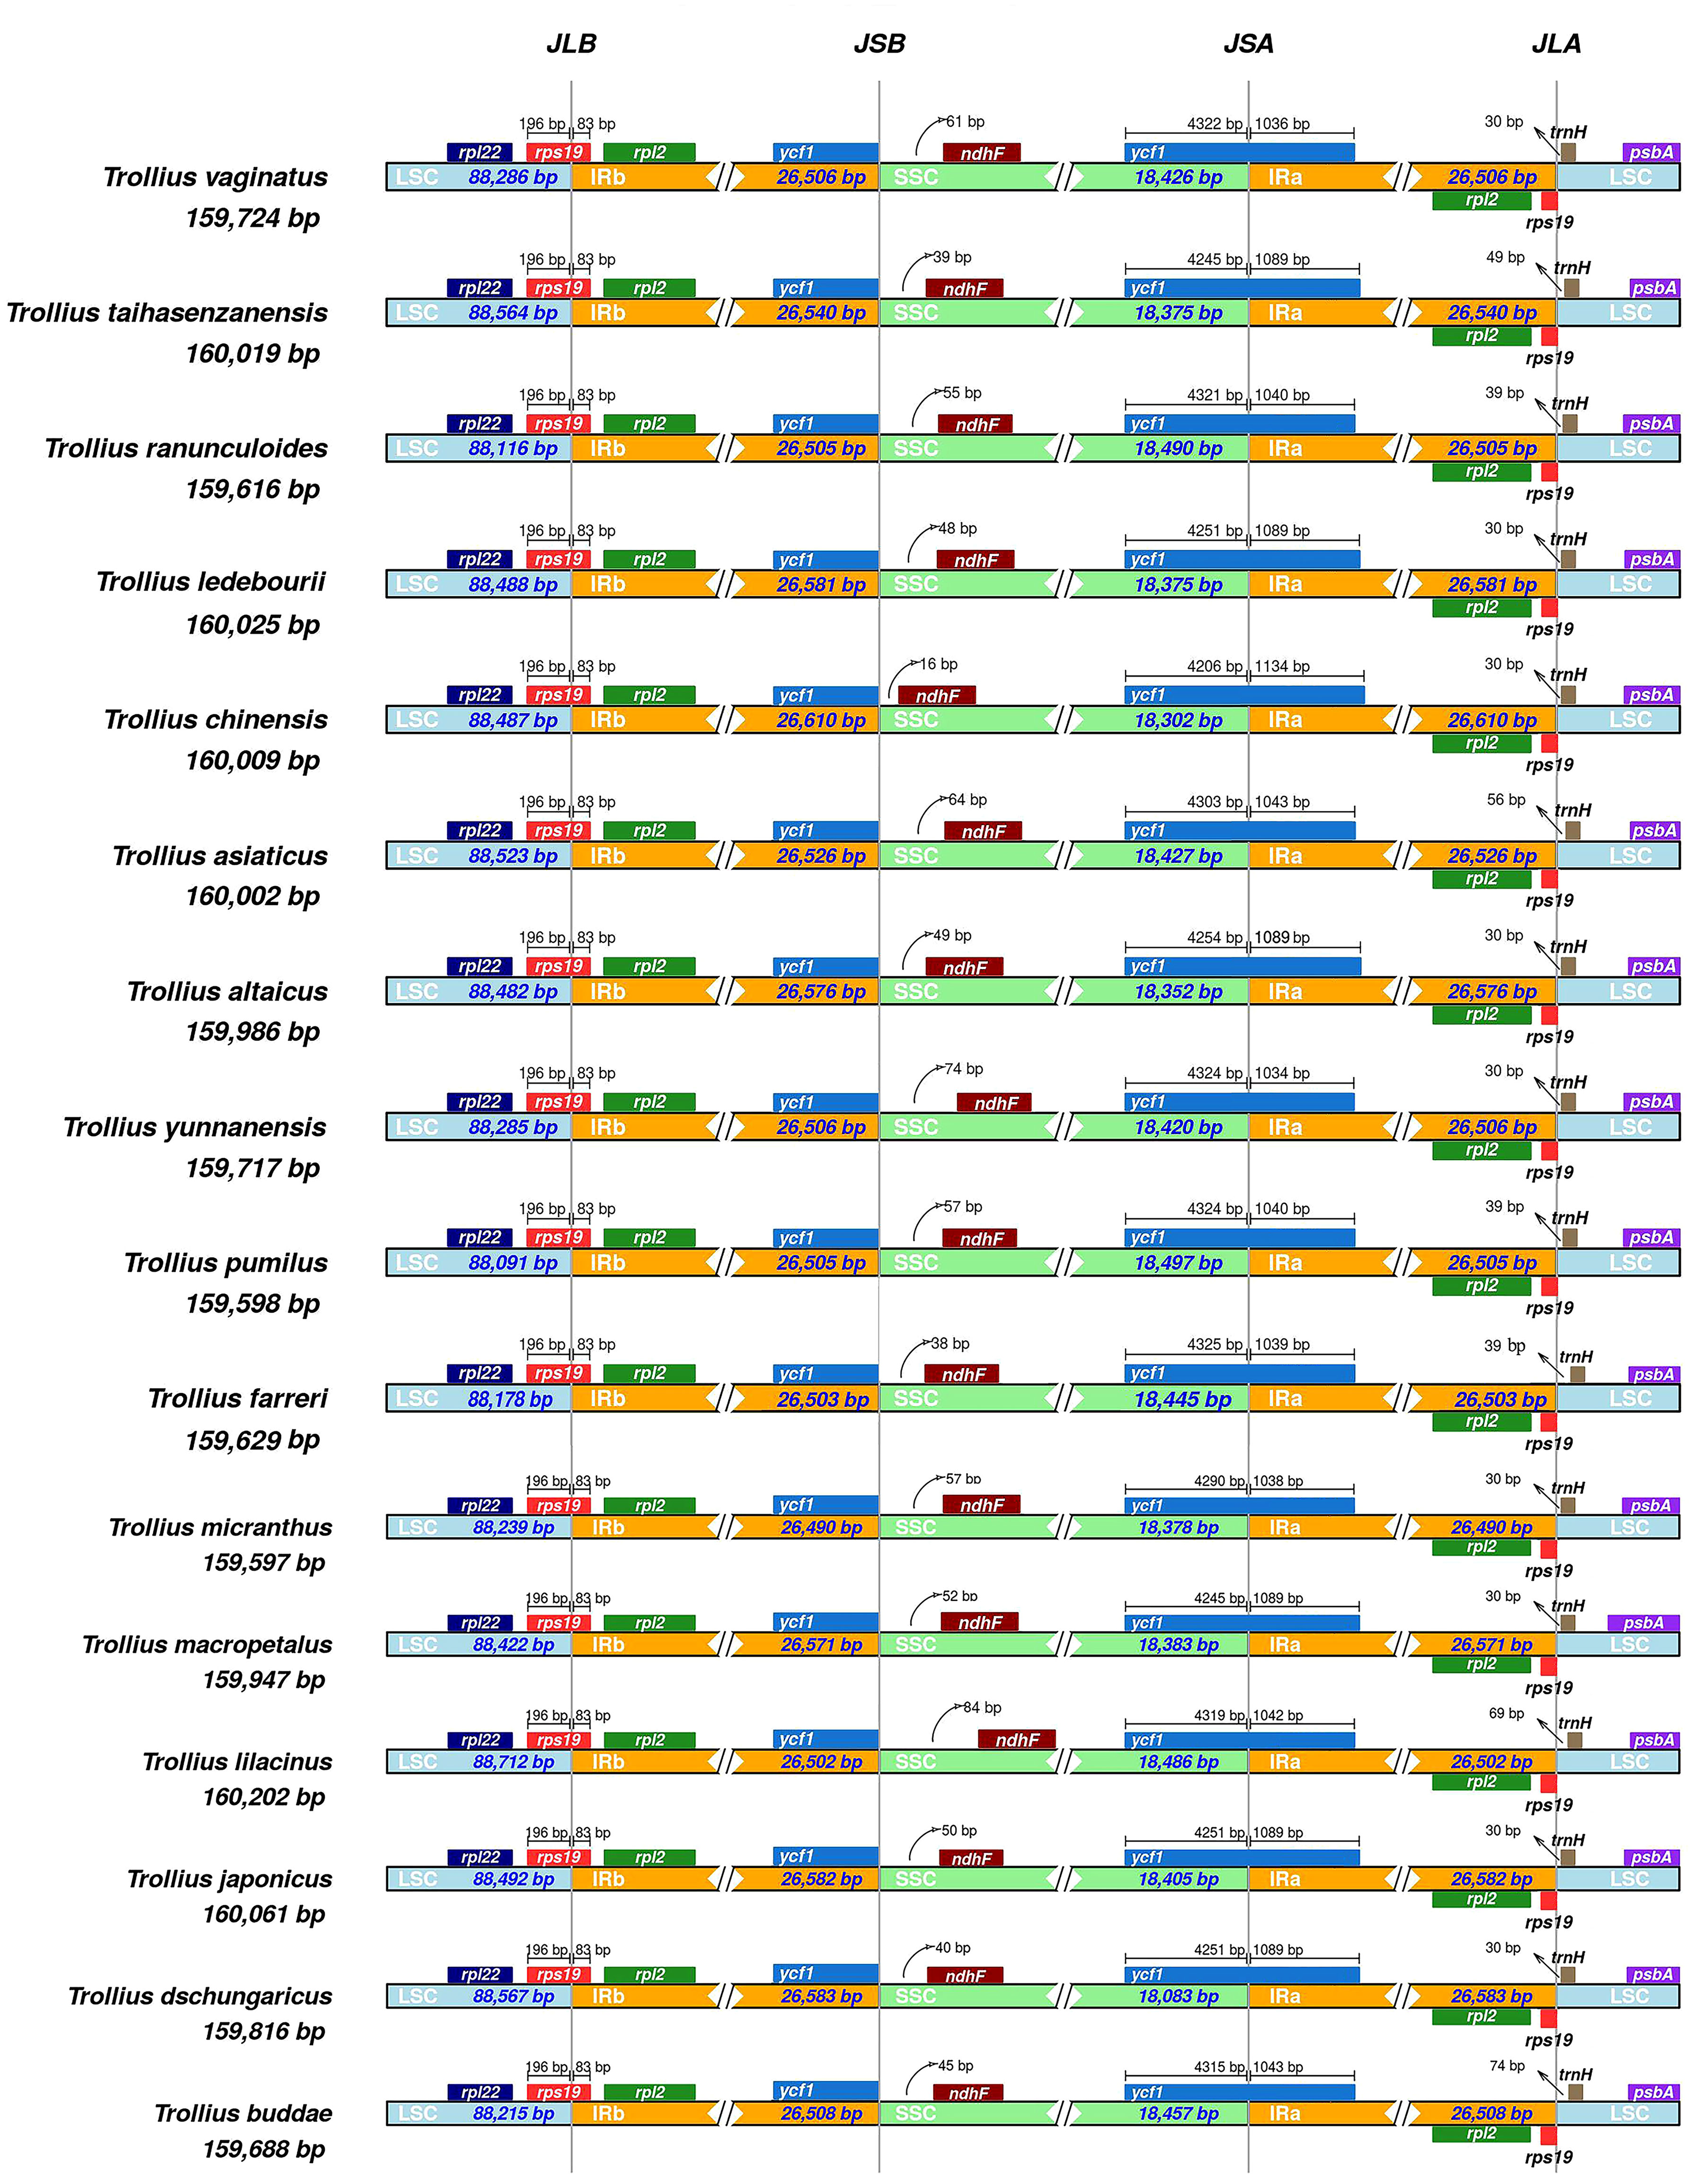
The comparative results of contraction and expansion of IR/SC boundaries within 16 species of Trollius were shown in Figure 2. We discovered that the four boundaries of the plastome were relatively conserved. The LSC/IRb (JLB) boundary was found to be located within the rps19 gene for all species, and the gene size was highly consistent with 196 bp in the LSC region and 83 bp expansion into the IRb region. The distances between the LSC/IRa (JLA) boundary and trnH were 30_74 bp, 9 species (T. altaicus C. A. Mey., T. dschungaricus Regel, T. japonicus Miq., T. macropetalus, T. micranthus, T. vaginatus Hand.-Mazz., T. ledebourii, T. yunnanensis (Franch.) Ulbr., and T. chinensis) were all located 30 bp away from the JLA boundary. At the SSC/IRa (JSA) boundary, the ycf1 gene was observed to span the SSC region into the IRa region. The gene length in the SSC region ranged from 4206 to 4325 bp with expansion of 1034_1134 bp into the IRa region. Specifically, the ycf1 genes of T. japonicus, T. dschungaricus, and T. ledebourii all showed the same characteristics at the JSA boundary with a length of 4251 bp located in the LSC region and 1089 bp in the IRa region. Trollius taihasenzanensis Masamune and T. macropetalus had the same JSA boundary with a length of 4245 bp in the SSC region and 1089 bp in the IRa region. The distance between the IRb/SSC (JSB) boundaries and ndhF varied from 16 to 84 bp. Only T. pumilus D. Don and T. micranthus were 57 bp from the JSB boundaries.
3.3 Characteristics of sequence repeats
In the SSR analysis, the number of SSRs was relatively consistent among the 16 species of the genus Trollius. Trollius taihasenzanensis and T. macropetalus exhibited the lowest number of SSRs (53), with T. vaginatus having the highest number of SSRs (67), as shown in Figure 3. The number of mononucleotide (29_40), dinucleotide (11_16), trinucleotide (2_6) and tetranucleotide (5_7) SSRs varied among the species. Additionally, pentanucleotide and hexanucleotide SSRs both were present in T. lilacinus, and pentanucleotide SSRs were detected in T. altaicus, T. japonicus, T. ledebourii, and T. chinensis. Furthermore, hexanucleotide SSRs were identified in T. macropetalus, T. vaginatus, and T. yunnanensis (Figure 3A). Generally, mononucleotides were the most abundant, exceeding half of the total (58.92%), followed by dinucleotides (24.71%) and tetranucleotides (5.84%). A/T was the predominant nucleotide composition in mononucleotide SSRs. In dinucleotide SSRs, the most frequent type was AT/TA. Additionally, the most common type of tetranucleotide SSR was TTTC (Figure 3B). The results of distribution of SSRs indicated that the LSC region (32_46) had the highest number of SSRs, followed by the SSC region (13_20), while the IR region (4_6) had the lowest number of SSRs (Figure 3C). Besides, the majority of SSRs were found in the intergenic regions (IGRs) (31_42), with fewer SSRs detected in the exon (12_17) and intron (7_14) regions. In particular, we observed that the SSRs of T. micranthus were more frequently located in the intron region than the exon region (Figure 3D).
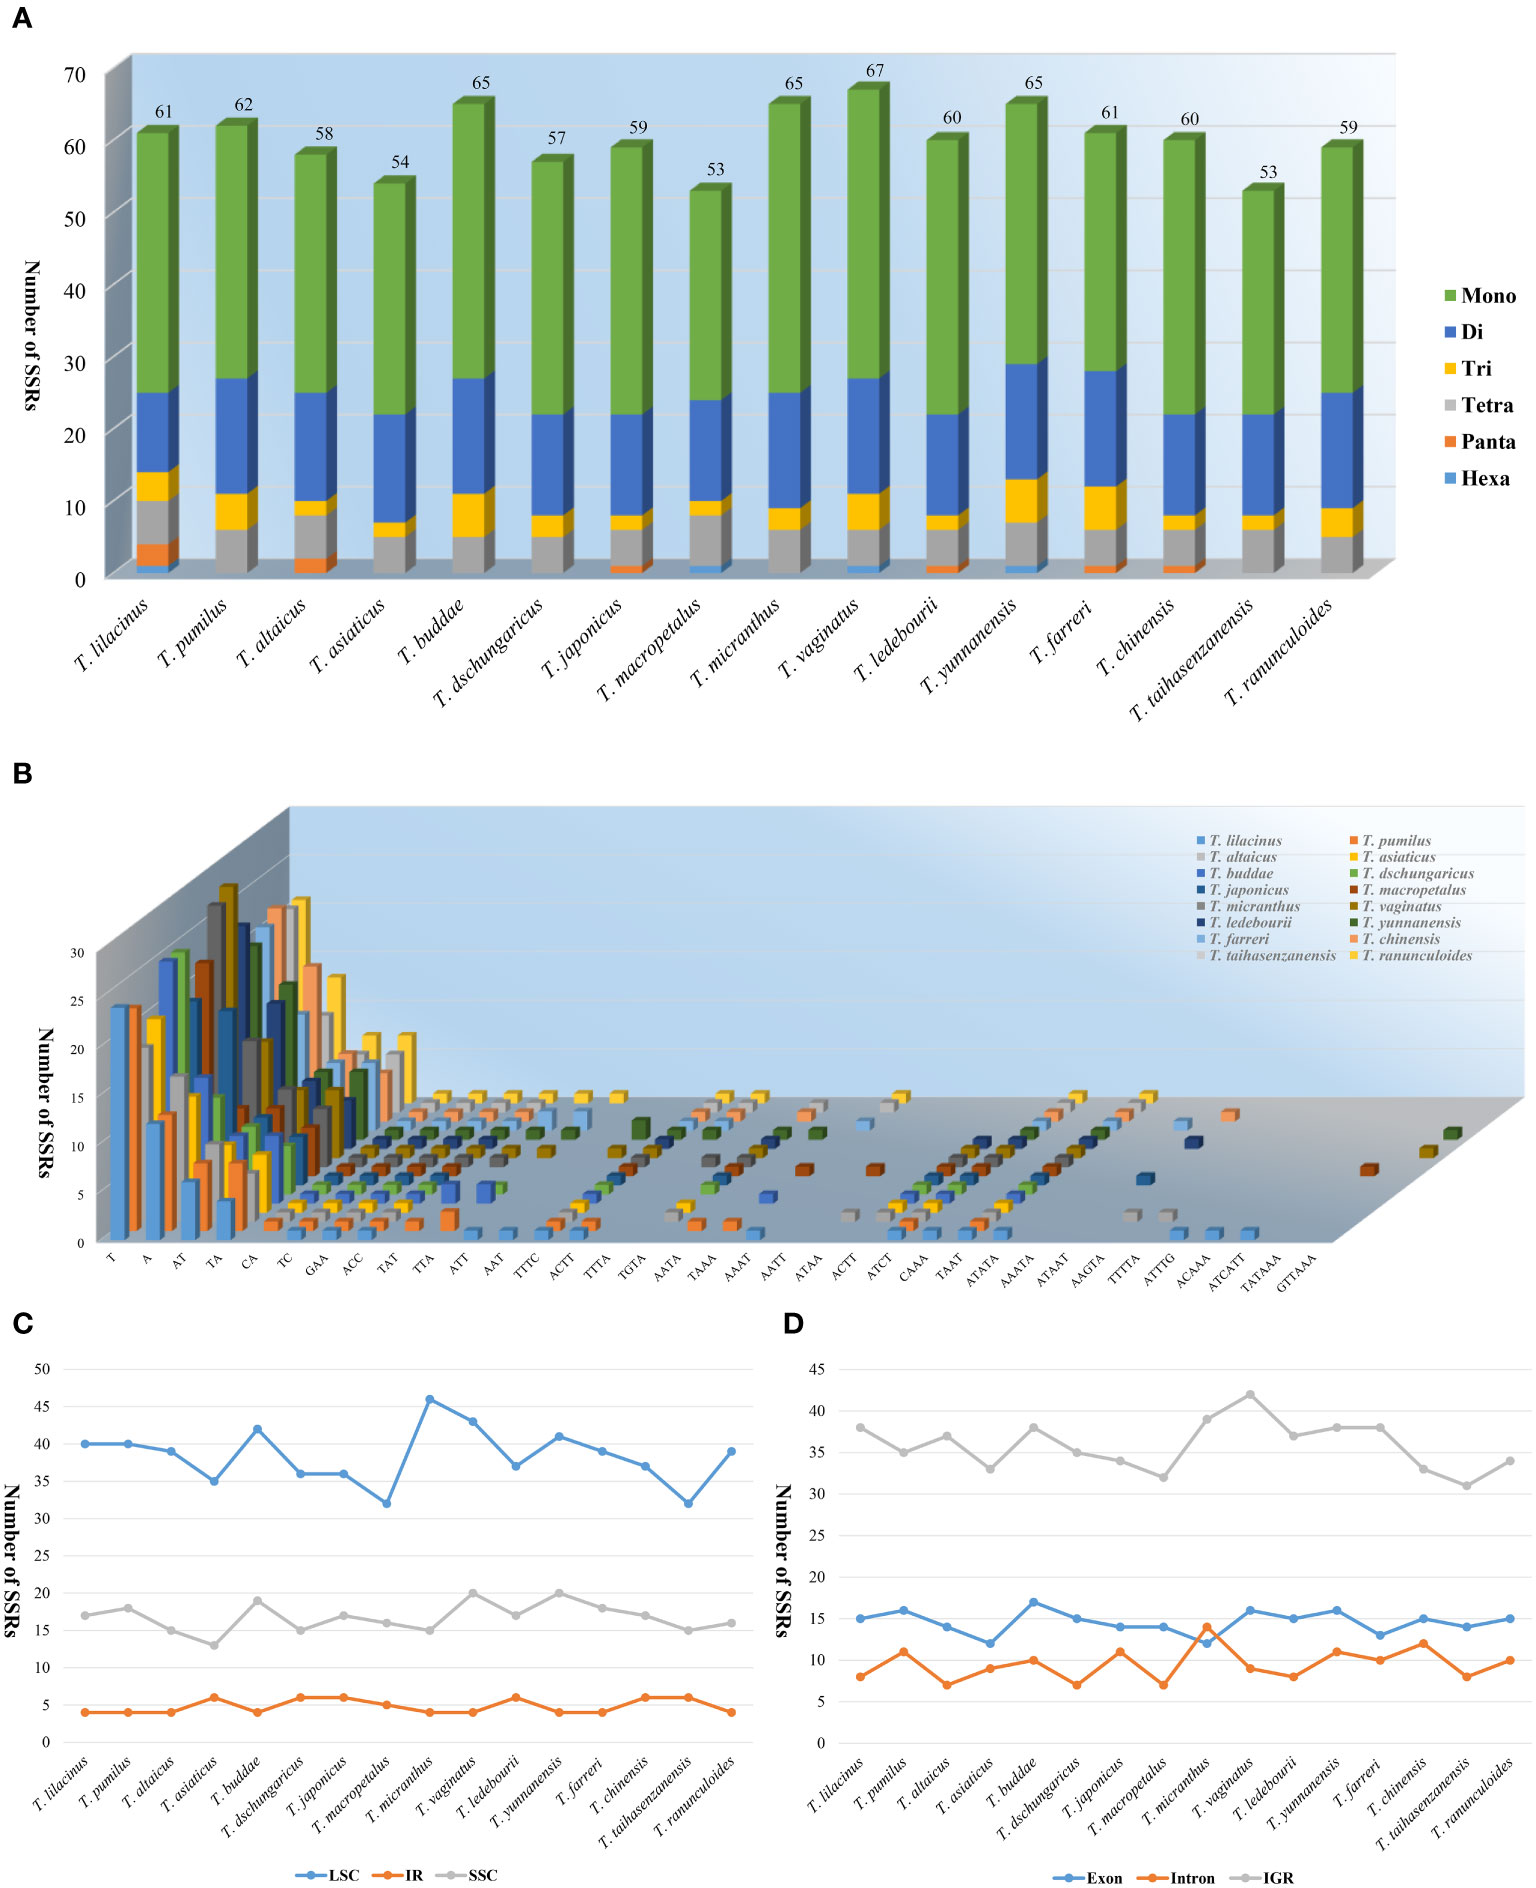
Figure 3 Comparison of the types and distribution of SSRs in the 16 Trollius plastomes. (A) Number of SSR repeat types. (B) Number of identified SSR motifs in different repeat class types. (C) Number of SSRs in the LSC, IR, SSC. (D) Number of SSRs in the intergenic regions (IGRs), exons and introns.
Totally 657 LSRs were detected in 16 Trollius species, among which T. ledebourii and T. ranunculoides Hemsl. had the highest number of 49 and T. macropetalus had the least number of 35 (Figure 4A). Palindrome and forward LSRs were observed in all 16 species examined, but reverse and complement LSRs were not present in all species. Specifically, T. macropetalus, T. micranthus, T. vaginatus, T. yunnanensis, T. chinensis and T. taihasenzanensis showed no reverse and complement LSRs (Figure 4B). Among the LSRs types, palindrome LSRs were the most abundant (17_22), followed by forward LSRs (16_21). LSRs lengths for 16 species ranged from 30_85. Length of 31 bp was the most common long sequence repeats, followed by a length of 30 bp. Remarkably, T. lilacinus lacked LSRs of 48, 49, and 67 bp lengths that were shared by the other 15 species (Figure 4C).
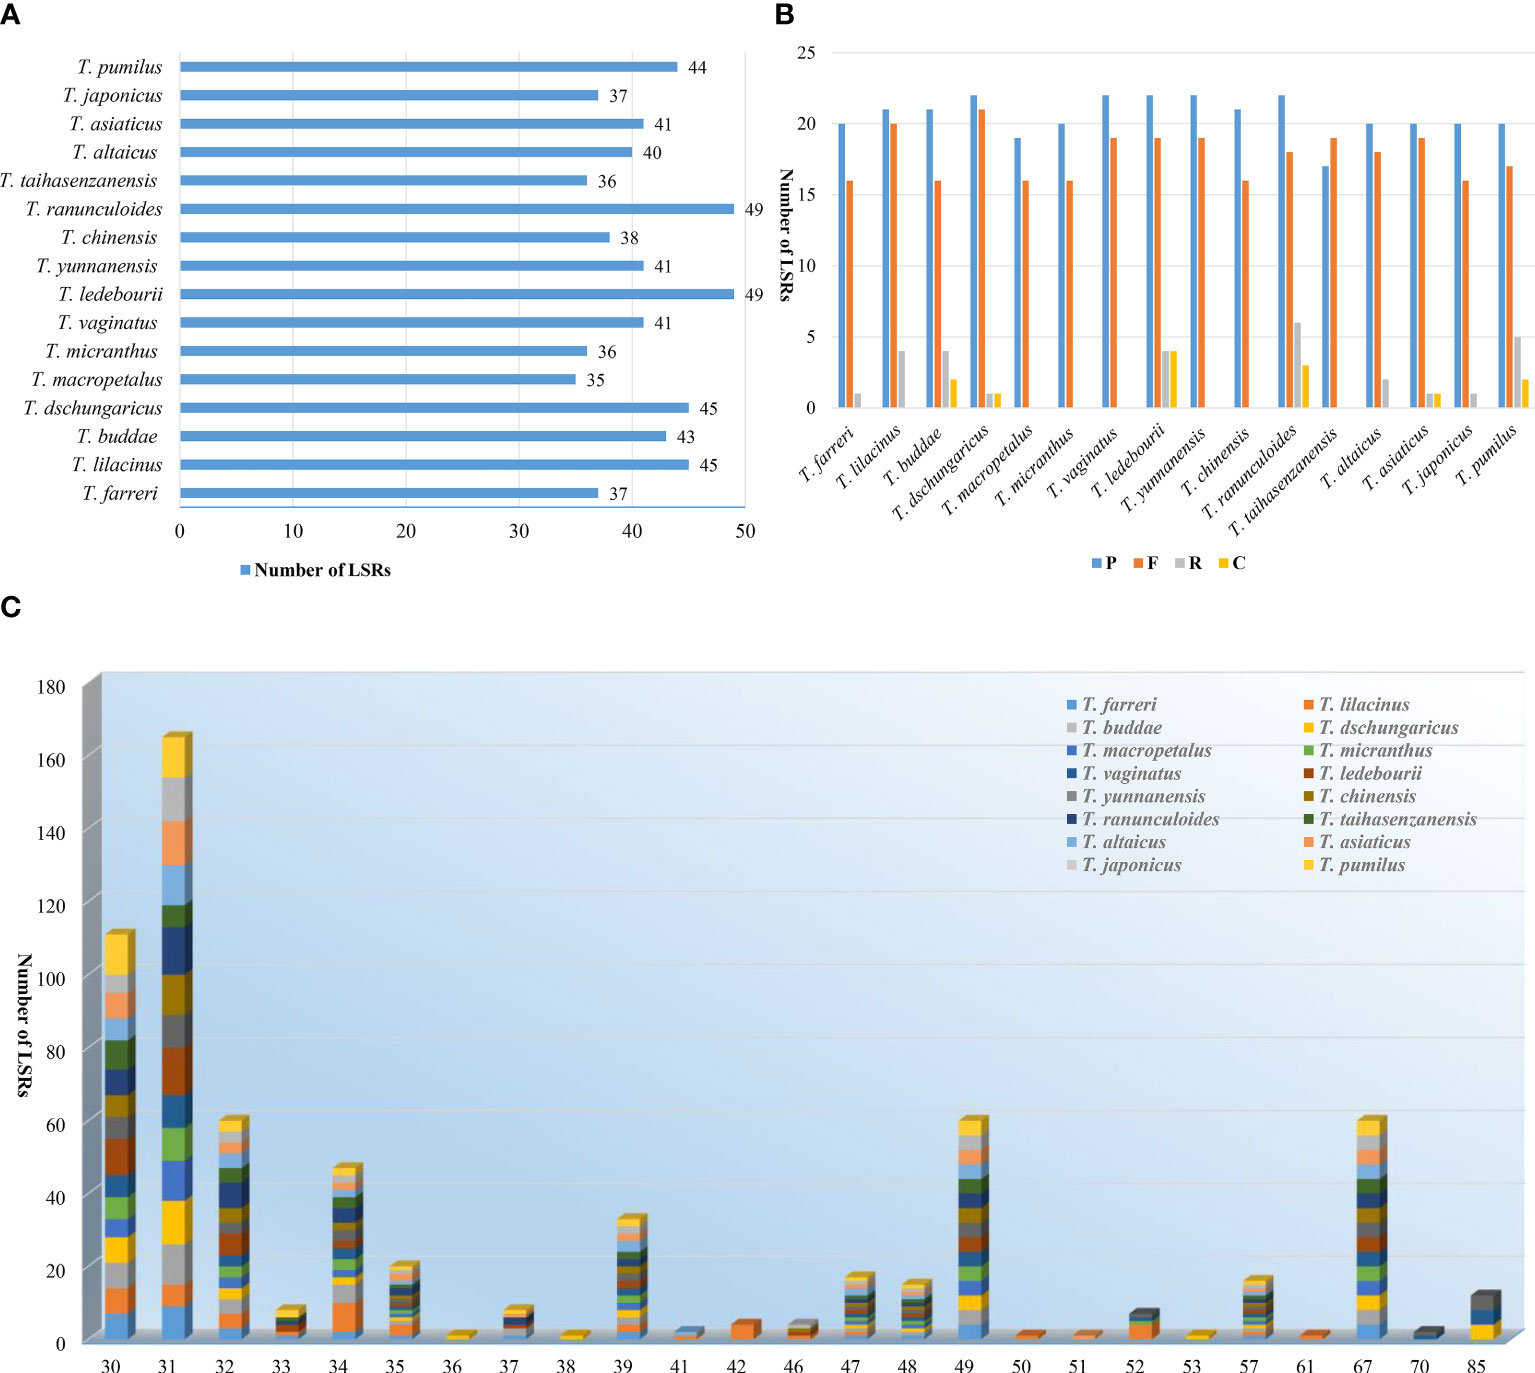
Figure 4 LSRs in the plastomes of 16 Trollius. (A) Number of LSRs. (B) Number of different LSRs types. (C) Number of LSRs of different lengths.
3.4 Sequence divergence and hotspots
We compared the similarity of plastomes within the genus Trollius using the mVISTA program, with T. chinensis as a reference (Figure 5). Our analysis revealed a relatively high level of sequence conservation in genome structure and gene order across the 16 Trollius species, with no significant large-scale inversions or gene rearrangements. However, we observed relatively low homology in five regions: rpl32-trnL, ycf4-cemA, ndhC-trnV, trnS-trnG, and ccsA-ndhD, with partial segments displaying homology below 50%. Most of these highly variable regions were found within the conserved non-coding sequence (CNS). Moreover, we observed that the IR regions exhibited higher conservation compared to the single-copy (SC) regions.
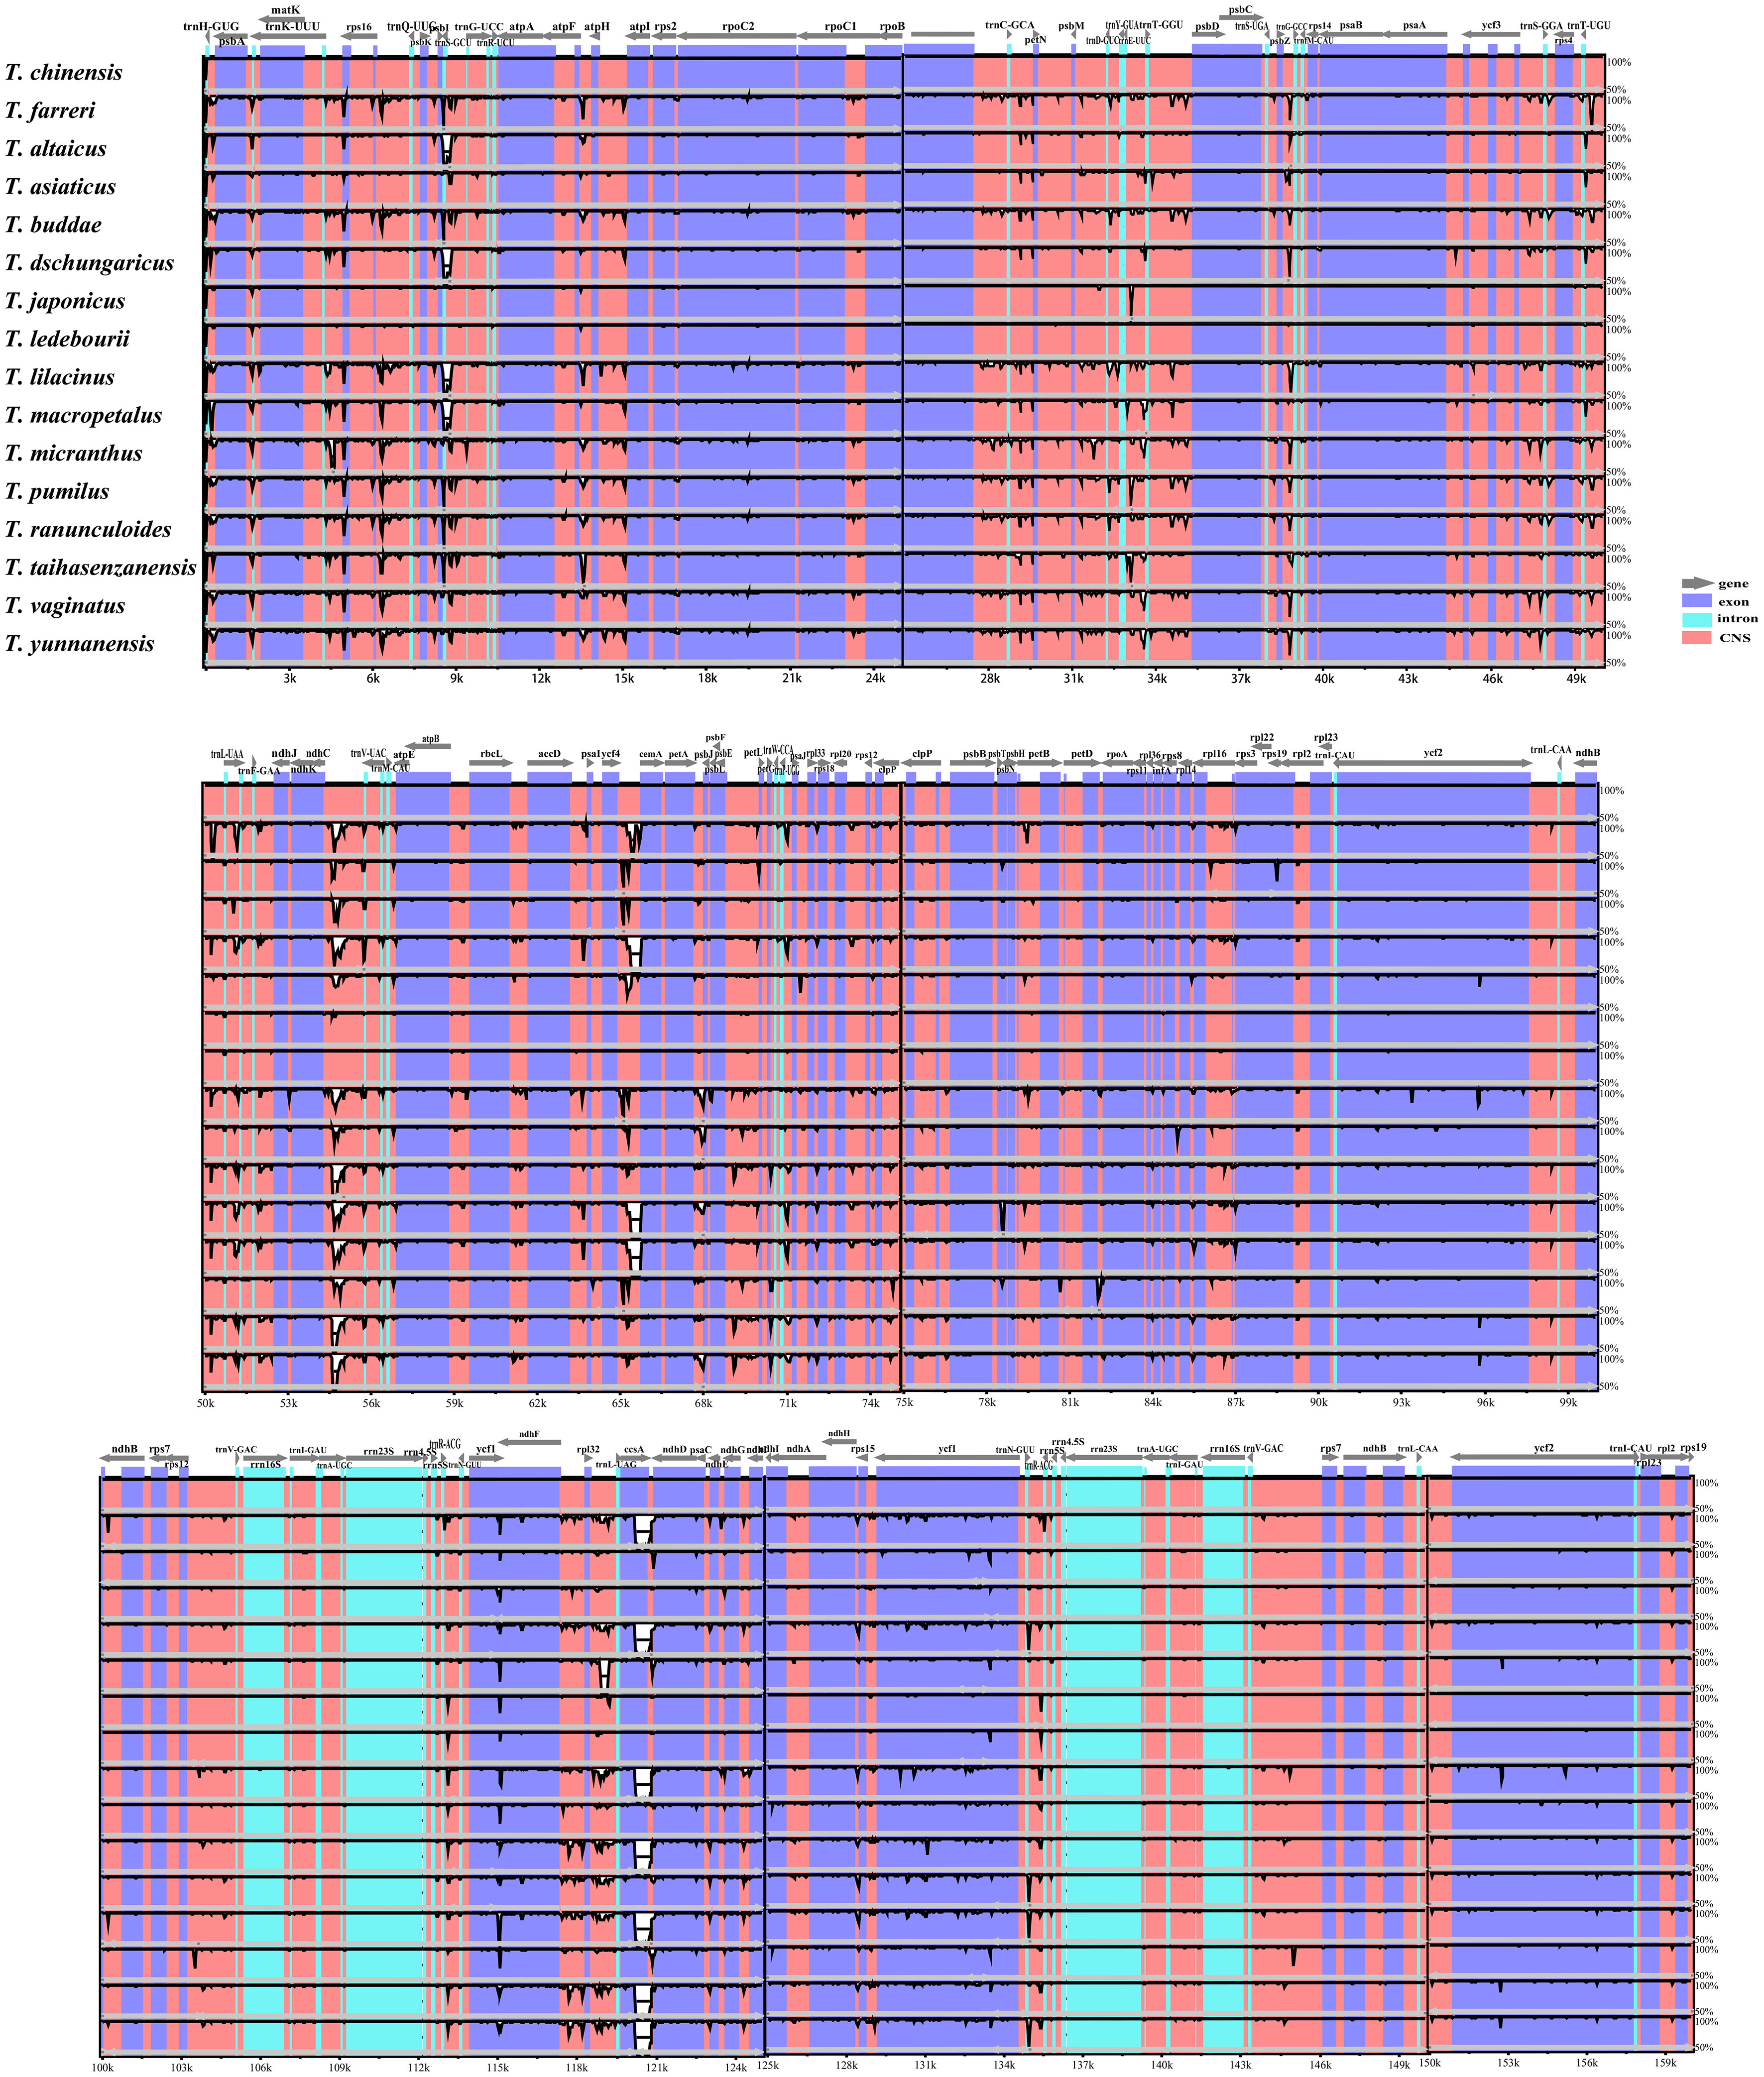
Figure 5 The plastomes of 16 Trollius species were aligned using the Shuffle-LAGAN alignment algorithm in mVISTA and T. chinensis was selected as a reference. The Y-axis represents the percentage of identity between 50% and 100%.
To identify sequence divergence hotspots, we calculated nucleotide diversity (Pi) values by DNAsp (Figure 6). By setting the window size to 600 bp, we found that Pi values within the region ranged from 0 to 0.03574, with the ndhC-trnV region exhibiting the highest Pi value (0.03574). Obviously, the mean Pi values in the IR, LSC, and SSC regions were 0.000964, 0.004068, and 0.006403, respectively. The mean Pi values observed in the IR region were lower than those in the SSC and LSC regions indicated that the IR region was more conserved than SC regions. Our analysis determined that 12 highly variable regions (Pi > 0.0115) were located in the SC region, including ndhC-trnV, rpl32-trnL, rps16-trnQ, trnE-trnT, ycf4-cemA, ycf1-ndhF, ycf1, trnK-rps16, ndhF-rpl32, psbM-trnD, ccsA-ndhD, and matK. Specifically, all of these regions except for matK and ycf1 were located in IGRs.
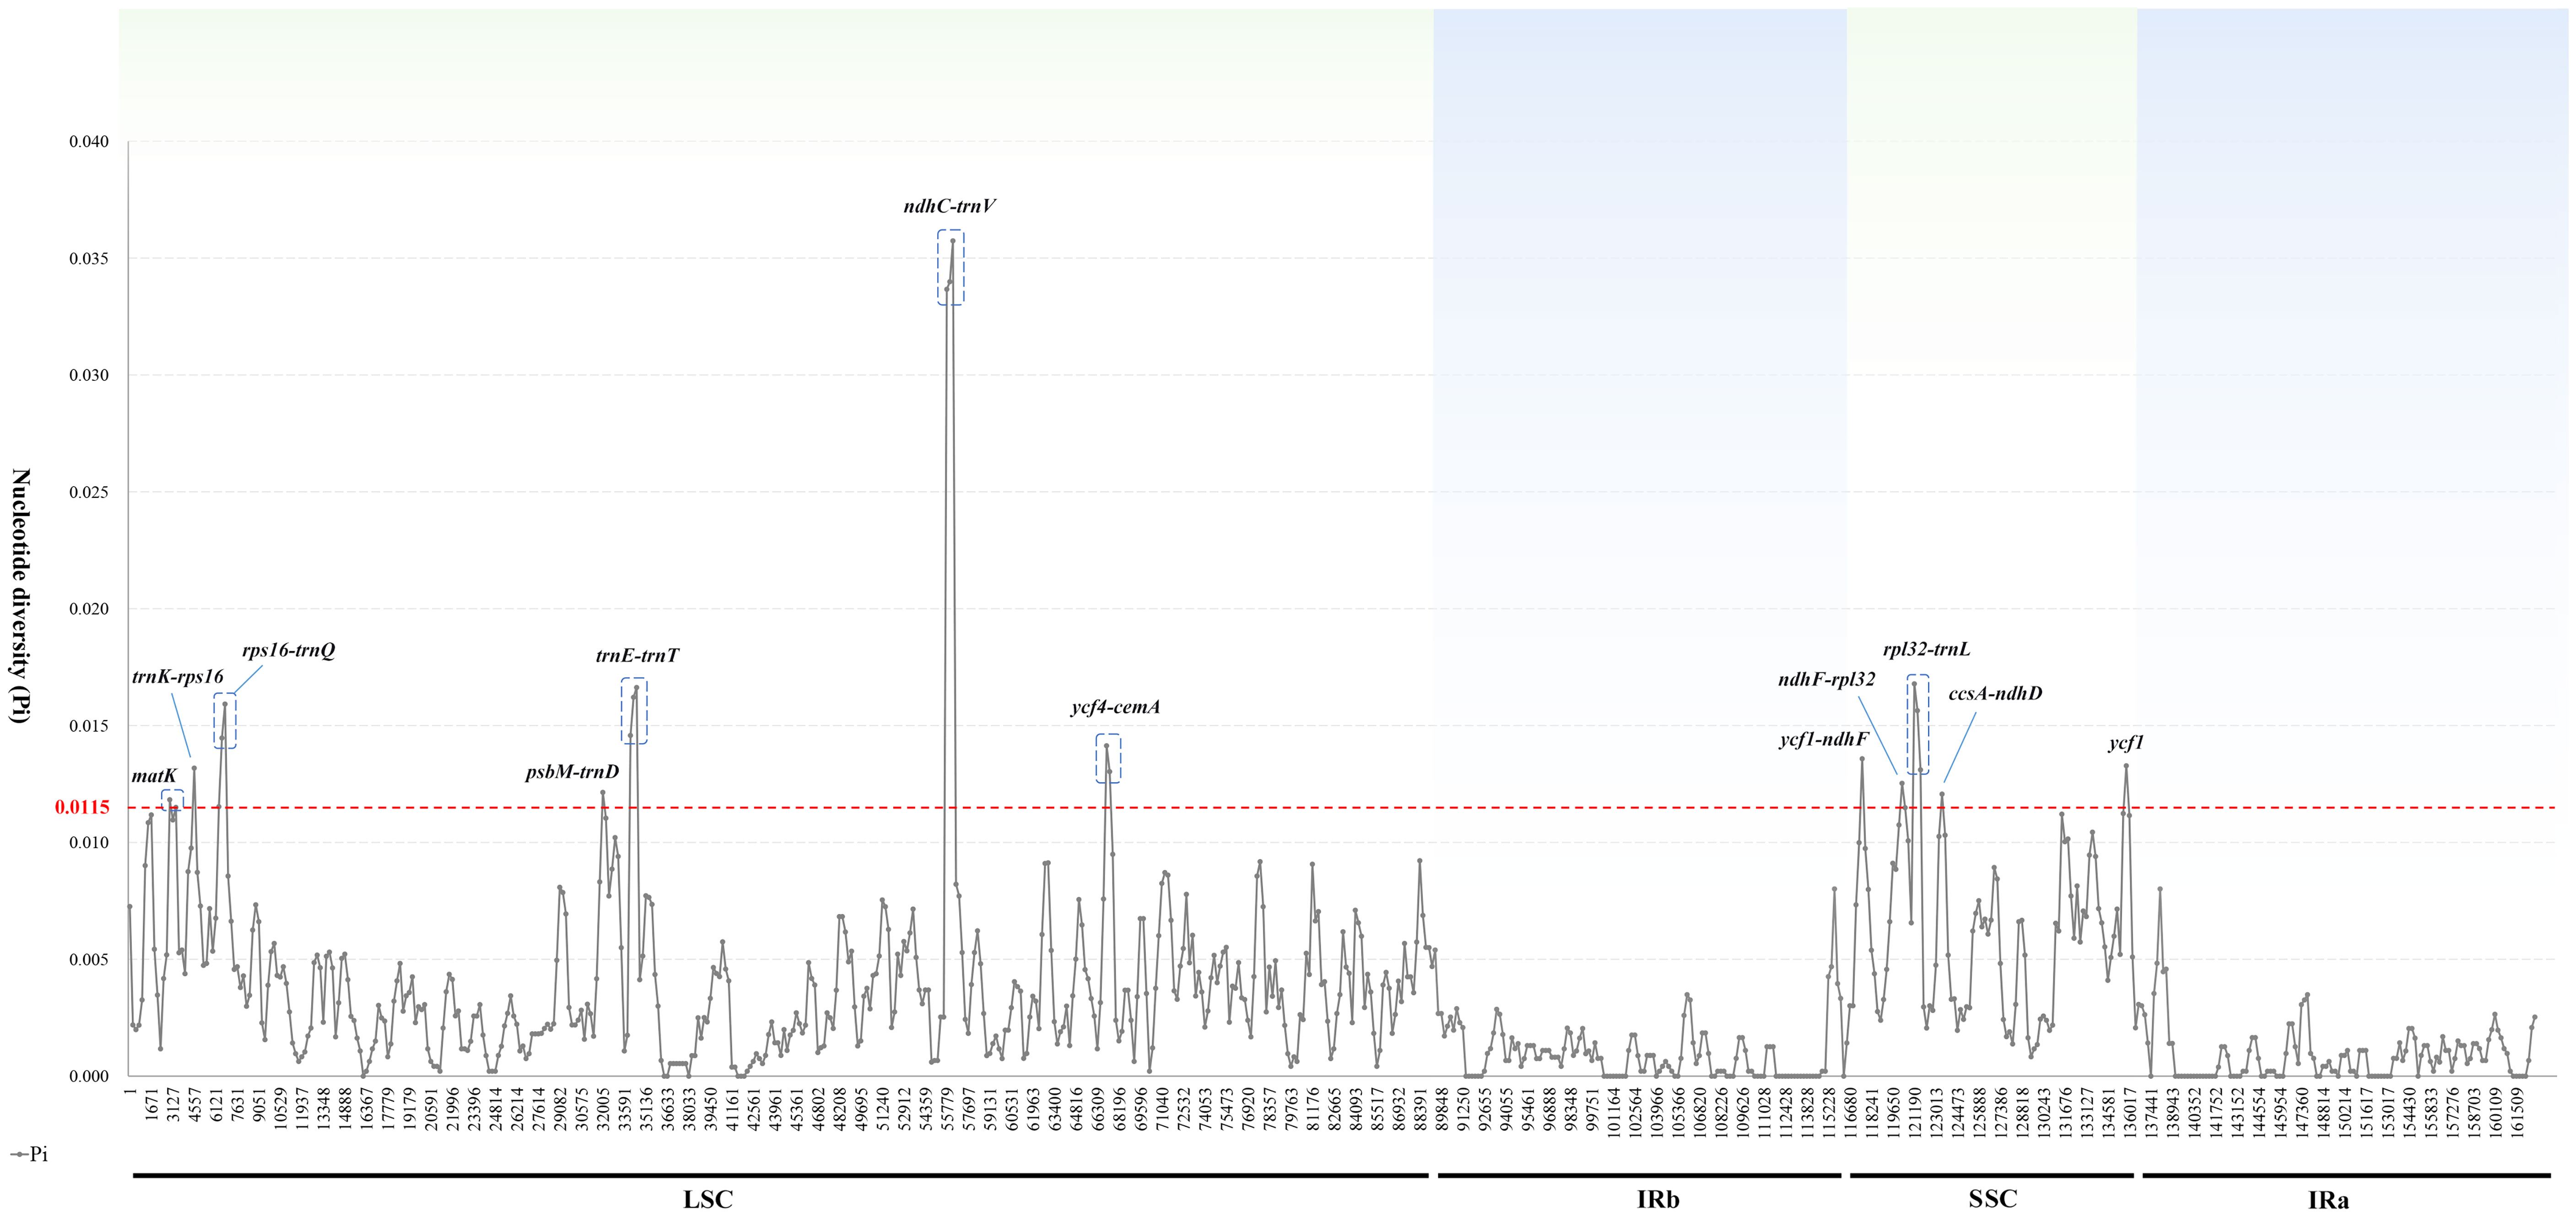
Figure 6 Sliding window analysis of the 16 Trollius plastomes. X-axis: position of the midpoint of a window; Y-axis: nucleotide diversity of each window.
3.5 Phylogenetic analysis
This study reconstructed phylogenetic tree of 16 Trollius species using maximum likelihood, Bayesian inference, and maximum parsimony methods based on three different sequence matrices. The phylogenetic tree based on the whole plastome sequences exhibited similar topologies with the phylogenetic tree based on CDS, and showed higher support values of some nodes, as shown in Figure 7. Due to a low level of sequence variation, the nrDNA tree was poorly resolved (Figure S1). The phylogenetic trees of eight highly polymorphic loci (Figures S2A, B, D, E, F, G, J, K) supported that the genus Trollius formed three clades (clade I, clade II and clade III), of which ycf1, rps16-trnQ, psbM-trnD gene trees (Figures S2I, C, H) were fully consistent with the phylogenetic tree based on the whole plastome sequences (Figure 7). Therefore, the results of the phylogeny in this study were mainly based on the whole plastomes. Trollius formed a monophyletic group with early diverging clade of T. lilacinus (clade I), which was strongly supported by three methods (MLBS = 100%; PP = 1.00; MPBS = 100%). The remaining 15 Trollius species were divided into two clades: the clade II contained most of the species from temperate zones (MLBS = 100%; PP = 1.00; MPBS = 100%), including T. dschungaricus, T. asiaticus L., T. chinensis, T. ledebourii, T. japonicus, T. altaicus, and T. macropetalus. The clade III included most of the species from subtropical zones (MLBS = 100%; PP = 1.00; MPBS = 100%), such as T. farreri Stapf, T. pumilus, T. ranunculoides, T. micranthus, T. yunnanensis and T. vaginatus.
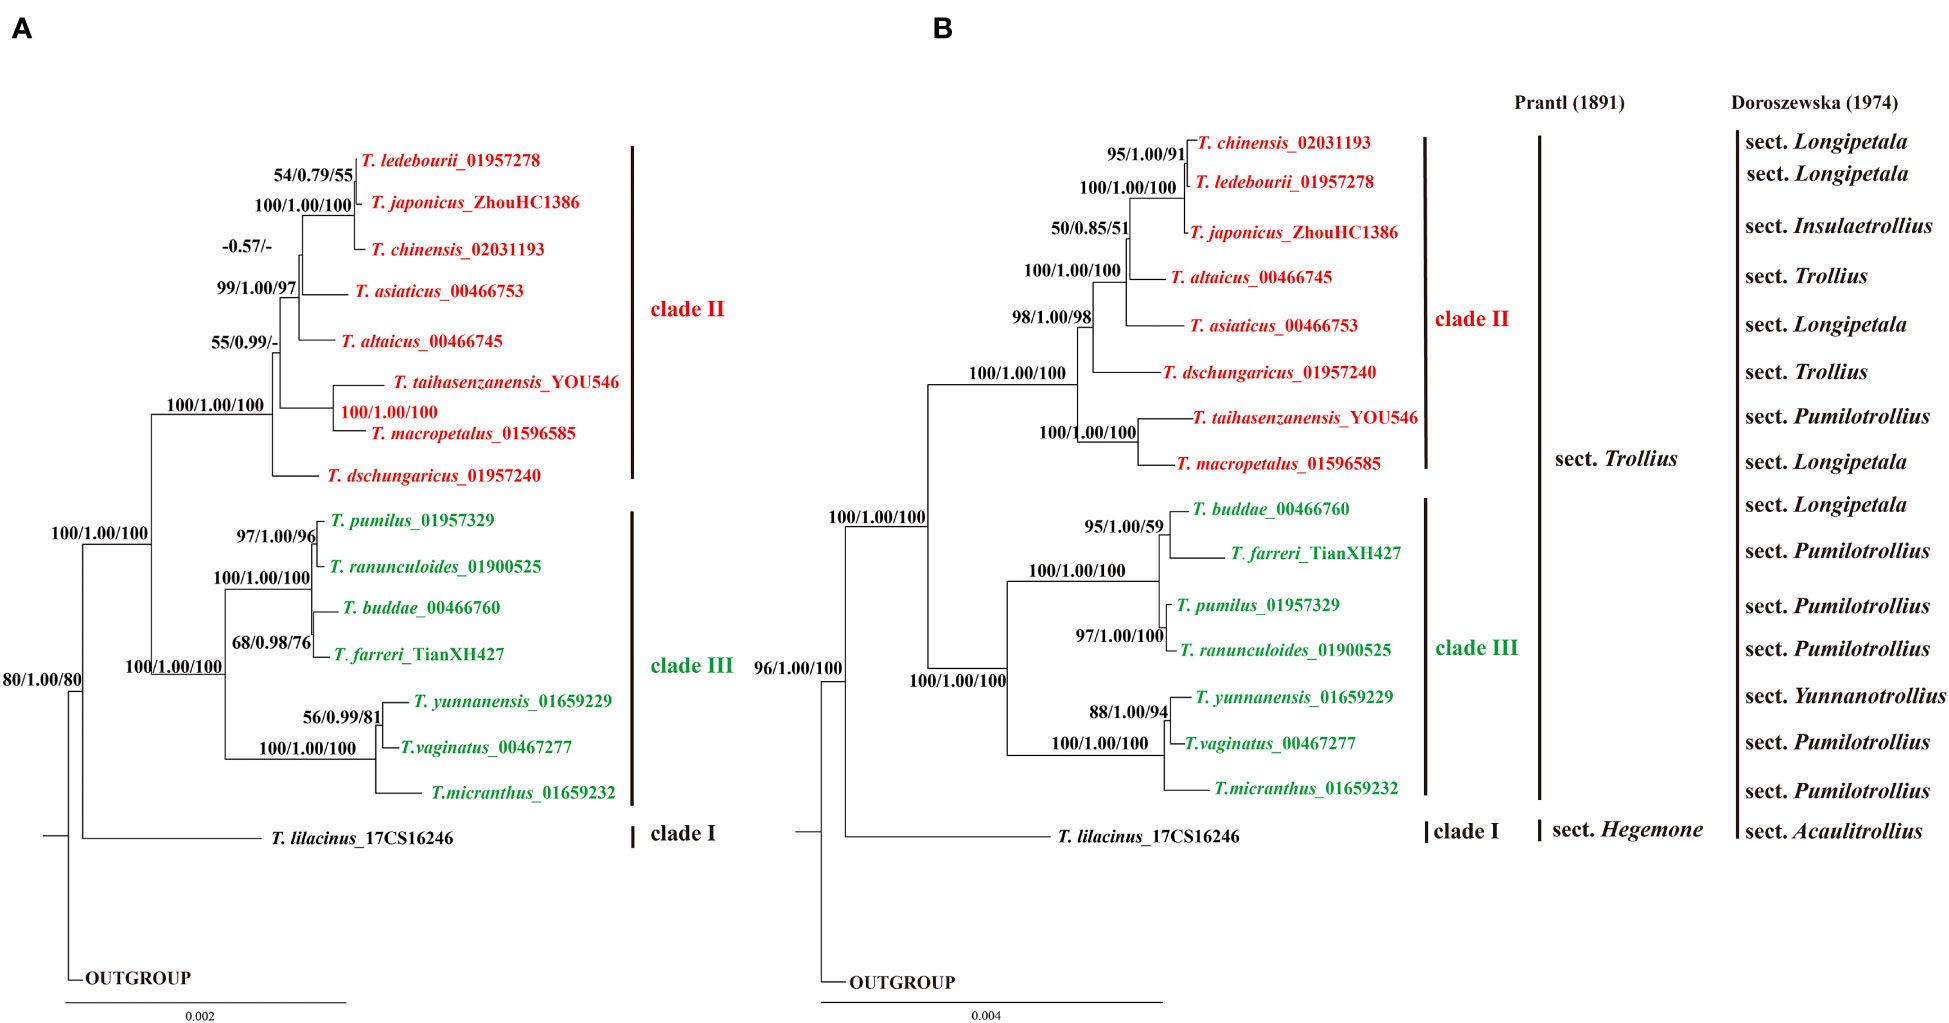
Figure 7 The phylogenetic tree of Trollius was reconstructed using maximum likelihood (ML), Bayesian inference (BI) and maximum parsimony (MP) methods. Each branch was annotated with three values: the ML bootstrap values, the Bayesian posterior probability, and the MP bootstrap values. (A) Phylogenetic tree constructed using the protein-coding sequences (CDS). (B) Phylogenetic tree constructed using the whole plastomes. Traditional classification systems of Prantl (1891) and Doroszewska (1974) were showed on the right vertical lines.
4 Discussion
4.1 Characteristics of plastome in Trollius
The plastomes of the 16 Trollius species sequenced in our study showed a typical quadripartite structure, consistent with other species in the family Ranunculaceae (Zhai et al., 2019). These genomes were larger than the average plastome size of land plants (151 kb), ranging from 159,597 to 160,202 bp, and their GC content (38.0_38.1%) was higher than the average GC content (36.3%) of land plant (Guo et al., 2021). In addition, we observed a significant variation in GC content in different regions of the plastomes, with the highest GC content observed in IR regions. This difference in GC content may be attributed in part to the fact that the four rRNA genes, which have a lower proportion of AT nucleotides, are all located in the IR regions of the plastomes (Palmer and Thompson, 1981; Wang et al., 2008; Yang et al., 2014).
The gene content, gene order and gene number observed in Trollius were consistent with those in the plastomes of most angiosperm, as reported in previous studies (Wicke et al., 2011; Daniell et al., 2016; Yao et al., 2023). We found that 16 species of Trollius all harbored 113 intact plastid genes, representing the largest number of plastid genes in the Ranunculaceae. We observed that the rpl32 was present in the plastomes of Trollius, but absent in many distant-related species within the family such as Adonis sutchuenensis and Leptopyrum fumarioides (L.) Reichb., which indicated that rpl32 have lost independently (Zhai et al., 2019).
Previous studies have shown that the expansion and contraction of the IR region were major contributors to changes in plastome size (Cheng et al., 2017; Li et al., 2021; Liu et al., 2022). However, we observed very similar patterns of SC/IR boundaries in Trollius without a clear signal of expansion or contraction in our study. Repeat sequences play an important role in plastome size in recent study (Feng et al., 2022b), yet we found that no significant differences in terms of the numbers of SSRs and LSRs (Figures 2, 3). Interestingly, the IR region lengths largely supported the phylogenetic relationships. The clade II consisted of eight species with slightly longer IR region ranged from 26,526 bp to 26,610 bp (T. dschungaricus, T. asiaticus, T. chinensis, T. ledebourii, T. japonicus, T. altaicus, T. taihasenzanensis, and T. macropetalus, Figures 2, 7), the clade III consisted of seven species with slightly shorter IR region ranged from 26,490 bp to 26,508 bp (T. buddae Schipcz., T. farreri, T. pumilus, T. ranunculoides, T. micranthus, T. yunnanensis and T. vaginatus, Figures 2, 7). We speculated that these species experienced different evolutionary pressures after diverging from T. lilacinus, resulting in diversification evolution of the length of IR region (Zhang et al., 2013).
4.2 Sequence repeats analysis
SSRs in angiosperm plastomes can be highly variable at the interspecific level due to sliding strand mismatches and unconventional recombination during DNA replication on individual DNA strands (Gandhi et al., 2010; Yuan et al., 2017). Moreover, their simple and relatively conservative structure makes them frequently used as molecular markers in population genetics, polymorphism studies and species identification (Murat et al., 2011). In our study, we detected the mononucleotide SSRs accounted for the largest number of all SSRs (58.92%), and A/T repeats, AT/AT repeats, TA/TA repeats, TAAT/TAAT repeats were common in all species (Figure 3B). This phenomenon was also reported in other genera of the Ranunculaceae family, such as Anemoclema (Franch.) W.T. Wang and Pulsatilla Adans. (Liu et al., 2018; Li et al., 2020), which can be attributed to the easier separation of AT base pairs compared to GC base pairs during plasmid replication (Zhao et al., 2020). Additionally, we noticed that the IR region had fewer SSRs than the other regions (Figure 3C). This was because the repetitive nature of the IR region encouraged copy correction activity, which lowered the frequency of SSRs in this region compared to the LSC and SSC regions.
Previous studies have shown that long sequence repeats can be provide important insight into the evolutionary relationships of species (Milligan et al., 1989; Liao et al., 2021). In our study, T. lilacinus exhibited a unique feature: it lacked the 48, 49, and 67 bp long sequence repeats that were shared by the other species. This finding might have suggested that T. lilacinus was more distantly related to the other species, which can be further supported by the observed morphological characters and habitats, such as unique light purple or light blue sepals, thick and coiled fibrous root, and altitude of 2600_3500 in the Tianshan Mountains of Xinjiang.
4.3 Identification of molecular markers
Mutations in the plastome tend to occur more frequently in certain regions known as “hot spots”, and these regions can exhibit high levels of genetic variation. As a result, hot spots can be employed as specific DNA barcodes for rapid and accurate species identification (Dong et al., 2012). Generally speaking, the IR regions exhibited the lowest average sequence variation among the four regions in the plastomes of Trollius. The highly conserved IR regions may be associated with a higher GC content (Chen et al., 2021). Non-coding regions have more highly variable loci and high Pi values than coding regions, consistent with findings observed in other taxonomic groups (Fan et al., 2018; Sun et al., 2020). Specifically, 12 highly variable hotspots were identified, including ten intergenic spacer regions (ndhC-trnV, rpl32-trnL, rps16-trnQ, trnE-trnT, ycf4-cemA, ycf1-ndhF, trnK-rps16, ndhF-rpl32, psbM-trnD, ccsA-ndhD) and two protein-coding regions (ycf1 and matK). The non-coding region of ndhC-trnV showed the highest variability (Figure 6), which also have been selected as highly variable regions in Pulsatilla and Aconitum L. of Ranunculaceae (Park et al., 2017; Li et al., 2020). The protein-coding region matK was most commonly employed in plant phylogenetic studies and identification (Li et al., 2019). The other protein-coding region ycf1 has been reported that the most variable regions of the plastome (Dong et al., 2012), which had remarkably high nucleotide diversity in Thalictrum L. of Ranunculaceae (Xiang et al., 2022). The phylogenetic analysis of 11 highly variable loci indicated that rps16-trnQ, psbM-trnD and ycf1 have great potential as molecular marker or DNA barcode for this genus.
4.4 Phylogenetic analyses
Due to the limited information provided by morphological characters and molecular markers, the phylogenetic relationships of Trollius have long been poorly resolved (Li, 1995; Després et al., 2003; Wang et al., 2010). However, we have not only effectively resolved phylogenetic relationships but also greatly improved the support values for clades of the phylogenetic tree of Trollius based on plastomes. Our findings strongly supported that the monophyly of Trollius composed of three clades. Trollius lilacinus was the earliest divergent clade (clade I) within the genus, which was supported by its unique morphological traits and distribution area, such as pollen type (Lee and Blackmore, 1992), lilac-blue or pale blue sepals, the flowers appeared before the leaves emerge, thick and coiled fibrous root, and altitude of 2600_3500 in the Tianshan Mountains of Xinjian (Wang, 1979).
The remaining 15 Trollius species were divided into two clades, clade II mainly consisting of species from temperate zones, and the clade III mostly composed of species from subtropical zones, which was congruent with the result of Wang et al. (2010). In the clade II, T. chinensis was closely related to T. ledebourii and T. japonicus, which shared similar morphological features, such as the flowers being single terminal or in 2_3 flowered umbels. Among them, T. chinensis and T. ledebourii formed a sister clade, which shared many of the same chemical components, including flavonoids like orientin and organic acids like palmitic acid (Hao, 2018). Furthermore, they were both distributed at relatively low altitudes. In the clade III, T. micranthus, T. yunnanensis, and T. vaginatus were more closely related to each other compared to other species, and they all had pentagonal leaves with long petioles. Among them, T. yunnanensis and T. vaginatus formed a sister clade, both of which occurred in Yunnan and Sichuan provinces of China. The sister group of T. ranunculoides and T. pumilus had overlapping ranges in Tibet (Wang, 1979). Although most species were assigned to their respective clades, the phylogenetic placement of T. buddae and T. taihasenzanensis were incongruent with their distribution areas. Trollius buddae was distributed in temperate zones but included in the clade III, and T. taihasenzanensis was distributed in subtropical zones but not included in the clade III. This phenomenon may be caused by natural hybridization reported to occur naturally in Trollius (Li et al., 2016). In the future, there is a critical need to integrate more sampling and nuclear genes to better understand the phylogenetic relationships.
The plastome phylogeny supported the traditional classification system of Prantl (1891) but not Doroszewska’s (1974) classification system. Prantl (1891) grouped 16 species of Trollius distributed in China into two sections based on the color of the sepal, sect. Hegemone (light purple or light blue sepals) and sect. Trollius (yellow sepals), which was supported by subsequent palynotaxonomic study (Lee and Blackmore, 1992). Pollen grains of Sect. Hegemone has T. acaulis-type characterized by a roughly striate or striato-rugulate surface, granulate colpus membranes, and generally larger grain size, while pollen grains of sect. Trollius has T. europaeus-type characterized by a finely striate surface, shortly echinate colpus membrane, and generally smaller grains. Our phylogenetic analysis also indicated that two sections have undergone different evolutionary routes. Furthermore, the sect. Trollius was divided into two groups according to the shape of the leaves. Leaves was palmately sect in one group and was palmately parted in the other group (Wang, 1979). There were actually two different evolutionary clades involved in sect. Trollius (clade II & clade III) in our phylogenetic analysis. However, taxa included in the clade II were leave-palmately-sect excluding T. dschungaricus, and taxa included in the clade III were leave-palmately-parted excluding T. ranunculoides, T. vaginatus and T. micranthus. In addition, Doroszewska (1974) defined seven sections within Trollius, of which sect. Pumilotrollius, Longipetala, Trollius were not monophyletic (Figure 7) in this study. It indicated that the genus Trollius were overly fine delineated based on floral morphology and distribution areas. Therefore, it is necessary to propose a more acceptable and practical classification system including more samples based on our phylogenetic results.
5 Conclusion
In this study, we successfully sequenced and assembled the complete plastomes of 16 Trollius species, providing valuable genomic resources for this genus. The plastomes of Trollius species were highly similar in terms of genome size, GC content, gene number, and gene types. Additionally, we observed very similar patterns of SC/IR boundaries in Trollius without a clear signal of expansion or contraction in our study. Using the whole plastomes, we constructed the phylogenetic relationships within the genus Trollius. The results showed that Trollius was a monophyletic group with three strongly-supported clade. Clade I was T. lilacinus, which was supported by many unique morphological characters, clade II and clade III were very consistent with their distribution areas. Besides, we identified 12 highly variable regions by comparative analysis of plastomes of Trollius, which may be used as specific DNA barcodes. Our findings lay a foundation for future research on phylogenetics, species identification, and conservation biology of Trollius. However, further investigation and research are needed to better understand the evolutionary history of this genus.
Data availability statement
The datasets presented in this study can be found in online repositories. The names of the repository/repositories and accession number(s) can be found below: https://www.ncbi.nlm.nih.gov/genbank/, OR449279 https://www.ncbi.nlm.nih.gov/genbank/, OR449280 https://www.ncbi.nlm.nih.gov/genbank/, OR449281 https://www.ncbi.nlm.nih.gov/genbank/, OR449282 https://www.ncbi.nlm.nih.gov/genbank/, OR449283 https://www.ncbi.nlm.nih.gov/genbank/, OR449284 https://www.ncbi.nlm.nih.gov/genbank/, OR449285 https://www.ncbi.nlm.nih.gov/genbank/, OR449286 https://www.ncbi.nlm.nih.gov/genbank/, OR449287 https://www.ncbi.nlm.nih.gov/genbank/, OR449288 https://www.ncbi.nlm.nih.gov/genbank/, OR449289 https://www.ncbi.nlm.nih.gov/genbank/, OR449290 https://www.ncbi.nlm.nih.gov/genbank/, OR449291 https://www.ncbi.nlm.nih.gov/genbank/, OR449292 https://www.ncbi.nlm.nih.gov/genbank/, OR449293 https://www.ncbi.nlm.nih.gov/genbank/, OR449294.
Author contributions
JL: Data curation, Writing – original draft, Conceptualization. YD: Conceptualization, Data curation, Writing – original draft. LX: Resources, Writing – original draft. XJ: Resources, Writing – original draft. ZZ: Data curation, Writing – original draft. MY: Conceptualization, Supervision, Writing – review & editing.
Funding
The author(s) declare financial support was received for the research, authorship, and/or publication of this article. This study was supported by the Natural Science Foundation of Inner Mongolia (No. 2020MS08005).
Acknowledgments
The authors thank Jian He, and Yuan-yuan Wang for assistance in data analysis. Additionally, the authors thank Zhi-jia You for help with sample collection.
Conflict of interest
The authors declare that the research was conducted in the absence of any commercial or financial relationships that could be construed as a potential conflict of interest.
Publisher’s note
All claims expressed in this article are solely those of the authors and do not necessarily represent those of their affiliated organizations, or those of the publisher, the editors and the reviewers. Any product that may be evaluated in this article, or claim that may be made by its manufacturer, is not guaranteed or endorsed by the publisher.
Supplementary material
The Supplementary Material for this article can be found online at: https://www.frontiersin.org/articles/10.3389/fpls.2023.1293091/full#supplementary-material
References
Amiryousefi, A., Hyvönen, J., Poczai, P. (2018). IRscope: an online program to visualize the junction sites of chloroplast genomes. Bioinformatics 34, 3030–3031. doi: 10.1093/bioinformatics/bty220.
Asaf, S., Khan, A. L., Khan, M. A., Waqas, M., Kang, S. M., Yun, B. W., et al. (2017). Chloroplast genomes of Arabidopsis halleri ssp. gemmifera and Arabidopsis lyrata ssp. petraea: Structures and comparative analysis. Sci. Rep. 7, 7556. doi: 10.1038/s41598-017-07891-5
Beier, S., Thiel, T., Münch, T., Scholz, U., Mascher, M. (2017). MISA-web: a web server for microsatellite prediction. Bioinformatics 33, 2583–2585. doi: 10.1093/bioinformatics/btx198
Chen, J., Zang, Y., Shang, S., Liang, S., Zhu, M. L., Wang, Y., et al. (2021). Comparative chloroplast genomes of zosteraceae species provide adaptive evolution insights into seagrass. Front. Plant Sci. 12. doi: 10.3389/fpls.2021.741152
Cheng, H., Li, J. F., Zhang, H., Cai, B. H., Gao, Z. H., Qiao, Y. S., et al. (2017). The complete chloroplast genome sequence of strawberry (Fragaria × ananassa Duch.) and comparison with related species of Rosaceae. PeerJ 5, e3919. doi: 10.7717/peerj.3919
Daniell, H., Lin, C. S., Yu, M., Chang, W. J. (2016). Chloroplast genomes: diversity, evolution, and applications in genetic engineering. Genome Biol. 17, 134. doi: 10.1186/s13059-016-1004-2
Després, L., Gielly, L., Redoutet, B., Taberlet, P. (2003). Using AFLP to resolve phylogenetic relationships in a morphologically diversified plant species complex when nuclear and chloroplast sequences fail to reveal variability. Mol. Phylogenet. Evol. 27, 185–196. doi: 10.1016/s1055-7903(02)00445-1
Ding, W. L., Chen, Z., Chen, J. (2003). Medicinal plant resources and application of Trollius. Chin. Wild Pl. Resour. 22, 19–21. doi: 10.3969/j.issn.1006-9690.2003.06.007
Dong, W., Liu, J., Yu, J., Wang, L., Zhou, S. L. (2012). Highly variable chloroplast markers for evaluating plant phylogeny at low taxonomic levels and for DNA barcoding. PloS One 7, e35071. doi: 10.1371/journal.pone.0035071
Doroszewska, A. (1974). The genus Trollius - A taxonomical study. Monogr. Bot. 1815, 1–167. doi: 10.5586/mb.1974.002
Fan, W. B., Wu, Y., Yang, J., Shahzad, K., Li, Z. H. (2018). Comparative chloroplast genomics of dipsacales species: Insights into sequence variation, adaptive evolution, and phylogenetic relationships. Front. Plant Sci. 9. doi: 10.3389/fpls.2018.00689
Feng, J., Zhao, D. Y., Xu, Q. N., Liu, X. Z., Zhou, M., Ye, X. S., et al. (2022a). A new phenolic glycoside from Trollius chinensis Bunge with anti-inflammatory and antibacterial activities. Nat. Prod. Res. 36, 3309–3316. doi: 10.1080/14786419.2020.1855166
Feng, Y., Gao, X. F., Zhang, J. Y., Jiang, L. S., Li, X., Deng, H. N., et al. (2022b). Complete chloroplast genomes provide insights into evolution and phylogeny of Campylotropis (Fabaceae). Front. Plant Sci. 13. doi: 10.3389/fpls.2022.895543
Frazer, K. A., Pachter, L., Poliakov, A., Rubin, E. M., Dubchak, I. (2004). VISTA: computational tools for comparative genomics. Nucleic Acids Res. 32, W273–W279. doi: 10.1093/nar/gkh458
Gandhi, S. G., Awasthi, P., Bedi, Y. S. (2010). Analysis of SSR dynamics in chloroplast genomes of Brassicaceae family. Bioinformation 5, 16–20. doi: 10.6026/97320630005016
Greiner, S., Lehwark, P., Bock, R. (2019). OrganellarGenomeDRAW (OGDRAW) version 1.3.1: expanded toolkit for the graphical visualization of organellar genomes. Nucleic Acids Res. 47, W59–W64. doi: 10.1093/nar/gkz238
Guo, Y. Y., Yang, J. X., Li, H. K., Zhao, H. S. (2021). Chloroplast genomes of two species of Cypripedium: Expanded genome size and proliferation of AT-biased repeat sequences. Front. Plant Sci. 12. doi: 10.3389/fpls.2021.609729
Hao, D. C. (2018). Ranunculales medicinal plants: biodiversity, chemodiversity and pharmacotherapy (Pittsburgh: Academic Press).
He, J., Yao, M., Lyu, R. D., Lin, L. L., Liu, H. J., Pei, L. Y., et al. (2019). Structural variation of the complete chloroplast genome and plastid phylogenomics of the genus Asteropyrum (Ranunculaceae). Sci. Rep. 9, 15285. doi: 10.1038/s41598-019-51601-2
He, L. Q., Cao, H. Y., Qin, C., Wang, P. P., He, J. J., Ma, W., et al. (2023). Application of biotechnology in medicinal plants. Tradit. Chin. Med. 12, 273–280. doi: 10.12677/tcm.2023.121045
Heo, K., Suh, Y. B. (2008). Taxonomic implications of seed coat in the subtribe Calthinae (Ranunculaceae). Korean J. Plant Taxon. 38, 1-16. doi: 10.11110/kjpt.2008.38.1.001
Jin, J. J., Yu, W. B., Yang, J. B., Song, Y., dePamphilis, C. W., Yi, T. S., et al. (2020). GetOrganelle: a fast and versatile toolkit for accurate de novo assembly of organelle genomes. Genome Biol. 21, 241. doi: 10.1186/s13059-020-02154-5
Kadota, Y. (2016). A revision of the genus Trollius (Ranunculaceae) in Japan. J. Jpn. Bot. 91, 178–200. doi: 10.51033/jjapbot.91_suppl_10730
Katoh, K., Standley, D. M. (2013). MAFFT multiple sequence alignment software version 7: improvements in performance and usability. Mol. Biol. Evol. 30, 772–780. doi: 10.1093/molbev/mst010
Kearse, M., Moir, R., Wilson, A., Stones-Havas, S., Cheung, M., Sturrock, S., et al. (2012). Geneious Basic: an integrated and extendable desktop software platform for the organization and analysis of sequence data. Bioinformatics 28, 1647–1649. doi: 10.1093/bioinformatics/bts199
Kolodner, R., Tewari, K. (1979). Inverted repeats in chloroplast DNA from higher plants. Proc. Natl. Acad. Sci. 76, 41–45. doi: 10.1073/pnas.76.1.41
Kong, H. H., Liu, W. Z., Yao, G., Gong, W. (2017). A comparison of chloroplast genome sequences in Aconitum (Ranunculaceae): a traditional herbal medicinal genus. PeerJ 5, e4018. doi: 10.7717/peerj.4018
Kurtz, S., Choudhuri, J. V., Ohlebusch, E., Schleiermacher, C., Stoye, J., Giegerich, R. (2001). REPuter: the manifold applications of repeat analysis on a genomic scale. Nucleic Acids Res. 29, 4633–4642. doi: 10.1093/nar/29.22.4633
Lee, S., Blackmore, S. (1992). A palynotaxonomic study of the genus Trollius (Ranunculaceae). Grana 31, 81–100. doi: 10.1080/00173139209430728
Li, L. Q. (1995). The geographical distribution of subfam. helleboroideae (Ranunculaceae). Syst. Evol. 33, 537–555.
Li, L., Hu, Y., He, M., Zhang, B., Wu, W., Cai, P. M., et al. (2021). Comparative chloroplast genomes: insights into the evolution of the chloroplast genome of Camellia sinensis and the phylogeny of Camellia. BMC Genomics 22, 1–22. doi: 10.1186/s12864-021-07427-2
Li, Q. J., Su, N., Zhang, L., Tong, R. C., Zhang, X. H., Wang, J. R., et al. (2020). Chloroplast genomes elucidate diversity, phylogeny, and taxonomy of Pulsatilla (Ranunculaceae). Sci. Rep. 10, 19781. doi: 10.1038/s41598-020-76699-7
Li, Q. J., Wang, X., Wang, J. R., Su, N., Zhang, L., Ma, Y. P., et al. (2019). Efficient identification of Pulsatilla (Ranunculaceae) using DNA barcodes and micro-morphological characters. Front. Plant Sci. 10. doi: 10.3389/fpls.2019.01196
Li, Q. Q., Zhou, S. D., Huang, D. Q., He, X. J., Wei, X. Q. (2016). Molecular phylogeny, divergence time estimates and historical biogeography within one of the world's largest monocot genera. AoB Plants 8, plw041. doi: 10.1093/aobpla/plw041
Liao, M., Gao, X. F., Zhang, J. Y., Deng, H. N., Xu, B. (2021). Comparative chloroplast genomics of Sophora species: Evolution and phylogenetic relationships in the early-diverging legume subfamily Papilionoideae (Fabaceae). Front. Plant Sci. 12. doi: 10.3389/fpls.2021.778933
Liu, H. J., He, J., Ding, C., Lyu, R., Pei, L., Cheng, J., et al. (2018). Comparative analysis of complete chloroplast genomes of Anemoclema, Anemone, Pulsatilla, and Hepatica revealing structural variations among genera in tribe Anemoneae (Ranunculaceae). Front. Plant Sci. 9. doi: 10.3389/fpls.2018.01097
Liu, C. K., Lei, J. Q., Jiang, Q. P., Zhou, S. D., He, X. J. (2022). The complete plastomes of seven Peucedanum plants: comparative and phylogenetic analyses for the Peucedanum genus. BMC Plant Biol. 22, 101. doi: 10.1186/s12870-022-03488-x
Milligan, B. G., Hampton, J. N., Palmer, J. D. (1989). Dispersed repeats and structural reorganization in subclover chloroplast DNA. Mol. Biol. Evol. 6, 355–368. doi: 10.1093/oxfordjournals.molbev.a040558
Murat, C., Riccioni, C., Belfiori, B., Cichocki, N., Labbé, J., Morin, E., et al. (2011). Distribution and localization of microsatellites in the Perigord black truffle genome and identification of new molecular markers. Fungal Genet. Biol. 48, 592–601. doi: 10.1016/j.fgb.2010.10.007
Palmer, J. D., Thompson, W. F. (1981). Rearrangements in the chloroplast genomes of mung bean and pea. Proc. Natl. Acad. Sci. 78, 5533–5537. doi: 10.1073/pnas.78.9.5533
Park, I., Kim, W. J., Yang, S., Yeo, S. M., Li, H. L., Moon, B. C. (2017). The complete chloroplast genome sequence of Aconitum coreanum and Aconitum carmichaelii and comparative analysis with other Aconitum species. PloS One 12, e0184257. doi: 10.1371/journal.pone.0184257
Patel, R. K., Jain, M. (2012). NGS QC Toolkit: a toolkit for quality control of next generation sequencing data. PloS One 7, e30619. doi: 10.1371/journal.pone.0030619
Pellmyr, O. (1992). The phylogeny of a mutualism: evolution and coadaptation between Trollius and its seed-parasitic pollinators. Biol. J. Linn. Soc 47, 337–365. doi: 10.1111/j.1095-8312.1992.tb00674.x
Posada, D., Buckley, T. R. (2004). Model selection and model averaging in phylogenetics: advantages of akaike information criterion and bayesian approaches over likelihood ratio tests. Syst. Biol. 53, 793–808. doi: 10.1080/10635150490522304
Ronquist, F., Teslenko, M., van der Mark, P., Ayres, D. L., Darling, A., Höhna, S., et al. (2012). MrBayes 3.2: efficient Bayesian phylogenetic inference and model choice across a large model space. Syst. Biol. 61, 539–542. doi: 10.1093/sysbio/sys029
Rozas, J., Ferrer-Mata, A., Sánchez-DelBarrio, J. C., Guirao-Rico, S., Librado, P., Ramos-Onsins, S. E., et al. (2017). DnaSP 6: DNA sequence polymorphism analysis of large data sets. Mol. Biol. Evol. 34, 3299–3302. doi: 10.1093/molbev/msx248
Shi, L. C., Chen, H. M., Jiang, M., Wang, L. Q., Wu, X., Huang, L. F., et al. (2019). CPGAVAS2, an integrated plastome sequence annotator and analyzer. Nucleic Acids Res. 47, W65–W73. doi: 10.1093/nar/gkz345
Stamatakis, A. (2014). RAxML version 8: a tool for phylogenetic analysis and post-analysis of large phylogenies. Bioinformatics 30, 1312–1313. doi: 10.1093/bioinformatics/btu033
Sun, J. H., Wang, Y. H., Liu, Y. L., Xu, C., Yuan, Q. J., Guo, L. P., et al. (2020). Evolutionary and phylogenetic aspects of the chloroplast genome of Chaenomeles species. Sci. Rep. 10, 11466. doi: 10.1038/s41598-020-67943-1
Wang, W. T. (1979). “Trollius,” in Flora Republicae Popularis Sinicae, vol. 27 . Ed. Wang, W. T. (Beijing: Science Press), 70–88.
Wang, R. J., Cheng, C. L., Chang, C. C., Wu, C. L., Su, T. M., Chaw, S. M. (2008). Dynamics and evolution of the inverted repeat-large single copy junctions in the chloroplast genomes of monocots. BMC Evol. Biol. 8, 36. doi: 10.1186/1471-2148-8-36
Wang, W., Hu, H., Xiang, X. G., Yu, S. X., Chen, Z. D. (2010). Phylogenetic placements of Calathodes and Megaleranthis (Ranunculaceae): Evidence from molecular and morphological data. Taxon 59, 1712–1720. doi: 10.1002/tax.596006
Wicke, S., Schneeweiss, G. M., dePamphilis, C. W., Müller, K. F., Quandt, D. (2011). The evolution of the plastid chromosome in land plants: gene content, gene order, gene function. Plant Mol. Biol. 76, 273–297. doi: 10.1007/s11103-011-9762-4
Wilgenbusch, J. C., Swofford, D. (2003). Inferring evolutionary trees with PAUP*. Curr. Protoc. Bioinf. 1, 4_6. doi: 10.1002/0471250953.bi0604s00
Witkowska-Banaszczak, E. (2015). The genus Trollius-review of pharmacological and chemical research. Phytother. Res. 29, 475–500. doi: 10.1002/ptr.5277
Xiang, K. L., Mao, W., Peng, H. W., Erst, A. S., Yang, Y. X., He, W. C., et al. (2022). Organization, phylogenetic marker exploitation, and gene evolution in the plastome of Thalictrum (Ranunculaceae). Front. Plant Sci. 13. doi: 10.3389/fpls.2022.897843
Xiong, Q., Hu, Y. X., Lv, W. Q., Wang, Q. H., Liu, G. X., Hu, Z. Y. (2021). Chloroplast genomes of five Oedogonium species: genome structure, phylogenetic analysis and adaptive evolution. BMC Genomics 22, 707. doi: 10.1186/s12864-021-08006-1
Yang, Y., Dang, Y. Y., Li, Q., Lu, J. J., Li, X. W., Wang, Y. T. (2014). Complete chloroplast genome sequence of poisonous and medicinal plant Datura stramonium: organizations and implications for genetic engineering. PloS One 9, e110656. doi: 10.1371/journal.pone.0110656
Yang, C. J., Wang, K., Zhang, H., Guan, Q. J., Shen, J. (2023). Analysis of the chloroplast genome and phylogenetic evolution of three species of Syringa. Mol. Biol. Rep. 50, 665–677. doi: 10.1007/s11033-022-08004-w
Yao, G., Zhang, Y. Q., Barrett, C., Xue, B., Bellot, S., Baker, W. J., et al. (2023). A plastid phylogenomic framework for the palm family (Arecaceae). BMC Biol. 21, 50. doi: 10.1186/s12915-023-01544-y
Yu, L. Y. (2016). Resource distribution, cultivation status, major chemical components, and pharmacological effects of Trollius in Mongolian medicine. J. Med. Pharm. Chin. Minorities 22, 39–41. doi: 10.16041/j.cnki.cn15-1175.2016.03.028
Yuan, C., Zhong, W. J., Mou, F. S., Gong, Y. Y., Pu, D. Q., Ji, P. C., et al. (2017). The complete chloroplast genome sequence and phylogenetic analysis of Chuanminshen (Chuanminshen violaceum Sheh et Shan). Physiol. Mol. Biol. Plants 23, 35–41. doi: 10.1007/s12298-016-0395-6
Zhai, W., Duan, X. S., Zhang, R., Guo, C. C., Li, L., Xu, G. X., et al. (2019). Chloroplast genomic data provide new and robust insights into the phylogeny and evolution of the Ranunculaceae. Mol. Phylogenet. Evol. 135, 12–21. doi: 10.1016/j.ympev.2019.02.024
Zhang, H. Y., Li, C., Miao, H. M., Xiong, S. J. (2013). Insights from the complete chloroplast genome into the evolution of Sesamum indicum L. PloS One 8, e80508. doi: 10.1371/journal.pone.0080508
Zhang, L. Q., Zhang, X. Y., Hu, Y. W., Sun, R. S., Yu, J. L. (2021). Complete chloroplast genome of Adonis amurensis (ranunculaceae), an important cardiac folk medicinal plant in east asia. Mitochondrial DNA 6, 583–585. doi: 10.1080/23802359.2021.1875916
Zhang, Q., Zhang, F., Li, B. H., Zhang, L. S., Shi, H. Q. (2016). Production of tetraploid plants of Trollius chinensis Bunge induced by colchicine. Czech J. Genet. Plant Breed. 52, 34–38. doi: 10.17221/89/2015-CJGPB
Zhao, F., Li, B., Drew, B. T., Chen, Y. P., Wang, Q., Yu, W. B., et al. (2020). Leveraging plastomes for comparative analysis and phylogenomic inference within Scutellarioideae (Lamiaceae). PloS One 15, e0232602. doi: 10.1371/journal.pone.0232602
Zheng, G., Wei, L. P., Ma, L., Wu, Z. Q., Gu, C. H., Chen, K. (2020). Comparative analyses of chloroplast genomes from 13 Lagerstroemia (Lythraceae) species: identification of highly divergent regions and inference of phylogenetic relationships. Plant Mol. Biol. 102, 659–676. doi: 10.1007/s11103-020-00972-6
Keywords: Trollius, plastome, comparative analysis, divergent hotspots, phylogenetic relationships
Citation: Li J, Du Y, Xie L, Jin X, Zhang Z and Yang M (2023) Comparative plastome genomics and phylogenetic relationships of the genus Trollius. Front. Plant Sci. 14:1293091. doi: 10.3389/fpls.2023.1293091
Received: 12 September 2023; Accepted: 31 October 2023;
Published: 17 November 2023.
Edited by:
Gang Yao, South China Agricultural University, ChinaCopyright © 2023 Li, Du, Xie, Jin, Zhang and Yang. This is an open-access article distributed under the terms of the Creative Commons Attribution License (CC BY). The use, distribution or reproduction in other forums is permitted, provided the original author(s) and the copyright owner(s) are credited and that the original publication in this journal is cited, in accordance with accepted academic practice. No use, distribution or reproduction is permitted which does not comply with these terms.
*Correspondence: Meiqing Yang, eW1xNDAwMjEwMTFAMTYzLmNvbQ==
†These authors have contributed equally to this work
 Jiaxin Li
 Yan Du1†
 Lei Xie
 Xiaohua Jin