 Vijai Malik1†
 Faiza Mohamad Ikram1†
 Yogita Singh2†
 Vivek Kumar1†Pranita Malik1
 Priyanka Balyan3
 Krishna Pal Singh4,5
 Reyazul Rouf Mir6
 Abeer Hashem7Graciela Dolores Avila-Quezada8
 Elsayed Fathi Abd_Allah9
 Upendra Kumar2,10*
- 1Department of Botany, Chaudhary Charan Singh University, Meerut, India
- 2Department of Molecular Biology & Biotechnology, College of Biotechnology, Chaudhary Charan Singh (CCS) Haryana Agricultural University, Hisar, India
- 3Department of Botany, Deva Nagri P.G. College, Chaudhary Charan Singh (CCS) University, Meerut, India
- 4Biophysics Unit, College of Basic Sciences & Humanities, Govind Ballabh (GB) Pant University of Agriculture & Technology, Pantnagar, India
- 5Mahatma Jyotiba Phule Rohilkhand University, Bareilly, India
- 6Division of Genetics and Plant Breeding, Sher-e-Kashmir University of Agricultural Sciences and Technology of Kashmir (SKUAST-Kashmir), Srinagar, India
- 7Botany and Microbiology Department, College of Science, King Saud University, Riyadh, Saudi Arabia
- 8Facultad de Ciencias Agrotecnológicas, Universidad Autónoma de Chihuahua, Chihuahua, Chihuahua, Mexico
- 9Plant Production Department, College of Food and Agricultural Sciences, King Saud University, Riyadh, Saudi Arabia
- 10Department of Plant Science, Mahatma Jyotiba Phule Rohilkhand University, Bareilly, India
The 26S proteasome is a molecular machine that catalyzes and degrades protein intracellularly with the help of its core complex called 20S proteasome. The 20S proteasomes degrade and cleave denatured, cytotoxic, damaged, and unwanted proteins via proteolysis and impart biotic and abiotic stress tolerance in model plants. This study identified 20 genes, namely, 10 SbPA and 10 SbPB that encode for α- and β-subunits of the 20S proteasome in Sorghum bicolor (L.) Moench (2n= 20). These genes have been found distributed on the 1st, 2nd, 3rd, 4th, 5th, 7th, and 10th chromosomes. These sorghum genes were orthologous to corresponding rice. Phylogenetic analysis clustered these genes into seven clades, each with one of the seven α-subunits (1 to 7) and one of the seven β-subunits (1 to 7). In silico gene expression analysis suggested that nine genes were involved in abiotic stress response (cold, drought, and abscisic acid hormone). The expression of these proteasomal genes was studied in shoots and roots exposed to different abiotic stresses (cold, drought, and abscisic acid) by quantitative real-time polymerase chain reaction. A significant increase in the relative fold expression of SbPBA1, SbPAA1, SbPBG1, SbPBE1, and SbPAG1 genes under ABA and drought stress provides an insight into its involvement in abiotic stress. No expression was observed for cold stress of these genes indicating their non-involvement. It is believed that additional investigation into the SbPA/SbPB genes would aid in the creation of S. bicolor cultivars that are resistant to climate change.
1 Introduction
Sorghum bicolor, a coarse grain, is primarily used as food and fodder in Asia, Africa, the Americas, and Australia. Besides fodder, like sugarcane, the juicy stalks of sweet S. bicolor can be utilized for preparation of syrup and jaggery. Grain from S. bicolor is germinated, dried, and processed to create malt, which serves as a substratum for fermentation in the creation of beer. India ranks second in the world for the cultivation (6.18 million hectares) and production (5.28 million tons) of S. bicolor. It is the third cereal crop after rice and wheat. For several decades, the main focus of research has been on developing agricultural cultivars that can survive biotic and abiotic stresses (Dhankher and Foyer, 2018; Kumar et al., 2019). Abiotic stress mainly involves temperature, salinity, and drought, causing crop yield losses, whereas biotic stresses include different fungal, bacterial, and viral diseases and insect pests (Sun et al., 2019). In response to these stresses, the physiological and molecular responses induce the proteolytic capacity of the eukaryotic cells to selectively remove/degrade the unnecessary/damaged proteins (Kurepa et al., 2009).
The ubiquitin–proteasome system (UPS) is an important protein degradation pathway that removes nuclear, cytosolic, and other membrane proteins (Glickman and Ciechanover, 2002; Finley, 2009). The 26S proteasome holoenzyme of UPS consists of a 19S regulatory particle and a 20S core particle, which recognizes ubiquitin signals and hydrolyzes unfolded polypeptides into short peptides (Saeki, 2017; Yu and Matouschek, 2017). The core complex is integral to the proteasome and is found in many cell types. Under stress, the 20S particle removes misfolded or damaged proteins, catalyzing protein degradation in a non-lysosomal, ATP-dependent manner. The 20S proteasome, a barrel shaped structure, forms the core of the 26S. 20S is made up of 28 subunits arranged in four rings of 7 α- and 7 β-subunits placed one above the other. In the center, two identical rings are made up of 7 β-subunits each. Terminal rings are made up of 7 α-subunits. This gives a symmetric (α 1-7/β 1-7/β 1-7/α 1-7) organization to 20S proteasome. Three β-subunits (numbered β1, β2, and β5) in the middle rings have a proteolytic active site with a specific substrate preference. The α-subunits at the terminal end of 20S proteasome are responsible for entry and exit of peptides. In Arabidopsis thaliana and many eukaryotes, there are 7 α-subunits and 7 β-subunits. Nomenclaturally, these α- and β-subunits can be represented as PAA-PAG and PBA-PBG, respectively.
Genetics of UPS has been figured out in species like Arabidopsis, rice (Fu et al., 1998), wheat (Sharma et al., 2022), and rapeseed (Kumar et al., 2022). In wheat, the 20S proteasome genes were identified and characterized, providing their roles in different biological processes related to abiotic stress tolerance (Sharma et al., 2022). Additionally, it has been demonstrated that the genes encoding various 20S proteasome subunits in rapeseed are linked to biotic and abiotic stressors (Kumar et al., 2022). Several other functions such as tolerance to arsenic (Sung et al., 2016), antiviral response (Dielen et al., 2011), immune response, and organellar stress inducing programmed cell death (L. Sun et al., 2013; Sun H.H et al., 2013; Cai et al., 2018) are also contributed by the 20S proteasomal genes. In Arabidopsis, AtPBE1 regulates proteasome assembly under salt stress (Han et al., 2019). In maize, AtPBAC4 ortholog resulted in defective/collapsed kernels (Wang et al., 2019). In wheat, TaGW2, which encodes the E3 ring ligase of proteasomal complex, regulates the grain size (Song et al., 2007). In rice, OgTT1 (α2 subunit) is associated with heat tolerance and their adaptation (Li et al., 2015).
Data mining computational/bioinformatic approaches provide us an opportunity to access the information available in the databases and have augmented to the structure of system biology (Swarbreck et al., 2007). A number of accessible computational tools/methods, databases, and experimental datasets of many crops are helpful in providing understanding of gene structure, duplication events, molecular phylogeny, cis regulatory elements distribution, microRNA target prediction, differential expression, gene interactions, coexpression networks, gene ontology (GO), and post-transcriptional/translational modifications (Toufighi et al., 2005; Kurata and Yamazaki, 2006; Swarbreck et al., 2007; Hruz et al., 2008; Lyons and Freeling, 2008; Bailey et al., 2009; Letunic et al., 2009; Proost et al., 2009; Sakai et al., 2013; Hu et al., 2015; Chow et al., 2016; Letunic and Bork, 2016; Xia et al., 2017; Dai et al., 2018; Ge et al., 2020).
To date, the comprehensive investigations on structural and functional aspects, and expression profiles of 20S proteasomal genes in sorghum have not been undertaken. Here, we aimed to identify the 20S proteasomal candidate genes, analyzed their structural features, and investigated promoter structure prediction and cis regulatory elements, transcriptional and post-transcriptional regulation, and also their in silico expression profiles at different stages of development and under different abiotic stresses, to understand the roles of these genes in the degradation pathway. Understanding the genetic architecture of 20S proteasomal genes involved in plant’s stress physiology and development ultimately provides a new foundation for future research into development of climate-resilient/smart S. bicolor.
2 Materials and methods
2.1 Characterization of 20S proteasome family genes and proteins
2.1.1 Identification and sequence retrieval of candidate genes
The sequences of 20S proteasome genes for S. bicolor and rice are available in the ensembl database (https://plants.ensembl.org/index.html). The coding sequences (CDS) of 23 rice genes (OsPA/OsPB) available in the ensembl database (https://plants.ensembl.org/index.html) have been utilized to obtain the 20S proteasome gene sequences of S. bicolor. The gene sequences of S. bicolor have been searched using Tblastx (e value ≤ 1e-5) against the available rice genome assembly. The hits were examined for the presence of specific domains as available in query sequences using the conserved domain database (CDD) (Lu et al., 2020) search tool at NCBI. High-level query coverage and (more than 60%) sequence similarity, and the presence of all domains and motifs available in query sequences were the criteria that were used to identify the orthologs in Sorghum.
2.1.2 Gene structure, duplication and genome-wide localization
The structure of gene was analyzed using ensembl plants (https://plants.ensembl.org/index.html), the gene structure display server (http://gsds.gao-lab.org) (Hu et al., 2015), meme suits (https://meme-suite.org/meme/tools/meme) (Bailey et al., 2009), and TB tools (https://github.com/CJ-Chen/TBtools/releases) (Chen et al., 2020). Repeat masker Version: open-4.0.9 (https://www.repeatmasker.org/cgi-bin/WEBRepeatMasker) (Chen, 2004) has been utilized to identify SSRs in gene sequences. All these were done using default and modified parameters.
2.1.3 Promoter structure analysis and miRNA target prediction
Utilizing Plant CARE (http://bioinformatics.psb.ugent.be/webtools/plantcare/html/) (Lescot et al., 2002), it was possible to find cis regulatory elements in the gene sequence upstream of 1,500 bp from the promoter region. The probable micro-RNAs and their targets in the genes of S. bicolor were looked for using the default parameters of the web-based service psRNATarget (https://www.zhaolab.org/psRNATarget/) (Dai et al., 2018). Here, e-value 0–3 was applied (Rensink & Buell, 2004; Lu et al., 2019).
2.1.4 Molecular phylogeny, synteny, and collinearity
Ensembl plants gene tree pipeline (protein sequence alignments) (Rogozin et al., 2003; Yu et al., 2019) was utilized to establish evolutionary relationship among proteasome genes using gene identifier for each gene of S. bicolor. Using the plant compara option, a gene tree of homologs across the genomes of S. bicolor and rice was created. This gene tree can be used to identify duplication and speciation events called paralogy and orthology, respectively. Ka/Ks ratios for seven pairs of gene were calculated using tbtool. Synteny/collinearity of S. bicolor with rice gene was determined using blocks of 25 genes. Genomicus tool v. 49.01 (https://www.genomicus.bio.ens.psl.eu/genomicus-plants-49.01/cgi-bin/search.pl) (Muffato et al., 2010) was used for this purpose.
2.1.5 Physio-chemical properties of candidate proteins
The NCBI keeps a database of conserved domains that can be searched on CDs (CDD). The major domains in the protein sequences of S. bicolor were identified using this tool. Rice has been manually searched for α/β-proteasome domains, which are distinctive traits of the proteasome family. Physio-chemical parameters such as amino acid composition, molecular weight, theoretical PI, the number of positively and negatively charged residues, instability index, aliphatic index, GRAVY, and stability have been calculated using the Protparam tool (https://web.expasy.org/protparam/) (Laskowski et al., 1993) of Expasy. Similar to this, the SOPMA tool (Geourjon and Deleage, 1995) was used to calculate the secondary level characteristics of proteins (https://npsa-prabi.ibcp.fr/cgi-bin/npsaautomat.pl?page=/NPSA/npsasopma.html).
2.1.6 Conserved motifs discovery and homology modeling
Meme suite (https://meme-suite.org/meme/tools/meme) was utilized to search motifs. Inter proscan database (https://www.ebi.ac.uk/interpro/search/sequence/) was utilized to annotate identified motifs. Homology modeling was used to infer the predicted proteins’ 3D structures. Pdb was tested using the Swiss model template library (https://swissmodel.expasy.org/). Geometric and energetic validation of the predicted 3D protein structures was done using the structural analysis and validation system (https://saves.mbi.ucla.edu/). Saves v6.0’s option procheck was used to compare the relative proportion of amino acids in a favored region to another region (Li et al., 2015). The quality of the protein was checked through the PROCHECK server by dihedral analysis of the Ramachandran plots of predicted candidate proteins. VERIFY-3D (Eisenberg et al., 1997) was used to evaluate how well the atomic model (3D) matched the amino acid sequence (Clavijo et al., 2017). To examine the statistics of non-bonded interactions between various atom types, the Errat option of saves was employed (Parmentier et al., 1997).
2.1.7 Structural characterization, subcellular localization, and gene ontology analysis
By aligning their representative structures, the 3D structures of proteins predicted for S. bicolor and those encoded by various Oryza sativa genes were compared using the Fat Cat server (https://fatcat.godziklab.org/fatcat/fatcat pair.html). By comparing the root mean square deviation (RMSD) values of the Cα atoms of the created structures to those of the corresponding 3D structures of the query genes, the similarity of the generated 3D structures in a globally optimized superimposition environment was determined. Subcellular localization and GO analysis were conducted using the Biomart tool (https://plants.ensembl.org/biomart/martview/1e86aac7e869419fd945a124d55c0405) (Smedley et al., 2009) and ShinyGO tool (http://bioinformatics.sdstate.edu/go/) (Ge et al., 2020), respectively. The protein–protein interaction network was performed to uncover unknown functions of proteins at the molecular level using string database (Szklarczyk et al., 2023).
2.1.8 Sequence alignment and phylogenetic analysis
To identify conserved and coevolving amino acid residues in S. bicolor and rice, multiple sequence alignment was performed using the MultAlin tool (http://multalin.toulouse.inra.fr/multalin/). The mutual information (MI) between two amino acid locations in MSA was calculated using the Mistic web server (http://mistic.leloir.org.ar/results.php?jobid=202112021211022296). Coevolving residues were found using MI. The MI between two places (two columns in the MSA) measures how well we can anticipate the amino acid identification at a different position when we are aware of an amino acid at one position. Thus, MI is a measurement that enables the detection of associated and compensating mutation sites in homologous proteins. Using MEGA software version 6.0 (MEGA stands for molecular evolutionary genetics analysis), the phylogenetic analysis of protein amino acid sequences was carried out (Xu & Xue, 2019). To create an unrooted tree, a neighbor-joining approach with a bootstrap requiring 1,000 iterations was used. Mega software’s Newick format tree was developed with iTOL (https://itol.embl.de/) (Letunic and Bork, 2016).
2.2 In silico expression profiling
The expression profiling of all the candidate SbPA/SbPB genes at different levels was performed using GENEVESTIGATOR (https://genevestigator.com/) (Hruz et al., 2008). First, at the tissue-specific level, the expression was studied on a quantitative basis in different tissues of sorghum, taking into account the SB-mRNASeq-SORGHUM datasets and selecting all the 20 SbPA/SbPB genes in a heat map format. Second, a set of experiments were performed for the 20 SbPA/SbPB genes at 10 different developmental stages. Third, the expression of these 20 SbPA/SbPB genes was studied under abiotic (cold, drought, and ABA hormone) stress and the data were presented in the form of fold values.
2.3 Validation of proteasomal genes through qRT-PCR
For experimental validation of candidate genes, the sorghum cultivar HJ 541 was selected and their seeds were grown in soil-filled pots under greenhouse conditions. Various abiotic stress treatments (cold: 4°C, ABA and drought: 10% of soil moisture remaining in pot) were performed. The leaf and root samples were collected from 4-week-old plants after providing the abiotic stresses for 10 days. Total RNA was isolated from samples using the Maxwell RSC Plant RNA kit (Promega, United States), according to manufacturer’s protocol. From the isolated RNA, cDNA was synthesized using the RevertAid cDNA synthesis kit (Thermo Scientific, United States). The Primer Quest tool of IDT was used to design specific primers for quantitative expression analysis. Actin was used as an endogenous control. Quantitative real-time polymerase chain reaction was performed using Quant Studio 6 Flex system, with three biological replicates. Relative expression of genes was quantified using the 2−ΔΔCT method to identify the expression pattern of proteasomal genes under abiotic stress.
3 Results
Numerous crops’ sequenced plant genomes have been used to research genes involved in various developmental stages and stress tolerance (Lu et al., 2019). The sequenced genomes of model plants A. thaliana and O. sativa, which serve as a platform for comparative studies, are beneficial to crops whose genomes have not been sequenced (Rensink and Buell, 2004). The workflow used to characterize the 20S proteasomal genes in this study is given in Figure 1.
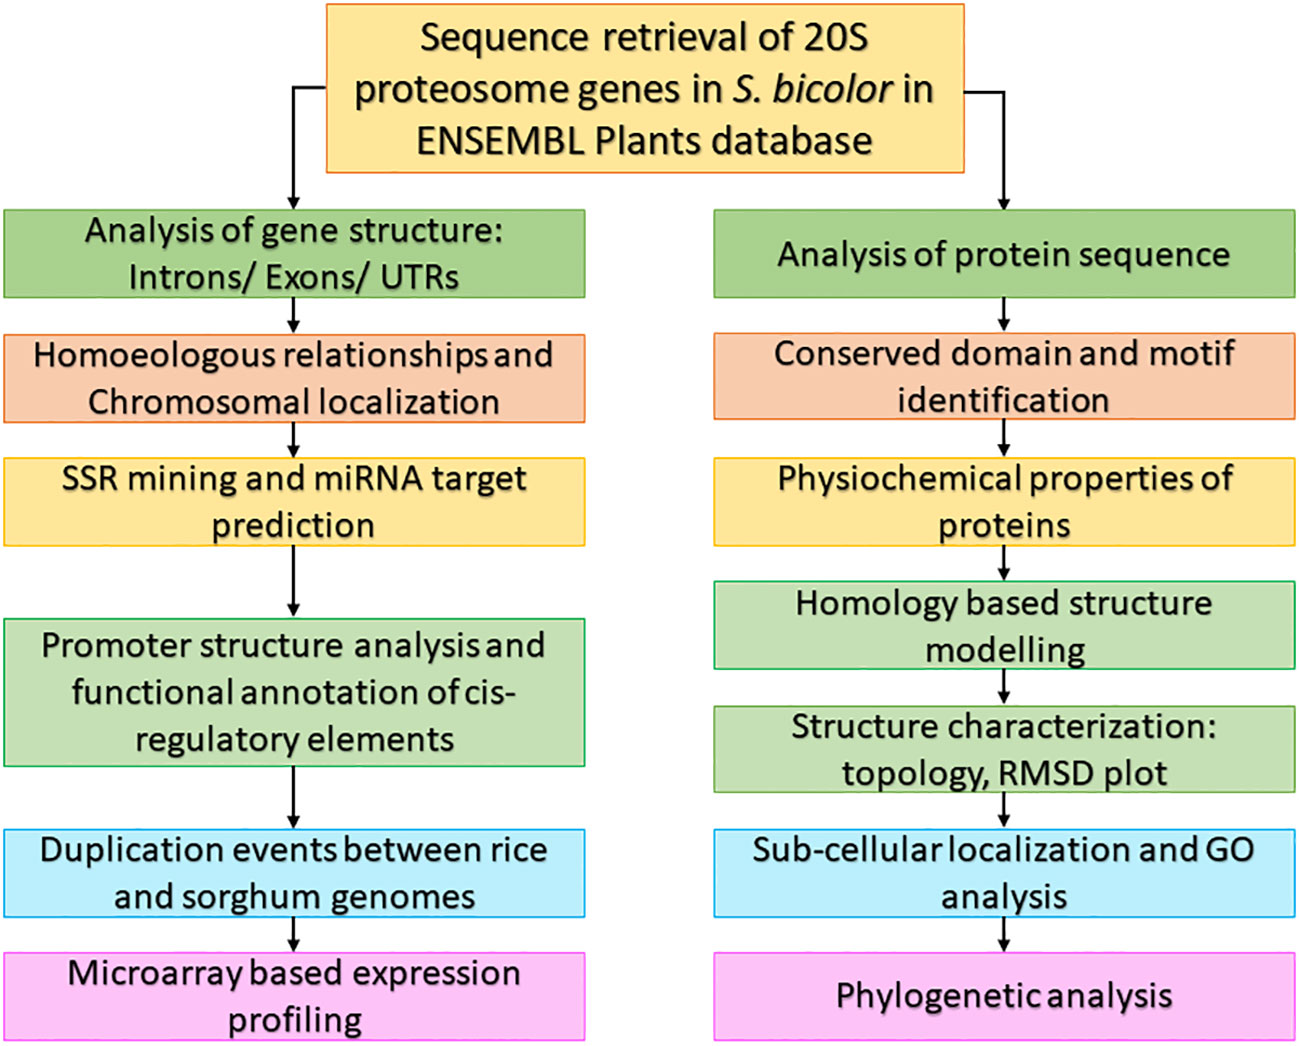
Figure 1 Workflow used to characterize 20S proteasomal genes in S. bicolor.
3.1 Gene sequence analysis
3.1.1 Gene structure, splice variants, and chromosomal location of 20S proteasome genes
The present investigation revealed 20 proteasomal genes in S. bicolor. These genes were classified into seven distinct α and β types of the 20S proteasome family. Table 1 contains detailed information about these genes, as well as the cDNA and CDS sequences of the α-subunits (SbPAA-SbPAG) and β-subunits (SbPBA-SbPBG). Information on homology of S. bicolor with rice is given in Table 1. All the 20 Sorghum genes have been designated on the basis of corresponding genes reported in rice (Fu et al., 1998; Livneh et al., 2016).
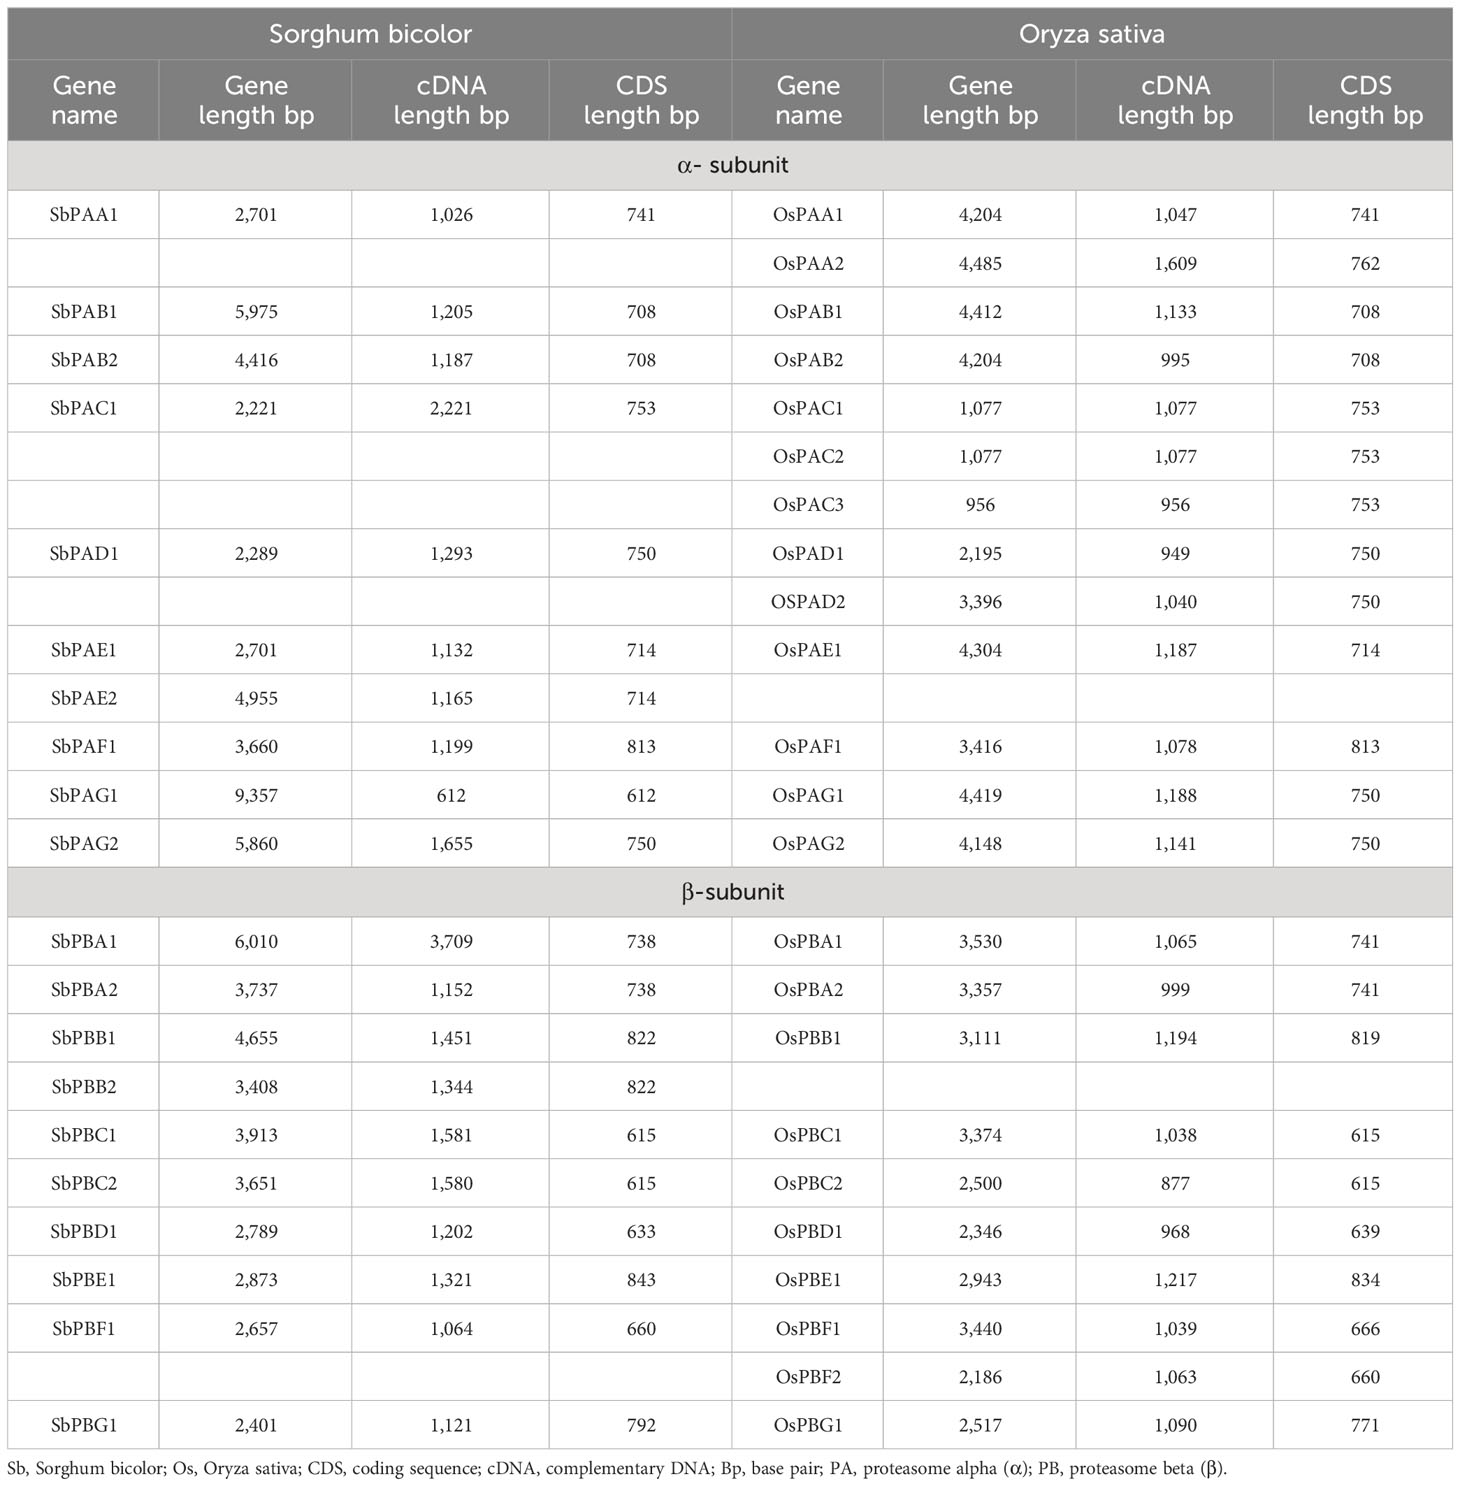
Table 1 Detailed information about genes, cDNA, and CDS sequences for α- and β-subunits of 20S proteasome in S. bicolor and rice.
Each SbPA gene has a length that varied from 2,221 to 9,357 base pairs. Exon and intron count in SbPA genes ranged from 1 to 11, respectively. The 10 SbPA genes are all intron-containing The SbPB genes’ lengths ranged from 2,401 to 6,010 base pairs. Exon and intron count in SbPB genes ranged from 3 to 8 and from 2 to 7, respectively (Supplementary Table 1). Although there are some exceptions, the structural arrangement of exon and intron was found to be comparable in the majority of SbPA and SbPB genes. The SbPA gene’s cDNA sequence ranged from 612 to 2,221, while the SbPB gene’s sequence ranged from 1,064 to 3,709 (Supplementary Table 1). SbPA (708–813) and SbPB (615–843) genes showed individual variations in CDS. Figure 2 shows the distribution of exons (solid yellow bar), introns (black lines), upstream and downstream areas (solid blue bar), and UTR (3’ or 5’) (solid green bar), as well as intron phase 0 (56.83%), phase 1 (30.93%), and phase 2 (12.23%). SbPA and SbPB genes were found to be unevenly distributed throughout 10 chromosomes, which may be the result of gene duplication or gene loss (Li et al., 2015; Clavijo et al., 2017; Yu et al., 2019). The Chromosome Sb10 had the maximum number (5) of genes (SbPAC1, SbPBA2, SbPBB2, SbPBC1, and SbPBE1) and chromosomes Sb3 and Sb5 had one gene each. Chromosomes Sb6, Sb8, and Sb9 are without any gene. The positions of all the genes were terminal and sub-terminal (Figure 3). In contrast to the prior work by Sassa et al., which reported that there were 14 genes in rice, the phylogenomic survey found that there are 23 genes (Sassa et al., 2000). More thorough phylogenomic surveys may also be able to resolve duplications and heterogeneity in other organisms.
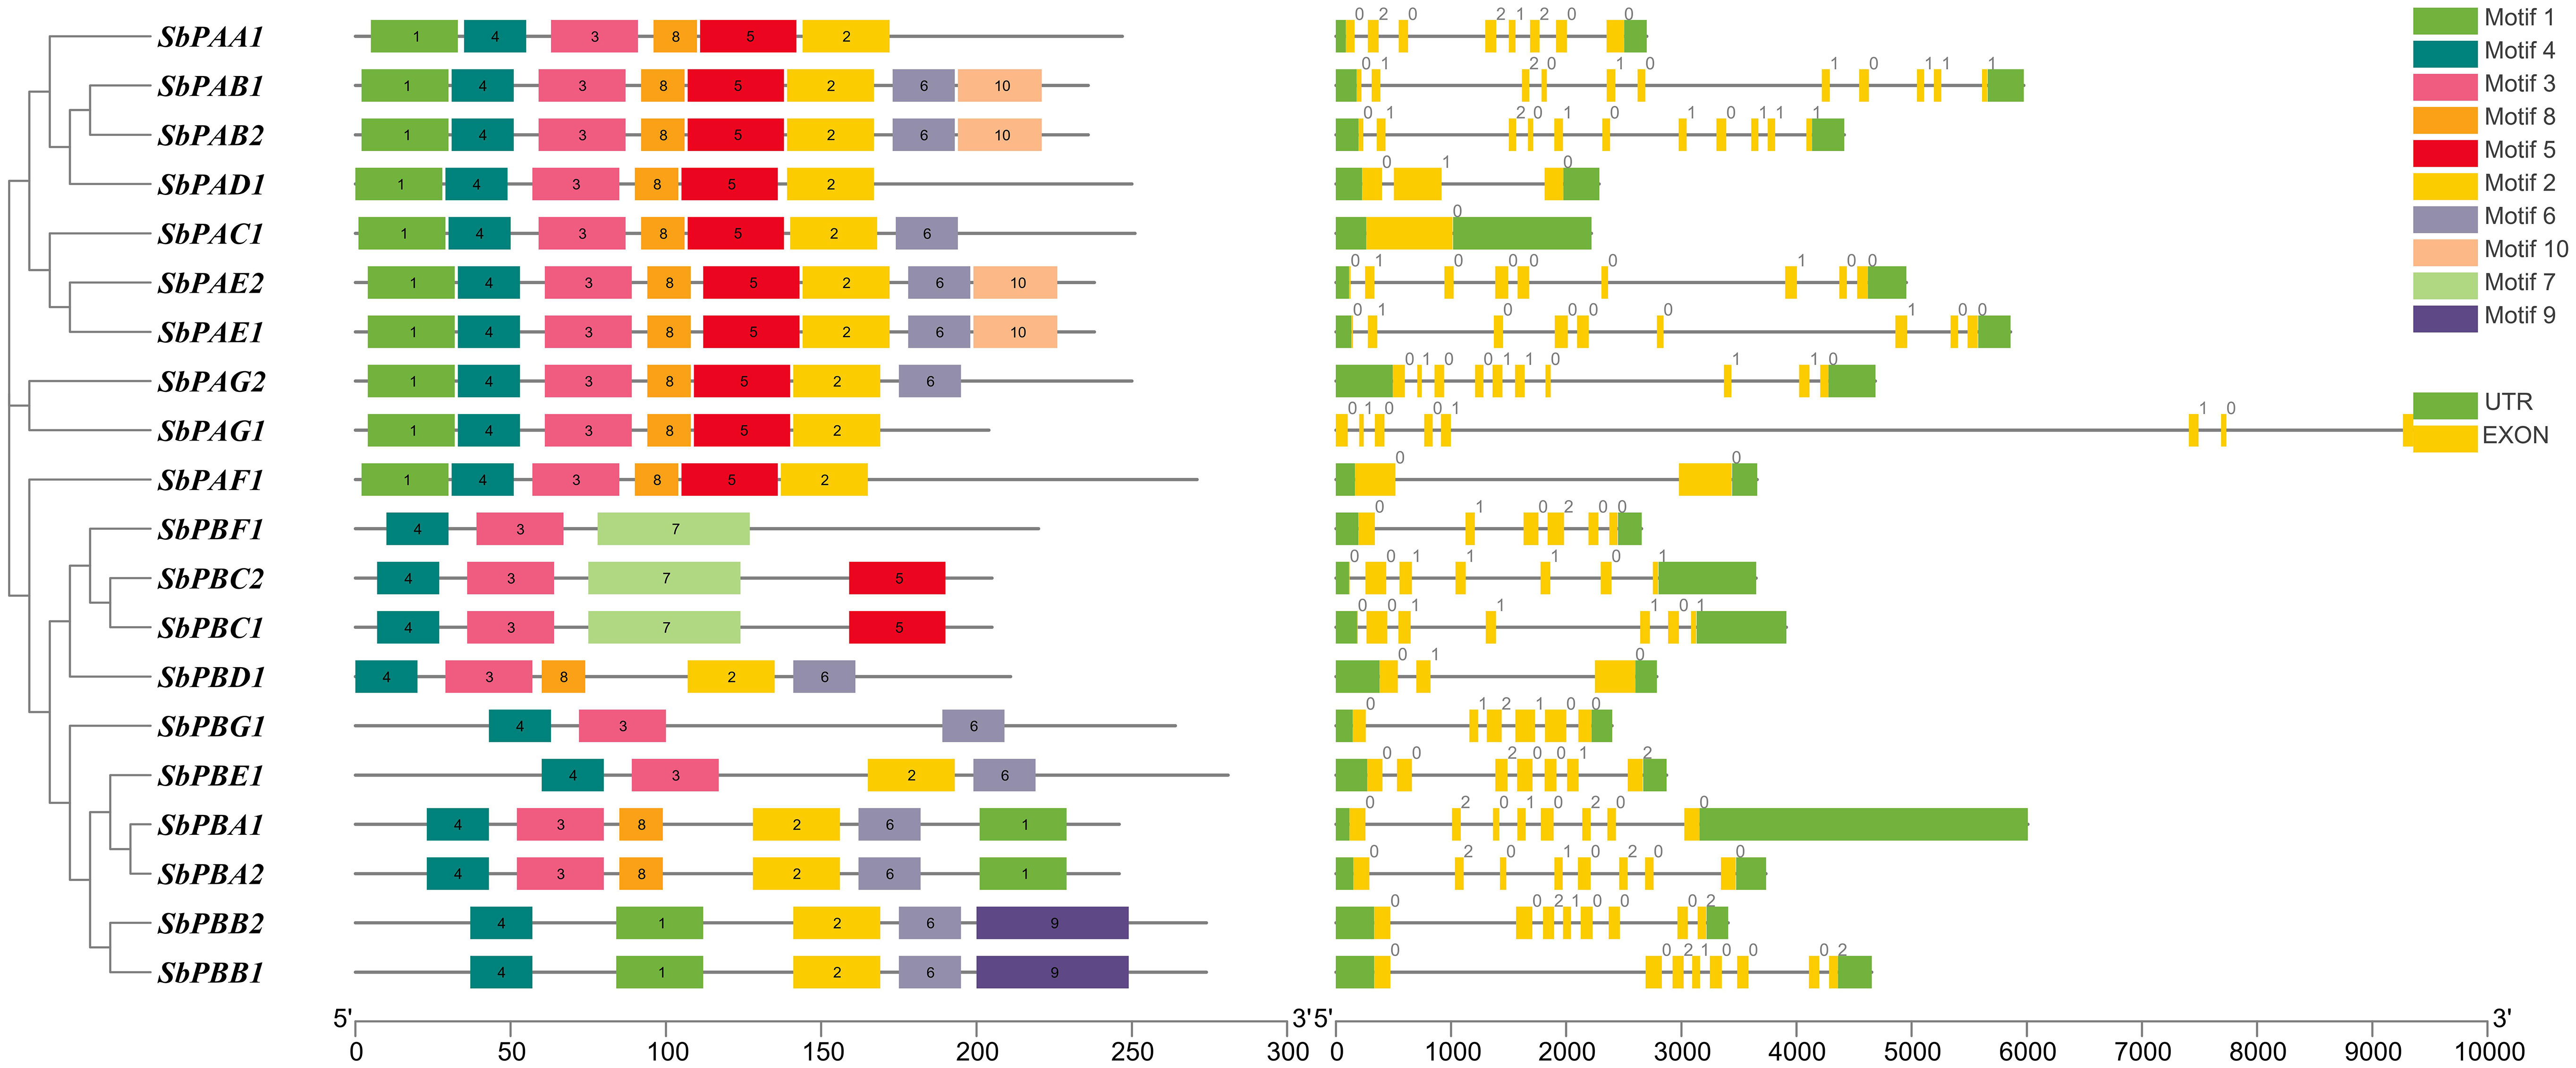
Figure 2 Structure of SbPA and SbPB genes of Sorghum bicolor showing distribution of exons (yellow solid bars), introns (black lines), upstream/downstream regions (solid green bars), and intron phases marked as 0, 1 and 2. This figure also represents the conserved motifs identified in SbPA and SbPB proteins.
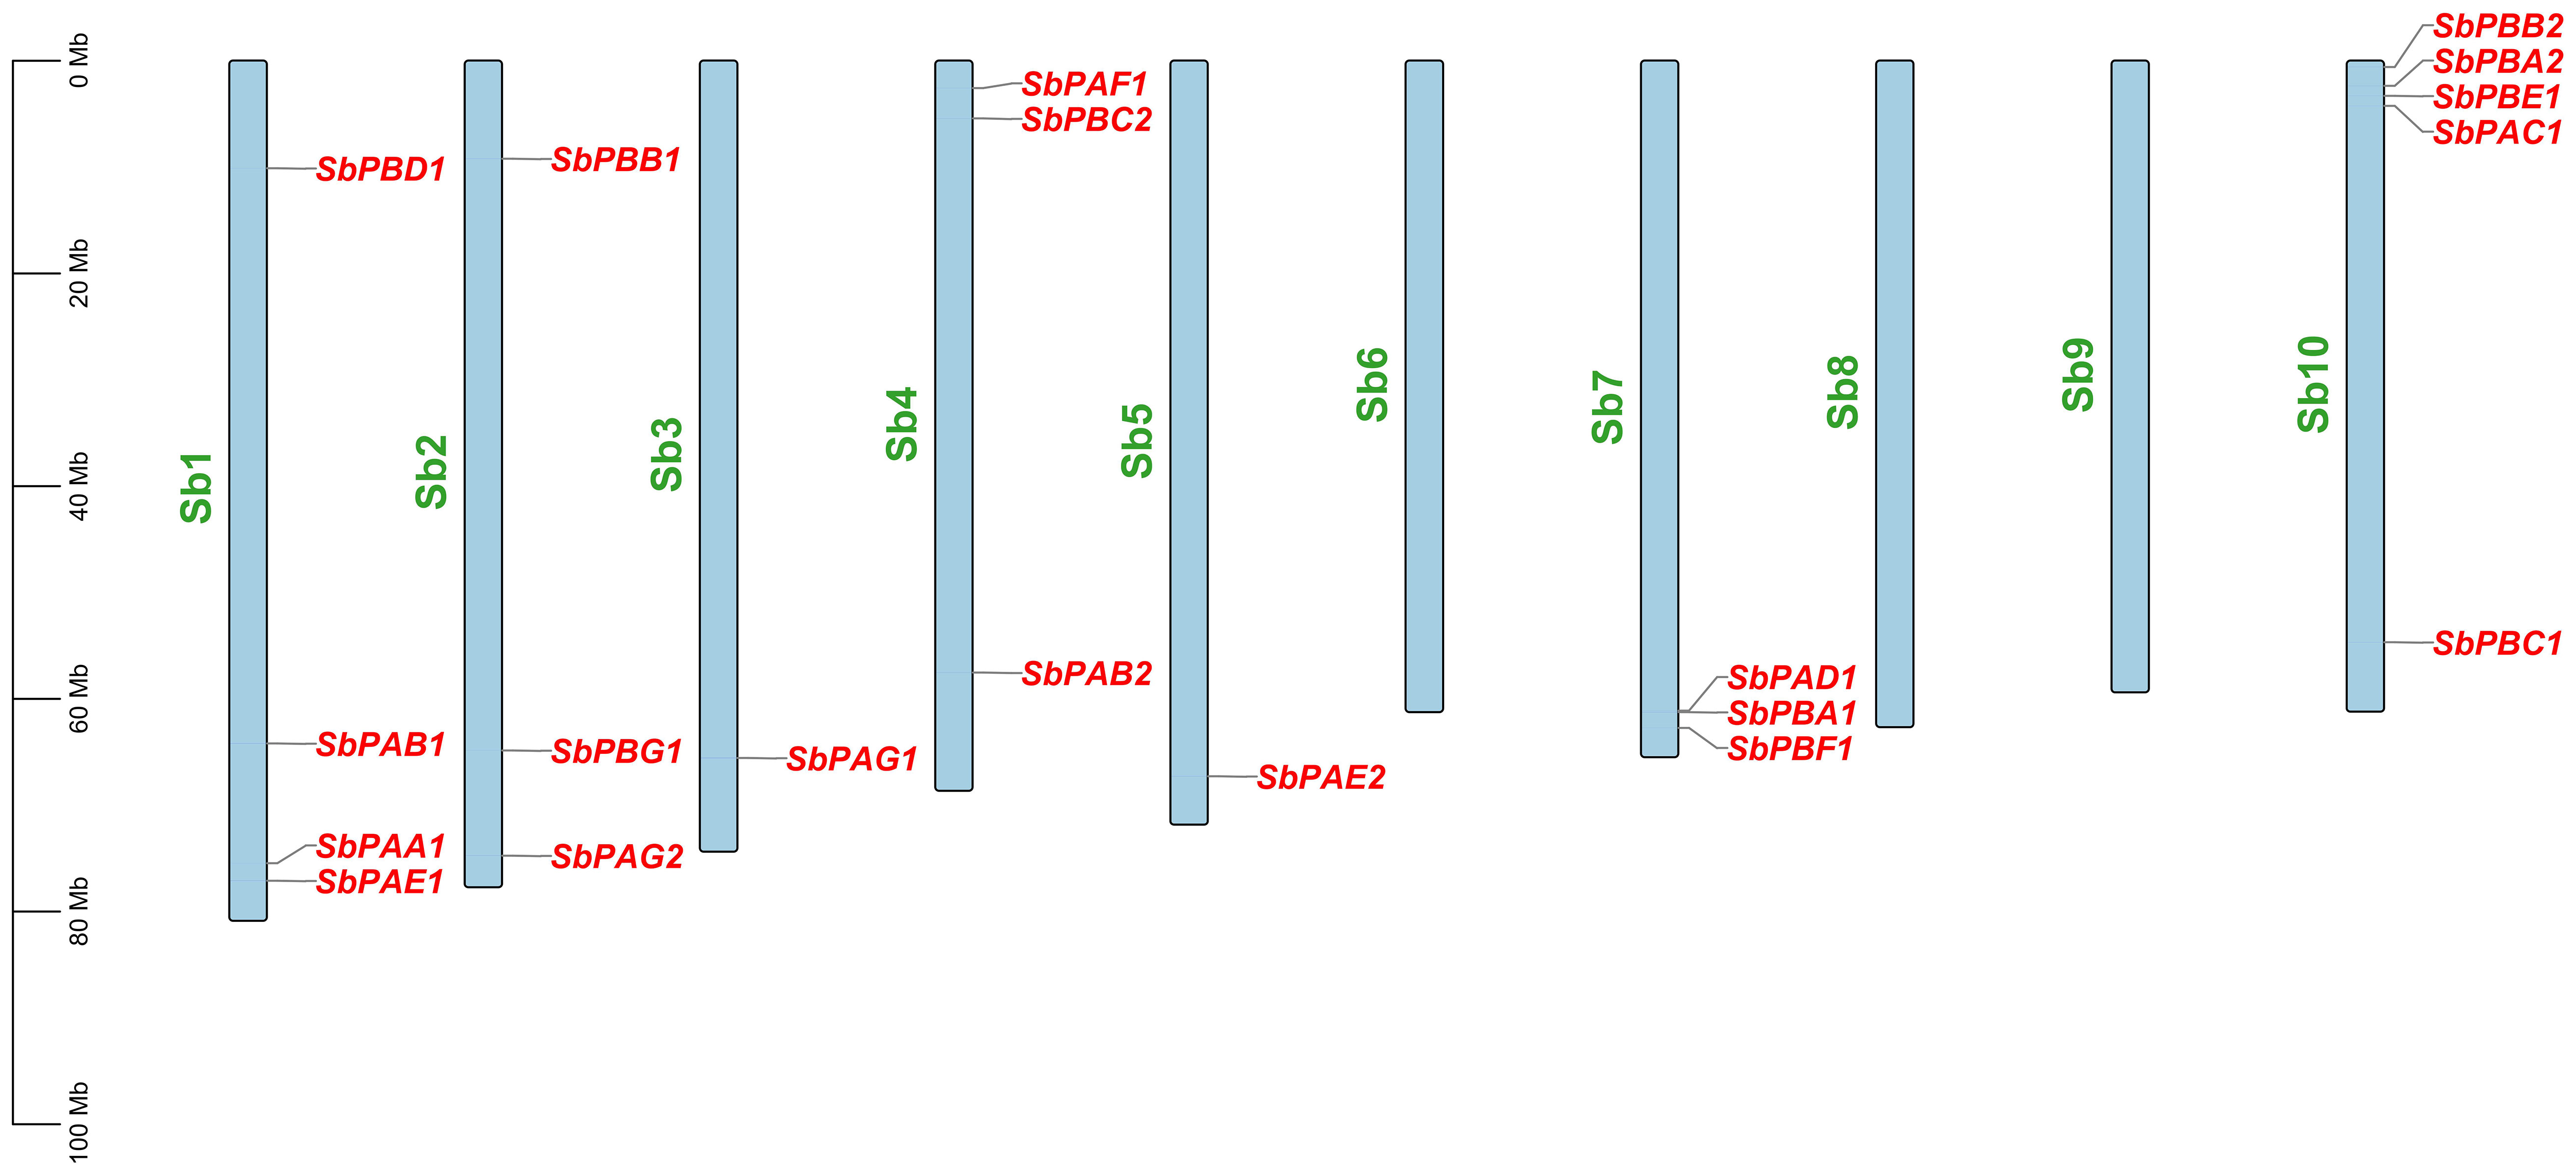
Figure 3 Distribution of 20 SbPA and SbPB genes on 20 chromosomes of Sorghum bicolor belonging to 1–10 chromosomes. On each chromosome, gene names are given on the upper side and their physical positions in megabases (Mb) are indicated on the left.
Using gene trees that included Sorghum genes as well as genes from O. sativa, the orthology between 10 SbPA and 10 SbPB genes was studied. Utilizing the Ensembl Plant Compara pipeline, this tree was created (Supplementary Figure 1).
3.1.2 Gene duplication and synteny
The orthologous and paralogous interactions between the SbPA and SbPB genes in several taxa are outlined in Supplementary Table 2. The 23 genes (13 α and 10 β) in rice were divided into seven duplicates, one triple, and the remaining six singletons (Supplementary Table 2). The duplication pattern in rice was used to predict the comparable pattern in S. bicolor. Using the plant compara gene tree in the ensembl plant database allowed us to distinguish orthologs from paralogs. Seven gene pairs have been found in the peptides of Sorghum bicolour and rice. Ka and Ks ratios for all the seven pairs were found to be less than one. These values indicate stabilizing selection, i.e., genes are constrained to maintain their current function and thus acting against change favoring conservation (Supplementary Table 3). Synteny of 20 genes of S. bicolor with the rice gene has been found to be 100% (Supplementary Figure 2). However, the collinearity of genes of S. bicolor with rice was absent.
3.1.3 SSRs mining
Eleven (55%) of the 20 genes included a total of 22 SSRs. This suggests that only a small fraction of the genes in a gene family include SSRs. Of these, 14 SSRs were found in eight SbPA genes and eight SSRs in three SbPB genes. The number of SSR per gene also varied, with two genes (SbPAG2 and SbPBB1) having five SSRs, three genes (SbPAE2, SbPAG1, and SbPBB2) having two SSRs, and the remaining six genes having one SSR each (Supplementary Table 4). The most common SSRs (5) have hexanucleotide and trinucleotide motifs, followed by those with mononucleotide (3), dinucleotide (3), pentanucleotide (3), tetranucleotide (2), and heptanucleotide (1) motifs.
3.1.4 Promoter structural analysis and functional annotation of cis-regulatory elements
All genes’ promoter regions were found to include many LAMP elements, CAAT-box, TATA-box, CCAAT-box, Sp1, CGTCA-motif, ABRE, I-box, G-Box, GC-motif, CAT-box, P-box, TC-rich repeats, TATC-box, TGACG-motif, GT1-motif, MBS, TCT-motif, ATCT-motif, AT-rich element, TCCC-motif, MRE, GARE-motif, O2-site, ARE, A-box, GCN4_motif, TCA-element, chs-CMA2a, AACA motif, AuxRR-core, Box 4, GATA-motif, LTR, GTGGC-motif, Box II, the 3-AF1 binding site, and the Pc-CMA2c elements. Among these, CAAT-box, TATA-box, TGACG-motif, G-Box, MRE, TCT-motif, Sp1, and AT-rich elements were present in maximum number of genes (Figure 4). The CAT box and GCN4 motif were found responsive in the expression of meristem and endosperm, respectively (Supplementary Figure 3). All of the transcription factors have the A-box motif, which is a cis-acting regulatory element connected to P-box and L-box. It is involved in transcriptional activity that is triggered. In the promoter regions, A-box from various families of transcription factors was discovered.
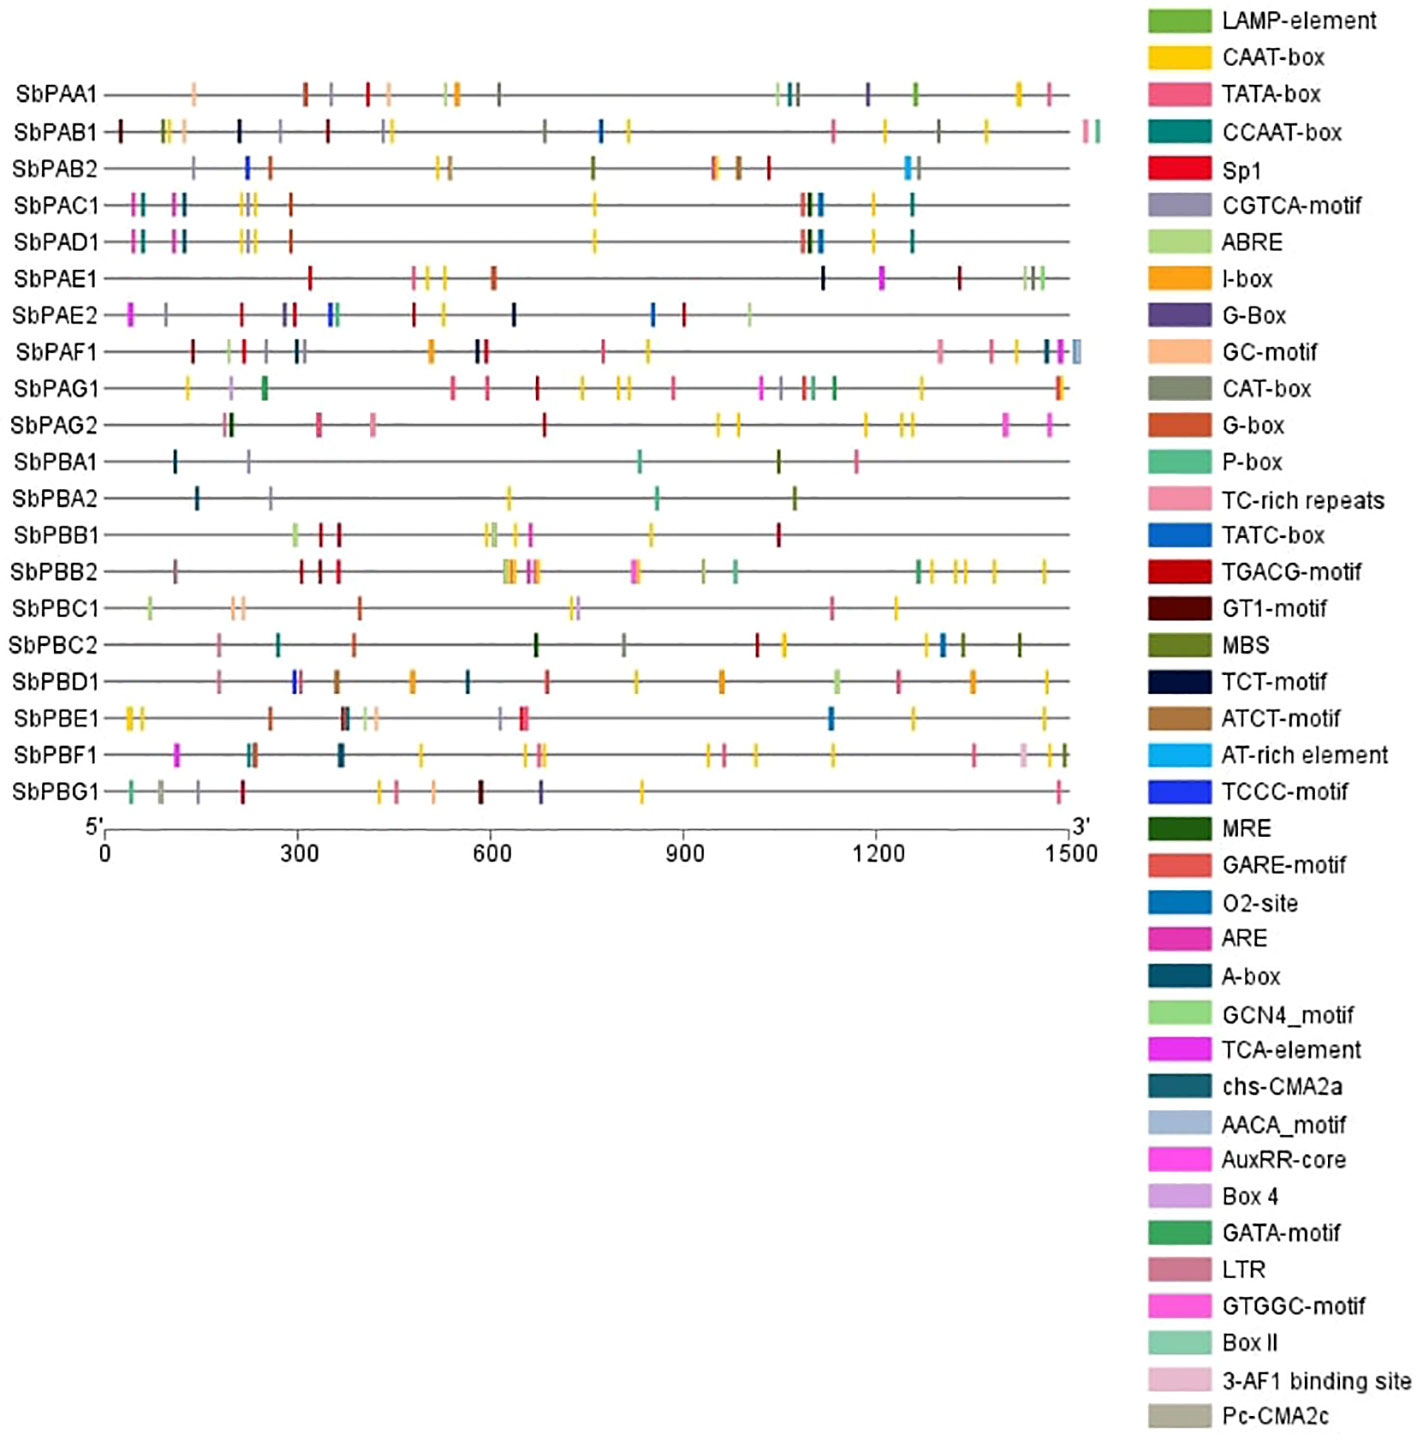
Figure 4 Promoter structure prediction in S. bicolor. Different colors depict the presence of identified cis regulatory elements.
3.1.5 miRNA target prediction
In the current investigation, we discovered 21 miRNAs that contained the SbPA and SbPB gene sequences. Only nine genes (six SbPA and three SbPB) were predicted to include the target locations for these miRNAs. Six miRNAs, the maximum number of target sites, were available for one gene (SbPBA1). The targets for SbPAC1 and SbPBC2 were available for three miRNAs. Similarly, the targets for SbPAB2, SbPAE1, and SbPAG2 were available for two miRNAs, and the targets for SbPAD1, SbPAE2, and SbPBC1 were available for one miRNA each. On numerous Sorghum chromosomes, various SbPA and SbPB genes served as the targets for the remaining 13 miRNAs (Table 2).
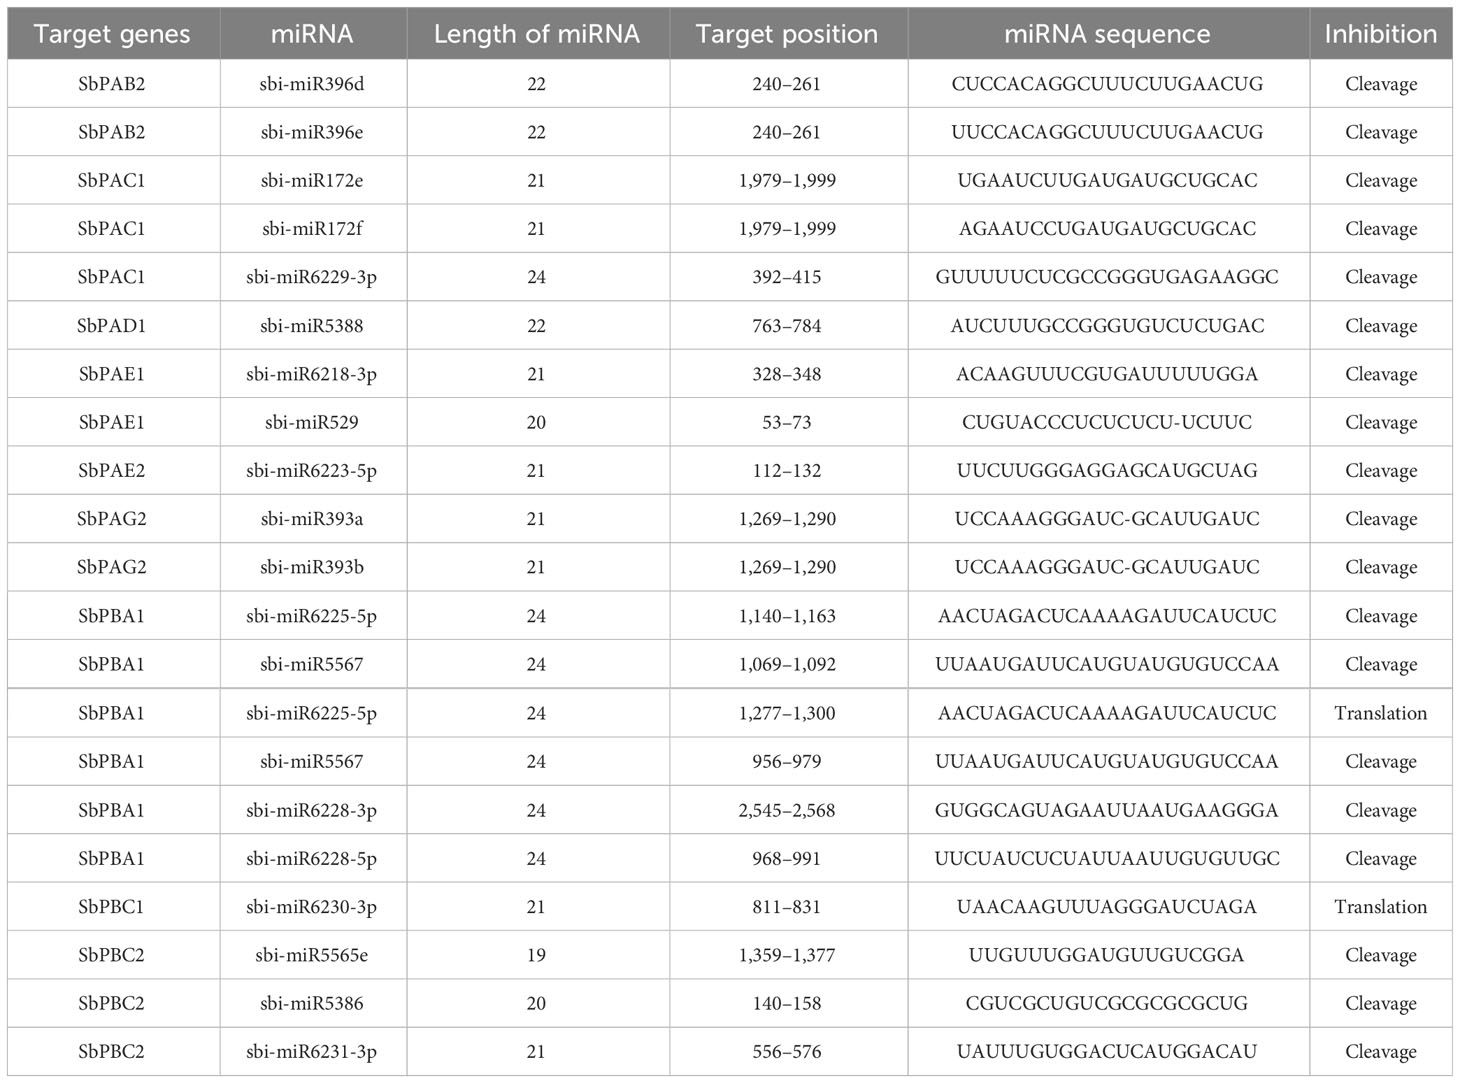
Table 2 Putative miRNAs involved in post-transcriptional regulation of 20S proteasomal genes in S. bicolor.
Most of the miRNAs suppressed the expression of genes with miRNA target sites through post-transcriptional cleavage while the two miRNAs (miR6225-5p and miR6230-3p) suppressed the gene expression through translational inhibition (Table 2).
3.2 Protein analysis
3.2.1 Physicochemical properties of SbPA and SbPB proteins
Twenty SbPA/SbPB proteins have an average of 242 amino acids (aa), ranging from 204 (SbPAG1, SbPBC1, and SbPBC2) to 280 (SbPBE1). There were identified α-subunits with a length of 204 to 280 aa and β-subunits with a length of 204 to 270 aa (Supplementary Table 5). SbPA and SbPB proteins were identified to have a molecular weight range of 22,375.5 kDa (SbPAG1) to 30,218 kDa (SbPBE1). The range of the isoelectric point (PI) was 4.72 to 8.26. While the remaining proteins (16) with greater aliphatic indexes (71.5 to 100.8) were stable, the unstable proteins (4) had aliphatic indexes ranging from 79.22 to 87.26. The protein solubility value was represented by the hydropathy’s overall average. Grand average of hydropathy (GRAVY) values ranged from −0.17 to −0.355, indicating that proteins are hydrophobic (Table 3). Because of this characteristic, proteins will fold correctly to maintain their stability and biological activity. The negative values of GRAVY indicates that proteins are non-polar and positive values of GRAVY indicate that proteins are polar. In S. bicolor, the peptides of 20S proteasome are rich in five amino acids (alanine, serine, glutamic acid, glycine, and leucine ranging from 8.93% to 12.22%). All these amino acids are involved in different biological functions in 20S proteasome (Supplementary Table 6). Five amino acids (arginine, phenylalanine, tyrosine, leucine, and glutamic acid) mainly provide catalytic sites for peptidase activity (Supplementary Table 10).
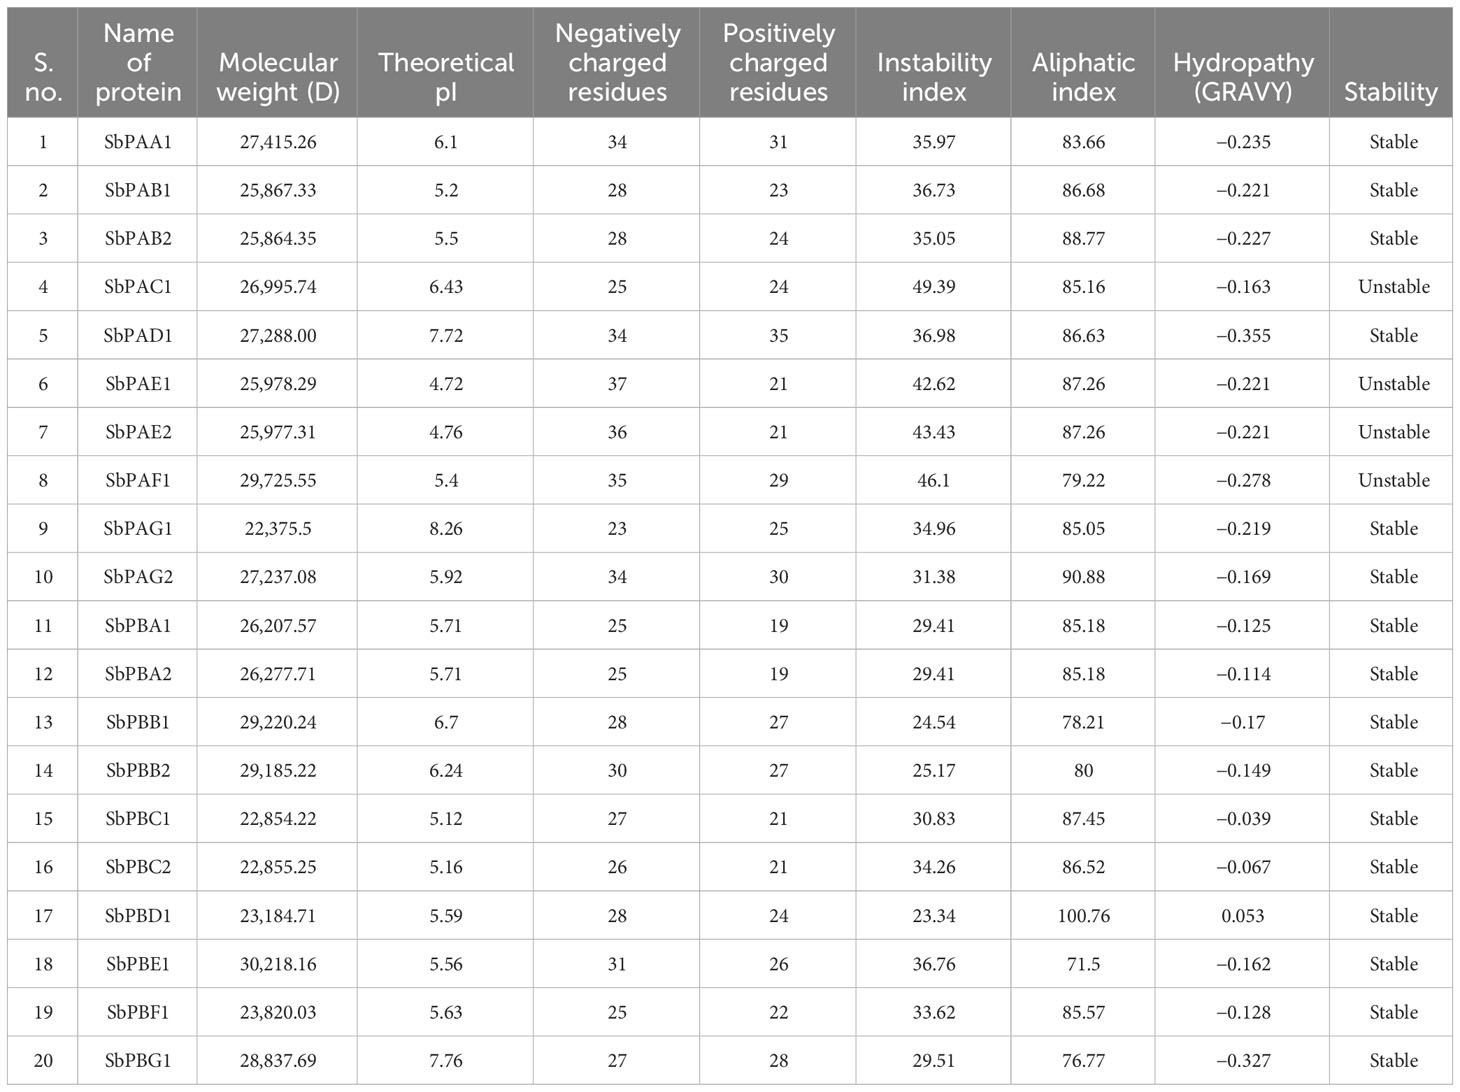
Table 3 Physicochemical properties of 20 SbPA/SbPB proteins associated with proteasomal degradation pathway.
3.2.2 Functional domains and motifs of SbPA and SbPB proteins
The logo of 10 distinct motifs and the associated amino acids identified in the protein sequences of SbPA and SbPB proteins were given (Supplementary Figure 4). In Supplementary Table 7, the specifics of these proteins’ sequences, e-values, and functions are listed. These 20 motifs available in the database were not previously documented in rice and Arabidopsis (Parmentier et al., 1997; Fu et al., 1998; Sassa et al., 2000).
Recently, Sharma et al. (2022) reported 20 motifs in wheat. Individual motifs ranged in length from 15 aa (motif 8) to 50 aa (motifs 7 and 9). In cellular protein catabolic processes, the roles of motifs 2, 3, 4, 5, and 7 have been linked to proteolysis (https://www.ebi.ac.uk/interpro/result/InterProScan/iprscan5-R20211209-091508-0331-1308065-p2m/). The remaining five motifs need to be molecularly characterized because they were found to be novel. SbPA and SbPB proteins are anticipated to be in the nucleus and cytoplasm, as previously found in research for eukaryotes (Fu et al., 1998). One distinct α-type (1-7) or β-type (1-7) domain is present in each of the 20 SbPA and SbPB proteins. Ten of these SbPA/SbPB proteins have a single α/β-type domain (Supplementary Table 5).
In species like yeast, Arabidopsis, and rice, similar data on the 20S proteasome for individual and subunit proteins have not been provided (Groll et al., 1997; Parmentier et al., 1997; Fu et al., 1998; Sassa et al., 2000).
3.2.3 Multiple sequence alignment and conserved amino acids
The OsPAE1 resembled 98.3% with SbPAE1 whereas OsPAF1 matched 89.55% with SbPAF1 (Supplementary Table 8). The OsPBC2 resembled 96.57% with SbPBC2 whereas OsPBE1 matched 83.33% with SbPBE1 (Supplementary Table 9). The similarity of all genes of S. bicolor with O. sativa was more than 80%. A high similarity of amino acids was observed between α- and β-subunits of S. bicolor and rice. A total of 5 aa of α-subunits and 8 aa of β-subunits were found to be highly conserved among S. bicolor and rice (Supplementary Figures 5A, B). These 5 (α-subunits) and 8 (β-subunits) residues also had the highest MI (Supplementary Figures 6, 7).
3.2.4 Subcellular localization and function
The proteasome complex includes the proteins SbPA and SbPB. These SbPA and SbPB proteins are found in the nucleus and cytoplasm These proteins may function in molecular processes such as response to zinc ions, proteasomal ubiquitin-independent protein metabolic processes, proteasome complex, proteasome core complex, proteasome core complex alpha-subunit complex, endopeptidase complex, and threonine-type endopeptidase activity, threonine-type peptidase activity, proteasome, peptidase complex, and response to metal ions, according to GO analysis and functional annotation (Supplementary Figure 8). We have performed protein–protein interaction network analysis to know the unknown functions of proteasomal proteins. We found 20 peptide nodes that correspond to number of gene sequences (Supplementary Figure 9). Based on the protein networks and their functional roles, we can say that the retrieved peptides show different types of functions such as ubiquitination, proteolysis, nitrogen metabolism, catabolic and anabolic processes, and endopeptidase and threonine peptidase activity (Supplementary Table 10).
3.2.5 Secondary and tertiary structures
The secondary structures of all the proteins were compared. The secondary structures were found to be dominated by the α-helix followed by random coils, extended β-strand and turns for all sequences. The random coils created the irregular structural areas that allow polypeptide chains to fold in a distinctive manner (Supplementary Table 11). The SbPA and SbPB proteins tend to form highly stable structures. Only six (30%) SbPA and SbPB proteins with similarities ranging from 29.81% to 54.98% to the matching rice template were selected to determine in silico 3D structures. For these 20 proteins, the Global Model Quality Estimation (GMQE) ranged from 0.73 to 0.82. A high-grade protein model is suggested by this. The Q-mean value varied between 0.74 ± 0.05 and 0.80 ± 0.06. The protein model and the reference (rice) proteins were similar to varying degrees (60.57%). The 3D–1D score (found using verify 3D) ranged from 78.22% to 97.12%, and the quality factor (calculated using ERRAT) ranged from 86.1878 to 97.8355. (Supplementary Table 12). The modeling of the three-dimensional structure of the proteins was performed by the modeling program Swiss-Model and the modeled structures are shown in Figure 5. PROCHECK server analysis of the modeled protein revealed a varied percentage of residues under the most favored (85%–97%), generously allowed (0.5%–1.4%), additionally allowed (2.9%–14.6%), and disallowed regions (0.4%–1.0%), indicating that the predicted models were of excellent geometry and were accepted for further analysis (Laskowski et al., 1993; Kumar et al., 2018; Batra et al., 2019). Out of these 20 proteasomal proteins, 15 proteins have over 90% of their amino acid residues in energetically favored regions (Supplementary Figure 10). These proteins’ predicted 3D architectures give researchers a starting point for deciphering their molecular functions.
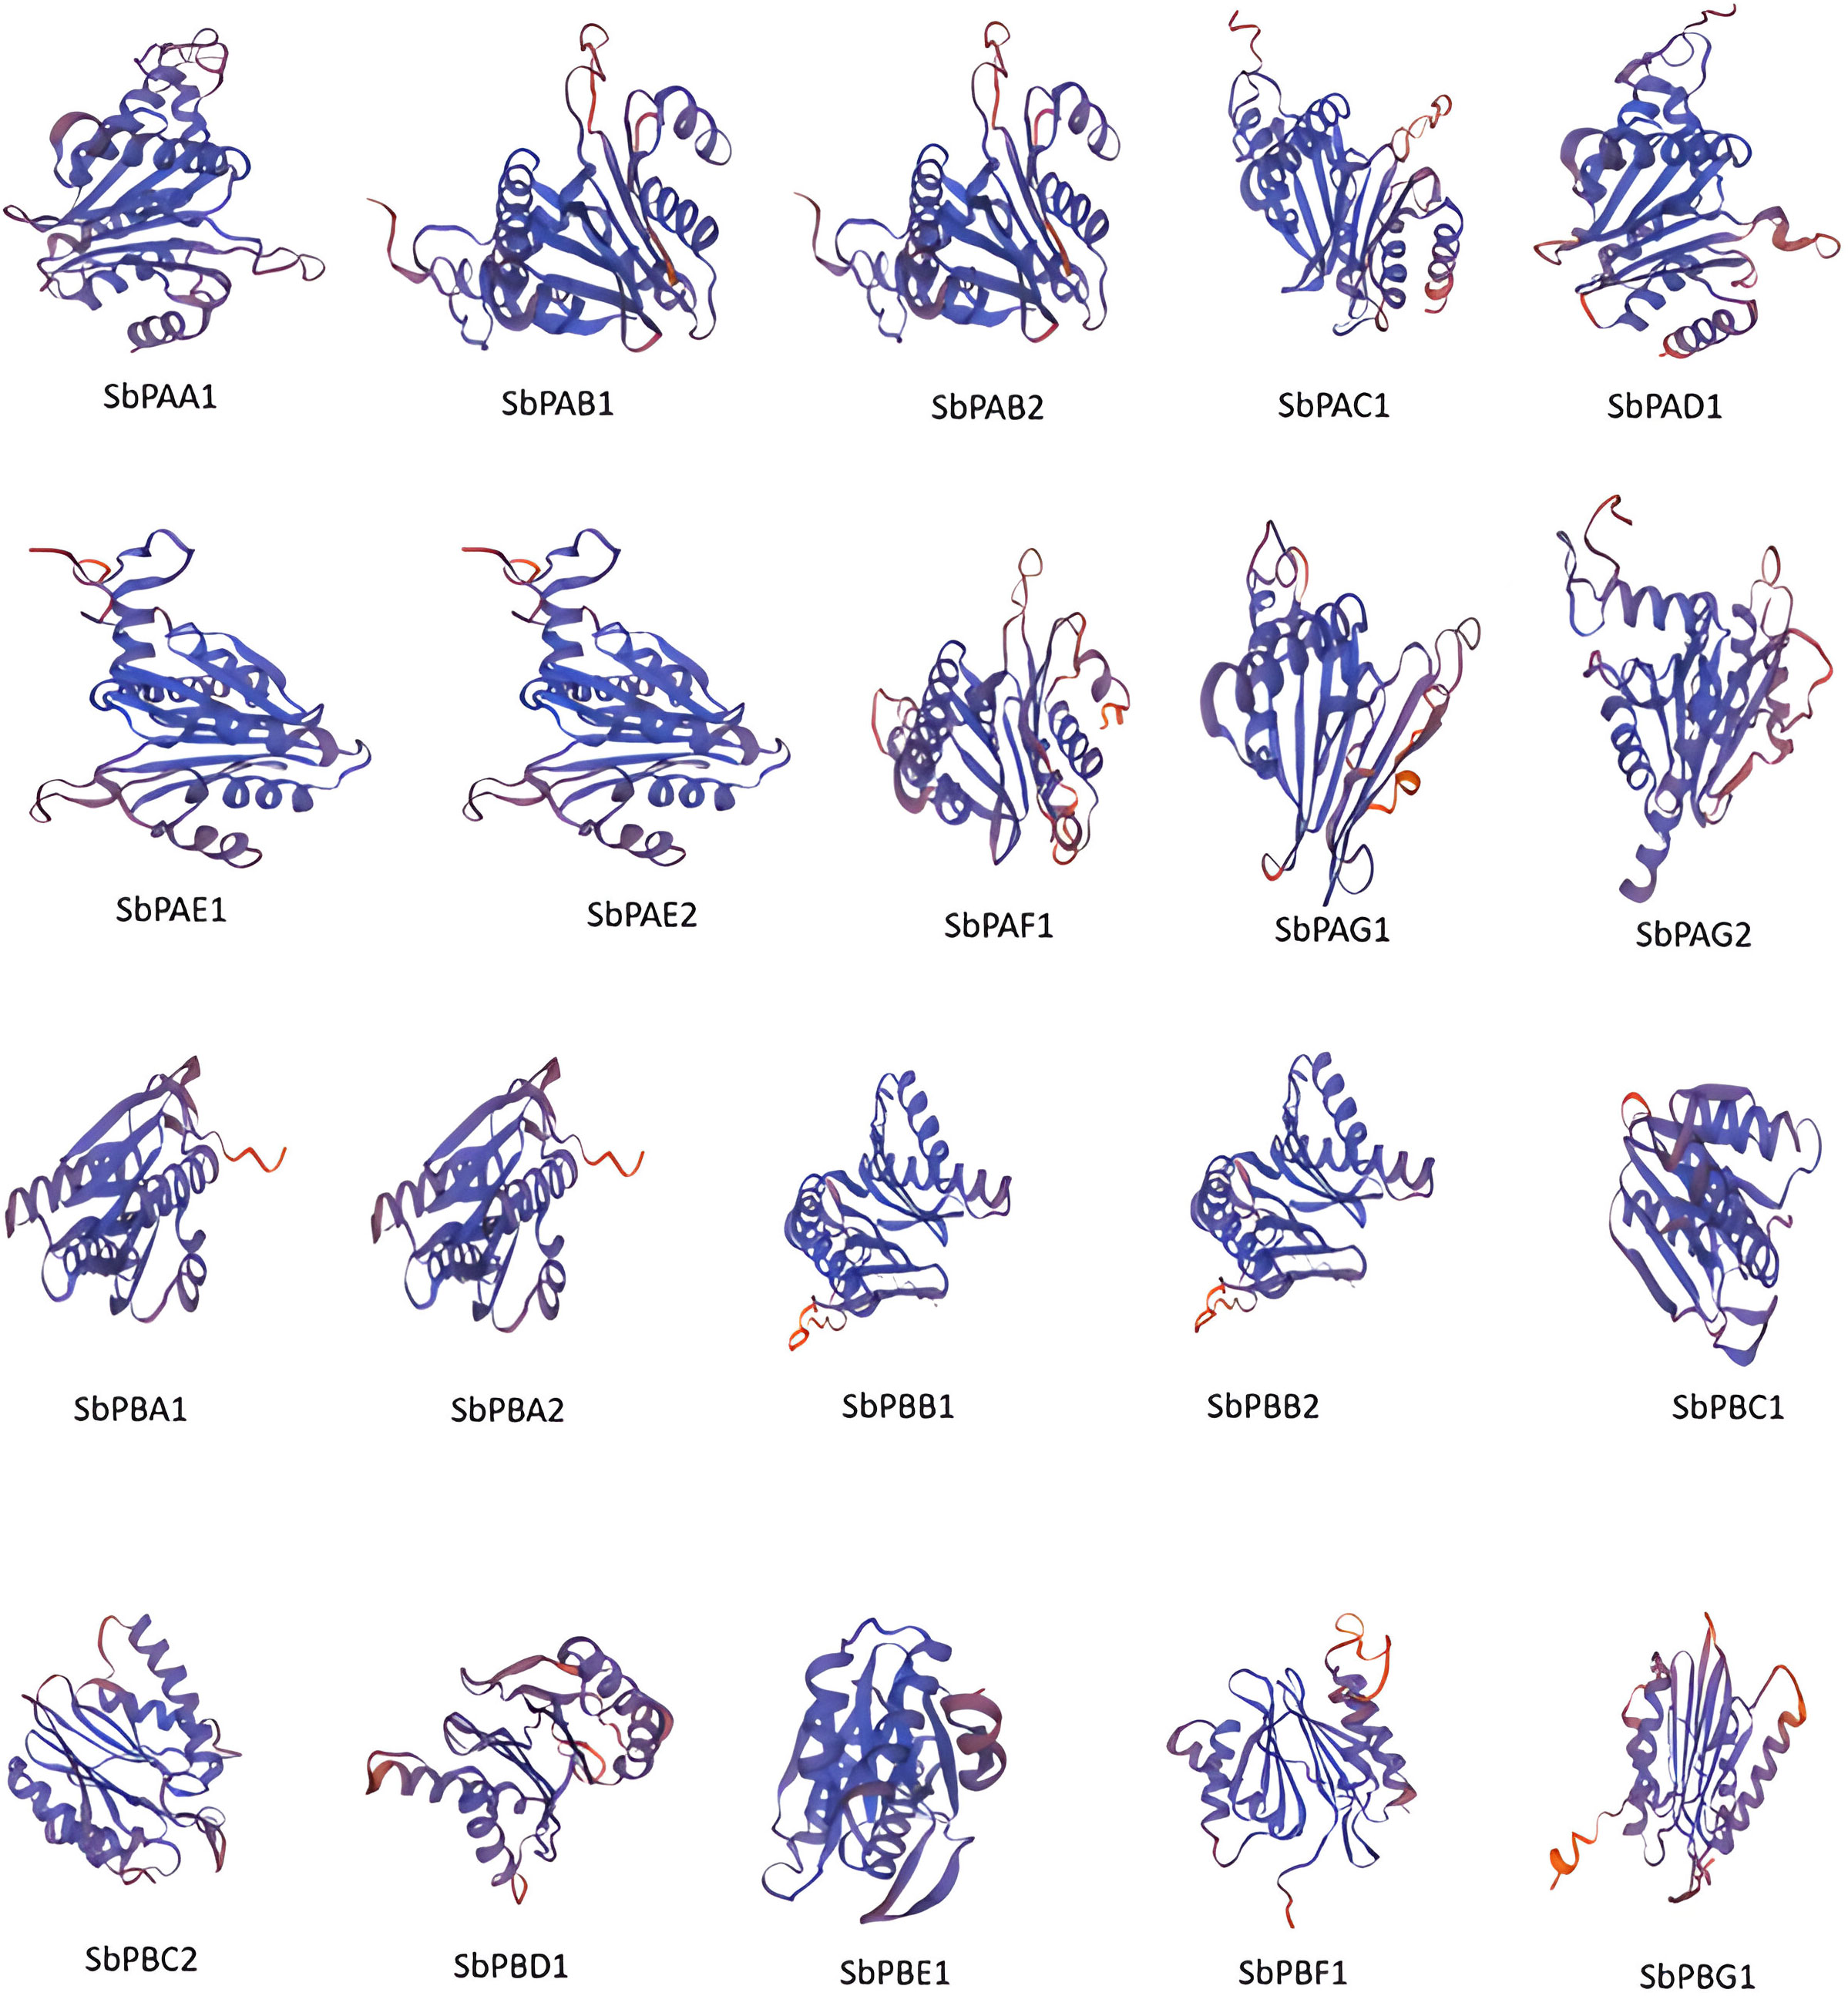
Figure 5 The 3D structures of 20 proteins encoded by SbPA and SbPB genes of 20S proteasome family in Sorghum bicolor. In all the 20 proteins, spirals represent helices, broad strips with arrowhead represent β-pleated sheets, and thin loops represent coil.
3.2.6 Alignment and functional annotation of 3D structures
The 3D protein structures of S. bicolor were superimposed (using the least amount of energy) onto the matching 3D protein structures of rice reference proteins (Supplementary Figure 11). Six proteins’ 3D structures (SbPAB2, SbPAG2, SbPBA1, SbPBA2, SbPBB1, and SbPAD1) exhibited 1.3% to 3.07% resemblance to the matching OsPAA1 protein’s 3D structure, with an RMSD of 0 Å (Supplementary Table 13).
3.3 Phylogenetic analysis
To create a phylogenetic tree, the amino acid sequences of S. bicolor and rice’s PA and PB subunits were used individually (Figure 6). Each of the phylogenetic trees consisting of seven specific clades was found (Figures 6A, B). Meme results showed that motifs 1, 2, 3, 4, 6, and 8 are most conserved in the alpha domain, whereas motifs 4, 3, and 2 are most conserved in the beta domain of proteasome. The conserved motifs and these clades were similar (Figure 2). The findings of seven clades in the present study may have numerous taxonomic applications (Fürstenberg-Hägg et al., 2013). It is interesting to note that seven clades in the phylogenetic tree were generated by the orthologs of three species that belong to distinct α- and β-subunits. A minimum of 7 and a maximum of 10 orthologs generated clades in the α-subunit tree. A minimum of 7 and a maximum of 13 orthologs generated clades in the β-subunit tree as well. Similar results were observed for rice, yeast, and Arabidopsis proteins (Fu et al., 1998; Sassa et al., 2000). These results revealed a higher degree of similarity between the α- and β-subunits of S. bicolor and the comparable subunits of rice. The results also suggested that 20S proteasome genes of S. bicolor are orthologous to rice genes.
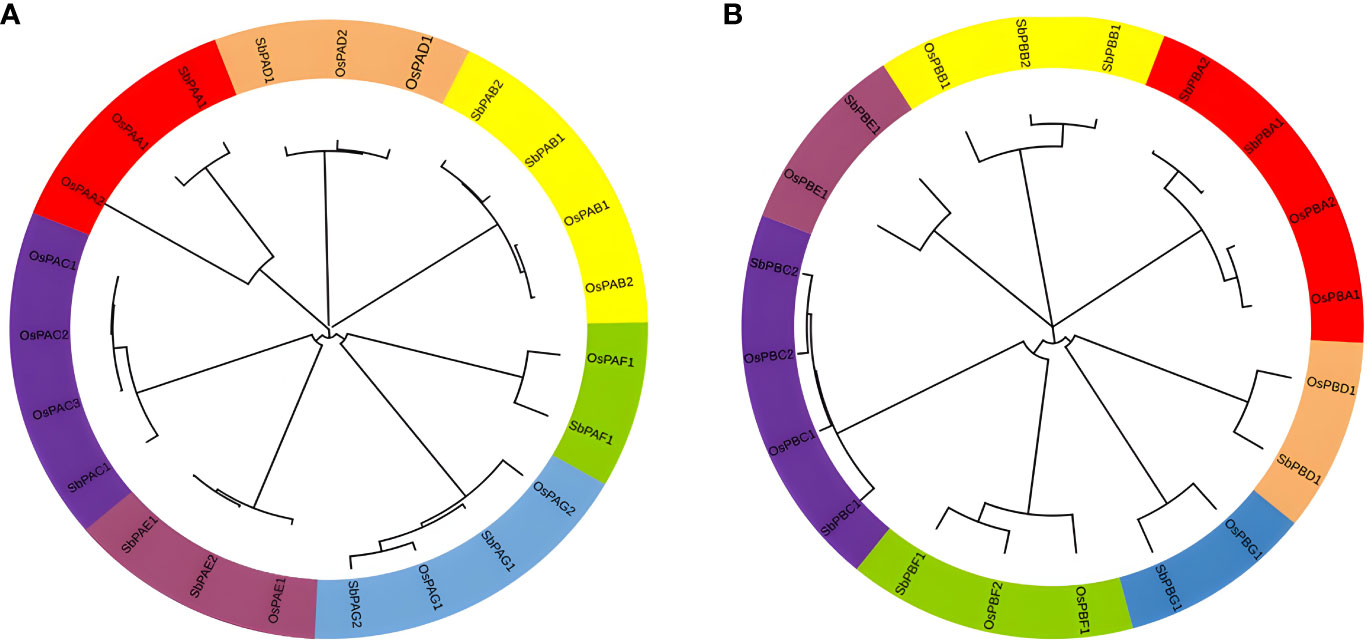
Figure 6 Phylogenetic tree constructed using protein sequences of (A) α-subunits and (B) β-subunits belonging to plant species, O. sativa and S. bicolor. Seven different colors in the tree represent seven different clades.
3.4 Differential gene expression pattern of 20S proteasome genes
Gene expression patterns under normal and stressful circumstances were studied. Under normal conditions, we examined tissue-specific and development-specific expression. We also observed cold, drought- and hormone responses under abiotic stress.
3.4.1 Tissue-specific expression
It was observed that different tissues (rhizome, shoot, inflorescence, seedling, and cell culture) showed variation in expression of 20S proteasomal genes. The rhizome showed the highest expression, which was then followed by the inflorescence, seedling, shoot, and cell culture (Figure 7A).
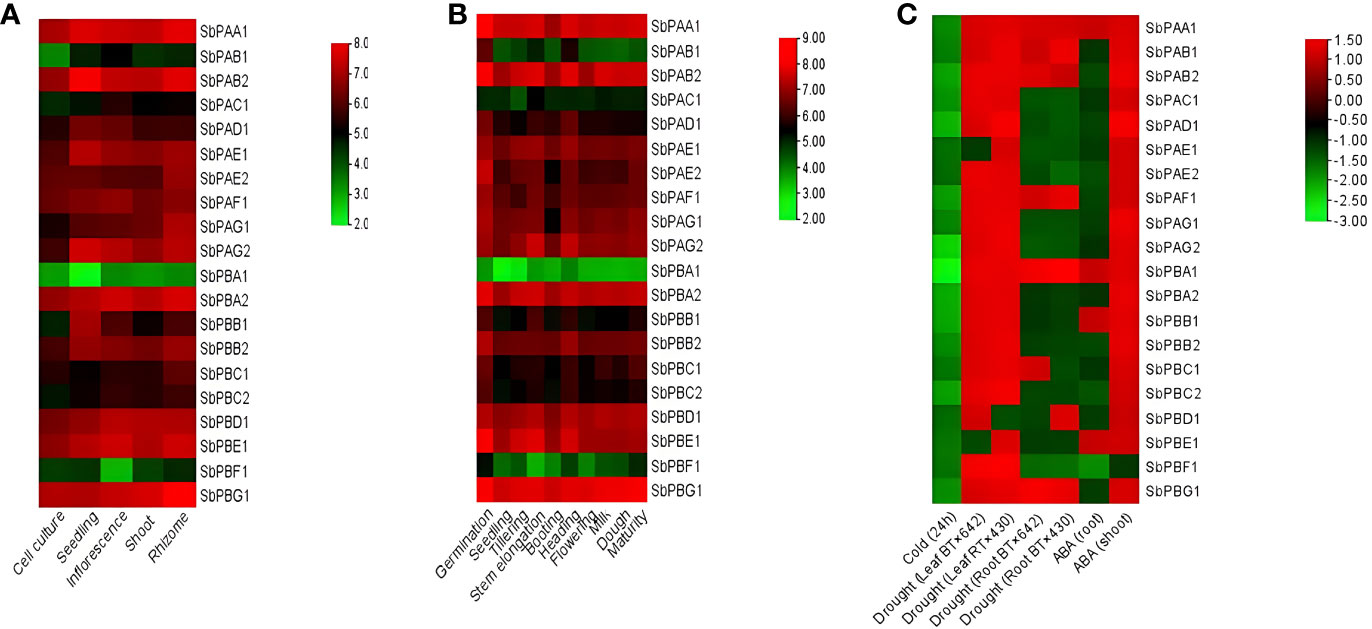
Figure 7 (A) Tissue-specific, (B) development-specific expression profile of SbPA and SbPB genes in S. bicolor under normal conditions, and (C) under abiotic stress. The expression data are represented in the form of fold values.
The expression analysis placed the 20 genes in three categories: (i) Higher expression: 16, 15, 14, 13, and 12 genes showed higher expression with six- to eightfold values in different organs, i.e., rhizome, inflorescence, seedling, shoot, and cell culture, respectively. (ii) Moderate expression: 4, 4, 3, 3, and 2 genes showed moderate expression with four- to sixfold values in different organs, i.e., seedling, shoot, inflorescence, cell culture, and rhizome, respectively. (iii) Lower expression: 5, 3, 2, 2, and 2 genes showed low expression with two- to fourfold values in different organs, i.e., cell culture, shoot, inflorescence, seedling, and rhizome, respectively (Figure 7A).
3.4.2 Differential gene expression during plant development
It was observed that various developmental stages (germination, seedling, tillering, stem elongation, booting, heading, flowering, milk, dough, and maturity stages) showed variation in expression of 20S proteasomal genes (Figure 7B).
The development-specific expression analysis placed the 20 genes in two categories of higher and medium expression. A total of 19 genes showed higher expression with four- to eightfold values in different stages (germination, seedling, tillering, stem elongation, booting, heading, flowering, milk, dough, and maturity stages). Only one gene (SbPBA1) showed medium expression with zero- to fourfold values in different stages (germination, seedling, tillering, stem elongation, booting, heading, flowering, milk, dough, and maturity stages) (Figure 7B).
3.4.3 Gene expression under abiotic stresses
3.4.3.1 Cold stress
In cold stress, all genes were found to be downregulated. At 24 h, one gene (SbPBA1) showed higher expression, i.e., −2.80, one gene (SbPAG2) showed high to medium expression, i.e., −2.20 to −2.60, and five genes (SbPAB2, SbPAD1, SbPBA2, SbPBB1, and SbPBC2) showed medium expression, i.e., −2.0 to −2.20. In the same interval, all the remaining genes showed their expression in the range of −1.40 to −1.80, i.e., very poor expression. (Figure 7C).
3.4.3.2 Drought stress
Under drought stress, two samples of each leaf (BT×642 and RT×430) and root (BT×642 and RT×430) were studied at pre-flowering stage for expression of 20S proteasome genes. The expression results showed downregulation (0.0 to −1.50-fold) of two genes (SbPAE1 and SbPBE1) and one gene (SbPBD1) in BT x 642 and RT x 430 leaf samples, respectively. The remaining genes showed upregulation (0.0- to 1.50-fold) in their expression in both leaf samples. However, seven genes were found to be upregulated in each BT x 642 (SbPAA1, SbPAB1, SbPAF1, SbPBC1, SbPAB2, SbPBA1, and SbPBG1) and RT x 430 (SbPAA1, SbPAB1, SbPAF1, SbPBD1, SbPAB2, SbPBA1, and SbPBG1) root sample and their expression ranged from 0.0 to 1.50. All the remaining genes were found to be downregulated with an expression range of 0.0 to −2.0 in both root samples (Figure 7C).
3.4.3.3 Hormone stress
Under abscisic acid (ABA) stress, 19 genes whose expression ranged from 0.0 to 1.50 were found upregulated, and one gene (SbPBF1) was found downregulated (0.0 to −2.0) in shoots. In roots, four genes (SbPAA1, SbPBA1, SbPBB1, and SbPBE1) whose expression ranged from 0.0 to 1.50 were upregulated and all the remaining genes showed downregulation (0.0 to −2.0) (Figure 7C).
The qRT-PCR analysis of candidate genes (SbPBA1, SbPAA1, SbPBG1, SbPBE1, and SbPAG1) was performed using gene-specific primers, listed in Supplementary Table 14. The genes showed similarity with in silico results. An increased expression of SbPBA1 gene under drought and ABA treatments was found, i.e., 1.32- and 1.12-fold in leaves and 1.58- and 1.55-fold in roots, as compared to the control conditions. SbPBE1 gene was found upregulated only under ABA stress in both leaf (1.45-fold) and root (1.6-fold) tissues. Downregulation of this gene was found under cold and drought stress. An upregulation in expression of SbPAG1 under drought (1.43-fold) and ABA (1.67-fold) stress in leaf tissues but not in roots was also observed. An increased expression of SbPAA1 gene under drought and ABA treatments was also found, i.e., 5.17- and 4.78-fold in leaves and 4.69- and 4.12-fold in roots, as compared to the control conditions. In leaves, under drought and ABA stress, SbPBG1 showed increased expression of 4.02- to 4.87-fold. These five genes studied for qRT-PCR expression showed their downregulation under cold treatment (Figure 8).
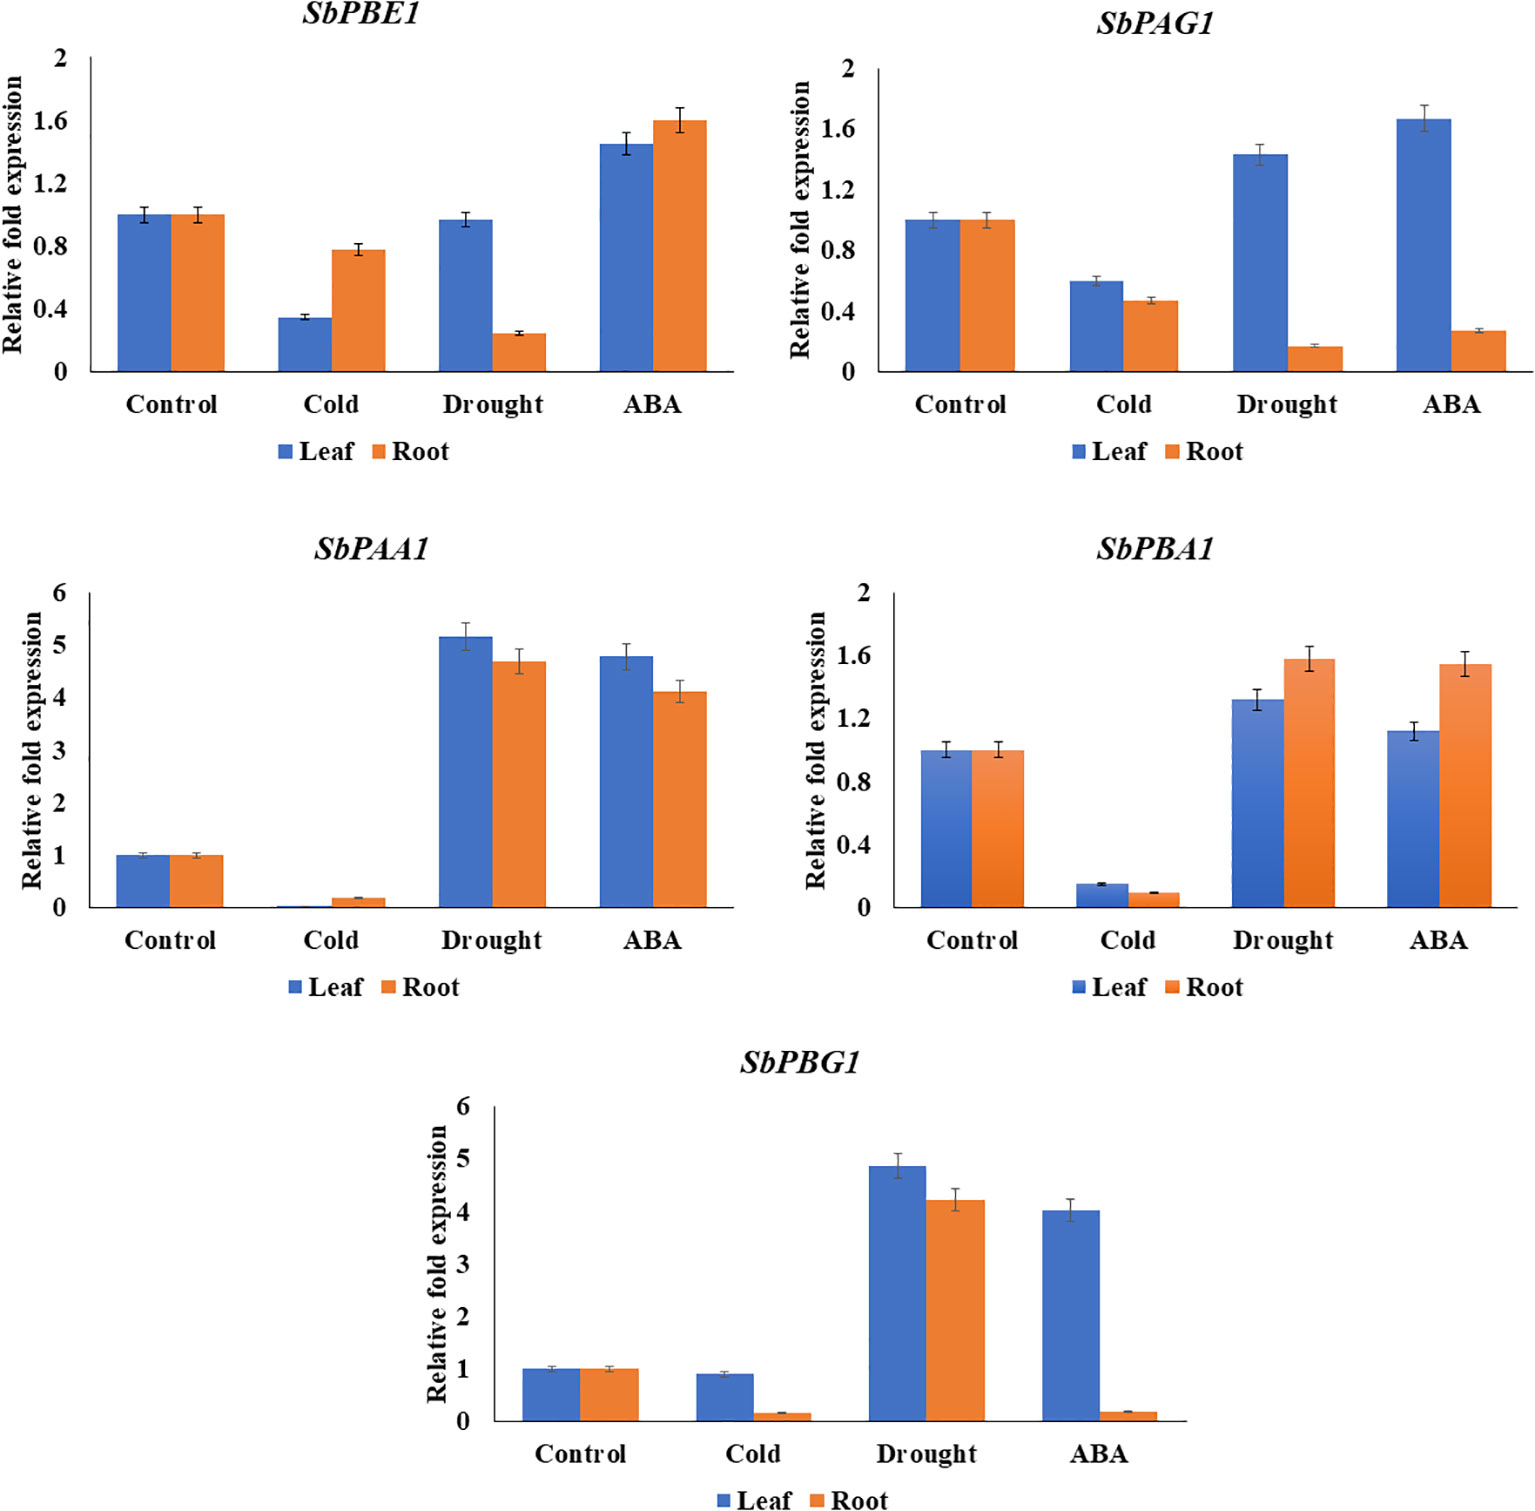
Figure 8 qRT-PCR expression levels of SbPBA1, SbPBE1, SbPBG1, SbPAA1, and SbPAG1 genes under abiotic stresses (cold, drought, and ABA hormone) in S. bicolor.
4 Discussion
The present investigation revealed 20 proteasomal genes in S. bicolor. These genes were organized into seven different α and seven different β types of 20S proteasome family. In the majority of the SbPA and SbPB genes the structural pattern of exon and intron was found to be similar, although in some cases, this similarity pattern deviates. This deviation may be due to loss or gain of intron during gene evolution (Rogozin et al., 2003; Yu et al., 2019). In cDNA sequences, major differences can be due to size and number of introns present in SbPA and SbPB genes. Moreover, differences in the length of cDNA sequences may be due to variation in the length of UTRs present on the borders of cDNA. The phylogenomic analysis of 20 genes revealed that there are seven clades of each α (SbPAA-SbPAG) and β (SbPBA-SbPBG). An uneven distribution of SbPA and SbPB genes on 10 chromosomes and this may be due to gene duplication or gene loss (Li et al., 2015; Clavijo et al., 2017; Yu et al., 2019). Gene duplication is a random and frequent process/event that occurs by either tandem or block duplication mechanisms. The duplication events are helpful in understanding the expansion mechanism of 20S proteasomal family genes. Eleven (55%) of the 20 genes included a total of 22 SSRs. This suggests that only a small fraction of the genes in a gene family include SSRs. The structural and functional characteristics of SSR have been identified in a large number of genes (Gupta and Rustgi, 2004; Li et al., 2004; Varshney et al., 2005). In Sorghum, the simple sequence repeats (SSRs) were mapped by Taramino et al. (1997). The SSRs found in the genes encoding the 20S proteasome’s α- and β-subunits can be exploited to provide useful/functional markers for marker-assisted selection. These biomarkers can be employed to increase plant system tolerance to biotic and abiotic challenges. The lack of transposable and retro elements in the genes under investigation implied that the 20S proteasome family is not expressed in S. bicolor. Promoter analysis revealed that there are a wide range of cis regulatory elements that mediate transcriptional regulation of 20S proteasomal genes. The investigation employed the 1,500-bp 5’ upstream of the promoter sequence. The development and stress response in Sorghum were found to be regulated by the consensus cis regulatory elements that were found to span the promoter of 20 proteasomal genes. A typical cis-acting element in promoter and enhancer regions is the CAAT-box. All families of transcription factors included it. Low-temperature responsiveness (LTR), drought responsiveness (MBS), and defense and stress responsiveness (TC rich repeats) are the recognized stress-related motifs. Similar to this, light responsiveness (LAMP element, MRE, TCT-motif, TCCC-motif, I-box, Sp1, GT1-motif, GTGGC-motif, GATA-motif, Box 4, Box II, ATCT-motif, PcCMA2c, chsCMA2a) and zein metabolism (O2 site) are development-related characteristics. Auxin responsiveness (AuxRR-core), abscisic acid responsiveness (ABRE), ethylene responsiveness, GA3 response (G-box, P-box, GARE-motif, and TATC-box), salicylic acid responsiveness (TCA element), and MeJA responsiveness are a few more hormone-responsive motifs that have been discovered (CGTCA and TGACG motifs). Small non-coding RNAs called miRNAs play regulatory roles in cells at the post-transcriptional and translational levels. These cause result gene targets to deteriorate (Budak and Zhang, 2017). Upon induction, the microRNA sbi-miR396d induced drought tolerance in Arabidopsis by targeting growth-regulating factors coordinating cell division and differentiation that impact leaf development and orientation (Jones-Rhoades and Bartel, 2004).
Digital expression analysis of the 20S proteasome genes in plant systems was previously studied (Fu et al., 1998; Li et al., 2015). Many biological processes, including plant development and reactions to various biotic and abiotic stressors, include 20S proteasome genes (Xu and Xue, 2019). These actions are a result of impulses from various signaling molecules that control plant growth under various stress conditions (Livneh et al., 2016). Numerous indications point to the possibility that hormone signals have an impact on the 20S proteasome gene’s expression (Kurepa et al., 2009). A number of genes contributing biotic and abiotic stress tolerance have been identified by studying UPS genetics in different crops, for example, TaFBA1’s role in heat tolerance (Li et al., 2018), the role of heat shock proteins in the breakdown of toxic and misfolded proteins (Awasthi and Wagner, 2005), and its participation in a number of human disorders (Bozaykut et al., 2020). This is the first investigation on the expression of 20S proteasome genes in S. bicolor under both normal and stressful circumstances. A publicly accessible transcriptome database was used for this.
Hoffmann and Rooney (2019) noted that the production of sorghum is impacted by both abiotic [drought, temperature (heat or cold), and soil fertility and/or composition (specifically soil pH, micronutrients, or fertility)] and biotic {insects like the sugarcane aphid (Melanaphis sacchari) and plant pathogens like stalk rot (Macrophomina phaseolina), head worm [Helicoverpa zea (Boddie)], midge [Contarinla sorghicola (Coquillett)], and green bug [Schizaphis graminum (Rondani)]}. Roozeboom and Prasad (2019) reported that Sorghum is a remarkably resilient plant, with the ability to compensate environmental stresses, insecticidal diseases, and nutrient availability. In comparison to wild types (with bloom phenotype), Jenks et al. (1994) discovered that leaves of a bloomless Sorghum mutant with thinner cuticles were more vulnerable to the fungi Exserohilum turcicum (Pass.) and Puccinia purpurea (eke) in the field. According to Burow et al. (2007), the bloom gene may significantly contribute to Sorghum’s overall drought resistance. The upregulation of SbPBA1, SbPAA1, SbPBG1, SbPBE1, and SbPAG1 under ABA and drought stress provide an insight into its involvement in abiotic stress. No expression was observed for cold stress of these genes indicating their non-involvement (Figure 8). Transcript levels of Glycine max UBC2 (GmUBC2) and Arabidopsis UBC32 (AtUBC32) are upregulated in response to drought and/or salt stress (Zhou et al., 2010; Wan et al., 2011; Cui et al., 2012). Transgenic Arabidopsis plants overexpressing Vigna radiata UBC1 (VrUBC1), AhUBC2, or GmUBC2 are more tolerant to drought stress (Zhou et al., 2010; Wan et al., 2011; Chung et al., 2013). In plants, UPS components contribute to ABA-dependent responses to abiotic stresses by regulating ABA biosynthesis (through XERICO and PUB44) and ABA signaling (through ABA receptors PYL/PYR/RCAR, suppressors PP2C and transcription factors ABFs/ABIs) (Xu and Xue, 2019). According to a recent study, the deletion of PBE1, a β5 subunit, had a significant impact on how proteasomes assembled when subjected to salt stress (Han et al., 2019), proving that PBE1 is necessary for complete proteasome assembly. Additionally, PBE1 was discovered to reduce the transcription factor ABI5’s protein accumulating activity, altering ABA-mediated salt stress signaling in plants (Han et al., 2019). The function of these above-mentioned genes that show differential expression may be planned for future studies in different breeding programs in order to develop sorghum cultivar resistant to various stresses.
The ubiquitin/20S proteasome system (UPS), which works after external stimuli, allows plants to modify their proteomes in response to their environment in order to develop and survive. Only a few genes and their functions have been fully understood to date out of the many genes that encode UPS components. It will be easier to understand the molecular regulatory mechanisms that underlie plant responses to environmental stimuli at the protein level with further identification of distinct substrates of proteasomal subunits and proteasome regulators, which will also help to provide practical strategies to increase crop tolerance to both biotic and abiotic stresses. Homologous or heterologous gene expression-based genetic engineering can produce genotypes that perform better under environmental stress (Han et al., 2019). It may be attempted to boost stress tolerance in crops including rice, maize, sorghum, and wheat by overexpressing particular UPS components that act as positive regulators of various types of stress tolerance.
5 Conclusion
In the current study, the 10 SbPA and 10 SbPB genes of the 20S proteasome were discovered which serves as genetic tools for functional analysis of 20S proteasome in S. bicolor. Orthology of SbPA and SbPB genes with rice was inferred and identified. The proteins that the SbPA and SbPB genes encode have a full-length 3D model and are capable of imparting distinct proteolytic and biological functions to the 20S complex. Under typical abiotic stress, it was discovered that various S. bicolor organs expressed a number of SbPA and SbPB genes. In response to abiotic stressors and in the development of many plant organs, the 20S proteasome gene is crucial. In this approach, the current study offers a wealth of knowledge that can be applied to the creation of S. bicolor cultivars that are climatically adaptable.
Data availability statement
The original contributions presented in the study are included in the article/Supplementary Material, further inquiries can be directed to the corresponding author.
Author contributions
VM: Investigation, Software, Supervision, Writing – original draft, Writing – review & editing. FI: Formal Analysis, Software, Writing – original draft. YS: Conceptualization, Data curation, Formal Analysis, Software, Validation, Writing – original draft, Writing – review & editing. VK: Data curation, Formal Analysis, Methodology, Software, Writing – original draft, Writing – review & editing. PM: Data curation, Formal Analysis, Methodology, Software, Writing – review & editing. PB: Conceptualization, Data curation, Formal Analysis, Methodology, Software, Writing – original draft, Writing – review & editing. KS: Conceptualization, Investigation, Project administration, Software, Supervision, Writing – review & editing. RM: Conceptualization, Formal Analysis, Investigation, Project administration, Supervision, Writing – review & editing. AH: Data curation, Formal Analysis, Funding acquisition, Methodology, Software, Writing – review & editing. GA-Q: Data curation, Formal Analysis, Funding acquisition, Methodology, Project administration, Software, Supervision, Writing – review & editing. EA: Data curation, Funding acquisition, Methodology, Software, Writing – review & editing. UK: Conceptualization, Data curation, Formal Analysis, Investigation, Methodology, Project administration, Software, Supervision, Validation, Writing – original draft, Writing – review & editing.
Funding
The author(s) declare that financial support was received for the research, authorship, and/or publication of this article. The authors are grateful to the UP state government [letter number 80/2021/1543 (1) sattar-4-2021-4(28)/10/8/2021] for providing fund for this research work. The authors would like to extend their sincere appreciation to the researchers supporting project number RSP2023R134, King Saud University, Riyadh, Saudi Arabia.
Conflict of interest
The authors declare that the research was conducted in the absence of any commercial or financial relationships that could be construed as a potential conflict of interest.
Publisher’s note
All claims expressed in this article are solely those of the authors and do not necessarily represent those of their affiliated organizations, or those of the publisher, the editors and the reviewers. Any product that may be evaluated in this article, or claim that may be made by its manufacturer, is not guaranteed or endorsed by the publisher.
Supplementary material
The Supplementary Material for this article can be found online at: https://www.frontiersin.org/articles/10.3389/fpls.2023.1287950/full#supplementary-material
Abbreviations
Ub, Ubiquitin; UPS, Ubiquitin–proteasome system; CDS, Coding sequences; CDD, Conserved domain database; MSA, Multiple sequence alignment; Aa, Amino acids; MiRNA, microRNA; ABA, Abscisic acid; UTR, Untranslated region; SSRs, Simple sequence repeats; MI, Mutual information; PI, Isoelectric point; GRAVY, Grand average of hydropathy; GMQE, Global Model Quality Estimation.
References
Awasthi, N., Wagner, B. J. (2005). Upregulation of heat shock protein expression by proteasome inhibition: an antiapoptotic mechanism in the lens. Invest. Ophthalmol. Visual Sci. 46 (6), 2082–2091. doi: 10.1167/iovs.05-0002
Bailey, T. L., Boden, M., Buske, F. A., Frith, M., Grant, C. E., Clementi, L., et al. (2009). MEME SUITE: tools for motif discovery and searching. Nucleic Acids Res. 37, 202–208. doi: 10.1093/nar/gkp335
Batra, R., Agarwal, P., Tyagi, S., Saini, D. K., Kumar, V., Kumar, A., et al. (2019). A study of CCD8 genes/proteins in seven monocots and eight dicots. PloS One 14 (3), e0213531. doi: 10.1371/journal.pone.0213531
Bozaykut, P., Sozen, E., Kaga, E., Ece, A., Ozaltin, E., Bergquist, J., et al. (2020). HSP70 inhibition leads to the activation of proteasomal system under mild hyperthermia conditions in young and senescent fibroblasts. Oxid. Med. Cell. longevity 2020, 1–10. doi: 10.1155/2020/9369524
Budak, H., Zhang, B. (2017). MicroRNAs in model and complex organisms. Funct. Integr. Genomics 17 (2), 121–124. doi: 10.1007/s10142-017-0544-1
Burow, G., Franks, C., Payton, P., Xin, Z. (2007). Genetic Mapping and Characterization of an Epicuticular Wax (Bloom) Gene, Sb Bl, in Sorghum bicolor L. (Moench) (Soils and Environment, New Orleans, Louisiana: International Annual Meetings on A Century of Integrating Crops).
Cai, Y. M., Yu, J., Ge, Y., Mironov, A., Gallois, P. (2018). Two proteases with caspase-3-like activity, cathepsin B and proteasome, antagonistically control ER-stress-induced programmed cell death in Arabidopsis. New Phytol. 218 (3), 1143–1155. doi: 10.1111/nph.14676
Chen, N. (2004). Using Repeat Masker to identify repetitive elements in genomic sequences. Curr. Protoc. Bioinf. 5 (1), 4–10. doi: 10.1002/0471250953.bi0410s05
Chen, S., Jia, H., Wang, X., Shi, C., Wang, X., Ma, P., et al. (2020). Hydrogen sulfide positively regulates abscisic acid signaling through persulfidation of SnRK2. 6 in guard cells. Mol. Plant 13, 732–744. doi: 10.1016/j.molp.2020.01.004
Chow, C.-N., Zheng, H.-Q., Wu, N.-Y., Chien, C.-H., Huang, H.-D., Lee, T.-Y., et al. (2016). PlantPAN 2.0: an update of plant promoter analysis navigator for reconstructing transcriptional regulatory networks in plants. Nucleic Acids Res. 44, 1154–1160. doi: 10.1093/nar/gkv1035
Chung, E., Cho, C. W., So, H. A., Kang, J. S., Chung, Y. S., Lee, J. H. (2013). Overexpression of VrUBC1, a mung bean E2 ubiquitin-conjugating enzyme, enhances osmotic stress tolerance in Arabidopsis. PloS One 8, e66056. doi: 10.1371/journal.pone.0066056
Clavijo, B. J., Venturini, L., Schudoma, C., Accinelli, G. G., Kaithakottil, G., Wright, J., et al. (2017). An improved assembly and annotation of the allohexaploid wheat genome identifies complete families of agronomic genes and provides genomic evidence for chromosomal translocations. Genome Res. 27 (5), 885–896. doi: 10.1101/gr.217117.116
Cui, F., Liu, L., Zhao, Q., Zhang, Z., Li, Q., Lin, B., et al. (2012). Arabidopsis ubiquitin conjugase UBC32 is an ERAD component that functions in brassinosteroid-mediated salt stress tolerance. Plant Cell 24, 233–244. doi: 10.1105/tpc.111.093062
Dai, X., Zhuang, Z., Zhao, P. X. (2018). psRNATarget: a plant small RNA target analysis server. Nucleic Acids Res. 46, 49–54. doi: 10.1093/nar/gky316
Dhankher, O. P., Foyer, C. H. (2018). Climate resilient crops for improving global food security and safety. Plant Cell Environ. 41 (5), 877–884. doi: 10.1111/pce.13207
Dielen, A. S., Sassaki, F. T., Walter, J., Michon, T., Menard, G., Pagny, G., et al. (2011). The 20S proteasome α5 subunit of Arabidopsis thaliana carries an RNase activity and interacts in planta with the lettuce mosaic potyvirus HcPro protein. Mol. Plant Pathol. 12 (2), 137–150. doi: 10.1111/j.1364-3703.2010.00654.x
Eisenberg, D., Lüthy, R., Bowie, J. U. (1997). [20] VERIFY3D: assessment of protein models with three-dimensional profiles. Methods enzymology 277, 396–404). doi: 10.1016/S0076-6879(97)77022-8
Finley, D. (2009). Recognition and processing of ubiquitin-protein conjugates by the proteasome. Annu. Rev. Biochem. 78, 477–513. doi: 10.1146/annurev.biochem.78.081507.101607
Fu, H., Doelling, J. H., Arendt, C. S., Hochstrasser, M., Vierstra, R. D. (1998). Molecular organization of the 20S proteasome gene family from Arabidopsis thaliana. Genetics 149 (2), 677–692. doi: 10.1093/genetics/149.2.677
Fürstenberg-Hägg, J., Zagrobelny, M., Bak, S. (2013). Plant defense against insect herbivores. Int. J. Mol. Sci. 14 (5), 10242–10297. doi: 10.3390/ijms140510242
Ge, S. X., Jung, D., Yao, R. (2020). ShinyGO: a graphical gene-set enrichment tool for animals and plants. Bioinformatics 36, 2628–2629. doi: 10.1093/bioinformatics/btz931
Geourjon, C., Deleage, G. (1995). SOPMA: significant improvements in protein secondary structure prediction by consensus prediction from multiple alignments. Bioinformatics 11 (6), 681–684. doi: 10.1093/bioinformatics/11.6.681
Glickman, M. H., Ciechanover, A. (2002). The ubiquitin-proteasome proteolytic pathway: destruction for the sake of construction. Physiol. Rev. 82, 373–428. doi: 10.1152/physrev.00027.2001
Groll, M., Ditzel, L., Löwe, J., Stock, D., Bochtler, M., Bartunik, H. D., et al. (1997). Structure of 20S proteasome from yeast at 2.4 Å resolution. Nature 386 (6624), 463–471. doi: 10.1038/386463a0
Gupta, P. K., Rustgi, S. (2004). Molecular markers from the transcribed/expressed region of the genome in higher plants. Funct. Integr. Genomics 4 (3), 139–162. doi: 10.1007/s10142-004-0107-0
Han, J. J., Yang, X., Wang, Q., Tang, L., Yu, F., Huang, X., et al. (2019). The β5 subunit is essential for intact 26S proteasome assembly to specifically promote plant autotrophic growth under salt stress. New Phytol. 221 (3), 1359–1368. doi: 10.1111/nph.15471
Hoffmann, L., Jr., Rooney, W. L. (2019). Sorghum improvement for yield. Sorghum: A State Art Future Perspetives 58, 31–46. doi: 10.2134/agronmonogr58.c2
Hruz, T., Laule, O., Szabo, G., Wessendorp, F., Bleuler, S., Oertle, L., et al. (2008). Genevestigator v3: a reference expression database for the metaanalysis of transcriptomes. Adv. Bioinf. 3, 1–5. doi: 10.1155/2008/420747
Hu, B., Jin, J., Guo, A. Y., Zhang, H., Luo, J., Gao, G. (2015). GSDS 2.0: an upgraded gene feature visualization server. Bioinformatics 31, 1296–1297. doi: 10.1093/bioinformatics/btu817
Jenks, M. A., Joly, R. J., Peters, P. J., Rich, P. J., Axtell, J. D., Ashworth, E. N. (1994). Chemically induced cuticle mutation affecting epidermal conductance to water vapour and disease susceptibility in Sorghum bicolor (L.) Moench. Plant Physiol. 105, 1239–1245. doi: 10.1104/pp.105.4.1239
Jones-Rhoades, M. W., Bartel, D. P. (2004). Computational identification of plant microRNAs and their targets, including a stress-induced miRNA. Mol. Cell 14 (6), 787–799. doi: 10.1016/j.molcel.2004.05.027
Kumar, A., Sharma, P., Gomar-Alba, M., Shcheprova, Z., Daulny, A., Sanmartín, T., et al. (2018). Daughter-cell-specific modulation of nuclear pore complexes controls cell cycle entry during asymmetric division. Nat. Cell Biol. 20 (4), 432–442. doi: 10.1038/s41556-018-0056-9
Kumar, V., Joshi, S., Pant, N. C., Sangwan, P., Yadav, A. N., Saxena, A., et al. (2019). “Molecular approaches for combating multiple abiotic stresses in crops of arid and semi-arid region,” in Molecular approaches in plant biology and environmental challenges (Singapore: Springer), 149–170. doi: 10.1007/978-981-15-0690-1_8
Kumar, V., Sharma, H., Saini, L., Tyagi, A., Jain, P., Singh, Y., et al. (2022). Phylogenomic analysis of 20S proteasome gene family reveals stress-responsive patterns in rapeseed (Brassica napus L.). Front. Plant Sci. 4269. doi: 10.3389/fpls.2022.1037206
Kurata, N., Yamazaki, Y. (2006). Oryzabase. An integrated biological and genome information database for rice. Plant Physiol. 140, 12–17. doi: 10.1104/pp.105.063008
Kurepa, J., Wang, S., Li, Y., Smalle, J. (2009). Proteasome regulation, plant growth and stress tolerance. Plant Signaling Behav. 4 (10), 924–927. doi: 10.4161/psb.4.10.9469
Laskowski, R. A., MacArthur, M. W., Moss, D. S., Thornton, J. M. (1993). PROCHECK: a program to check the stereochemical quality of protein structures. J. Appl. Crystallogr. 26 (2), 283–291. doi: 10.1107/S0021889892009944
Lescot, M., Dehais, P., Thijs, G., Marchal, K., Moreau, Y., Van de Peer, Y., et al. (2002). PlantCARE, a database of plant cis-acting regulatory elements and a portal to tools for in silico analysis of promoter sequences. Nucleic Acids Res. 30, 325–327. doi: 10.1093/nar/30.1.325
Letunic, I., Bork, P. (2016). Interactive tree of life (iTOL) v3: an online tool for the display and annotation of phylogenetic and other trees. Nucleic Acids Res. 44, 242–245. doi: 10.1093/nar/gkw290
Letunic, I., Doerks, T., Bork, P. (2009). SMART 6: recent updates and new developments. Nucleic Acids Res. 37, 229–232. doi: 10.1093/nar/gkn808
Li, Q., Wang, W., Wang, W., Zhang, G., Liu, Y., Wang, Y., et al. (2018). Wheat F-box protein gene TaFBA1 is involved in plant tolerance to heat stress. Front. Plant Sci. 9, 521. doi: 10.3389/fpls.2018.00521
Li, X. M., Chao, D. Y., Wu, Y., Huang, X., Chen, K., Cui, L. G., et al. (2015). Natural alleles of a proteasome α2 subunit gene contribute to thermotolerance and adaptation of African rice. Nat. Genet. 47 (7), 827–833. doi: 10.1038/ng.3305
Li, Y. C., Korol, A. B., Fahima, T., Nevo, E. (2004). Microsatellites within genes: structure, function, and evolution. Mol. Biol. Evol. 21 (6), 991–1007. doi: 10.1093/molbev/msh073
Livneh, I., Cohen-Kaplan, V., Cohen-Rosenzweig, C., Avni, N., Ciechanover, A. (2016). The life cycle of the 26S proteasome: from birth, through regulation and function and onto its death. Cell Res. 26 (8), 869–885. doi: 10.1038/cr.2016.86
Lu, K., Wei, L., Li, X., Wang, Y., Wu, J., Liu, M., et al. (2019). Whole-genome resequencing reveals Brassica napus origin and genetic loci involved in its improvement. Nat. Commun. 10 (1), 1–12. doi: 10.1038/s41467-019-09134-9
Lu, S., Wang, J., Chitsaz, F., Derbyshire, M. K., Geer, R. C., Gonzales, N. R., et al. (2020). CDD/SPARCLE: the conserved domain database in 2020. Nucleic Acids Res. 48, 265–268. doi: 10.1093/nar/gkz991
Lyons, E., Freeling, M. (2008). How to usefully compare homologous plant genes and chromosomes as DNA sequences. Plant J. 53, 661–673. doi: 10.1111/j.1365-313X.2007.03326.x
Muffato, M., Louis, A., Poisnel, C. E., Crollius, H. R. (2010). Genomicus. Bioinformatics 26 (8), 1119–1121. doi: 10.1093/bioinformatics/btq079
Parmentier, Y., Bouchez, D., Fleck, J., Genschik, P. (1997). The 20S proteasome gene family in Arabidopsis thaliana. FEBS Lett. 416 (3), 281–285. doi: 10.1016/S0014-5793(97)01228-3
Proost, S., Van Bel, M., Sterck, L., Billiau, K., Van Parys, T., Van de Peer, Y., et al. (2009). PLAZA: a comparative genomics resource to study gene and genome evolution in plants. Plant Cell 21, 3718–3731. doi: 10.1105/tpc.109.071506
Rensink, W. A., Buell, C. R. (2004). Arabidopsis to rice. Applying knowledge from a weed to enhance our understanding of a crop species. Plant Physiol. 135 (2), 622–629. doi: 10.1104/pp.104.040170
Rogozin, I. B., Wolf, Y. I., Sorokin, A. V., Mirkin, B. G., Koonin, E. V. (2003). Remarkable interkingdom conservation of intron positions and massive lineage-specific intron loss and gain in eukaryotic evolution. Curr. Biol. 13 (17), 1512–1517. doi: 10.1016/S0960-9822(03)00558-X
Roozeboom, K. L., Prasad, P. V. (2019). Sorghum growth and development. Sorghum: A State Art Future Perspect. 58, 155–172. doi: 10.2134/agronmonogr58.c8
Saeki, Y. (2017). Ubiquitin recognition by the proteasome. J. Biochem. 161, 113–124. doi: 10.1093/jb/mvw091
Sakai, H., Lee, S. S., Tanaka, T., Numa, H., Kim, J., Kawahara, Y., et al. (2013). Rice Annotation Project Database (RAP-DB): an integrative and interactive database for rice genomics. Plant Cell Physiol. 54, 6. doi: 10.1093/pcp/pcs183
Sassa, H., Oguchi, S., Inoue, T., Hirano, H. (2000). Primary structural features of the 20S proteasome subunits of rice (Oryza sativa). Gene 250 (1-2), 61–66. doi: 10.1016/S0378-1119(00)00190-6
Sharma, H., Batra, R., Kumar, S., Kumar, M., Kumar, S., Balyan, H. S., et al. (2022). Identification and characterization of 20S proteasome genes and their relevance to heat/drought tolerance in bread wheat. Gene Rep. 27, 101552. doi: 10.1016/j.genrep.2022.101552
Smedley, D., Haider, S., Ballester, B., Holland, R., London, D., Thorisson, G., et al. (2009). BioMart–biological queries made easy. BMC Genomics 10 (1), 1–12. doi: 10.1186/1471-2164-10-22
Song, X. J., Huang, W., Shi, M., Zhu, M. Z., Lin, H. X. (2007). A QTL for rice grain width and weight encodes a previously unknown RING-type E3 ubiquitin ligase. Nat. Genet. 39, 623–630. doi: 10.1038/ng2014
Sun, H. H., Fukao, Y., Ishida, S., Yamamoto, H., Maekawa, S., Fujiwara, M., et al. (2013). Proteomics analysis reveals a highly heterogeneous proteasome composition and the post-translational regulation of peptidase activity under pathogen signaling in plants. J. Proteome Res. 12 (11), 5084–5095. doi: 10.1021/pr400630w
Sun, Q., Miao, C., Hanel, M., Borthwick, A. G., Duan, Q., Ji, D., et al. (2019). Global heat stress on health, wildfires, and agricultural crops under different levels of climate warming. Environ. Int. 128, 125–136. doi: 10.1016/j.envint.2019.04.025
Sun, L., Yang, Z. T., Song, Z. T., Wang, M. J., Sun, L., Lu, S. J., et al. (2013). The plant-specific transcription factor gene NAC 103 is induced by b ZIP 60 through a new cis-regulatory element to modulate the unfolded protein response in A rabidopsis. Plant J. 76 (2), 274–286. doi: 10.1111/tpj.12287
Sung, M. K., Reitsma, J. M., Sweredoski, M. J., Hess, S., Deshaies, R. J. (2016). Ribosomal proteins produced in excess are degraded by the ubiquitin–proteasome system. Mol. Biol. Cell 27 (17), 2642–2652. doi: 10.1091/mbc.E16-05-0290
Swarbreck, D., Wilks, C., Lamesch, P., Berardini, T. Z., Garcia-Hernandez, M., Foerster, H., et al. (2007). The Arabidopsis Information Resource (TAIR): gene structure and function annotation. Nucleic Acids Res. 36, 1009–1014. doi: 10.1093/nar/gkm965
Szklarczyk, D., Kirsch, R., Koutrouli, M., Nastou, K., Mehryary, F., Hachilif, R., et al. (2023). The STRING database in 2023: protein–protein association networks and functional enrichment analyses for any sequenced genome of interest. Nucleic Acids Res. 51 (D1), D638–D646. doi: 10.1093/nar/gkac1000
Taramino, G., Tarchini, R., Ferrario, S., Lee, M. (1997). Characterization and mapping of simple sequence repeats (SSRs) in Sorghum bicolor. Theor. Appl. Genet. 95 (1-2), 66–72. doi: 10.1007/s001220050533
Toufighi, K., Brady, S. M., Austin, R., Ly, E., Provart, N. J. (2005). The Botany Array Resource: e-Northerns, expression angling, and promoter analyses. Plant J. 43, 153–163. doi: 10.1111/j.1365-313X.2005.02437.x
Varshney, R. K., Graner, A., Sorrells, M. E. (2005). Genic microsatellite markers in plants: features and applications. Trends Biotechnol. 23 (1), 48–55. doi: 10.1016/j.tibtech.2004.11.005
Wan, X., Mo, A., Liu, S., Yang, L., Li, L. (2011). Constitutive expression ofa peanut ubiquitin-conjugating enzyme gene in Arabidopsis confers improved water-stress tolerance through regulation of stress-responsive gene expression. J. Bioscience Bioengineering 111, 478–484. doi: 10.1016/j.jbiosc.2010.11.021
Wang, G., Fan, W., Ou, M., Wang, X., Qin, H., Feng, F., et al. (2019). Dek40 encodes a PBAC4 protein required for 20S proteasome biogenesis and seed development. Plant Physiol. 180 (4), 2120–2132. doi: 10.1104/pp.18.01419
Xia, L., Zou, D., Sang, J., Xu, X., Yin, H., Li, M., et al. (2017). Rice Expression Database (RED): an integrated RNA-Seq-derived gene expression database for rice. J. Genet. Genomics 44, 235–241. doi: 10.1016/j.jgg.2017.05.003
Xu, F. Q., Xue, H. W. (2019). The ubiquitin-proteasome system in plant responses to environments. Plant Cell Environ. 42 (10), 2931–2944. doi: 10.1111/pce.13633
Yu, X., Han, J., Wang, E., Xiao, J., Hu, R., Yang, G., et al. (2019). Genome-wide identification and homoeologous expression analysis of PP2C genes in wheat (Triticum aestivum L.). Front. Genet. 10. doi: 10.3389/fgene.2019.00561
Yu, H., Matouschek, A. (2017). Recognition of client proteins by the proteasome. Annu. Rev. Biophys. 46, 149–173. doi: 10.1146/annurev-biophys-070816-033719
Keywords: Sorghum bicolor, 20S proteasome gene family, gene duplication, miRNAs, splice variants, homology modelling, cis-regulatory elements
Citation: Malik V, Ikram FM, Singh Y, Kumar V, Malik P, Balyan P, Singh KP, Mir RR, Hashem A, Avila-Quezada GD, Abd_Allah EF and Kumar U (2023) Structural and functional characteristics and expression profile of the 20S proteasome gene family in Sorghum under abiotic stress. Front. Plant Sci. 14:1287950. doi: 10.3389/fpls.2023.1287950
Received: 03 September 2023; Accepted: 08 November 2023;
Published: 29 November 2023.
Edited by:
Anil Kumar Singh, Indian Council of Agricultural Research, IndiaReviewed by:
Madhab Kumar Sen, Czech University of Life Sciences Prague, CzechiaNagaraju Marka, UCONN Health, United States
Copyright © 2023 Malik, Ikram, Singh, Kumar, Malik, Balyan, Singh, Mir, Hashem, Avila-Quezada, Abd_Allah and Kumar. This is an open-access article distributed under the terms of the Creative Commons Attribution License (CC BY). The use, distribution or reproduction in other forums is permitted, provided the original author(s) and the copyright owner(s) are credited and that the original publication in this journal is cited, in accordance with accepted academic practice. No use, distribution or reproduction is permitted which does not comply with these terms.
*Correspondence: Upendra Kumar, YmFsaXlhbi51cGVuZHJhQGdtYWlsLmNvbQ==
†These authors have contributed equally to this work and share first authorship