 Le Han
 Bolin Shen1†
 Xinyi Wu
 Jin Zhang
 Yang-Jun Wen
- 1College of Science, Nanjing Agricultural University, Nanjing, China
- 2State Key Laboratory of Crop Genetics and Germplasm Enhancement and Utilization, Nanjing Agricultural University, Nanjing, China
Introduction: Epistasis is currently a topic of great interest in molecular and quantitative genetics. Arabidopsis thaliana, as a model organism, plays a crucial role in studying the fundamental biology of diverse plant species. However, there have been limited reports about identification of epistasis related to flowering in genome-wide association studies (GWAS). Therefore, it is of utmost importance to conduct epistasis in Arabidopsis.
Method: In this study, we employed Levene’s test and compressed variance component mixed model in GWAS to detect quantitative trait nucleotides (QTNs) and QTN-by-QTN interactions (QQIs) for 11 flowering-related traits of 199 Arabidopsis accessions with 216,130 markers.
Results: Our analysis detected 89 QTNs and 130 pairs of QQIs. Around these loci, 34 known genes previously reported in Arabidopsis were confirmed to be associated with flowering-related traits, such as SPA4, which is involved in regulating photoperiodic flowering, and interacts with PAP1 and PAP2, affecting growth of Arabidopsis under light conditions. Then, we observed significant and differential expression of 35 genes in response to variations in temperature, photoperiod, and vernalization treatments out of unreported genes. Functional enrichment analysis revealed that 26 of these genes were associated with various biological processes. Finally, the haplotype and phenotypic difference analysis revealed 20 candidate genes exhibiting significant phenotypic variations across gene haplotypes, of which the candidate genes AT1G12990 and AT1G09950 around QQIs might have interaction effect to flowering time regulation in Arabidopsis.
Discussion: These findings may offer valuable insights for the identification and exploration of genes and gene-by-gene interactions associated with flowering-related traits in Arabidopsis, that may even provide valuable reference and guidance for the research of epistasis in other species.
Introduction
Arabidopsis thaliana, an important flowering plant, has emerged as a model organism for molecular plant genetics research in recent years (Koornneef and Meinke, 2010). Its compact genome, short life cycle, ease of cultivation, and abundant genetic resources make it widely utilized in fundamental biology, crop enhancement, and biotechnology. The flowering phase of Arabidopsis plays a crucial role in determining the precise timing of reproduction, seed, and fruit development. Therefore, studying the regulation and molecular mechanisms of flowering time in Arabidopsis remains an important area of research. By discovering the genetic factors and regulatory pathways affecting flowering time in Arabidopsis, it is possible to identify homologous genes and manipulate their expression in agronomic crops, optimize crop flowering time to adapt to specific environments and agricultural practices, improve crop yields, and produce crops that are more adapted to climate change and stress resistance.
Flowering in Arabidopsis has complex regulatory mechanisms and pathways, and the phenotypic material of flowering under different regulatory pathways is particularly important to elucidate the genetic mechanism of flowering (Qi et al., 2018). In the photoperiodic pathway, Arabidopsis perceives light signals through photoreceptors and transmits them to its biological clock. The biological clock, responsive to changes in day length, ultimately transforms the light signals into flowering signals via the CONSTANS (CO) gene (Imaizumi and Kay, 2006). Under long-day treatments, the CO gene facilitates flowering, whereas under short-day treatments, it retards the process (Teper-Bamnolker and Samach, 2005; Balasubramanian et al., 2006). In addition, vernalization plays a vital role in regulating flowering. By suppressing the activity of the FLOWERING LOCUS C protein, low-temperature induction during vernalization unlocks Arabidopsis’s flowering potential (Helliwell et al., 2015). In additional to the vernalization pathway, it was shown that the flowering time of Arabidopsis in 25-27°C short days was similar that in 23°C long days, suggesting that higher temperature promotes flowering in Arabidopsis (Balasubramanian et al., 2006). These studies indicate that in the research on flowering-related traits of Arabidopsis, factors such as photoperiod, vernalization, and temperature need to be considered.
Epistasis, referred to as loci-locus interactions (He et al., 2019), plays an important role in phenotypic variation and has received much attention over the years. As a major factor in molecular evolution (Breen et al., 2012), epistasis plays a crucial role in quantitative genetic analysis and is now one of the main causes of ‘missing heritability’ (Mackay and Moore, 2014; Upton et al., 2016). In Arabidopsis, flowering time as a complex quantitative trait is regulated by genes such as photoperiod, but also by other physiological processes such as temperature signaling and vernalization, which are both independent and interrelated. Therefore, these physiological processes involve a large number of loci and even genes that often interact with each other, and individual genetic loci or genes may have a small effect on flowering time in Arabidopsis, but together with other genes may have a large effect on phenotypic variation (Zhang et al., 2014), making it particularly important to investigate epistatic loci for flowering-related traits in Arabidopsis.
Recently, researchers have proposed many epistasis detection algorithms for complex traits based on traditional genome-wide association studies (GWAS) or artificial intelligence (AI). The most basic approach to explore epistasis is regression-based methods such as PLINK (Purcell et al., 2007), which has the advantage of high computational efficiency, rapid analysis of tens of thousands of markers and epistasis, and wide application in case-control datasets, but a high false positive rate. BOOST (Wan et al., 2010), which uses a Boolean representation of genotype data, can save memory space and improve computational speed at the same time, but it can only handle binary phenotype data and not for continuous quantitative traits such as yield and flowering time, which is a very limited application scenario. For continuous traits in plants, mixed linear model (MLM)-based methods perform better due to accounting for environmental factors, controlling for population stratification, and explaining cryptic correlations among individuals. QTXNetwork is a multi-locus mixed model proposed by Zhang et al. (2015). This method first detects each marker to identify potential quantitative trait nucleotides (QTNs), QTN-by-environment interactions (QEIs), and all the pairs of markers to identify potential QTN-by-QTN interactions (QQIs), and then all the potential QTNs, QEIs, and QQIs are placed into a genetic model to identify significant loci. However, the associated polygenic backgrounds in the first step were not taken into account. Ning et al. (2018) proposed a rapid epistatic mixed-model association analysis (REMMA) algorithm, which used the best linear unbiased prediction (BLUP) to predict additive and dominant effects, their epistatic effects and their variances, and then Wald Chi-squared test was used to identify the significance of all the effects. However, their power could be further improved. Multifactor dimensionality reduction (MDR) (Moore, 2004), a classical nonparametric machine learning method, was originally designed for identifying epistasis in case-control studies. Quantitative MDR (QMDR) (Gui et al., 2013; Yu et al., 2015) represents a robust, model-free extension of MDR accommodated for quantitative phenotypes. None of them, however, effectively address the challenges posed by limited interpretability and overfitting in AI and lengthy computation times required for genome-wide markers.
To overcome the above issues, Li et al (2022a; 2022b). established a compressed variance component mixed model method, named 3VmrMLM, to detect QTNs, QEIs, and QQIs while controlling for all the possible polygenic backgrounds. It reveals epistatic effects by reducing the number of variance components, while ensuring high statistical power. Additionally, the method efficiently reduces computation time and effectively addresses potential confounding factors arising from various polygenic backgrounds.
A number of gene-by-gene interactions associated with flowering time have been identified in Arabidopsis. For example, Zhao et al. (2022) identified a novel flowering repressor, UBA2c, and showed that the expression of a key flowering repressor gene, FLM, is promoted by inhibiting the histone modification H3K27me3, thereby suppressing premature flowering in plants. Hanano and Goto (2011) found that the interaction of FD with TFL1 by BiFC assay induces Arabidopsis flowering repressor genes to fine-tune flowering time and inflorescence meristem tissue development, which in turn affects flowering time. However, most gene-by-gene interactions related flowering in Arabidopsis have been obtained by biological methods such as transcriptome analysis, and few gene-by-gene interactions have been identified by GWAS.
In this study, QQIs and QTNs for eleven flowering-related traits in natural populations of Arabidopsis were investigated using 3VmrMLM with data from https://www.Arabidopsis.org. Differentially expressed genes were identified under temperature, photoperiod, and vernalization treatments. Candidate genes and gene-by-gene interactions were identified by functional enrichment, haplotype and phenotypic difference analysis. Epistasis for flowering-related traits of Arabidopsis will help identify interacting genes and provide references for studying epistasis in other crops.
Materials and methods
Genotypic and phenotypic data
The dataset of Arabidopsis (Atwell et al., 2010) including the phenotypic and genotypic data were obtained from https://www.Arabidopsis.org. The dataset consisted 23 flowering-related traits, 199 individuals, and 216,130 markers.
Among 23 traits, we focused on eleven traits related to flowering under three different environmental conditions, including temperature, photoperiod, and vernalization treatments. They were Days to flowering time under Long Day (LD), Days to flowering time under Long Day with vernalization at 4°C during 5 weeks (LDV), Days to flowering time under Short Day with vernalization at 4°C during 5 weeks (SDV), Days to FT under LD with vernalization for 0 weeks, 2 weeks, 4 weeks, 8 weeks (0W, 2W, 4W, 8W), Flowering time at 10°C, 22°C (FT10, FT22), leaf number at flowering time at 10°C, 22°C (LN10, LN22) (Supplementary Data.zip).
To explore the relationship among the above flowering-related traits, we computed the Pearson correlation coefficients (PCCs) using the cor.test function in R (Version 4.2.1) and generated a phenotypic correlation heatmap using the ggcorrplot function from the ggcorrplot package. A hierarchical cluster analysis of the phenotypes was also performed using the hclust function in R to divide traits into groups that correlated more significantly into the same group (Figure 1A).
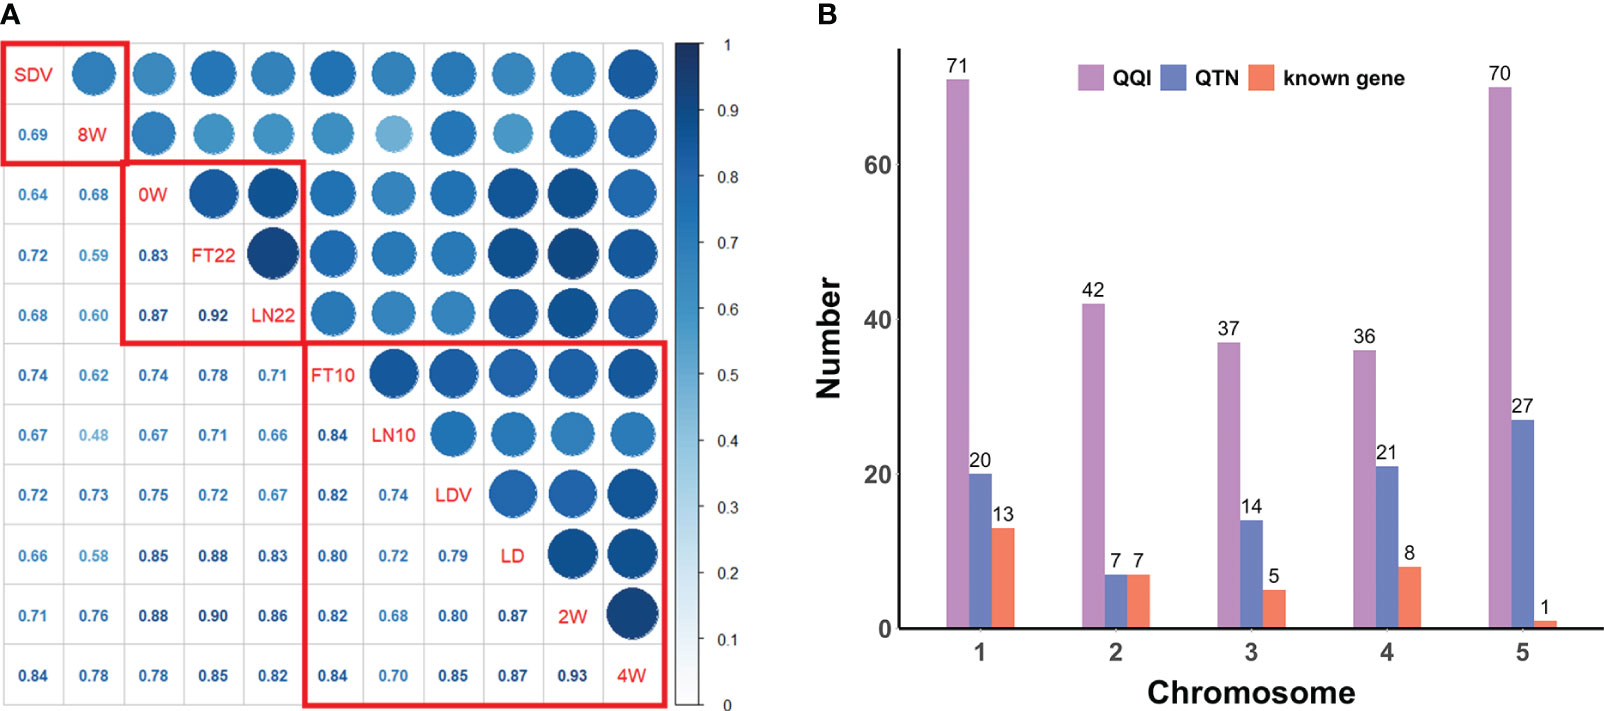
Figure 1 (A) Pearson correlation coefficients and correlation clustering of flowering-related traits. The lower diagonal represents the correlation coefficients, and the red boxes indicate the clustering results. (B) Distribution of QQIs, QTNs, and known genes across all chromosomes for eleven flowering-related traits.
GWAS method
To rapidly and accurately analyze epistasis for GWAS, we combined Levene’s test (Brown and Forsythe, 1974) with 3VmrMLM. Firstly, we conducted Levene’s test from the OSCA software tool (http://cnsgenomics.com/software/osca; Zhang et al., 2019) for mining the potential epistatic single nucleotide polymorphisms (SNPs) as well as alleviating computational burden. We utilized “––vqtl -mtd 2” for Levene’s test with median and “––maf 0.01” for removing data with minor allele frequency (MAF) < 0.01 in OSCA, resulting in the top 5,000 loci for each trait. Subsequently, we used the IIIVmrMLM package (https://github.com/YuanmingZhang65/IIIVmrMLM; Li et al., 2022b) in R to detect QQIs and QTNs, with parameter set to “Epistasis”. 3VmrMLM determines the significance of QQIs or QTNs using either Bonferroni correction (P-value < 0.05/[m × (m–1)]/2, where m is the number of markers) for significant association or a logarithm of odds (LOD) score of 3.0 for suggestive association, either criterion indicates a significant association with the traits. We used Vp = Vepi + Vadd + Vr (Figure 2) for each trait to calculate the proportion of the sum of epistatic variance (Vepi) to the phenotypic variance (Vp), where Vadd is the sum of additive variance of detected QTNs and Vr is the residual variance.
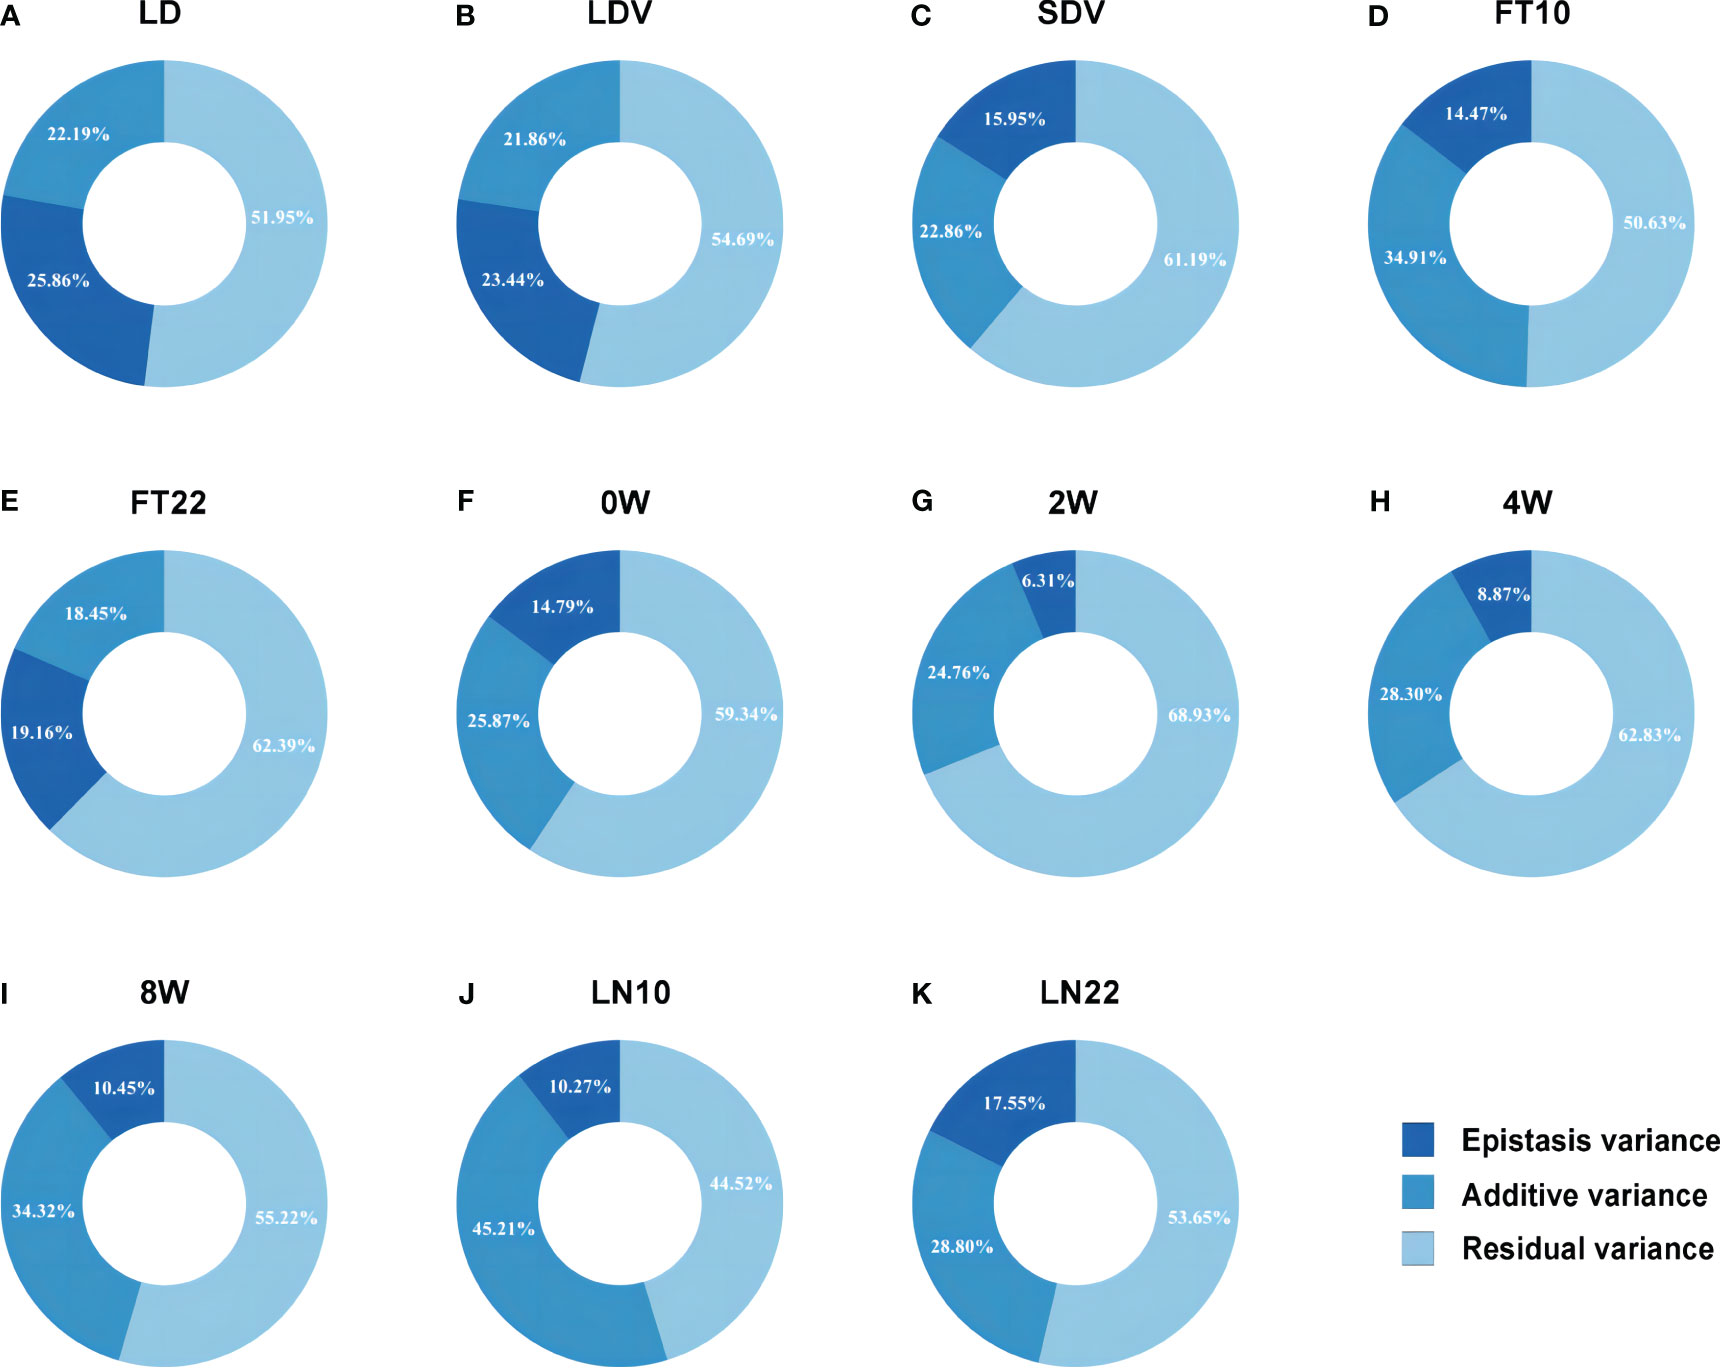
Figure 2 Phenotypic variation explained by the epistatic and additive effects for eleven flowering-related traits. (A–K) correspond to the traits LD, LDV, SDV, FT10, FT22, 0W, 2W, 4W, 8W, LN10, and LN22, respectively.
Identification of known genes
We identified genes located within a 20 kb distance around significant loci, specifically focusing on known genes that have been previously reported in relevant articles. Then the Arabidopsis Information Resource (TAIR) (https://www.arabidopsis.org/) and National Center for Biotechnology Information (NCBI) (https://www.ncbi.nlm.nih.gov/) were employed for gene annotation. Known gene mining involved three steps. First, extracting genes within a 20 kb region around significant loci detected by 3VmrMLM from the Arabidopsis gene library downloaded from TAIR. Second, screening for genes impacting flowering-related traits and containing relevant keywords. Third, confirming the association between genes and flowering time in Arabidopsis, as well as their confirmed epistatic interactions with other genes by retrieving literature from TAIR and NCBI. Finally, known genes will be identified.
Differential expression and functional enrichment analyses
After excluding known genes reported in the literature, we performed differential expression analysis on the remaining unreported genes using the Gene Expression Omnibus (GEO) database (https://www.ncbi.nlm.nih.gov/geo/). We utilized the GSE197581, GSE190748, and GSE40455 series for targeting differentially expressed genes (DEGs) in response to different temperature, photoperiod, and vernalization treatments. The GSE197581 series included two samples of Arabidopsis at 22°C and 10°C, with three biological replicates. The GSE190748 series consisted samples subjected to long-day (16h light/8h dark) and short-day (8h light/16h dark), with two biological replicates. The GSE40455 series included samples to four weeks of vernalization and samples subjected without vernalization treatment, with four biological replicates. For the GSE190748 and GSE40455 series, we used the “analyze with GEO2R” tool to identify genes with an absolute log2FoldChange greater than 1 and a P-value less than 0.05. For the GSE197581 series, we used the provided data from the website and identify genes with an absolute log2FoldChange greater than 1 and the false discovery rate (FDR) less than 0.05. Subsequently, the DEGs obtained above were intersected with the detected unreported genes around QQIs and QTNs, resulting in identification of DEGs associated with flowering-related traits. For gene ontology (GO) based functional enrichment analysis, we submitted the above flowering-related DEGs information to the DAVID platform (https://david.ncifcrf.gov/), and selected the enriched gene ontology terms with a significance threshold of P-value less than 0.05.
Haplotype analysis for identifying candidate genes
We used the HaploView software (Version 4.1) to perform linkage disequilibrium and haplotype block studies (Barrett et al., 2005) based on the SNPs within these genes and 2 kb upstream of them, which are obtained from GO enrichment analysis. Meanwhile, we employed the t.test function in R to examine the phenotypic differences among haplotypes. Candidate genes were identified as those exhibiting significant phenotypic differences across various haplotypes. This approach allowed us to identify potential genes associated with the traits of interest.
Results
Phenotypic correlation and clustering
PCCs were obtained from correlation analysis of eleven quantitative traits (Figure 1A). The phenotypic correlations of all flowering-related traits showed positive. There were two pairs of PCCs more than 0.90, 2W and 4W (PCCs = 0.93), FT22 and LN22 (PCCs = 0.92), and only one pair of PCCs less than 0.50, LN10 and 8W, but their PCCs also reached 0.48. The above results indicate that eleven traits play an important role in the regulation of flowering time in Arabidopsis, and there is a very significant positive correlation between any two pairs.
Hierarchical cluster analysis of all traits by the hclust function in R ranked the phenotypes with more significant correlations and divided them into three groups (Figure 1A). The first group was SDV and 8W with a correlation coefficient of 0.69; the second group was 0W, FT22, and LN22 with PCCs ranging from 0.83 to 0.92; and the third group was FT10, LN10, LDV, LD, 2W, and 4W with PCCs ranging from 0.68 to 0.93. Clustering of these phenotypes revealed a higher overall correlation between these traits and a greater likelihood of interactions between loci, which was further confirmed following by the pleiotropy of known genes (Table 1).

Table 1 Pleiotropic genes reported around QQIs/QTNs.
Epistasis mining using 3VmrMLM
After Levene’s test in the raw dataset, 3VmrMLM used in the top 5,000 markers detected 130 QQIs (107 significant and 23 suggested QQIs; Supplementary Table 1) and 89 QTNs (61 significant and 28 suggested QTNs; Supplementary Table 2) that were strongly associated with the flowering-related traits.
Overall, QQIs and QTNs are distributed on all chromosomes (Figure 1B). For QQIs, 3VmrMLM detected a large number of loci, with the highest distribution on chromosome 1 and 5, with 71 and 70 loci, respectively. Although it has a relatively small distribution on chromosomes 2 and 4, it also has more than 35 loci (Figure 1B). For QTNs, the distribution of loci on chromosome 2 was relatively uniform, with the number ranging from 14 ~27, except for a minimum of 7 loci on chromosome 2 (Figure 1B). On chromosome 1 and chromosome 5, QQIs and QTNs are relatively large, and we can analyze that these two chromosomes have a great influence on the genetic variation of flowering-related traits (Figure 1B). In addition, the number of QQIs far exceeded the number of QTNs, indicating that epistasis is a very important link to explore the genetic mechanism of traits related to flowering time, and the interaction between loci is relatively common.
Six of the 11 traits obtained more than 10 QQIs (Supplementary Table 1). FT22 detected the most QQIs, reaching 19 QQIs, with P values of 2.965E-09~1.386E-04, LOD scores of 3.154~7.645, respectively, and 7 positive effects (Figure 3B; Supplementary Table 1). FT10 detected 11 QQIs with P values of 2.293E-10~ 9.951E-05 and LOD scores of 3.289~8.730, where SNP72738 on chromosome 2 and SNP167863 on chromosome 5 also were the QQIs for 2W and LN22 traits, respectively (Supplementary Figure 1C; Supplementary Table 1). LN10 detected 16 QQIs, second only to FT22, with P values of 1.327E-10~5.173E-05 and LOD scores of 3.558~8.962, respectively (Figure 3D; Supplementary Table 1). LN22 detected 10 QQIs, with P values of 6.250E-10~1.190E-04 and LOD scores of 3.216~8.304, respectively (Supplementary Figure 1G; Supplementary Table 1). LDV detected 14 QQIs, with P values of 4.326E-15~1.174E-04 and LOD scores of 3.221~13.365, 7 positive effects, respectively (Figure 3A; Supplementary Table 1). SDV detected 14 QQIs, with P values of 4.136E-11~1.379E-04, LOD scores of 3.156~9.457, and 4 positive effects, respectively. Notably, SNP200347 on chromosome 5 was involved in interactions with both SNP179236 and SNP32689. Trait 0W detected 12 QQIs, with P values of 2.605E-14~1.318E-05 and LOD scores of 4.123~12.608, respectively (Supplementary Figure 1D; Supplementary Table 1). Trait 2W detected 14 QQIs, with P values of 3.985E-09~8.515E-05 and LOD scores of 3.353~7.520, respectively, and SNP72738 was found to be involved in intercrossing with SNP2739 and SNP72795 simultaneously in this trait (Figure 3C; Supplementary Table 1).
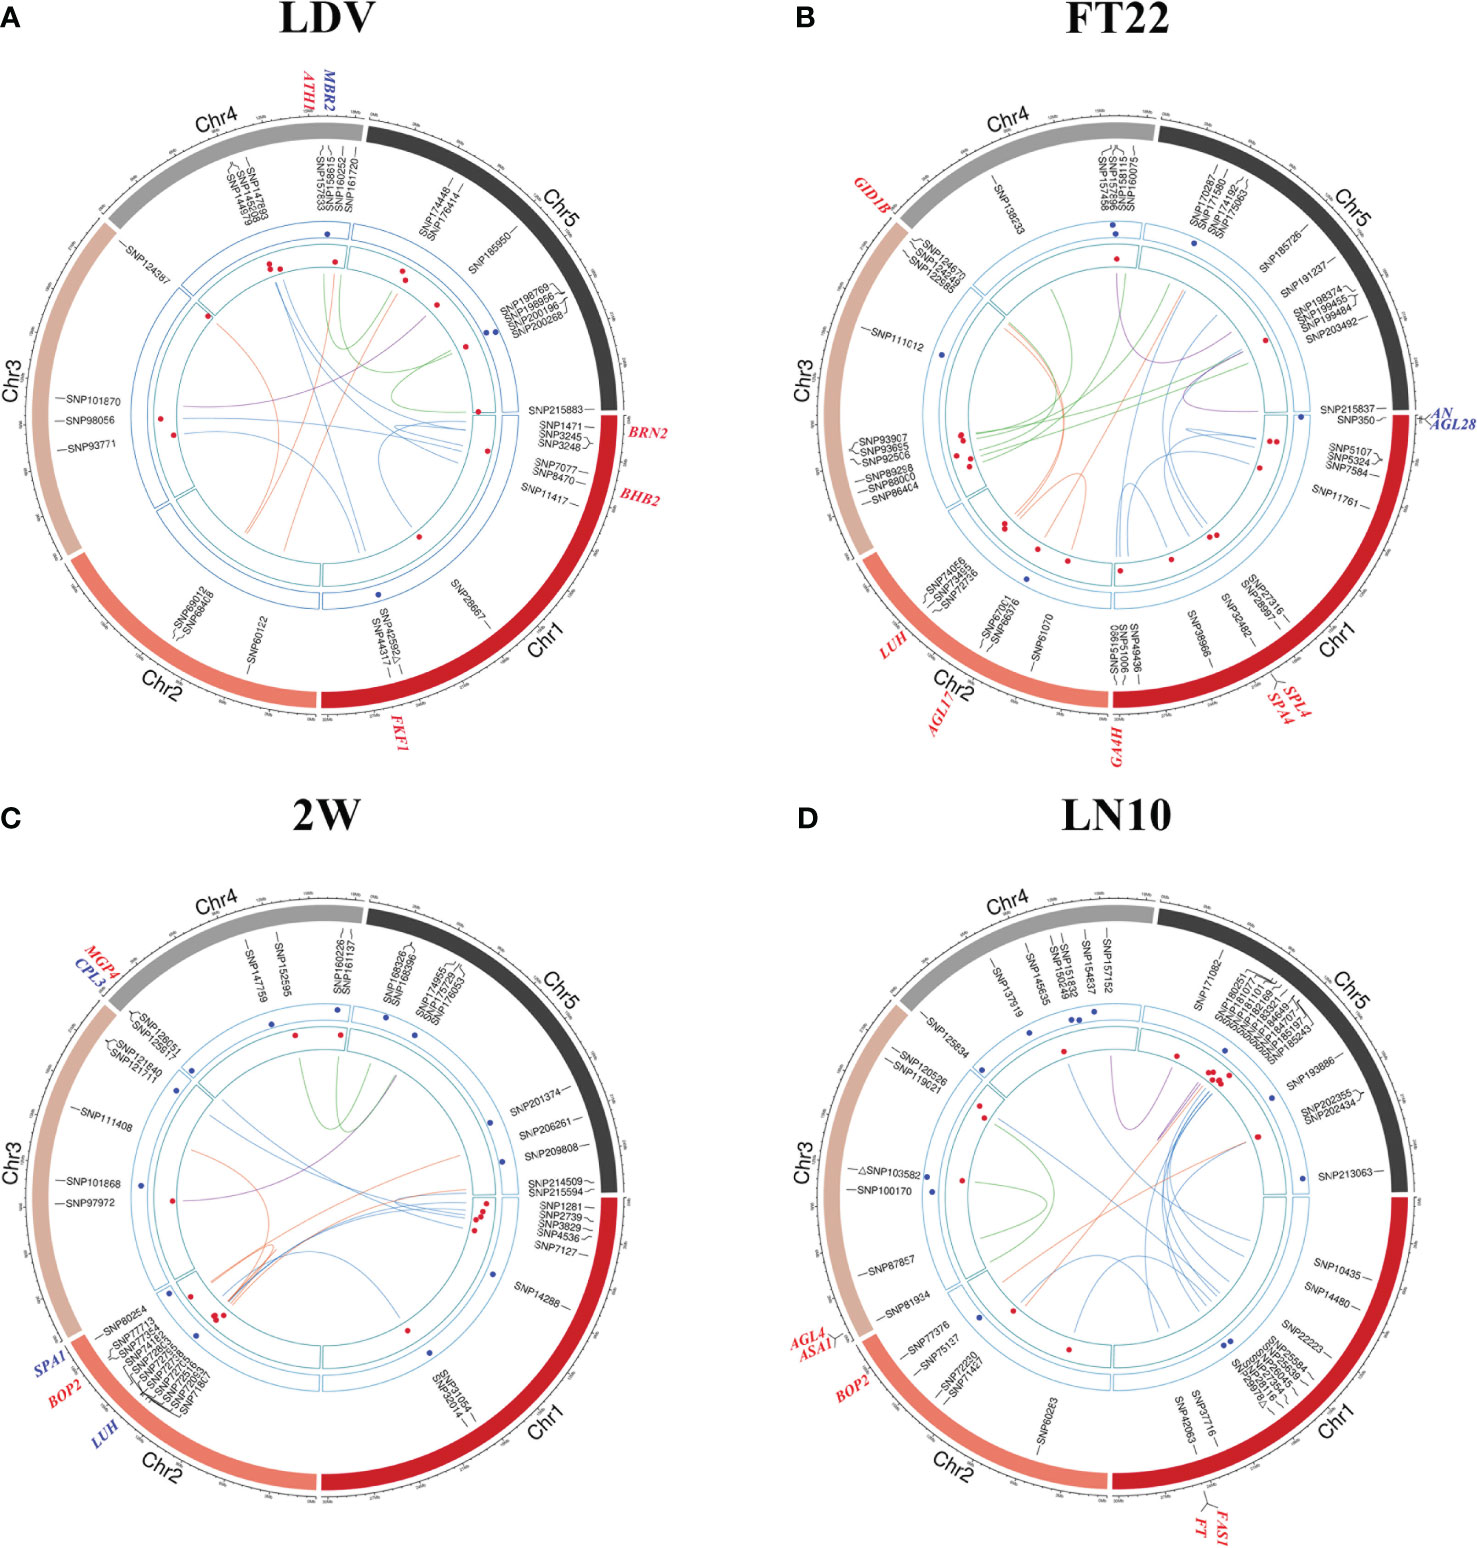
Figure 3 Chord diagrams for QQIs and QTNs detected by 3VmrMLM. (A–D) correspond to the traits LDV, FT22, 2W, and LN10, respectively. The inner circle displays the detected QQIs or QTNs (△ indicates overlapping loci between QQIs and QTNs), the height of red dots represents the epistatic effects of QQI pairs, and the height of blue dots represents the additive effects of corresponding QTNs. The outer circle indicates the known genes in vicinity of significant loci.
8 QQIs were detected for both 4W and 8W, with P values of 5.906E-13 ~3.681E-06, LOD scores of 4.652~11.266, respectively, and only 2 positive effects for 4W (Supplementary Figure 1E; Supplementary Table 1). P values of 4.899E-08~1.064E-04 and LOD scores of 3.261~6.462 for 8W (Supplementary Figure 1F; Supplementary Table 1). Although LD obtained the least number of QQIs, only four, with P values of 2.792E-08~8.968E-07 and LOD scores of 5.242~6.699, respectively, the phenotypic contribution of all four pairs of epistatic loci was >4%, with the pair SNP66960 and SNP71678, located on chromosome 2, having the largest percentage of phenotypic variance explained (PVE) of all QQIs at 8.187%. (Supplementary Table 1).
For QTNs, a total of 89 significant/suggestive QTNs were detected to be associated with at least one of the 11 flowering-related traits (Figure 3; Supplementary Figure 1; Supplementary Table 2). Among these QTNs, 3, 4, 8, 10, 6, 6, 13, 11, 11, 13, and 7 QTNs were associated with LD, LDV, SDV, FT10, FT22, 0W, 2W, 4W, 8W, LN10, and LN22, respectively (Supplementary Table 2), and the PVE of all QTNs for each trait were 22.193%, 21.875%, 22.864%, 34.906%, 18.446%, 25.868%, 24.760%, 28.297%, 34.328%, 45.205%, and 28.797%, respectively, with P values ranging from 1.757E-10 to 1.986E-04 and LOD scores of 3.006 to 8.843 (Figure 2; Supplementary Table 2). Notably, SNP31054 and SNP101868 on chromosomes 1 and 3 were involved in both 2W and 4W phenotypic variants, and in addition, SNP103582 on chromosome 3 was detected on both LN10 and FT10 (Figure 3D; Supplementary Figure 1C; Supplementary Table 2).
The total PVE for each trait, considering both additive and epistatic effects, was calculated using the IIIVmrMLM package in R, and the results were visualized in Figure 2. The PVE of QQIs for the traits LD, LDV, and FT22 were 25.856%, 23.438%, and 19.163%, respectively, as shown in Figures 2A, B, E. Accordingly, these values were higher than the PVEs of the corresponding QTNs. The analysis of QQIs and QTNs revealed that most locus exhibited either epistatic or additive effects in contributing to phenotypic variation of each trait (Figure 2; Supplementary Tables 1, 2). However, we also identified some specific SNPs, such as SNP42592 for LDV, both SNP103582 and SNP29978 for LN10, SNP200347 for SDV, SNP125854 for 0W, SNP101868 for 4W, both SNP111498 and SNP181717 for 8W, which were involved in both additive and epistatic effects (Figures 3A, D; Supplementary Figures 1B, D, E, F; Supplementary Tables 1, 2).
Known genes around QQIs and QTNs for flowering-related traits in Arabidopsis
TAIR (https://www.arabidopsis.org/) was used to mine the known genes around QQIs and QTNs (20 kb upstream and downstream of each locus). A total of 34 known genes were found to be located around the significant/suggested loci, including 29 QQIs and 12 QTNs (Figure 3; Supplementary Figure 1; Supplementary Table 3).
For QQIs, 3, 4, 2, 1, 6, 4, 2, 0, 1, 5, and 1 known genes were explored in LD, LDV, SDV, FT10, FT22, 0W, 2W, 4W, 8W, LN10, and LN22, respectively (Supplementary Table 3). Specifically, the known genes BRN2 (AT1G03457, near SNP1471) and FKF1 (AT1G68050, near SNP44317) associated with LDV (Figure 3A; Supplementary Table 3) interact with the AtBRN and CDF2 protein to promote or repress flowering in Arabidopsis, respectively (Kim et al., 2013; Lee et al., 2018). The known gene SPA4 (AT1G53090) associated with FT22 is located near SNP32482 (Figure 3B; Supplementary Table 3). There has been reported that SPA4 is involved in regulating photoperiodic flowering in Arabidopsis and interacts with the flower inducer CO to regulate flowering stability, while it interacts with PAP1 and PAP2 and is involved in repressive regulation at the transcriptional level, affecting light conditions growth of Arabidopsis under light conditions (Laubinger et al., 2006; Maier et al., 2013). Two known genes, FT (AT1G65480) and FAS1 (AT1G65470), were detected simultaneously near SNP42063 (Figure 3D; Supplementary Table 3), and two known genes, ASA1 (AT3G02260) and AGL4 (AT3G02310), were detected near SNP81934 under LN10 (Figure 3B; Supplementary Table 3), where FT interacts with FD(AT4G35900) and 14-3-3 proteins to produce a florigen-activation complex, control flowering time, and correct the expression of floral homologs to promote flowering (Collani et al., 2019); the known gene AGL4 interacts with DNA and may be involved in forming a tetrameric DNA-binding complex to control flower development and thus affect flowering time (Jetha et al., 2014). The known gene HOS1 (AT2G39810, near SNP76337) associated with trait 0W (Supplementary Figure 1D; Supplementary Table 3) is localized to the nuclear membrane and interacts with Nup96, and loss of function of Nup96 would lead to disruption of HOS1 protein, resulting in excessive accumulation of CO protein, a key activator of flowering under long-day that suppresses early flowering in Arabidopsis under long-day (Lazaro et al., 2015).
For QTNs, 1, 2, 1, 2, 3, 1, and 2 known genes were explored in LDV, SDV, FT10, FT22, 2W, 4W, and LN22, respectively, and only QQI-related genes were obtained for the remaining four traits (Supplementary Table 3). Among the significant loci associated with SDV, FD (AT4G35900) was found to be located near SNP159681 (Supplementary Figure 1B; Supplementary Table 3), and it was shown that FD acts as a transcriptional activator of floral tissue identity genes to regulate flowering time in Arabidopsis, while the FD transcription factor was shown to interact with TFL1 by BiFC assay to induce flowering time and inflorescence meristem tissue by Arabidopsis repressor genes development is fine-tuned (Hanano and Goto, 2011; Gorham et al., 2018). In the case of FT22, two known genes, AN (AT1G01510) and AGL28 (AT1G01530), were detected simultaneously near SNP350 (Figure 3B; Supplementary Table 3), and AN has been shown to control leaf morphology and thus indirectly affect flowering time in Arabidopsis. (Stern et al., 2007); AGL28 can act as a flower activator by up-regulating the expression of known flower promoters within the autonomous pathway, and its overexpression will up-regulate the expression of FCA and LUMINIDEPENDENS, leading to early flowering in Arabidopsis (Yoo et al., 2006). One known gene associated with LDV, MBR2 (AT4G34040), located near SNP158615 (Figure 3A; Supplementary Table 3), was shown in earlier studies to promote flowering through a PFT1 dependent and independent mechanism (Iñigo et al., 2012). The gene SPA1 (AT2G46340, near SNP80254) is known to be associated with 2W (Figure 3C; Supplementary Table 3), and is a key repressor of light signaling in the ovary to regulate flowering time by regulating the photoperiod (Ranjan et al., 2011). Near the QTN SNP135761, which is significantly associated with LN22, CRY1 (AT4G08920; Supplementary Figure 1G; Supplementary Table 3) is known to mediate blue light to promote flowering in Arabidopsis, which is more sensitive to flowering photoperiod under blue light, suggesting that CRY1 plays an important role in flowering regulation (Mockler et al., 2003).
Interestingly, out of these 34 known genes, five pleiotropic genes were involved in the performance variation of at least two traits in terms of QQI or QTN (Table 1). In terms of QQI, the known gene AGL17 (AT2G22630), which was detected around SNP67001, SNP66970, and SNP66990 and was associated with FT22, LD, and LN22 (Table 1; Figure 3B; Supplementary Figures 1A, G), has been confirmed to play a role in the photoperiodic pathway of Arabidopsis and is positively controlled by the photoperiodic pathway regulator CO. It can promote the flowering of Arabidopsis thaliana (Han et al., 2008). At the same time, the known gene ATH1 (AT4G32980, around SNP157833), which is related to LDV and 0W (Table 1; Figure 3A; Supplementary Figure 1D), is necessary for controlling the morphology of Arabidopsis flower stalk. In addition, there is an interaction between ATH1 and KNAT2, and the protein complex plays a role in regulating flower pedicle development (Li et al., 2012). BOP2 (AT2G41370), detected near SNP77354 and SNP77376, is associated with two traits, 2W and LN10 (Table 1; Figures 3C, D), and studies have shown that the LFY and BOP2 proteins physically interact to inhibit bracteal formation and reduce flowering time in a short period of time under certain conditions (Chahtane et al., 2018). In terms of QTN, a known gene CPL3(AT4G01060, near SNP125917 and SNP125988) was detected to have additive effects on both 2W and FT10 (Table 1; Figure 3C; Supplementary Figure 1C), and CPL3 gene has pleiotropic effects on flowering development and epidermal cell size of Arabidopsis by regulating internal duplication (Zhang and Shen, 2022).
Notable is, known gene LUH (AT2G32700), located near SNP72736, SNP72705, and SNP72738, exhibited associations with FT22, 2W, and FT10 (Table 1; Figures 3B, C; Supplementary Figure 1C). Furthermore, it displayed both additive and epistatic effects (Table 1; Figures 3B, C; Supplementary Figure 1C). LUH showed epistatic effect at FT10 and FT22, and additive effect at 2W. It was shown that LUH interacts with YAB to regulate distal axis pattern, lateral organ growth, and inflorescence foliation. At the same time, its leaf-based signaling pathway promotes paraxial cell identity in leaves and initiation and maintenance of embryo bud apical meristem SAM (Stahle et al., 2009). More detailed information about the genes surrounding QTNs and QQIs identified by 3VmrMLM can be found in Supplementary Table 3.
Response to different treatments and GO enrichment pathway
We conducted a comprehensive analysis of gene expression changes under different treatments to gain insights into their responses. Through differential expression analysis on the unreported genes, we successfully identified distinct expression patterns of the 35 genes (Supplementary Table 4). Specifically, we found 18 genes that exhibited significant differential expression between 22°C and 10°C treatments (Figure 4A; Supplementary Table 4), 15 were significantly upregulated at 10°C, while only three genes showed significant downregulation at this temperature. For instance, AT3G55980, located near the SNP120225 locus associated with LN22, exhibited a log2FoldChange of 2.79 and a P-value of 1.05E-07, as illustrated in the upper right corner of the volcano plot. This gene was found to be enriched in the nucleus (Figure 4A; Supplementary Table 4). Similarly, 14 genes showed significant differential expression between long-day and short-day treatments (Figure 4B; Supplementary Table 4), suggesting their involvement in light-dependent processes. Specifically, eight genes exhibited significant upregulation under short-day treatments, while six genes were significantly upregulated under long-day treatments. Additionally, we observed differential expression in 3 genes between 4 weeks and 0 weeks treatments (Figure 4C; Supplementary Table 4), highlighting their role in a time-dependent response. These findings offer valuable insights into the biological underpinnings of the newly identified genes associated with flowering-related traits in Arabidopsis.
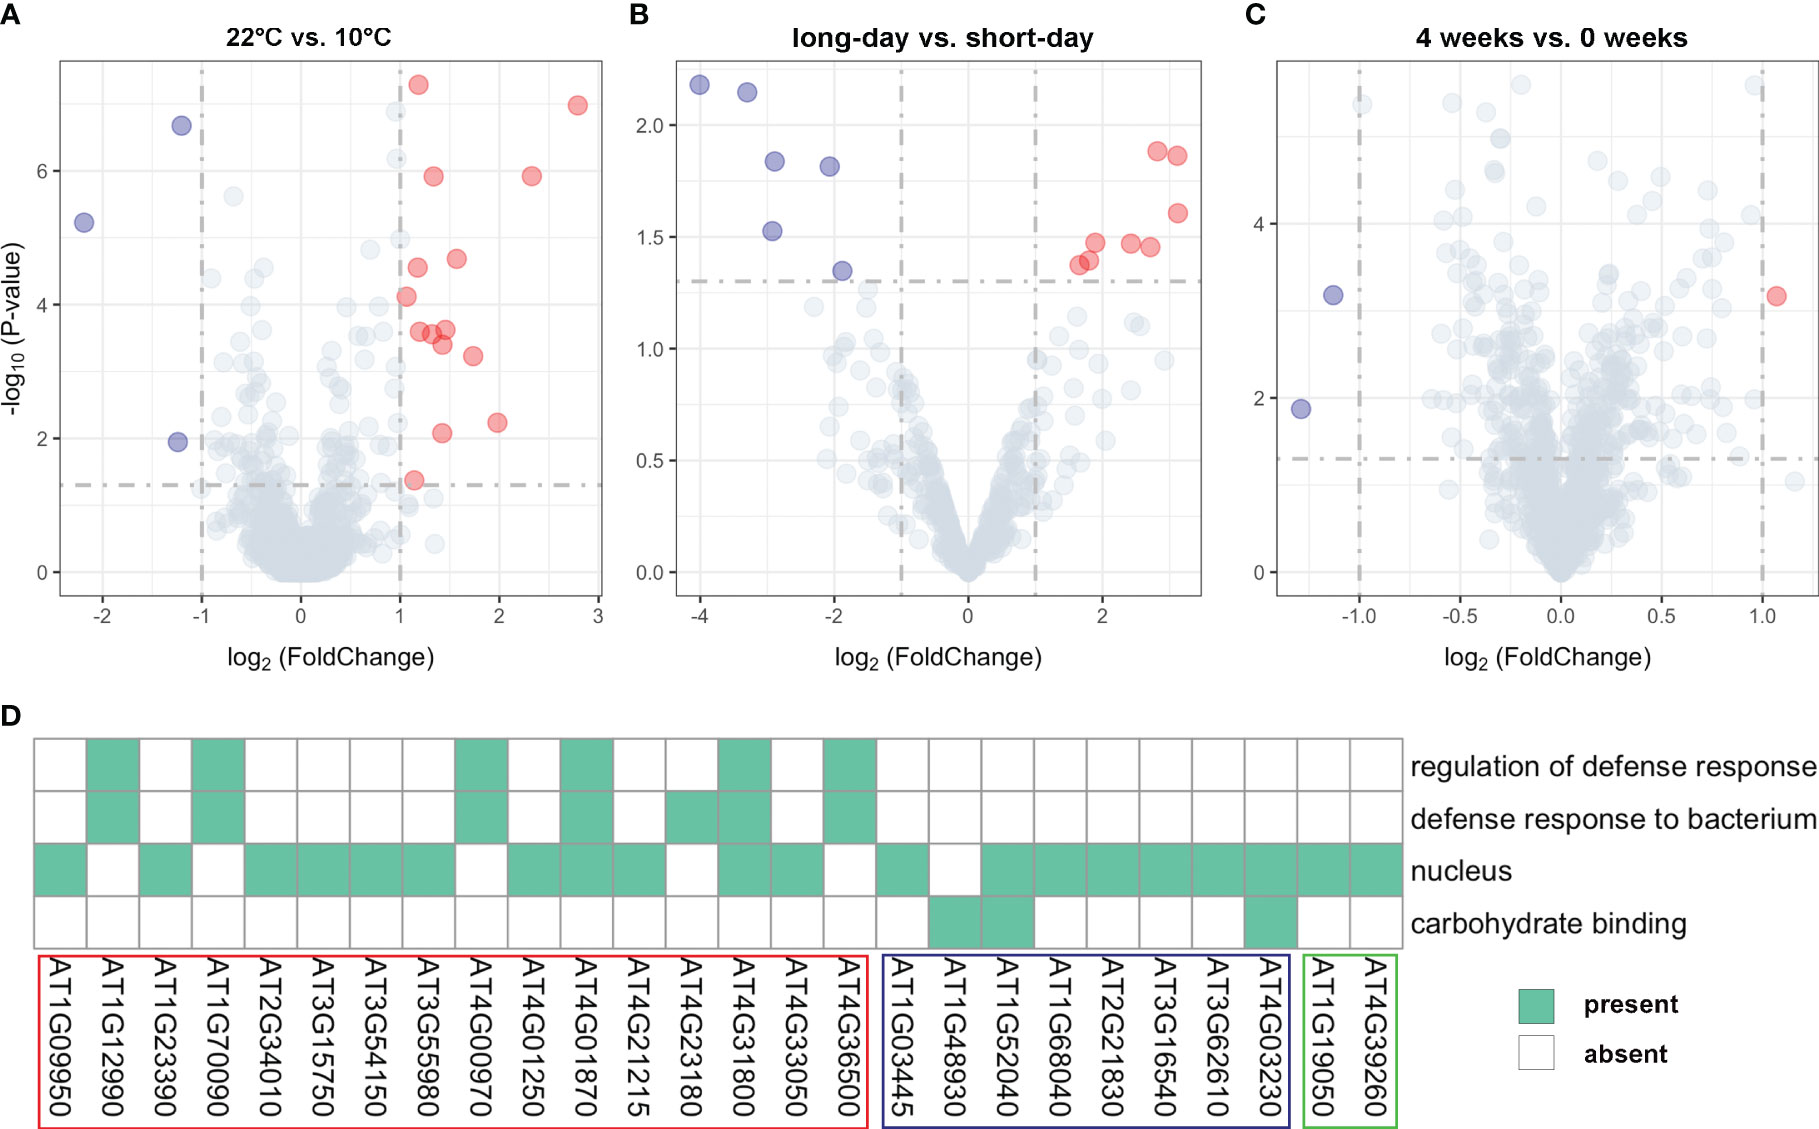
Figure 4 Volcano plots for expression values of (A) 18 genes under different temperature treatments (22°C vs. 10°C), (B) 14 genes under different photoperiod treatments (long-day vs. short-day), and (C) 3 genes under different vernalization time treatments (4 weeks vs. 0 weeks). (D) Results of functional enrichment analysis based on gene ontology. The genes highlighted within the red, blue, and green boxes belong to the group of significant DEGs between 22°C vs. 10°C treatments, long-day vs. short-day treatments, and 4 weeks vs. 0 weeks treatments, respectively.
To gain further functional insights, we performed GO functional enrichment analysis on the identified DEGs. This analysis revealed that out of the 35 DEGs, 26 genes were significantly enriched in 4 distinct GO terms associated with various biological processes (Figure 4D). Furthermore, it was shown that 20 genes located in proximity to QQIs and QTNs were specifically enriched in the nucleus (GO:0005634) (Figure 4D). For example, AT3G55980, known as AtSZF1, has been reported to be associated with the nucleus and is involved in the Arabidopsis salt stress response (Sun et al., 2007). Notably, AT4G01870 and AT4G31800 were found to be simultaneously associated with three important biological processes (Figure 4D). Specifically, AT4G31800, known as WRKY18, enhances developmentally regulated defense responses in transgenic plants without causing significant negative effects on plant growth (Pandey et al., 2010). On the other hand, AT4G01870 is involved in the chemical reactions and pathways leading to the synthesis of camalexin, an indole phytoalexin (https://www.arabidopsis.org/). In addition, we observed three genes AT1G52040, AT4G03230, and AT1G48930 related to carbohydrate binding (Figure 4D), with AT1G48930 possessing a carbohydrate-binding structural domain (CBM49) that plays a role in Arabidopsis root hair and endosperm development, among other functions (del Campillo et al., 2012). Interestingly, we identified a pair of QQIs, AT1G09950 and AT1G12990, in close proximity to the SNP5324 and SNP7584 loci, respectively (Table 2). AT1G09950 is involved in cellular components. It affects seed germination and early seedling growth by increasing sensitivity to abscisic acid (Ren et al., 2010). Meanwhile, AT1G12990 is associated with the regulation of the defense response (GO:0031347) and the defense response against bacteria (GO:0042742) for glycosyltransferase activity (https://www.arabidopsis.org/).
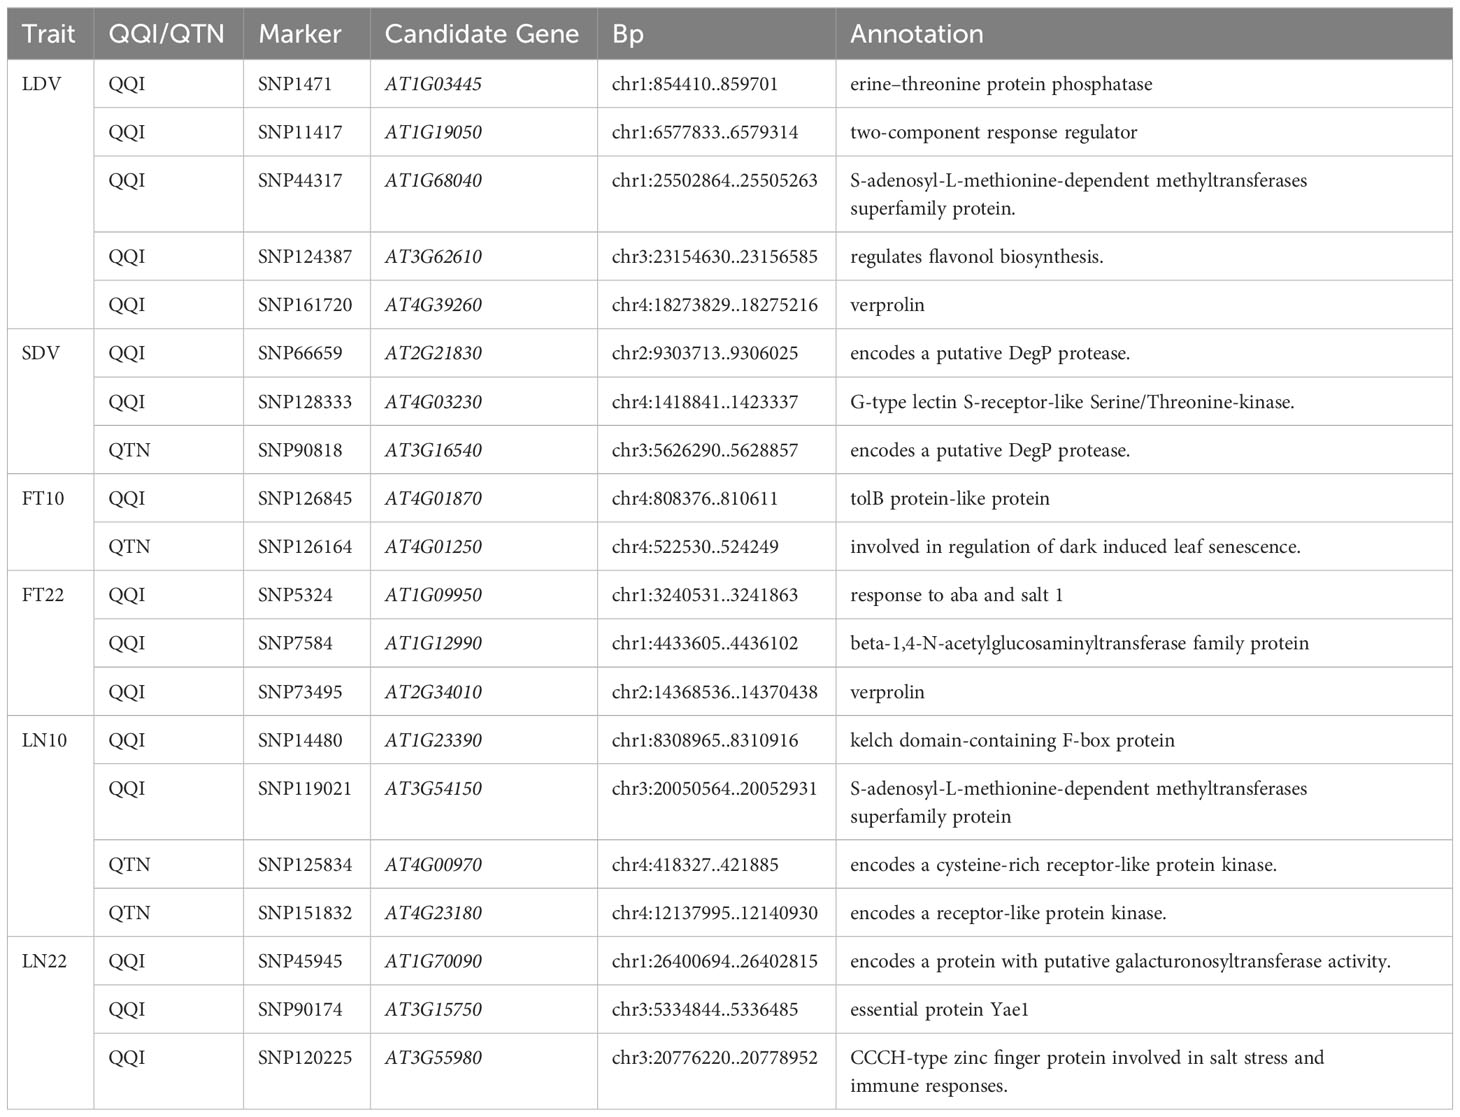
Table 2 Results of 20 candidate genes and functional annotation.
Haplotype and phenotypic difference analysis of candidate genes
To further validate the association between genes and flowering-related traits, we performed haplotype analysis on the SNPs within the 2 kb upstream regions of the 26 genes identified from the GO enrichment analysis. In total, 20 candidate genes were identified, which significant phenotypic differences were observed among their haplotypes (Table 2). These genes were associated with six different traits, namely LDV, SDV, FT10, FT22, LN10, and LN22 (Table 2). Among them, 16 genes were located near QQIs, while 4 genes were located near QTNs. It is worth noting that the loci near AT1G03445 and AT1G68040, which correspond to these genes, also contain previously reported known genes. More detailed information was listed in Table 2; Supplementary Table 5.
Figure 5 illustrates the analysis of AT1G12990 (CDS coordinates [5’-3’]: 4433605-4436102), AT4G01870 (CDS coordinates [5’-3’]: 808376-810611), and AT3G62610 (CDS coordinates [5’-3’]: 23154630-23156585) to reveal intragenic variations impacting flowering time and identify favorable haplotypes. Figure 5A presents the linkage disequilibrium and haplotype block with 8 SNPs for the gene AT1G12990, located near the SNP7584 locus, a QQI for FT22 (Table 2). After removing 53 missing values from the phenotypic data, the remaining 146 individuals were classified into four haplotypes based on seven SNPs (SNP7613, SNP7614, SNP7615, SNP7617, SNP7618, SNP7619, and SNP7620). Haplotype IV (TGTGTTT) exhibited significantly higher median phenotypic values for FT22 compared to the other three haplotypes (Figure 5B). Haplotype IV consisted 25 individuals, among which 12 had a maximum phenotypic value of 250 for the FT22 trait, while the other three haplotypes had values of 1, 4, and 1, respectively. Additionally, a t-test demonstrated significant differences between haplotype IV and haplotypes I (CGGGGTG, P-value = 5.65E-07), II (CGGGTTG, P-value = 9.16E-06), and III (TGGGTTG, P-value = 7.98E-07; Supplementary Table 5). Similarly, the candidate gene AT1G09950 (CDS coordinates [5’-3’]: 4433605-4436102), located near the SNP5324 locus, showed an interaction effect with the SNP7584 locus for the FT22 trait. Supplementary Figure 2A depicts the linkage disequilibrium and haplotype block analysis using 11 SNPs. After removing 42 missing values from the phenotype data, the remaining 157 individuals were divided into three haplotypes based on seven SNPs (SNP5265, SNP5266, SNP5267, SNP5268, SNP5269, SNP5271, and SNP5272). Supplementary Figure 2B demonstrates significant differences between haplotype I (ATATAGT) and haplotype III (GAGGTCT, P-value = 1.73E-02; Supplementary Table 5). Therefore, we inferred that the candidate genes AT1G12990 and AT1G09950 may interact with each other and play a role in flowering time regulation in Arabidopsis.
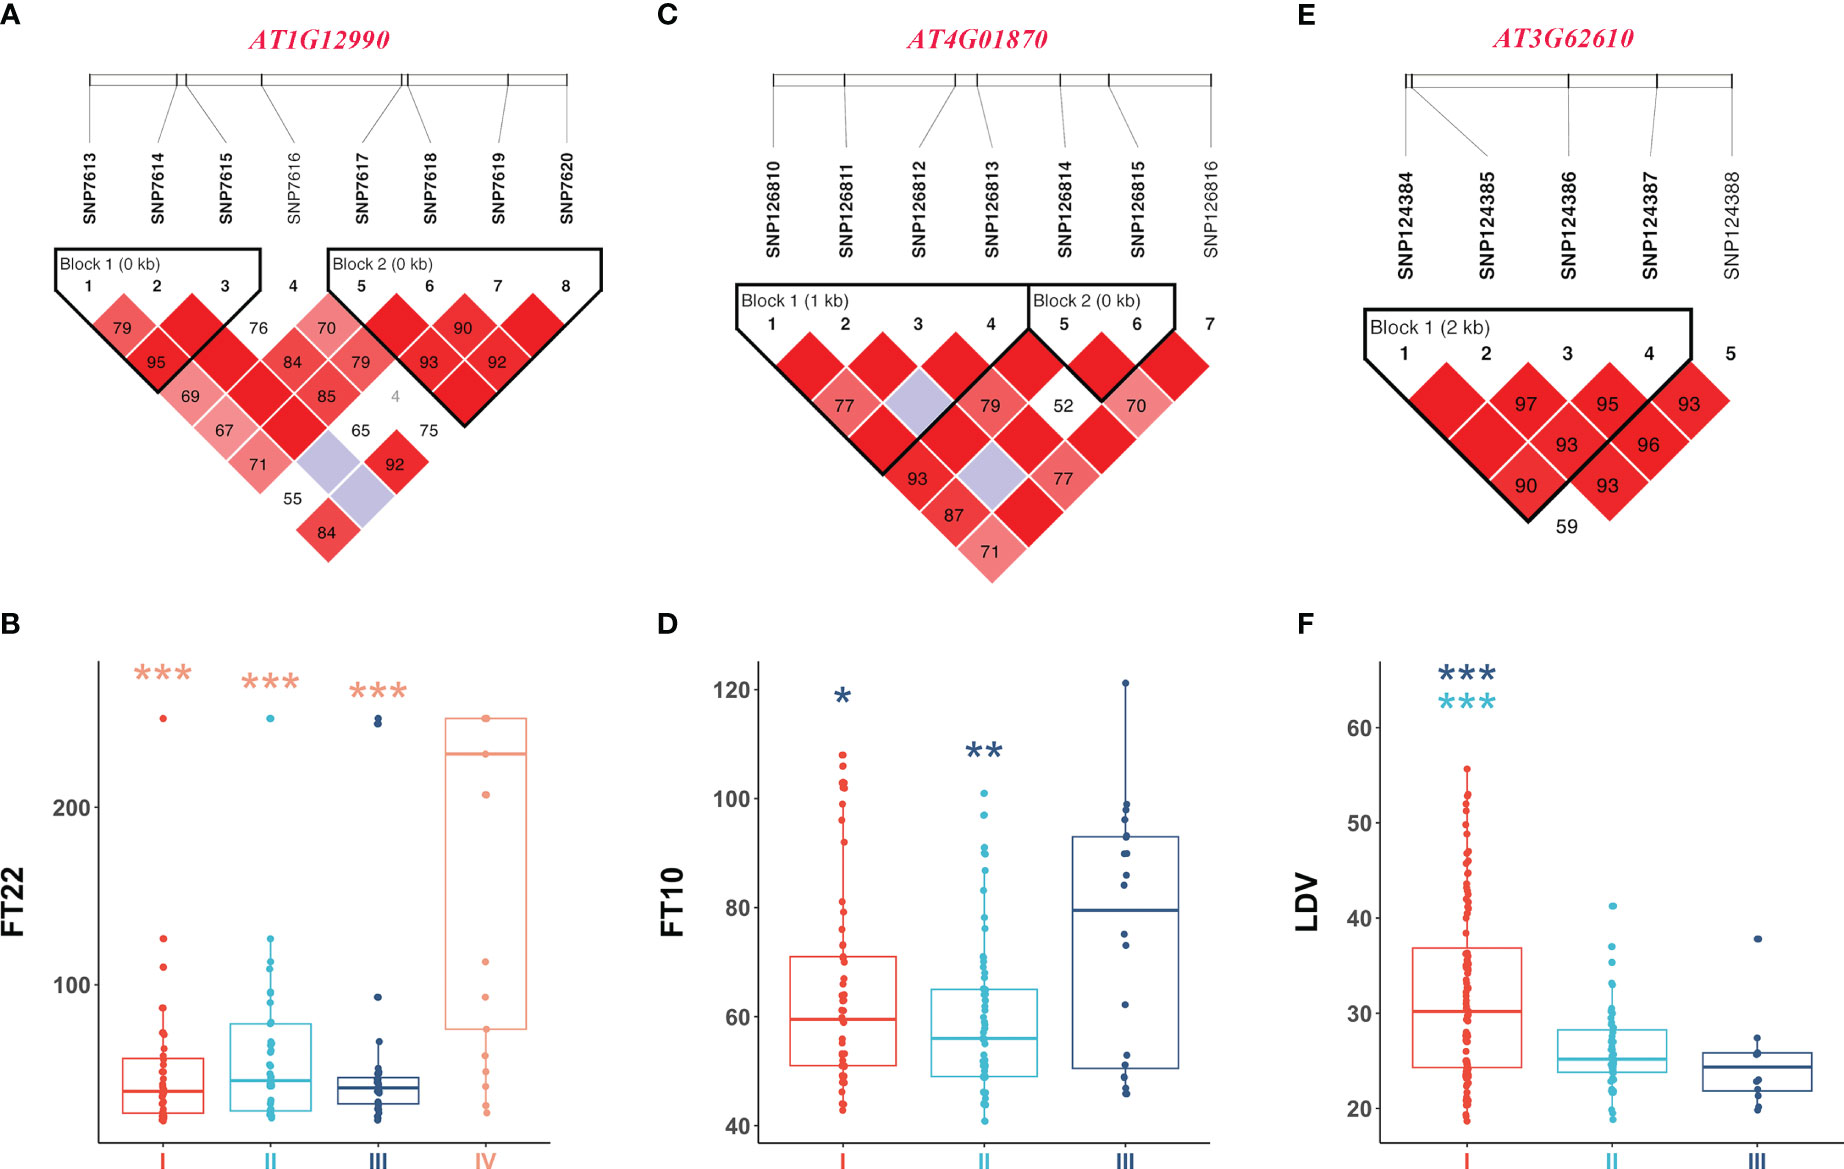
Figure 5 Linkage disequilibrium and haplotype block analysis for the candidate genes (A) AT1G12990 associated with FT22, (C) AT4G01870 associated with FT10, and (E) AT3G62610 associated with LDV, respectively. (B) Comparison of FT22 across various haplotypes I (CGGGGTG), II (CGGGTTG), III (TGGGTTG), and IV (TGTGTTT). (D) Comparison of FT10 across various haplotypes I (GTCTGG), II (TTGTTG), and III (TTGTTT). (F) Comparison of LDV across various haplotypes I (AAAG), II (AGTA), and III (CGTA). In the boxplots, the center line represents the median, the box limits indicate the upper and lower quartiles, and the whiskers extend 1.5 times the interquartile range. Data points beyond the whiskers are considered outliers and plotted individually. The number of stars indicates the significance level from t-test (*0.05, **0.01, ***0.001).
Figures 5C, D present the haplotype block and phenotype differences of the candidate gene AT4G01870, detected around the SNP126845 locus, a QQI for FT10 (Table 2; Supplementary Table 5). Haplotype III (TTGTTT) exhibited the highest median phenotypic values and showed significant differences with haplotype I (GTCTGG, P-value = 4.20E-02) and haplotype II (TTGTTG, P-value = 6.87E-03; Supplementary Table 5). Similarly, the candidate gene AT3G62610 was detected around the SNP124387 locus, a QQI for LDV (Table 2; Supplementary Table 5). Figures 5E, F illustrate the haplotype block and phenotype differences. Hence, we suggest that the candidate genes AT4G01870 and AT3G62610 may influence the flowering time in Arabidopsis.
Additionally, the candidate gene AT4G01250 (CDS coordinates [5’-3’]: 522530-524249) was detected around the SNP126164 locus, a QTN for FT10, while the candidate gene AT4G00970 (CDS coordinates [5’-3’]: 418327-421885) was detected near the SNP125834 locus, a QTN for LN10 (Table 2; Supplementary Table 5). Supplementary Figures 2C–F display the haplotype block and phenotype differences of these two genes. We hypothesize that the candidate genes AT4G01250 and AT4G00970 may also affect the flowering time in Arabidopsis.
In summary, we propose that the four candidate genes mentioned above, located near QQIs, may exert potential influence on their corresponding traits, among them AT1G12990 and AT1G09950 might have gene-by-gene interaction. Furthermore, several candidate genes near QTNs exhibited significant differences in phenotypes across haplotypes (Supplementary Table 5). However, further experimental verification is required to determine whether these candidate genes interact with each other in regulating flowering in Arabidopsis.
Discussion
Levene’s test for potential epistasis
Due to the substantial computational requirements in QQI detection, particularly when considering the population structure and polygenic backgrounds in 3VmrMLM, it is advisable to limit the number of markers to less than 5,000 (Li et al., 2022a; Li et al., 2022b). To obtain the potential epistasis and alleviate the computational burden, we employed Levene’s test, which can be used to detect potential loci for heterogeneity of variances due to potentially interacting SNPs such as QTN-by-QTN interactions (Zhang et al., 2019). However, the direct application of Levene’s test to the raw data did not reveal any significant interacting loci due to the large number of markers and the stringent threshold of the Bonferroni correction. Moreover, potential limitations of Levene’s test include no covariates are allowed and only equality of variances, but not means, can be tested (Dumitrascu et al., 2019), that is, it could neither consider the population structure nor obtain the effect estimate of markers. Therefore, for each trait, we firstly selected the top 5,000 significantly associated variance-controlling SNPs detected by Levene’s test, which also exhibited that P values were less than 0.05, and then performed QQI detection of 3VmrMLM using these top 5,000 loci for input. Combining potential epistasis loci selection with 3VmrMLM significantly improves detection accuracy while greatly reducing computation time.
Genetic basis for flowering-related traits in Arabidopsis
3VmrMLM detected 130 QQIs and 89 QTNs significantly associated with 11 flowering-related traits in the analysis of epistasis. Among them, the PVE of QQIs for the traits LD, LDV, and FT22 were 25.856%, 23.438%, and 19.163%, respectively (Figures 2A, B, E), which were higher than those of QTNs at 22.193%, 21.863%, and 18.446% (Figures 2A, B, E), indicating that QQIs contribute more to phenotypic variation than QTNs for these three traits and epistasis is a non-negligible factor contributing to phenotypic variation. Notably, A pair of loci SNP66960 and SNP71678, located on chromosome 2 under LD, had the highest PVE among all traits in terms of QQI, at 8.187% (Supplementary Table 1). In its vicinity, the known gene SVP (AT2G22540; Supplementary Figure 1A; Supplementary Table 3) has been shown to be an important regulator during the transition to flowering and floral development, while SVP interacts with OsMADS22 and OsMADS47 to interfere with normal Arabidopsis flower development (Fornara et al., 2008).
The known genes BRN2 (AT1G03457) located near QQI SNP1471 (P-value = 4.32628E-15, LOD = 3.2212) and FKF1 (AT1G68050) located near QQI SNP44317 (P-value = 1.37721E-07, LOD = 5.8963; Figure 3A; Supplementary Table 3) are both associated with LDV and interact with AtBRN, CDF2 protein to promote or repress flowering in Arabidopsis, respectively (Kim et al., 2013). The known gene SPA4 (AT1G53090) associated with FT22 is located near QQI SNP32482 (P-value=1.35181E-08, LOD=7.0044; Figure 3B; Supplementary Table 3). SPA4 is involved in regulating Arabidopsis photoperiodic flowering and was found to interact with both CO, PAP1 and PAP2 to jointly regulate flowering stability and growth under light conditions (Laubinger et al., 2006; Maier et al., 2013).Two known genes, FT (AT1G65480) and FAS1 (AT1G65470), were detected simultaneously near QQI SNP42063 (P-value=9.97104E-07, LOD=5.6226) under the LN10 trait (Figure 3D; Supplementary Table 3), where FT interacts with FD (AT4G35900), and 14-3-3 proteins interact to produce florigen-activation complex to control flowering time and correct expression of floral homologs and promote flowering (Collani et al., 2019). On the other hand, the known genes with QTN effects FD (AT4G35900, near QTN SNP159681; Hanano and Goto, 2011; Gorham et al., 2018), AGL28 (AT1G01530, near QTN SNP350; Yoo et al., 2006), MBR2 (AT4G34040, near QTN SNP158615; Iñigo et al., 2012) and 8 other genes have been reported to influence flowering through different pathways to exert either facilitative or repressive effects on flowering (Figure 3; Supplementary Figure 1; Supplementary Table 3).
Note that we also uncovered five pleiotropic known genes that act on multiple traits in terms of QQI or QTN. The known gene AGL17 (AT2G22630), detected around QQI SNP67001, SNP66970, and SNP66990, is associated with three traits FT22, LD, and LN22 (Table 1; Figure 3B; Supplementary Figures 1A, G). It has been shown to be positively regulated by the photoperiod pathway regulator CO to promote flowering in Arabidopsis (Han et al., 2008). The known genes ATH1 (AT4G32980, around QQI SNP15783; Table 1; Figure 3A; Supplementary Figure 1D) associated with LDV and 0W are required for the control of Arabidopsis flower stem morphology and interact with KNAT2 to help regulate flower tip development (Li et al., 2012). BOP2 (AT2G41370) was detected around QQI SNP77354 and QQI SNP77376 were detected in the vicinity, associated with 2W and LN10 (Table 1; Figures 3C, D), and BOP2 proteins interaction with LFY has been reported to shorten flowering time in a short period of time (Chahtane et al., 2018). The known gene CPL3 (AT4G01060, around QTN SNP125988 and QTN SNP125917) was detected to have additive effects on both FT10 and 2W (Table 1; Figure 3C; Supplementary Figure 1C), confirming a pleiotropic effect on flowering development in Arabidopsis (Zhang and Shen, 2022). The known gene LUH (AT2G32700, around QQI SNP72736, QTN SNP72705, and QQI SNP72738) was uncovered to be involved not only in three traits FT22, 2W, and FT10, but also found to have additive and epistatic effects (Table 1; Figures 3B, C; Supplementary Figure 1C), and studies showed that LUH interacts with YAB and plays a regulatory role on lateral organ growth and inflorescence leaf management (Stahle et al., 2009). The phenotypic association results of BOP2 (AT2G41370) and CPL3 (AT4G01060) were consistent with the phenotypic clustering results shown in Figure 1A. Additionally, the traits LN22 and FT22 associated with AGL17 (AT2G22630), as well as the traits 2W and FT10 associated with LUH (AT2G32700), were also grouped together (Figure 1A; Table 1). These findings further support the reliability of our analysis.
Except for known genes, we also identified 20 candidate genes in this study (Table 2). Among them, AT1G12990, AT1G09950, AT4G01870, and AT3G62610, located near QQIs, specially, former two genes showed potential gene-by-gene interactions related to flowering traits in Arabidopsis. Specifically, AT1G12990 was found in proximity to the SNP7584 locus, while AT1G09950 was found near the SNP5324 locus, and remarkably, these loci coincided with a significant pair of QQIs associated with the trait FT22 (P-value = 7.08064E-05, LOD = 3.4287; Supplementary Table 1). AT4G01870 was detected near the SNP126845 locus, forming a QQI with SNP185421 for FT10 (P-value = 5.12209E-08, LOD = 6.443; Supplementary Table 1). Additionally, AT3G62610 was found around the SNP124387 locus, forming a QQI with SNP69012 for LDV (P-value = 4.70143E-06, LOD = 4.5505; Supplementary Table 1). These candidate genes also showed differential expression under 22°C vs. 10°C and long-days vs. short-days treatments (Figures 4B, C; Supplementary Table 4). AT1G12990 and AT4G01870 were associated with the regulation of defense response (GO:0031347) and defense response to bacterium (GO:0042742), while AT1G09950, AT4G01870, and AT3G62610 were involved in nucleus-related functions (GO:0005634). Notably, significant phenotypic differences were observed across different haplotypes. Therefore, we hypothesize that these candidate genes, namely AT1G12990, AT1G09950, AT4G01870, and AT3G62610, in proximity of QQIs, may play a role in influencing flowering in Arabidopsis. Specially, AT1G12990 and AT1G09950 might exist potential gene-by-gene interaction. However, further experimental validation, such as functional validation, is necessary to explore these gene-by-gene interactions for flowering-related traits.
Methods comparison
To better analyze the QQIs results obtained from the 3VmrMLM method, we performed epistasis analysis in the raw dataset using PLINK (Purcell et al., 2007). The command used for detecting pairs of epistatic loci was “plink --file genotype --pheno phenoq.txt --epistasis --epi1 P-value --allow-no-sex --out result”, with a threshold using Bonferroni correction. The number of significant interacting loci detected for each trait using PLINK ranged from 2,903 to 41,132 (Supplementary Table 6). It is well-known that PLINK uses a simple linear model, which computes quickly even with large sample sizes, but it does not consider the polygenic background, leading to an increased false positive rate (Purcell et al., 2007). In addition, except for trait 0W, the number of significant QQIs detected by PLINK that overlap with those detected by 3VmrMLM ranged from 1 to 34. Among them, for trait FT22, PLINK detected a total of 41,132 QQIs, out of which 34 were simultaneously detected by 3VmrMLM (Supplementary Table 6). This suggests that QQIs detected by 3VmrMLM are likely to be potential interacting loci.
We also employed the REMMA method (Ning et al., 2018), a mixed linear model-based approach, for conducting epistasis analysis in the raw dataset. This method incorporates both additive and dominance relationship matrices, offering theoretical control over Type I errors when examining pairwise epistatic SNPs. Among the eleven traits, three (SDV, FT22, and 8W) showed significant interacting loci, with 429, 72, and 3,541 loci detected, respectively (Supplementary Table 6). The QQIs associated with SDV overlapped with those detected by 3VmrMLM (Supplementary Table 6).
Similarly, we employed the QMDR approach (Yu et al., 2015) based on machine learning to analyze epistasis. Because no results were obtained in the raw dataset due to the large number of markers and strict Bonferroni correction threshold. Thus, the strategy for top 5,000 marker selection and LOD scores greater than 3.0 was identical to that described for 3VmrMLM in order to be comparable. As listed in Supplementary Table 6, only six traits (LD, SDV, FT22, LN22, 4W, and 8W) showed significant interaction loci, while the remaining traits did not. Overall, 3VmrMLM excels in both efficiency and accuracy when analyzing epistasis.
Conclusion
In this study, we performed the novel 3VmrMLM method in GWAS to investigate the epistatic association with eleven flowering-related traits in Arabidopsis. A total of 130 pairs of QQIs and 89 QTNs were successfully detected. Furthermore, through genome annotation and previous research, 29 known genes around QQIs and 12 known genes around QTNs were identified. Among the above known genes, five genes, namely AGL17 (AT2G22630), ATH1 (AT4G32980), BOP2 (AT2G41370), CPL3 (AT4G01060), and LUH (AT2G32700), were demonstrated an epistatic or additive effect for at least two traits. Moreover, 16 candidate genes around QQIs and 4 candidate genes around QTNs were validated using differential expression analysis, functional enrichment analysis, and haplotype and phenotypic difference analysis. Notably, AT1G12990 and AT1G09950 around QQIs exhibited potential gene-by-gene interactions influencing flowering. These findings contribute to the identification and exploration of epistasis associated with flowering-related traits in Arabidopsis.
Data availability statement
The datasets presented in this study can be found in online repositories. The names of the repository/repositories and accession number(s) can be found in the article/Supplementary Material.
Author contributions
LH: Data curation, Formal analysis, Investigation, Validation, Visualization, Writing – original draft. BS: Data curation, Formal analysis, Investigation, Validation, Visualization, Writing – original draft. XW: Data curation, Resources, Writing – review & editing. JZ: Writing – review & editing, Funding acquisition. Y-JW: Conceptualization, Funding acquisition, Supervision, Writing – review & editing.
Funding
The author(s) declare financial support was received for the research, authorship, and/or publication of this article. The work was supported by the National Natural Science Foundation of China (32070688 and 32270694), the Postdoctoral Science Foundation of Jiangsu (2020Z330), and the Fundamental Research Funds for the Central Universities (JCQY202108).
Conflict of interest
The authors declare that the research was conducted in the absence of any commercial or financial relationships that could be construed as a potential conflict of interest.
Publisher’s note
All claims expressed in this article are solely those of the authors and do not necessarily represent those of their affiliated organizations, or those of the publisher, the editors and the reviewers. Any product that may be evaluated in this article, or claim that may be made by its manufacturer, is not guaranteed or endorsed by the publisher.
Supplementary material
The Supplementary Material for this article can be found online at: https://www.frontiersin.org/articles/10.3389/fpls.2023.1283642/full#supplementary-material
Supplementary Figure 1 | Chord diagrams for QQIs and QTNs detected by 3VmrMLM. (A~G) correspond to the traits LD, SDV, FT10, 0W, 4W, 8W, and LN22, respectively. The inner circle displays the detected QQIs or QTNs (△ indicates overlapping loci between QQIs and QTNs), the height of red dots represents the epistatic effects of QQI pairs, and the height of blue dots represents the additive effects of corresponding QTNs. The outer circle indicates the known genes in vicinity of significant loci.
Supplementary Figure 2 | Linkage disequilibrium and haplotype block for the candidate gene (A) AT1G09950 associated with FT22, (C) AT4G01250 associated with FT10, and (E) AT4G00970 associated with LN10. (B) Comparison of FT22 across various haplotypes I (ATATAGT), II (GAGGACT), and III (GAGGTCT). (D) Comparison of FT10 across various haplotypes I (TATACTATCT), II (TGGACCATCA), III (TGGACTAAAT), and IV (TGGACTATCT). (F) Comparison of LN10 across various haplotypes I (AGCCCACTGA), II (AGCTCGCCGT), III (CAATCGCCGT), and IV (CAATGGCCCT). For boxplots, center line shows median, box limits indicate upper and lower quartiles, and whiskers extend 1.5 times the interquartile range, while data beyond the end of the whiskers are outlying points that are plotted individually. The number of stars represents the result of t test at different significance levels (*: 0.05, **: 0.01, ***: 0.001).
Supplementary Data Sheet | All the phenotypic values of the traits and all the marker genotypes, which are derived from Atwell et al. Nature 2010; 465(7298), 627-631.
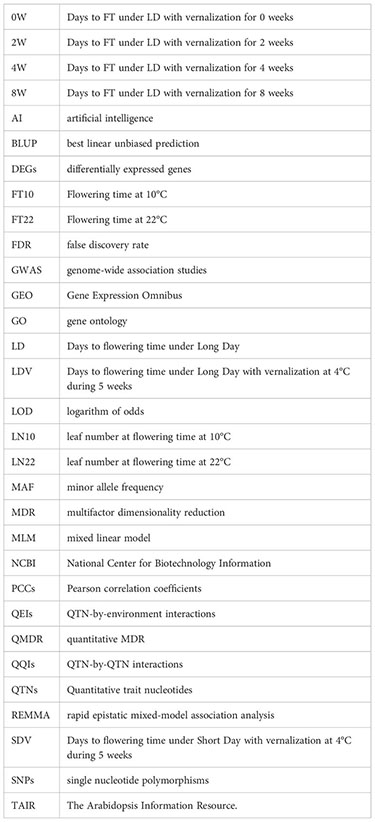
Glossary
References
Atwell, S., Huang, Y. S., Vilhjalmsson, B. J., Willems, G., Horton, M., Li, Y., et al. (2010). Genome-wide association study of 107 phenotypes in Arabidopsis thaliana inbred lines. Nature 465 (7298), 627–631. doi: 10.1038/nature08800
Balasubramanian, S., Sureshkumar, S., Lempe, J., Weigel, D. (2006). Potent induction of Arabidopsis thaliana flowering by elevated growth temperature. PloS Genet. 2 (7), e106. doi: 10.1371/journal.pgen.0020106
Barrett, J. C., Fry, B., Maller, J., Daly, M. J. (2005). Haploview: Analysis and visualization of LD and haplotype maps. Bioinformatics 21 (2), 263–265. doi: 10.1093/bioinformatics/bth457
Breen, M. S., Kemena, C., Vlasov, P. K., Notredame, C., Kondrashov, F. A. (2012). Epistasis as the primary factor in molecular evolution. Nature 490 (7421), 535–538. doi: 10.1038/nature11510
Brown, M. B., Forsythe, A. B. (1974). Robust tests for the equality of variances. J. Am. Stat. Assoc. 69 (346), 364–367. doi: 10.1080/01621459.1974.10482955
Chahtane, H., Zhang, B., Norberg, M., LeMasson, M., Thevenon, E., Bako, L., et al. (2018). LEAFY activity is post-transcriptionally regulated by BLADE ON PETIOLE2 and CULLIN3 in Arabidopsis. New Phytol. 220 (2), 579–592. doi: 10.1111/nph.15329
Collani, S., Neumann, M., Yant, L., Schmid, M. (2019). FT modulates genome-wide DNA-Binding of the bZIP transcription factor FD. Plant Physiol. 180 (1), 367–380. doi: 10.1104/pp.18.01505
del Campillo, E., Gaddam, S., Mettle-Amuah, D., Heneks, J. (2012). A tale of two tissues: AtGH9C1 is an endo-β-1,4-glucanase involved in root hair and endosperm development in Arabidopsis. PloS One 7 (11), e49363. doi: 10.1371/journal.pone.0049363
Dumitrascu, B., Darnell, G., Ayroles, J., Engelhardt, B. E. (2019). Statistical tests for detecting variance effects in quantitative trait studies. Bioinformatics 35 (2), 200–210. doi: 10.1093/Bioinformatics/bty565
Fornara, F., Gregis, V., Pelucchi, N., Colombo, L., Kater, M. (2008). The rice StMADS11-like genes OsMADS22 and OsMADS47 cause floral reversions in Arabidopsis without complementing the svp and agl24 mutants. J. Exp. Bot. 59 (8), 2181–2190. doi: 10.1093/jxb/ern083
Gorham, S. R., Weiner, A. I., Yamadi, M., Krogan, N. T. (2018). HISTONE DEACETYLASE 19 and the flowering time gene FD maintain reproductive meristem identity in an age-dependent manner. J. Exp. Bot. 69 (20), 4757–4771. doi: 10.1093/jxb/ery239
Gui, J., Moore, J. H., Williams, S. M., Andrews, P., Hillege, H. L., van der Harst, P., et al. (2013). A simple and computationally efficient approach to multifactor dimensionality reduction analysis of gene-gene interactions for quantitative traits. PloS One 8 (6), e66545. doi: 10.1371/journal.pone.0066545
Han, P., Garcia-Ponce, B., Fonseca-Salazar, G., Alvarez-Buylla, E. R., Yu, H. (2008). AGAMOUS-LIKE 17, a novel flowering promoter, acts in a FT-independent photoperiod pathway. Plant J. 55 (2), 253–265. doi: 10.1111/j.1365-313X.2008.03499.x
Hanano, S., Goto, K. (2011). Arabidopsis TERMINAL FLOWER1 is involved in the regulation of flowering time and inflorescence development through transcriptional repression. Plant Cell 23 (9), 3172–3184. doi: 10.1105/tpc.111.088641
He, T., Hill, C. B., Angessa, T. T., Zhang, X. Q., Chen, K., Moody, D., et al. (2019). Gene-set association and epistatic analyses reveal complex gene interaction networks affecting flowering time in a worldwide barley collection. J. Exp. Bot. 70 (20), 5603–5616. doi: 10.1093/jxb/erz332
Helliwell, C. A., Anderssen, R. S., Robertson, M., Finnegan, E. J. (2015). How is FLC repression initiated by cold? Trends Plant Sci. 20 (2), 76–82. doi: 10.1016/j.tplants.2014.12.004
Imaizumi, T., Kay, S. A. (2006). Photoperiodic control of flowering: not only by coincidence. Trends Plant Sci. 11 (11), 550–558. doi: 10.1016/j.tplants.2006.09.004
Iñigo, S., Giraldez, A. N., Chory, J., Cerdan, P. D. (2012). Proteasome-mediated turnover of Arabidopsis MED25 is coupled to the activation of FLOWERING LOCUS T transcription. Plant Physiol. 160 (3), 1662–1673. doi: 10.1104/pp.112.205500
Jetha, K., Theißen, G., Melzer, R. (2014). Arabidopsis SEPALLATA proteins differ in cooperative DNA-binding during the formation of floral quartet-like complexes. Nucleic Acids Res. 42 (17), 10927–10942. doi: 10.1093/nar/gku755
Kim, H. S., Abbasi, N., Choi, S. B. (2013). Bruno-like proteins modulate flowering time via 3’ UTR-dependent decay of SOC1 mRNA. New Phytol. 198 (3), 747–756. doi: 10.1111/nph.12181
Koornneef, M., Meinke, D. (2010). The development of Arabidopsis as a model plant. Plant J. 61 (6), 909–921. doi: 10.1111/j.1365-313X.2009.04086.x
Laubinger, S., Marchal, V., Le Gourrierec, J., Wenkel, S., Adrian, J., Jang, S., et al. (2006). Arabidopsis SPA proteins regulate photoperiodic flowering and interact with the floral inducer CONSTANS to regulate its stability. Development 133 (16), 3213–3222. doi: 10.1242/dev.02481
Lazaro, A., Mouriz, A., Pineiro, M., Jarillo, J. A. (2015). Red light-mediated degradation of CONSTANS by the E3 ubiquitin ligase HOS1 regulates photoperiodic flowering in Arabidopsis. Plant Cell 27 (9), 2437–2454. doi: 10.1105/tpc.15.00529
Lee, C. M., Feke, A., Li, M. W., Adamchek, C., Webb, K., Pruneda-Paz, J., et al. (2018). Decoys untangle complicated redundancy and reveal targets of circadian clock F-box proteins. Plant Physiol. 177 (3), 1170–1186. doi: 10.1104/pp.18.00331
Li, Y., Pi, L., Huang, H., Xu, L. (2012). ATH1 and KNAT2 proteins act together in regulation of plant inflorescence architecture. J. Exp. Bot. 63 (3), 1423–1433. doi: 10.1093/jxb/err376
Li, M., Zhang, Y. W., Zhang, Z. C., Xiang, Y., Liu, M. H., Zhou, Y. H., et al. (2022a). A compressed variance component mixed model for detecting QTNs and QTN-by-environment and QTN-by-QTN interactions in genome-wide association studies. Mol. Plant 15 (4), 630–650. doi: 10.1016/j.molp.2022.02.012
Li, M., Zhang, Y. W., Xiang, Y., Liu, M. H., Zhang, Y. M. (2022b). IIIVmrMLM: The R and C++ tools associated with 3VmrMLM, a comprehensive GWAS method for dissecting quantitative traits. Mol. Plant 15 (8), 1251–1253. doi: 10.1016/j.molp.2022.06.002
Mackay, T. F., Moore, J. H. (2014). Why epistasis is important for tackling complex human disease genetics. Genome Med. 6 (6), 124. doi: 10.1186/gm561
Maier, A., Schrader, A., Kokkelink, L., Falke, C., Welter, B., Iniesto, E., et al. (2013). Light and the E3 ubiquitin ligase COP1/SPA control the protein stability of the MYB transcription factors PAP1 and PAP2 involved in anthocyanin accumulation in Arabidopsis. Plant J. 74 (4), 638–651. doi: 10.1111/tpj.12153
Mockler, T., Yang, H., Yu, X., Parikh, D., Cheng, Y. C., Dolan, S., et al. (2003). Regulation of photoperiodic flowering by Arabidopsis photoreceptors. Proc. Natl. Acad. Sci. U.S.A. 100 (4), 2140–2145. doi: 10.1073/pnas.0437826100
Moore, J. H. (2004). Computational analysis of gene-gene interactions using multifactor dimensionality reduction. Expert Rev. Mol. Diagn. 4 (6), 795–803. doi: 10.1586/14737159.4.6.795
Ning, C., Wang, D., Kang, H., Mrode, R., Zhou, L., Xu, S., et al. (2018). A rapid epistatic mixed-model association analysis by linear retransformations of genomic estimated values. Bioinformatics 34 (11), 1817–1825. doi: 10.1093/bioinformatics/bty017
Pandey, S. P., Roccaro, M., Schön, M., Logemann, E., Somssich, I. E. (2010). Transcriptional reprogramming regulated by WRKY18 and WRKY40 facilitates powdery mildew infection of Arabidopsis. Plant J. 64 (6), 912–923. doi: 10.1111/j.1365-313X.2010.04387.x
Purcell, S., Neale, B., Todd-Brown, K., Thomas, L., Ferreira, M. A., Bender, D., et al. (2007). PLINK: a tool set for whole-genome association and population-based linkage analyses. Am. J. Hum. Genet. 81 (3), 559–575. doi: 10.1086/519795
Qi, X. H., Wu, D. T., Li, G. Z., Zhao, J. L., Li, M. L. (2018). Regulation pathways of flowering in Arabidopsis thaliana. J. Shanxi Agric. Univ. (Nat. Sci.) 38 (9), 1–8. doi: 10.13842/j.cnki.isn1671-8151.201805004
Ranjan, A., Fiene, G., Fackendahl, P., Hoecker, U. (2011). The Arabidopsis repressor of light signaling SPA1 acts in the phloem to regulate seedling de-etiolation, leaf expansion and flowering time. Development 138 (9), 1851–1862. doi: 10.1242/dev.061036
Ren, Z., Zheng, Z., Chinnusamy, V., Zhu, J., Cui, X., Iida, K., et al. (2010). RAS1, a quantitative trait locus for salt tolerance and ABA sensitivity in Arabidopsis. Proc. Natl. Acad. Sci. U.S.A. 107 (12), 5669–5674. doi: 10.1073/pnas.0910798107
Stahle, M. I., Kuehlich, J., Staron, L., von Arnim, A. G., Golz, J. F. (2009). YABBYs and the transcriptional corepressors LEUNIG and LEUNIG_HOMOLOG maintain leaf polarity and meristem activity in Arabidopsis. Plant Cell 21 (10), 3105–3118. doi: 10.1105/tpc.109.070458
Stern, M. D., Aihara, H., Cho, K. H., Kim, G. T., Horiguchi, G., Roccaro, G. A., et al. (2007). Structurally related Arabidopsis ANGUSTIFOLIA is functionally distinct from the transcriptional corepressor CtBP. Dev. Genes Evol. 217 (11-12), 759–769. doi: 10.1007/s00427-007-0186-8
Sun, J., Jiang, H., Xu, Y., Li, H., Wu, X., Xie, Q., et al. (2007). The CCCH-type zinc finger proteins AtSZF1 and AtSZF2 regulate salt stress responses in Arabidopsis. Plant Cell Physiol. 48 (8), 1148–1158. doi: 10.1093/pcp/pcm088
Teper-Bamnolker, P., Samach, A. (2005). The flowering integrator FT regulates SEPALLATA3 and FRUITFULL accumulation in Arabidopsis leaves. Plant Cell 17 (10), 2661–2675. doi: 10.1105/tpc.105.035766
Upton, A., Trelles, O., Cornejo-Garcia, J. A., Perkins, J. R. (2016). Review: High-performance computing to detect epistasis in genome scale data sets. Brief. Bioinform. 17 (3), 368–379. doi: 10.1093/bib/bbv058
Wan, X., Yang, C., Yang, Q., Xue, H., Fan, X., Tang, N. L., et al. (2010). BOOST: A fast approach to detecting gene-gene interactions in genome-wide case-control studies. Am. J. Hum. Genet. 87 (3), 325–340. doi: 10.1016/j.ajhg.2010.07.021
Yoo, S. K., Lee, J. S., Ahn, J. H. (2006). Overexpression of AGAMOUS-LIKE 28 (AGL28) promotes flowering by upregulating expression of floral promoters within the autonomous pathway. Biochem. Biophys. Res. Commun. 348 (3), 929–936. doi: 10.1016/j.bbrc.2006.07.121
Yu, W., Kwon, M. S., Park, T. (2015). Multivariate quantitative multifactor dimensionality reduction for detecting gene-gene interactions. Hum. Hered. 79 (3-4), 168–181. doi: 10.1159/000377723
Zhang, F., Boerwinkle, E., Xiong, M. (2014). Epistasis analysis for quantitative traits by functional regression model. Genome Res. 24 (6), 989–998. doi: 10.1101/gr.161760.113
Zhang, F., Chen, W., Zhu, Z., Zhang, Q., Nabais, M. F., Qi, T., et al. (2019). OSCA: a tool for omic-data-based complex trait analysis. Genome Biol. 20 (1), 107. doi: 10.1186/s13059-019-1718-z
Zhang, Y., Shen, L. (2022). CPL2 and CPL3 act redundantly in FLC activation and flowering time regulation in Arabidopsis. Plant Signal Behav. 17 (1), 2026614. doi: 10.1080/15592324.2022.2026614
Zhang, F. T., Zhu, Z. H., Tong, X. R., Zhu, Z. X., Qi, T., Zhu, J. (2015). Mixed linear model approaches of association mapping for complex traits based on omics variants. Sci. Rep. 5, 10298. doi: 10.1038/srep10298
Keywords: epistasis, GWAS, 3VmrMLM, Arabidopsis thaliana, flowering-related traits
Citation: Han L, Shen B, Wu X, Zhang J and Wen Y-J (2024) Compressed variance component mixed model reveals epistasis associated with flowering in Arabidopsis. Front. Plant Sci. 14:1283642. doi: 10.3389/fpls.2023.1283642
Received: 26 August 2023; Accepted: 15 December 2023;
Published: 08 January 2024.
Edited by:
Yuan-Ming Zhang, Huazhong Agricultural University, ChinaReviewed by:
Wenlong Ren, Nantong University, ChinaHai Yan Lü, Henan Agricultural University, China
Liu Jinyang, Jiangsu Academy of Agricultural Sciences (JAAS), China
Copyright © 2024 Han, Shen, Wu, Zhang and Wen. This is an open-access article distributed under the terms of the Creative Commons Attribution License (CC BY). The use, distribution or reproduction in other forums is permitted, provided the original author(s) and the copyright owner(s) are credited and that the original publication in this journal is cited, in accordance with accepted academic practice. No use, distribution or reproduction is permitted which does not comply with these terms.
*Correspondence: Yang-Jun Wen, d2VueWFuZ2p1bkBuamF1LmVkdS5jbg==
†These authors have contributed equally to this work