 Chubiao Wang
 Jun Lan2
 Jianzhong Wang
 Wanhong Lu
94% of researchers rate our articles as excellent or good
Learn more about the work of our research integrity team to safeguard the quality of each article we publish.
Find out more
ORIGINAL RESEARCH article
Front. Plant Sci., 15 December 2023
Sec. Plant Breeding
Volume 14 - 2023 | https://doi.org/10.3389/fpls.2023.1278427
Eucalyptus pellita has the characteristics of rapid growth and high resistance. However, there is little research on molecular breeding of E. pellita, which is essential to shortening breeding life and selecting quality varieties. Therefore, a crucial step before selective breeding can be carried out to increase the wood quality of E. pellita is identifying genetic diversity and population structure using single nucleotide polymorphism (SNP) markers. In this study, the genetic diversity of 1st generation 196 E. pellita families from 23 geographically defined was assessed using 1,677,732 SNP markers identified by whole genome resequencing. SNP annotation showed that the ratio of non-synonymous to synonymous coding mutations was 0.83. Principal component analysis (PCA), phylogenetic tree, and population structure analysis permitted the families to be categorized into three groups, one of which (G2) contains most of the Indonesian (IDN) and Papua New Guinea (PNG) families. Genetic relationship analysis showed that IDN was closely related to PNG. Genetic diversity analysis showed that He, PIC, I, and H mean values were 0.2502, 0.2027, 0.3815, and 0.2680, respectively. PCA analysis classified various provenances in QLD into two categories (G1 and G3). The genetic diversity of G3 was higher than that of G2. The results of genetic differentiation (Fst) showed that PNG region was divided into two groups (PNG1 and PNG2), the Fst (0.172) between QLD and PNG2 region was higher than QLD and PNG1, and the Fst (0.024) between IDN and PNG1 is smaller than IDN and PNG2. A Mantel test revealed a positive correlation between the genetic and geographic distance of E. pellita. This study has a certain reference value for genetic identification, germplasm preservation, and breeding of E. pellita. Also, it provides a basis for subsequent association analysis to explore excellent alleles and introduction.
Eucalyptus pellita, a fast-growing tree with strong disease resistance and a high survival rate, has been introduced and cultivated in numerous countries, such as China, Brazil, and Western Samoa. E. pellita thrives after introduction since the cultivated climate is comparable to that of the native distribution area. Currently, Australia (Brawner et al., 2010), Indonesia (Leksono et al., 2008), and Vietnam (Harwood and Nambiar, 2014) have advanced E. pellita seed orchards to the second or even the third generation. The average annual yield of E. pellita is 16-18 m3/ha in Sumatra, Indonesia, while the average annual yield of Eucalyptus in China is 15-28 m3/ha (Harwood and Nambiar, 2014). Before 2014, Eucalyptus plantations in China were in a developmental and exploratory stage. Many individuals and investors recognized the economic benefits of Eucalyptus and ventured into Eucalyptus forestry. However, the problem of poor Eucalyptus varieties also limited Eucalyptus yields. According to data from 2009 to 2018, domestic Eucalyptus annual yields have increased rapidly, reaching as high as 39.43 m3/ha. The main reason for this increase is that China began to place significant emphasis on the development of artificial Eucalyptus forests.
E. pellita is a humid and subtropical forest species. It has two naturally occurring regions: southern New Guinea (NG) and North Queensland (QLD). E. pellita was first discovered in 1864 by John Dallachy at Rockingham Bay, south of Innisfail in Queensland, and described in the same year by Baron Ferdinand von Mueller (Harwood, 1998). By the end of the 1980s, E. pellita was thought to be limited to Australia, with widespread distribution in northern QLD and New South Wales. Similar to E. pellita, Eucalyptus Scias is found in Lanzhou, New South Wales, however, its descriptions of leaves, buds, and fruits are very different from that of the species (Johnson and Hill, 1990). The E. pellita of Cape York in northern QLD are similar to the NG population and in some respects have fewer fruits and leaves than the southern Australian population. Further research may admit that the E. pellita populations in NG and Cape York in QLD originated independently of each other (Harwood, 1998). However, few studies on genetic diversity and population structure of E. pellita have been reported, which is of great significance in distinguishing the relationship between the three provenances.
Initially, a large number of introduced species and high-generation improvements were carried out in Brazil, Southeast Asia, and other countries, with the primary goal of studying the genetic variation of growth, adaptability, wood characters, disease resistance, and genetic gain between generations (Brawner et al., 2010). The majority of the genetic materials investigated were from natural sites, and phenotypic traits analysis effectively distinguished between QLD and NG provenances. In plantings of E. pellita in eastern Colombia, the provenance of NG performed noticeably better than that of QLD (Nieto et al., 2016). Similarly, when planted in humid tropical environments, the NG outperformed the QLD in terms of survival rate, growth rate, and morphological characteristics (Harwood et al., 1997). In addition, the internal provenance of QLD and NG was also different. For the survival study of introduction, E. pellita was introduced to Urbano Santos in Brazil. The survival rates of Northeastern Coen and South Helenvale at 3.5 years of age were 29.8% and 43.8%, respectively (Harwood, 1998). Although the geographical location of the various provenances is established, the necessity for genetic relationships between provenances remains to be determined.
In China, E. pellita is mostly utilized as a hybrid parent to develop excellent Eucalyptus clones and to conduct theoretical research on cross-breeding for fast growth, disease resistance, and insect pests. Long-term artificial selection and domestication also introduce a slew of issues, the most prominent of which is the limited genetic diversity of breeding materials, which severely homogenizes variations and makes it harder and harder to produce novel, ground-breaking varieties (Zhang et al., 2012). The selection of parents in cross-breeding is aided by knowing the genetic background of the breeding materials; this increases the effectiveness of producing new varieties with evident heterosis.
Genetic diversity plays an important role in heterosis and breeding programs. Therefore, the genetic diversity within and between Eucalyptus populations is routinely assessed using different marker techniques such as morphological (Byrne et al., 2016), biochemical (Kirst et al., 2005), and molecular markers (Shang et al., 2019). Morphological markers have been extensively utilized to assess genetic diversity because they are inexpensive, fast, and easy to measure. They are, however, highly influenced by the environment, and several other factors limit their ability to estimate genetic diversity (Yaman, 2021). Because molecular markers are stable, polymorphic, easily obtainable in the genome, and insensitive to environmental factors, they are still valuable tools for measuring genetic diversity (Govindaraj et al., 2015). Therefore, molecular markers, including RFLP, RAPD, ISSR, SSR, and SNP based on single nucleotide differences, are the most ideal methods to explain biological genetic diversity.
The study of genetic diversity and population structure is essential in identifying genetic relationships among germplasm resources. Plant improvement initiatives benefit from genetic heterogeneity among populations as well as genetic relationships between them. Identification of populations with high levels of genetic variation will be a valuable resource for broadening the genetic base because it makes it possible to identify good alleles for traits (Yang et al., 2020; Aesomnuk et al., 2021). To comprehend and use accessible gene bank resources, a variety of approaches can be employed to identify E. pellita genetic diversity. For example, early isoenzyme markers technology discovered considerable genetic variations between NG and QLD provenances, with NG provenances having much lower heterozygosity (House and Bell, 1996). Similarly, RFLP was also used to evaluate the genetic resources of Eucalyptus, though the results were stable, reliable, and repeatable (Moran et al., 2000). However, it has some drawbacks, such as complicated operation, long duration, high cost, and large demand for DNA.
So far, studies on E. pellita based on SNP markers are scarce, and earlier techniques are prohibitively expensive and may yield inaccurate results. Therefore, SNP markers are being promoted with the advent of next-generation sequencing (NGS) technology. SNP molecular markers have been widely used to study genetic diversity due to their richness, wide genomic coverage, availability of neutral variation and selected loci, rapid and high-yield genotyping, and low error rate (Helyar et al., 2011). Based on SNP markers, complex traits were anatomized by QTLs (Quantitative traits Loci) or LD (linkage disequilibrium) analysis to provide a basis for Eucalyptus breeding (Resende et al., 2017; Butler et al., 2022).
Whole-genome resequencing is the process of sequencing the entire genome sequence of different individuals or species with known genome sequence, to analyze the differences between different populations or individuals (Risch and Merikangas, 1996). A large number of SNP, InDel, and SV can be discovered by comparing the sequenced sequence of a single individual with the known genome sequence of that species or related species (Catanach et al., 2019). In this study, 196 E. pellita resources from New Guinea and Australia were sequenced using whole-genome resequencing technology, and SNP sites were detected, screened, and typed. Genetic diversity, population structure, and genetic differentiation of these materials were further analyzed. It will lay the foundation for conservation and utilization of Eucalyptus resources, gene mapping of important traits, polymeric breeding based on molecular markers and further genome-wide association analysis.
The provenances of the 1st generation of E. pellita breeding populations are from Queensland (QLD, AUS) and New Guinea (NG) Island, which are separated by the ocean with 150 km as the closest shoreline. Generally, the provenances of NG are divided into Indonesian provenances (IDN) and Papua New Guinea provenances (PNG). QLD is divided into Cape York provenances and northeast Queensland provenances. In this study, 196 E. pellita germplasm resources were collected, including 5 from IDN, 55 from PNG, and 133 from QLD. All seeds were randomly planted in Fusui, Guangxi, China, and Suixi, Guangdong, China. Each family was divided into 23 provenances according to geographical location, as detailed in Supplementary TableS1. After gathering young leaves from the top canopy of surviving trees in mature forests, the leaves were swiftly placed in an incubator with ice for sample and sealed in a zippered bag containing silica gel. The samples were brought indoors and stored in the refrigerator at -24°C.
The CTAB method was used to extract DNA (Gan et al., 2003). Use Nanodrop2000 Spectrophotometer (Thermo Fisher Scientific) to determine the concentration and quality of the total genome DNA. DNA libraries with a mean insert size of 350 bp were constructed, and 125-bp paired-end reads were generated using an Illumina HiSeq 4000 instrument. Library preparation and sequencing were carried out at the Biomarker Technologies Corporation (Beijing, China).
Illumina platform was used for sequencing, and Raw image data files were identified by CASAVA bases to form Raw reads. Subsequently, Clean reads were obtained through quality control analysis, base quality distribution analysis, and sequencing data filtering. BWA software (Li and Durbin, 2009) was used to compare Clean reads with E.grandis genomes (https://www.ncbi.nlm.nih.gov/assembly/GCF_016545825.1), and the results were formatted by SAMTOOLS software (Li et al., 2009), and then reweighted by PICARD software (http://broadinstitute.github.io/picard/;v1.94). The ratio of pairs, genome coverage distribution, insert-size distribution, and variation were also analyzed. SNPs and InDels within the 196 families were called using the HaplotypeCaller module in GATK (McKenna et al., 2010). They were filtered with the following parameters: QD < 2.0 || MQ < 40.0 || FS > 60.0 || QUAL < 30.0 || MQrankSum < -12.5 || ReadPosRankSum < -8.0 -clusterSize 2 -clusterWindowSize 5. SNPs with minor allele frequency (MAF) of lower than 5% in the population were filtered out. Software SnpEff (Cingolani et al., 2012) was used to annotate variation and predict the impact of variation. The position of mutation locus on the reference genome can be obtained by SnpEff analysis and functional annotation.
Based on the genetic data of the population, the genetic distance was calculated and phylogenetic tree was constructed based on the distance matrix. MEGA5.2 (Tamura et al., 2011) software was used to construct phylogenetic trees for each sample, with the Kimura 2-parameter model, 1000 bootstrap replicates, and neighbor-joining method.
EIGENSOFT was used for principal component analysis to obtain sample clustering (Price et al., 2006). Principal component analysis (PCA) analysis can be used to know which sample relationships are relatively close and which sample relationships are relatively distant and can play an auxiliary role in evolutionary analysis.
Admixture software was used to analyze and study the population structure (Alexander et al., 2009). The pre-set subgroup number (K value) of the population was clustered, with a range from 1 to 10. The optimal clustering number was determined according to the minimum value of cross-validation error rate.
GCTA software was used to estimate the genetic relationship between two individuals in natural populations (Yang et al., 2011). In this study, the mean of the expected variances of SNP markers was used to correct the labeled expectation variances, namely the G-matrix, to obtain a heat map of kinship.
Nei’s genetic diversity index (H), polymorphic information content (PIC), minor allele frequency (MAF), expected heterozygosity (He), and observed heterozygosity (Ho) of the 23 provenances and inferred groups were calculated by PowerMarker V3.25 (Liu and Muse, 2005). PopGenome R package (Pfeifer et al., 2014) was used to calculate the nucleotide polymorphism (Pi) and Tajima’ D for 23 provenances. GenAlEx V6.5 (Peakall and Smouse, 2006) was used to calculate the pairwise genetic differentiation coefficient (Fst) between provenances to study population differentiation. PopLDdecay (Zhang et al., 2019) was used to evaluate LD value and plot LD decay for each chromosome.
Based on Qual > 30,000 in the original data, 12,475 SNP markers were selected for subsequent analysis. R language was used to generate SNP format 0,1,2 from the filtered data, where 0 represented homozygote reference,1 represented heterozygote, and 2 represented homozygote substitution. The GenAIEx V6.5 software (Peakall and Smouse, 2006) was used to perform AMOVA to divide the total level of genotypic variance into variance within and between populations. The Mantel test was used to correlate the genetic distance and geographic distance matrices between populations by GenAIEx V6.5 software. In addition, these filtered SNPs were used to perform Fst and Nei’s genetic distance analysis for three populations by GenAIEx V6.5 software (Fufa et al., 2022).
Based on SNPs data, we investigated the polymorphism distribution in E. pellita genome regions and found that 242,265 (14.44%), 325,144 (19.38%), 273,806 (16.32%) and 605,493 (36.09%) SNPs were located in intron and upstream region (within 5 kb upstream of transcription start site), downstream region (within 5 kb downstream of transcription stop site) and intergenic region (Figure 1), respectively. In coding regions (The number of SNPs is 177,001), we annotated 79,491 non-synonymous,177 start-lost, 1,328 stop-gained, and 124 stop-lost SNPs, which led to amino acid changes, longer transcripts, or premature stop codons. In addition, 95,669 SNPs in the coding region were synonymous mutations, and the ratio of non-synonymous to synonymous SNPs was 0.8309.
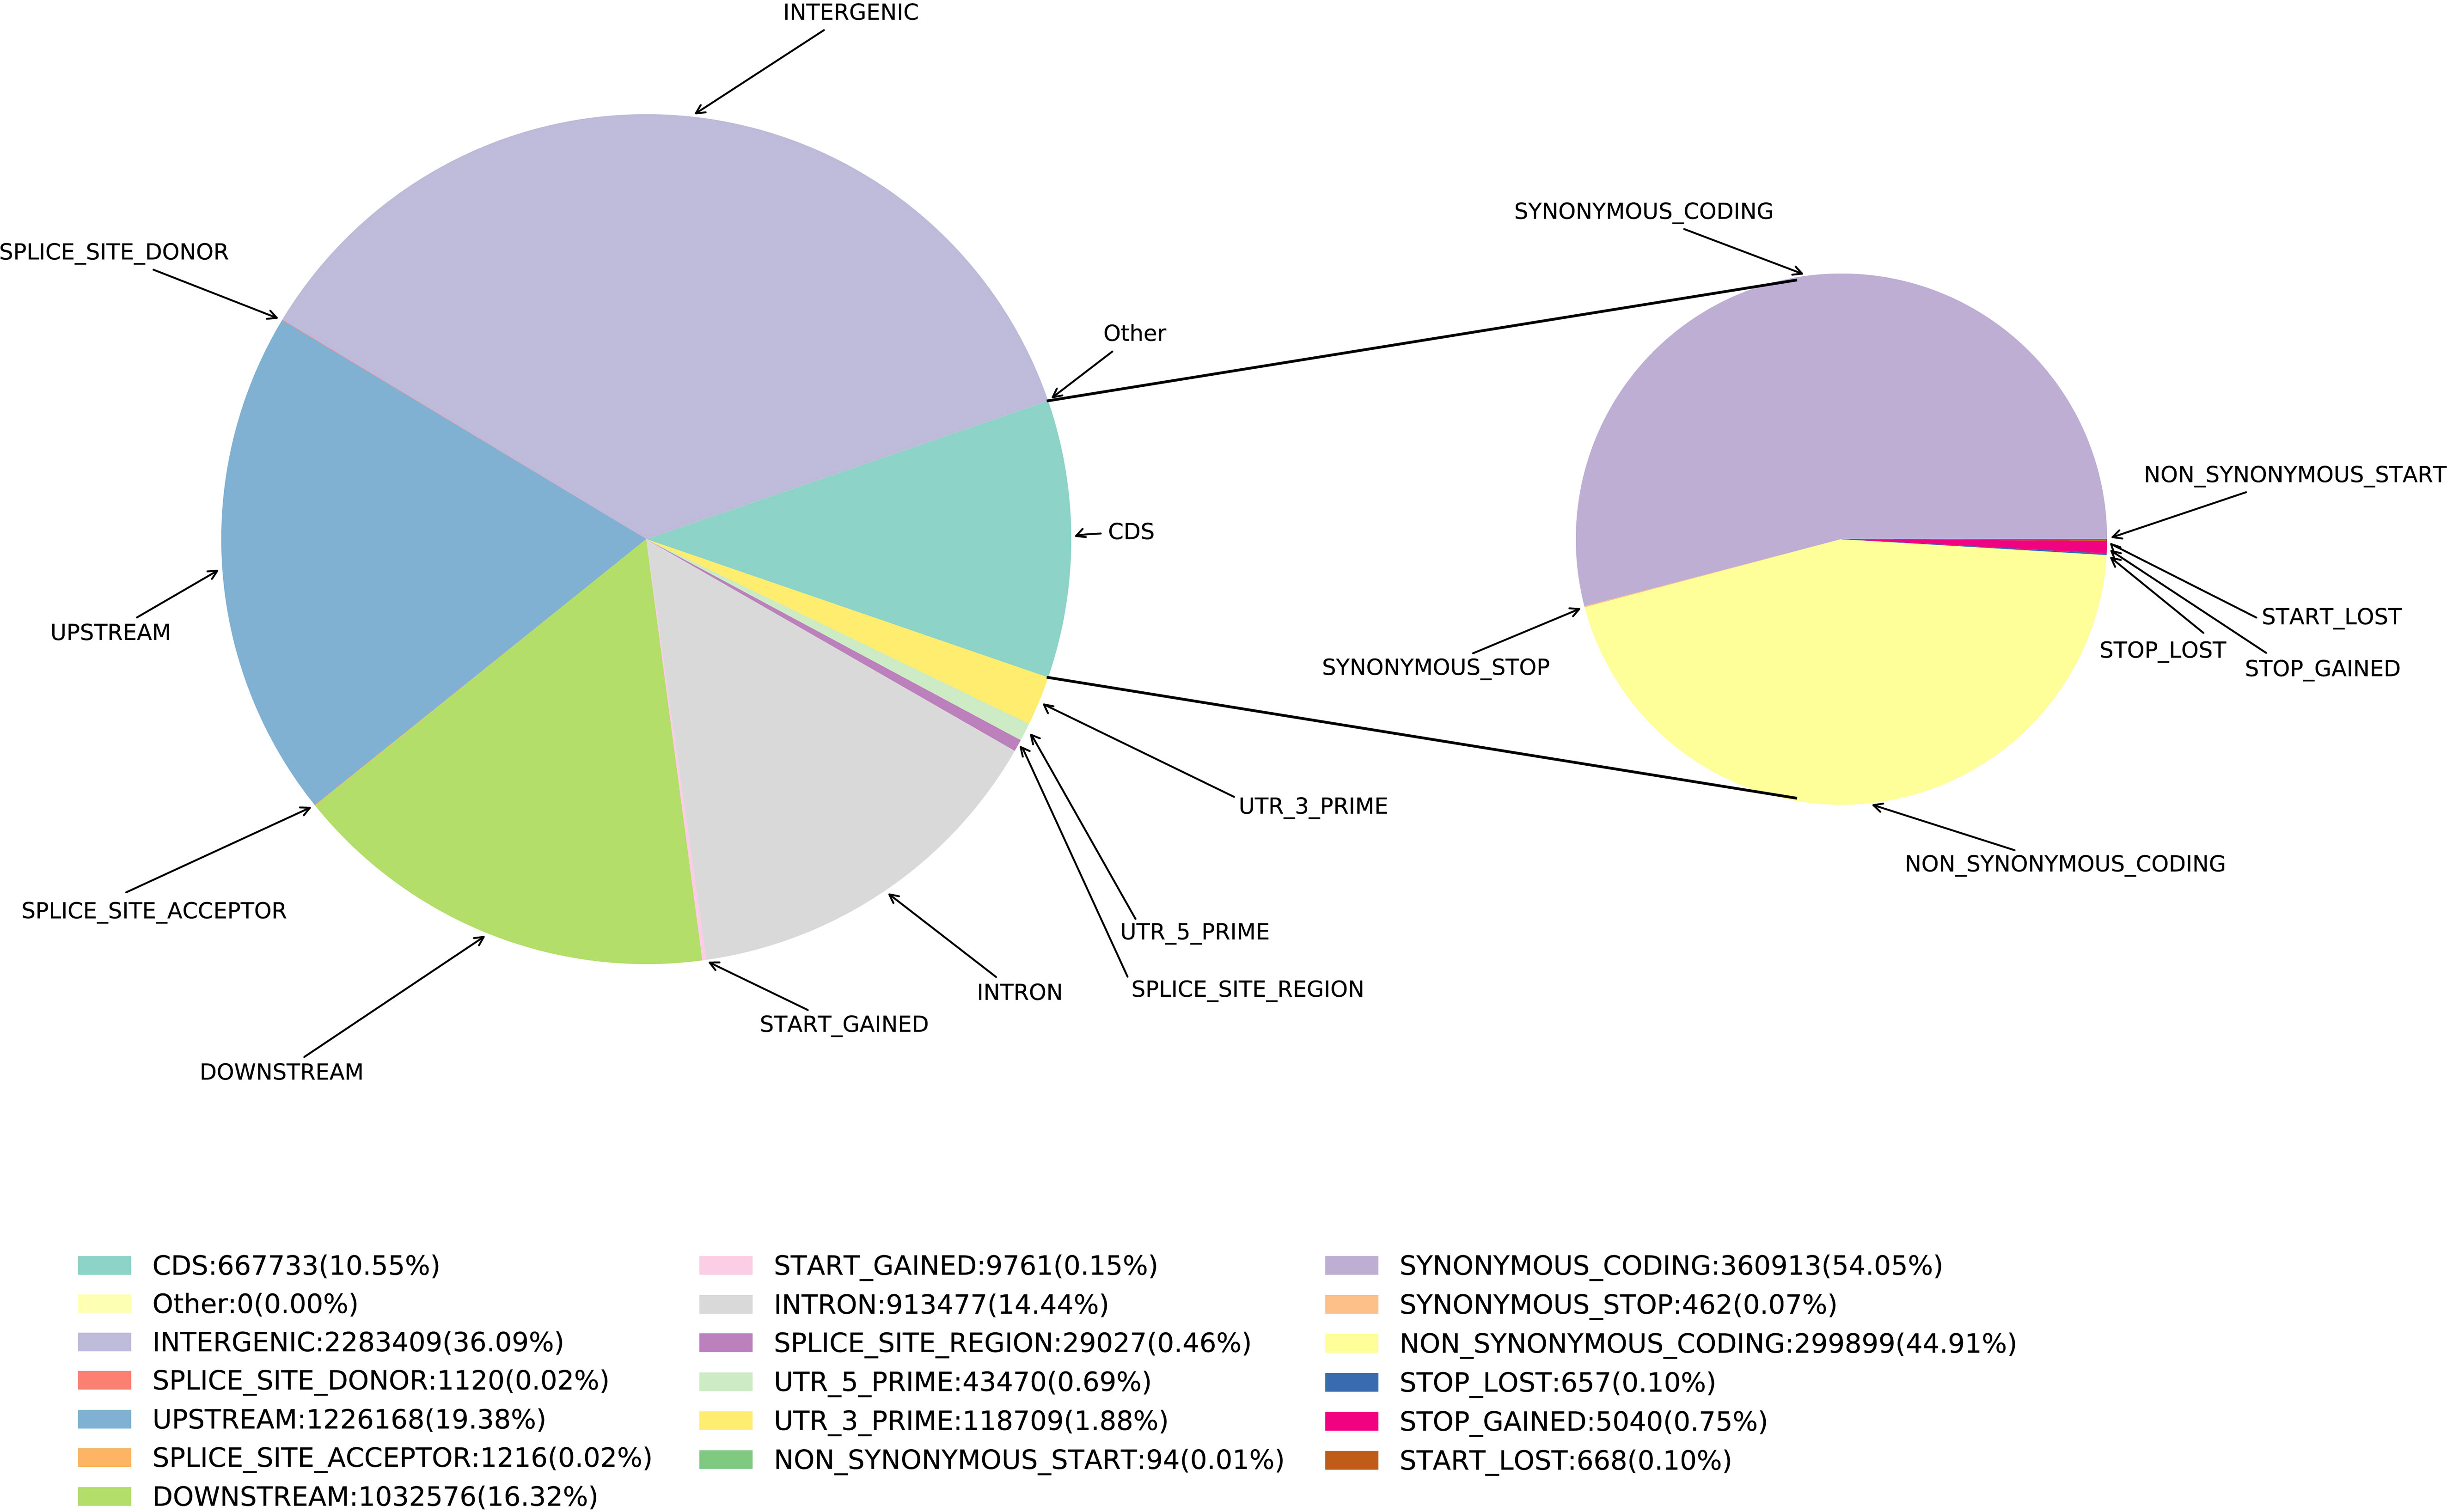
Figure 1 SNP annotated results. The pie chart on the right is based on the CDS region.
In order to determine whether there are regions with high genetic differentiation, we performed chromosomal localization of SNPs and InDels loci (Figure 2). It can be seen that the density trend of SNPs and InDels sites is basically the same, showing a radial distribution. For example, the genetic differentiation degree of SNPs and InDels was relatively low around the 25 Mbp interval of chromosome 8. Furthermore, there was a substantial low genetic differentiation region in the middle of each chromosome, with SNP sites being particularly prominent. Moreover, high levels of genetic differentiation were not uniformly distributed across different chromosomes; for instance, chromosomes 1 and 7 exhibited a concentration of differentiation at their ends, whereas other chromosomes displayed uneven variations.
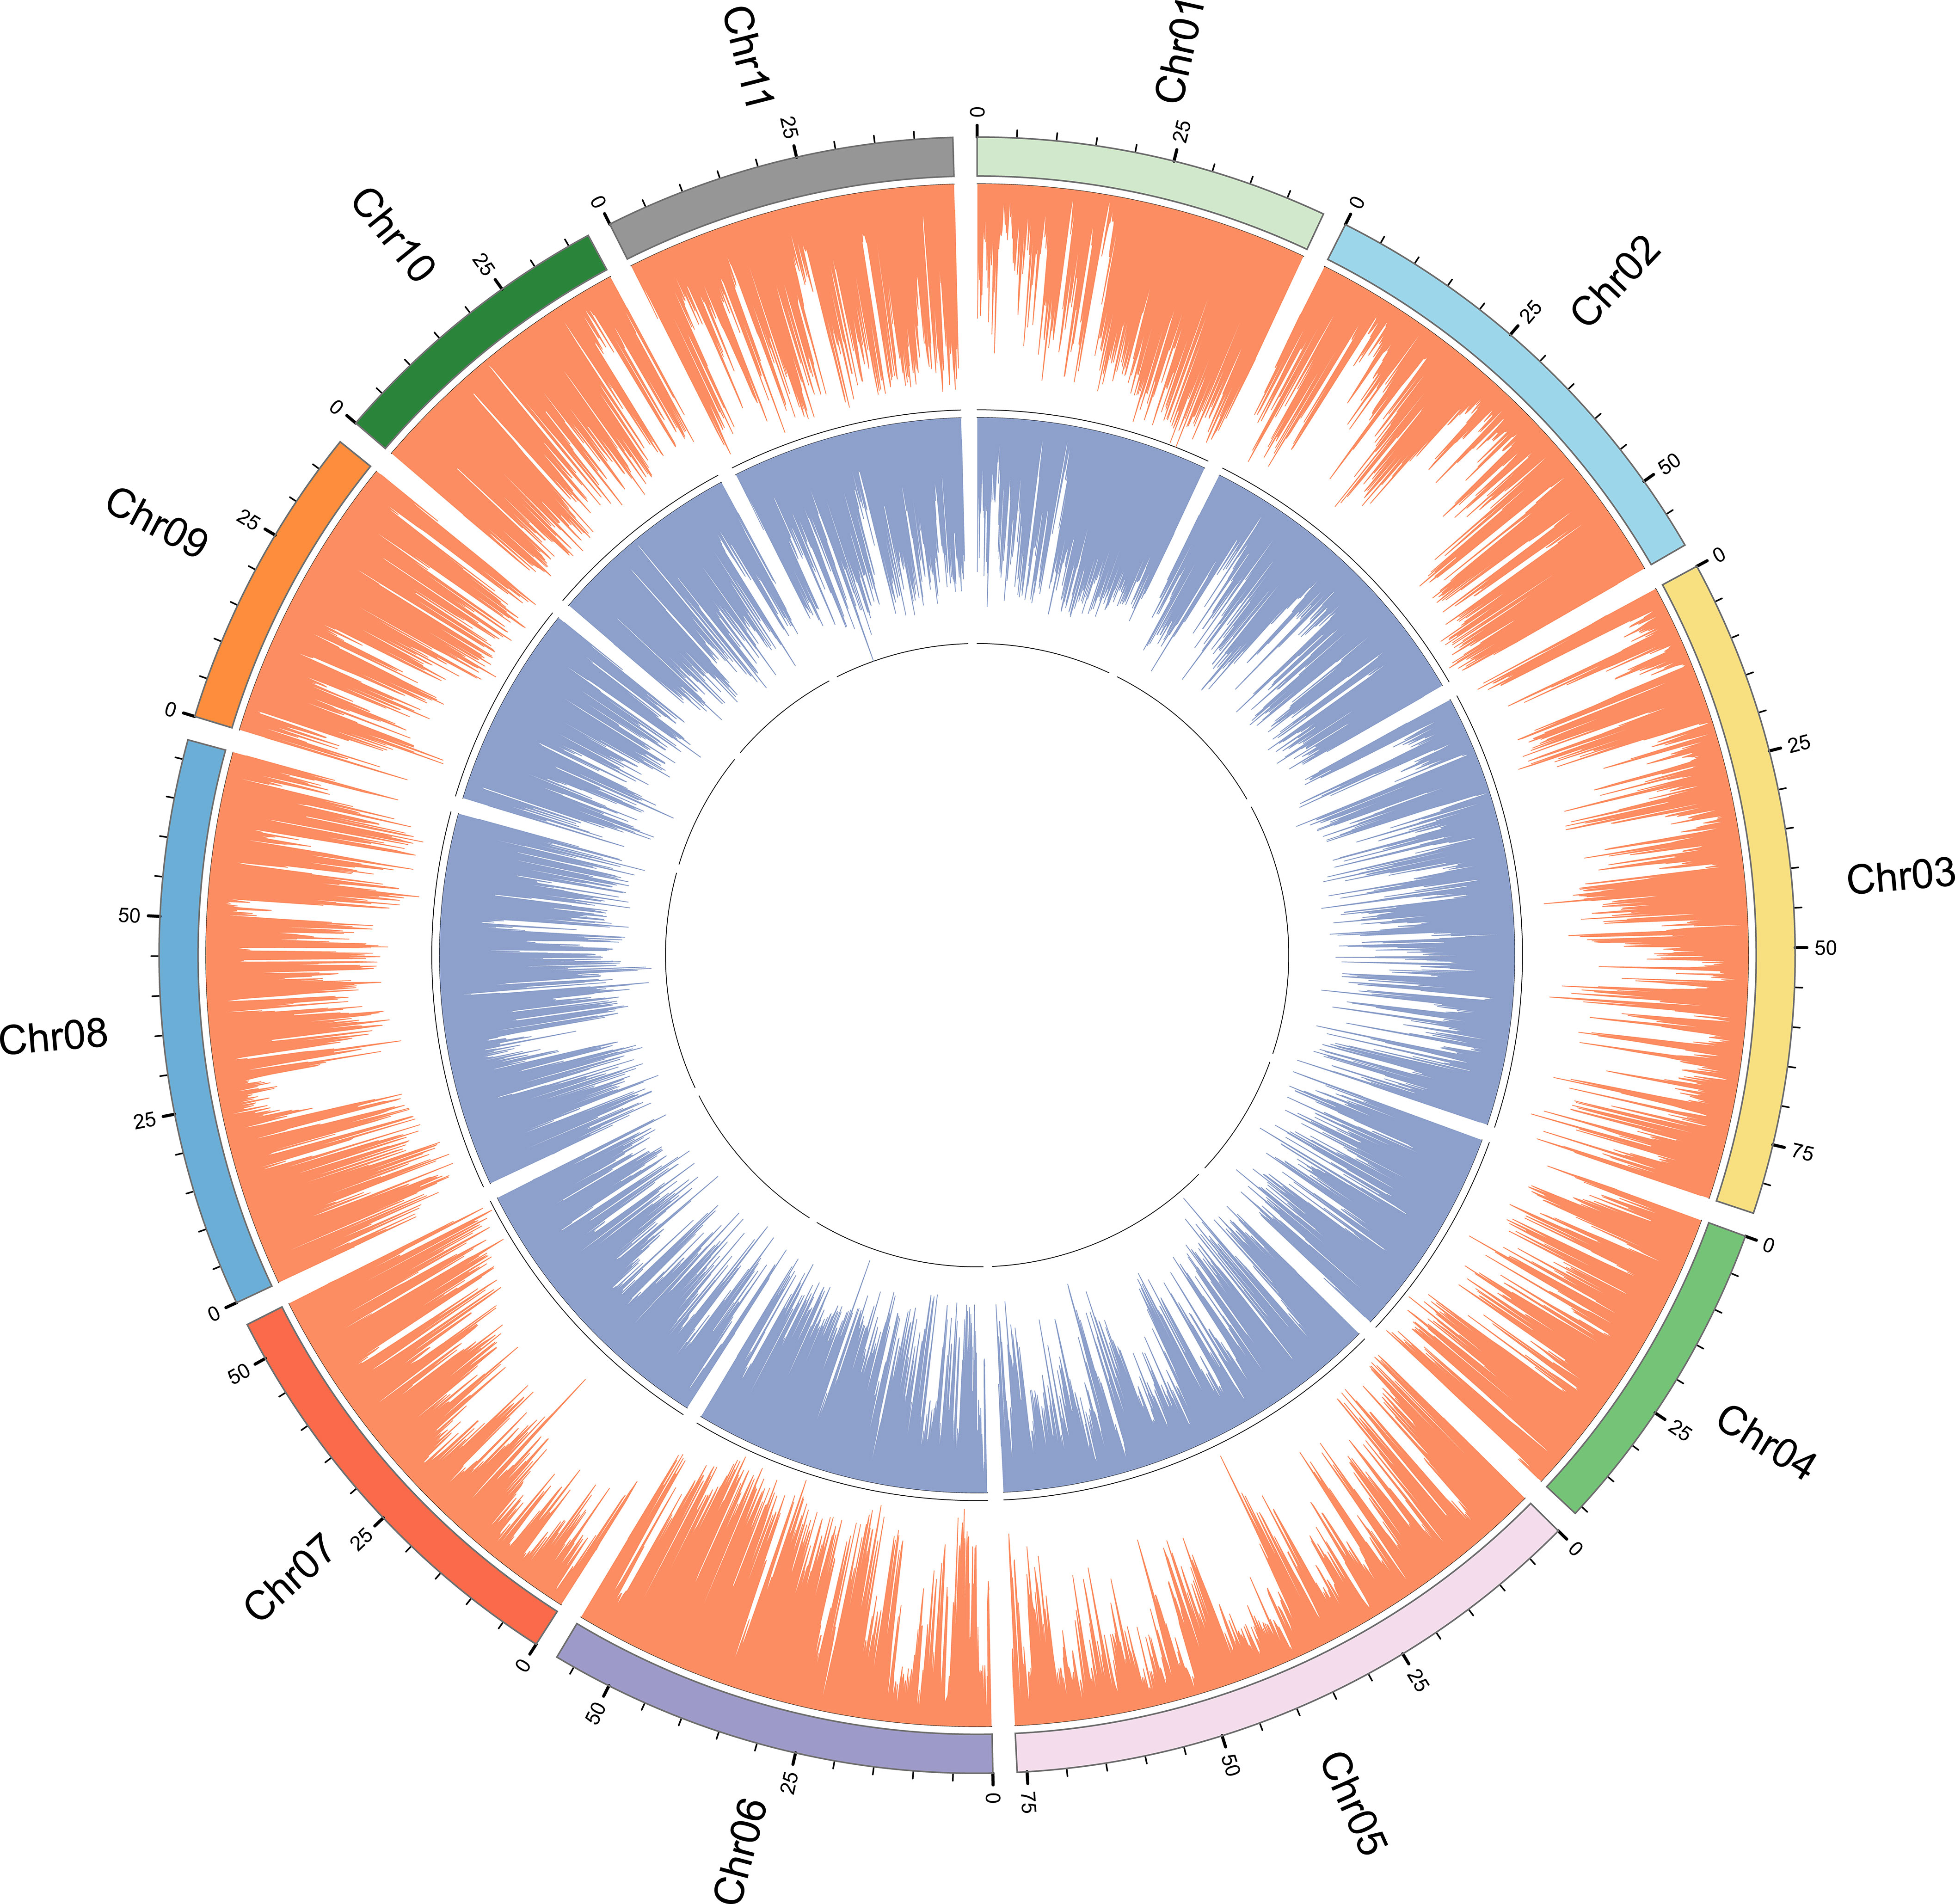
Figure 2 SNP and InDel distribution plot for genotyping-by-sequencing of 196 E. pellita accessions. SNP and InDel are represented by orange and blue bars.
According to integrity > 0.8 and MAF > 0.05, all the above SNP markers were filtered, and a total of 1,677,732 SNPs with high consistency were obtained. Based on the SNPs filtered, admixture software was used to analyze the population structure of the samples, and the sample population number (K value) was assumed to be 1-10 for clustering (Figure 3A). According to the valley value of cross-validation error rate, the optimal population number was 3, indicating that 196 E. pellita families can be divided into three groups, which means they come from different original ancestors. The clustering with K values ranging from 1 to 10 and the cross-validation error rate corresponding to each K value is shown in Figure 3B. The population structure divided the families into Q1-Q3 (Supplementary TableS2), and most of the families from PNG and IDN were assigned to Q1. Families from the QLD region included 85 in Q2 and 47 in Q3.
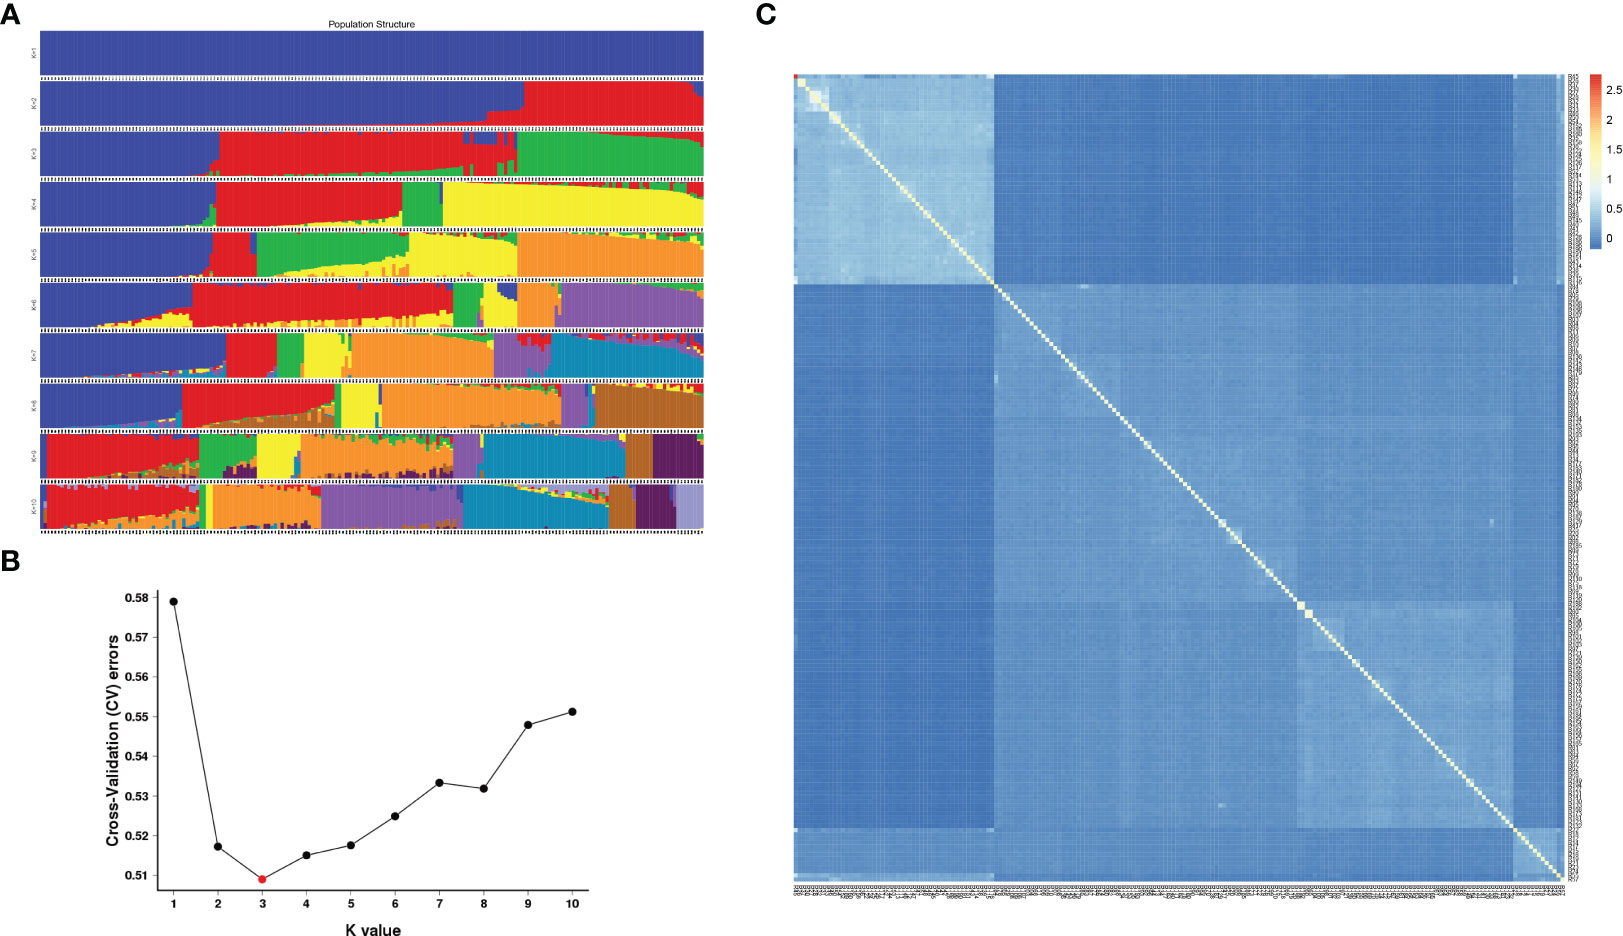
Figure 3 Population structure and genetic relationship. (A) In each population structure, each individual was represented by a line of different colors, and which subgroup the variety belonged to was inferred according to the proportion of colors; (B) Cross-validation error rate for each K value; (C) The smaller the value of kinship between the two samples, the darker the blue shaded part.
As can be seen from the kinship heat map of E. pellita group (Figure 3C), as a natural group, the kinship between the families of the 1st generation of E. pellita was not close and their kinship value was mostly low. However, the families in the upper left corner of the figure were relatively close, and most of these families come from the PNG region. In the white-blue shade in the upper left corner, PNG had 45 families, IDN had 4 families, and QLD had 2 families (Supplementary TableS3), which meant that the genetic distance between these 51 families was close. It also implied that IDN was closely related to PNG region.
To further verify the accuracy of the above results, principal component analysis and cluster analysis were performed on SNP data. According to the geographical location of each family (Figure 4A) and the distribution of each family in PCA (Figure 4B), they could be divided into 3 groups, namely, group 1-3. 196 families from 23 provenances clustered into 3 groups and only provenances S14339 were relatively discrete and did not belong to the 3 groups, indicating that this population mainly came from 3 branches. For example, the provenances from IDN and PNG belong to Group 2 and are relatively independent from other provenances. The families of Group 2 are concentrated in NG Island (5°S-10°S), and the provenances from QLD are also divided into two groups according to latitude. Group 3 is located between 15°S and 17°S, and Group 2 is located in an area above 17°S (Figure 4A). Provenances from different regions have specificity and can be distinguished, and the relationship between provenances and SNP can be better understood by combining the traits of provenances from the three regions.
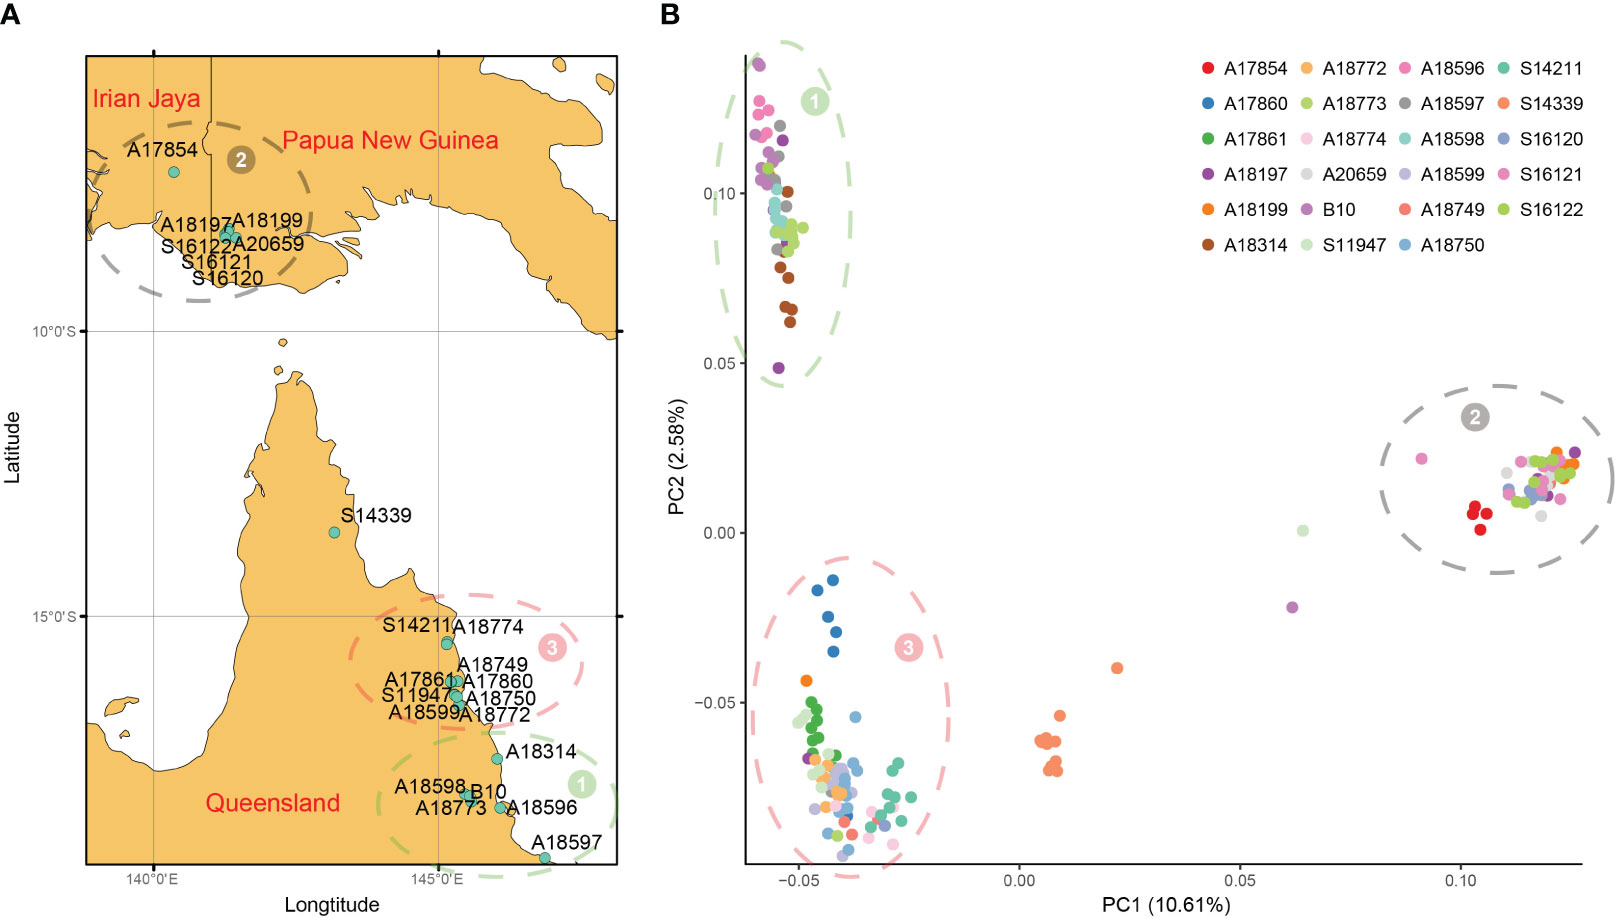
Figure 4 Geographical distribution and PCA. (A) Geographic distribution of 23 provenances in this study; (B) The first two principal component principal component analyses (PCA) based on genome-wide SNP data. All provenances can be divided into three groups, and the location of each group is consistent with the geographical distribution, represented by numbers 1 to 3 respectively.
To better understand the clustering of each family, we constructed a phylogenetic tree for 196 families (Figure 5). From the roots of the developing tree, all provenances can be divided into three large clades (Group A-C). As mentioned above, PNG and IDN were geographically relatively close to each other, both on the island of NG. It can be seen that IDN families were classified into Group C (except F3-104), of which most PNG families were classified into Group C. In addition to PNG and IDN provenances in Group C, some QLD provenances were also classified in Group C, including provenances S14339, S14211, S18774, and A18750. Most of the families of Group A branch were located in southern QLD, while most of the families of Group B originated from northern QLD.
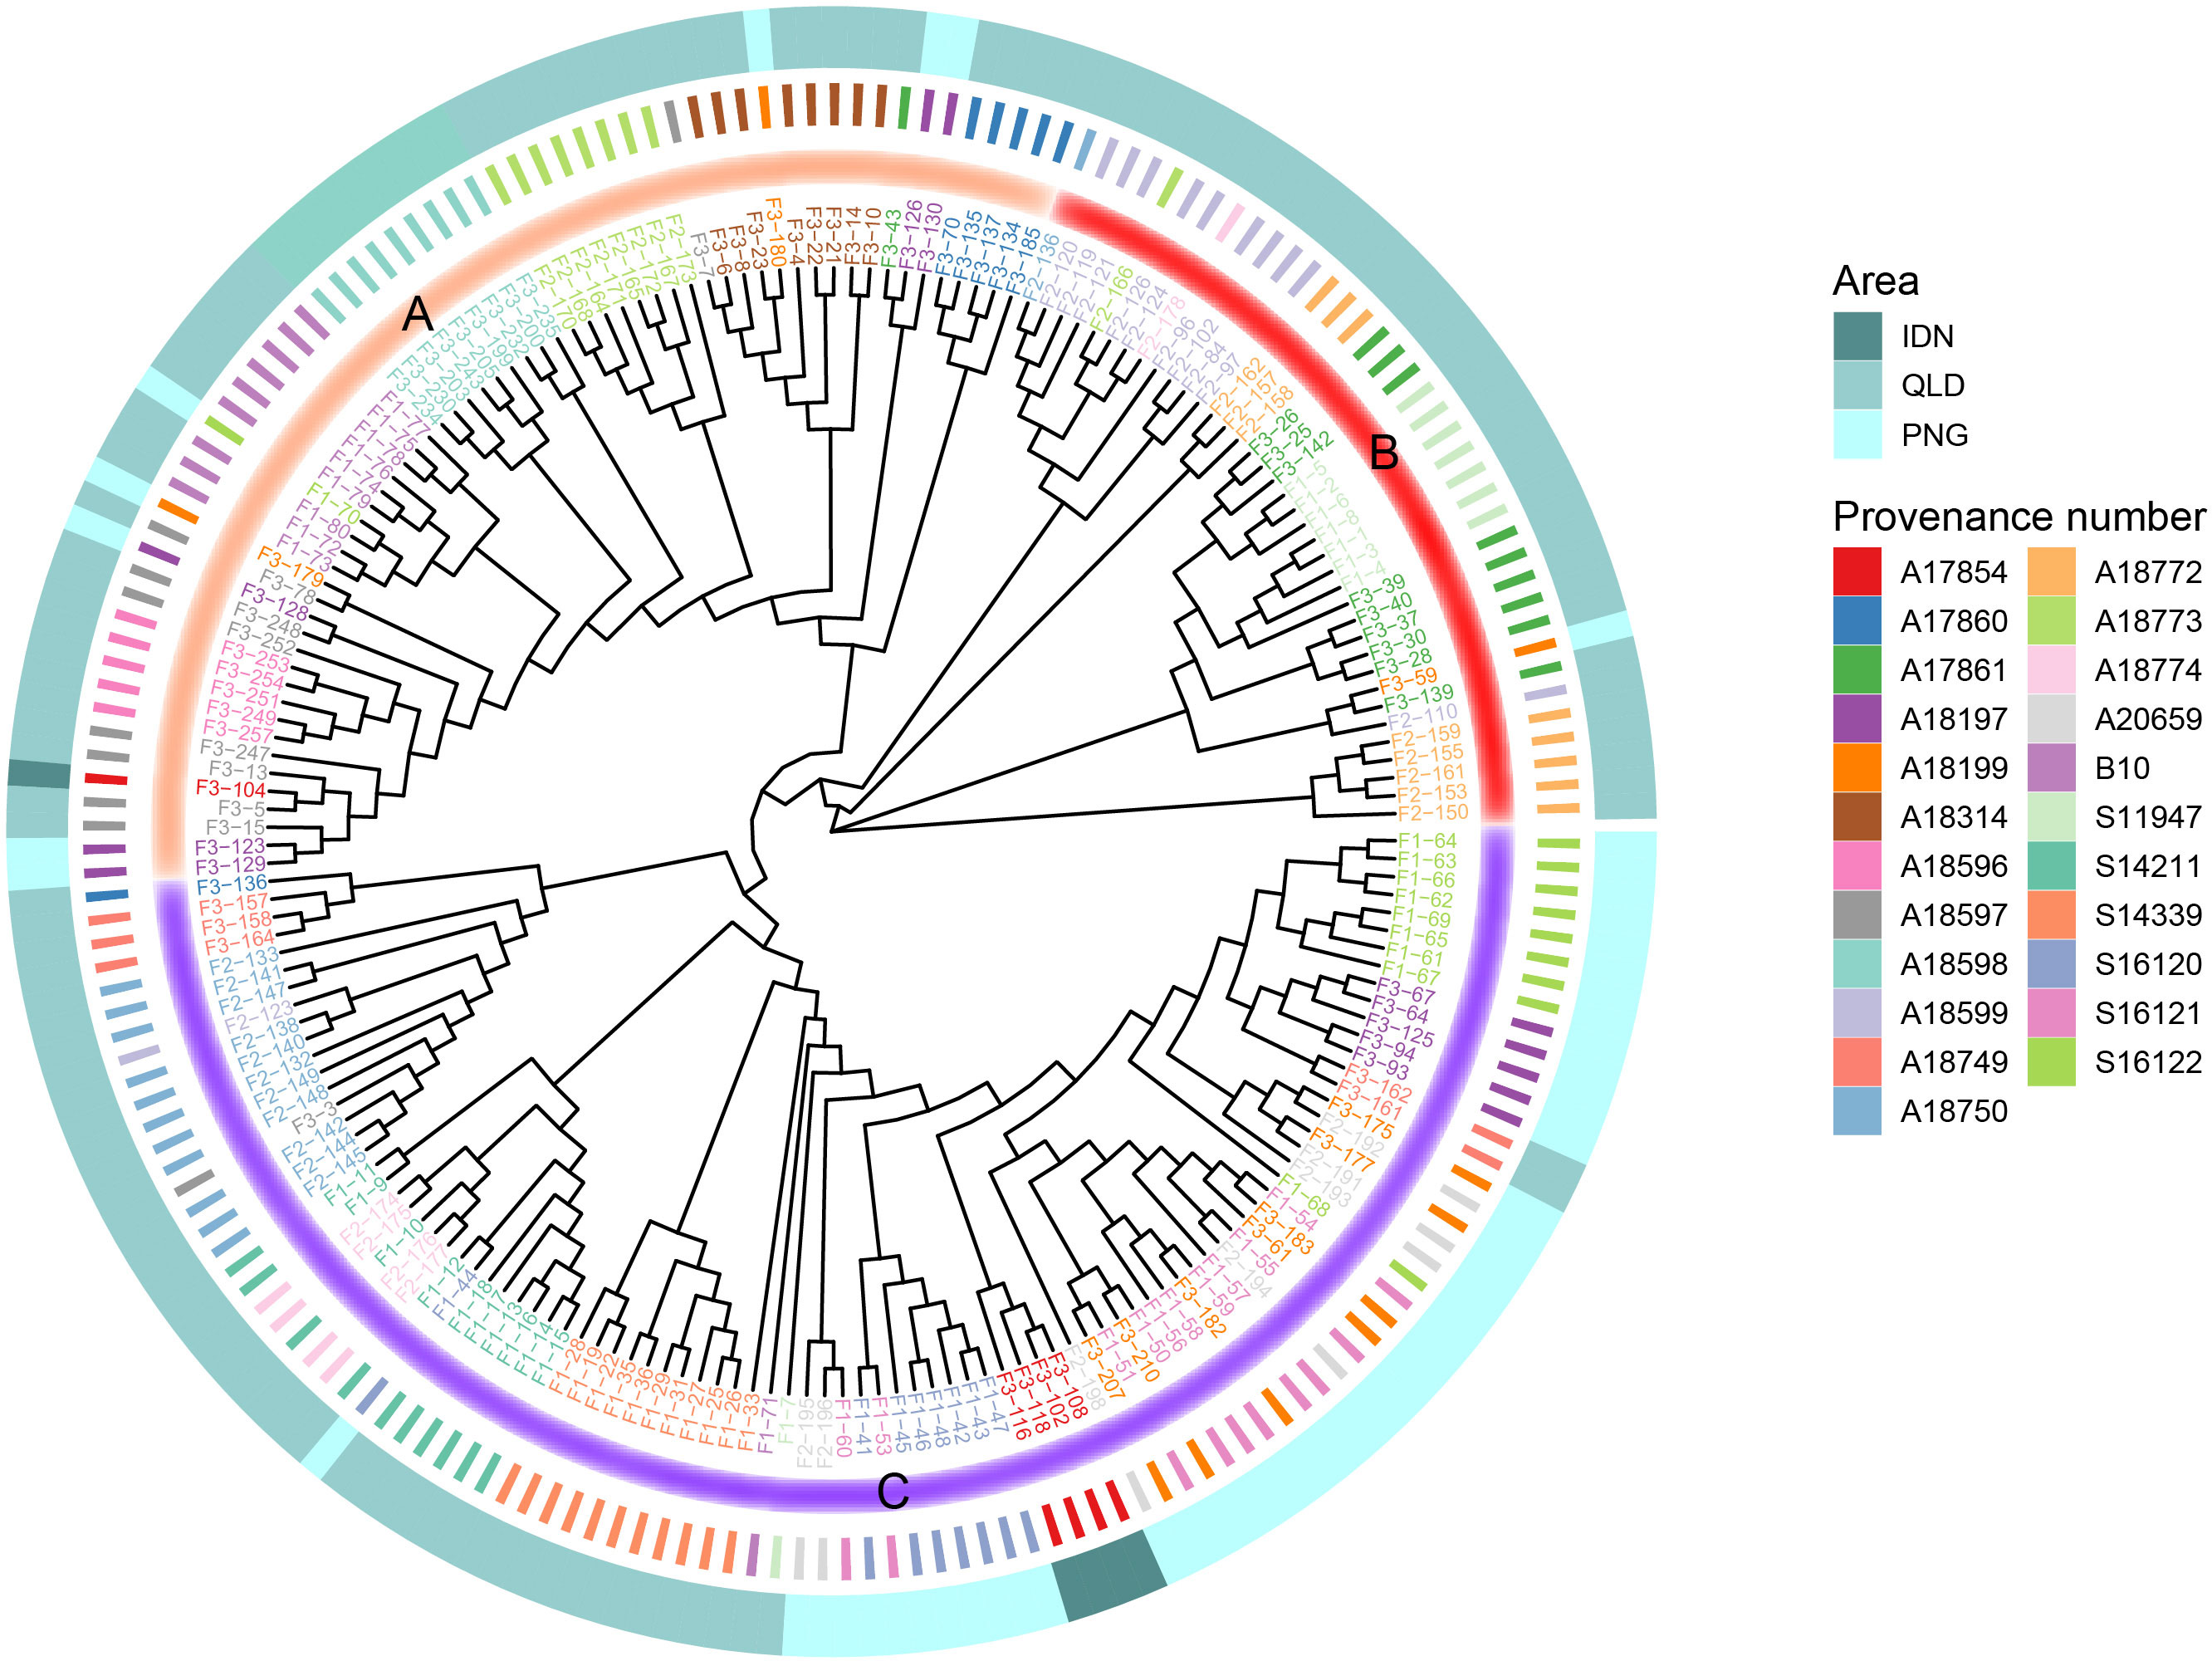
Figure 5 Phylogenetic tree of the 196 E. pellita families based on SNPs. The outermost circle indicates the region to which each family belongs, 3 different regions are represented by different colors, and the innermost circle divides each family into three categories Group A, B and C, which are represented by different colors.
According to the genetic diversity parameters of the first-generation E. pellita population (Table 1), the overall expected heterozygosity of all provenances was 0.2502. The expected heterozygosity of QLD, PNG, and IDN were 0.2547, 0.2428, and 0.2232, respectively. The provenance with the highest expected heterozygosity was A18197 while the smallest provenance was S16120 with little difference among provenances. The observed heterozygosity of provenances A17854, A17860, A18314, A18596, A18598, A18774, and A20659 was higher than the expected heterozygosity, suggesting that these populations may have experienced distant hybridization. The Nei’s diversity index, Shannon-Wiener index, and polymorphism information content of all provenances were 0.2680, 0.3815, and 0.2027, respectively. They all follow the same pattern, with the highest values in the QLD region, followed by the PNG region, and the lowest values in the IDN region. Overall, the genetic diversity is highest in the QLD region and lowest in the IDN region. The highest genetic diversity was A18197 and A18599, and the lowest was A17854 and S16120. In the population predicted by PCA (Figure 4), the genetic diversity of Group 3 was greater than that of Group 1, and that of Group 1 was greater than that of Group 2, of which Group 1 and Group 3 were from the QLD area. In addition, the average nucleotide polymorphism across all sources is 0.000669, indicating that the 23 germplasm sources from the three major regions have not undergone artificial selection. This is consistent with their natural population attributes. Tajima’s D test analysis also suggests the presence of a higher frequency of low-frequency variants within various provenances, possibly due to the imbalance caused by genetic drift or selection.
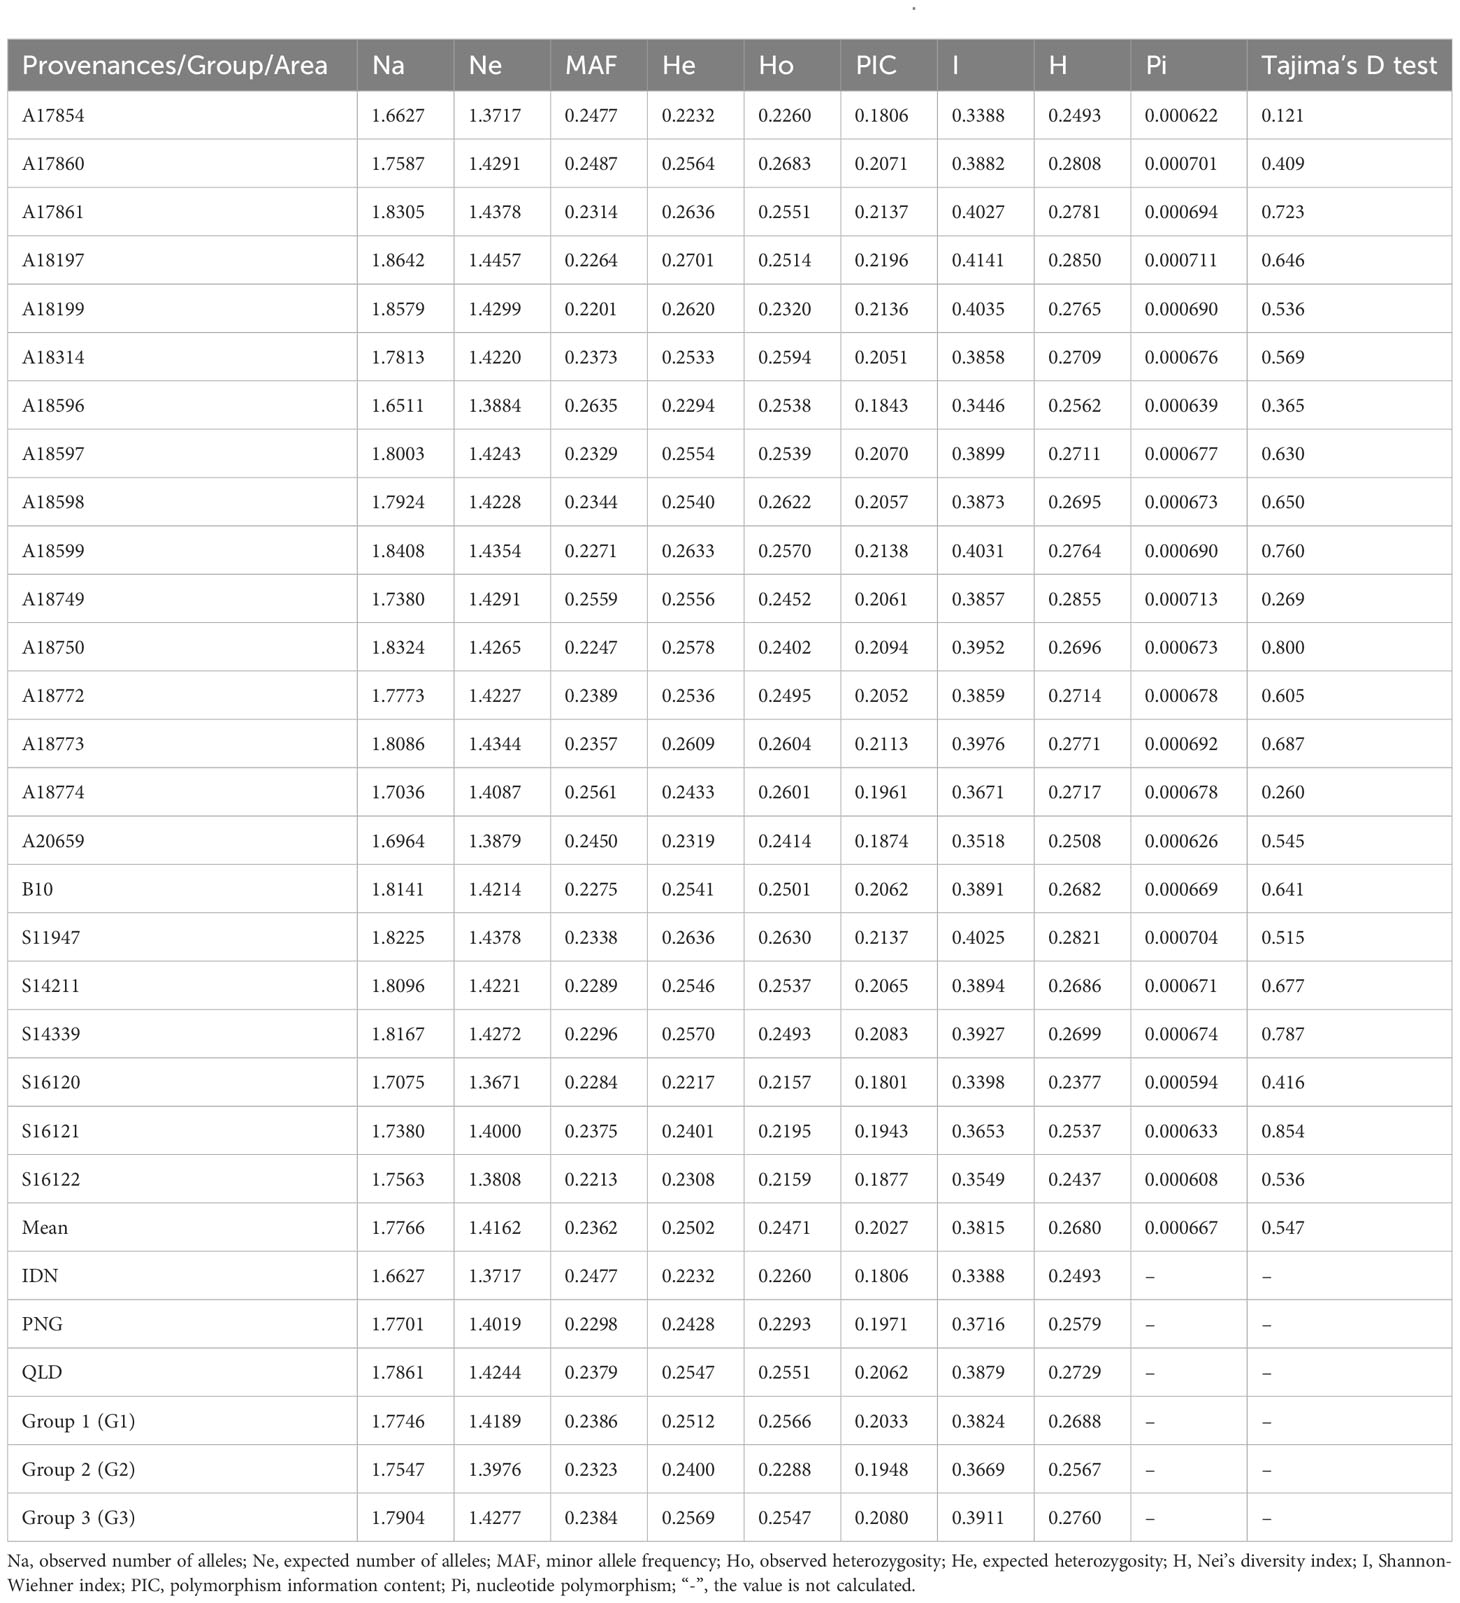
Table 1 Genetic diversity parameters of various provenances and inferred groups of E. pellita.
The population differentiation analysis of the 1st generation of E. pellita population (Table 2) showed that the average Fst of IDN and PNG was only 0.039, while the average Fst of IDN and QLD was 0.123, indicating that the differentiation between IDN and QLD was greater than that between IDN and PNG. Based on the geographical distribution of the three regions (Figure 3A), we speculated that QLD was the origin of E. pellita, which spread from QLD to PNG and then to IDN.
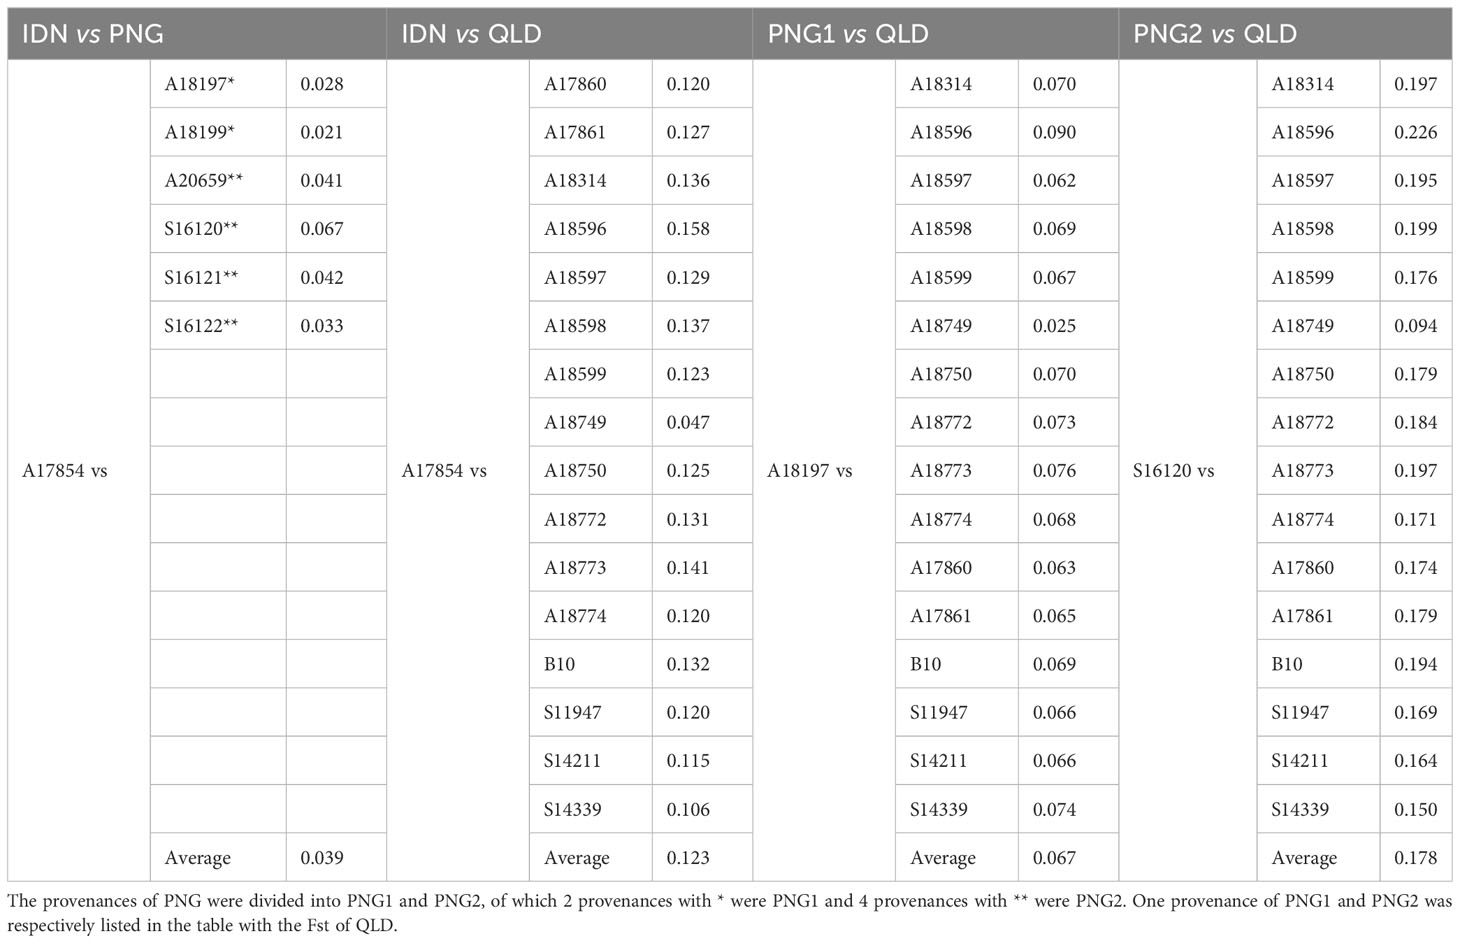
Table 2 The 1st generation of E. pellita group as the major source of differentiation index (Fst).
According to the Fst results, PNG was divided into PNG1 and PNG2. The Fst between PNG1 (including provenances A18197 and A18199) and QLD was 0.067 and 0.102, respectively, with an average of 0.085, while the Fst between PNG2 (including provenances A20659, S16120, S16121 and S16122) and QLD was 0.175, 0.178, 0.173 and 0.161 respectively, with an average of 0.172, which is twice as much as that between PNG1 and QLD, indicating that the relationship between PNG and QLD wasn’t single. If PNG provenances were only transmitted from QLD, there would be no significant difference between them and the Fst of QLD. Combined with the speculation of Harwood (1998), who observed the characters of E. pellita from various sources and speculated that PNG and QLD were two independent populations, we concluded that QLD and PNG2 were two independent origins of E. pellita, and that PNG1 was transmitted from QLD. IDN is transmitted from PNG, but it is more likely to be transmitted from PNG1 based on the perspective of Fst coefficient.
The alternative hypothesis holds that PNG2 is the only source, which then spreads to PNG1 and QLD. In this case, the average Fst of PNG2 and QLD, as well as the average Fst of PNG2 and PNG1, are not that different. However, this theory is invalid since PNG and QLD are independent based on the observation of phenotypic traits.
The value range of Fst is 0-1. The maximum value of 1 indicates that the two populations are completely differentiated, while the minimum value of 0 indicates that there is no differentiation between the two populations. It is generally believed that genetic differentiation among populations is very small when Fst is 0-0.05. Between 0.05 and 0.15, there was moderate genetic differentiation among populations. At 0.15 to 0.25, there was a large genetic differentiation among populations. There was large genetic differentiation among populations above 0.25 (Weir and Cockerham, 1984). According to the average Fst values of the first-generation population from all major sources in this study, there was a large differentiation between QLD and PNG2, a moderate differentiation between QLD, PNG1, and IDN, and a small differentiation between other sources.
Association maps based on linkage disequilibrium (LD) provide a powerful strategy for genetic profiling of complex quantitative traits. The distance to threshold decay (R2 ≈ 0.2), and half-maximum decay (R2 = 0.1) was calculated within all contigs and all samples in a global analysis, with genome-wide LD decaying to the threshold level within 5.8098 kb, to half-maximum within 33.6428 kb. In addition, the distance of chromosomal average LD decay to the threshold level ranged from 4.5364 to 7.1236 kb, and the distance to the half-maximum ranged from 18.7877 to 53.0599 kb (Figure 6). Among these chromosomes, Chr05 showed a faster LD decay, while Chr01 showed a slower LD decay.
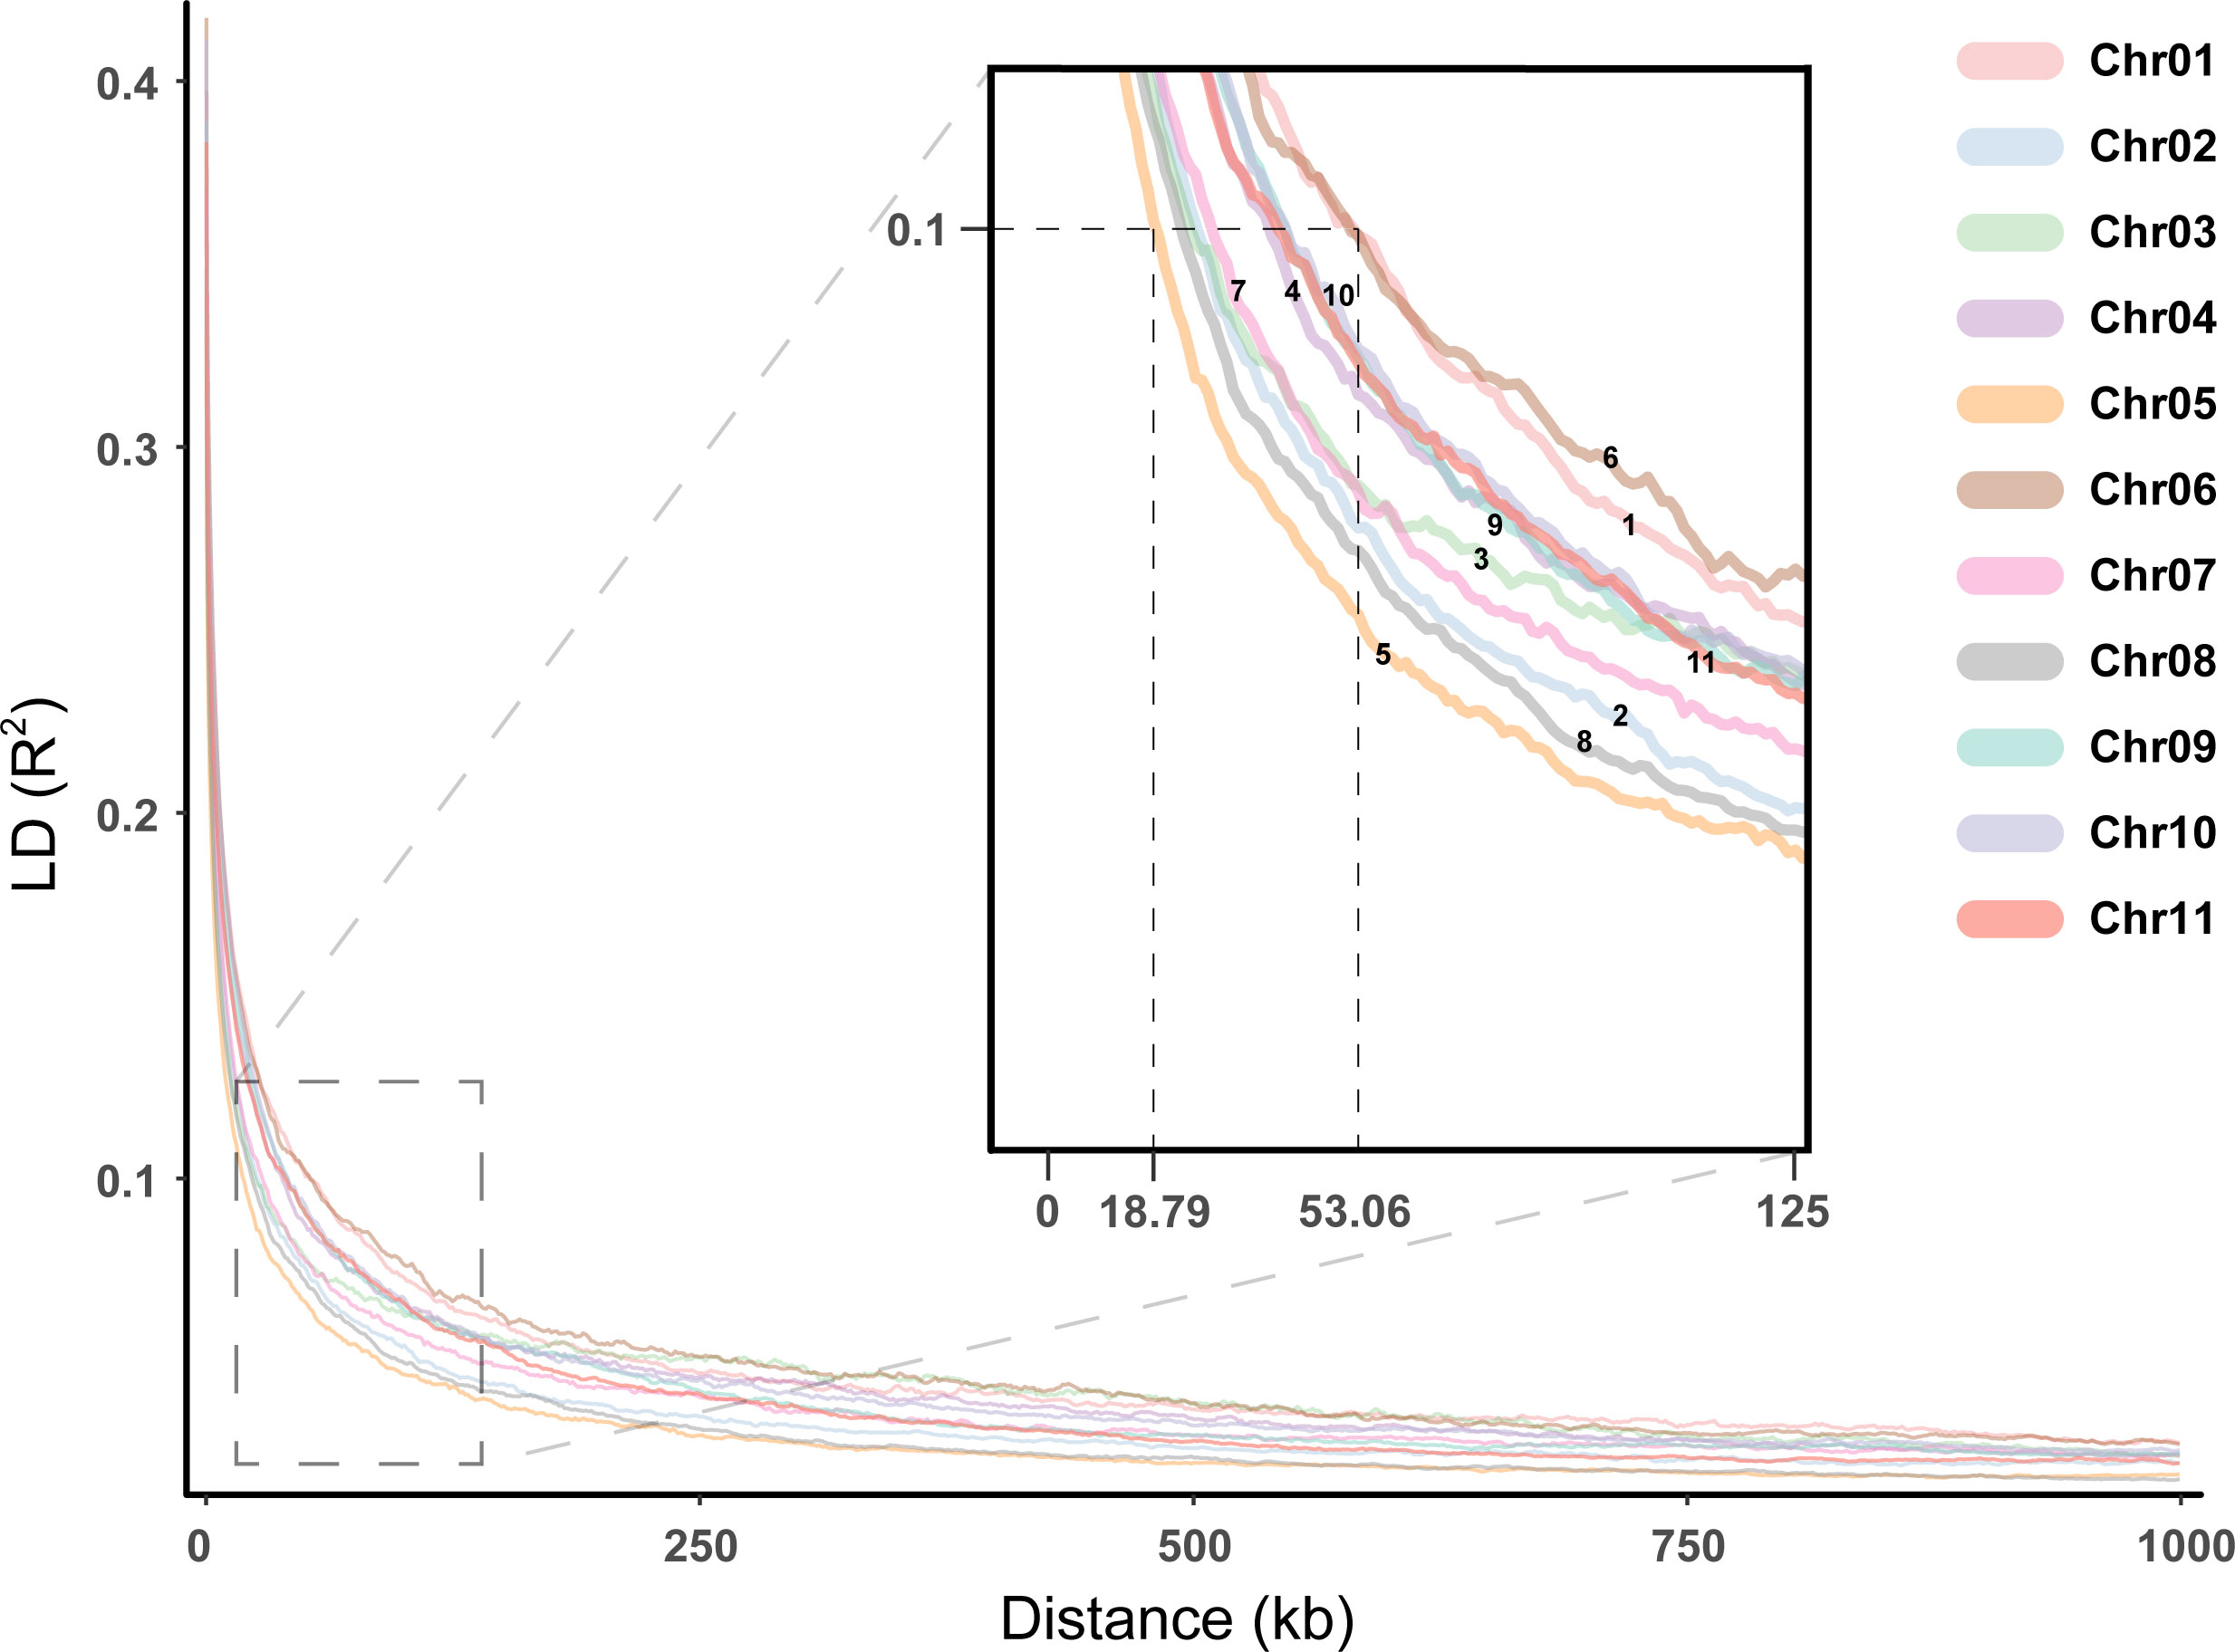
Figure 6 Linkage disequilibrium for the E. pellita chromosomes. Different chromosomes were represented in different colors, and the enlarged image was used to clearly show the decay rate of different chromosomes.
Table 3 shows the results of AMOVA for the 196 E. pellita using 12,475 SNP markers. The results showed that the genetic variation among population accounted for only 10% of the total variation, while the genetic variation within the populations accounted for 90%.
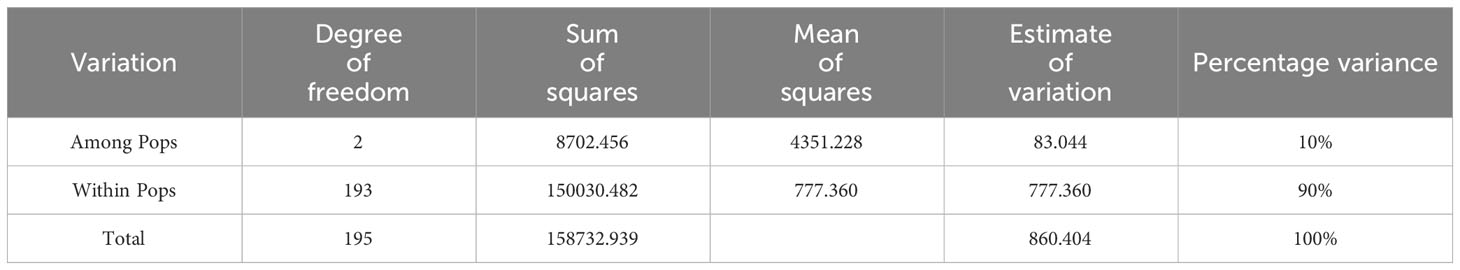
Table 3 Analysis of molecular variance (AMOVA) results.
All Fst comparisons between populations showed the values between PNG and QLD were higher than others, while Nei’s genetic distance values between IDN and QLD were higher than others (Table 4). In general, Nei’s genetic distance is more suitable for the study of genetic diversity within a population. Thus, a smaller genetic difference (Fst = 0) between IDN and QLD indicates the presence of higher gene flow or similarity in gene frequencies.
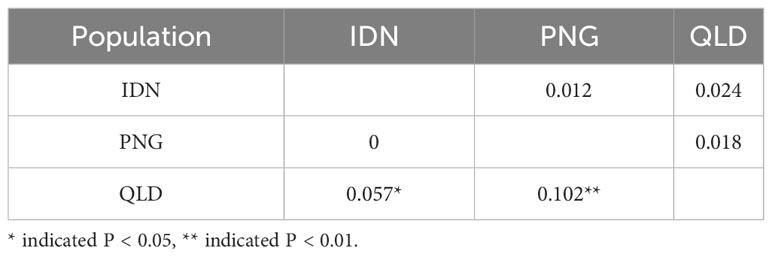
Table 4 Pairwise PhiPT values (below diagonal) and Nei’s minimum genetic distance (above diagonal) between populations within region for 196 E. pellita assessed using GenAlex software.
A mantel test was performed to obtain a correlation coefficient between genetic distance and geographic distance of E. pellita. The SNP marker-based correlation coefficient was Rxy 0.09 (P < 0.05), indicating a positive correlation between genetic distance and geographical location.
In the coding region, the ratio of non-synonymous to synonymous coding mutations was 0.83, which was similar to that of Arabidopsis thaliana (0.83) (Clark et al., 2007), but lower than that of Cajanus cajan (1.18) (Varshney et al., 2017) and Chinese plum (1.32) (Wei et al., 2021), indicating that there were fewer mutations causing protein changes in the coding region compared with other species. The ratio of non-synonymous to synonymous coding mutations is less than 1, suggesting that negative selection is an important evolutionary force affecting E. pellita.
The genetic structure of E. pellita was analyzed using various methodologies including population structure analysis, PCA, and phylogenetic tree construction, thereby providing complementary information. The 1st generation of E. pellita families from three sources: QLD, PNG, and IDN. According to the analysis results, the 23 1st generation provenances can be divided into three large groups. While the division of these groups is not fully compatible with the three large E. pellita sources, the families that come from the same source are essentially able to get together. This rule was also supported by the findings of the genetic distance calculation, which showed that there was a significant genetic distance between provenances in different locations and that there was a correlation between genetic distance and geographic position. Similarly, the clustering results of E. moluccana and its putative subspecies are not entirely consistent with geographical distribution (Flores-Rentería et al., 2021).
Genetic diversity analysis is of great significance to the evaluation and utilization of plant germplasm resources and the breeding of new varieties. It is also an important component of plant genetics, breeding, conservation, and evolution. In recent years, the majority of studies on the genetic diversity of Eucalyptus plants have primarily focused on SSR molecular markers, with a lack of emphasis on SNP markers. However, it is important to note that different molecular marker technologies yield varying results. For instance, when using SSR molecular markers, the He value for E. Cloeziana is 0.682 (Lv et al., 2020); whereas when utilizing SNP molecular markers, the He value ranges from 0.2677 to 0.3487 for E. urophylla (Yang et al., 2020). Similarly, the genetic diversity value (He) of SSR markers was significantly higher than that of SNP markers in palm trees (Jara-Arancio et al., 2022). These findings highlight the influence of different molecular labeling techniques on parameter values.
It is generally considered that PIC ≥ 0.5 is highly polymorphic, 0.25 ≤ PIC < 0.5 is moderately polymorphic, and PIC < 0.25 is low polymorphic (Botstein et al., 1980). Previous studies based on SSR markers showed that the PIC values of E. urophylla (Lu et al., 2018), E. camaldulensis and E. tereticornis (Arumugasundaram et al., 2011) were highly polymorphic (greater than 0.5). In this study, the mean values of total He and PIC of the 1st generation of E. pellita were 0.2502 and 0.2027, indicating a moderately low polymorphism according to Botstein’s theory (Botstein et al., 1980). However, the PIC obtained by SNP markers is at a low level, which may be because each SNP is bi-allelic in nature. Theoretically, the maximum PIC of a single SNP is 0.5 (Eltaher et al., 2018). Similarly, other species studied based on SNP markers had lower PIC, such as corn (0.19) (Adu et al., 2019), cowpea (0.27) (Seo et al., 2020), sorghum (0.24) (Silva et al., 2020). In conclusion, the genetic diversity of E. pellita in this study is theoretically not low.
In addition, the difference between the observed heterozygosity and the expected heterozygosity reflected the rationality of SNP markers selection and the genetic diversity of population (Liu et al., 2022). In this study, the He and Ho difference of the three origins (QLD、IND、PNG) of the first-generation population was small, which could accurately estimate the genetic structure of the E. pellita population, indicating QLD had a relatively high genetic richness than others.
Through to the 1st generation group differentiation index (Fst) analysis, this study for E. pellita has two natural origins (QLD and PNG) that provided evidence, at the same time, this study also continued to develop the inference, considered one of the big provenances PNG1 spread by big provenance QLD, this assumption is supported by other index, for example, genetic distance. Population differentiation index is one of the important indexes to analyze the origin of species. Many scholars use this index to analyze the origin of species. According to the analysis of Cajanus cajan (Varshney et al., 2017), South Asian and sub-Saharan African populations had the lowest Fst values (0.102) compared to South Asian and South American populations (0.126) and South Asian and Central American populations (0.167). Fst values correlated with geographical distance between populations. These Fst values suggest that dal spread from South Asia to sub-Saharan Africa and finally to South and Central America.
The average Fst of the 1st generation natural E. pellita population was 0.0913, while the Fst of the 2nd and 3rd generations of E. urophylla based on SSR markers was 0.03 (Lu et al., 2018). It can be seen that the Fst of natural populations of E. pellita was in the middle level. Similarly, there were Eucalypts with low genetic differentiation index, for example, E. camaldulensis with Fst values of 0.044-0.065 (Butcher et al., 2002), E. globulus was only 0.08 (Jones et al., 2002), E. marginata was 0.045 (Wheeler et al., 2003). But some of the other Eucalyptus species had higher Fst values, for example, the Fst of E. curtisii was 0.30 (Smith et al., 2003), E. angustissima was 0.136 (Elliott and Byrne, 2004). E. morrisbyi was 0.19 (Jones et al., 2005).
The number of SNPs determines the accuracy and reliability of the results. A dataset consisting of 12,745 SNPs was employed for analysis. In comparison to recent studies on other tree species, such as avocado (384 SNPs) (Wienk et al., 2022) and palm (1038 SNPs) (Jara-Arancio et al., 2022), a larger number of filtered SNPs was used in this study, despite their original datasets containing millions or even billions of SNP loci. Thus, differences in analysis results between populations can be attributed to different filtering parameters applied to SNPs.
Considering the filtered SNP loci, AMOVA reveals that 90% of the variation is within populations. This percentage is notably higher compared to other tree species. For instance, in the case of the Fujian tea tree, 66% of the variation is within populations, but these samples have a closer geographic distribution (Liu et al., 2022). In this study, particularly for the QLD population, samples from different provenances span a larger geographic range, leading to greater differences within populations. This highlights a certain correlation between the geographic distribution of provenances and population variation.
To validate the potential association between different populations, Fst and Nei’s distance were employed to assess genetic differences between populations. In this study, Fst values between PNG and QLD were relatively high, while Nei’s distance values between IDN and QLD were higher. This suggests that different analysis methods can yield distinct results. This phenomenon has been observed in other species as well (Wienk et al., 2022; Osundare et al., 2023), possibly attributed to either lower levels of population differentiation or the presence of complex genetic structures. In addition, the Mantel analysis results indicated a moderate correlation between the molecular matrix and the geographic matrix, with a Mantel test value of only 0.09 in this study. For comparison, the Pinus bungeana population in central China showed a significantly higher Mantel test value of 0.6 (Tian et al., 2022), and the rice population in northern India exhibited a value of 0.525 (Choudhury et al., 2023). A commonality in these cases is that the samples have relatively concentrated local distributions. As previously reported (Tian et al., 2022), introducing a more dispersed population would lead to a decrease in Mantel test values. Therefore, despite the broad geographic distribution of E. pellita, there is still a discernible correlation with genetic distance.
Although the provenance differences of the 1st generation of E. pellita have been indirectly studied by predecessors, the genetic diversity, population structure and genetic differentiation based on SNP markers in E. pellita have not been studied. In this study, we conducted rigorous whole-genome resequencing of 196 families of E. pellita. A series of analyses were carried out based on the quality screening SNP, and it was concluded that the 1st E. pellita population could be divided into three groups. The IDN and PNG provenances were classified into one group, and the QLD provenances were divided into two groups, and the QLD provenances had high genetic diversity. Our analysis of genetic differentiation reveals that QLD was the origin of E. pellita. Analyzed 12,475 screened SNPs, showed that the genetic variation among the population accounted for only 10% of the total variation, while the genetic variation within the populations accounted for 90%. The results of this study help to clarify the population structure and provide a valid inference for the population origin of E. pellita. The results lay the foundation for genome-wide association analysis.
The datasets presented in this study can be found in online repositories at the link below: https://www.ebi.ac.uk/eva/?eva-study=PRJEB70965.
CW: Conceptualization, Data curation, Writing – original draft. JLa: Investigation, Writing – review & editing. JW: Investigation, Writing – review & editing. WH: Software, Writing – original draft. WL: Investigation, Methodology, Writing – review & editing. YL: Investigation, Project administration, Writing – review & editing. JLu: Conceptualization, Supervision, Validation, Writing – review & editing.
The author(s) declare financial support was received for the research, authorship, and/or publication of this article. This work was supported by the Fundamental Research Funds for the Central Non-profit Research Institution of CAF (CAFYBB2021MB002) and National Key R&D Program of China for the 14th Five-year Plan (2022YFD2200203).
The authors declare that the research was conducted in the absence of any commercial or financial relationships that could be construed as a potential conflict of interest.
All claims expressed in this article are solely those of the authors and do not necessarily represent those of their affiliated organizations, or those of the publisher, the editors and the reviewers. Any product that may be evaluated in this article, or claim that may be made by its manufacturer, is not guaranteed or endorsed by the publisher.
The Supplementary Material for this article can be found online at: https://www.frontiersin.org/articles/10.3389/fpls.2023.1278427/full#supplementary-material
Adu, G. B., Badu-Apraku, B., Akromah, R., Garcia-Oliveira, A. L., Awuku, F. J., Gedil, M. (2019). Genetic diversity and population structure of early-maturing tropical maize inbred lines using SNP markers. PloS One 14 (4), e0214810. doi: 10.1371/journal.pone.0214810
Aesomnuk, W., Ruengphayak, S., Ruanjaichon, V., Sreewongchai, T., Malumpong, C., Vanavichit, A., et al. (2021). Estimation of the genetic diversity and population structure of Thailand’s rice landraces using SNP markers. Agronomy 11 (5), 995. doi: 10.3390/agronomy11050995
Alexander, D. H., Novembre, J., Lange, K. (2009). Fast model-based estimation of ancestry in unrelated individuals. Genome Res. 19 (9), 1655–1664. doi: 10.1101/gr.094052.109
Arumugasundaram, S., Ghosh, M., Veerasamy, S., Ramasamy, Y. (2011). Species discrimination, population structure and linkage disequilibrium in Eucalyptus camaldulensis and Eucalyptus tereticornis using SSR markers. PloS One 6 (12), e28252. doi: 10.1371/journal.pone.0028252
Botstein, D., White, R. L., Skolnick, M., Davis, R. W. (1980). Construction of a genetic linkage map in man using restriction fragment length polymorphisms. Am. J. Hum. Genet. 32 (3), 314–331.
Brawner, J. T., Bush, D. J., Macdonell, P. F., Warburton, P. M., Clegg, P. A. (2010). Genetic parameters of red mahogany breeding populations grown in the tropics. Aust. For. 73 (3), 177–183. doi: 10.1080/00049158.2010.10676324
Butcher, P. A., Otero, A., McDonald, M. W., Moran, G. F. (2002). Nuclear RFLP variation in Eucalyptus camaldulensis Dehnh. from northern Australia. Heredity 88 (5), 402–412. doi: 10.1038/sj.hdy.6800074
Butler, J. B., Freeman, J. S., Potts, B. M., Vaillancourt, R. E., Kahrood, H. V., Ades, P. K., et al. (2022). Patterns of genomic diversity and linkage disequilibrium across the disjunct range of the Australian forest tree Eucalyptus globulus. Tree Genet. Genom. 18 (3), 28. doi: 10.1007/s11295-022-01558-7
Byrne, M., Koenders, A., Rogerson, K., Sampson, J., van Etten, E. J. B. (2016). Genetic and morphological analysis of multi-stemmed plants of tuart (Eucalyptus gomphocephala). Aust. J. Bot. 64 (8), 704. doi: 10.1071/bt16091
Catanach, A., Crowhurst, R., Deng, C., David, C., Bernatchez, L., Wellenreuther, M. (2019). The genomic pool of standing structural variation outnumbers single nucleotide polymorphism by threefold in the marine teleost Chrysophrys auratus. Mol. Ecol. 28 (6), 1210–1223. doi: 10.1111/mec.15051
Choudhury, D. R., Kumar, R., Maurya, A., Semwal, D. P., Rathi, R. S., Gautam, R. K., et al. (2023). SSR and SNP marker-based investigation of Indian rice landraces in relation to their genetic diversity, population structure, and geographical isolation. Agriculture-Basel 13, 823. doi: 10.3390/agriculture13040823
Cingolani, P., Platts, A., Wang le, L., Coon, M., Nguyen, T., Wang, L., et al. (2012). A program for annotating and predicting the effects of single nucleotide polymorphisms, SnpEff: SNPs in the genome of Drosophila melanogaster strain w1118; iso-2; iso-3. Fly 6 (2), 80–92. doi: 10.4161/fly.19695
Clark, R. M., Schweikert, G., Toomajian, C., Ossowski, S., Zeller, G., Shinn, P., et al. (2007). Common sequence polymorphisms shaping genetic diversity in Arabidopsis thaliana. Science 317 (5836), 338–342. doi: 10.1126/science.1138632
Elliott, C. P., Byrne, M. (2004). Phylogenetics and the conservation of rare taxa in the Eucalyptus angustissima complex in Western Australia. Conserv. Genet. 5 (1), 39–47. doi: 10.1023/B:COGE.0000014063.56405.93
Eltaher, S., Sallam, A., Belamkar, V., Emara, H. A., Nower, A. A., Salem, K. F. M., et al. (2018). Genetic diversity and population structure of F(3:6) Nebraska winter wheat genotypes using genotyping-by-sequencing. Front. Genet. 9. doi: 10.3389/fgene.2018.00076
Flores-Rentería, L., Rymer, P. D., Ramadoss, N., Riegler, M. (2021). Major biogeographic barriers in eastern Australia have shaped the population structure of widely distributed Eucalyptus moluccana and its putative subspecies. Ecol. Evol. 11 (21), 14828–14842. doi: 10.1002/ece3.8169
Fufa, T. W., Abtew, W. G., Amadi, C. O., Oselebe, H. O. (2022). DArTSeq SNP-based genetic diversity and population structure studies among taro [(Colocasia esculenta (L.) Schott] accessions sourced from Nigeria and Vanuatu. PloS One 17, e0269302. doi: 10.1371/journal.pone.0269302
Gan, S., Shi, J., Li, M., Wu, K., Wu, J., Bai, J. (2003). Moderate-density molecular maps of Eucalyptus urophylla S. T. Blake and E. tereticornis Smith genomes based on RAPD markers. Genetica 118 (1), 59–67. doi: 10.1023/a:1022966018079
Govindaraj, M., Vetriventhan, M., Srinivasan, M. (2015). Importance of genetic diversity assessment in crop plants and its recent advances: an overview of its analytical perspectives. Genet. Res. Int. 2015, 431487. doi: 10.1155/2015/431487
Harwood, C. (1998). Eucalyptus pellita: An annotated bibliography (Canberra: CSIRO Forestry and Forest Products).
Harwood, C., Alloysius, D., Pomroy, P., Robson, K., Haines, N. (1997). Early growth and survival of Eucalyptus pellita provenances in a range of tropical environments, compared with E. grandis, E. urophylla and Acacia mangium. New For. 14 (3), 203–219. doi: 10.1023/A:1006524405455
Harwood, C., Nambiar, E. (2014). Productivity of acacia and eucalypt plantations in Southeast Asia. 2. Trends and variations. Int. For. Rev. 16 (2), 249–260. doi: 10.1505/146554814811724766
Helyar, S. J., Hemmer-Hansen, J., Bekkevold, D., Taylor, M. I., Ogden, R., Limborg, M. T., et al. (2011). Application of SNPs for population genetics of nonmodel organisms: new opportunities and challenges. Mol. Ecol. Resour. 11 Suppl 1, 123–136. doi: 10.1111/j.1755-0998.2010.02943.x
House, A. P. N., Bell, J. C. (1996). Genetic diversity, mating system and systematic relationships in two red mahoganies, Eucalyptus pellita and E. scias. Aust. J. Bot. 44, 157–174. doi: 10.1071/BT9960157
Jara-Arancio, P., da Silva Carvalho, C., Carmona-Ortiz, M. R., Bustamante, R. O., Schmidt Villela, P. M., da Silva Andrade, S. C., et al. (2022). Genetic diversity and population structure of jubaea Chilensis, an endemic and monotype gender from Chile, based on SNP markers. Plants-Basel 11, 1959. doi: 10.3390/plants11151959
Johnson, L. A. S., Hill, K. (1990). New taxa and combinations in Eucalyptus and Angophora (Myrtaceae). Telopea 4, 37–108. doi: 10.7751/TELOPEA19904916
Jones, R. C., Mckinnon, G. E., Potts, B. M., Vaillancourt, R. E. (2005). Genetic diversity and mating system of an endangered tree Eucalyptus morrisbyi. Aust. J. Bot. 53, 367–377. doi: 10.1071/BT04182
Jones, R. C., Steane, D. A., Potts, B. M., Vaillancourt, R. E. (2002). Microsatellite and morphological analysis of Eucalyptus globulus populations. Can. J. For. Res. 32, 59–66. doi: 10.1139/x01-172
Kirst, M., Basten, C. J., Myburg, A. A., Zeng, Z. B., Sederoff, R. R. (2005). Genetic architecture of transcript-level variation in differentiating xylem of a Eucalyptus hybrid. Genetics 169 (4), 2295–2303. doi: 10.1534/genetics.104.039198
Leksono, B., Kurinobu, S., Ide, Y. (2008). Realized genetic gains observed in second generation seedling seed orchards of Eucalyptus pellita in Indonesia. J. For. Res. 13 (2), 110–116. doi: 10.1007/s10310-008-0061-0
Li, H., Durbin, R. (2009). Fast and accurate short read alignment with Burrows–Wheeler transform. Bioinformatics 25, 1754–1760. doi: 10.1093/bioinformatics/btp324
Li, H., Handsaker, B., Wysoker, A., Fennell, T., Ruan, J., Homer, N., et al. (2009). The sequence alignment/map format and SAMtools. Bioinformatics 25 (16), 2078–2079. doi: 10.1093/bioinformatics/btp352
Liu, C., Yu, W., Cai, C., Huang, S., Wu, H., Wang, Z., et al. (2022). Genetic diversity of tea plant (Camellia sinensis (L.) kuntze) germplasm resources in Wuyi mountain of China based on single nucleotide polymorphism (SNP) markers. Horticulturae 8, 932. doi: 10.3390/horticulturae8100932
Liu, K., Muse, S. V. (2005). PowerMarker: An integrated analysis environment for genetic marker analysis. Bioinformatics 21 (9), 2128–2129. doi: 10.1093/bioinformatics/bti282
Lu, W., Qi, J., Lan, J., Luo, J. (2018). Genetic diversity of advanced generation breeding population of Eucalyptus urophylla in China. J. Trop. For. Sci. 30 (3), 320–329. doi: 10.26525/jtfs2018.30.3.320329
Lv, J., Li, C., Zhou, C., Chen, J., Li, F., Weng, Q., et al. (2020). Genetic diversity analysis of a breeding population of Eucalyptus cloeziana F. Muell.(Myrtaceae) and extraction of a core germplasm collection using microsatellite markers. Ind. Crop Prod. 145, 112157. doi: 10.1016/j.indcrop.2020.112157
McKenna, A., Hanna, M., Banks, E., Sivachenko, A., Cibulskis, K., Kernytsky, A., et al. (2010). The Genome Analysis Toolkit: A MapReduce framework for analyzing next-generation DNA sequencing data. Genome Res. 20 (9), 1297–1303. doi: 10.1101/gr.107524.110
Moran, G., Butcher, P., Glaubitz, J. (2000). Application of genetic markers in the domestication, conservation and utilisation of genetic resources of Australasian tree species. Aust. J. Bot. 48 (3), 313–320. doi: 10.1071/BT99015
Nieto, V., Giraldo-Charria, D., Sarmiento, M., Borralho, N. (2016). Effects of provenance and genetic variation on the growth and stem formation of Eucalyptus pellita in Colombia. J. Trop. For. Sci. 28 (3), 227–234. doi: 10.2307/43856526
Osundare, O. T., Akinyele, B. O., Odiyi, A. C., Paliwal, R., Oyatomi, O. A., Abberton, M. T. (2023). Genetic diversity and population structure of some Nigerian accessions of Bambara groundnut (Vigna subterranea (L.) Verdc.,) using DArT SNP markers. Genet. Resour. Crop Evol. 70, 887–901. doi: 10.1007/s10722-022-01472-w
Peakall, R., Smouse, P. E. (2006). GENALEX 6: Genetic analysis in Excel. Population genetic software for teaching and research. Mol. Ecol. Notes 6, 288–295. doi: 10.1111/J.1471-8286.2005.01155.X
Pfeifer, B., Wittelsbürger, U., Ramos-Onsins, S. E., Lercher, M. J. (2014). PopGenome: an efficient Swiss army knife for population genomic analyses in R. Mol. Biol. Evol. 31, 1929–1936. doi: 10.1093/molbev/msu136
Price, A. L., Patterson, N. J., Plenge, R. M., Weinblatt, M. E., Shadick, N. A., Reich, D. (2006). Principal components analysis corrects for stratification in genome-wide association studies. Nat. Genet. 38 (8), 904–909. doi: 10.1038/ng1847
Resende, R. T., Resende, M. D., Silva, F. F., Azevedo, C. F., Takahashi, E. K., Silva-Junior, O. B., et al. (2017). Regional heritability mapping and genome-wide association identify loci for complex growth, wood and disease resistance traits in Eucalyptus. New Phytol. 213 (3), 1287–1300. doi: 10.1111/nph.14266
Risch, N., Merikangas, K. R. (1996). The future of genetic studies of complex human diseases. Science 273, 1516–1517. doi: 10.1126/science.273.5281.1516
Seo, E., Kim, K., Jun, T. H., Choi, J., Kim, S. H., Munoz-Amatriain, M., et al. (2020). Population structure and genetic diversity in Korean cowpea germplasm based on SNP markers. Plants 9 (9), 1190. doi: 10.3390/plants9091190
Shang, X., Arnold, R. J., Wu, Z., Zhang, P., Liu, G., Luo, J., et al. (2019). Combining quantitative data on growth, wood density and other traits with SSR markers to evaluate genetic diversity and structure in a planted population of Eucalyptus camaldulensis Dehn. Forests 10 (12), 1090. doi: 10.3390/f10121090
Silva, K., Pastina, M. M., Guimarães, C. T., Magalhães, J. V., Pimentel, L. D., Schaffert, R. E., et al. (2020). Genetic diversity and heterotic grouping of sorghum lines using SNP markers. Sci. Agric. 78 (6), e20200039. doi: 10.1590/1678-992x-2020-0039
Smith, S., Hughes, J., Wardell-Johnson, G. (2003). High population differentiation and extensive clonality in a rare mallee eucalypt: Eucalyptus curtisii Conservation genetics of a rare mallee eucalypt. Conserv. Genet. 4, 289–300. doi: 10.1023/A:1024077315820
Tamura, K., Peterson, D., Peterson, N., Stecher, G., Nei, M., Kumar, S. (2011). MEGA5: Molecular evolutionary genetics analysis using maximum likelihood, evolutionary distance, and maximum parsimony methods. Mol. Biol. Evol. 28 (10), 2731–2739. doi: 10.1093/molbev/msr121
Tian, Q., El-Kassaby, Y. A., Li, W. (2022). Revealing the genetic structure and differentiation in endangered pinus bungeana by genome-wide SNP markers. Forests 13, 326. doi: 10.3390/f13020326
Wei, X., Shen, F., Zhang, Q., Liu, N., Zhang, Y., Xu, M., et al. (2021). Genetic diversity analysis of Chinese plum (Prunus salicina L.) based on whole-genome resequencing. Tree Genet. Genomes 17 (3), 1–10. doi: 10.1007/s11295-021-01506-x
Weir, B. S., Cockerham, C. C. (1984). Estimating F-statistics for the analysis of population structure. Evolution 38 (6), 1358–1370. doi: 10.2307/2408641
Wheeler, M. A., Byrne, M., McComb, J. (2003). Little genetic differentiation within the dominant forest tree, Eucalyptus marginata (Myrtaceae) of south-western Australia. Silvae Genet. 52, 254–259.
Wienk, R., Mostert-O’Neill, M., Abeysekara, N., Manosalva, P., Freeman, B., van den Berg, N. (2022). Genetic diversity, population structure, and clonal verification in South African avocado cultivars using single nucleotide polymorphism (SNP) markers. Tree Genet. Genomes 18, 41. doi: 10.1007/s11295-022-01573-8
Yaman, M. (2021). Evaluation of genetic diversity by morphological, biochemical and molecular markers in sour cherry genotypes. Mol. Biol. Rep. 49, 5293–5301. doi: 10.1007/s11033-021-06941-6
Yang, J. A., Lee, S. H., Goddard, M. E., Visscher, P. M. (2011). GCTA: A tool for genome-wide complex trait analysis. Am. J. Hum. Genet. 88 (1), 76–82. doi: 10.1016/j.ajhg.2010.11.011
Yang, H. X., Liao, H. Q., Zhang, W. H., Pan, W. (2020). Genome-wide assessment of population structure and genetic diversity of Eucalyptus urophylla based on a multi-species single-nucleotide polymorphism chip analysis. Tree Genet. Genomes 16 (3), 1–11. doi: 10.1007/s11295-020-1422-x
Varshney, R. K., Saxena, R. K., Upadhyaya, H. D., Khan, A. W., Yu, Y., Kim, C., et al. (2017). Whole-genome resequencing of 292 pigeonpea accessions identifies genomic regions associated with domestication and agronomic traits. Nat. Genet. 49 (7), 1082–1088. doi: 10.1038/ng.3872
Zhang, C., Dong, S.-S., Xu, J.-Y., He, W.-M., Yang, T.-L. (2019). PopLDdecay: a fast and effective tool for linkage disequilibrium decay analysis based on variant call format files. Bioinformatics 35, 1786–1788. doi: 10.1093/bioinformatics/bty875
Keywords: Eucalyptus pellita, single nucleotide polymorphism, population structure, genetic diversity, population differentiation
Citation: Wang C, Lan J, Wang J, He W, Lu W, Lin Y and Luo J (2023) Population structure and genetic diversity in Eucalyptus pellita based on SNP markers. Front. Plant Sci. 14:1278427. doi: 10.3389/fpls.2023.1278427
Received: 24 August 2023; Accepted: 25 October 2023;
Published: 15 December 2023.
Edited by:
Luigi Cattivelli, Council for Agricultural and Economics Research, ItalyReviewed by:
Chiara Biselli, Council for Agricultural and Economics Research (CREA), ItalyCopyright © 2023 Wang, Lan, Wang, He, Lu, Lin and Luo. This is an open-access article distributed under the terms of the Creative Commons Attribution License (CC BY). The use, distribution or reproduction in other forums is permitted, provided the original author(s) and the copyright owner(s) are credited and that the original publication in this journal is cited, in accordance with accepted academic practice. No use, distribution or reproduction is permitted which does not comply with these terms.
*Correspondence: Jianzhong Luo, OTY5MTcwNzg5QHFxLmNvbQ==
Disclaimer: All claims expressed in this article are solely those of the authors and do not necessarily represent those of their affiliated organizations, or those of the publisher, the editors and the reviewers. Any product that may be evaluated in this article or claim that may be made by its manufacturer is not guaranteed or endorsed by the publisher.
Research integrity at Frontiers
Learn more about the work of our research integrity team to safeguard the quality of each article we publish.