 Wachira Suwannarut
 Silvere Vialet-Chabrand
 Elias Kaiser
- Horticulture and Product Physiology, Wageningen University and Research, Wageningen, Netherlands
Photosynthesis (A) and stomatal conductance (gs) change diurnally due to internal signals, but the effects of diurnal rhythms on dynamic photosynthetic behavior are understudied. We examined diurnal changes in A and gs in ten tropical species: across species, there was a tendency for A and gs to decline diurnally when these were repeatedly measured under either steady-state or fluctuating irradiance conditions. We then examined in more detail the irradiance-induced kinetics of gas exchange in a C3 and C4 crop species each, namely fig (Ficus carica) and sugarcane (Saccharum officinarum). During the day, fig showed significantly slower photosynthetic induction and lower gs, as well as a slower gs increase, in the afternoon than in the morning and noon. Sugarcane showed a reduction in steady-state A reached under high irradiance and slower gs increase as well as lower gs reached under high irradiance, but no changes in the rate of photosynthetic induction, in the afternoon, compared to morning and noon. These reductions in the afternoon were not reverted by a dark treatment in the middle of the day, suggesting that the decrease was not proportional to diurnal time-integrated carbon fixation. Repeated exposure to light- and shadeflecks (1000 and 50 μmol m-2 s-1, lasting 20 min each) revealed fundamental differences in stomatal regulation between species: in fig, stomata opened and closed slowly, and their opening became progressively slower under a series of lightflecks, whereas sugarcane showed much faster stomatal opening than closure that was unchanged during the course of the day. Our results highlight that steady-state rates and irradiance-induced kinetics of photosynthesis and stomatal movement change diurnally in most species studied, and that they do so differently in fig and sugarcane.
1 Introduction
Plants continuously exchange gases with their environment. To match their metabolism with the environment, plants respond to both external and internal cues. While the effects of external drivers such as irradiance, CO2 concentration and temperature on photosynthetic gas exchange are apparent, internal drivers have effects as well (Matthews et al., 2017): for example, 15-25% of diurnal variation in net photosynthesis rate (A), 30-35% of changes in stomatal conductance ( ɡs) during the photoperiod, and a monotonic, ~30% decline in nocturnal mitochondrial respiration, all can take place under constant environmental conditions, and are thought to be driven by several internal processes (Resco de Dios, 2017; Resco de Dios and Gessler, 2018; Bruhn et al., 2022). An implication is that purely due to internal rhythms, the efficiencies of resource use, such as irradiance and intrinsic water use efficiency (WUEi), change during a 24 h period (Matthews et al., 2018). However, to what extent these diurnal signals affect the dynamics of A, ɡs and WUEi under fluctuating solar irradiance is not well documented (Vialet-Chabrand et al., 2017b; Matthews et al., 2018). Apart from circadian rhythms, most hypotheses about the diurnal signals and processes involved (e.g. photoinhibition, photoassimilate accumulation; (Mohotti and Lawlor, 2002; Paul and Pellny, 2003) suggest that it is time-integrated and disappears during the night. This raises the question if the diurnal reductions in A and ɡs and changes in the speed of response could be mitigated or reversed by a period of darkness or low irradiance during the middle of the day.
More often than not, plants grow under fluctuations in irradiance that are caused by wind-induced leaf movement, passing clouds, as well as the natural rotation of the Earth (Pearcy et al., 1996; Kaiser et al., 2018; Durand et al., 2021). Photosynthesis responds to sudden increases in irradiance with a delay, which is greater the longer a leaf had been in the shade before the irradiance increase. This delay is due to processes such as enzyme activation (biochemical limitations; Ernstsen et al., 1997) and stomatal opening (diffusional limitations; Parkhurst, 1994; Lawson and Vialet-Chabrand, 2019) that limit the rapid increase in A (Pearcy, 1988). When summed up throughout the photoperiod, the resulting loss in foregone CO2 assimilation may be in the range of 10-40% (Lawson and Blatt, 2014; Long et al., 2022), and the speed with which A responds to fluctuations in irradiance (dynamic A) thus presents an exciting opportunity for crop breeding and genetic modification (Kromdijk et al., 2016; Kaiser et al., 2019). There exists large inter- and intraspecific variation in properties of dynamic photosynthesis (McAusland et al., 2016; Soleh et al., 2017; Salter et al., 2019; Zhang et al., 2022). The ability to respond to irradiance changes is often quantified using measurements of photosynthetic induction (Kaiser et al., 2017; Kaiser et al., 2019): a leaf is first adapted to darkness or shade, is then exposed to high irradiance in a stepwise change, and the resulting increase in A is followed until A reaches a steady state at high irradiance (tens of minutes). Parameters that quantify the speed of the change in A, such as the times to reach 50 and 90% of final steady-state (tA50 and tA90, respectively) can then be calculated for comparison between species or treatments. The extent to which genotypic variation affects the diurnal rhythms of photosynthetic gas exchange is not well documented, especially with regard to diurnal variations in dynamic photosynthesis.
One source of variation between species is the type of photosynthetic metabolism (for a review that compares the physiologies of C3, C4 and CAM plants, see Yamori et al., 2014). Whether or not C4 plants use fluctuating irradiance more efficiently than C3 plants is under discussion, but may depend on the frequency of these fluctuations: the increased complexity in the C4 metabolism may lead to a slower build-up of metabolite pools and incoordination between metabolic pathways, or – conversely - lead to increased flexibility that would reduce the reliance on non-photochemical quenching during the first seconds after a low to high irradiance transition (Stitt and Zhu, 2014; Slattery et al., 2018). Additionally, how the time of day affects the photosynthetic response to irradiance fluctuations in C4 plants, and how this compares to C3 plants, is currently unknown.
The aim of this study was to compare how diurnal signals influence dynamic and steady-state gas exchange in tropical plant species that have not received a lot of attention, but are economically important. We investigated i) the impact of diurnal regulation of dynamic and steady-state photosynthetic gas exchange in ten different tropical plant species, of which nine were C3 and one was a C4 species, ii) in detail the differences in dynamic A and gs behavior throughout the day between a C3 and a C4 crop (Ficus carica and Saccharum officinarum, respectively), and iii) if the observed diurnal declines in these traits could be reversed or mitigated by an intermittent dark or low light intensity period.
2 Materials and methods
2.1 Plant materials and growth conditions
Two greenhouse compartments at Wageningen University and Research, the Netherlands (52°N, 5.5°E) constantly house a large number of tropical species, which grow in soil. All plants are irrigated with tap water by hand once or twice a week, as needed. The soil is regularly fertilized with cow manure and tree bark. Among these species, ten species were chosen based on their economic importance in tropical countries (Table 1; Figure S1). During the measurement period (June-September 2022), average day/night air temperatures and relative humidities (RH) were 24/19.4°C and 67/77%, respectively (Table S1). A shade screen (Ludvig Svensson, Sweden) was closed at solar incoming radiation >1075 μmol m-2 s-1 photosynthetic photon flux density (PPFD).
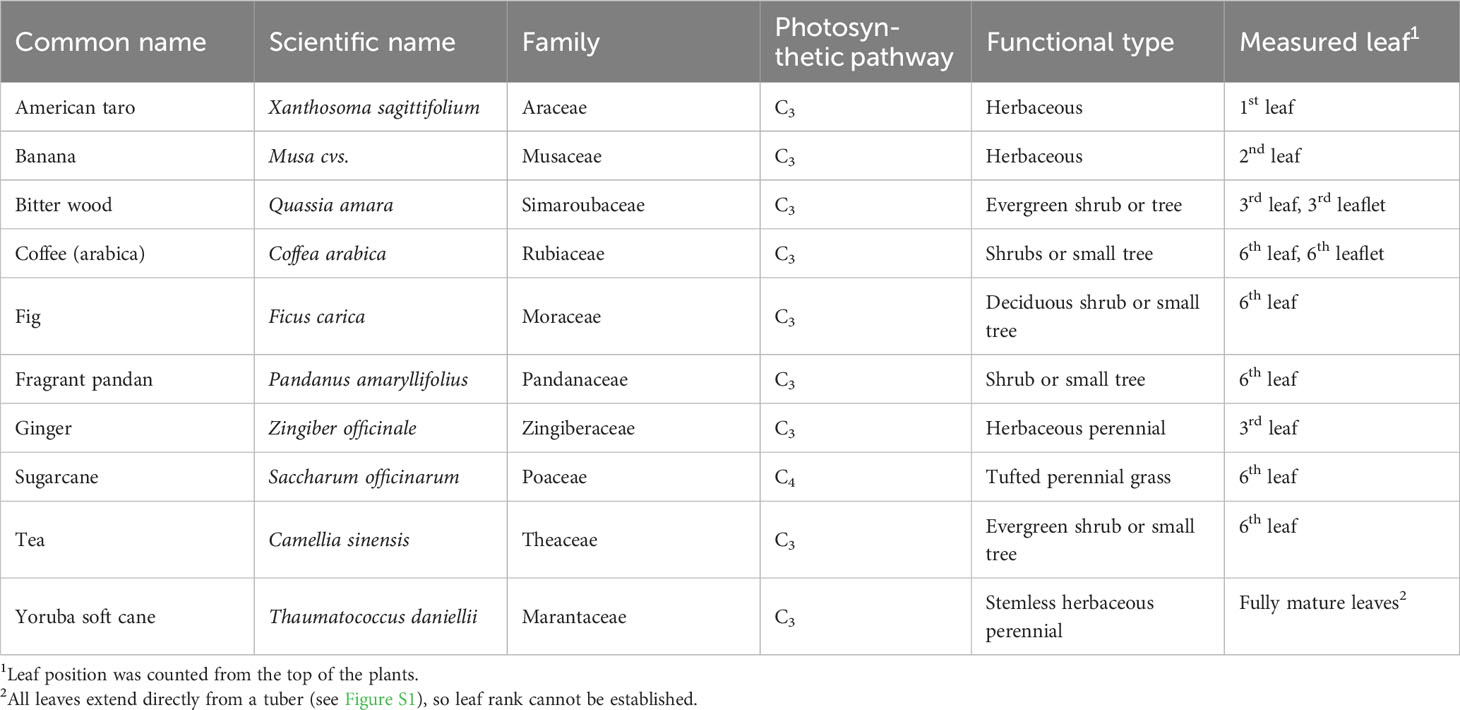
Table 1 List of investigated tropical plant species.
2.2 Gas exchange measurements
Gas exchange was measured on 6 cm2 of the uppermost, fully expanded leaves (Table 1), using the Li-6800 photosynthesis system (Li-Cor Biosciences, Lincoln, NE, USA). The flow rate of air was set to 500 µmol s-1, the CO2 concentration was 400 µmol CO2 mol-1 air, and irradiance was provided by a mixture of 90% red and 10% blue LEDs in the 6800-01A fluorometer. Environmental conditions in the cuvette were controlled to roughly match average conditions in the greenhouse: 26°C air temperature and 60% RH.
2.2.1 Photosynthetic induction
Plants were assessed for gas exchange responses to a step increase in irradiance from 50 to 1000 µmol m-2 s-1 (PPFD) at different times of the day: morning (9:00-10:30), noon (12:00-13:30), and afternoon (15:00-16:30). A first protocol was designed for fast screening of several species to separate fast and slow photosynthesis induction phenotypes; thereafter, a second protocol requiring lengthier but more detailed measurements was designed to study the causes of limitations in photosynthesis during photosynthetic induction. During measurements, gas exchange was recorded every second. For screening of diurnal changes in dynamic photosynthesis properties, photosynthetic induction in all ten species was measured during five min of high irradiance exposure. Leaves were covered with aluminum foil for 30 min for dark adaptation, and were then placed in the gas exchange cuvette at an irradiance of 50 µmol m-2 s-1 for five min, after which irradiance was increased to 1000 µmol m-2 s-1 for another five min. For subsequent measurements, fig and sugarcane were selected for measuring photosynthetic induction during 30 min of illumination. Leaves were enclosed in the gas exchange cuvette, exposed to 50 µmol m-2 s-1 for 35 min (during which both A and ɡs reached constant values), and were then exposed to 1000 µmol m-2 s-1 for 30 min. The measurement was performed in each species with one replicate per day, until five replicates had been collected. To assess the impact of an intermittent dark period on subsequent photosynthesis, leaves were wrapped in aluminum foil for five hours (10:00-15:00), and photosynthetic induction was measured before (9:00-10:00) and after (15:00-16:30) the dark period. Environmental conditions in the greenhouse were monitored throughout the experiment (Figure S2).
2.2.2 Steady-state measurements
To characterize gas exchange throughout the photoperiod, snapshot measurements on leaves of all ten species were conducted every 30 min between 9:00 and 16:00. During each measurement, the leaf was enclosed for ~2 min in the gas exchange cuvette at an irradiance of 200 µmol m-2 s-1, until A and ɡs had stabilized, and their values were logged. The value of 200 µmol m-2 s-1 PPFD (ca. 10% of full sunlight) was chosen to represent an intermediate between full shade and full sunlight exposure. In between measurements, leaves were exposed to the greenhouse environment.
2.2.3 Light- and shadeflecks
To study how fig and sugarcane leaves responded to repeated, rhythmic changes in irradiance during the day (9:00-16:00), a lightfleck protocol was devised: 50 µmol m-2 s-1 for 20 min (shadeflecks) were followed by a stepwise change to 1000 µmol m-2 s-1, which was applied for another 20 min (lightflecks). This cycle was repeated for a total of 7 hours. Gas exchange was recorded every 10 s. The measurement was performed on one replicate per day, until five replicates per species had been collected.
2.3 Calculations
Photosynthetic induction was calculated following Chazdon and Pearcy (1986):
Where A, Ai, and Af are transient A during photosynthetic induction, initial steady-state A at 50 µmol m-2 s-1, and final steady-state A at 1000 µmol m-2 s-1, respectively. Times to reach 50 and 90% of full photosynthetic induction (tA50, tA90) were calculated. In some cases, A showed strong overshooting behavior during photosynthetic induction (i.e., A at first increased to a transient peak value, and then decreased to settle on a final value); for these cases, we also calculated tA50 and tA90, using the peak value of A as Af. WUEi was calculated as:
The temporal response of ɡs to a stepwise increase and decrease in irradiance was calculated by using a curve-fitting routine in Microsoft Excel (Vialet-Chabrand et al., 2017b), which was described by sigmodal equations as follows:
where ɡsmax and ɡsmin represent the maximum and minimum steady state values of ɡs, and represent the time constants for the increase (equation 3) and decrease (equation 4) in ɡs, λ is the initial time lag, and t is the time at which ɡs is calculated from time = 0. All calculations were performed per replicate, and resulting parameters were used for statistical analysis.
2.4 Statistical analysis
All data are shown as average ± standard error (SE), based on three to five biological replicates per treatment (n = 3 – 5). Data were initially tested for homogeneity of variances (Levene’s test) and normal distribution (Shapiro–Wilk test). On datasets where those requirements were met, one-way repeated measures ANOVA was performed, followed by Fisher’s least significant difference (LSD) procedure to determine significant differences between treatments. Paired two-sample student’s t-tests were conducted for testing for significant differences between morning and afternoon in the intermittent dark treatment experiment. When datasets did not comply with normality or homogeneity of variances, the Kruskal–Wallis test was used instead of ANOVA, followed by Dunn’s test of multiple comparisons. Then, a Mann–Whitney U-test was conducted instead of the t-test. All statistical tests were performed using RStudio v.4.1.3 (R Core Team, 2022). Statistically significant differences were determined at p = 0.05.
3 Results
3.1 Dynamic and steady-state photosynthesis at different times of day in ten tropical species
The ten tropical plant species responded very differently to a short (5 min) step change in irradiance from 50 to 1000 μmol m-2 s-1 (lightfleck; Figure 1): American taro and fig showed a hyperbolic increase in A (Figures 1A, B), whereas sugarcane, coffee, ginger, tea and Yoruba soft cane showed linear increases in A that were very small in most cases (except for sugarcane; Figures 1C–G). A third group, namely banana, bitter wood, and fragrant pandan, did not show any significant change in A (Figures 1H–J). The average rate of increase in A during the first 100 s of high irradiance exposure varied greatly between species, ranging from ~0 μmol m-2 s-2 in coffee to 0.044 μmol m-2 s-2 in fig (Figure S3). The ability to use a lightfleck for photosynthesis decreased during the day, but did so with very different magnitude in the studied species: American taro, for example, showed a strong (but non-significant; p = 0.09 based on a paired t-test) decrease in A in the afternoon, only reaching ~30% of the values it had reached in the morning and noon (Figure 1A). Fig, ginger, coffee and Yoruba soft cane showed comparatively smaller, nonsignificant decreases in A in the afternoon. The only species that showed a significant reduction in A between morning and the rest of the day was tea (p = 0.006; Figure 1F). While sugarcane, coffee and ginger tended to have larger A values at noon than in the morning, no species showed peak values in the afternoon.
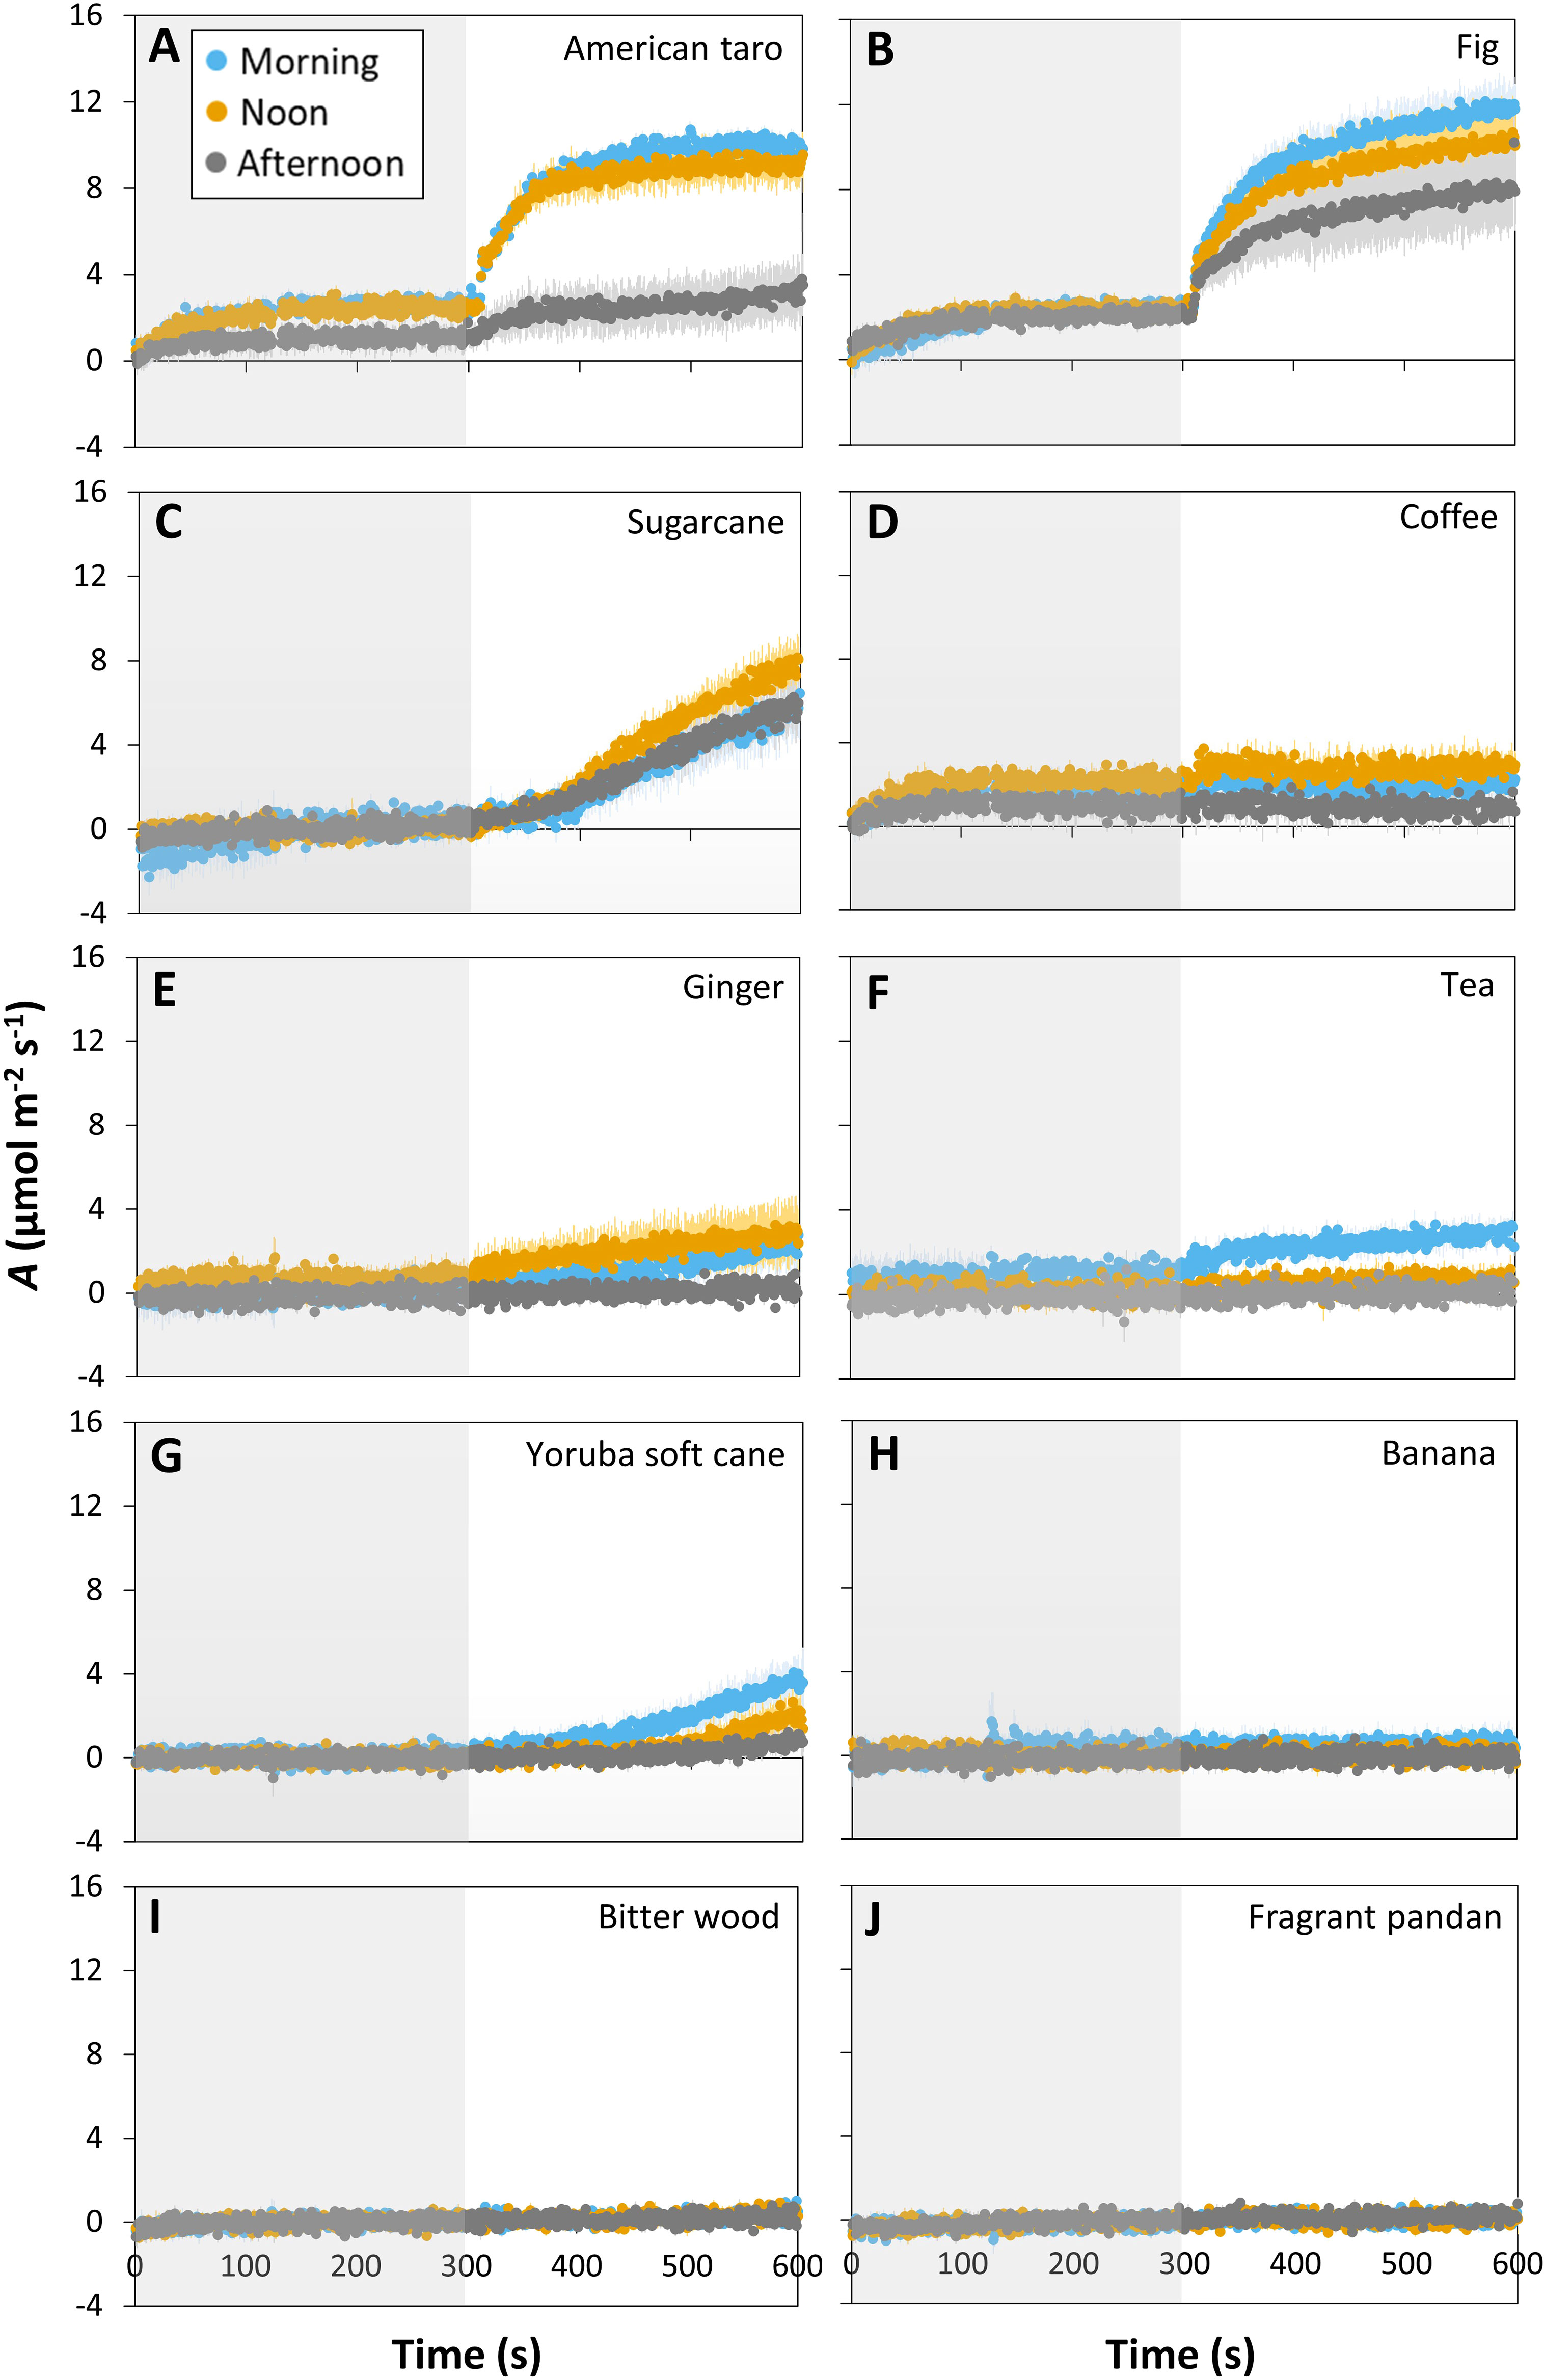
Figure 1 Time courses of net photosynthesis rate (A) in ten tropical plant species after a transition from low irradiance (50 µmol m-2 s-1, gray background) to high irradiance (1000 µmol m-2 s-1, white background) for 5 min (300 s) at different times of the day: morning (9:00-10:30), noon (12:00-13:30), and afternoon (15:00-16:30). Leaves were dark-adapted for 30 min before time = 0 s. Symbols represent averages ± SE, n = 3-5. Different panels show responses for American taro (A), Fig (B), Sugarcane (C), Coffee (D), Ginger (E), Tea (F), Yoruba soft cane (G), Banana (H), Bitter wood (I), and Fragrant pandan (J).
The tendency for photosynthetic gas exchange to decline during the photoperiod also showed in most species when steady-state A and ɡs were repeatedly measured at the same irradiance during the day (Figure 2). In Bitter wood, coffee, ginger, sugarcane, tea, American taro, banana and fig, the general trend was a monotonic decline in A, which was paralleled by a similar decline in ɡs in many cases (Figure S4). It is noteworthy that in the C3 species bitter wood and in the C4 species sugarcane, A declined whereas ɡs was relatively stable (and low) throughout the day, leading to a decline in WUEi throughout the day. Contrary to the other species, fragrant pandan and Yoruba soft cane did not show clear declines, but several in- and decreases in A and ɡs throughout the day (Figures 2G, J). In general, all species tended to show a lower value of A in the afternoon compared to the rest of the diurnal period.
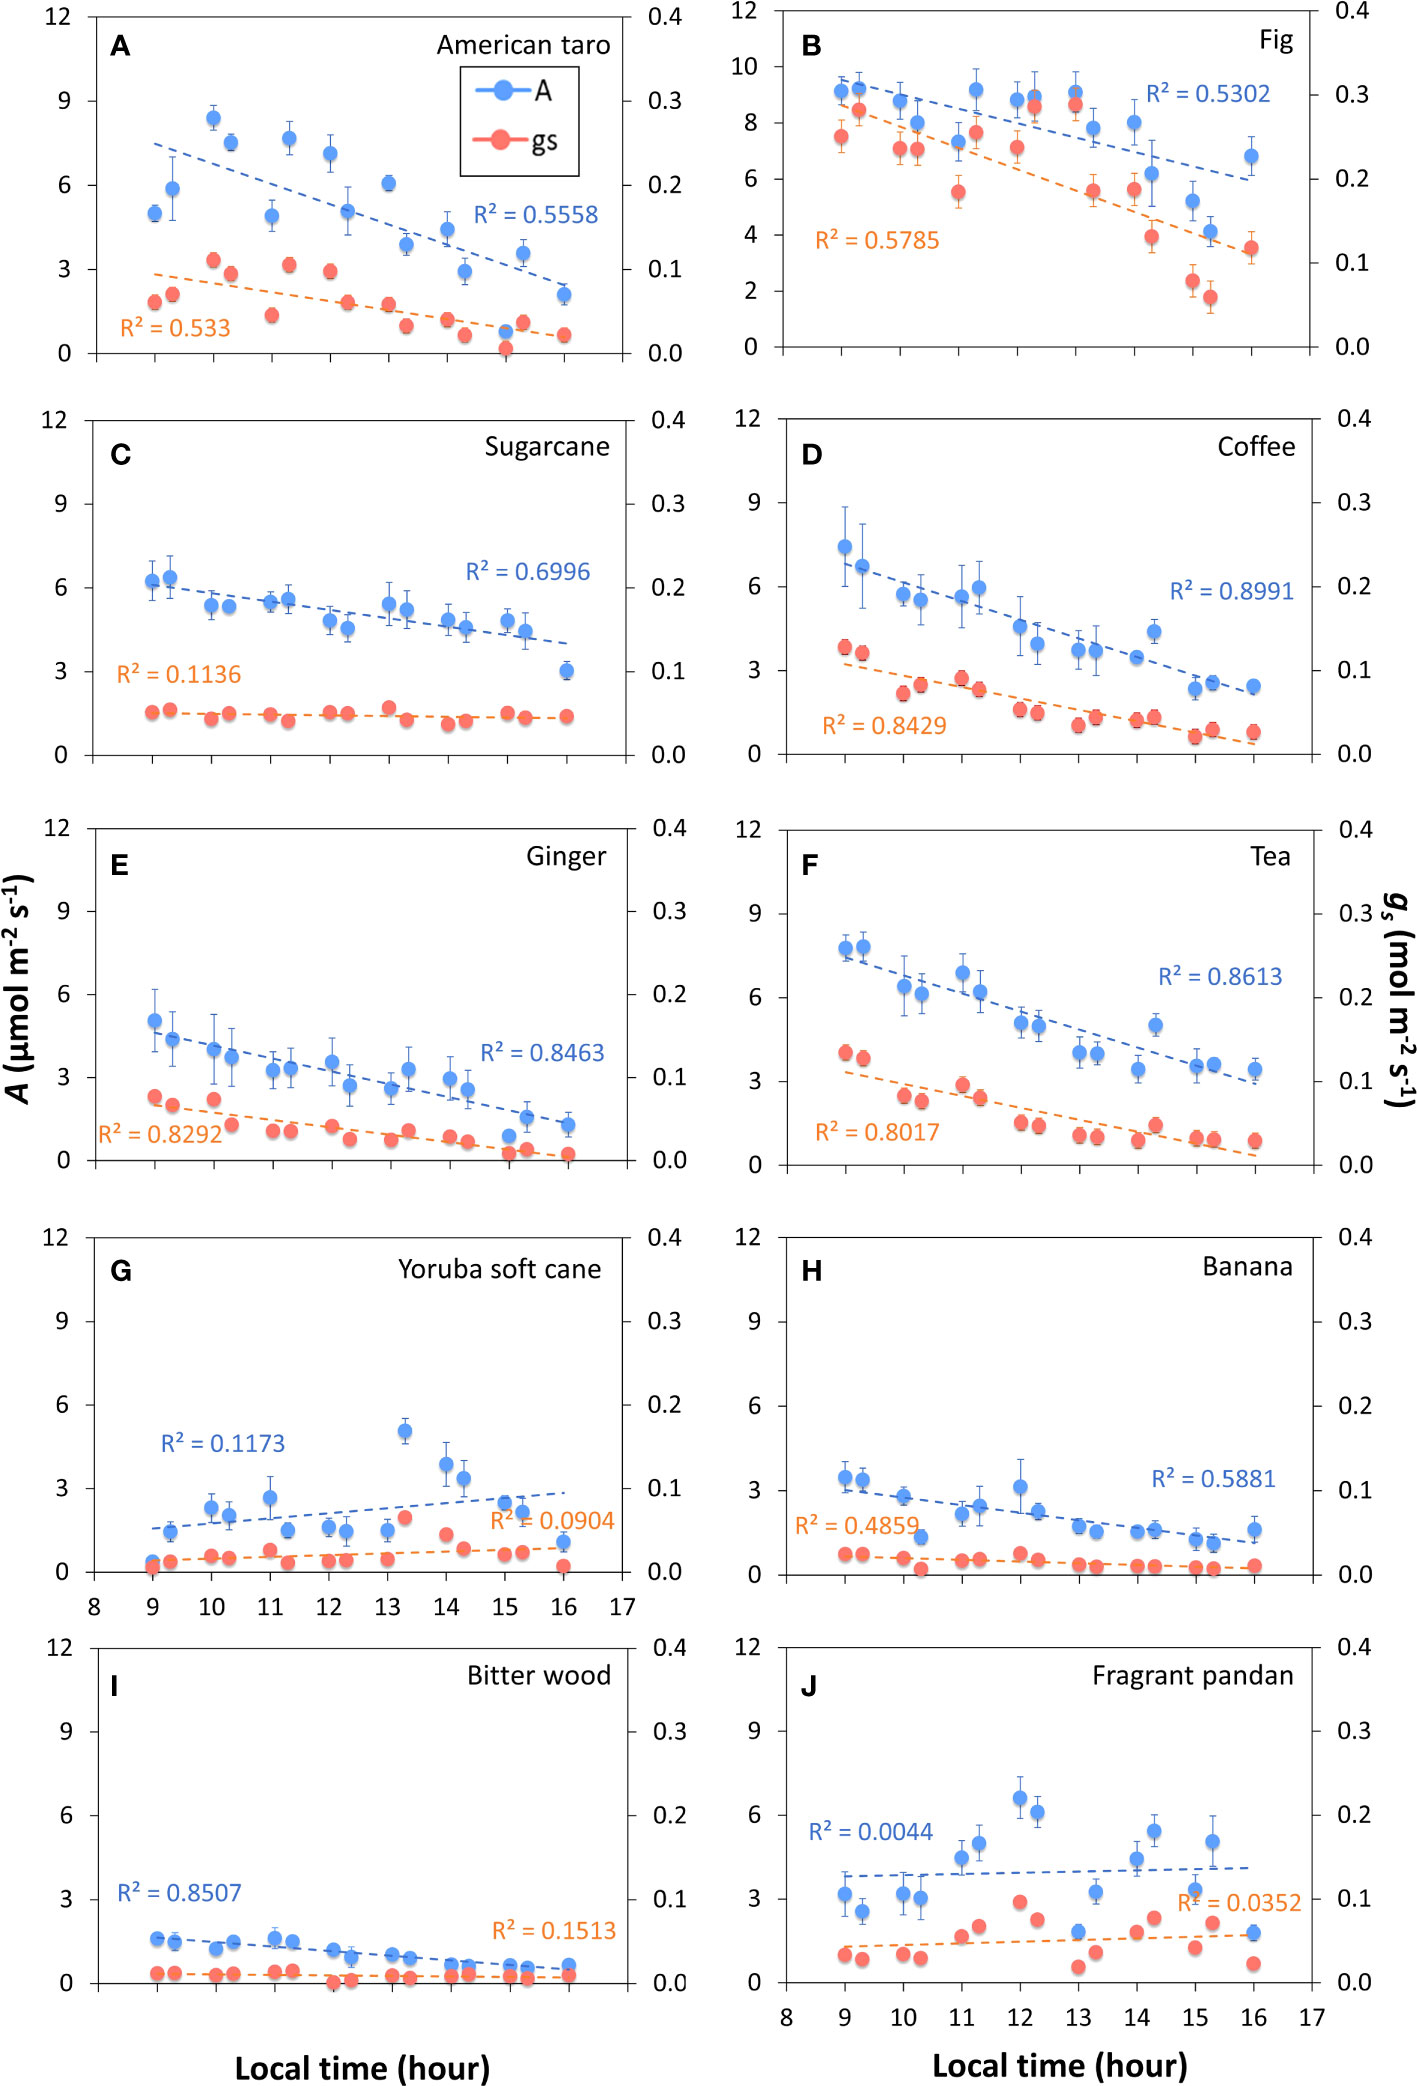
Figure 2 Net photosynthesis rate (A) and stomatal conductance (gs) throughout the photoperiod in ten tropical plant species. At every time point, measurements were conducted in snapshot-style measurements (~2 min per sample) under constant environmental conditions, whereas in between measurements, environmental conditions were variable. During measurements, irradiance was 200 μmol m-2 s-1 PPFD. Filled symbols show averages ± SE (n = 3-5), dashed lines show linear trends, R2 is the coefficient of determination. Different panels show responses for American taro (A), Fig (B), Sugarcane (C), Coffee (D), Ginger (E), Tea (F), Yoruba soft cane (G), Banana (H), Bitter wood (I), and Fragrant pandan (J).
3.2 Time of day effects on photosynthetic induction in fig and sugarcane
To study the diurnal response of photosynthetic gas exchange under fluctuating irradiance in greater detail, fig and sugarcane were chosen, because both species i) showed large changes in A and ɡs throughout the day (Figures 1, 2), ii) use different photosynthesis pathways, C3 and C4 respectively, iii) have kidney- and dumbbell-shaped stomata, respectively, and iv) are commercially relevant crops.
Photosynthesis and stomatal conductance reached after 30 min under high irradiance decreased during the diurnal period (Figure 3), similarly to observations in Figures 1 and 2. In addition, the temporal kinetics of A and ɡs showed species-specific differences throughout the day (Figures 3, 4). In fig, the rate of photosynthetic induction declined throughout the day (Figures 3A; S5A), resulting in significantly larger values of tA50 and tA90 in the afternoon compared to morning and noon (Figures 4A, C). This decline was paralleled by a gradual reduction in ɡs (Figure 3C), slower stomatal opening in the afternoon (larger τ, Figure 4E) resulting in a larger reduction in Ci during initial phases of photosynthetic induction (Figure 3E), and a tendency for WUEi to increase (Figure 3G). Despite this decrease in the rate of photosynthetic induction in fig, steady-state A at high irradiance was similar between different times of day (Figure 3A, inset). In sugarcane, on the other hand, the rate of photosynthetic induction did not change much throughout the day (Figures 3B, 4B, D), while steady-state A at the end of the irradiance phase dropped by more than half in the afternoon, reaching a significantly lower level compared to the other two time points (Figure 3B, inset). When tA50 and tA90 were calculated based on the peak value of A reached during photosynthetic induction (to account for the overshooting behavior of A), it could still be concluded that the rate of photosynthetic induction was not affected much in sugarcane by the time of day (Figure S6). Also, although photosynthetic induction was not strongly different between times of day in sugarcane (Figures 4B, D; S6), the absolute rate of increase in A did slow down significantly in the afternoon (p = 0.02; Figure S5B).
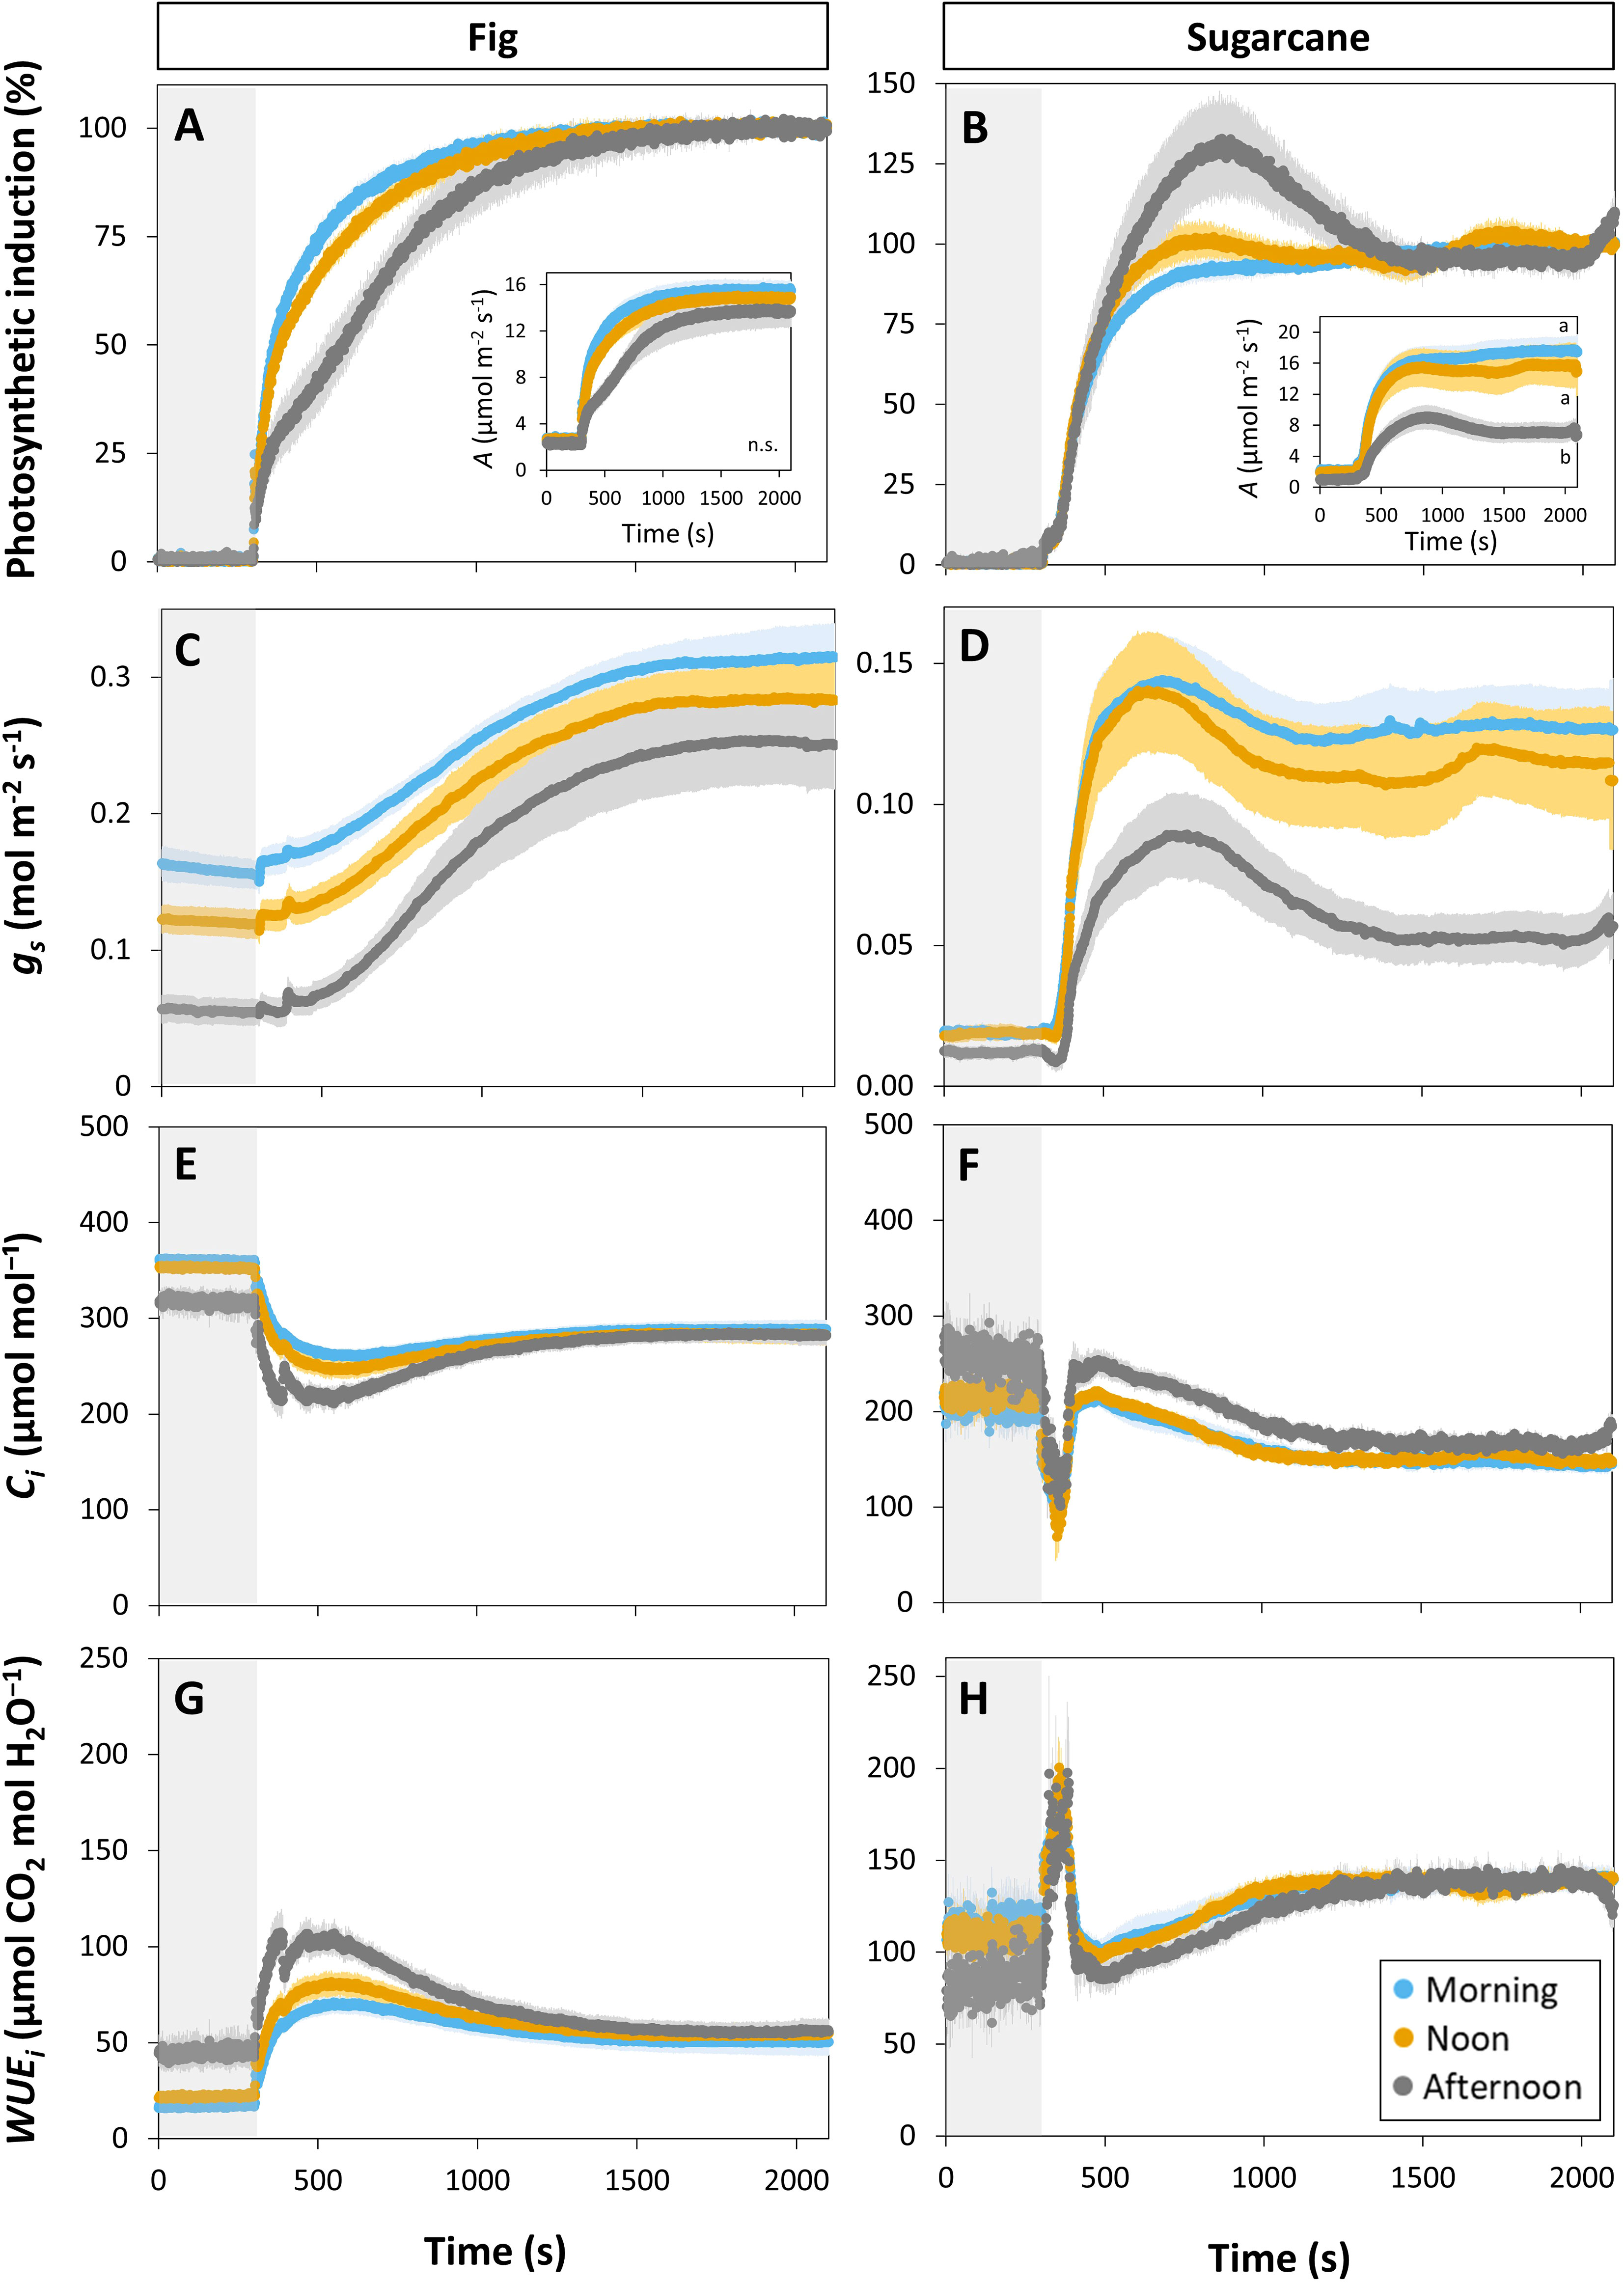
Figure 3 Time courses of gas exchange in fig (C3, left panel) and sugarcane (C4, right panel) after a transition from low (50 µmol m-2 s-1, gray background) to high irradiance (1000 µmol m-2 s-1) for 30 min (1800 s) at different times of the day: morning (9:00-10:30), noon (12:00-13:30), and afternoon (15:00-16:30). Before transition to high irradiance, leaves were adapted to 50 µmol m-2 s-1 for 35 min. (A, B), photosynthetic induction; (C, D), stomatal conductance (gs); (E, F), CO2 concentration in the substomatal cavity (Ci); (G, H), intrinsic water use efficiency (WUEi). Insets in (A, B) show time courses of net photosynthesis rate (A). Symbols represent averages ± SE, n = 5. Note that y-axis scales are different between plots.
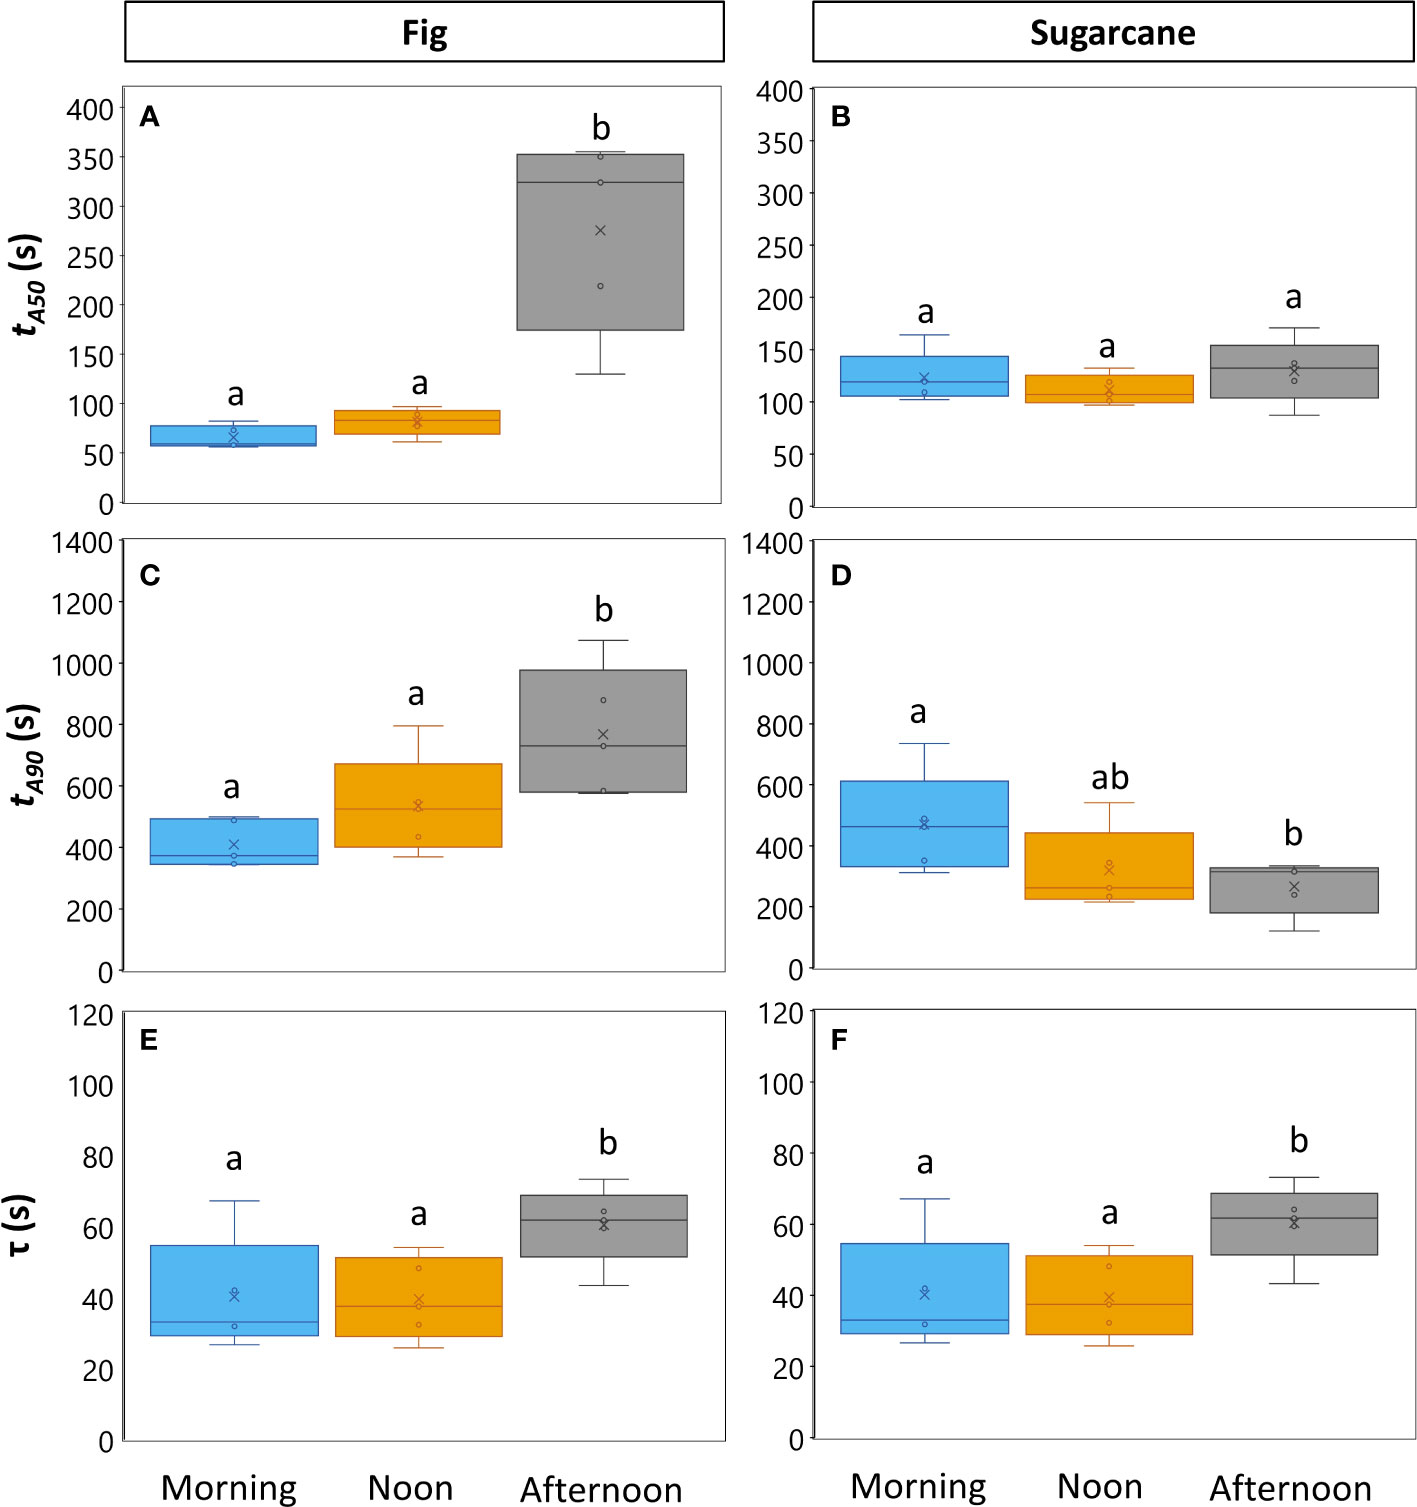
Figure 4 Parameters expressing speed of photosynthesis and stomatal conductance responses to an irradiance change in fig (C3, left panel) and sugarcane (C4, right panel). For details on experiment, see Figure 3. (A-D). Times required to reach 50% (A, B; tA50) and 90% (C, D; tA90) of final steady-state net photosynthesis rate during photosynthetic induction; (E, F), time constant of stomatal opening. Different letters above boxplots indicate statistically significant differences between times of day (p<0.05), as determined by Fisher’s LSD method. The vertical line inside the boxplot represents the median, the x represents the average value, upper and lower limits to the box represent the first and third quantile, respectively, and the whiskers represent the minimum and maximum values. Note that y-axis scales are different between plots.
The decrease in steady-state A was paralleled by a decrease in steady-state ɡs at high irradiance, which in the afternoon was reduced by more than half (compared to noon and morning; Figure 3D). The temporal kinetics of ɡs mostly differed by their decreasing levels (ɡsmin and ɡsmax) at different times of the day rather than their shape in fig, but were lower (ɡsmax) and slower in the case of sugarcane (Figure 4F). Further, ɡs in sugarcane exhibited overshooting behavior, as well as a reduction after the overshoot, both of which tended to get stronger as the day progressed (Figure 3D); this was coordinated with A responses, leading to strong transient increases and drops in A until a steady-state value was reached (Figure 3B). In sugarcane, Ci was low and WUEi high, both staying relatively unchanged throughout the day (Figures 3F, H) compared to fig, as would be expected of a C4 when compared to a C3 species.
Next, we wanted to know whether the diurnal decline of photosynthesis and stomatal conductance traits was caused by total irradiance exposure during the photoperiod, and consequently could be alleviated by a dark period (applied between 10:00 and 15:00). This seemed not to be the case (Figures 5; S7), as i) A and ɡs in sugarcane still showed the same strong decline (Figures 5B, D) and overshooting behavior they had shown without intermittent dark treatment (Figures 3B, D), ii) there was still a tendency for photosynthetic induction to be slower in the afternoon (Figure 5A), although the difference was not significant (Figure S7A), and iii) ɡs in fig still showed the same decrease as it had without intermittent dark treatment (compare Figures 5C, 3C). Calculating tA50 and tA90 based on overshooting behavior in sugarcane did not change these conclusions, as there was no difference between different times of day in sugarcane regardless of how tA50 and tA90 were calculated (cv. Figures S7, S8).
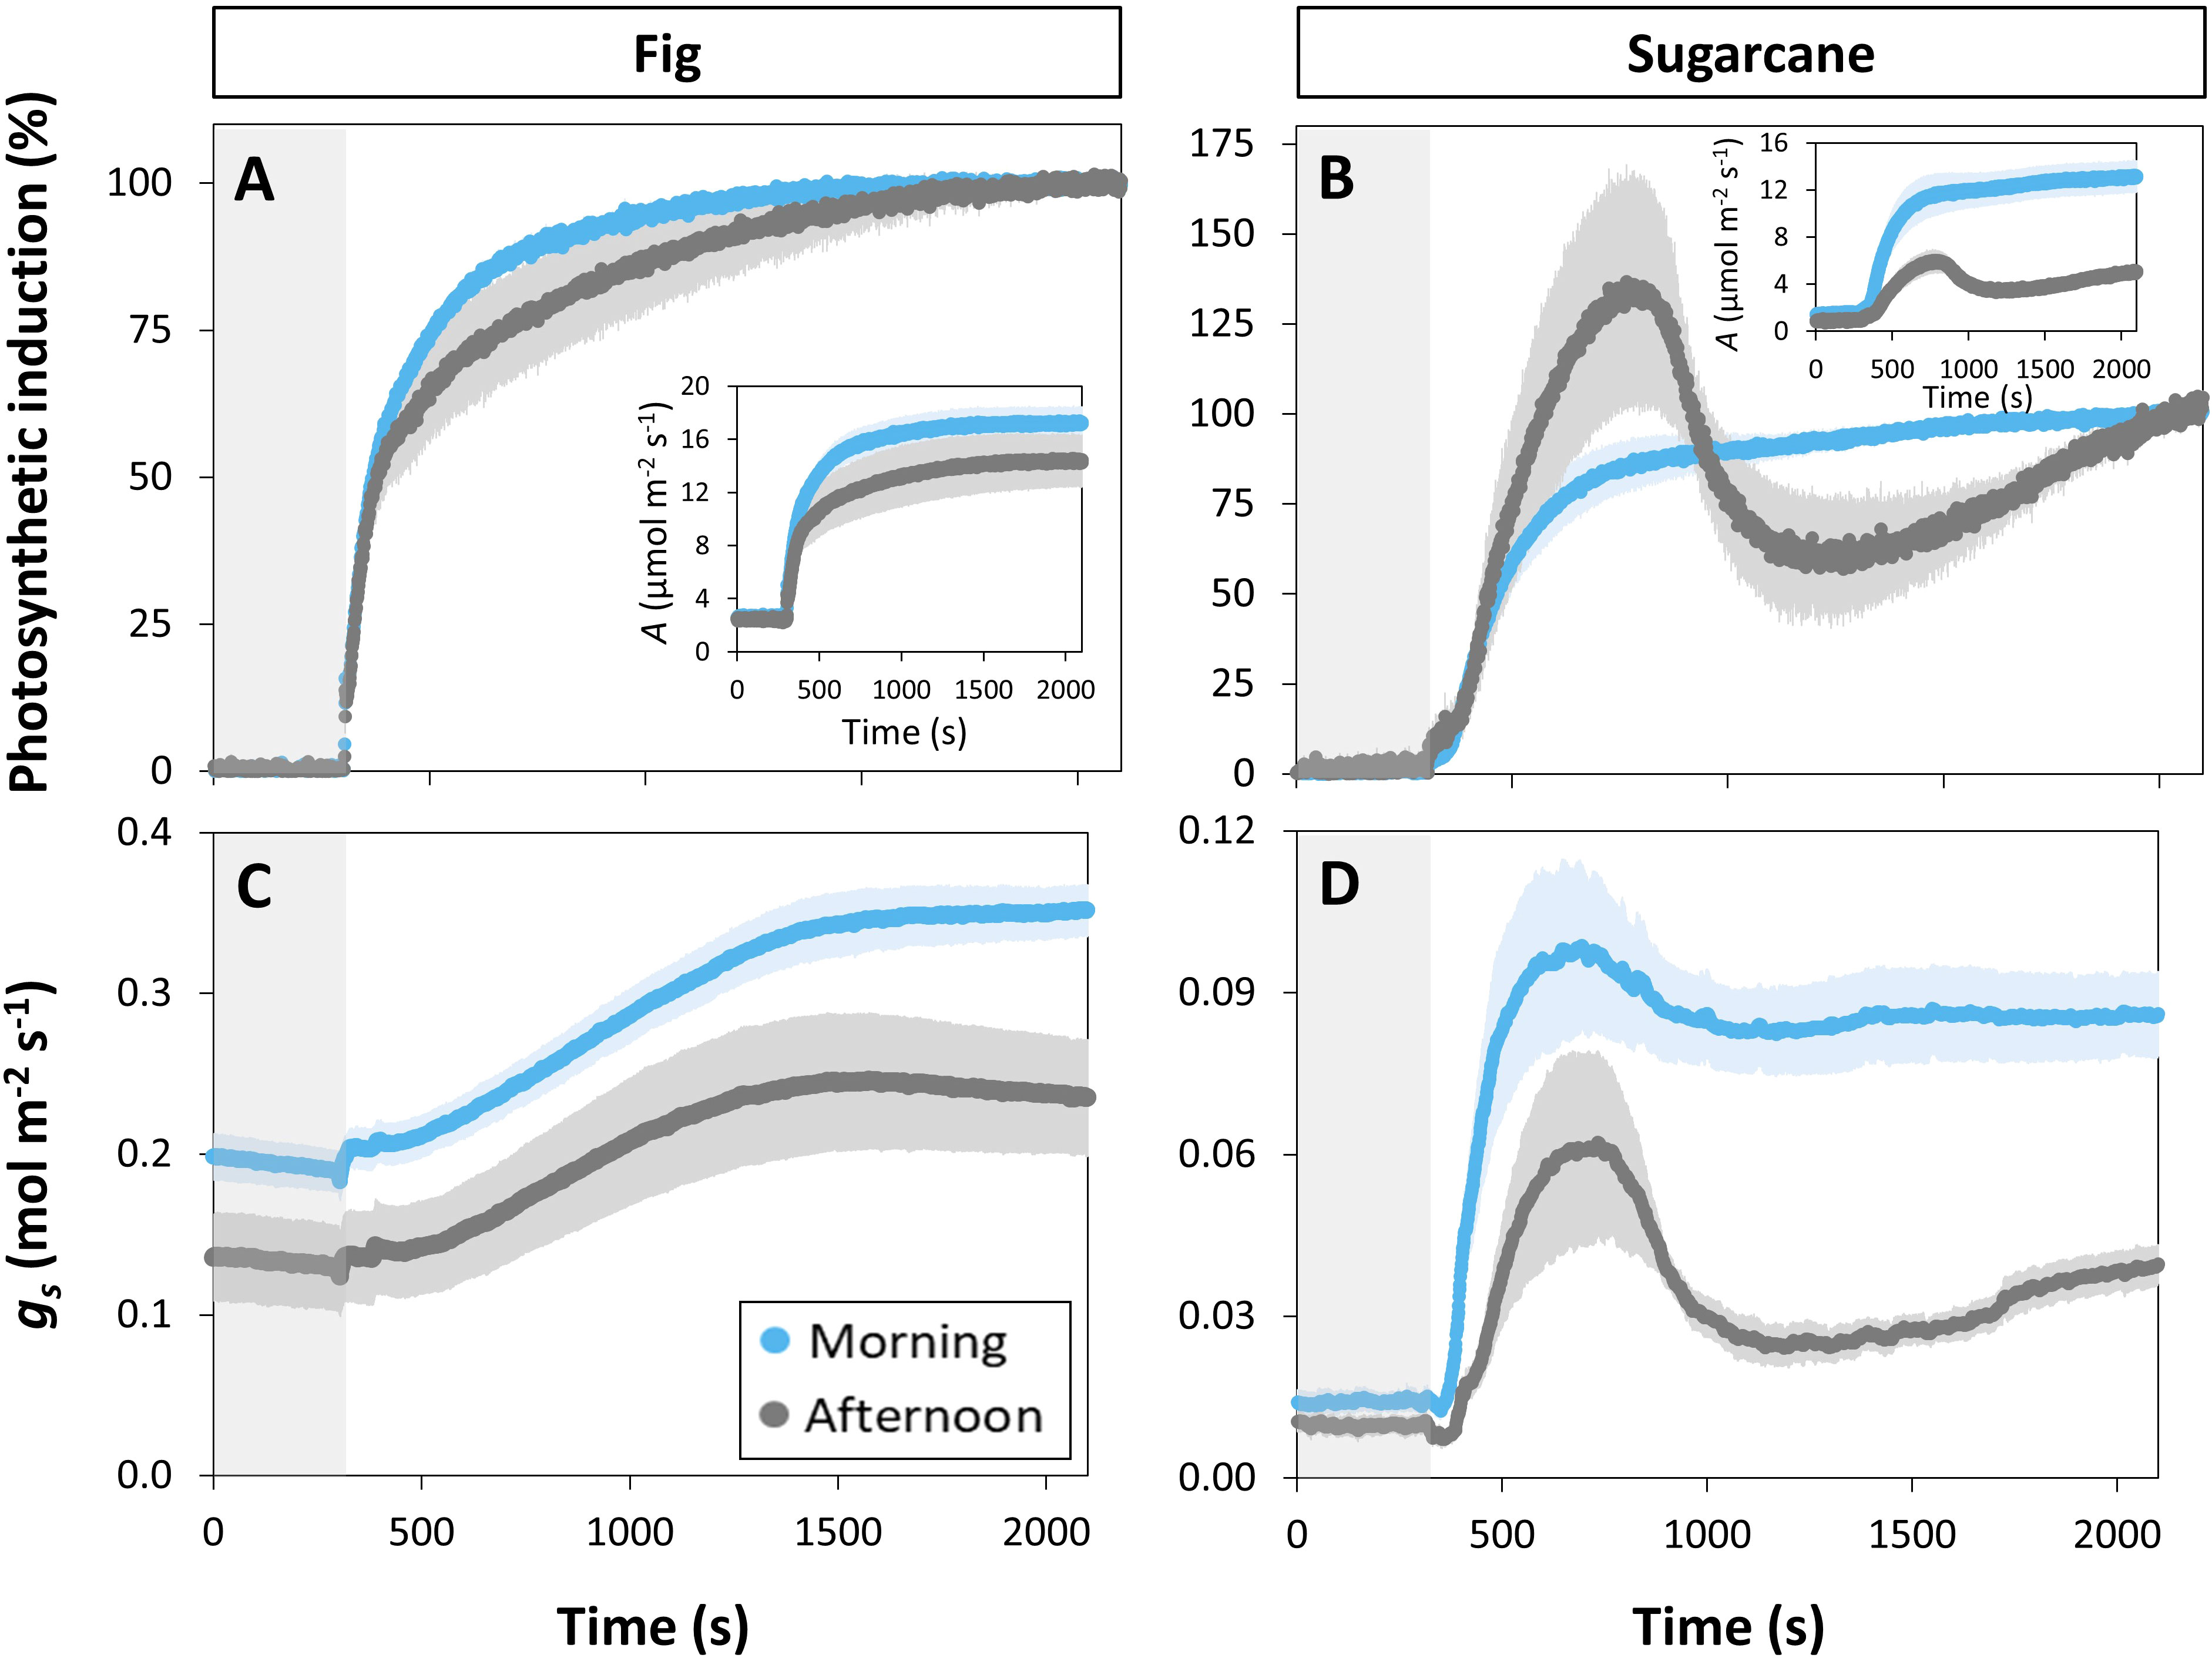
Figure 5 Results of midday dark adaptation experiment. Time courses of gas exchange in fig (C3, left panel) and sugarcane (C4, right panel) after a transition from low (50 µmol m-2 s-1, gray background) to high irradiance (1000 µmol m-2 s-1) for 30 min (1800 s) in the morning (9:00-10:00), and in the afternoon (15:00-16:30) after intermittent dark adaptation for five hours (10:00-15:00). Before transition to high irradiance, leaves were adapted to 50 µmol m-2 s-1 for 35 min. (A, B), photosynthetic induction; (C, D), stomatal conductance (gs). Insets in (A, B) show time courses of net photosynthesis rate (A). Symbols represent averages ± SE, n = 5. Note that y-axis scales are different between plots.
3.3 Gas exchange during repeated light- and shadeflecks
Next, we studied if an accumulation of irradiance fluctuations over the course of the day was the reason for the observed decrease in A and ɡs. To simulate these, leaves were exposed to repeated light- and shadeflecks, i.e. a 7 h sequence of transitions between 50 and 1000 μmol m-2 s-1, each taking 20 min. In fig, A during lightflecks never reached a steady state, but the highest attained value tended to show a decline (Figure 6A), which however was not significant (p = 0.129; average A during the last 30 s of a lightfleck was compared between the first and last lightfleck). During shadeflecks, A was unchanged in fig throughout the day, and showed a consistent, rapid decrease and slow re-increase (post-illumination CO2 burst) right after the high to low irradiance transition (from ~2 to ~3 μmol m-2 s-1; Figure 6A). Stomatal conductance in fig displayed symmetrical in- and decreases during light- and shadeflecks, respectively (Figure 6C). Changes in ɡs tended to become smaller in amplitude during the diurnal period, leading to a decrease in ɡs (Figure 6C). The overall decline in ɡs was relatively stronger than that of A, resulting in a tendency for WUEi to increase during the day (Figure 6E).
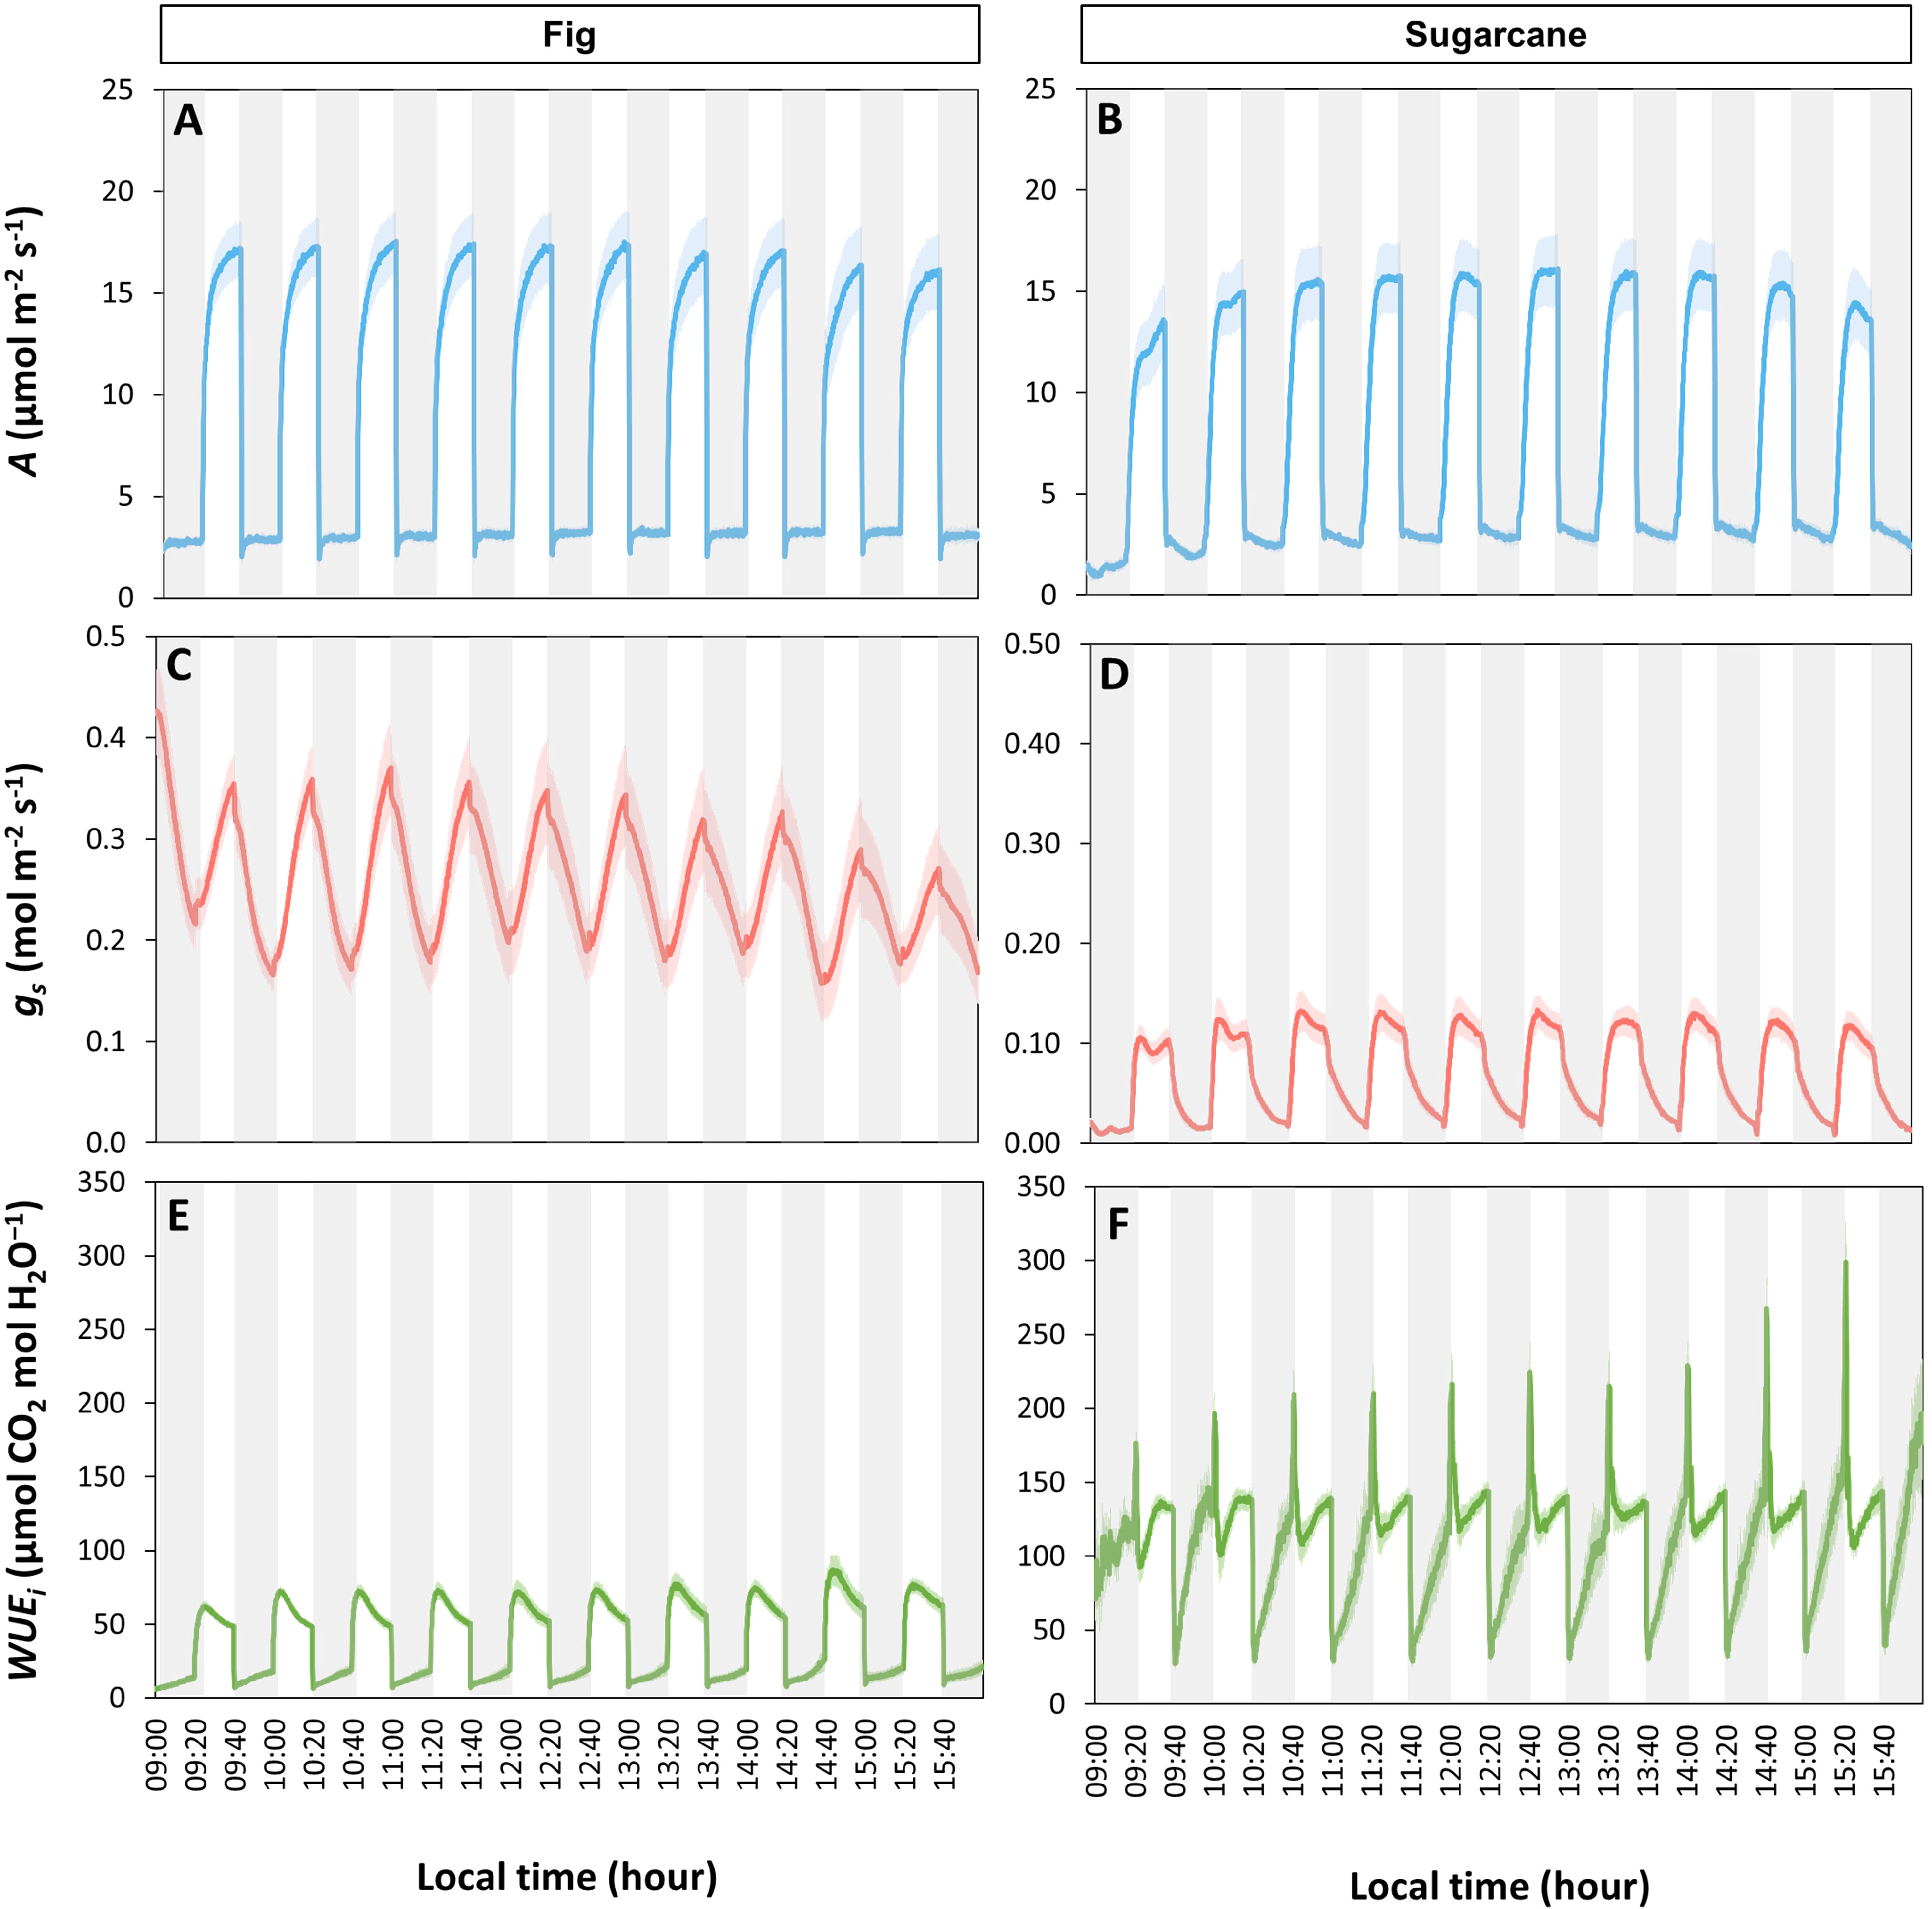
Figure 6 Time courses of photosynthetic gas exchange under a series of light- and shadeflecks. Leaves of fig (left panel) and sugarcane (right panel) were exposed to repeated changes between periods of low (50 µmol m-2 s-1, gray background) and high irradiance (1000 µmol m-2 s-1, white background), each period lasting 20 min, for a total of seven hours. (A, B), net photosynthesis rate (A); (C, D), stomatal conductance (gs), (E, F), intrinsic water use efficiency (WUEi). Lines represent averages ± SE, n = 5.
Unlike in fig, A in sugarcane often reached a steady state during lightflecks, but in some cases showed a subsequent decline (Figure 6B) that coincided with declines in ɡs (Figure 6D). During shadeflecks, A declined near-monotonically, but showed an increasing trend during the diurnal period. No post-illumination CO2 burst upon high to low irradiance transitions was observed in sugarcane (Figure 6B). Increases in ɡs during lightflecks were extremely rapid compared to fig, but after reaching an initial peak within 5-10 min at relatively low values (ca. 0.1 mol m-2 s-1), ɡs decreased (Figure 6D). Unlike the rapid ɡs increase, the decrease in ɡs upon high to low irradiance transitions displayed a first rapid decrease, followed by a slow exponential decay (Figure 6D). WUEi in sugarcane was ~ 2 - 3x higher than in fig and showed complex kinetics, with large spikes in the beginning of a lightfleck and large drops at the beginning of a shadefleck, as well as strong increases during the remainder of the shadefleck, as gs decreased (Figure 6F).
A closer look at ɡs kinetics during light- and shadeflecks (Figures 6C, D) revealed fundamental differences in stomatal regulation between the two species (Figure 7). Overall, fig displayed slow stomatal movement (large time constants and initial lag times; Figures 7A, C), as well large ɡsmax and ɡsmin (Figures 7E, G), but also showed a diurnal trend: the time constant for stomatal closure (τd) increased strongly and significantly with time, showing that at the end of the measuring period stomata took ca. twice as long to close as they had during its beginning, whereas the time constant for stomatal opening (τi) did not change with time (Figure 7A). Also, the lag time for stomatal opening or closure showed near-linear increases in fig (Figure 7C), whereas overall ɡs (ɡsmax and ɡsmin; Figures 7E, G) tended to decline over time. In contrast, sugarcane showed much faster stomatal movement, as illustrated by time constants that were ca. 2-6x smaller than in fig (Figure 7B). It is also noteworthy that in sugarcane, stomata closed much more slowly than they opened (ca. 4x larger τd than τI, Figure 7B), whereas such an obvious difference between the two time constants was not visible in fig (Figure 7A). Also, while the time lag for stomatal opening (λi) was ca. half as large in sugarcane compared to fig, there was no measurable time lag for stomatal closure in sugarcane (apart from the first 1-2 shadefleck instances; Figure 7D). Additionally, in sugarcane overall ɡs (ɡsmax and ɡsmin; Figures 7F, H) was very low and stable over time.
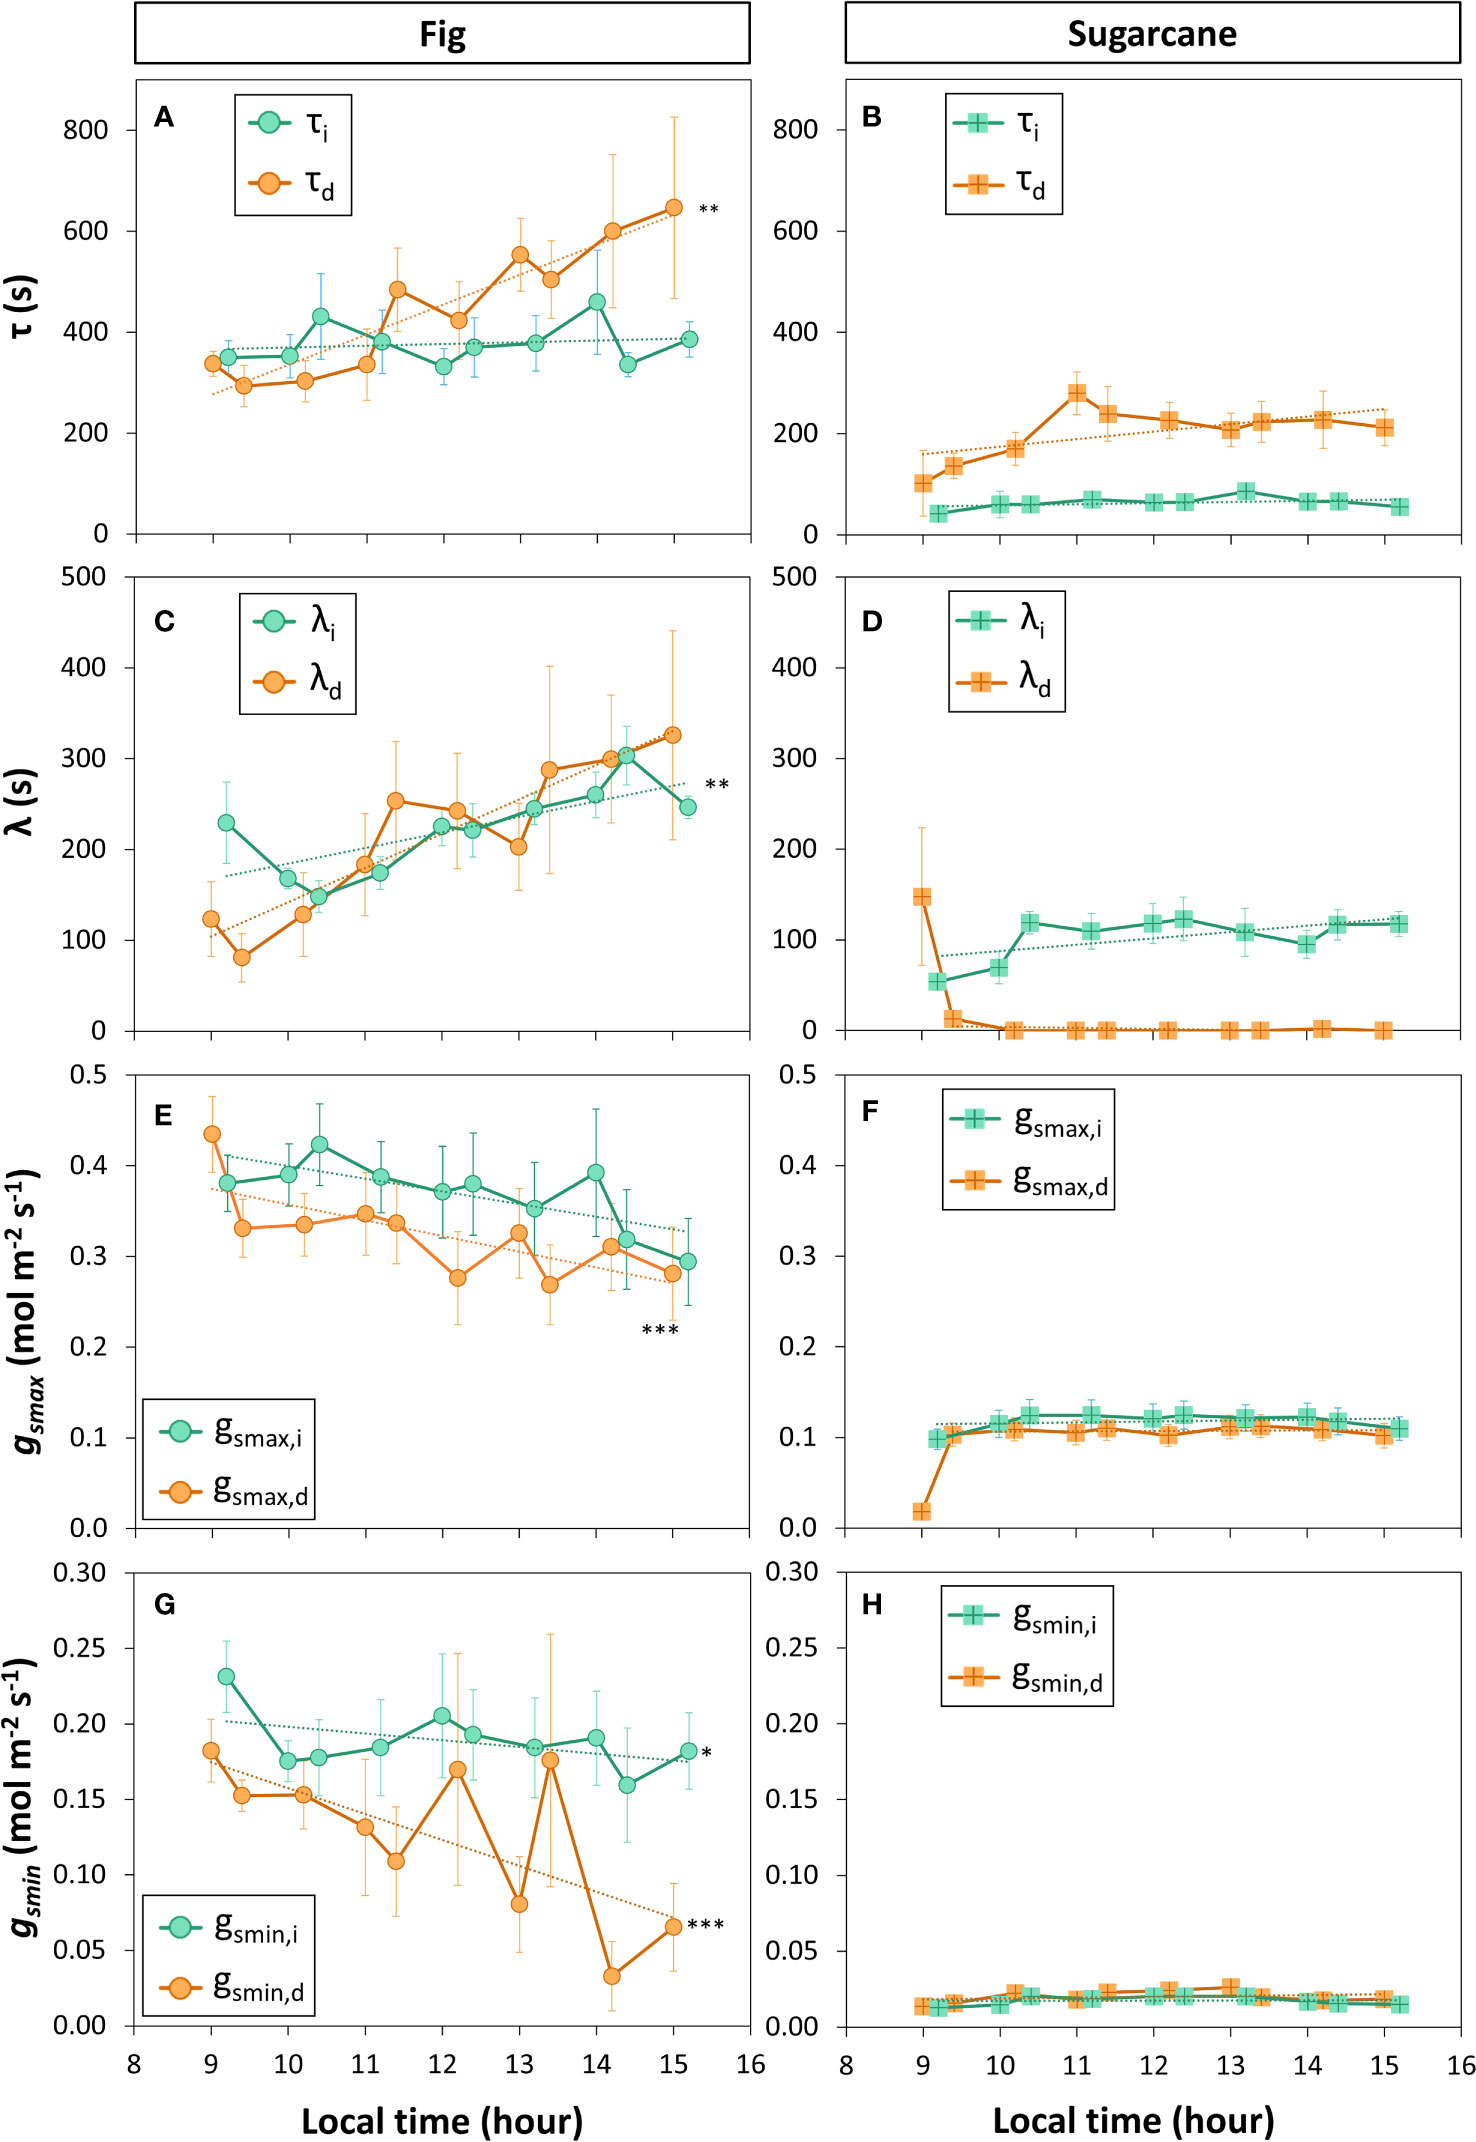
Figure 7 Parameters of stomatal conductance kinetics derived from a sequence of increased (Xi) and decreased (Xd) irradiance. Leaves of fig (left panel) and sugarcane (right panel) were exposed to repeated shadeflecks (50 µmol m-2 s-1) and lightflecks (1000 µmol m-2 s-1) for 20 min each, see Figure 6 for details. (A, B), time constant of stomatal movement (τ); (C, D), initial lag time of stomatal movement (λ), (E, F), maximum stomatal conductance (gsmax); (G, H), minimum stomatal conductance reached during low irradiance (gsmin). Filled symbols show averages ± SE (n = 3-5). Stars show that the last value in the time series is significantly different from the first value, i.e. that a significant change in a given parameter has occurred during the time series; *, p<0.05; **, p<0.01; ***, p<0.001. Dashed lines show linear trends (in the case of λd (D) and gsmax,d (F), the first time point was omitted in the linear correlation analysis).
4 Discussion
Dynamic gas exchange has been shown to be an important trait to improve crop yield (Adachi et al., 2019). Our results highlight the largely different strategies deployed by tropical species to dynamically balance the trade-off between carbon fixation and stomatal control of transpiration under light intensity fluctuations. These differences were particularly striking in the C3 crop fig and the C4 crop sugarcane, where our results revealed very different and complex diurnal patterns of WUEi under a succession of sunflecks.
4.1 Dynamic and steady-state photosynthesis and stomatal conductance tend to decline throughout the day
In most species that we surveyed, steady-state A and ɡs (when repeatedly measured under stable environmental conditions) declined throughout the photoperiod (Figures 1–3). We observed a strong coupling between A and ɡs in most species (Figure S4); however, on the basis of our data we cannot conclude whether a reduction in gs caused a reduction in A, or vice versa. Similarly, in the seven species that did show a transient increase in A during a 5 min exposure to high irradiance, there tended to be a reduction of A reached during afternoon measurements (Figure 1). Steady-state A and ɡs (or transpiration rate) have been found to decline throughout the day under constant environmental conditions in e.g. Arabidopsis (Arabidopsis thaliana; Matthews et al., 2018), lisianthus (Eustoma grandiflorum; Lanoue et al., 2017), tomato (Solanum lycopersicum; Lanoue et al., 2017; Lanoue et al., 2018), broad bean (Vicia faba; Gorton et al., 1993), common bean (Phaseolus vulgaris, Mencuccini et al., 2000) and cotton (Gossypium hirsutum; Resco de Dios et al., 2017). Under fluctuating irradiance, A and gs have also been shown to decrease during the diurnal period in Arabidopsis thaliana, with a reduction of about 20% of the diurnal carbon gain (Vialet-Chabrand et al., 2017a).
During the later stages of a photoperiod, A (and ɡs) may decrease due to at least two kinds of inhibition: photoinhibition and feedback inhibition. Photoinhibition is incurred when a central pigment in the photosystem II core, D1, is destroyed by oxidative stress more quickly than it can be repaired (Long and Humphries, 1994). The risk of oxidative stress in photosynthetic light harvesting antennae increases with the level of irradiance, and photosynthetic organisms have evolved a number of photoprotective processes, which aim at avoiding oxidative stress through fast non-damaging relaxation of pigment exited states, interception of reactive oxygen species through antioxidants, and repair of damaged proteins (Bassi and Dall’osto, 2021). Nevertheless, the risk of photoinhibition increases at high irradiance, and can lead to reductions of A (Murchie and Niyogi, 2011). Feedback inhibition is incurred when metabolites (e.g. sucrose, starch and amino acids) produced in the leaf induce a feedback regulation of photosynthesis as a two-way process (Paul and Pellny, 2003; Henry et al., 2020). A progressive accumulation of sucrose in the leaf during the photoperiod is often observed and could be caused by a limited rate of export; sucrose concentration is sensed by trehalose-6-phosphate, which subsequently triggers a reduction in A, among others (Figueroa and Lunn, 2016; Paul et al., 2018). We hypothesized that a dark period of several hours in the middle of the diurnal period would lead to a reduction in metabolite concentration and a repair of potentially damaged photosystem II. Under this assumption, if one of these processes was involved in the diurnal regulation of photosynthesis, its speed of response and magnitude of change should have shown a similar response at the beginning and end of the diurnal period. Our results suggest that these processes are not likely to be involved in the diurnal regulation of photosynthesis, as the dark period did not alter the response (Figures 5; S7). However, we did not quantify carbohydrate accumulation nor the degree of photoinhibition throughout the photoperiod, and more direct experimental evidence is thus needed to make a more definitive statement.
Two other possibilities for the observed reductions in A and ɡs may be: regulation by the circadian clock, and changes in environmental conditions in the experimental greenhouse. Large diurnal changes in A and ɡs under perfectly constant environmental conditions are known to occur (Sayre, 1926; Mansfield and Heath, 1964; Gorton et al., 1989; Resco de Dios, 2017; Matthews et al., 2018) and these can be caused by the circadian clock. To our knowledge, a separation of the effects of feedback inhibition and the circadian clock on diurnal changes in A and ɡs has not been attempted. Further, the climate in the greenhouse where the measurements were conducted was not stable diurnally, but changed as a function of incoming solar irradiation: both air temperature and VPD showed peaks around mid-day on several days of measurement (Figure S2), likely changing whole-plant water potential. This may have had systemic effects on measurement leaves, progressively reducing ɡs throughout the day and feeding back on A (Devireddy et al., 2020; Ehonen et al., 2020).
As for diurnal changes in the properties of dynamic A, our results suggest that in many species, the speed of photosynthetic induction decreased as the day progressed (Figures 1, 3, 5), though the cause was not clearly identified. A possible explanation could be that the lower observed ɡs in the afternoon caused larger diffusional limitations, limiting the rate of A increase. The decrease in speed and magnitude of response in ɡs during the diurnal period is likely under control of the circadian clock (Gorton et al., 1993; Vialet-Chabrand et al., 2021), as well as starch metabolism (Westgeest et al., 2023). The decrease in photosynthesis induction during the diurnal period was species-specific, but present in both C3 and C4 plants (Figure 1). These results are in agreement with previous findings (Poorter and Oberbauer, 1993; Allen and Pearcy, 2000a; Allen and Pearcy, 2000b; Matthews et al., 2018). One potential cause for diurnal changes in photosynthetic induction could be diurnal changes in the ratio of Rubisco to Rubisco activase (the latter of which is required for fast photosynthetic induction (Mott and Woodrow, 2000)): in wheat leaves, it was recently found that while the concentration of Rubisco activase oscillated throughout the photoperiod due to changes in gene expression, the concentration of Rubisco was stable (Perdomo et al., 2021). It could be hypothesized that a diurnal change in the ratio of Rubisco to its chaperone would lead to changes in the rate of photosynthetic induction.
4.2 Kinetics of stomatal movement under fluctuating irradiance differ widely between fig and sugarcane
Stomata of sugarcane responded much more quickly, and also with much smaller diurnal variation in time constants, to irradiance fluctuations than those of fig (Figures 6, 7). The difference in speed of response between sugarcane and fig could be in part explained by the difference in stomatal anatomy, with subsidiary cells in sugarcane stomata (dumbbell shape; (Wang and Chen, 2020) providing a mechanical advantage (Franks and Farquhar, 2007) and more rapid responses compared to stomata in fig (kidney shape; Mamoucha et al., 2016). Our results are well in agreement with those of McAusland et al. (2016) and Ozeki et al. (2022). In McAusland et al. (2016), the three C4 species maize, sorghum and miscanthus (Zea mays, Sorghum bicolor and Miscanthus nepalensis, respectively) showed much smaller time constants of stomatal opening and closure than 12 other C3 species, after single step changes in irradiance. Ozeki et al. (2022) showed that whole-plant ɡs in several C4 species belonging to the Poaceae family (sorghum, maize, Eleusine coracana, Panicum miliaceum, and Zea nicaraguensis) responded much more quickly, and with a smaller diurnal variation in time constants, to a series of 15 min and 30 min lightflecks, than did several C3 species (Triticum aestivum, Avena sativa, Hordeum vulgare, and Lolium multiflorum). Adding up these results, we can conclude that the kinetics of ɡs in C4 leaves i) are often faster than in C3 leaves, unlike the kinetics of A (see next paragraph), and these faster ɡs kinetics are likely caused by the presence of dumbbell-shaped guard cells that are paired with subsidiary cells, and ii) show a different pattern of diurnal variation for A and ɡs, unlike those of C3. The combination of low ɡs and fast stomatal movement under irradiance fluctuations results in much higher dynamic WUEi in C4 than C3 crops (Figures 3, 6; Ozeki et al., 2022). Improving on the speed of stomatal movement through breeding or genetic manipulation is arguably a worthwhile target (Lawson and Blatt, 2014), given agricultural freshwater use and (projected future) freshwater scarcity.
4.3 Does C4 photosynthesis react faster to fluctuating irradiance than C3 photosynthesis?
While research on dynamic A had until recently largely been focused on C3 species, several recent studies compared dynamic A in a large number of C3 and C4 species (McAusland et al., 2016; Li et al., 2021; Lee et al., 2022; Ozeki et al., 2022; Arce Cubas et al., 2023). The question whether C4 photosynthesis uses irradiance fluctuations with higher efficiency than C3 photosynthesis has been discussed repeatedly (Stitt and Zhu, 2014; Slattery et al., 2018), but without a definitive conclusion. Our results did not show a significant difference in photosynthesis induction time between fig and sugarcane, suggesting that such a trait is species-specific and does not only depend on the photosynthesis pathway. Comparing the results from recent experimental papers, no clear difference between C3 and C4 species can be identified: whereas Lee et al. (2022) found that C4 species used a series of short lightflecks (4 min high irradiance, 2 min low irradiance) more efficiently than C3 species, Li et al. (2021) found the opposite to be true when exposing leaves to repeated cycles of high and low irradiance (each cycle lasting 2 min). Furthermore, Arce Cubas et al. (2023) found A in dark-adapted C4 leaves to respond more slowly to a sudden step change to either 600 or 1500 μmol m-2 s-1. Finally, data from McAusland et al. (2016) and Ozeki et al. (2022) show no obvious differences in time constants of A after an increase in irradiance, similar to our own results (Figure 4). These results suggest that there is no consistent difference in dynamic A between C3 and C4 plants. However, we note that i) all studies cited here use different measuring protocols of dynamic A (as is often the case), and ii) the hypothesis that the extent to which C4 leaves can utilize irradiance fluctuations depends on the frequency of these fluctuations (Slattery et al., 2018) still remains to be tested.
4.4 Conclusions
It is now well accepted that photosynthesis often operates under dynamically changing irradiance. However, how strongly the response of photosynthesis to irradiance fluctuations is affected by the time of day, and how this differs between species, is understudied. Hence, very little is known about the diurnal behavior of dynamic photosynthesis and stomatal conductance in plants, including various tropical plant species. Our study adds significant knowledge, in that we found that i) steady-state and dynamic photosynthesis traits tended to decline throughout the day in seven out of ten species (Figures 1, 2), ii) compared to measurements in the morning and noon, in the afternoon the rate of photosynthetic induction was reduced in fig, whereas in sugarcane the steady-state photosynthesis rate was reduced (Figures 3, 4), surprisingly, neither of these reductions could be reversed by intermittent dark adaptation during the day (Figure 5), and iii) stomata in fig opened and closed slowly, and their opening became progressively slower under a series of lightflecks, whereas sugarcane consistently showed much faster opening than closure (Figures 6, 7). Overall, the diurnal gas exchange regulation is species-specific and largely impacts diurnal water use efficiency.
Data availability statement
The original contributions presented in the study are included in the article/Supplementary Material. Further inquiries can be directed to the corresponding author.
Author contributions
WS: Data curation, Formal Analysis, Methodology, Writing – original draft, Writing – review & editing. SV-C: Methodology, Supervision, Writing – review & editing. EK: Conceptualization, Methodology, Supervision, Writing – original draft, Writing – review & editing.
Funding
The author(s) declare financial support was received for the research, authorship, and/or publication of this article. This project was funding by the Royal Thai Government Scholarship Program offered by OCSC to WS.
Acknowledgments
The authors further thank Sarah Berman for expert help with measuring equipment, and Bertus van der Laan and Ad Hermsen (WUR Unifarm) for help with plant maintenance and growth information.
Conflict of interest
The authors declare that the research was conducted in the absence of any commercial or financial relationships that could be construed as a potential conflict of interest.
The author(s) declared that they were an editorial board member of Frontiers, at the time of submission. This had no impact on the peer review process and the final decision.
Publisher’s note
All claims expressed in this article are solely those of the authors and do not necessarily represent those of their affiliated organizations, or those of the publisher, the editors and the reviewers. Any product that may be evaluated in this article, or claim that may be made by its manufacturer, is not guaranteed or endorsed by the publisher.
Supplementary material
The Supplementary Material for this article can be found online at: https://www.frontiersin.org/articles/10.3389/fpls.2023.1273802/full#supplementary-material
References
Adachi, S., Tanaka, Y., Miyagi, A., Kashima, M., Tezuka, A., Toya, Y., et al. (2019). High-yielding rice Takanari has superior photosynthetic response to a commercial rice Koshihikari under fluctuating light. J. Exp. Bot. 70, 5287–5297. doi: 10.1093/jxb/erz304
Allen, M. T., Pearcy, R. W. (2000a). Stomatal behaviour and photosynthetic performance under dynamic light regimes in a seasonally dry tropical rain forest. Oecologia 122, 470–478. doi: 10.1007/s004420050968
Allen, M. T., Pearcy, R. W. (2000b). Stomatal versus biochemical limitations to dynamic photosynthetic performance in four tropical rainforest shrub species. Oecologia 122, 479–486. doi: 10.1007/s004420050969
Arce Cubas, L., Vath, R. L., Bernardo, E. L., Sales, C. R. G., Burnett, A. C., Kromdijk, J. (2023). Activation of CO2 assimilation during photosynthetic induction is slower in C4 than in C3 photosynthesis in three phylogenetically controlled experiments. Front. Plant Sci. 13. doi: 10.3389/fpls.2022.1091115
Bassi, R., Dall’osto, L. (2021). Dissipation of light energy absorbed in excess: the molecular mechanisms. Annu. Rev. Plant Biol. 72, 47–76. doi: 10.1146/annurev-arplant-071720
Bruhn, D., Newman, F., Hancock, M., Povlsen, P., Slot, M., Sitch, S., et al. (2022). Nocturnal plant respiration is under strong non-temperature control. Nat. Commun. 13, 1–10. doi: 10.1038/s41467-022-33370-1
Chazdon, R. L., Pearcy, R. W. (1986). Photosynthetic responses to light variation in rainforest species. Oecologia 69, 517–523. doi: 10.1007/bf00410357
Devireddy, A. R., Arbogast, J., Mittler, R. (2020). Coordinated and rapid whole-plant systemic stomatal responses. New Phytol. 225, 21–25. doi: 10.1111/nph.16143
Durand, M., Matule, B., Burgess, A. J., Robson, T. M. (2021). Sunfleck properties from time series of fluctuating light. Agric. For Meteorol. 308–309, 1–12. doi: 10.1016/j.agrformet.2021.108554
Ehonen, S., Hölttä, T., Kangasjärvi, J. (2020). Systemic signaling in the regulation of stomatal conductance. Plant Physiol. 182, 1829–1832. doi: 10.1104/PP.19.01543
Ernstsen, J., Woodrow, I. E., Mott, K. A. (1997). Responses of Rubisco activation and deactivation rates to variations in growth-light conditions (Dordrecht (NL): Kluwer Academic Publishers).
Figueroa, C. M., Lunn, J. E. (2016). A tale of two sugars: Trehalose 6-phosphate and sucrose. Plant Physiol. 172, 7–27. doi: 10.1104/pp.16.00417
Franks, P. J., Farquhar, G. D. (2007). The mechanical diversity of stomata and its significance in gas-exchange control. Plant Physiol. 143, 78–87. doi: 10.1104/pp.106.089367
Gorton, H. L., Williams, W. E., Assmann, S. M. (1993). Circadian rhythms in stomatal responsiveness to red and blue light. Plant Physiol. 103, 399–406. doi: 10.1104/pp.103.2.399
Gorton, H. L., Williams, W. E., Binns, M. E., Gemmell, C. N., Leheny, E. A., Shepherd, A. C. (1989). Circadian stomatal rhythms in epidermal peels from vicia faba. Plant Physiol. 90, 1329–1334. doi: 10.1104/pp.90.4.1329
Henry, C., Watson-Lazowski, A., Oszvald, M., Griffiths, C., Paul, M. J., Furbank, R. T., et al. (2020). Sugar sensing responses to low and high light in leaves of the C4 model grass Setaria viridis. J. Exp. Bot. 71, 1039–1052. doi: 10.1093/jxb/erz495
Kaiser, E., Galvis, V. C., Armbruster, U. (2019). Efficient photosynthesis in dynamic light environments: A chloroplast’s perspective. Biochem. J. 476, 2725–2741. doi: 10.1042/BCJ20190134
Kaiser, E., Morales, A., Harbinson, J. (2018). Fluctuating light takes crop photosynthesis on a rollercoaster ride. Plant Physiol. 176, 977–989. doi: 10.1104/pp.17.01250
Kaiser, E., Zhou, D., Heuvelink, E., Harbinson, J., Morales, A., Marcelis, L. F. M. (2017). Elevated CO2 increases photosynthesis in fluctuating irradiance regardless of photosynthetic induction state. J. Exp. Bot. 68, 5629–5640. doi: 10.1093/jxb/erx357
Kromdijk, J., Glowacka, K., Leonelli, L., Gabilly, S. T., Iwai, M., Niyogi, K. K., et al. (2016). Improving photosynthesis and crop productivity by accelerating recovery from photoprotection. Sci. (1979) 354, 857–861. doi: 10.1126/science.aai8878
Lanoue, J., Leonardos, E. D., Grodzinski, B. (2018). Effects of light quality and intensity on diurnal patterns and rates of photo-assimilate translocation and transpiration in tomato leaves. Front. Plant Sci. 9. doi: 10.3389/fpls.2018.00756
Lanoue, J., Leonardos, E. D., Ma, X., Grodzinski, B. (2017). The effect of spectral quality on daily patterns of gas exchange, biomass gain, and water-use-efficiency in tomatoes and lisianthus: An assessment of whole plant measurements. Front. Plant Sci. 8. doi: 10.3389/fpls.2017.01076
Lawson, T., Blatt, M. R. (2014). Stomatal size, speed, and responsiveness impact on photosynthesis and water use efficiency. Plant Physiol. 164, 1556–1570. doi: 10.1104/pp.114.237107
Lawson, T., Vialet-Chabrand, S. (2019). Speedy stomata, photosynthesis and plant water use efficiency. New Phytol. 221, 93–98. doi: 10.1111/nph.15330
Lee, M. S., Boyd, R. A., Ort, D. R. (2022). The photosynthetic response of C3 and C4 bioenergy grass species to fluctuating light. GCB Bioenergy 14, 37–53. doi: 10.1111/gcbb.12899
Li, Y. T., Luo, J., Liu, P., Zhang, Z. S. (2021). C4 species utilize fluctuating light less efficiently than C3 species. Plant Physiol. 187, 1288–1291. doi: 10.1093/plphys/kiab411
Long, S. P., Humphries, S. (1994). Photoinhibition of photosynthesis in nature. Annu. Rev. Plant Physiol. Plant Mol. Biol. 45, 633–662. doi: 10.1146/annurev.pp.45.060194.003221
Long, S. P., Taylor, S. H., Burgess, S. J., Carmo-Silva, E., Lawson, T., De Souza, A. P., et al. (2022). Into the shadows and back into sunlight: photosynthesis in fluctuating light. Annu. Rev. Plant Biol. 73, 617–648. doi: 10.1146/annurev-arplant-070221-024745
Mamoucha, S., Fokialakis, N., Christodoulakis, N. S. (2016). Leaf structure and histochemistry of Ficus carica (Moraceae), the fig tree. Flora: Morphol. Distribution Funct. Ecol. Plants 218, 24–34. doi: 10.1016/j.flora.2015.11.003
Mansfield, T. A., Heath, O. V. S. (1964). Studies in Stomatal Behaviour: X. An investigation of responses to low-intensity illumination and temperature in Xanthium pennsylvanicum. J. Exp. Bot. 15, 114–124. doi: 10.1093/jxb/15.1.114
Matthews, J. S. A., Vialet-Chabrand, S. R. M., Lawson, T. (2017). Diurnal variation in gas exchange: the balance between carbon fixation and water loss. Plant Physiol. 174, 614–623. doi: 10.1104/pp.17.00152
Matthews, J. S. A., Vialet-Chabrand, S., Lawson, T. (2018). Acclimation to fluctuating light impacts the rapidity of response and diurnal rhythm of stomatal conductance. Plant Physiol. 176, 1939–1951. doi: 10.1104/pp.17.01809
McAusland, L., Vialet-Chabrand, S., Davey, P., Baker, N. R., Brendel, O., Lawson, T. (2016). Effects of kinetics of light-induced stomatal responses on photosynthesis and water-use efficiency. New Phytol. 211, 1209–1220. doi: 10.1111/nph.14000
Mencuccini, M., Mambelli, S., Comstock, J. (2000). Stomatal responsiveness to leaf water status in common bean (Phaseolus vulgaris L.) is a function of time of day. Plant Cell Environ. 23, 1109–1118. doi: 10.1046/j.1365-3040.2000.00617.x
Mohotti, A. J., Lawlor, D. W. (2002). Diurnal variation of photosynthesis and photoinhibition in tea: effects of irradiance and nitrogen supply during growth in the field. J. Exp. Bot. 53, 313–322. doi: 10.1093/jexbot/53.367.313
Mott, K. A., Woodrow, I. E. (2000). Modelling the role of Rubisco activase in limiting non-steady-state photosynthesis. J. Exp. Bot. 51, 399–406. doi: 10.1093/jexbot/51.suppl_1.399
Murchie, E. H., Niyogi, K. K. (2011). Manipulation of photoprotection to improve plant photosynthesis. Plant Physiol. 155, 86–92. doi: 10.1104/pp.110.168831
Ozeki, K., Miyazawa, Y., Sugiura, D. (2022). Rapid stomatal closure contributes to higher water use efficiency in major C4 compared to C3 Poaceae crops. Plant Physiol. 189, 188–203. doi: 10.1093/plphys/kiac040
Parkhurst, D. F. (1994). Diffusion of CO2 and other gases inside leaves. New Phytol. 126, 449–479. doi: 10.1111/j.1469-8137.1994.tb04244.x
Paul, M. J., Gonzalez-Uriarte, A., Griffiths, C. A., Hassani-Pak, K. (2018). The role of trehalose 6-phosphate in crop yield and resilience. Plant Physiol. 177, 12–23. doi: 10.1104/PP.17.01634
Paul, M. J., Pellny, T. K. (2003). Carbon metabolite feedback regulation of leaf photosynthesis and development. J. Exp. Bot. 54, 539–547. doi: 10.1093/jxb/erg052
Pearcy, R. W. (1988). Photosynthetic utilisation of lightflecks by understory plants. Aust. J. Plant Physiol. 15, 223–238. doi: 10.1071/PP9880223
Pearcy, R. W., Krall, J. P., Sassenrath-Cole, G. F. (1996). “Photosynthesis in fluctuating light environments,” in Photosynthesis and the Environment. Ed. Baker, N. R. (Dordrecht, the Netherlands: Kluwer Academic), 321–346. doi: 10.1007/0-306-48135-9_13
Perdomo, J. A., Buchner, P., Carmo-Silva, E. (2021). The relative abundance of wheat Rubisco activase isoforms is post-transcriptionally regulated. Photosynth. Res. 148, 47–56. doi: 10.1007/s11120-021-00830-6
Poorter, L., Oberbauer, S. F. (1993). Photosynthetic induction responses of two rainforest tree species in relation to light environment. Oecologia. 96, 193–199. doi: 10.1007/BF00317732
Resco de Dios, V. (2017). Circadian regulation and diurnal variation in gas exchange. Plant Physiol. 175, 3–4. doi: 10.1104/pp.17.00984
Resco de Dios, V., Gessler, A. (2018). Circadian regulation of photosynthesis and transpiration from genes to ecosystems. Environ. Exp. Bot. 152, 37–48. doi: 10.1016/j.envexpbot.2017.09.010
Resco de Dios, V., Gessler, A., Ferrio, J. P., Alday, J., Bahn, M., del Castillo, J., et al. (2017). Circadian rhythms regulate the environmental responses of net CO2 exchange in bean and cotton canopies. Agric. For Meteorol. 239, 185–191. doi: 10.1016/j.agrformet.2017.03.014
R Core Team. (2022). R: A language and environment for statistical computing. R Foundation for Statistical Computing, Vienna, Austria. Available at: https://www.R-project.org/.
Salter, W. T., Merchant, A. M., Richards, R. A., Trethowan, R., Buckley, T. N. (2019). Rate of photosynthetic induction in fluctuating light varies widely among genotypes of wheat. J. Exp. Bot. 70, 2787–2796. doi: 10.1093/jxb/erz100
Sayre, J. D. (1926). Physiology of stomata of Rumex patientia. Ohio J. Sci. 67, 233–266. doi: 10.1126/science.57.1468.205
Slattery, R. A., Walker, B. J., Weber, A. P. M., Ort, D. R. (2018). The impacts of fluctuating light on crop performance. Plant Physiol. 176, 990–1003. doi: 10.1104/pp.17.01234
Soleh, M. A., Tanaka, Y., Kim, S. Y., Huber, S. C., Sakoda, K., Shiraiwa, T. (2017). Identification of large variation in the photosynthetic induction response among 37 soybean [Glycine max (L.) Merr.] genotypes that is not correlated with steady-state photosynthetic capacity. Photosynth. Res. 131, 305–315. doi: 10.1007/s11120-016-0323-1
Stitt, M., Zhu, X. G. (2014). The large pools of metabolites involved in intercellular metabolite shuttles in C4 photosynthesis provide enormous flexibility and robustness in a fluctuating light environment. Plant Cell Environ. 37, 1985–1988. doi: 10.1111/pce.12290
Vialet-Chabrand, S., Matthews, J. S. A., Lawson, T. (2021). Light, power, action! Interaction of respiratory energy- and blue light-induced stomatal movements. New Phytol. 231, 2231–2246. doi: 10.1111/nph.17538
Vialet-Chabrand, S. R. M., Matthews, J. S. A., McAusland, L., Blatt, M. R., Griffiths, H., Lawson, T. (2017b). Temporal dynamics of stomatal behavior: Modeling and implications for photosynthesis and water use. Plant Physiol. 174, 603–613. doi: 10.1104/pp.17.00125
Vialet-Chabrand, S., Matthews, J. S. A., Simkin, A. J., Raines, C. A., Lawson, T. (2017a). Importance of fluctuations in light on plant photosynthetic acclimation. Plant Physiol. 173, 2163–2179. doi: 10.1104/pp.16.01767
Wang, Y., Chen, Z. H. (2020). Does molecular and structural evolution shape the speedy grass stomata? Front. Plant Sci. 11. doi: 10.3389/fpls.2020.00333
Westgeest, A. J., Dauzat, M., Simonneau, T., Pantin, F. (2023). Leaf starch metabolism sets the phase of stomatal rhythm. Plant Cell. 35, 3444–3469. doi: 10.1093/plcell/koad158
Yamori, W., Hikosaka, K., Way, D. A. (2014). Temperature response of photosynthesis in C3, C4, and CAM plants: Temperature acclimation and temperature adaptation. Photosynth. Res. 119, 101–117. doi: 10.1007/s11120-013-9874-6
Keywords: C3, C4, gas exchange, fluctuating light intensity, photosynthesis, stomatal conductance
Citation: Suwannarut W, Vialet-Chabrand S and Kaiser E (2023) Diurnal decline in photosynthesis and stomatal conductance in several tropical species. Front. Plant Sci. 14:1273802. doi: 10.3389/fpls.2023.1273802
Received: 07 August 2023; Accepted: 09 October 2023;
Published: 24 October 2023.
Edited by:
Shunsuke Adachi, Tokyo University of Agriculture and Technology, JapanReviewed by:
Daisuke Sugiura, Nagoya University, JapanRenata Retkute, University of Cambridge, United Kingdom
Copyright © 2023 Suwannarut, Vialet-Chabrand and Kaiser. This is an open-access article distributed under the terms of the Creative Commons Attribution License (CC BY). The use, distribution or reproduction in other forums is permitted, provided the original author(s) and the copyright owner(s) are credited and that the original publication in this journal is cited, in accordance with accepted academic practice. No use, distribution or reproduction is permitted which does not comply with these terms.
*Correspondence: Elias Kaiser, ZWxpYXMua2Fpc2VyQHd1ci5ubA==