
94% of researchers rate our articles as excellent or good
Learn more about the work of our research integrity team to safeguard the quality of each article we publish.
Find out more
ORIGINAL RESEARCH article
Front. Plant Sci., 08 January 2024
Sec. Plant Breeding
Volume 14 - 2023 | https://doi.org/10.3389/fpls.2023.1259736
This article is part of the Research TopicMarker-Assisted Selection (MAS) in Crop Plants, volume IIView all 23 articles
 Nairan Sun1,2,3†Jisuan Chen4†Yuqi Wang1,2,3
 Iqbal Hussain2,3Na Lei5Xinyan Ma2,3Weiqiang Li1,2,3Kaiwen Liu2,3Hongrui Yu2,3Kun Zhao2,3Tong Zhao2,3Yi Zhang2,3
 Xiaolin Yu1,2,3*
Introduction: Simple sequence repeats (SSR), also known as microsatellites, are crucial molecular markers in both animals and plants. Despite extensive previous research on SSRs, the development of microsatellite markers in Brassica crops remains limited and inefficient.
Methods: Krait software was used to identify microsatellites by genome-wide and marker development based on three recently sequenced basic species of Brassica crops in the triangle of U (Brassica rapa, B. nigra and B. oleracea), as well as three allotetraploids (B. juncea, B. napus and B. carinata) using public databases. Subsequently, the primers and the characteristics of microsatellites for most of them were accordingly designed on each chromosome of each of the six Brassica species, and their physical locations were identified,and the cross-transferability of primers have been carried out. In addition, a B-genome specific SSR marker was screened out.
Results: A total of 79341, 92089, 125443, 173964, 173604, and 222160 SSR loci have been identified from the whole genome sequences of Brassica crops within the triangle of U crops, B. rapa (AA), B. nigra (BB), B. oleracea (CC), B. napus (AACC), B. juncea (AABB) and B. carinata (BBCC), respectively. Comparing the number distribution of the three allotetraploid SSR loci in the three subgenomes AA, BB and CC, results indicate that the allotetraploid species have significant reduction in the number of SSR loci in the genome compared with their basic diploid counterparts. Moreover, we compared the basic species with their corresponding varieties, and found that the microsatellite characters between the allotetraploids and their corresponding basic species were very similar or almost identical. Subsequently, each of the 40 SSR primers was employed to investigate the polymorphism potential of B. rapa (85.27%), B. nigra (81.33%) and B. oleracea (73.45%), and B. rapa was found to have a higher cross-transfer rate among the basic species in the triangle of U. Meanwhile, a B-genome specific SSR marker, BniSSR23228 possessing the (AAGGA)3 sequence characteristics was obtained, and it located in chromosome B3 with a total length of 97 bp.
Discussion: In this study, results suggest that the pattern of distribution may be highly conserved during the differentiation of basic Brassica species and their allotetraploid counterparts. Our data indicated that the allotetraploidization process resulted in a significant reduction in SSR loci in the three subgenomes AA, BB and CC. The reasons may be partial gene dominated chromosomal homologous recombination and rearrangement during the evolution of basic diploid species into allotetraploids. This study provides a basis for future genomics and genetic research on the relatedness of Brassica species.
Brassica, as a diverse and important genus within the cruciferous family, includes many important vegetable and oilseed crops for human consumption or food production, such as Chinese cabbage, turnip, cabbage, cauliflower, broccoli, Brussels sprouts, kohlrabi, kale, collards, mustard, and rapeseed. These crops can be stored for a long time and provide sufficient food reserves in winter. Not only several Brassica species are economically important oil seeds, spices and vegetables, but also they are rich in essential nutrients such as vitamin C and glucosinolates, which has been associated with a reduced risk of many cancers (Kristal and Lampe, 2002). The genetic relationships between the top six Brassica species can be described by the triangle of U model (Nagaharu, 1935) (Figure 1). Therein, three ancestral diploid species B. rapa (A genome, n=10), B. nigra (B genome, n=8) and B. oleracea (C genome. n=9) have been cross-bred over time to produce three allotetraploids: B. juncea (AB genome, n=18), B. napus (AC genome, n=19) and B. carinata (BC genome, n=17). Some Brassica crops were also found to be capable in crossing with other important cruciferous crops such as wild radish (Raphanus) (Beckie et al., 2003; FitzJohn et al., 2007). This potential to hybridize with a wide range of inbreds and the diversity of non-domesticated forms of key crop species makes Brassica an integral part of global gene banks.
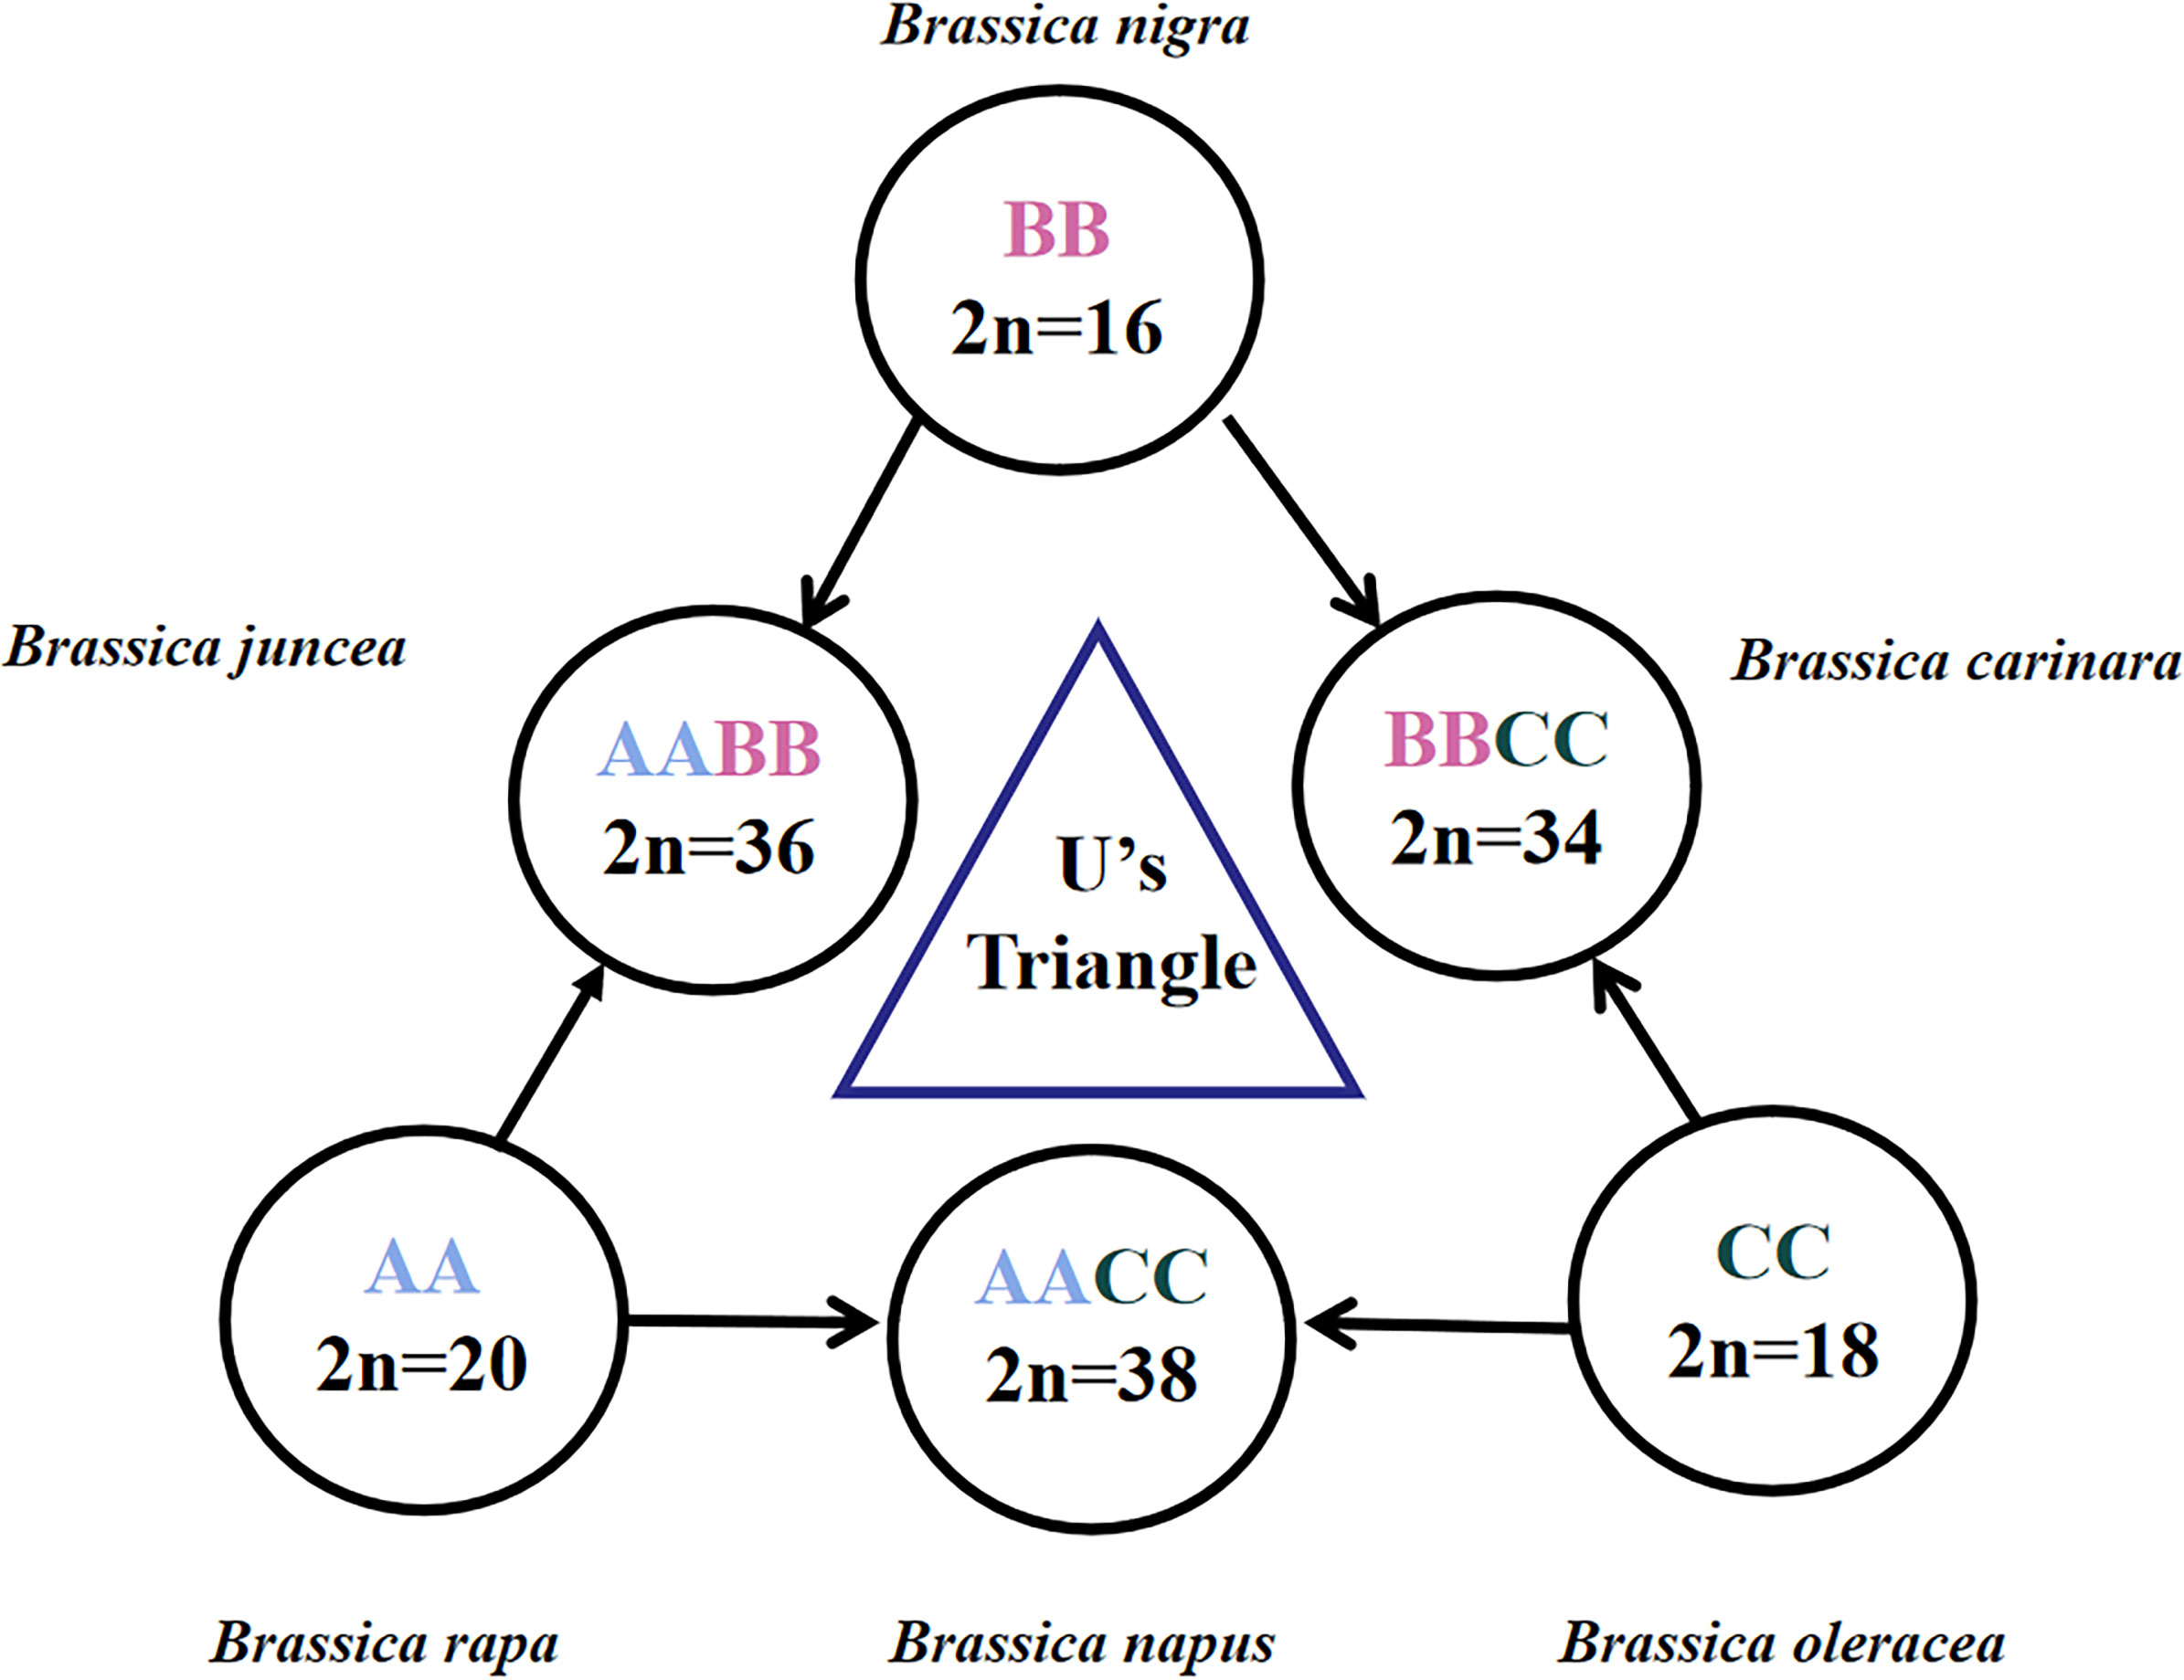
Figure 1 Brassica species in the triangle of U. The three diploid basic species are referred to by AA, BB and CC genomes, and the three allotetraploid species are referred to by AABB, AACC and BBCC. The diploid chromosome number (2n) is shown. The image is adapted from U (1935).
The detection of DNA sequence variation is a crucial step in studying the Brassica genome. Over the past two decades, various molecular markers have been used in genetic breeding studies of Brassica, such as restriction fragment length polymorphisms (RFLP), random amplified polymorphic DNA (RAPD), amplified fragment length polymorphisms (AFLP), simple sequence repeats (SSRs), sequence-related amplified polymorphisms (SRAP), sequence-characterized amplified regions (SCAR), and single nucleotide polymorphisms (SNP) (Ananga et al., 2006; Rahman et al., 2010; Zeng et al., 2010; Christensen et al., 2011; Panigrahi et al., 2011; Rezaeizad et al., 2011; Shirasawa et al., 2011). Among these molecular markers, SSRs or microsatellites are characterized by high polymorphism, reproducibility, ease of detection by polymerase chain reaction (PCR), co-dominance, adaptability, transferability, and genomic abundance. Thus, SSRs have been widely used in genetic diversity studies, quantitative trait loci and genetic mapping analysis, gene localization, germplasm classification and evolution and comparative genomics, and it is still one of the important molecular markers in genetic breeding research (Wang et al., 2014).
Traditional methods for developing SSRs involve the probe hybridization of genomic and cDNA libraries containing repetitive motifs, followed by DNA sequencing (Lowe et al., 2004), or the in silico analysis of publicly available bacterial artificial chromosome (BAC) sequences (Burgess et al., 2006; Xu et al., 2010), genomic survey sequences and whole-genome shotgun sequences (Cheng et al., 2009; Li et al., 2011). These procedures are time-consuming, costly and labor-intensive; however, with the expansion of DNA sequence information in public databases, the development of SSRs from publicly available DNA sequences has become a rapid and cost-effective alternative (McCouch et al., 2002; Song et al., 2005; Shoemaker et al., 2008). Currently, genome-wide SSR-based development is commonly used in crops such as cocoa, grapes, maize, kidney beans, and prunes (Cai et al., 2009; Cao et al., 2013; Qu and Liu, 2013). This approach has also proved useful in developing SSRs in expressed sequence tags in many agricultural crops, including rice, wheat, cotton, barley, groundnut, cowpea, and radish (Cardle et al., 2000; Kantety et al., 2002; La Rota et al., 2005; Park et al., 2005; Liang et al., 2009; Gupta and Gopalakrishna, 2010; Shirasawa et al., 2011).
With the rapid advancement of whole genome sequencing technology, the genome sequence of cabbage has been released and is available online (http://www.ocri-genomics.org/bolbase/index.html) (Liu et al., 2014). Genome sequences provide a powerful pool of information for genome-wide microsatellite characterization. At the same time, studies on the development of SSRs based on the whole genome of Brassica have been limited (Shi et al., 2014). Therefore, in this study, we analyzed the genome-wide SSR information distribution of six Brassica species, and located the physical position of SSRs on each chromosome to analyze the relatedness between these species. To evaluate the newly developed genome-wide SSR markers in representative self-crossed lines, we attached these SSR primers of these species as Supplementary Files and screened a number of specific SSR markers by PCR amplification. Moreover, a B-genome specific SSR marker, BniSSR23228, was screened out. These results provide great value in relevant research fields including introgression line tracking, genetic diversity analysis, marker-assisted breeding, and so on.
The genome sequences of three basic species [B. rapa (Brara_Chiifu_V3.5), B. nigra (Brana_ NI100_V2) and B. oleracea (Braol_JZS_V2.0)] and three allotetraploids [B. juncea (Braju_tum_V1.5), B. napus (Brana_Dar_V5) and B. carinata (http://brassicadb.bio2db.com/download.html)] of the genus Brassica were downloaded from the Brassica Info (http://www.Brassica.info/) website (Chen et al., 2010; Liu et al., 2014). The sequences obtained for B. rapa, B. nigra, B. oleracea, B. juncea, B. napus and B. carinata were 353140194 bp, 506000232bp, 561157886 bp, 937030072 bp, 850292103 bp, and 1086987601 bp in length, respectively.
The Krait identification tool was employed to search for the presence of SSR motifs in the genomic sequences (Du et al., 2018). The parameters were set as follows: the minimum number of repeat units was 12 single nucleotides, 7 dinucleotides, 5 trinucleotides, 4 tetranucleotides and pentanucleotides, and 4 hexanucleotides. The frequency and length of the searched SSRs were counted and analyzed.
The primer pairs on both sides of the SSR loci were designed using Krait software (Du et al., 2018). The main parameters were set as follows: the primer length was controlled between 18 and 27 bp, with an optimal size of 20 bp; the melting temperature was 58°C to 65°C, with an optimal temperature of 60°C; the GC content was in the range of 30% to 80%; and the predicted PCR product was in the range of 100-300 bp. All other parameters were set as default.
The plant materials used in the experiment were from B. rapa (AA), B. nigra (BB), B. oleracea (CC), B. juncea (AABB), B. napus (AACC), B. carinata (BBCC), Raphanus sativus (RR) and Arabidopsis thaliana (At) specimens. The total genomic DNA was extracted from young frozen leaf tissues using the SDS method. The genomic DNA concentrations (ng/µL) were adjusted to an experimentally specific 100 ng/µL using a NanoDrop 1000 spectrophotometer (Thermo Fisher Scientific, USA).
From the SSR primers designed based on the genomes of the six chosen species, 40 pairs of primers were randomly selected in each of the three diploid species, B. rapa, B. nigra and B. oleracea. To perform PCR amplification, a reaction mixture containing 1 µL (100 ng/µL) of template genomic DNA, 1µL (10 µmol/L) of each primer and 12.5 µL of 2×T5 Super PCR Mix (PAGE) buffer was added, followed by the addition of ddH2O to 25 µL total volume of the reaction mixture. The PCR assay amplification procedure included pre-denaturation at 94°C for 3 min, then 35 cycles involving denaturation at 94°C for 30 s, annealing at 53°C for 30 s, and extension at 72°C for 30 s, and finally, extension at 72°C for 7 min. The PCR reaction procedure was performed on a BIO-RAD S1000TM Thermal Cycler instrument, and samples were stored at 4°C. The SSR cross-transfer rate refers to the number of the amplified bands obtained from the other seven related species except for itself/total bands×100%.
The PCR product was detected by 12% PAGE following a method modified from “Molecular Cloning: A Laboratory Manual” (Sambrook et al., 2001).
The obtained SSR marker loci were analyzed and calculated using MG2C (http://mg2c.iask.in/mg2c_v2.1/) to locate the physical position of the SSR on each chromosome (Chao et al., 2021). A binary matrix of ‘1’ and ‘0’ was prepared for the SSR marker allele data for all genotypes. The polymorphic information content (PIC) values, gene diversity and heterozygosity were calculated using PowerMarker 3.0 software (Liu and Muse, 2005).
From the genomic sequences of B. rapa, B. nigra, B. oleracea, B. napus, B. juncea, and B. carinata with lengths of 340, 490, 541, 893, 824 and 1085.44 Mb, respectively, we identified 79341, 92089, 125443, 173964, 173604 and 222160 complete mono-nucleotide to hexanucleotide repeat sequence microsatellites with total frequencies of 226, 182, 223.6, 231.31, 235.12 and 204.42 loci per Mb, respectively (Tables 1, 2).
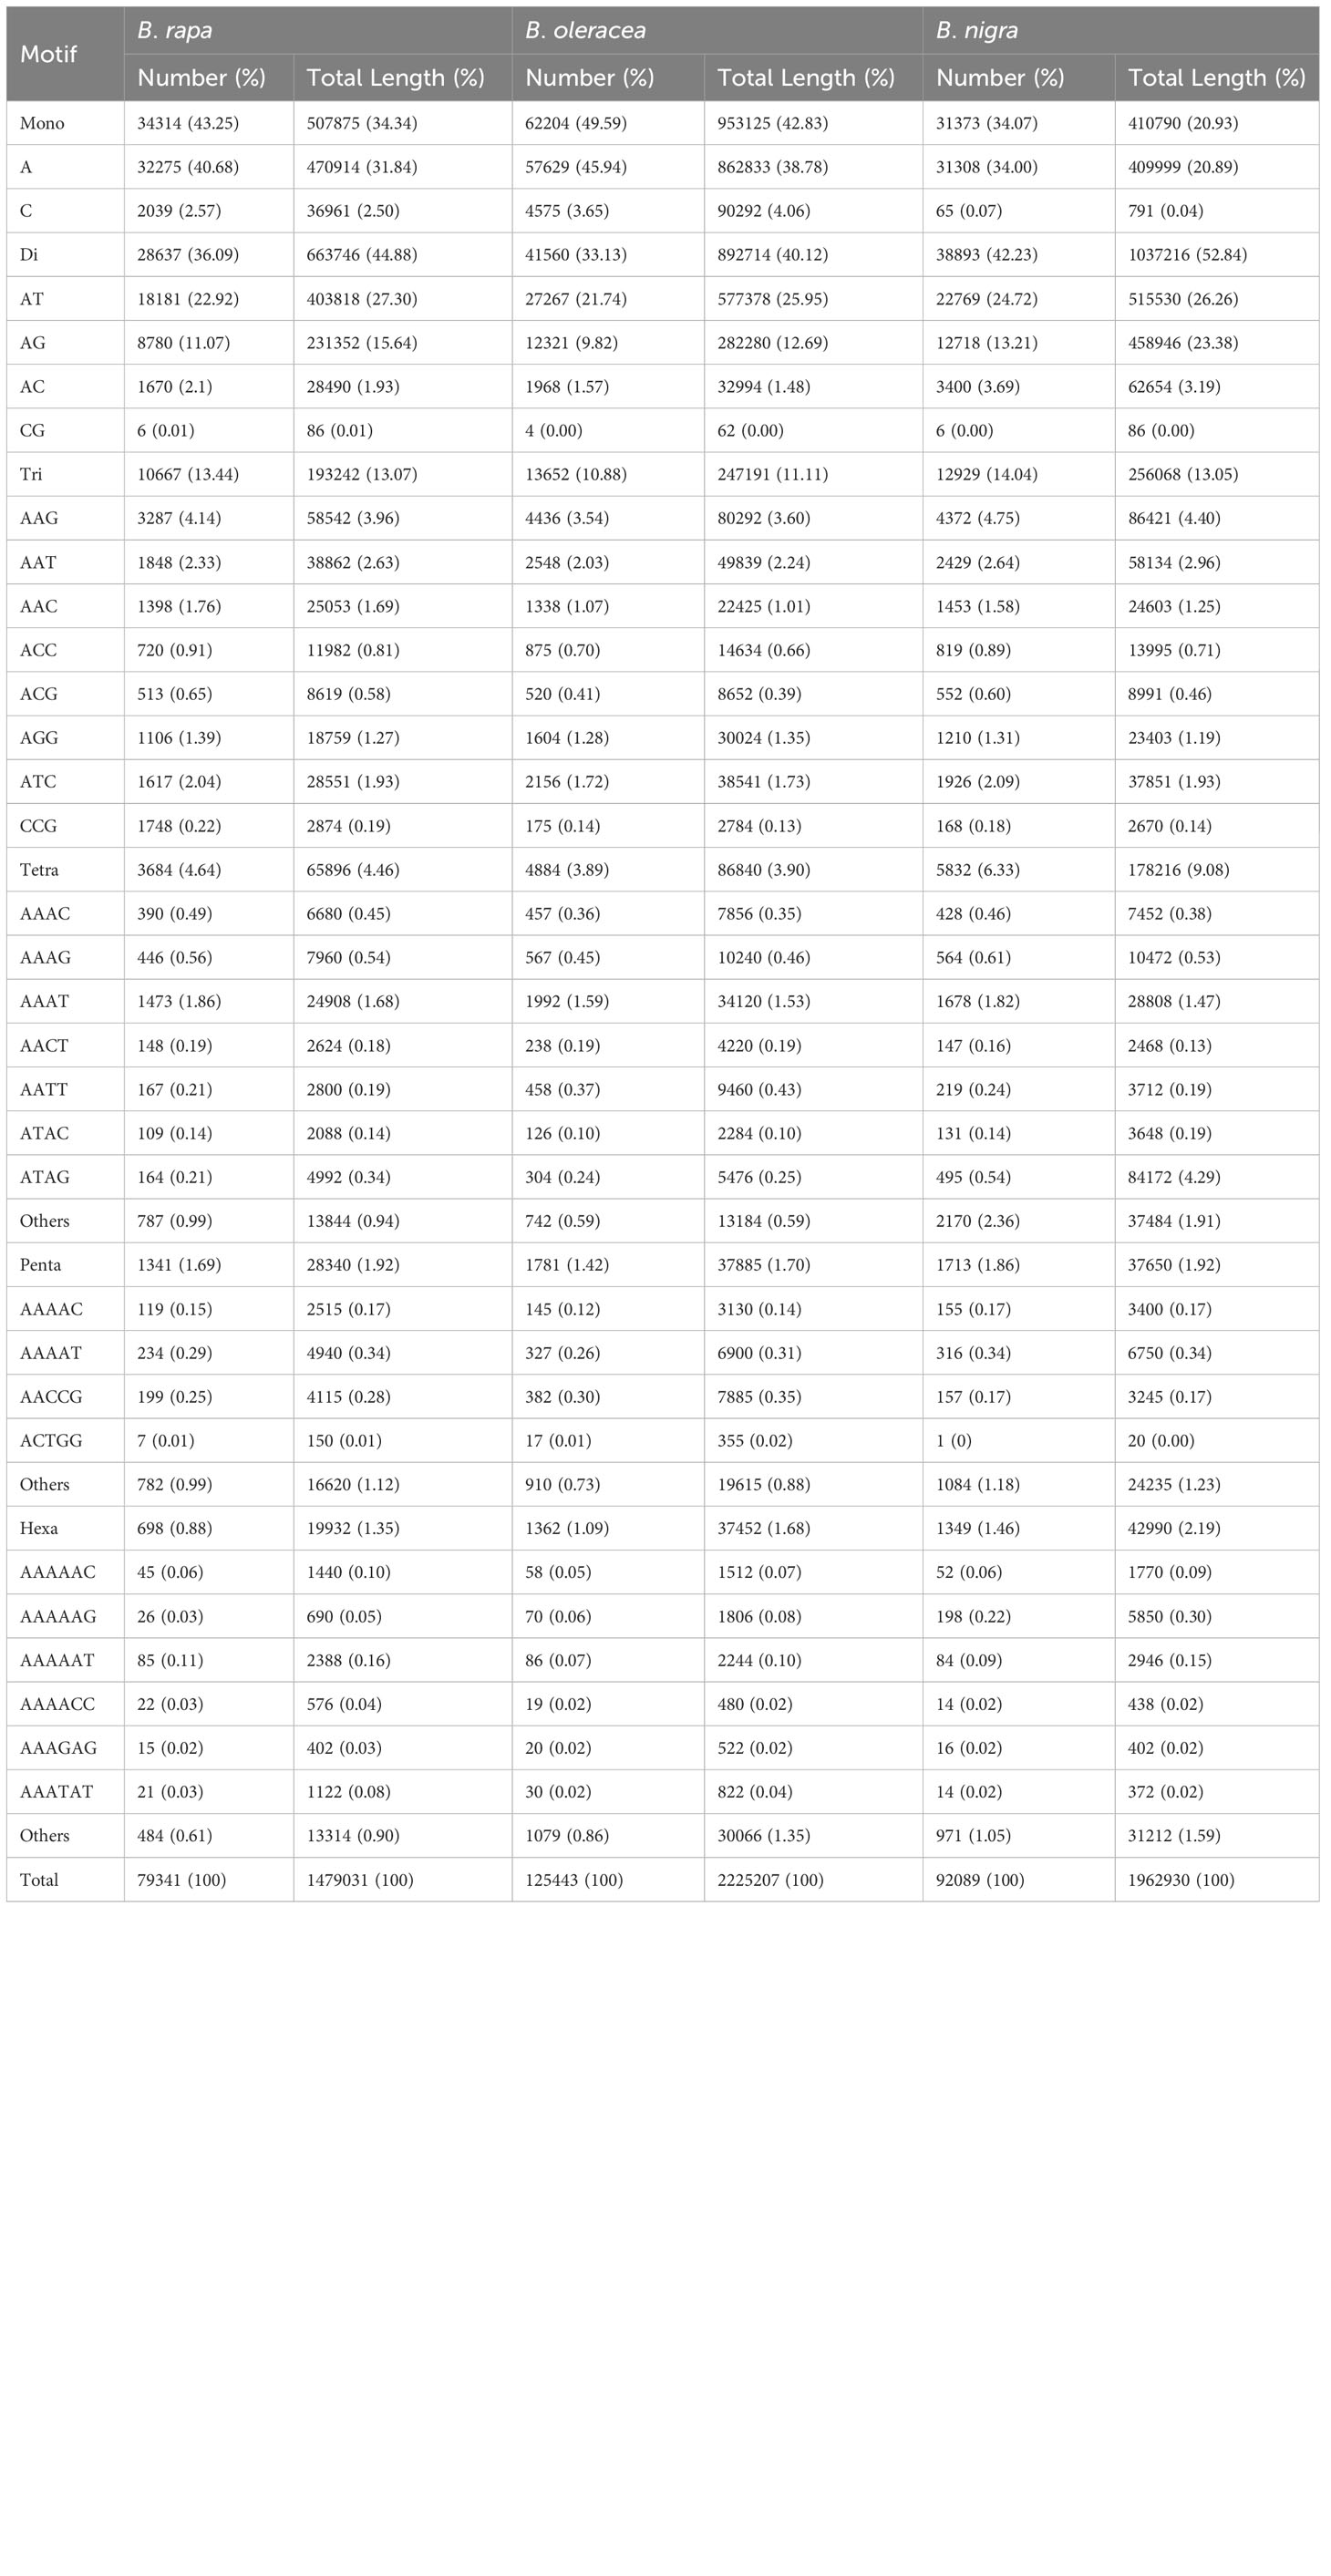
Table 1 Distribution of the main SSR types in the genomes of the three basic species.
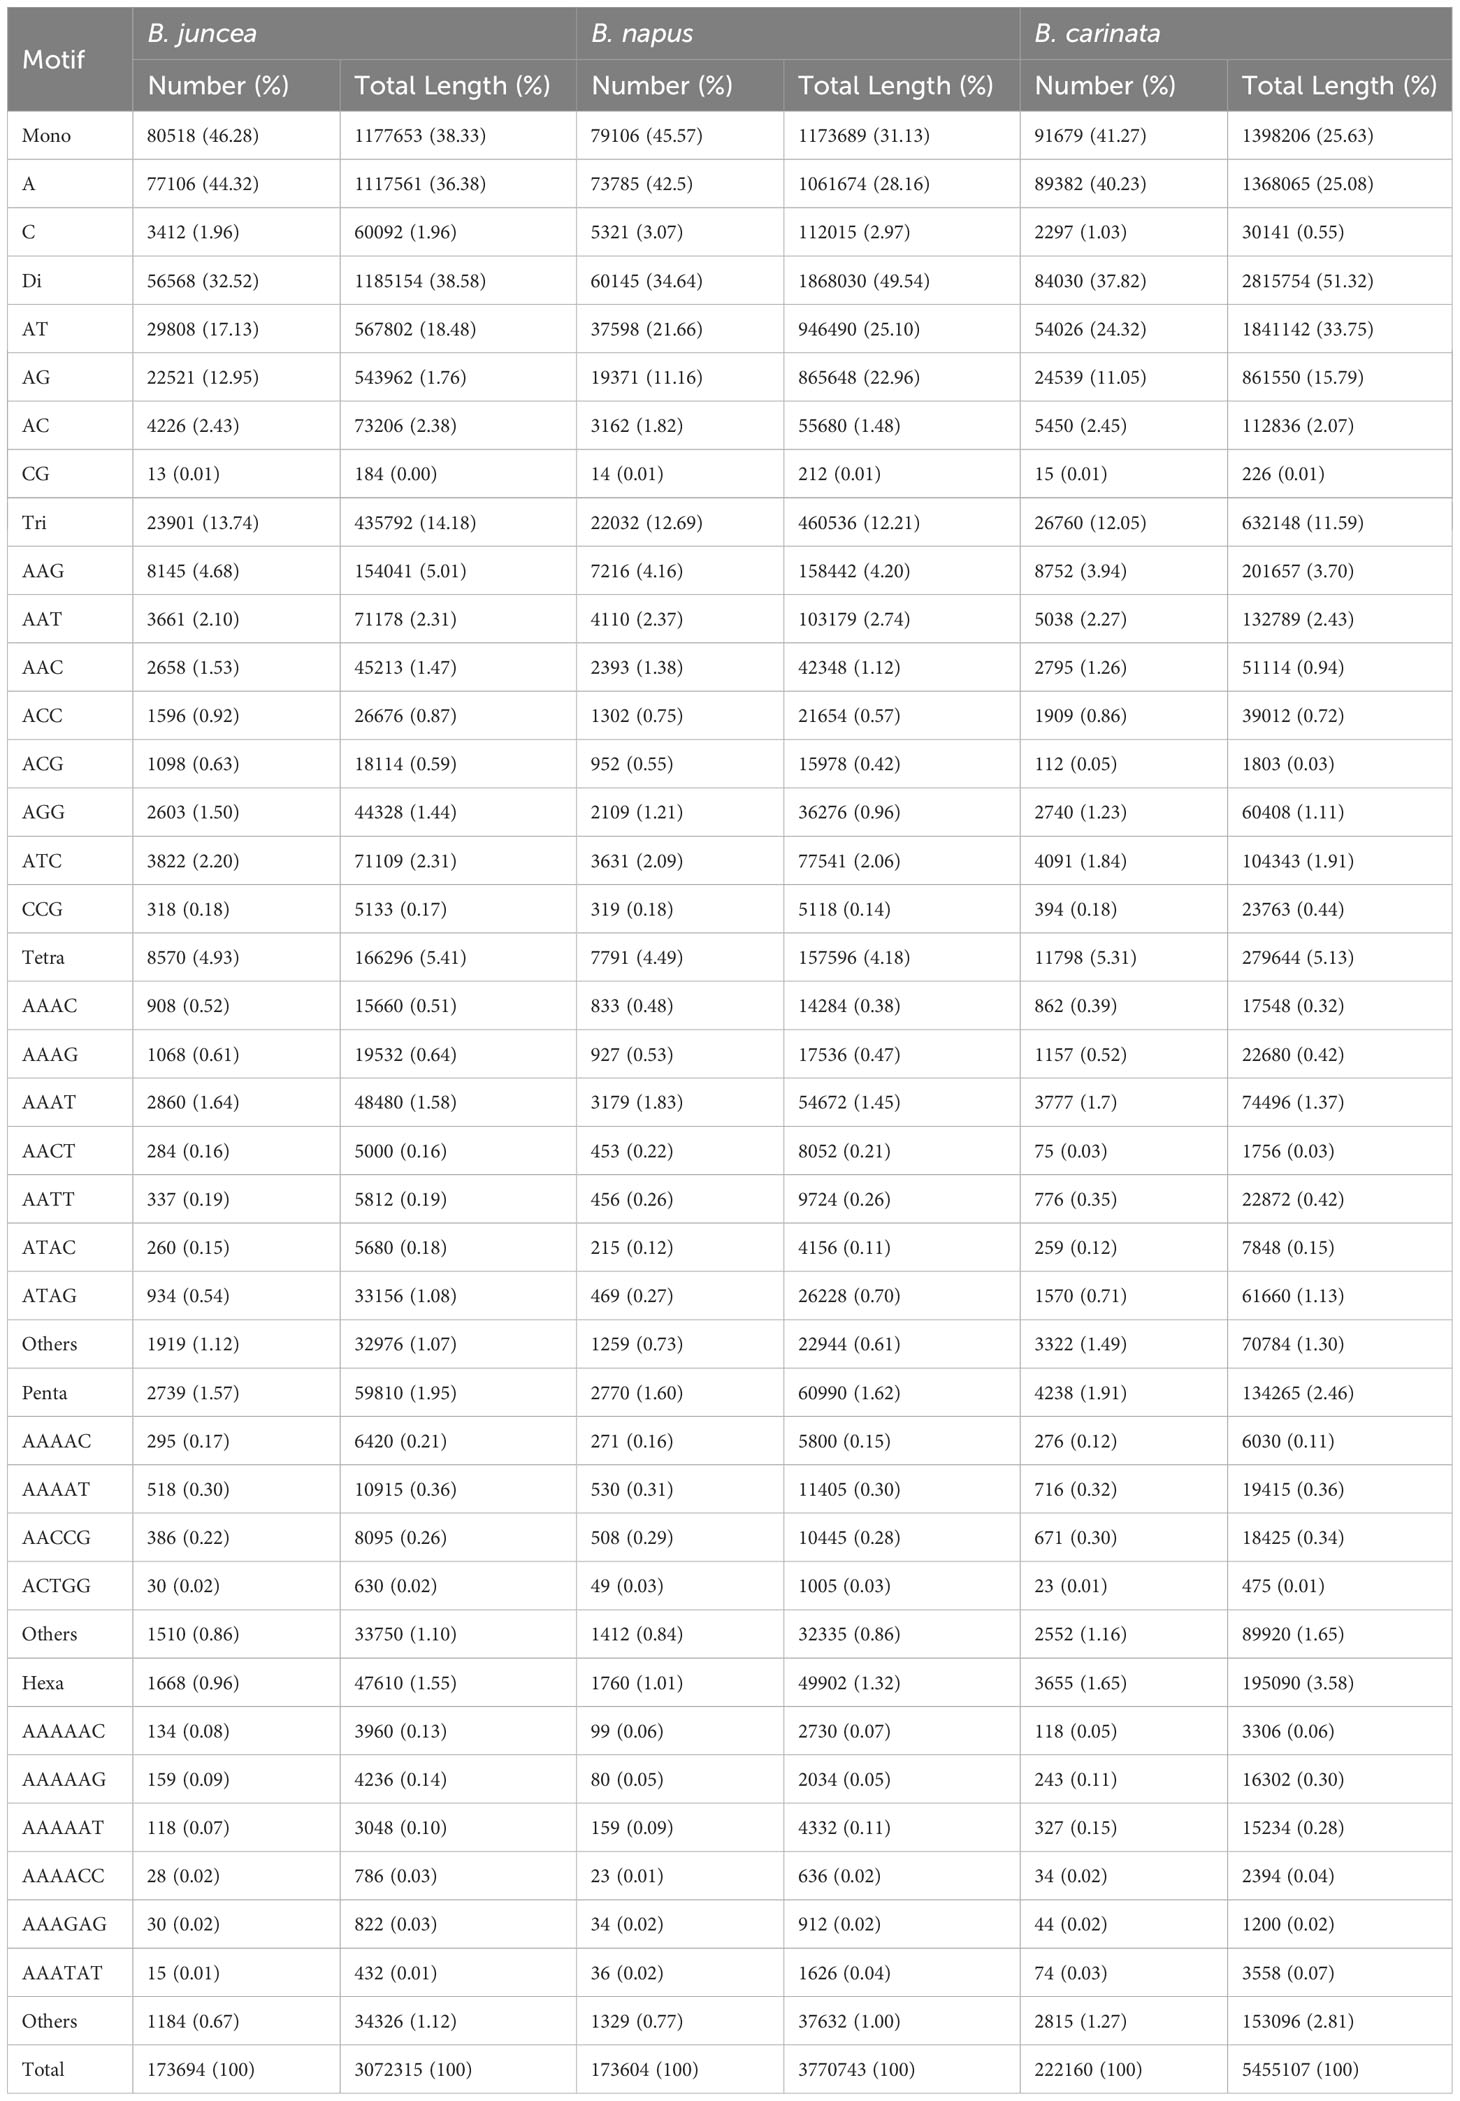
Table 2 Distribution of the main SSR types in the genomes of the three allotetraploids.
In the genomic SSRs of the six studied species, the distribution of microsatellite motif lengths was almost identical except in B. nigra (BB); mononucleotide, dinucleotide, trinucleotide and tetranucleotide repeats accounted for a very similar and relatively high proportion, while pentanucleotide and hexanucleotide repeats were relatively uncommon. The mononucleotide repeat motifs were the most abundant of the repeat types, with frequencies largely above 40%, and even close to 50% in B. oleracea (Figure 2A).
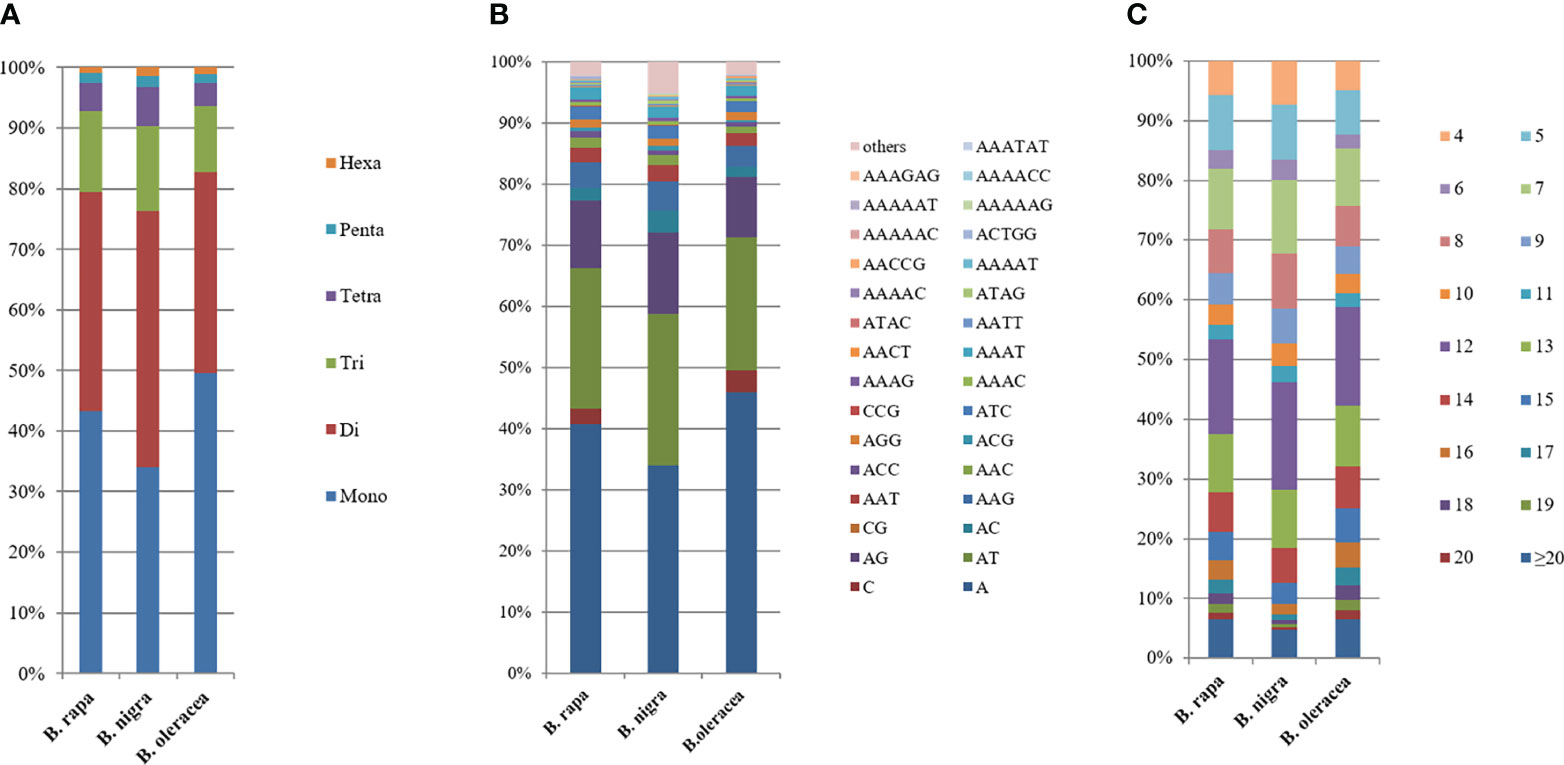
Figure 2 Distribution with respect to the motif length (A), type (B) and repeat number (C) of microsatellites in the whole genomes of B. rapa, B. nigra and B. oleracea. The vertical axis represents the abundance (%) of microsatellites of different motif lengths, types or number of repeats, which are distinguished by different colors. For (B), due to the limited number of items in Excel, the abundance of representative single to pentanucleotide motifs was selected, while the abundance of other motifs was shown in Supplementary Table 2.
The type distribution of microsatellite motifs was almost identical in the whole genome sequences of B. rapa, B. nigra, B. oleracea, B. napus, B. juncea, and B. carinata (Figure 2B). In other words, the mononucleotide to hexanucleotide motifs making up the major part of the genome sequences of the six Brassica species and those that are scarce were essentially the same. From Figure 2B, it is interesting to find that among the mononucleotide repeat sequences, A has the most repetitive motifs; among the dinucleotide repeat sequences, AT has the most repetitive motifs, followed by AG; among the trinucleotide repeat sequences, AAG has the most repetitive sequences, followed by AAC; among the tetranucleotides AAAT has the most repetitive sequences; among the five and six nucleotides, AAAAT and AAAAAT are also more common than other combinations. Most of the single to hexanucleotide sequences that account for the major motifs contained abundant A\T, while the G\C motifs are all among the scarce motifs. This is in good agreement with previous reports of microsatellites identified in B. rapa, B. oleracea and B. napus. It is also clearly seen that the genomic sequences of B. rapa have a much higher content of A\T relative to C\G.
Among the whole genome sequences of B. rapa (AA), B. nigra, B. oleracea, B. napus, B. juncea, and B. carinata, the distribution pattern of the number of motif repeats of microsatellites is essentially the same, except for B. nigra, where 12 repeats have the highest proportion of all repeats. (Figure 2C). At the same time, we can see that the microsatellite abundance decreases significantly as the number of motif repeats increases, with the rate of change being the flattest for dinucleotides, followed by single nucleotide as well as trinucleotide repeats, and more drastic changes can be observed for long repeat motifs. (Figures 3, 4).
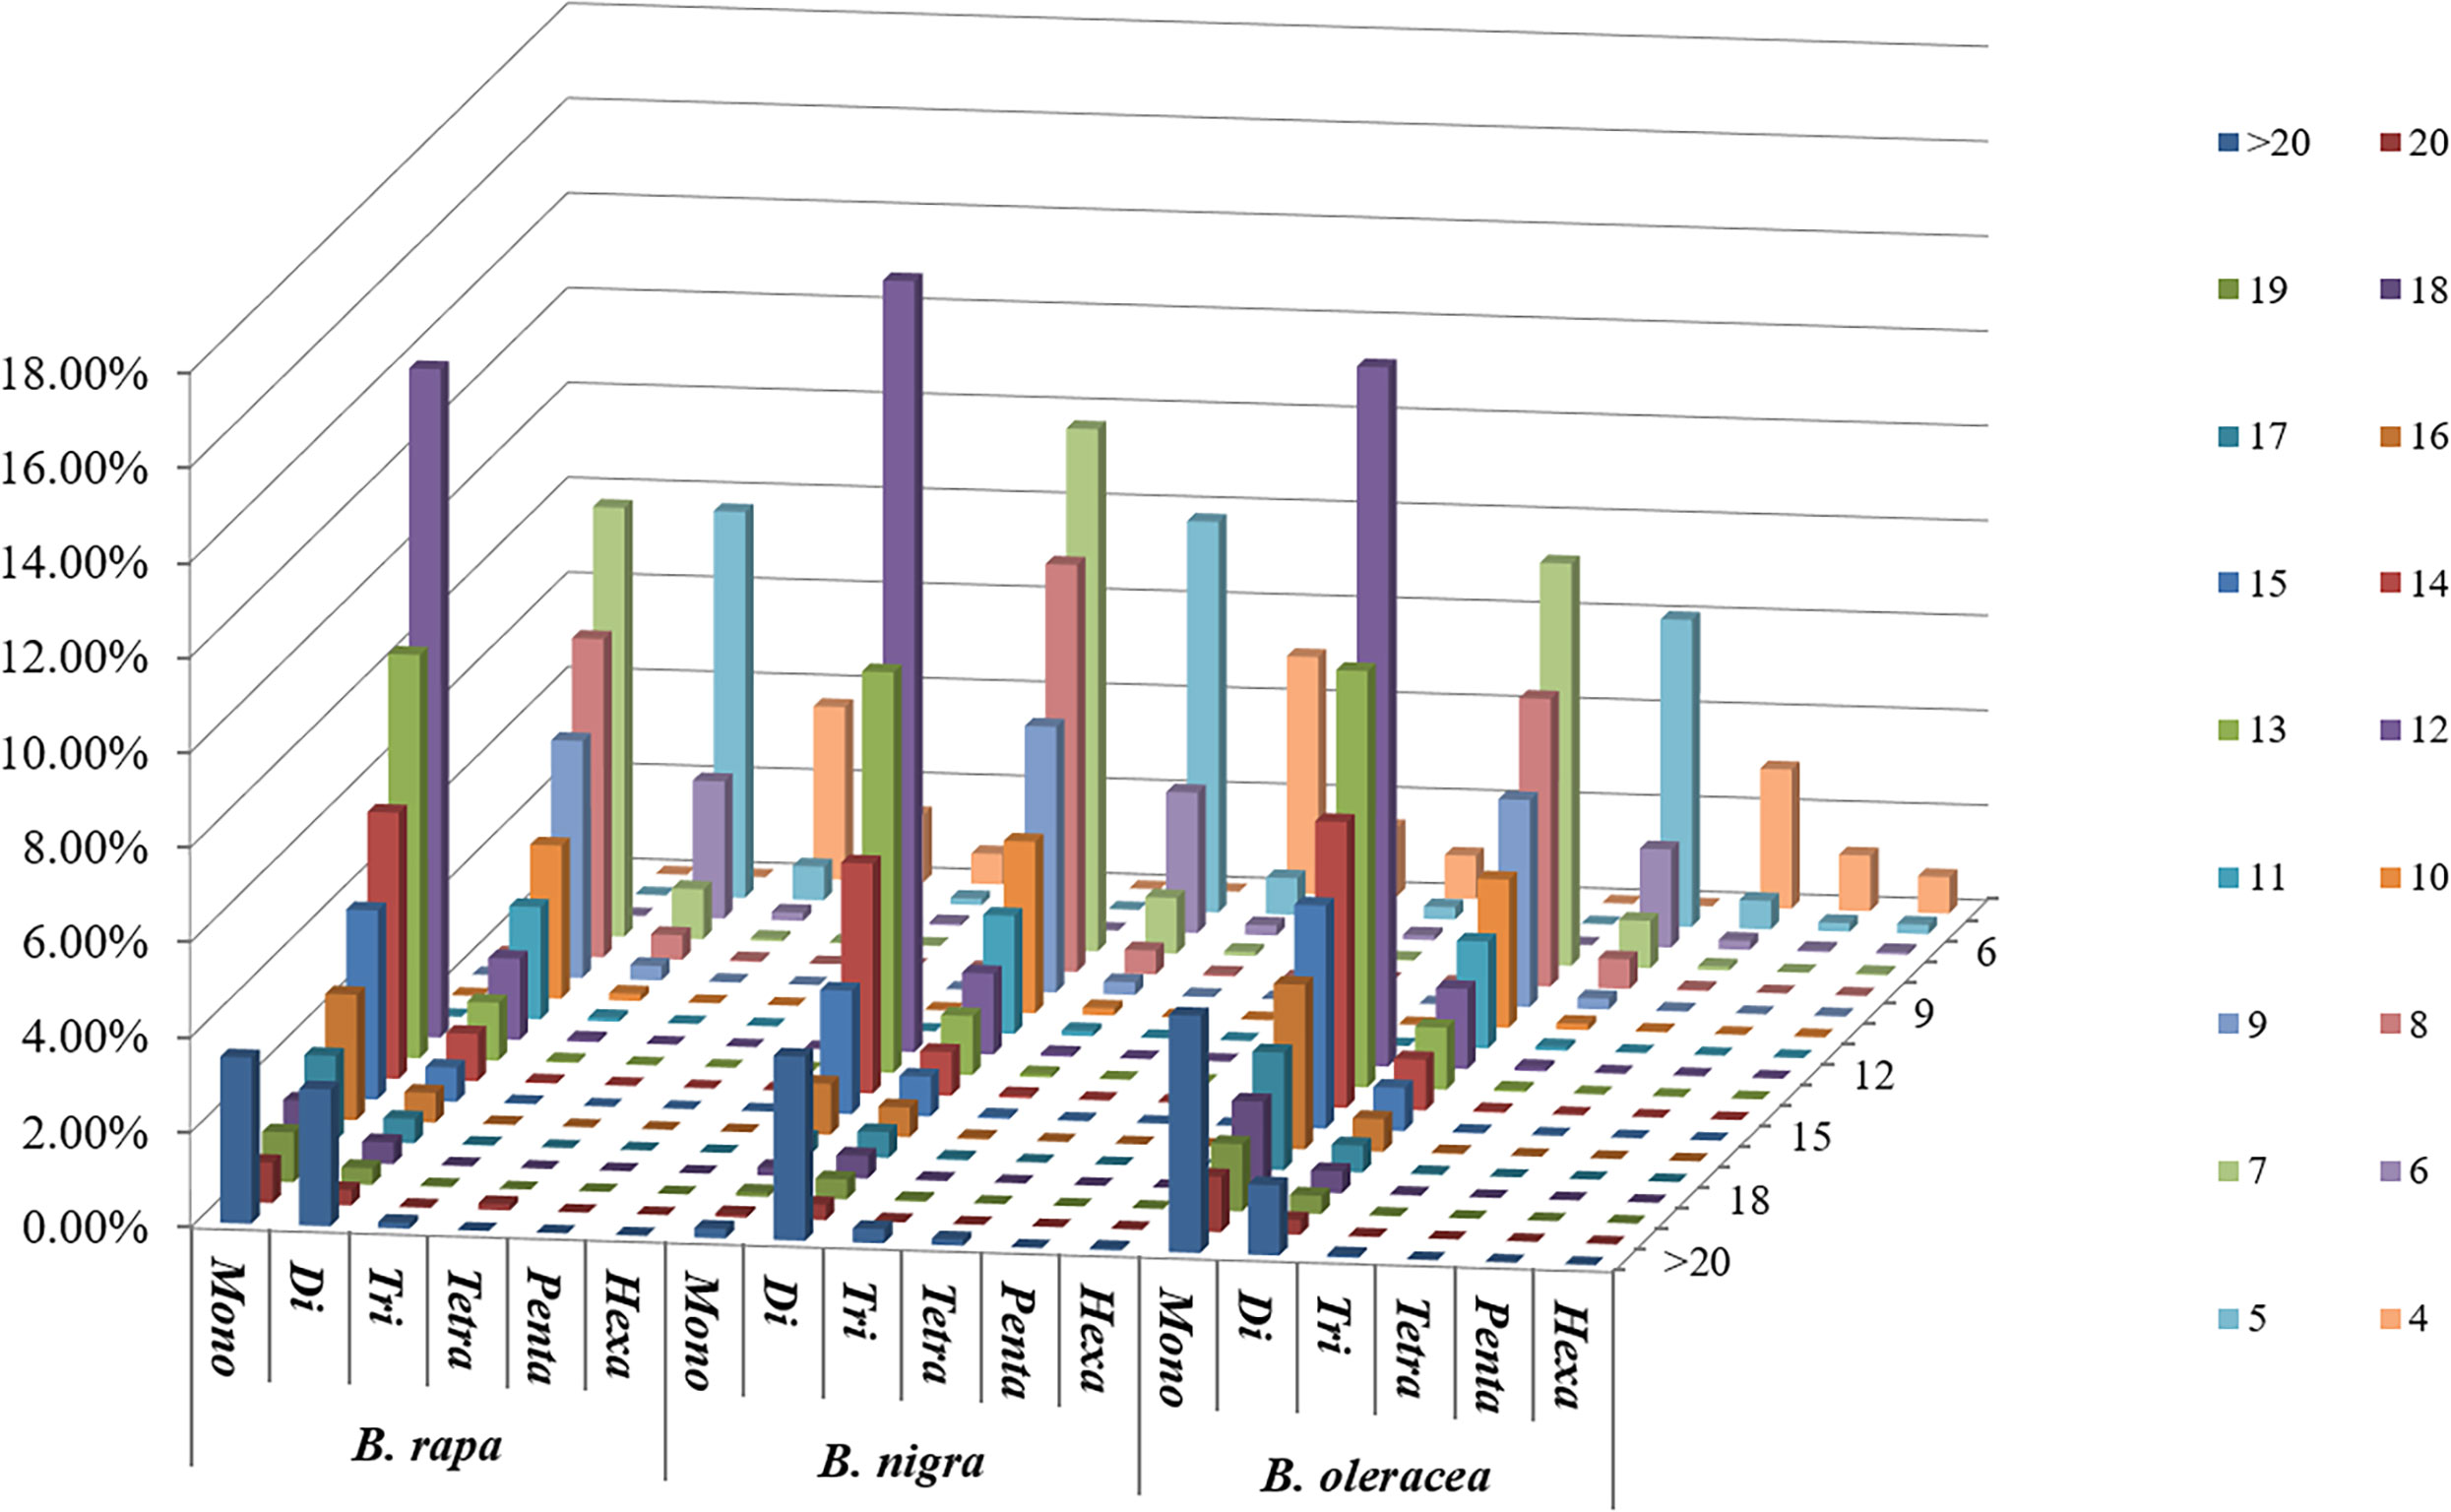
Figure 3 Distribution with respect to the motif repeat number of the individual mono- to hexanucleotide repeat microsatellites in the whole genomes of B. rapa, B. nigra and B. oleracea. The vertical axis shows a large number of microsatellites with different motif repeat numbers (from 4 to 20), which are distinguished by different colors.
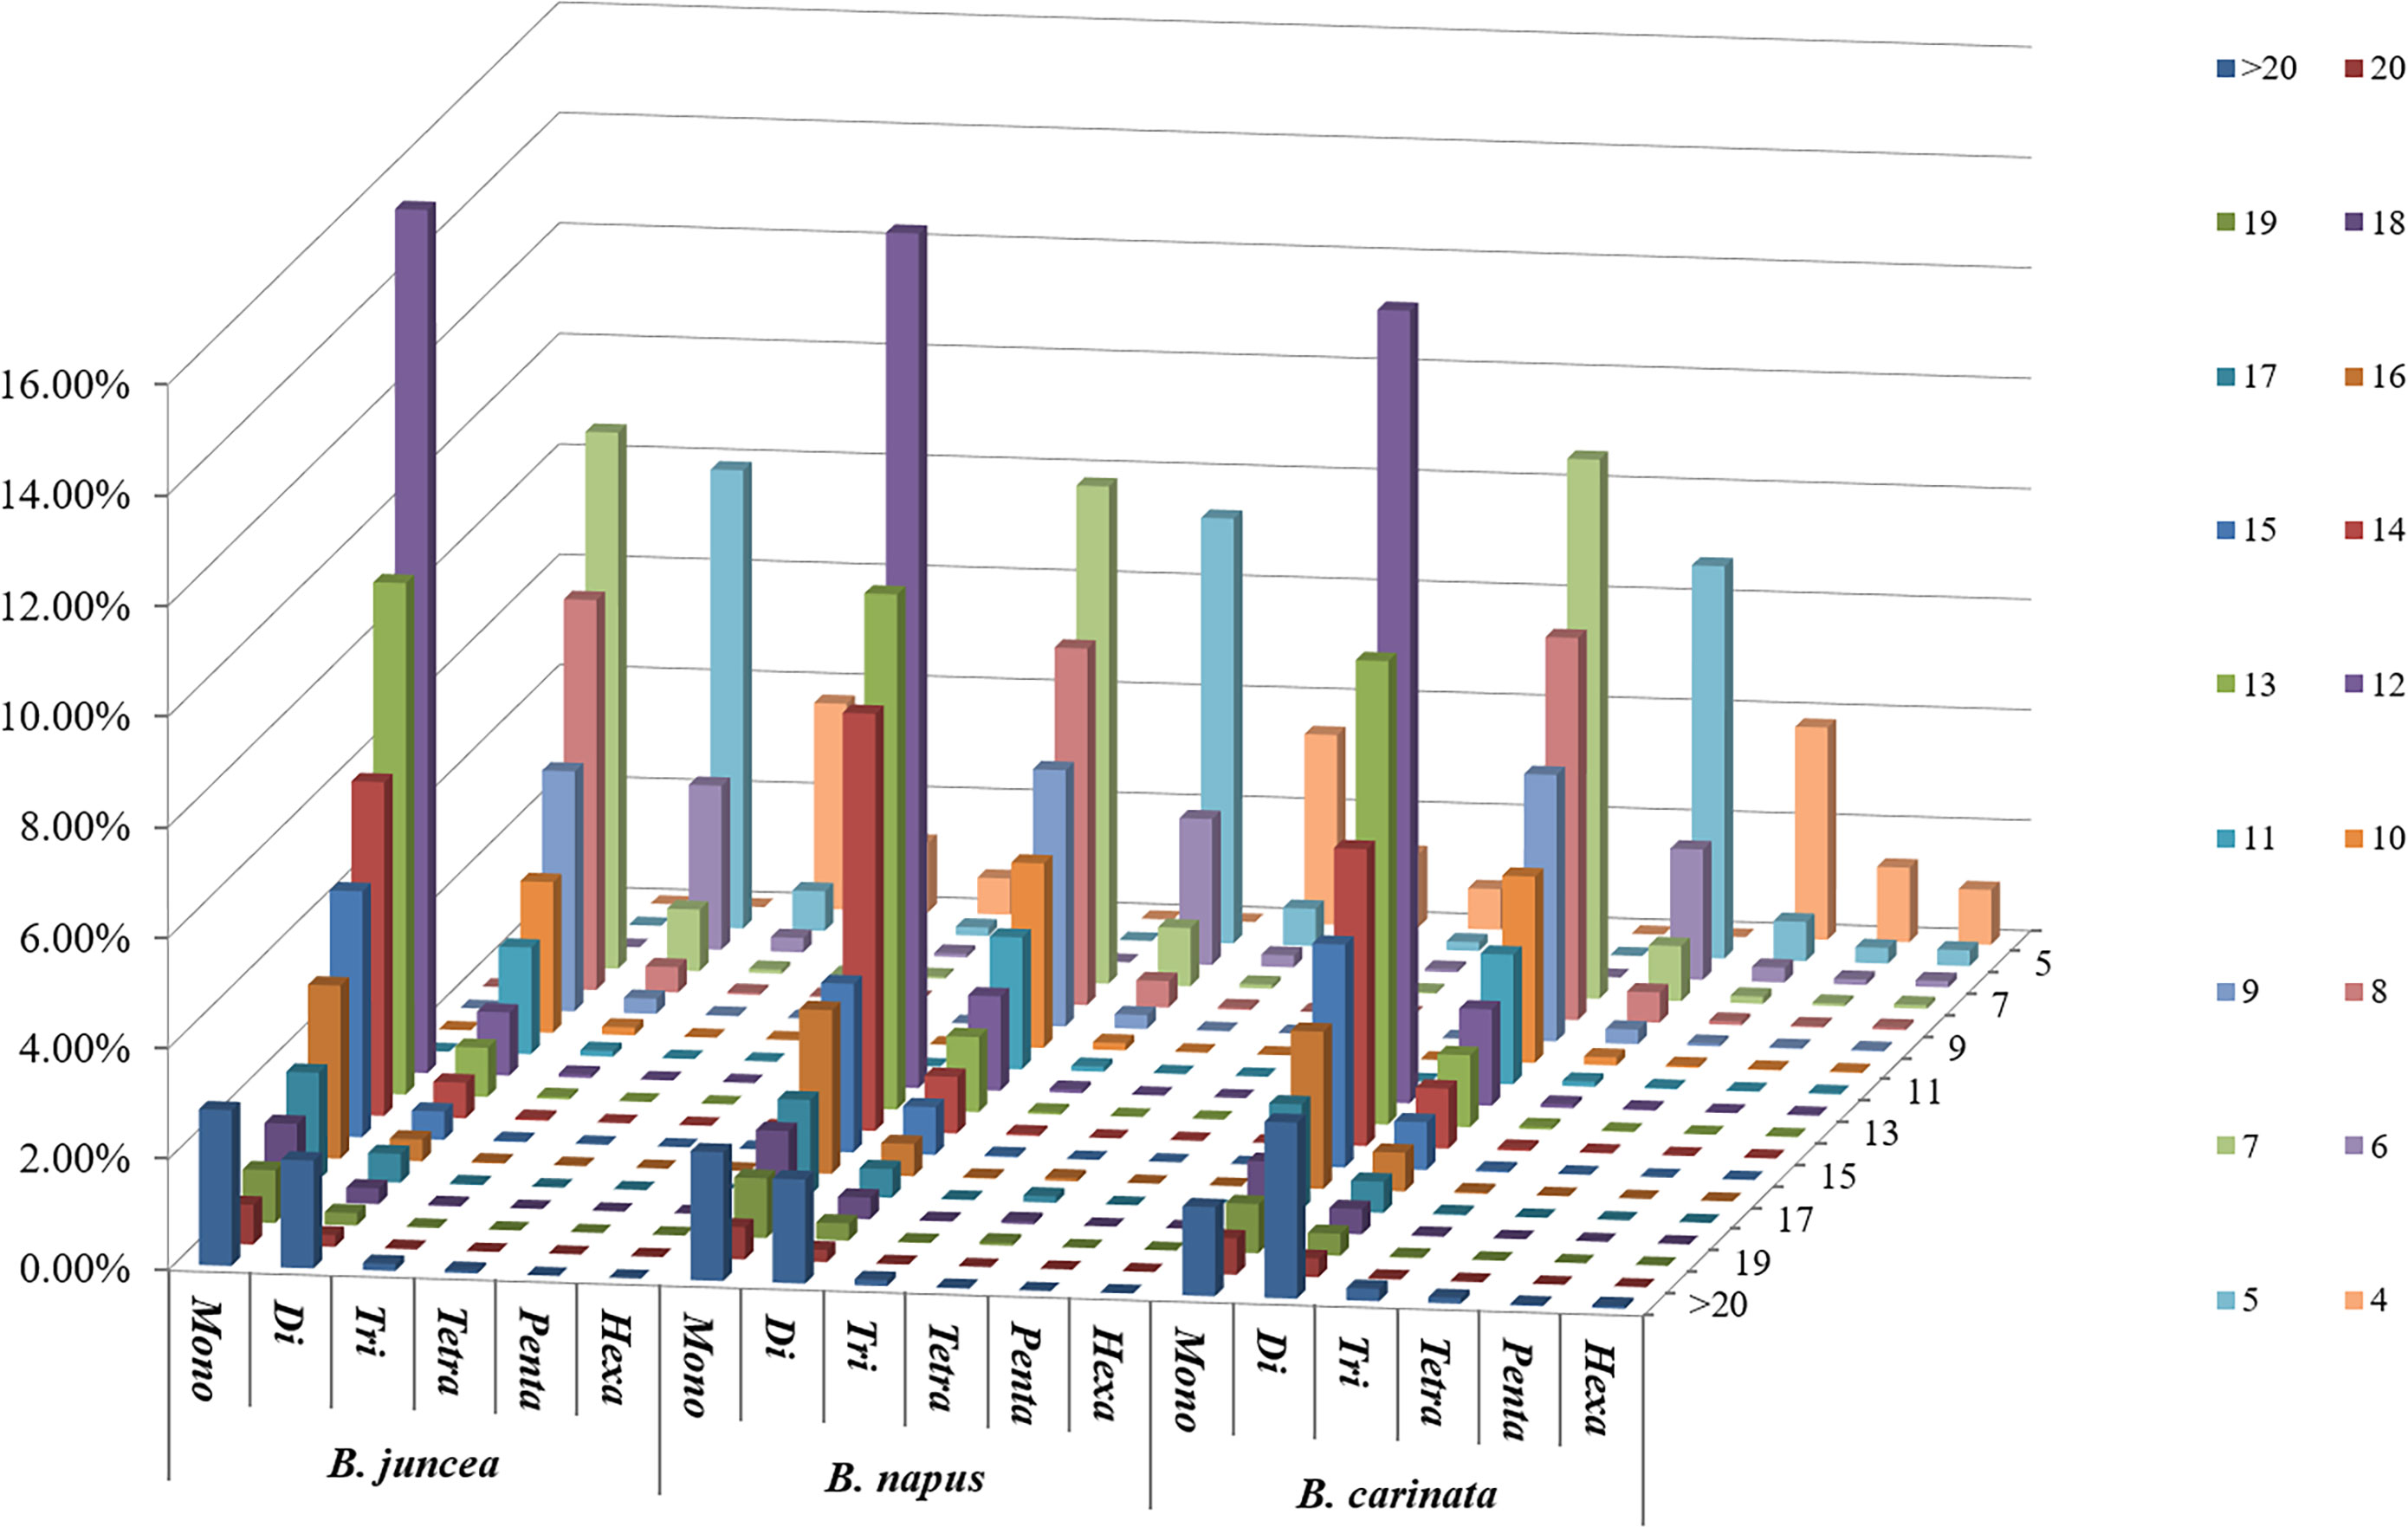
Figure 4 Distribution with respect to the motif repeat number of the individual mono- to hexanucleotide repeat microsatellites in the whole genomes of B. juncea, B. napus and B. carinata. The vertical axis shows a large number of microsatellites with different motif repeat numbers (from 4 to 20), which are distinguished by different colors.
In addition, we compared the corresponding motif lengths (Figure 5), mono- to hexanucleotide microsatellite numbers and motif repeat numbers between the basic species and the two heterotetraploid variants from which they diverged. As can be seen from the figure, the patterns of variation are very similar in the genomic SSRs of the six studied species, but comparisons between them reveal a more similar trend in microsatellite length distribution between B. rapa (AA), B. napus (AACC) and B. juncea (AABB) (Figure 5A); among B. nigra (BB), B. juncea (AABB) and B. carinata (BBCC), the microsatellite length distribution trends are more similar between B. nigra (BB) and B. carinata (BBCC) (Figure 5B); whereas among B. oleracea (CC), B. napus (AACC) and B. carinata (BBCC), the microsatellite length distribution trends are more similar between B. oleracea (CC) and B. napus (AACC) (Figure 5C). However, these differences are not highly significant.
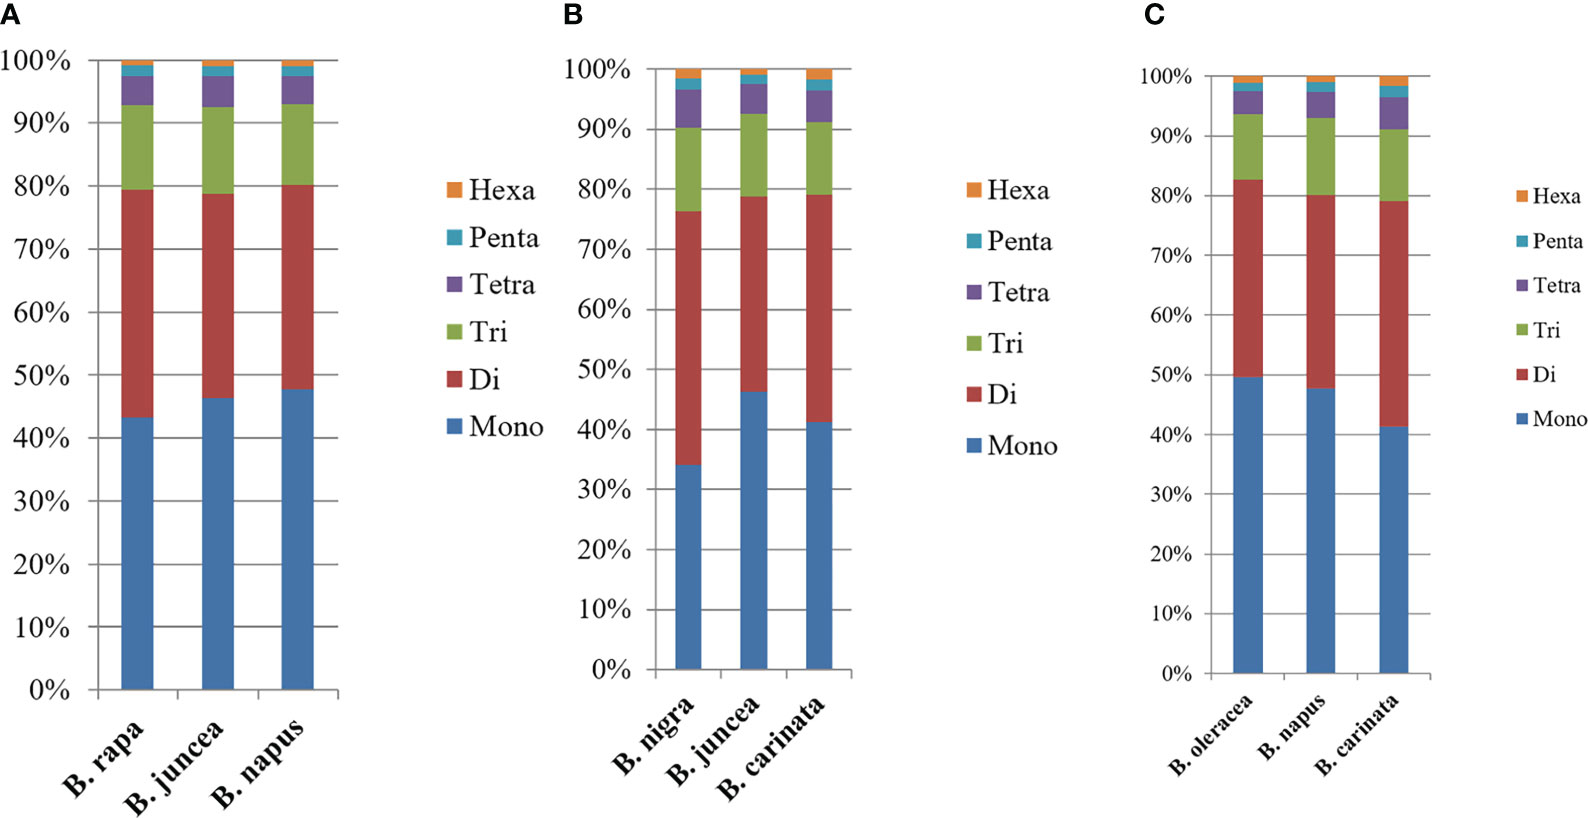
Figure 5 Distribution with respect to the motif length of microsatellites in the whole genomes of Brassica species in the triangle of U. (A) Distribution with respect to the motif length of microsatellites in the whole genomes of B. rapa, B. napus and B. juncea. (B) Distribution with respect to the motif length of microsatellites in the whole genomes of B. nigra, B. juncea and B. carinata. (C) Distribution with respect to the motif length of microsatellites in the whole genomes of B. oleracea, B. napus and B. carinata. The vertical axis shows the abundance (%) of microsatellites with different motif lengths, which are distinguished by different colors.
By comparing the number distribution of the three allotetraploid SSR loci in the three subgenomes AA, BB and CC, we can find that the allotetraploid species have significant differences in the number of SSR loci in the genome compared with their basic diploid counterparts (Table 3). It is worth mentioning that the reduction in SSR loci is the highest during the allotetraploidization of B. napus (AACC), which is 31.3% and 37%, respectively, compared with the diploid AA and CC genome. Furthermore, the reduction in SSR loci is intermediate during the allotetraploidization of B. juncea (AABB) L, which is 7.3% and 13.0%, respectively, compared with the diploid AA and BB genome. Moreover, the reduction in SSR loci is the lowest during the allotetraploidization of B. carinata (BBCC) L, which is 1.7% and 6.0%, respectively, compared with the diploid BB and CC genome (Table 3). We also compared the distribution of subgenomic chromosome SSR loci in the three basic species and the three allotetraploids respectively, and found that although the number of SSR loci in most chromosomes showed a downward trend, a few chromosomes showed an increase (Supplementary Table 1). For example, in B. juncea, the A subgenomic chromosomes A01 and A02 increased by 5.55% and 2.60% compared with the basic species, respectively. Moreover, in B. carinata, the B subgenomic chromosomes B01, B03 and B04 increased by 49.53%, 11.17% and 3.13%, respectively (Supplementary Table 1). These results suggest that the cytological and genetic mechanisms of allotetraploid evolution are complex and worthy of further study in the future.
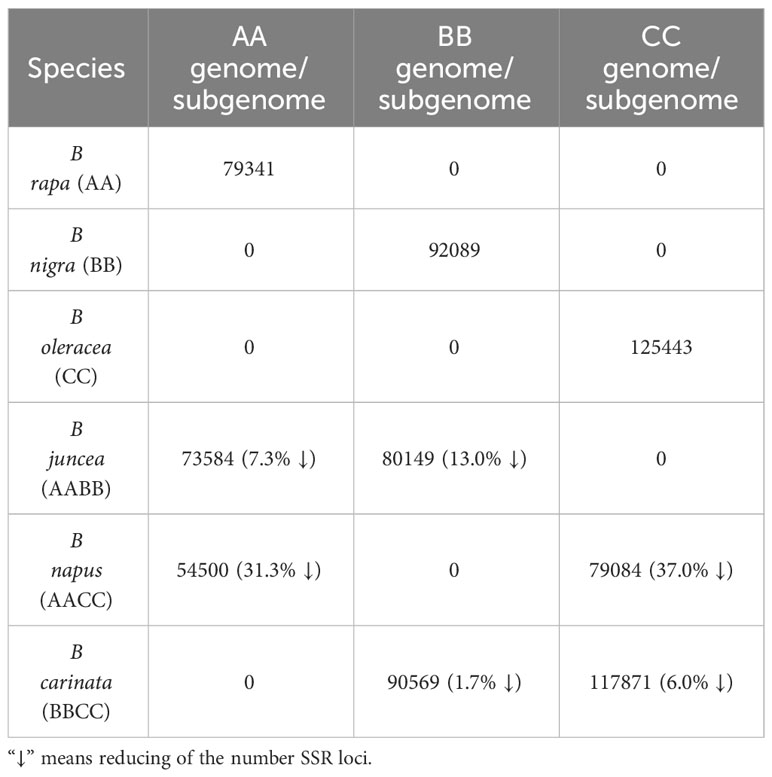
Table 3 The number of SSR loci in different genomes in the B Brassica species in the triangle of U.
Based on sequencing the whole genome chromosomes of Brassica species in the triangle of U, the characteristics of microsatellites on each chromosome of each of the six considered Brassica species and their physical location were investigated.
The characteristics of length, type and number of repeats on each chromosome of the six Brassica species were consistent with the overall microsatellite characteristics of each species described above. However, the number of microsatellites distributed on each chromosome was extremely heterogeneous. For the basic species B. rapa (AA) (Supplementary Table 2), B. nigra (BB) (Supplementary Table 3) and B. oleracea CC (Supplementary Table 4), the number of microsatellites was the highest on A09 (11214), B02 (13909) and C03 (18286), respectively. In contrast, for the four allotetraploid variants B. napus (AACC) (Supplementary Table 5), B. juncea (AABB) (Supplementary Table 6) and B. carinata (BBCC) (Supplementary Table 7), the microsatellite numbers were the highest on C03 (12561), B02 (12452) and C01 (16036), respectively. This may have occurred because the number of microsatellites is closely related to the length of the chromosomes; the greater the length of a chromosome, the larger the number of its corresponding microsatellites.
In order to explore the exact distribution of microsatellites on each chromosome, the relationship between microsatellites and chromosomes and that between the three basic species and their corresponding allotetraploids should be analyzed more clearly. We used mapping software to locate the physical position of each microsatellite to the corresponding chromosome. The results show that, for the six Brassica species, B. rapa (AA), B. nigra (BB), B. oleracea (CC), B. juncea (AABB), B. napus (AACC), and B. carinata (BBCC), all chromosomes have higher microsatellite frequencies at and near the ends, and they present lower microsatellite frequencies in and near the middle region. This is consistent with previous studies on the location of microsatellites on chromosomes and may correspond to the distribution around the telomeres and the thylakoids. Secondly, the physical distribution of microsatellites across all chromosomes of the six different species of Brassica is highly heterogeneous, suggesting that microsatellites do not occur randomly but their presence is most likely highly correlated with gene function around them. By comparison, we can also find that microsatellite distribution is more concentrated in B. nigra (BB) based on the physical position of microsatellites among the three basic species. Meanwhile, in the three allotetraploids, microsatellite distribution is more concentrated in B. carinata (BBCC), which may be due to the more concentrated distribution of genes on B. nigra (BB) and B. carinata (BBCC). The more concentrated distribution of genes on the latter two species is probably related. Moreover, the high concordance between microsatellites and genes strongly suggests the putative role of microsatellites in regulating genome function and in tagging genes using SSR molecules.
Using Krait software, primer pairs were successfully designed for each of the six species of B. rapa (AA), B. nigra (BB), B. oleracea (CC), B. napus (AACC), B. juncea (AABB) and B. carinata (BBCC), respectively, yielding a total of 52356, 62290, 82984, 111276, 120324 and 144149 primer pairs named in the order of BrSSR00001 ~ BrSSR52356, BniSSR00001 ~ BniSSR62290, BolSSR000001 ~ BolSSR082984, BnaSSR000001 ~ BnaSSR111276, BjuSSR000001 ~ BjuSSR120324, and BcaSSR000001 ~ BcaSSR144149, respectively. The primer sequence, TM value, SSR motif, expected product length, and start/end position on the chromosome for each SSR marker were determined (Supplementary Tables 8–13).
In this study, to enrich the SSR marker library of cruciferous crops and confirm the validity of the designed SSR primers, we randomly selected 120 primer pairs (Supplementary Tables 14–16) in three basic species and used genomic DNA from eight cruciferous species as DNA template, namely, B. rapa (AA), B. nigra (BB), B. oleracea (CC), B. juncea (AABB), B. napus (AACC), B. carinata (BBCC), R. sativus (RR), and A. thaliana (At). The cross-transferability of SSR markers from B. rapa (40 SSRs), B. nigra (40 SSRs) and B. oleracea (40 SSRs) was assessed and the affinities of the three basic species in forming three allotetraploids were speculated. We used a total of 120 SSRs, 40 from B. rapa, 40 from B. nigra, and 40 from B. oleracea for cross-amplification studies.
For the 40 primer pairs of B. rapa, a total of 310 positive amplifications were made in the eight species, resulting in a total of 325 alleles amplified with a cross-transfer rate of 85.27% (Table 4 and Supplementary Figure 1A). This high cross-transfer rate presumes the validity of these SSR markers for the study of the genomes of other species of cruciferous crops. Among these 325 amplified markers, the PIC values ranged from 0.32 to 0.84 with a mean value of 0.73. The gene diversity ranged from 0.41 to 0.86 with a mean value of 0.7461, and the heterozygosity values ranged from 0.21 to 0.70 with a mean value of 0.55.
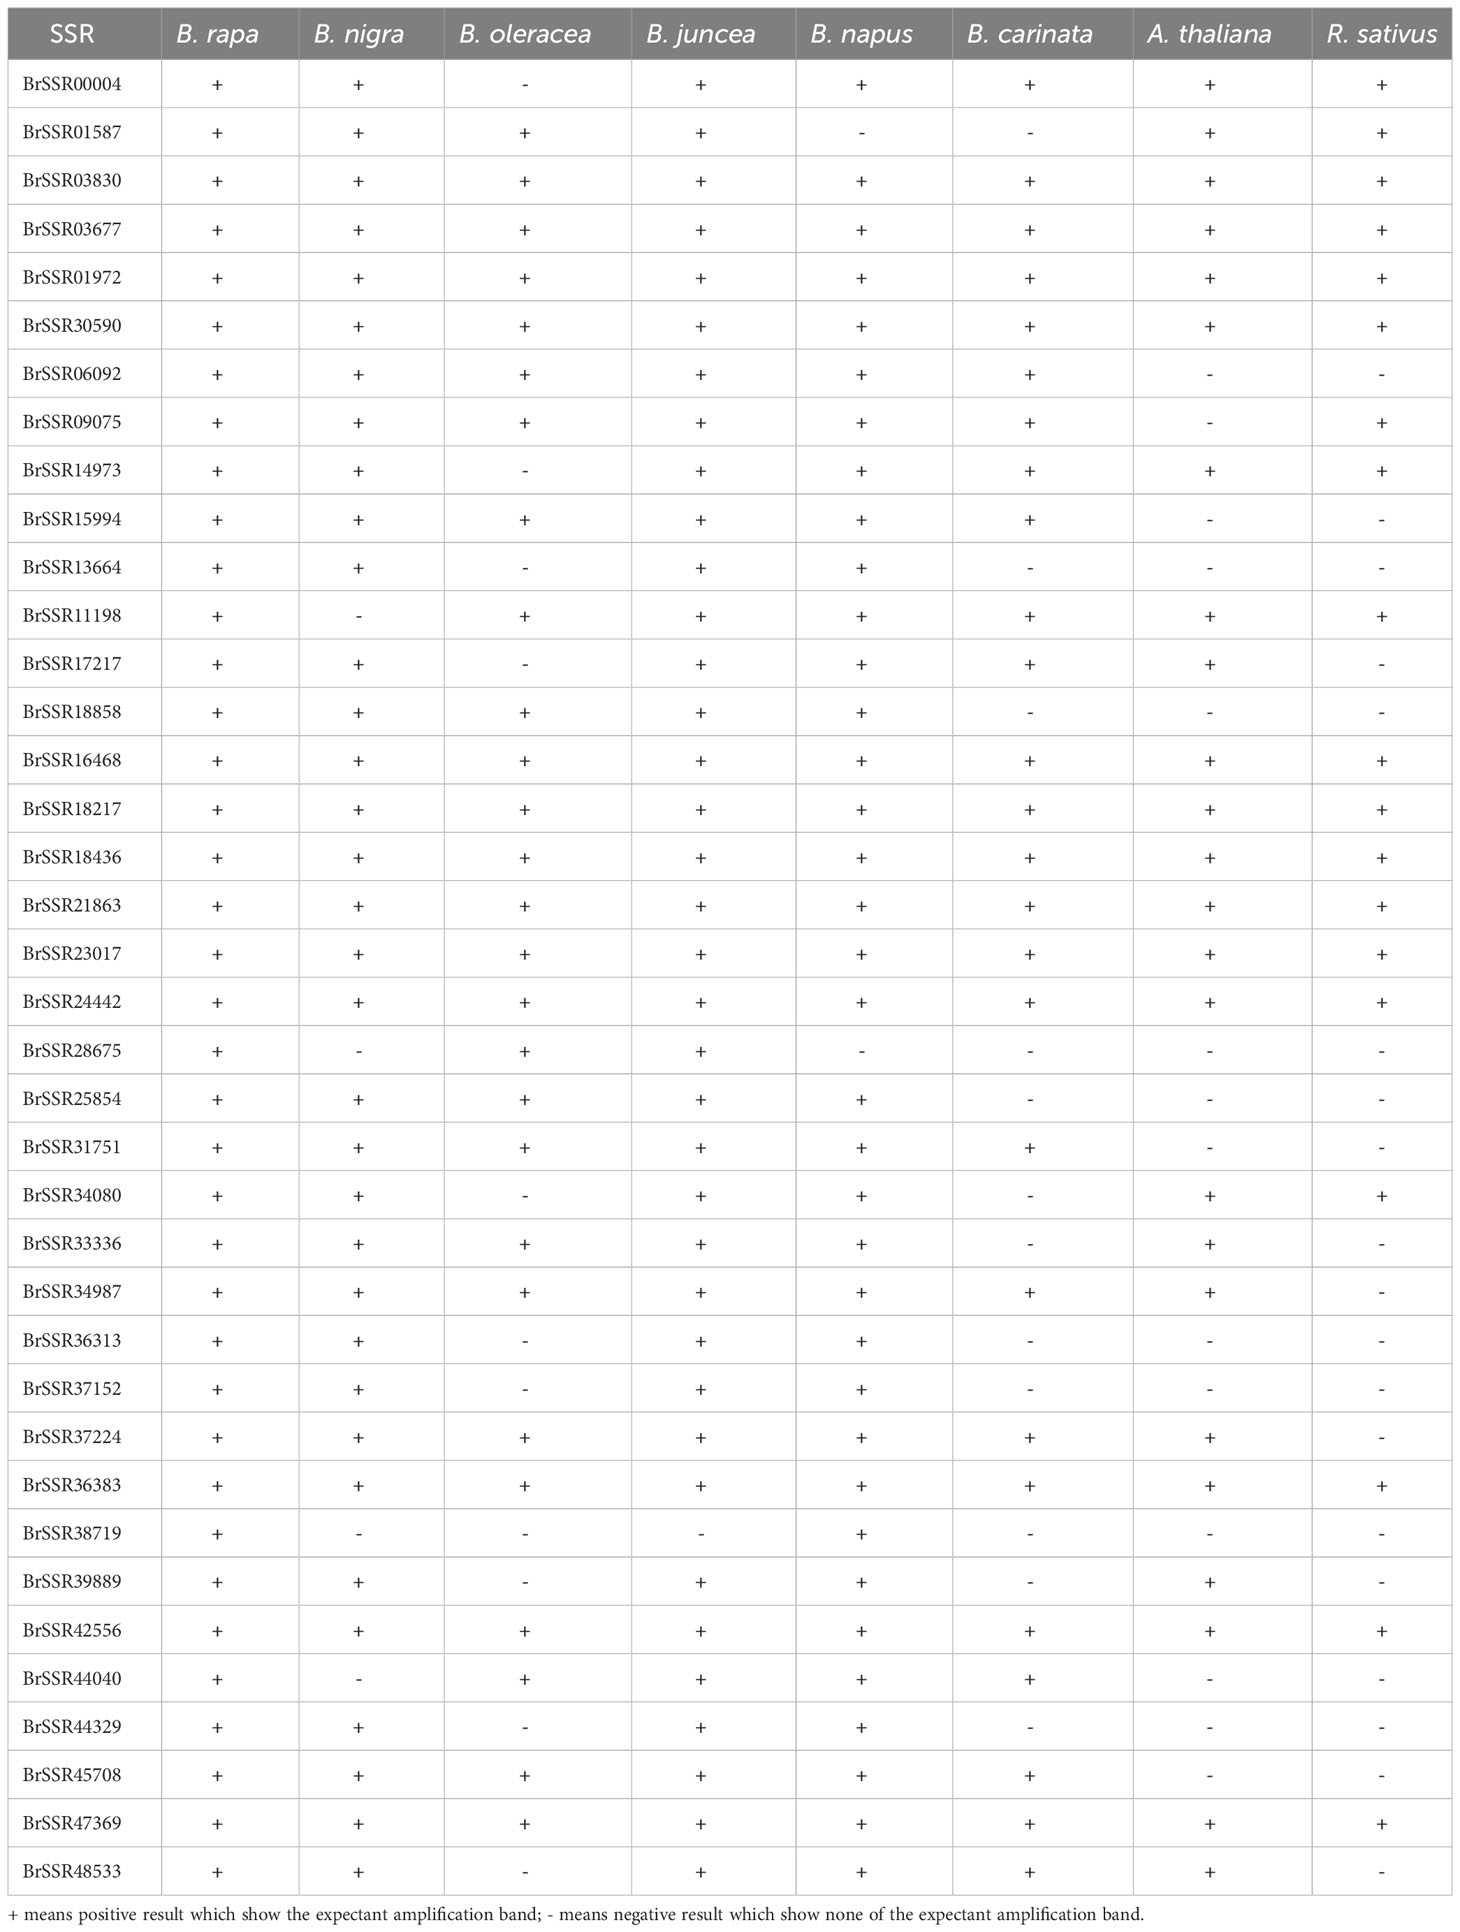
Table 4 Amplification results of the B. rapa cross-transferability test.
For the 40 primer pairs of B. nigra, a total of 280 positive amplifications were made across the eight species, resulting in a total of 301 alleles amplified with a cross-transfer rate of 81.33% (Supplementary Table 17 and Supplementary Figure 1B). From this high rate of cross-transfer, we speculate that these SSR markers have some validity for genomic studies of other species of cruciferous crops. The PIC values of these 301 amplified markers ranged from 0.33 to 0.73 with a mean value of 0.50. The gene diversity ranged from 0.38 to 0.71 with a mean value of 0.58, and the heterozygosity values ranged from 0.10 to 0.53 with a mean value of 0.41.
For the 40 primer pairs of B. oleracea, a total of 303 positive amplifications were made across the eight species, resulting in a total of 310 amplified alleles with a cross-transfer rate of 73.45% (Supplemntary Table 18 and Supplementary Figure 1C). This indicates that the SSR cross-transfer rate of B. oleracea has limitations in terms of its validity for studying the genomes of other species of cruciferous crops. Among these 310 amplified markers, the PIC values ranged from 0.48 to 0.85 with a mean of 0.67. The gene diversity ranged from 0.54 to 0.81 with a mean of 0.64, and the heterozygosity values ranged from 0.0 to 0.71 with a mean of 0.41.
When comparing the polymorphism potential of B. rapa (85.27%), B. nigra (81.33%) and B. oleracea (73.45%), B. rapa was found to have a higher cross-transfer rate (85.27%). In addition, the mean values of PIC, genetic diversity and heterozygosity of B. rapa-derived SSR markers were relatively high, indicating that among cruciferous plant species, B. rapa has better polymorphic potential than B. nigra and B. oleracea. The cross-species transferability has been demonstrated in Brassica crops, while the degree of SSR cross-transfer depends on the evolutionary distance among species (Thakur et al., 2022).
A B-genome specific SSR marker, BniSSR23228, was obtained from 40 selected SSR primers of black mustard (Supplementary Figure 1B). After PCR amplification, polyacrylamide gel electrophoresis, cloning verification screening and sequence alignment were carried out to validate the existence of this specific SSR marker (Figure 6). The validity experiment results indicated that BniSSR23228 possessing (AAGGA)3 sequence characteristics located in chromosome B3 with a total length of 97 bp (Supplementary Figure 2). Subsequently, this molecular marker can effectively screen the B genome of Brassica, and can be used for variety and parent identification, introgression line tracking, genetic diversity analysis, and marker-assisted breeding.
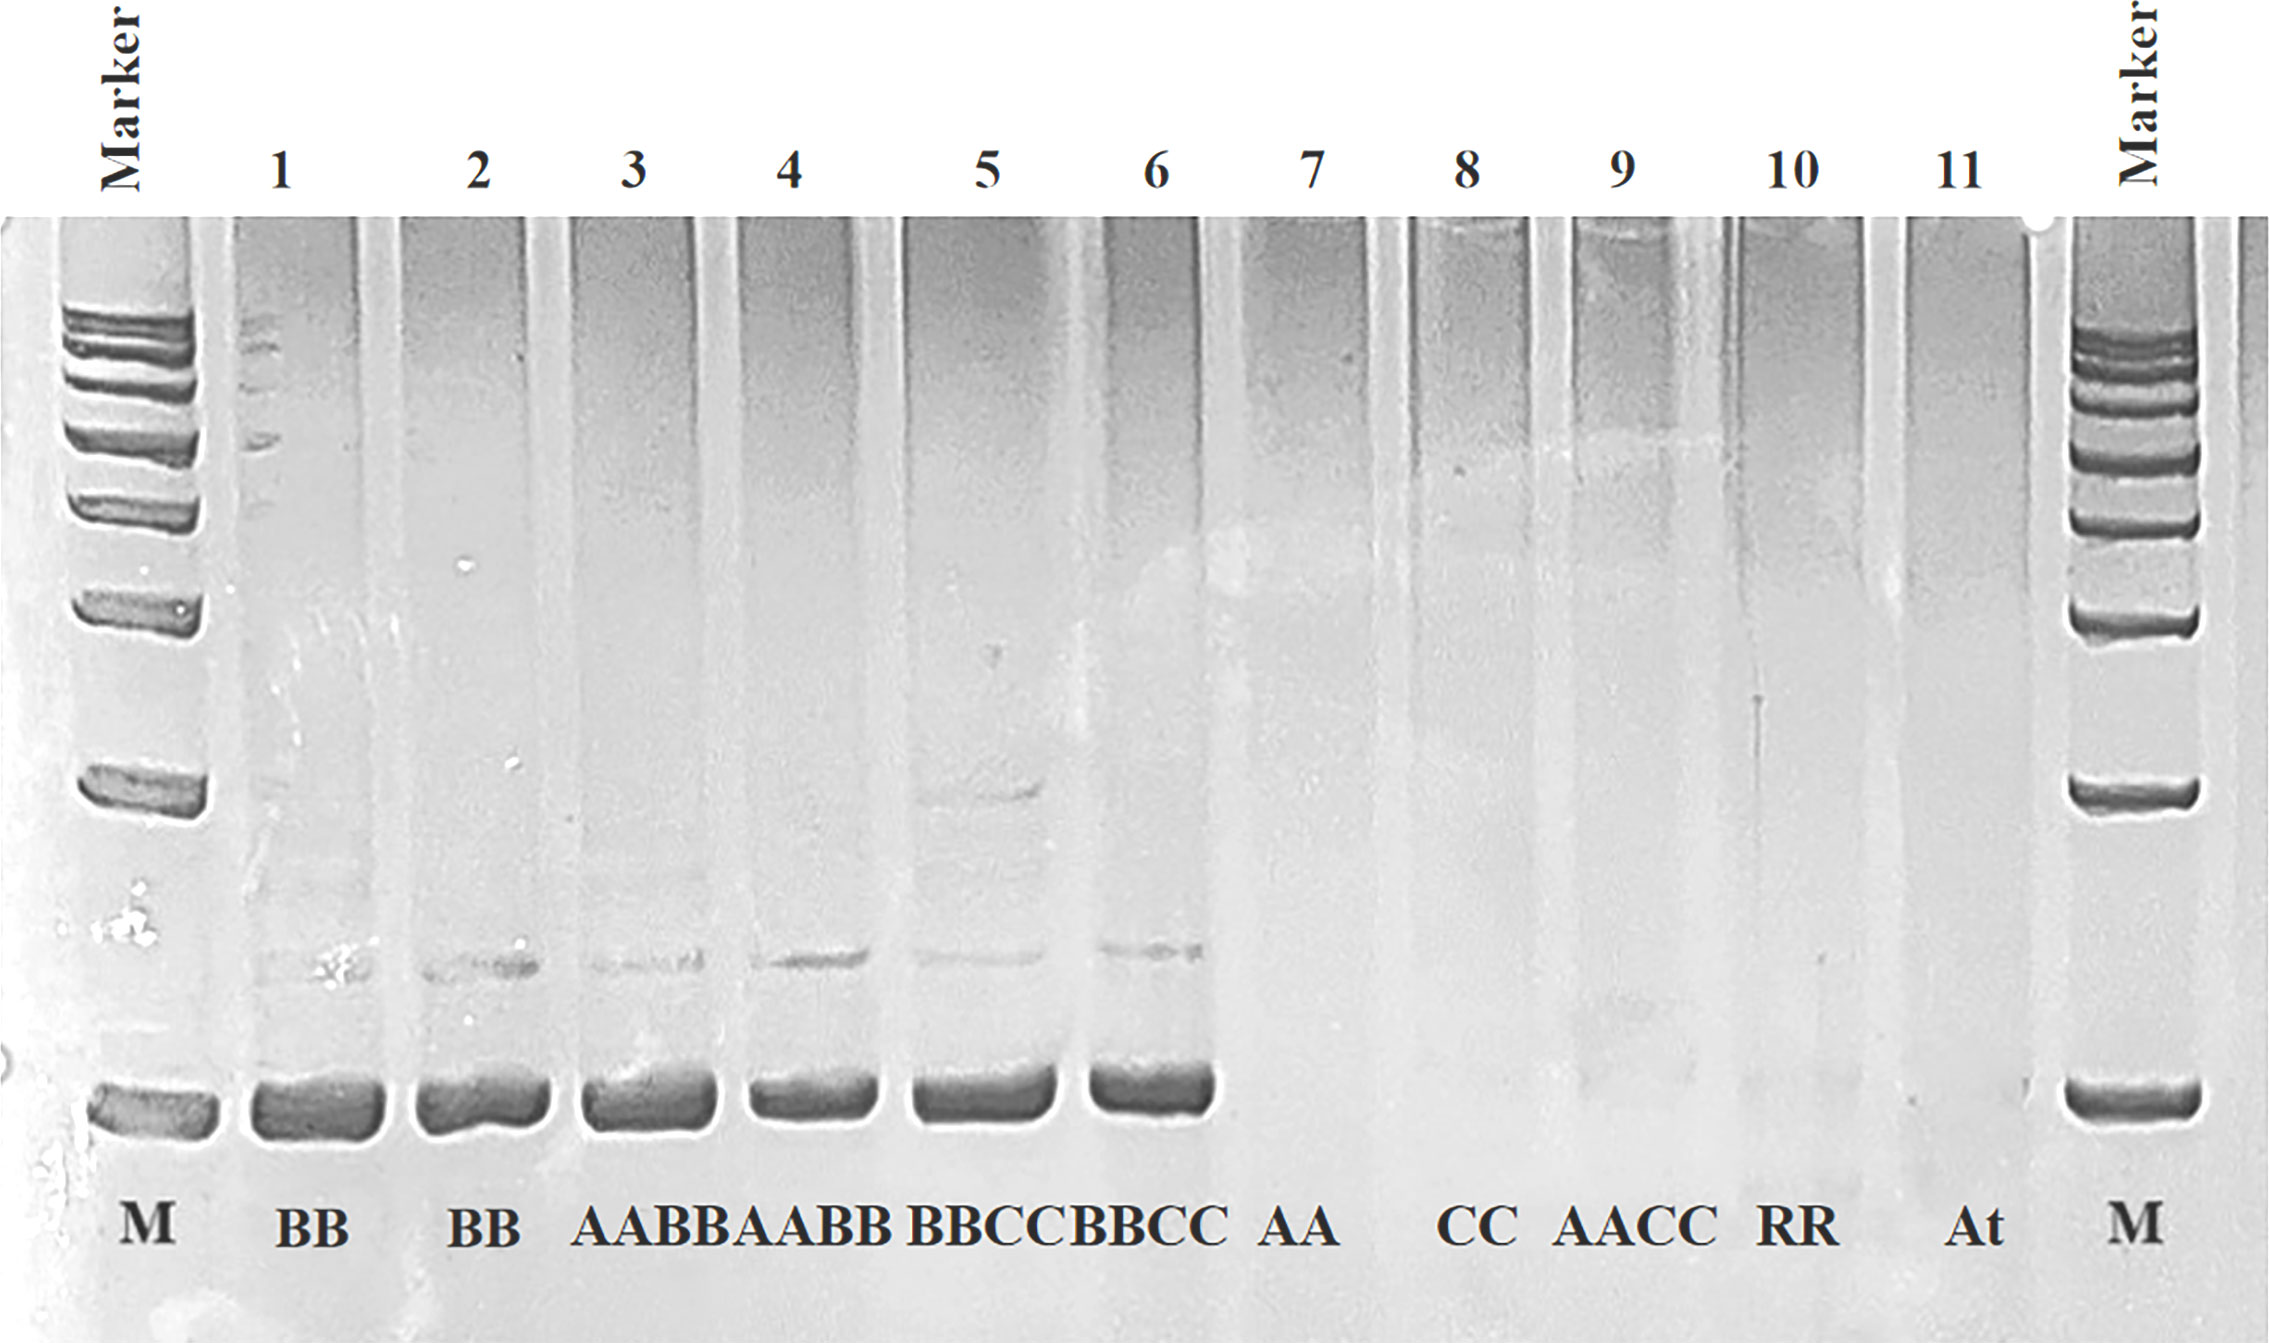
Figure 6 PCR amplification result of validity for BniSSR23228 in different Brassica species in the triangle of U. 1, 2: B. nigra (BB); 3, 4: B. juncea (AABB); 5, 6: B. carinata (BBCC); 7, 8, 9, 10, and 11: B. rapa (AA), B. oleracea (CC), B. napus (AACC), R. sativus (RR) and A. thaliana (At), respectively.
Krait software was used to search for 79341, 92089, 125443, 173964, 173604, and 222160 SSR loci from the whole genome sequences of six species of Brassica, namely, B. rapa (AA), B. nigra (BB), B. oleracea (CC), B. napus (AACC), B. juncea (AABB), and B. carinata (BBCC), respectively. The frequency of SSR occurrences (average SSRs per Mb) was 226 loci/Mb, 182 loci/Mb, 223.6 loci/Mb, 231.31 loci/Mb, 235.12 loci/Mb and 204.42 loci/Mb, respectively. In a previous report, the PERL5 script MIcroSAtellite (MISA; http://pgrc.ipkgatersleben.de/misa/) was employed for the genomes of B. rapa, B. oleracea and B. napus to obtain 140998, 229389 and 420991 SSR markers, respectively (Shi et al., 2014). Using Karit enabled SSR identification and subsequent primer design in less time than MISA, and the long microsatellites identified in this way were more polymorphic and useful. Among the SSR single nucleotide sequences identified in the six species, B. rapa (AA), B. nigra (BB), B. oleracea (CC), B. napus (AACC), B. juncea (AABB), and B. carinata (BBCC), the A sequence repeats were present in 29518 (42.5%), 31308 (34.00%), 57629 (45.94%), 73785 (42.5%), 77106 (44.32%), and 89382 (40.23%) single nucleotides, respectively. They were therefore regarded as the most important of such repeats, while the C sequence was less represented in single nucleotides. This result is consistent with previous studies performing SSR analysis of the whole grapevine genome (Cai et al., 2009). For the dinucleotide repeat type AT, the number of repeats were 13915 (20.04%), 22769 (24.72%), 27267 (21.74%), 37598 (21.66%), 29808 (17.13%) and 54026 (24.32%) respectively. This is therefore considered as the most significant of this replicate type, consistent with previous studies using SSR analysis of the whole B73 maize genome (Qu and Liu, 2013). The frequency of single nucleotide repeats was the highest of all repeat types, a result that differs from previous SSR analysis studies using MISA in B. rapa, B. oleracea and B. napus (Shi et al., 2014). Moreover, Shi et al. study results showed the microsatellite frequencies of Brassica, Arabidopsis and other angiosperm species were significantly negatively correlated with both their genome sizes and transposable elements contents (Shi et al., 2013). Qin et al. (2015) investigated the evolutionary regularities of SSRs during the evolution of plant species and the plant kingdom by analysis of twelve sequenced plant genome sequences. The results showed that, SSRs not only had the general pattern in the evolution of plant kingdom, but also were associated with the evolution of the specific genome sequence.
Probably, the deviation may be due to differences in the SSR software algorithms, parameter settings and the original databases used. In addition, our data indicated that the allotetraploidization process resulted in a significant reduction in SSR loci in the three subgenomes AA, BB and CC. The reasons may be partial gene-dominated chromosomal homologous recombination and rearrangement during the evolution of basic diploid species into allotetraploids (Song et al., 2021). Meanwhile, there are a large number of transposable elements (TE) in the Brassica species in the triangle of U genome (Cai et al., 2022), and TE insertion seems to result in chromosomal translocation, leading to the reduced number of SSR loci in the three subgenomes AA, BB and CC during the process of allotetraploidization. Of course, further experiments are required to prove this hypothesis. Shi et al. (2014) carried out microsatellite characterization based on genome-wide and marker development in three recently sequenced Brassica crops, and suggested that the distribution pattern of microsatellites may be conserved in the genus Brassica. This view was reinforced by the use of Krait to identify SSR signatures of six species of Brassica, suggesting that the distribution patterns of microsatellites are likely to be conserved in all Brassica species. Thus far, the comprehensive identification, characterization and primer development of SSRs for six Brassica species in the triangle of U have not been carried out. However, in this study, based on the complete whole genome sequences of six Brassica species in the triangle of U, not only were the SSRs of each variety comprehensively analyzed, but also the differences between the Brassica crops in the triangle of U were compared and a comprehensive primer design for the SSRs was carried out. To our knowledge, this is the first report to identify the SSR loci and design the SSR primers based on the complete whole genome sequences of six Brassica species in the triangle of U together. These markers will act as a powerful tool for future genomic and genetic studies of Brassica cruciferous crops in the near future.
High transferability has been reported for SSRs of different plant species, such as “Chiifu” of B. rapa, that is, 95% of its SSRs could amplify a fragment of other species (Wang et al., 2011). Thakur et al. (2018) study result indicated 100% cross-transferability was obtained for B. juncea and three subspecies of B. rapa with 124 Brassica-derived SSR loci assayed, while lowest cross-transferability (91.93%) was obtained for Eruca sativa. The average % age of cross-transferability across all the seven species was 98.15%. In addition, 47% of EST-SSR markers developed from B. rapa, B. oleracea, and B. napus were transferable to six Brassica species (An et al., 2011). Sim et al. randomly selected 41 SSR markers of thistle and alfalfa, and found that the transferability was 53% to 71% in the leguminous plant (alfalfa) and 33% to 44% in the non-leguminous plant (thistle). About 57% of cereal EST-SSRs could also be amplified in ryegrass (Sim et al., 2009). Additionally, about 60% of EST-SSR markers from barley could be amplified in wheat and rye (Castillo et al., 2008). Cui et al. (2005) used 69 pairs of SSR primers of non-heading Chinese cabbage in eight varieties of Brassica crops, and found that the transferability amplification rate was 49.3% to 85.5% and that 33% of the SSR primers in the inter-specific hybrids of Brassica presented abundant diversity.
Based on the 1176 SSR-containing ESTs in cabbage, a total of 978 primer pairs have been successfully designed and assessed by validation of the amplification on two inbreed lines (Chen et al., 2010). Subsequently, the results indicated that the developed SSRs from ESTs of B. oleracea were valid and practicable in marker-assisted selection and QTL analysis in cabbage (Su et al., 2015). Some useful information about SSR and sequence analysis in Brassica crops can also be obtained on the website of Brassica DB database (http://Brassica.bbsrc.ac.uk/).
In this work, the functional utility of SSR markers derived from B. rapa (AA), B. nigra (BB) and B. oleracea (CC) was evaluated by analyzing their cross-transferability among B. rapa (AA), B. nigra (BB), B. oleracea (CC), B. juncea (AABB), B. napus (AACC), B. carinata (BBCC), R. sativus (RR), and A. thaliana (At). From our results, it was inferred that the cross-transferability of SSR markers from B. rapa (AA) showed higher potential than those from B. nigra (BB) and B. oleracea (CC) among these eight species, with cross-transferability rates of 85.27%, 81.33% and 73.45%, respectively. In fact, enriching other varieties with SSR markers alleviates the hassle of the expansion and development process and can facilitate the genetic improvement of new varieties by the genomes of superior varieties. Our findings suggest that genomic SSR markers with high transferability can be used for different Brassica species and even non-Brassica species. Therefore, these genomic SSR markers with clear location and uniform nomenclature system have high potential to be more widely used in several fields, such as gene localization, genetic mapping, evolutionary analysis, molecular marker-assisted breeding, and provide marker materials for genetic and comparative genomics analysis to further introduce some important agronomic traits into other superior Brassica species lacking these traits.
Alien chromosome additions have been used to link species-specific characteristics to particular chromosomes (Kapoor et al., 2011). The plasticity of the Brassica genome and existence of natural amphiploids have made it possible to develop several alien chromosome additions by dissecting the B. rapa, B. oleracea, and B. nigra genomes (Chevre et al., 1996; Gu et al., 2009; Li et al., 2013). Compared with the single species-specific SSR marker obtained by comparison between two species developed in previous studies (Gu et al., 2009; Li et al., 2013), the specific SSR developed in this study, BniSSR23228, has been verified among Brassica species in the triangle of U and their closely related species, radish and Arabidopsis. The results revealed that it is a B-genome specific SSR marker, therefore has more significant B-genome specificity and more extensive application value in the future.
Publicly available datasets were analyzed in this study. This data can be found here: http://brassicadb.cn.
NS: Methodology, Software, Validation, Writing – original draft, Writing – review & editing. JC: Conceptualization, Funding acquisition, Resources, Supervision, Writing – review & editing. YW: Formal analysis, Investigation, Methodology, Validation, Writing – review & editing. IH: Data curation, Validation, Writing – review & editing. NL: Funding acquisition, Resources, Validation, Writing – review & editing. XM: Data curation, Investigation, Validation, Writing – review & editing. WL: Data curation, Formal analysis, Investigation, Writing – review & editing. KL: Data curation, Validation, Visualization, Writing – review & editing. HY: Formal analysis, Methodology, Visualization, Writing – review & editing. KZ: Data curation, Investigation, Validation, Visualization, Writing – review & editing. TZ: Data curation, Formal analysis, Investigation, Writing – review & editing. YZ: Data curation, Software, Validation, Writing – review & editing, Writing – original draft. XY: Conceptualization, Funding acquisition, Project administration, Resources, Supervision, Writing – review & editing, Writing – original draft.
The author(s) declare financial support was received for the research, authorship, and/or publication of this article. This research was funded by the Project of Sci-tech Foundation of Zhejiang Province (2022C02030 and 2022C02032), the Breeding Project of the Sci-tech Foundation of Zhejiang Province (2021C02065), the Natural Science Foundation of Hainan Province (321MS063), the Project of the Sci-tech Foundation of Ningbo City (2022S189), the Basic Public Welfare Research Plan of Zhejiang Province (LTGN23C150008), Zhejiang Province SanNongJiuFang Science and Technology Cooperation Project (2023SNJF009) and Harbin Academy of Agricultural Sciences & Zhejiang University Agricultural College Research Cooperation Project (2021ZSZZNS03).
The authors gratefully acknowledge Prof. Zhenning Liu and Dr. Dongya Wu for stimulating discussion and critical reading of the manuscript. And the authors are grateful to Zhejiang University Press for improving the English.
Author JC was employed by the company Ningbo Haitong Food Technology Co., Ltd.
The part of the B-genome specific SSR marker result has been applied for Chinese patent 202310602125.0.
The remaining authors declare that the research was conducted in the absence of any commercial or financial relationships that could be construed as a potential conflict of interest.
All claims expressed in this article are solely those of the authors and do not necessarily represent those of their affiliated organizations, or those of the publisher, the editors and the reviewers. Any product that may be evaluated in this article, or claim that may be made by its manufacturer, is not guaranteed or endorsed by the publisher.
The Supplementary Material for this article can be found online at: https://www.frontiersin.org/articles/10.3389/fpls.2023.1259736/full#supplementary-material
Supplementary Figure 1 | Transferability analysis on the designed SSR primers for the three basic species. (A), PCR amplification results of SSR primers for part of the AA genome; (B), PCR amplification results of SSR primers for part of the BB genome; C, PCR amplification results of SSR primers for part of the CC genome.
Supplementary Figure 2 | Genomic sequence of BniSSR23228 and sequence alignment results for the BB, AA and CC genomes. (A), Genomic sequence of BniSSR23228; (B), Sequence alignment result for the BB genome; (C), Sequence alignment result for the AA genome; (B), Sequence alignment result for the CC genome.
An, Z. S., Gao, C. H., Li, J. N., Fu, D. H., Tang, Z. L., Ortegon, O. (2011). Large-scale development of functional markers in Brassica species. Genome 54 (9), 763–770. doi: 10.1139/g11-042
Ananga, A. O., Cebert, E., Soliman, K., Kantety, R., Pacumbaba, R. P., Konan, K. (2006). RAPD markers associated with resistance to blackleg disease in Brassica species. Afr. J. Biotechnol. 5 (22), 2041–2048. doi: 10.5897/AJB06.594
Beckie, H. J., Warwick, S. I., Nair, H., Seguin-Swartz, G. S. (2003). Gene flow in commercial fields of herbicide-resistant canola (Brassica napus). Ecol. Appl. 13 (5), 1276–1294. doi: 10.1890/02-5231
Burgess, B., Mountford, H., Hopkins, C. J., Love, C., Ling, A. E., Spangenberg, G. C., et al. (2006). Identification and characterization of simple sequence repeat (SSR) markers derived in silico from Brassica oleracea genome shotgun sequences. Mol. Ecol. Notes 6 (4), 1191–1194. doi: 10.1111/j.1471-8286.2006.01488.x
Cai, B., Li, C. H., Yao, Q. H., Zhou, J., Tao, J. M., Zhang, Z. (2009). Analysis of SSRs in grape genome and development of SSR database. J. Nanjing Agric. Univ. 32 (4), 28–32. doi: 10.3321/j.issn:1000-2030.2009.04.006
Cai, X., Lin, R. M., Liang, J. L., King, G. J., Wu, J., Wang, X. W. (2022). Transposable element insertion: a hidden major source of domesticated phenotypic variation in Brassica rapa. Plant Biotechnol. J. 20 (7), 1298–1310. doi: 10.1111/pbi.13807
Cao, H. C., Wang, Y., Huang, L. S., Wang, Y. J., Yu, Y. J., Yang, L. (2013). Large - scale development of SSR markers in the genome of cacao. J. Shandong Agric. Univ. Nat. Sci. 44 (3), 340–344. doi: CNKI:SUN:SCHO.0.2013-03-005
Cardle, L., Ramsay, L., Milbourne, D., Macaulay, M., Marshall, D., Waugh, R. (2000). Computational and experimental characterization of physically clustered simple sequence repeats in plants. Genetics 156 (2), 847–854. doi: 10.1093/GENETICS/156.2.847
Castillo, A., Budak, H., Varshney, R. K., Dorado, G., Graner, A., Hernandez, P. (2008). Transferability and polymorphism of barley EST-SSR markers used for phylogenetic analysis in Hordeum Chilense. BMC Plant Biol. 8, 9. doi: 10.1186/1471-2229-8-97
Chao, J. T., Li, Z. Y., Sun, Y. H., Aluko, O. O., Wu, X. R., Wang, Q., et al. (2021). MG2C: a user-friendly online tool for drawing genetic maps. Mol. Hortic. 1, 16. doi: 10.1186/s43897-021-00020-x
Chen, C., Zhuang, M., Li, K. N., Liu, Y. M., Yang, L. M., Zhang, Y. Y., et al. (2010). Development and utility of EST-SSR marker in cabbage. Acta Hortic. Sin. 37 (2), 221–228. doi: 10.16420/j.issn.0513-353x.2010.02.010
Cheng, X. M., Xu, J. S., Xia, S., Gu, J. X., Yang, Y., Fu, J., et al. (2009). Development and genetic mapping of microsatellite markers from genome survey sequences in Brassica napus. Theor. Appl. Genet. 118 (6), 1121–1131. doi: 10.1007/s00122-009-0967-8
Chevre, A. M., Eber, F., This, P., Barret, P., Tanguy, X., Brun, H., et al. (1996). Characterization of Brassica nigra chromosomes and of blackleg resistance in B-napus-B-nigra addition lines. Plant Breed. 115 (2), 113–118. doi: 10.1111/j.1439-0523.1996.tb00884.x
Christensen, S., von Bothmer, R., Poulsen, G., Maggioni, L., Phillip, M., Andersen, B. A., et al. (2011). AFLP analysis of genetic diversity in leafy kale (Brassica oleracea L. convar. acephala (DC.) Alef.) landraces, cultivars and wild populations in Europe. Genet. Resour. Crop Evol. 58 (5), 657–666. doi: 10.1007/s10722-010-9607-z
Cui, X. M., Hou, X. L., Dong, Y. X. (2005). Development of SSR primers of non-heading Chineses cabbage and transferability among closely related species. Sci. Tech. Rev. 23 (11), 20–23. doi: 10.3321/j.issn:1000-7857.2005.11.006
Du, L. M., Zhang, C., Liu, Q., Zhang, X. Y., Yue, B. S. (2018). Krait: an ultrafast tool for genome-wide survey of microsatellites and primer design. Bioinformatics 34 (4), 681–683. doi: 10.1093/bioinformatics/btx665
FitzJohn, R. G., Armstrong, T. T., Newstrom-Lloyd, L. E., Wilton, A. D., Cochrane, M. (2007). Hybridisation within Brassica and allied genera: evaluation of potential for transgene escape. Euphytica 158 (1-2), 209–230. doi: 10.1007/s10681-007-9444-0
Gu, A. X., Wang, Y. H., Xuan, S. X., Chen, X. P., Shen, S. X. (2009). Establishment of specific SSR from different linkage groups of cabbage compared with Chinese cabbage. Acta Hortic. Sin. 36 (8), 1221–1226. doi: 10.16420/j.issn.0513-353x.2009.08.021
Gupta, S. K., Gopalakrishna, T. (2010). Development of unigene-derived SSR markers in cowpea (Vigna unguiculata) and their transferability to other Vigna species. Genome 53 (7), 508–523. doi: 10.1139/g10-028
Kantety, R. V., La Rota, M., Matthews, D. E., Sorrells, M. E. (2002). Data mining for simple sequence repeats in expressed sequence tags from barley, maize, rice, sorghum and wheat. Plant Mol.Biol. 48 (5), 501–510. doi: 10.1023/a:1014875206165
Kapoor, R., Kaur, G., Banga, S., Banga, S. S. (2011). Generation of B. nigra-B. rapa chromosome addition stocks: cytology and microsatellite markers (SSRs) based characterization. New Biotech. 28 (4), 407–417. doi: 10.1016/j.nbt.2010.11.002
Kristal, A. R., Lampe, J. W. (2002). Brassica vegetables and prostate cancer risk: A review of the epidemiological evidence. Nutr. Cancer 42 (1), 1–9. doi: 10.1207/s15327914nc421_1
La Rota, M., Kantety, R. V., Yu, J. K., Sorrells, M. E. (2005). Nonrandom distribution and frequencies of genomic and EST-derived microsatellite markers in rice, wheat, and barley. BMC Genomics 6, 12. doi: 10.1186/1471-2164-6-23
Li, H. T., Chen, X., Yang, Y., Xu, J. S., Gu, J. X., Fu, J., et al. (2011). Development and genetic mapping of microsatellite markers from whole genome shotgun sequences in Brassica oleracea. Mol. Breed. 28 (4), 585–596. doi: 10.1007/s11032-010-9509-y
Li, X. J., Wang, Y. H., Xuan, S. X., Zhao, J. J., Gu, A. X. (2013). Screening of specific SSR markers on different linkage groups of Chinese cabbage compared with cabbage. J. Plant Genet. Resour. 14 (4), 694–698. doi: 10.13430/j
Liang, X. Q., Chen, X. P., Hong, Y. B., Liu, H. Y., Zhou, G. Y., Li, S. X., et al. (2009). Utility of EST-derived SSR in cultivated peanut (Arachis hypogaea L.) and Arachis wild species. BMC Plant Biol. 9, 9. doi: 10.1186/1471-2229-9-35
Liu, K. J., Muse, S. V. (2005). PowerMarker: an integrated analysis environment for genetic marker analysis. Bioinformatics 21 (9), 2128–2129. doi: 10.1093/bioinformatics/bti282
Liu, S. Y., Liu, Y. M., Yang, X. H., Tong, C. B., Edwards, D., Parkin, I. A. P., et al. (2014). The Brassica oleracea genome reveals the asymmetrical evolution of polyploid genomes. Nat. Commun. 5, 11. doi: 10.1038/ncomms4930
Lowe, A. J., Moule, C., Trick, M., Edwards, K. J. (2004). Efficient large-scale development of microsatellites for marker and mapping applications in Brassica crop species. Theor. Appl. Genet. 108 (6), 1103–1112. doi: 10.1007/s00122-003-1522-7
McCouch, S. R., Teytelman, L., Xu, Y. B., Lobos, K. B., Clare, K., Walton, M., et al. (2002). Development and mapping of 2240 new SSR markers for rice (Oryza sativa L.). DNA Res. 9 (6), 199–207. doi: 10.1093/dnares/9.6.199
Nagaharu, U. (1935). Genome analysis in Brassica with special reference to the experimental formation of B. napus and peculiar mode of fertilization. Jpn J. Bot. 7, 389–452.
Panigrahi, J., Kole, P., Kole, C. (2011). RFLP mapping of loci controlling self-incompatibility in Brassica campestris and their comparative mapping with B. napus and B. oleracea. Biol. Plant 55 (1), 54–60. doi: 10.1007/s10535-011-0007-9
Park, Y. H., Alabady, M. S., Ulloa, M., Sickler, B., Wilkins, T. A., Yu, J., et al. (2005). Genetic mapping of new cotton fiber loci using EST-derived microsatellites in an interspecific recombinant inbred line cotton population. Mol. Genet. Genomics 274 (4), 428–441. doi: 10.1007/s00438-005-0037-0
Qin, Z., Wang, Y., Wang, Q., Li, A., Hou, F., Zhang, L. (2015). Evolution analysis of simple sequence repeats in plant genome. PloS One 10 (12), e0144108. doi: 10.1371/journal.pone.0144108
Qu, J. T., Liu, J. (2013). A genome-wide analysis of simple sequence repeats in maize and the development of polymorphism markers from next-generation sequence data. BMC Res. Notes 6, 403. doi: 10.1186/1756-0500-6-403
Rahman, M., Li, G. Y., Schroeder, D., McVetty, P. B. E. (2010). Inheritance of seed coat color genes in Brassica napus (L.) and tagging the genes using SRAP, SCAR and SNP molecular markers. Mol. Breed. 26 (3), 439–453. doi: 10.1007/s11032-009-9384-6
Rezaeizad, A., Wittkop, B., Snowdon, R., Hasan, M., Mohammadi, V., Zali, A., et al. (2011). Identification of QTLs for phenolic compounds in oilseed rape (Brassica napus L.) by association mapping using SSR markers. Euphytica 177 (3), 335–342. doi: 10.1007/s10681-010-0231-y
Sambrook, J., Russell, D. W., Sambrook, J., Russell, D. W. (2001). Molecular cloning: A laboratory manual (New York: Cold Spring Harbor Laboratory Press).
Shi, J., Huang, S., Fu, D., Yu, J., Wang, X., Hua, W., et al. (2013). Evolutionary dynamics of microsatellite distribution in plants: insight from the comparison of sequenced Brassica, Arabidopsis and other angiosperm species. PloS One 8 (3), e59988. doi: 10.1371/journal.pone.0059988
Shi, J. Q., Huang, S. M., Zhan, J. P., Yu, J. Y., Wang, X. F., Hua, W., et al. (2014). Genome-wide microsatellite characterization and marker development in the sequenced Brassica crop species. DNA Res. 21 (1), 53–68. doi: 10.1093/dnares/dst040
Shirasawa, K., Oyama, M., Hirakawa, H., Sato, S., Tabata, S., Fujioka, T., et al. (2011). An EST-SSR linkage map of Raphanus sativus and comparative genomics of the Brassicaceae. DNA Res. 18 (4), 221–232. doi: 10.1093/dnares/dsr013
Shoemaker, R. C., Grant, D., Olson, T., Warren, W. C., Wing, R., Yu, Y., et al. (2008). Microsatellite discovery from BAC end sequences and genetic mapping to anchor the soybean physical and genetic maps. Genome 51 (4), 294–302. doi: 10.1139/g08-010
Sim, S. C., Yu, J. K., Jo, Y. K., Sorrells, M. E., Jung, G. (2009). Transferability of cereal EST-SSR markers to ryegrass. Genome 52 (5), 431–437. doi: 10.1139/g09-019
Song, Q. J., Shi, J. R., Singh, S., Fickus, E. W., Costa, J. M., Lewis, J., et al. (2005). Development and mapping of microsatellite (SSR) markers in wheat. Theor. Appl. Genet. 110 (3), 550–560. doi: 10.1007/s00122-004-1871-x
Song, X. M., Wei, Y. P., Xiao, D., Gong, K., Sun, P. C., Ren, Y. M., et al. (2021). Brassica carinata genome characterization clarifies U's triangle model of evolution and polyploidy in Brassica. Plant Physiol. 186 (1), 388–406. doi: 10.1093/plphys/kiab048
Su, Y. B., Liu, Y. M., Li, Z. S., Fang, Z. Y., Yang, L. M., Zhuang, M., et al. (2015). QTL analysis of head splitting resistance in cabbage (Brassica oleracea L. var. capitata) using SSR and InDel makers based on whole-genome re-sequencing. PloS One 10 (9), 17. doi: 10.1371/journal.pone.0138073
Thakur, A. K., Singh, K. H., Sharma, D., Parmar, N., Mishra, D. C., Singh, L., et al. (2022). Enriching the repertoire of SSR markers of Ethiopian mustard using cross-transferability approach. Plant Physiol. Rep. 27 (1), 65–72. doi: 10.1007/s40502-021-00639-4
Thakur, A. K., Singh, K. H., Singh, L., Nanjundan, J., Khan, Y. J., Singh, D. (2018). SSR marker variations in Brassica species provide in sight into the origin and evolution of Brassica amphidiploids. Hereditas. 155, 6. doi: 10.1186/s41065-017-0041-5
Wang, G. P., Niu, Y., Wang, W. Y., Yue, S. J., Lin, J. R. (2014). Transferability of tomato SSR markers to eggplants and other Solanaceous vegetables. J. South China Agric. Univ. 35 (4), 56–60. doi: 10.3969/mpb.008.000909
Wang, X. W., Wang, H. Z., Wang, J., Sun, R. F., Wu, J., Liu, S. Y., et al. (2011). The genome of the mesopolyploid crop species Brassica rapa. Nat. Genet. 43 (10), 1035–U1157. doi: 10.1038/ng.919
Xu, J. S., Qian, X. J., Wang, X. F., Li, R. Y., Cheng, X. M., Yang, Y. A., et al. (2010). Construction of an integrated genetic linkage map for the A genome of Brassica napus using SSR markers derived from sequenced BACs in B. rapa. BMC Genomics 11, 15. doi: 10.1186/1471-2164-11-594
Keywords: Brassica L, simple sequence repeats, microsatellite, primer development, genomewide, B-genome specific SSR marker
Citation: Sun N, Chen J, Wang Y, Hussain I, Lei N, Ma X, Li W, Liu K, Yu H, Zhao K, Zhao T, Zhang Y and Yu X (2024) Development and utility of SSR markers based on Brassica sp. whole-genome in triangle of U. Front. Plant Sci. 14:1259736. doi: 10.3389/fpls.2023.1259736
Received: 16 July 2023; Accepted: 13 December 2023;
Published: 08 January 2024.
Edited by:
Baohua Wang, Nantong University, ChinaReviewed by:
Zhen Huang, Northwest A&F University, ChinaCopyright © 2024 Sun, Chen, Wang, Hussain, Lei, Ma, Li, Liu, Yu, Zhao, Zhao, Zhang and Yu. This is an open-access article distributed under the terms of the Creative Commons Attribution License (CC BY). The use, distribution or reproduction in other forums is permitted, provided the original author(s) and the copyright owner(s) are credited and that the original publication in this journal is cited, in accordance with accepted academic practice. No use, distribution or reproduction is permitted which does not comply with these terms.
*Correspondence: Xiaolin Yu, eGx5dUB6anUuZWR1LmNu
†These authors have contributed equally to this work
Disclaimer: All claims expressed in this article are solely those of the authors and do not necessarily represent those of their affiliated organizations, or those of the publisher, the editors and the reviewers. Any product that may be evaluated in this article or claim that may be made by its manufacturer is not guaranteed or endorsed by the publisher.
Research integrity at Frontiers
Learn more about the work of our research integrity team to safeguard the quality of each article we publish.