 Mathieu Deblieck
 Frank Ordon
 Albrecht Serfling
94% of researchers rate our articles as excellent or good
Learn more about the work of our research integrity team to safeguard the quality of each article we publish.
Find out more
ORIGINAL RESEARCH article
Front. Plant Sci., 23 October 2023
Sec. Plant Breeding
Volume 14 - 2023 | https://doi.org/10.3389/fpls.2023.1252123
This article is part of the Research TopicTrends and Perspectives for the Use of Crop Wild Relatives in Crop BreedingView all 13 articles
Wheat leaf rust (Puccinia triticina) is one of the most significant fungal diseases of wheat, causing substantial yield losses worldwide. Infestation is currently being reduced by fungicide treatments and mostly vertical resistance. However, these measures often break down when the fungal virulence pattern changes, resulting in a breakdown of vertical resistances. In contrast, the prehaustorial resistance (phr) that occurs in the einkorn–wheat leaf rust interaction is race-independent, characterized by an early defense response of plants during the prehaustorial phase of infestation. Einkorn (Triticum monococcum) is closely related to Triticum urartu as a progenitor of wheat and generally shows a high level of resistance against leaf rust of wheat. Hence, einkorn can serve as a valuable source to improve the level of resistance to the pathogen in future wheat lines. In particular, einkorn accession PI272560 is known to exhibit a hypersensitive prehaustorial effector triggered immune reaction, preventing the infection of P. triticina. Remarkably, this effector-triggered immune reaction turned out to be atypical as it is non-race-specific (horizontal). To genetically dissect the prehaustorial resistance (phr) in PI272560, a biparental F2 population of 182 plants was established after crossing PI272560 with the susceptible T. boeoticum accession 36554. Three genetic maps comprising 2,465 DArT-seq markers were constructed, and a major QTL was detected on chromosome 5A. To locate underlying candidate genes, marker sequences flanking the respective QTL were aligned to the T. urartu reference genome and transcriptome data available from the parental accessions were used. Within the QTL interval of approximately 16.13 million base pairs, the expression of genes under inoculated and non-inoculated conditions was analyzed via a massive analysis of cDNA (MACE). Remarkably, a single gene located 3.4 Mbp from the peak marker within the major QTL was upregulated (20- to 95-fold) after the inoculation in the resistant accession in comparison to the susceptible T. boeoticum accession. This gene belongs to a berberine bridge enzyme-like protein that is suspected to interact on the plant surface with glycoside hydrolases (GH) secreted by the fungus and to induce a hypersensitive defense reaction in the plant after fungal infections.
Wheat leaf rust (Puccinia triticina) belongs to the economically most important obligate biotrophic pathogens of wheat (Bolton et al., 2008a; Bolton et al., 2008b; Kolmer, 2013). It is the causative agent of leaf rust, the most common rust of wheat worldwide reducing number of grains and thousand-grain weight, resulting in yield losses of up to 60% (Bancal et al., 2007; Bolton et al., 2008b; Kolmer, 2013). Uredinia, the typical leaf rust fruiting bodies formed during the asexual life cycle, occur on the upper surface and bottom side of leaves on susceptible wheat cultivars with a diameter of up to 1.5 mm (Kolmer, 2005; Kolmer, 2013). These uredinia harbor dikaryotic uredospores of approximately 20 µm. When the leaf epidermis ruptures, the orange-yellow uredospores are spread by the wind to infect new host plants under favorable conditions (i.e., 10°C to 20°C and high humidity) (Bolton et al., 2008a).
At the beginning of a successful penetration process, uredospores germinate 4 to 8 hours after inoculation (hai) and form a germ tube and an appressorium over stomata cells (Bolton et al., 2008a). Within 12–24 h after the formation of the anppressorium, an infection vesicle is generated, and infection hyphae grow between parenchymal cells and form haustorial mother cells (hmc) on the cell walls of mesophyll cells (Bolton et al., 2008b). Next, 24 h after the formation of an appressoria, haustoria start to develop (Serfling et al., 2016). They penetrate the host cells and generate an extrahaustorial membrane (Bolton et al., 2008b).
Race-specific resistance is known to be effective “posthaustorial”, thus after the formation of haustorial mother cells (Niks, 1988; Niks, 1991). Hypersensitive cell death is triggered by a gene-for-gene recognition of effectors (Ji et al., 2022, Kumar et al., 2021) and is contrary to adult plant resistance (APR) already active at the seedling stage. Moreover, race-specific resistance is vulnerable to breakdown by virulent races, which occurs after a mutation of an elicitor or the interacting resistance gene in the host. More than 100 leaf rust resistance genes (Lr-genes) have been described; however, only a few are carried by cultivars due to linkage drag and undesired agronomic properties (Mapuranga et al., 2022). The lifespan of such vertical/qualitative resistance carried by cultivars was calculated by Mapuranga et al. (2022) at 3 to 5 years. Hence, a horizontal/race-independent resistance that has the character of nonhost resistance to leaf rust as a host-specific pathogen could be more durable. This nonhost–pathogen interaction was exemplarily described for barley—P. triticina (Jafary et al., 2008; Haghdoust et al., 2021) and wheat—Blumeria hordei, P. hordei, and Magnaporthe oryzae (Delventhal et al., 2017). Nonhost interactions result in prehaustorial resistance (phr) and have also been observed in T. monococcum–P. triticina interactions (Serfling et al. 2016; Anker et al. 2001; Anker and Niks, 2001). Various studies have shown a different expression of pathogenesis-related (PR-) genes, peroxidases, chitinases, peroxidases, and beta 1,3 glucanase within the first 24 hai. However, the inheritance of nonhost resistance of T. monococcum to P. triticina has not yet been genetically analyzed.
Triticum monococcum accession PI272560 (Serfling et al., 2016) shows complete and nonhost resistance to six investigated leaf rust (Tables S1A, B) races (Serfling et al., 2016) and one leaf rust race tested by Niks (1991). This resistance was previously identified as a phr in which leaf rust develops few or no haustorial mother cells after infection because their formation is prevented by an effective defense reaction of the plant (Anker et al., 2001). Serfling et al. (2016) indicate an increased level of phenolic substances, peroxidase, and chitinase activity at the site of infection and pathogenesis-related genes in the first 24 hai in comparison to the partially susceptible T. boeoticum accession (36554). These results demonstrate transcriptome alterations and resistance mechanisms in the background of phr in PI272560. However, the genetic background and the inheritance of this resistance were not elucidated up to now. Therefore, this study aims to identify the genomic regions and candidate genes involved in the phr of T. monococcum based on microscopic analysis of fungal development, the defense reaction, and visual rating in a biparental F2 mapping population derived from T. monococcum accession PI272560 and T. boeoticum accession 36554. These investigations are complemented by data from transcriptome analysis by massive analysis of cDNA ends (MACE) of the parental accessions to be mapped into QTL regions.
The T. monococcum accession PI272560 (T. monococcum var. monococcum variety “Ungarn white”) (Anker et al., 2001) and the partially susceptible accession 36554 (T. boeoticum spp. thaoudar var. reuteri, variety “Angora”) (Anker et al., 2001; Serfling et al., 2016) were obtained from the gene bank of the Leibniz Institute of Plant Genetics and Crop Plant Research (IPK, Gatersleben, Germany) and the National Plant Germplasm System (NPGS) of the United States Department of Agriculture (Aberdeen, ID, USA). Einkorn accession 36554 has previously been identified as one of the most susceptible to wheat leaf rust by Lind (2005). After crossing, the resulting F2 seeds were germinated on moist filter paper in petri dishes and transferred to pots with a size of 11 cm × 11 cm (height and width), filled with soil (Archut-Fruhstorfer Erde, HAWITA, Oldenburg Germany). Cultivation was conducted at 80% ± 10% humidity, at 20°C ± 2°C, and at a light intensity higher than 300 ± 15 μmol under daylight conditions (16 h). The resistant accession PI272560 was used as a pollinator. Successful crossing was confirmed in F2 generation by phenotyping and genotyping of seedlings.
Ten-day-old 182 F2 plants were inoculated in a settling tower according to Hoogkamp et al. (1998). For that purpose, 3 mg of uredospores from single-spore isolate wxr77 was applied together with 2 mg of dry powdered clay to the parental accessions. This isolate originated from a collection of Nover and Lehmann (1967) (Serfling et al., 2016). Isolate wxr77 was also used for the inoculation of F2 progenies. Uredospores were multiplicated on leaves of the wheat variety Borenos. Then, 72 hai, fungal structures were stained with Calcofluor White M2R (Sigma Aldrich Chemie GmbH. Taufkirchen, Germany) as described by Rohringer (1977). Pictures were taken using an Axioskop 50 microscope and an Axiocam MRc camera connected to the software package Axiovision 4 (Carl Zeiss AG, Jena, Germany), using the filter set 02 (excitation filter G 365, beam splitter FT 395, and barrier filter LP 420). Autofluorescence of plant tissue was recorded using the filter set 05 (excitation filter BP 400-440, beam splitter FT 460, barrier filter LP 470) according to Serfling et al. (2016).
Three leaf segments from the middle of the third youngest leaf were taken for microscopic analysis. Ten infection sites were examined microscopically on three leaf segments per genotype so that haustorial mother cells from a total of 30 infection sites were analyzed at 48 and 72 hai. To assess the generation of uredospore pustules in relation to the investigated leaf area, pictures were taken using a stereo microscope (Stemi, 2000; Carl Zeiss, Jena, Germany) in combination with the digital camera Axiocam MRc and its software package Axiovision 4 (Carl Zeiss AG, Jena). Ten days after inoculation (dai) when the generation of uredospore pustules on the leaves was completed, macroscopic infection resistance was estimated according to McIntosh et al. (1995). This rating system allows the classification as “immune” (rated as “0”), “very resistant” (rated as “;”), “resistant” (rated as “1”), “moderately resistant” (rated as “2”), “moderately resistant to moderately susceptible” (rated as “3”), and “susceptible” (rated as “4”) in resistance testing of wheat to leaf rust. The letter “N” has been used to indicate a high degree of necrosis on leaves. However, in order to be able to calculate rating data for QTL analyses, the ratings were changed as follows: 0 (0),;, 1 (1, N), 2 (2), 3 (3), 4 (4).
About 1 µg of purified DNA from leaf samples of each F2 plant was extracted according to Stein et al. (2001) and sent to the Diversity Arrays Technology (DArT) Lab (Bruce, Australia, https://www.diversityarrays.com/) for DArT-seq analysis (https://www.diversityarrays.com/services/dartseq/). DArT-seq is an efficient genotyping-by-sequencing platform, based on restriction enzyme-mediated genome complexity reduction and sequencing of the restriction fragments (Edet et al., 2018). Codominant DArT-seq SNP markers were scored with a “0” (reference allele homozygote), “1” (SNP allele homozygote), and “2” (heterozygote: presence of both reference and SNP alleles), while dominant DArT-seq markers were scored in a binary fashion, with “1” and “0” representing presence or absence variation (PAV) of the restriction fragment with the marker sequence (Kilian et al., 2012). For the selection of markers, grouping, and construction of the genetic map, JoinMap (Van Ooijen, 2006) was applied. Monomorphic markers were removed. Subsequently, data files were converted into an “abh” matrix (codominant DArT markers), “db” matrix (SNP alleles from maternal parent 36554) and an “ac” matrix (SNP alleles from paternal parent PI272560).
All markers were analyzed for their goodness of fit to the appropriate expected segregation ratios (1:2:1, 1:3, or 3:1) using the chi-square (χ2) test (Olivera et al., 2013). All segregations showing a significant χ2 test at a level of 0.05, where the threshold for one degree of freedom (df) was 2.7 (ac; bd matrix) and that for 2 df was 4.59 (abh matrix), were excluded. Markers with >10% missing information and a significant segregation distortion (alpha 0.05) were removed. To avoid repulsion effects of dominant and codominant markers, different strategies were developed to cope with this issue (Knapp et al., 1995; Peng et al., 2000; Mester et al., 2003). Therefore, three different genetic maps were constructed according to Edet et al. (2018), that is, for codominant and dominant DArT-seq markers, respectively. Linkage groups were generated based on the population node at a stringency of the threshold value that enabled the formation of seven groups according to the number of chromosomes. Genetic distances were calculated according to Kosambi (1943). By applying a standard BLASTN search against the T. urartu genome according to Ling et al. (2018), unique positions of the DArT-Seq markers on the corresponding chromosomes were identified. Markers that could not be grouped into chromosomes by the Joinmap function “Group” were excluded from further analysis. In case that the orientation in maps was not the same after comparison of physical and genetic positions, the orientation of the corresponding linkage group was swapped.
Before QTL detection, phenotypic data were prepared as follows: Outliers were filtered out, if they were higher or lower than plus or minus three times the standard deviation of the mean. Then, quantile–quantile (QQ) plots were created to remove non-normal distributed data at the QQ plot residuals manually. Shapiro–Wilk tests (SW-tests, Shapiro and Wilk, 1965) were applied to confirm normal distribution. Abnormally distributed data were (log-) transformed, if possible. In that, the transformed visual rating scale nomenclature (McIntosh et al., 1995) was used for QTL analysis. Finally, a single-trait QTL simple interval mapping (SIM) analysis was conducted with MapQTL 5.0 by interval mapping (Van Ooijen, 2006; Kyazma, Wageningen, Netherlands).
To detect the respective thresholds of statistically significant LOD scores, permutation tests (1,000 repeats) were applied as previously described by Van Ooijen, 2006. Level of significance is needed to prove a QTL, and a relative cumulative count of 1 − 0.05 = 0.95 according to a p-value of 0.05 was used. Results from a MACE data of accessions PI272560 and 36554 8 hai, 16 hai, and 24 hai and a control variant without any inoculation (Serfling et al., 2016) were used to improve candidate gene identification. These MACE data comprised sequence tags of PI272560 and Tb36554 samples obtained 8 hai, 16 hai, and 24 hai with leaf rust isolate wxr77. MACE data from 8 hai, 16 hai, and 24 hai and in parallel data of the non-inoculated control samples were available (Serfling et al., 2016). To detect differences of the expression between the parental accessions, the relative expression values (REVs) of each MACE tag were calculated as follows.
By dividing the number of a MACE tag within a specific sample through the sample’s total MACE number, the sampling effect was eliminated (Serfling et al., 2016). REV1 describes the relative expression of a specific MACE tag of PI272560 vs. Tb36554, while REV2—vice versa—describes the relative expression of a specific MACE tag of Tb36554 vs. PI272560 at the same time segment and the same variant (inoculated or not inoculated). Since REV1< 1 values equal to REV2< −1 and REV2 values > −1 equal to REV1 > 1, only REV1 > 1 and REV2< −1 were considered. To anchor the MACE tags to the T. urartu genome (taxid 4572), a MEGABLAST (Morgulis et al., 2008) search against all T. urartu genes was applied with an exception cutoff of 0.001 (E-value). Finally, based on scores for homology, the best BLAST-hit of each MACE was considered, if the percentage identity scores were above 95% and matched a gene on the T. urartu chromosome 5A (Ling et al., 2018).
After crossing PI272560 and the partially susceptible 36554, 182 F2 plants were genotyped using the DArT-seq array based on Jing et al. (2009). Out of 2,138 dominant markers and 7,984 codominant markers, after excluding monomorphic, as well as non-grouped markers and markers showing minor allele frequency<5% or a high number of missing data, 2,465 markers were included in three genetic maps. One map contains codominant SNP markers and two maps contain dominant markers for both parental alleles. The three different genetic maps have a size of 1,341.45, 945.29, and 1,046.52 cM (Table 1).
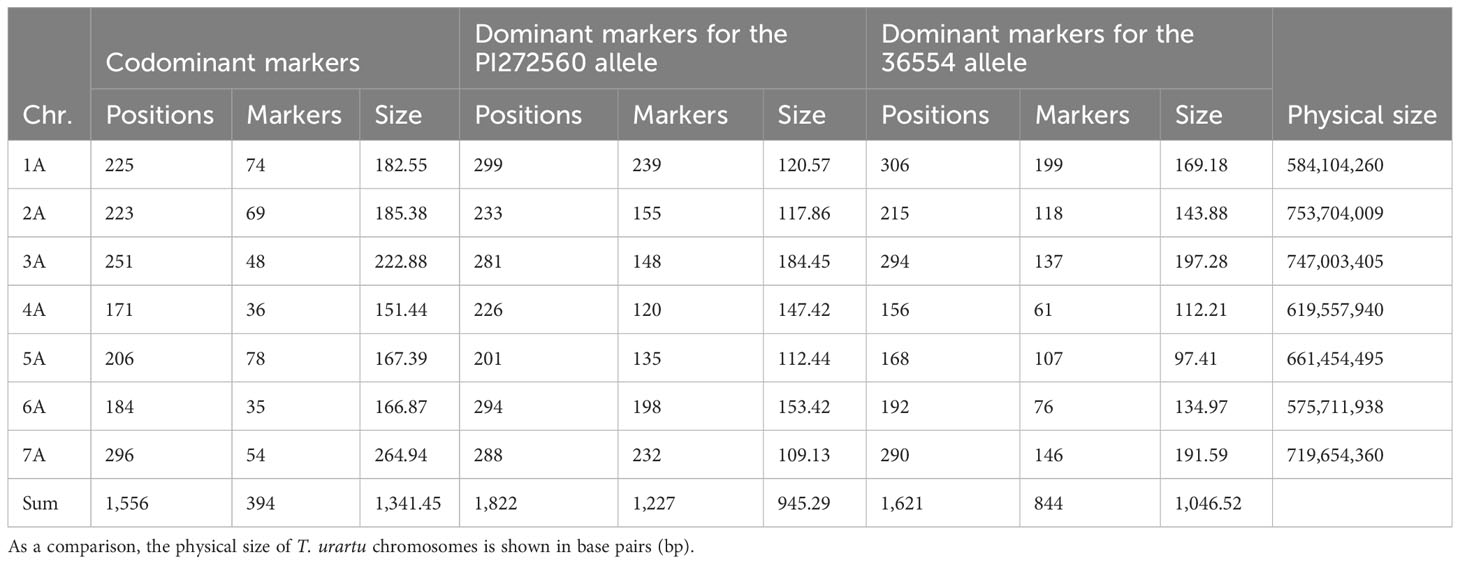
Table 1 Distribution, positions, and number of markers of mapped DArT-seq markers within the three genetic maps (size is shown in cM) for dominant and codominant markers, respectively.
Furthermore, the sequenced T. urartu genome (Ling et al., 2018) was used to anchor the DArT-seq markers to base pair positions of the respective physical chromosomes (pseudomolecules). In general, the arrangement of markers in the genetic and physical maps was comparable. However, in a few cases, the chronology of markers differed, e.g., at the tips of the chromosomes or inside inverted chromosome fragments. The respective genetic maps, phenotypic data, and QTL LOD values along the chromosomes are summarized in Table S2.
After carrying out the SW-test, it became apparent that neither hmc data (48 hai and 72 hai) nor visual rating data (Table S3) are normally distributed, but right skewed. While a (log-) transformation to normal distribution succeeded to transform the 48 hai hmc data to normal distribution, the hmc data (72 hai) and macroscopic data remained non-normally distributed (Figure 1, Table 2). According to previous studies (Serfling et al., 2016), generation of hmc 48 hai differed in the amount of counted uredospore pustules per mm² in leaf tissue between 0.35 ± 0.17 of PI272560 and 2.54 ± 0.64 (36554) and 72 hai between 0.53 ± 0.05 and 11.38 ± 1.99. Seven days after the inoculation, the parental line PI272560 did not show any colonies whereas line 36554 showed 0.39 ± 0.06 uredospore pustules per mm². Phenotypes of the F2 population ranged between 0.18 and 8.67 hmc (48 hai), 0.87 and 16.83 hmc (72 hai), and from complete resistant (rated as “0”) to most susceptible phenotypes rated as “2”.
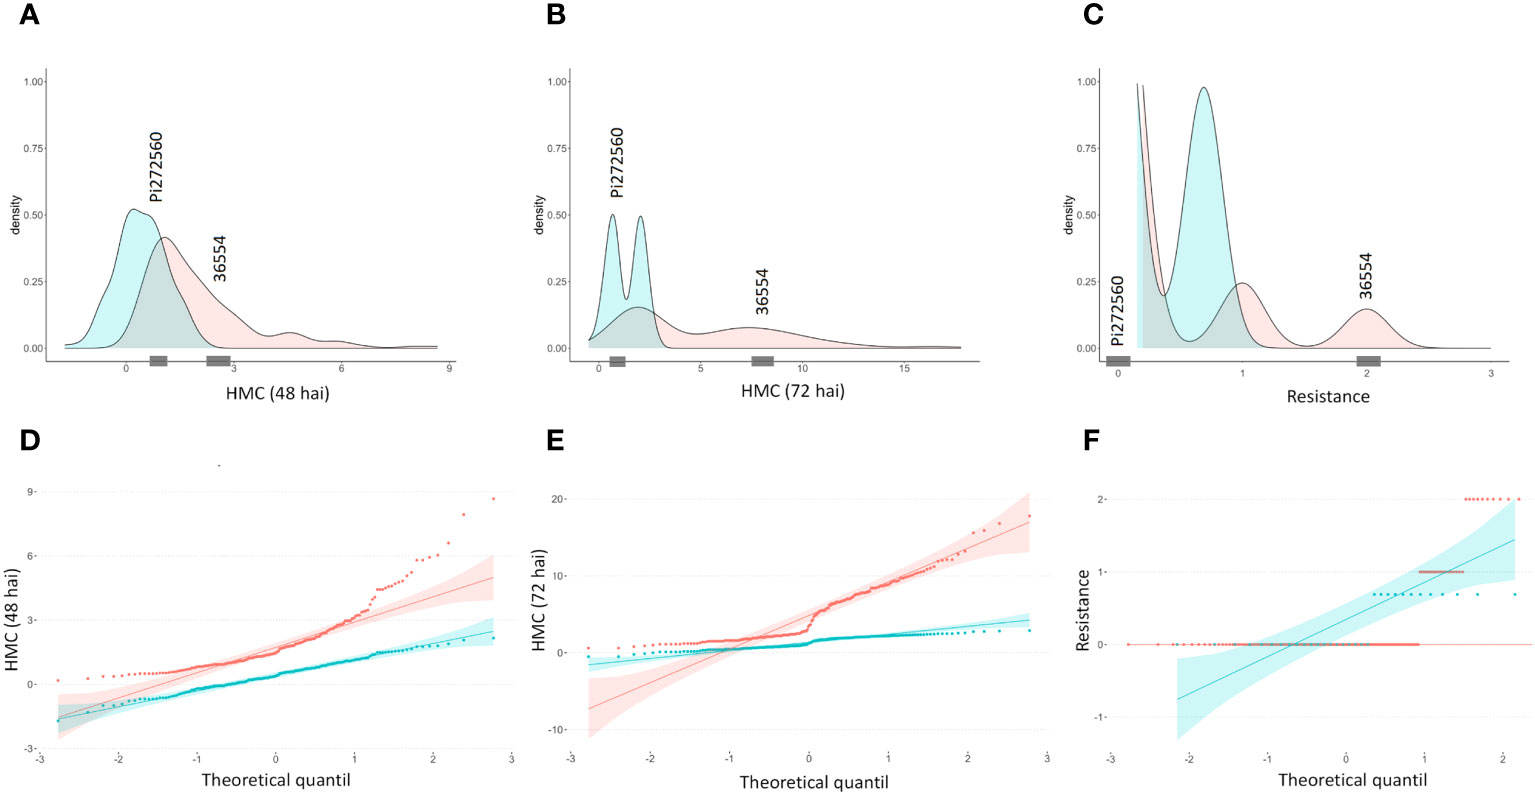
Figure 1 Density plots and quantile–quantile plots of microscopically counted haustorial mother cells 48 and 72 hai and macroscopic resistance data. Macroscopic resistance data were obtained 10 days after inoculation (dai) after the generation of uredospore pustules. Original and (log-)transformed data are colored in blue and red, respectively. From 182 F2 genotypes, the distribution of the haustorial mother cell number (A) 48 h, (B) 72 h, visual rating, and (C) 10 days after the inoculation is shown. Quantile-quantile plots of HMC data (D) 48 hai, (E) 72 hai and (F) rating data 10 dai. Observed hmc and rating values of the parental lines are represented on the x-axis by gray markings.
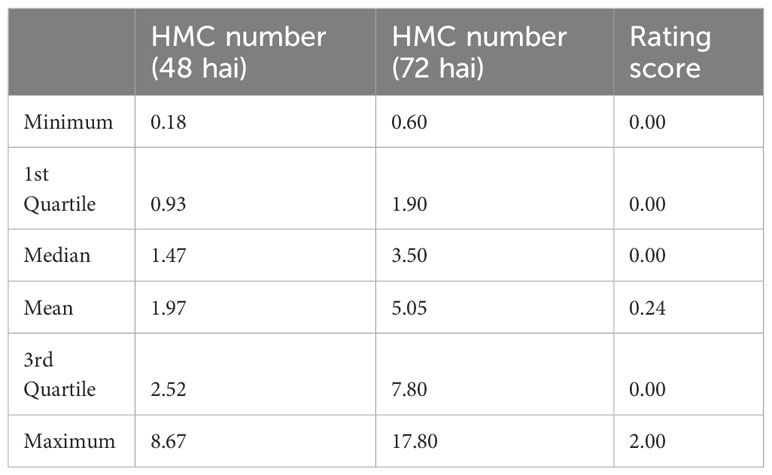
Table 2 Distribution of the haustorial mother cell number (hmc) and the rating score within the F2 mapping population 48 h after inoculation (hai), 72 hai, and after 10 days.
None of the three different phenotypic datasets correlate significantly (α = 0.01, 0.05, Spearman test) (Table 3). However, analysis of visual rating and hmc data at 72 hai led to the identification of a single QTL on chromosome 5A in two of the three genetic maps with a LOD value of 12.6 (hmc 72 hai) and 4.6 after processing visual rating (Table 4). Aligning the flanking and peak markers of these QTLs (Table 4) to the T. urartu reference genome revealed that both the hmc (72 hai) and rating-based QTL are located within the same physical interval in the T. urartu reference genome (Table 4). Both QTLs show the same peak with the SNP marker SNP_1364455 at the tip of the QTL (Table 4 and Table S2). Almost all (49 of 50) F2 genotypes showing the PI272560 allele were rated as completely resistant, whereas plants being heterozygous or homozygous for the 36554 allele harbor a considerably higher fraction of susceptible (rating 2 or 3) F2 plants (Figure 2).
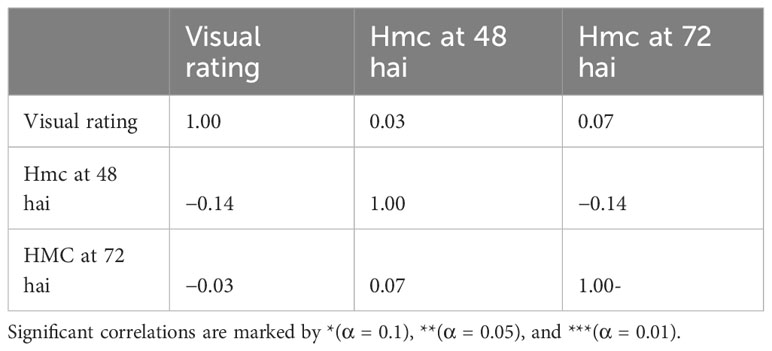
Table 3 Pearson correlation between rating data, haustorial mother cell (hmc) generation at 48 hai and at 72 hai.
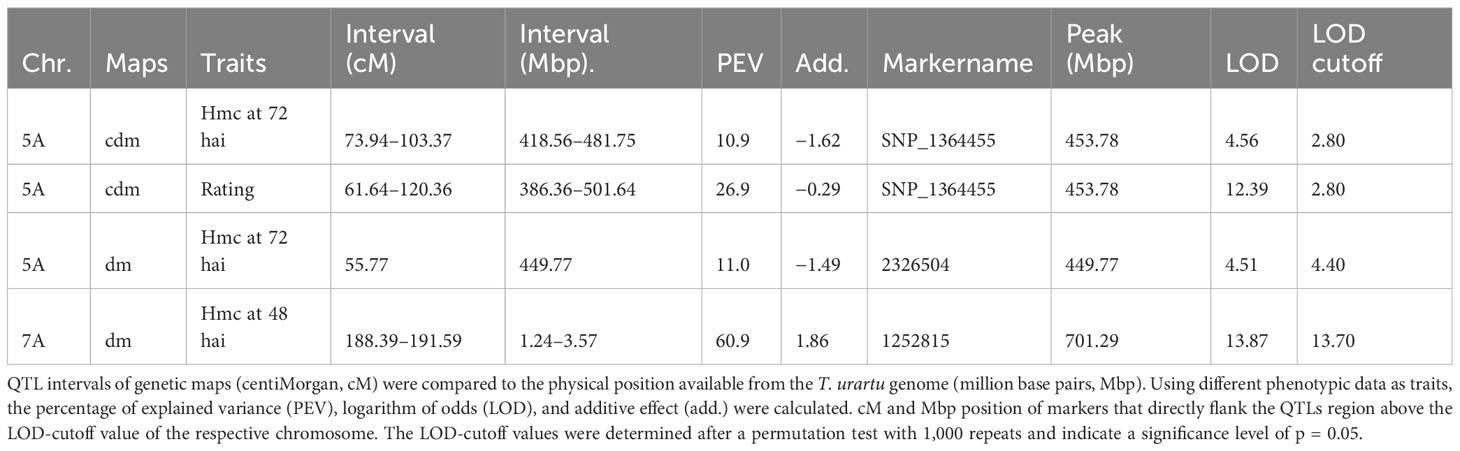
Table 4 QTL regions on chromosomes (chr.) 5A and 7A based on genetic maps calculated with dominant markers (dm) and codominant markers (cdm).
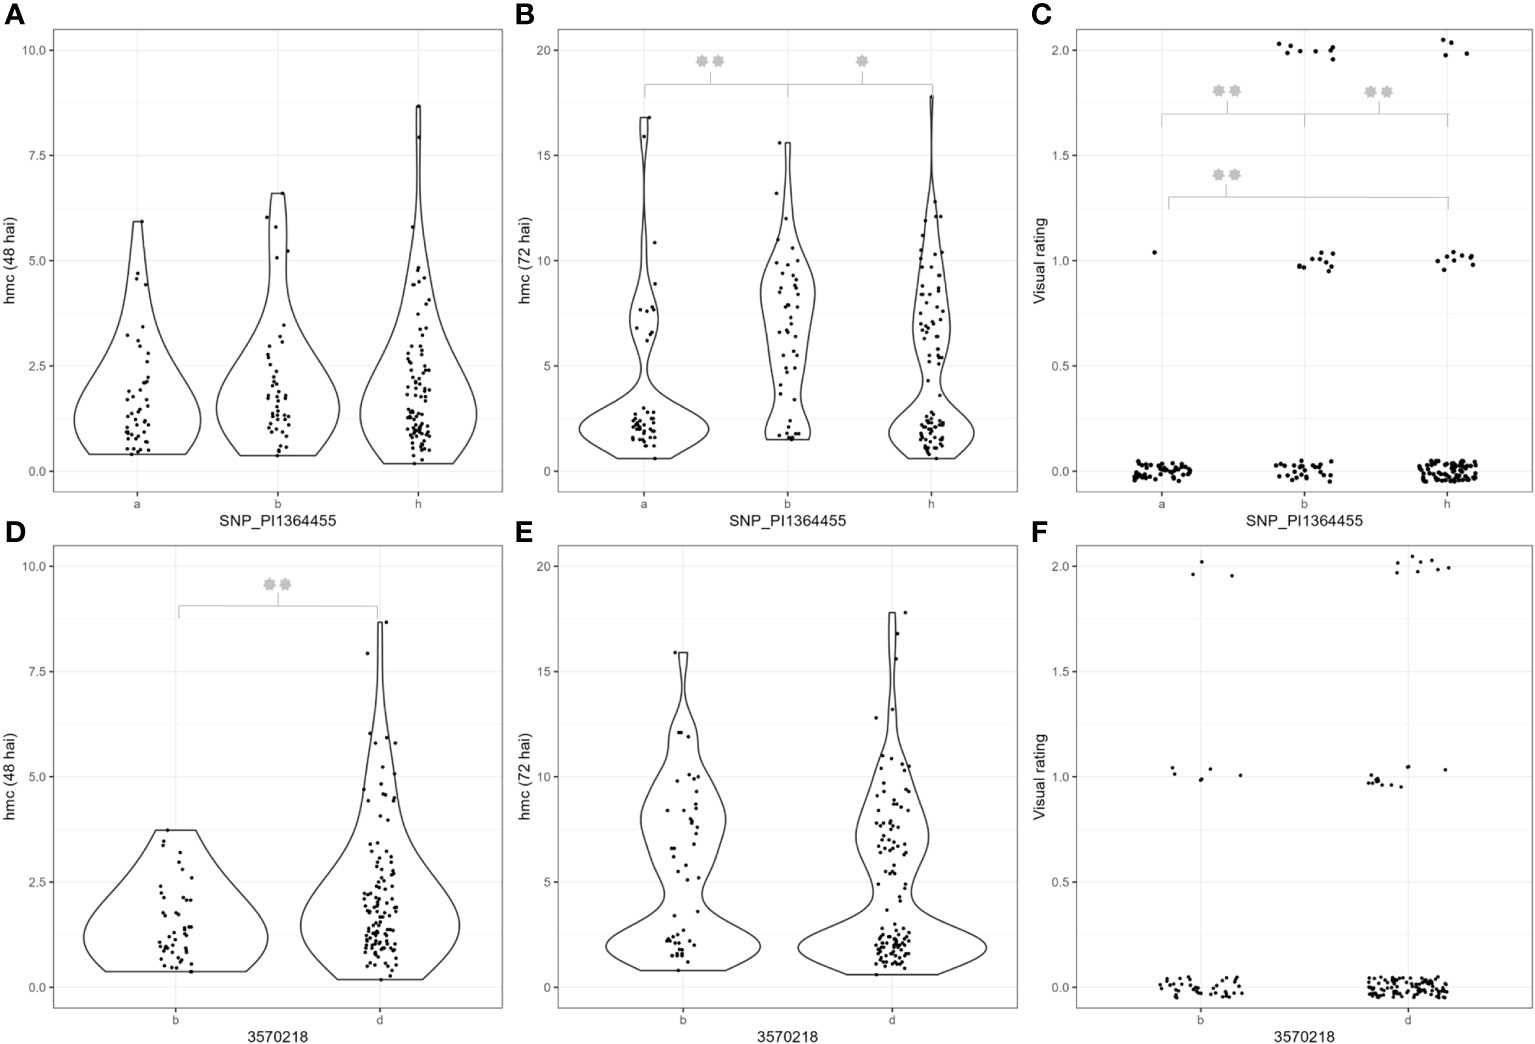
Figure 2 Phenotypic data of genotypes carrying different alleles of the SNP_PI1364455 and 3570218 markers. Hmc = Haustorial mother cells. The “a” and “b” alleles represent genotypes that are homozygous for the PI272560 or Tb36554 allele. “h” represents heterozygous genotypes. (A, D) Haustorial mother cell data 48 hai, (B, E) haustorial mother cell data 72 hai, and (C, F) resistance data. Significant differences between the respective subgroups were calculated with a two-tailed independent t-test. p-values ≤ 0.05 or 0.01 were marked with one or two stars, respectively.
Complete resistance only occurs in genotypes homozygous for the PI272560 allele (Figure 2). Nevertheless, a positive effect of the PI272560 allele can be detected in heterozygous genotypes as they are significantly more resistant than genotypes homozygous for the 36554 allele (χ2 test, p-value = 0.003). However, notably, genotypes being homozygous for the allele of the susceptible parent 36554 were not completely susceptible. Figures 2A–C illustrate that the PI272560 allele of SNP_1364455 is associated with a lower amount of HMC 72 hai and a significantly reduced or even absent infestation 10 dpi.
Furthermore, a possible minor QTL just above the significance threshold could be detected on chromosome 7A at 48 hai (Table 4). According to a χ2 test, F2 plants carrying the 36554 allele of the respective peak marker 3570218 show a minor reduction of hmc compared to genotypes carrying the 36554 allele. However, no differences could be detected at 72 hai and visual rating after 10 days (Figures 2D–F).
Independent from the different genetic maps, DArT-seq markers in general show the same order on chromosome 5A compared to the T. urartu genome. Furthermore, both QTL for rating data and the number of hmc at 72 hai between the flanking markers colocalize within the same physical region (Figure 3; Table 4).
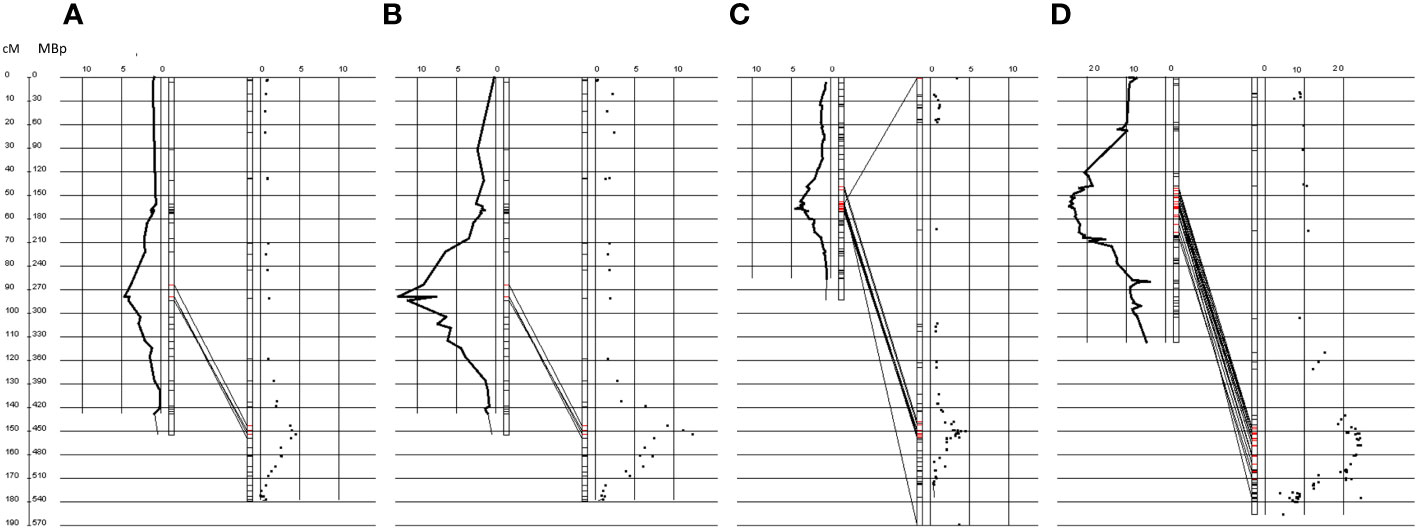
Figure 3 QTL for hmc (72 hai) data and resistance rated in the codominant SNPs and dominant genetic map on genetic and physical scale on chromosome 5A. Million base pair (Mbp) positions according to the sequenced T. urartu genome (Ling et al., 2018) are illustrated to the right side. Genetic positions of the codominant and dominant maps are illustrated to the left. Logarithm of odds (LOD) values were plotted along the chromosomes on both sides. (A, B) illustrate the QTLs mapped along the genetic map that was constructed with codominant markers. (C, D) illustrate maps that were constructed with markers that were dominant for the PI272560 or Tb36554 allele. (A, C) show QTLs that were obtained with macroscopic resistance data after the generation of uredospore pustules (for more details, see text). (B, D) illustrate QTLs that were obtained with haustorial mother cell data 72 hai (for more details, see text). Red markers indicate the presence of significant QTL LOD values, according to a permutation test (alpha = 0.05). All QTLs colocalize within the same physical region. Illustrations were created with the software GenoTypeMapper (Deblieck et al., 2020).
After a permutation test at a level of α = 0.05, 729 genes (Ling et al., 2018) could be located based on their physical position within the QTL (trait hmc at 72 hai) on Chromosome 5A, ranging from 418.56 to 481.75 Mbp (Table 4, Table S4). Increasing the significance level from 0.950 to 0.999, the QTL region could be narrowed down to 10.6 Mbp., ranging from 443.16 to 453.78 Mbp. Within this region, the order of markers did not perfectly match the order of the physical T. urartu genome (Figure 3; Table S5). Therefore, based on the marker order in the genetic map, the size of the interval was increased to a region between 443.16 and 459.30 Mbp, comprising 217 genes (Ling et al., 2018; Table S4). MACE tags could be anchored to 117 of them.
Out of these 117 genes, 11 genes are exclusively expressed in PI272560 and 12 genes are expressed only in accession 36554 (Table 5). Overall, five of these genes are known to be involved in resistance reactions to fungal pathogens (Table 5).
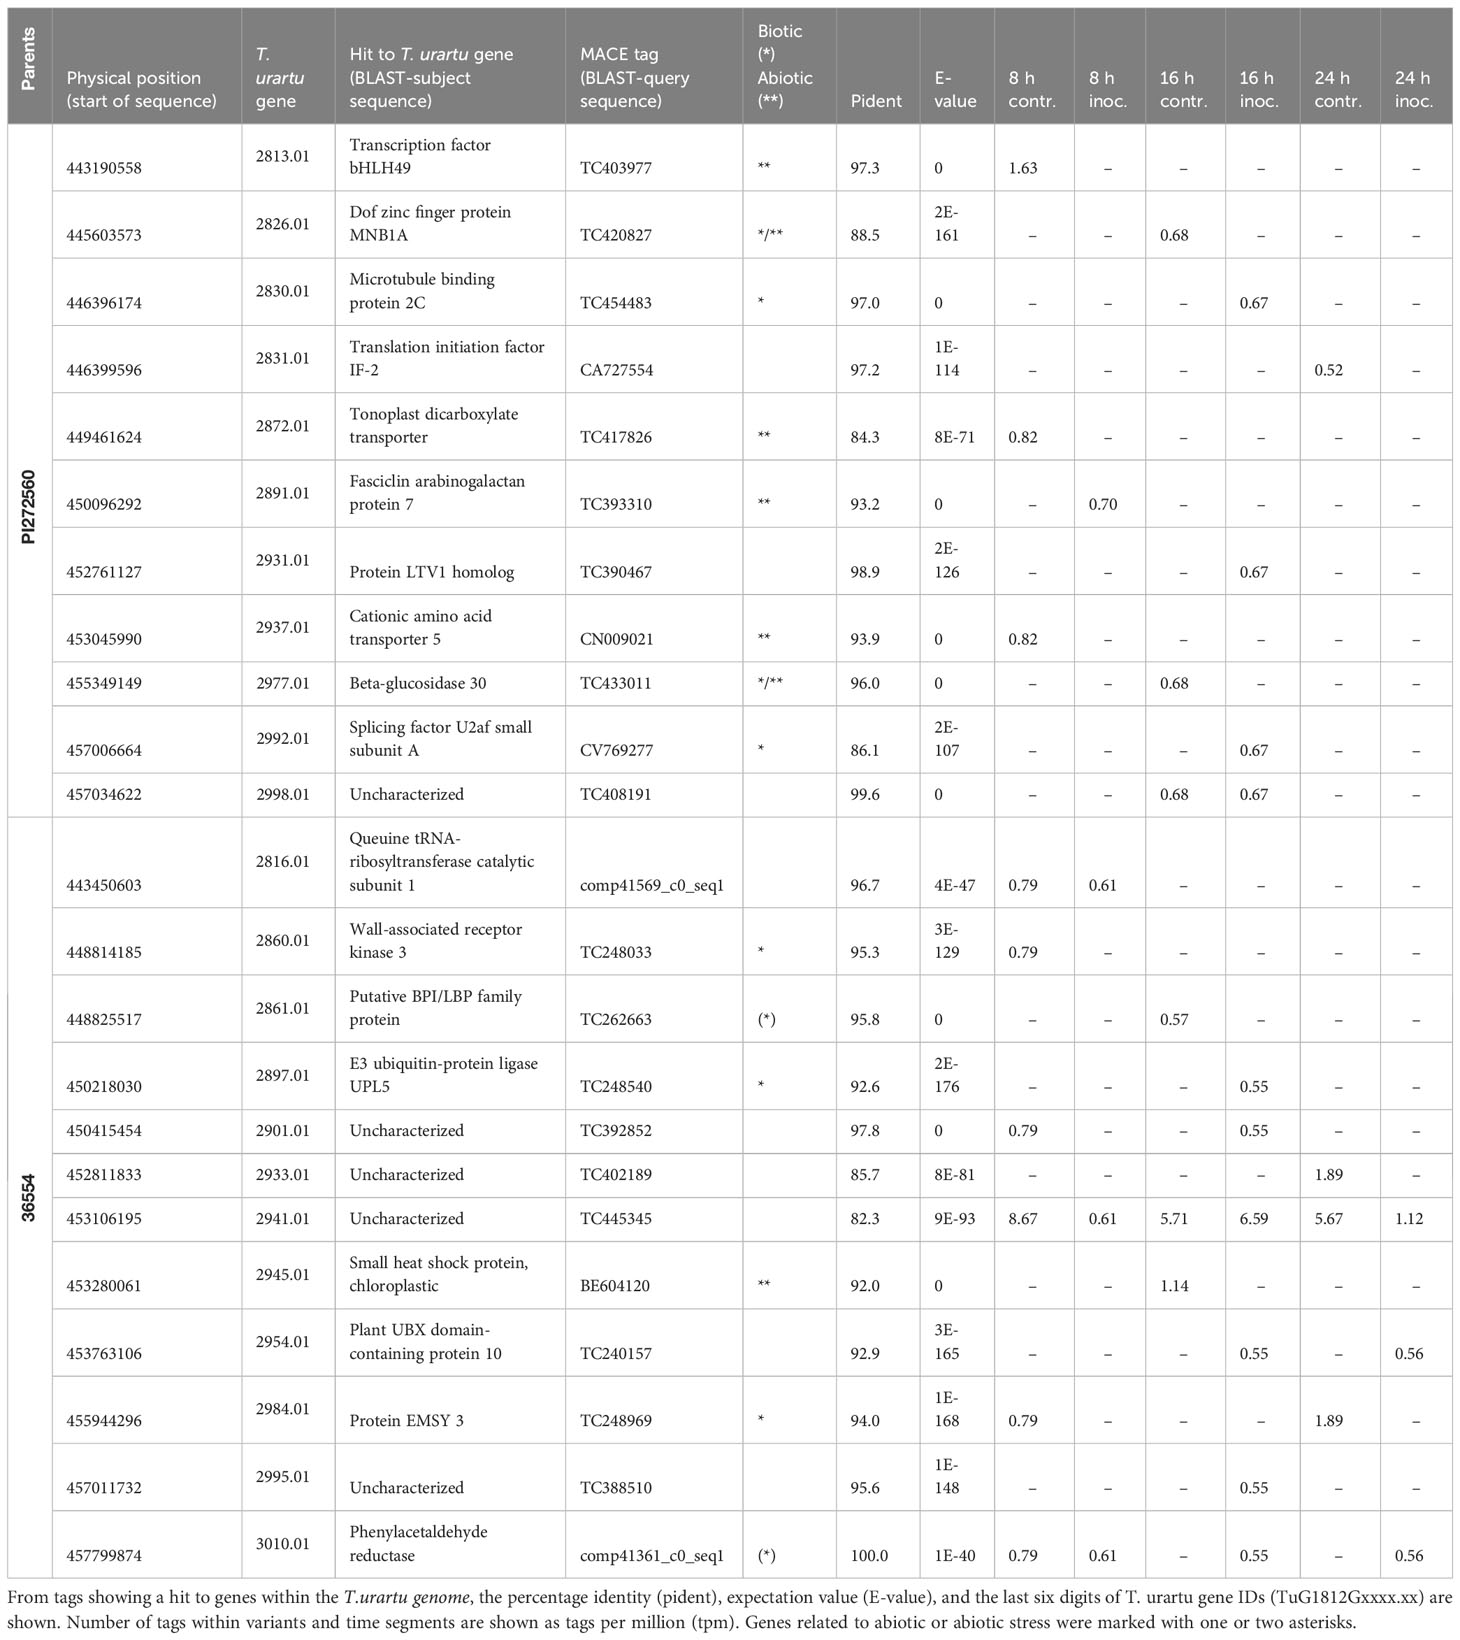
Table 5 Exclusively expressed tags in parents PI272560 and 36554 that could be anchored within the narrowed down QTL region on chromosome 5A.
Finally, differentially expressed MACE and their underlying genes were examined. For this purpose, the three MACE with the highest or lowest REV1 and REV2 values were identified 8–24 hai in inoculated and non-inoculated samples and summarized in Table 6: 8 and 14 MACE tags were quantitatively upregulated in 36554 and PI272560, respectively (Table 6; Figure 4).
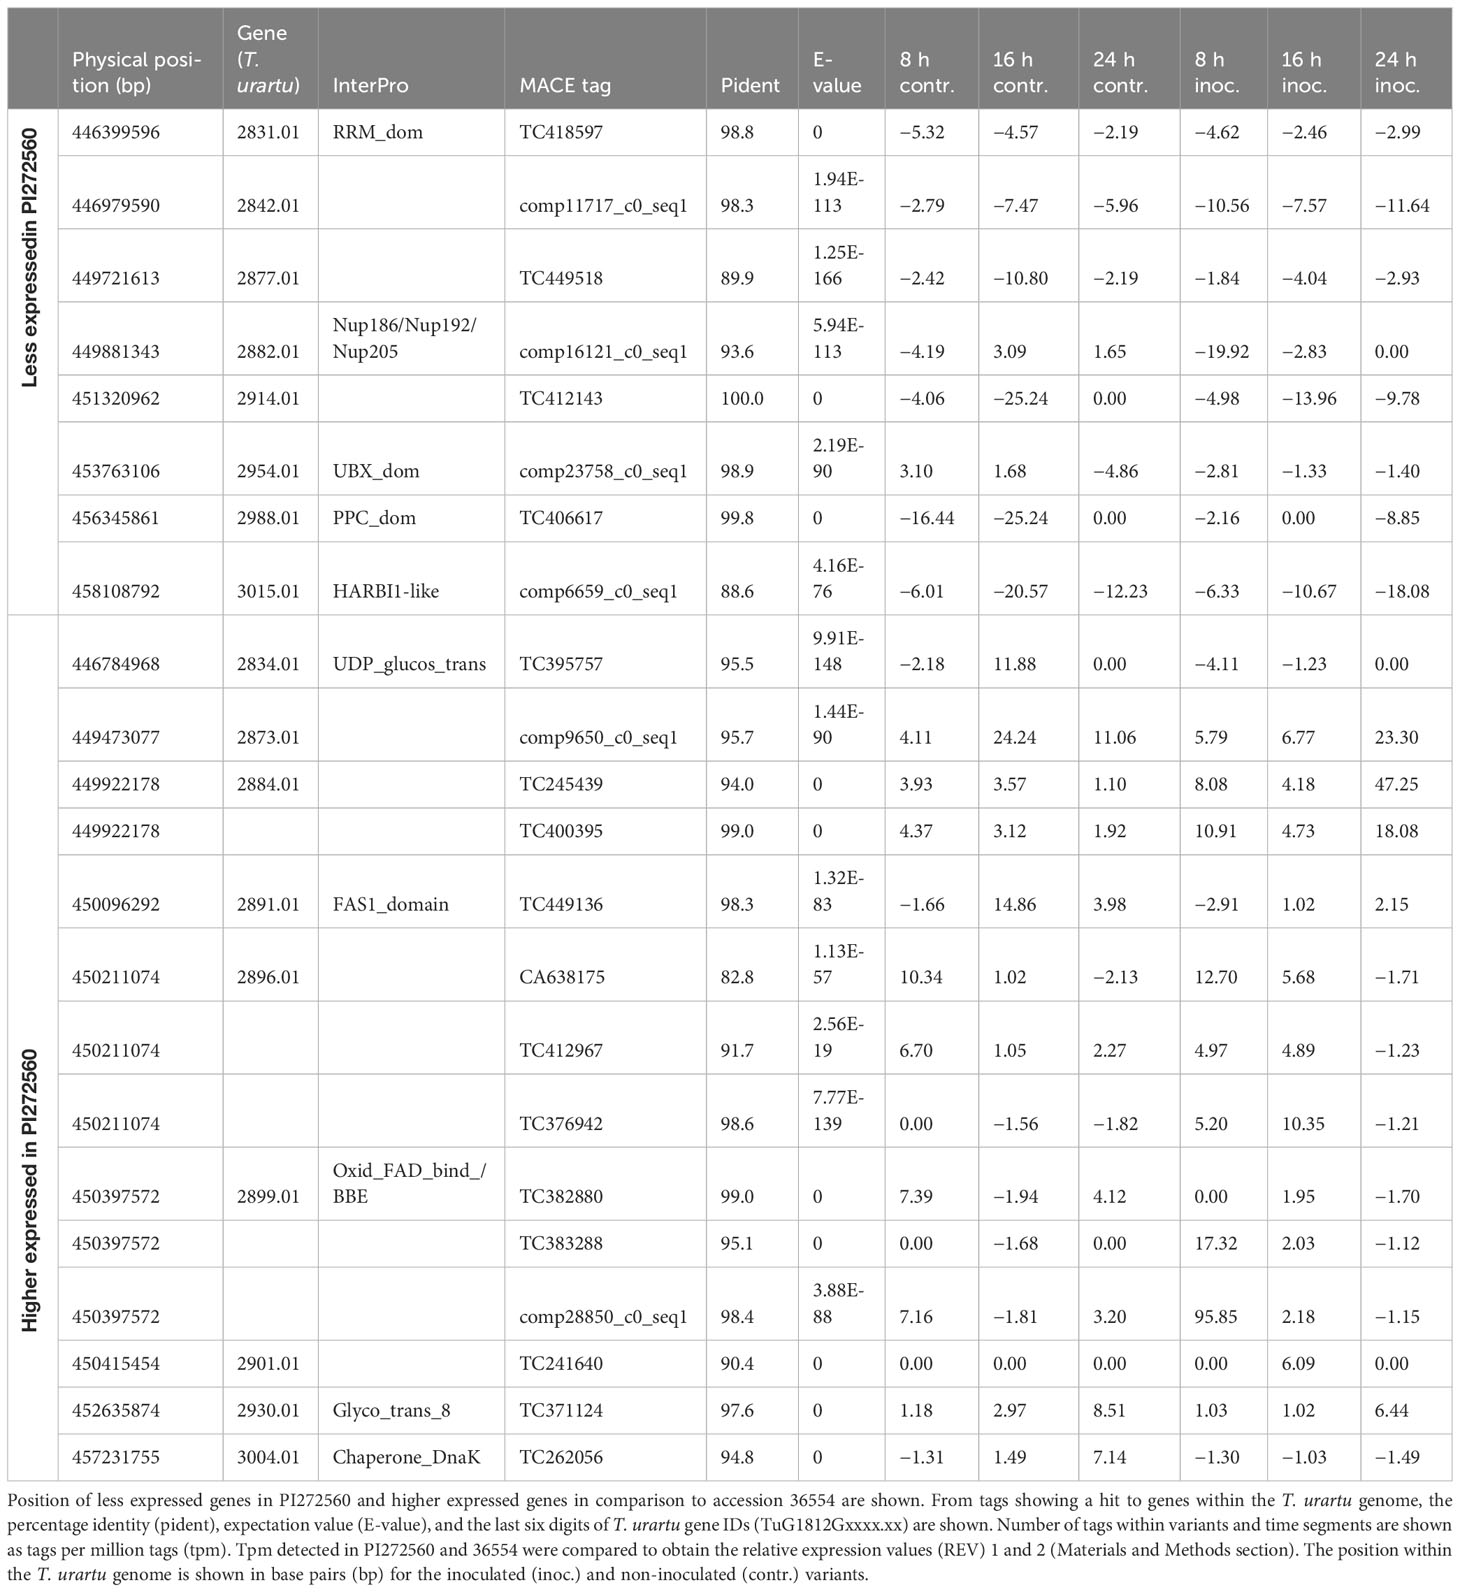
Table 6 Differentially expressed genes 8, 16, and 24 hai within the QTL interval on chromosome 5A.
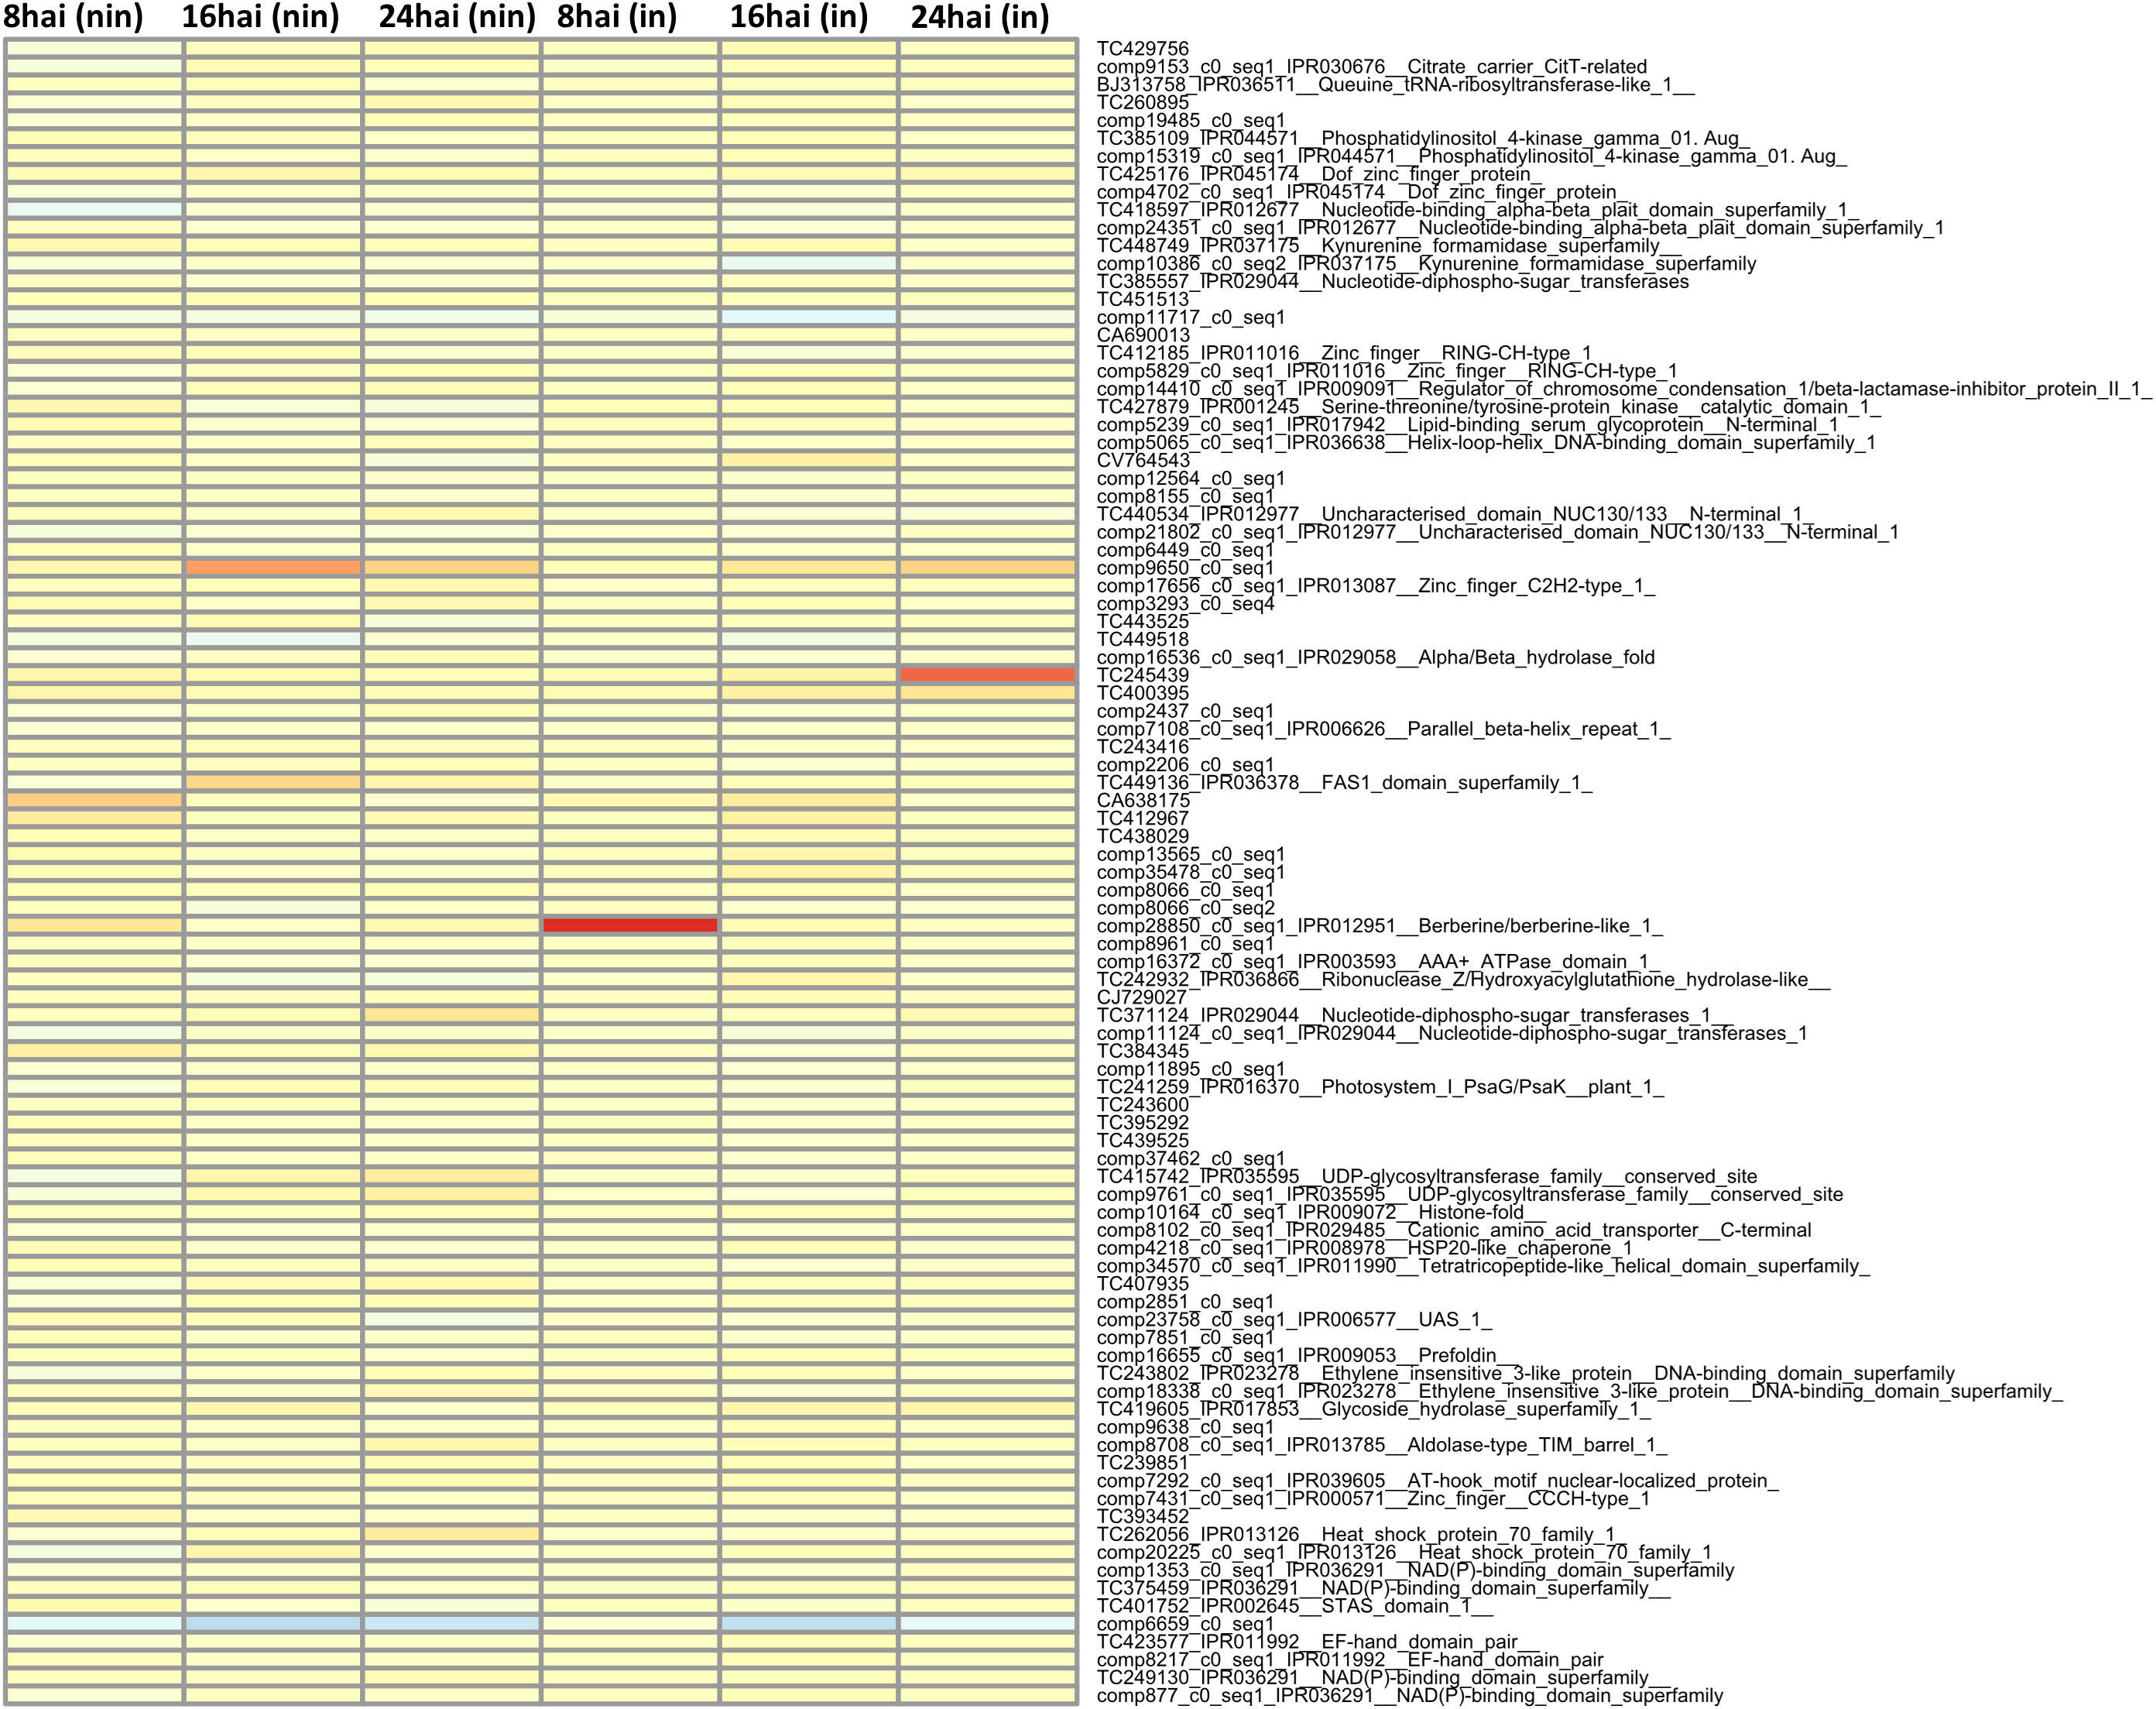
Figure 4 Heatmap of the most differentially expressed genes between PI272560 and 36554 in non-inoculated (columns from left to right) and inoculated variants at 8, 16, 24 hai. The number of tags per million (tpm) between PI272560 and 36554 for the same tags was compared according to the REV1 and REV2 equations. High and low expression values were colored in red and blue. For more detailed information about the REV1/REV2 values and anchoring of the MACE-tags to the genes, see the Materials and Methods section. Only MACE with complete expression information, i.e., under inoculated and non-inoculated conditions and at all time points, were considered.
Notably, one gene (TuG1812G0500002899), encoding a berberine bridge enzyme (BBE)-like Cyn d 4, showed a 95 times higher expression at 8 hai in PI272560 than in 36554. This gene is located exactly at the peak of the QTL on chromosome 5A at 450.397 Mbp, close to the marker SNP_1364455 (Table 6, Figures 3, 5). On a whole transcriptome level, the gene coding for a berberine bridge enzyme-like was one of the highest upregulated genes in PI272560 after inoculation in comparison to 36554 (Figures 5, 6; Table S6). Figures 5 and 6 illustrate the relative expression of MACE tags along chromosome 5A (Ling et al., 2018) and within the MACE data.
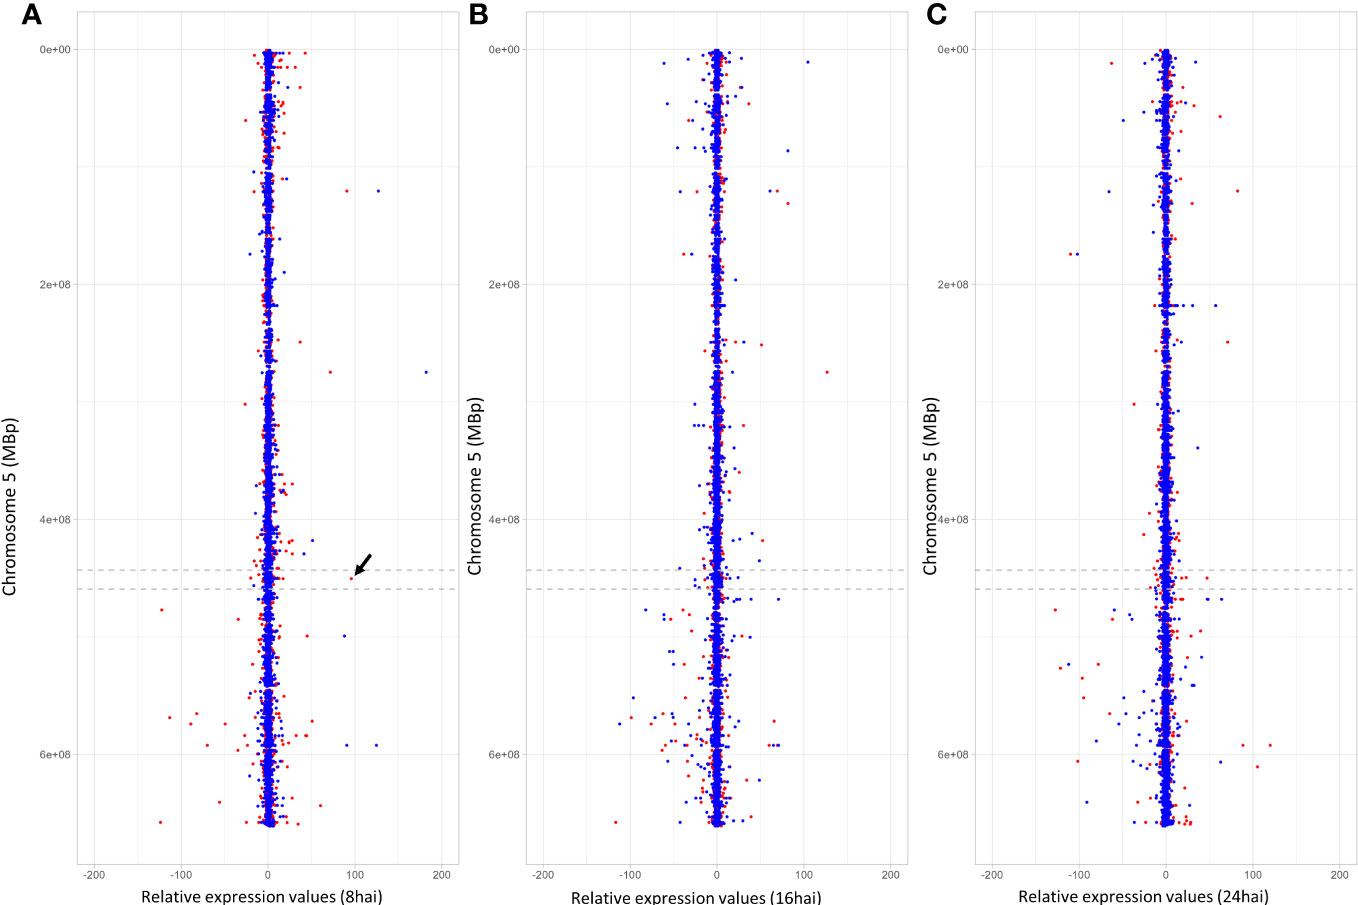
Figure 5 MACE expression values on chromosome 5A. Relative expression values and positions of the MACE on chromosome 5A are illustrated on the x- and y-axes. Blue and red dots represent expression values (REV), obtained under non-inoculated conditions and inoculated conditions. They describe the x fold expression of a MACE relative to the resistant PI272560 and were calculated according to the REV1 and REV2 equations (for more details, see text). Negative relative expression values indicate a stronger expression of the MACE tag in 36554, whereas positive values indicate a stronger expression in the resistant parent PI272560. (A–C) illustrate the relative expression values that were calculated for the MACE 8 hai, 16 hai and 24 hai, respectively. The arrow between the dashed lines indicates the position of the MACE with the highest differential expression in the QTL interval on chromosome 5A. This MACE tag belongs to a Berberine bridge enzyme (BBE) and is 95-fold higher expressed in the resistant accession PI272560 8 hai.
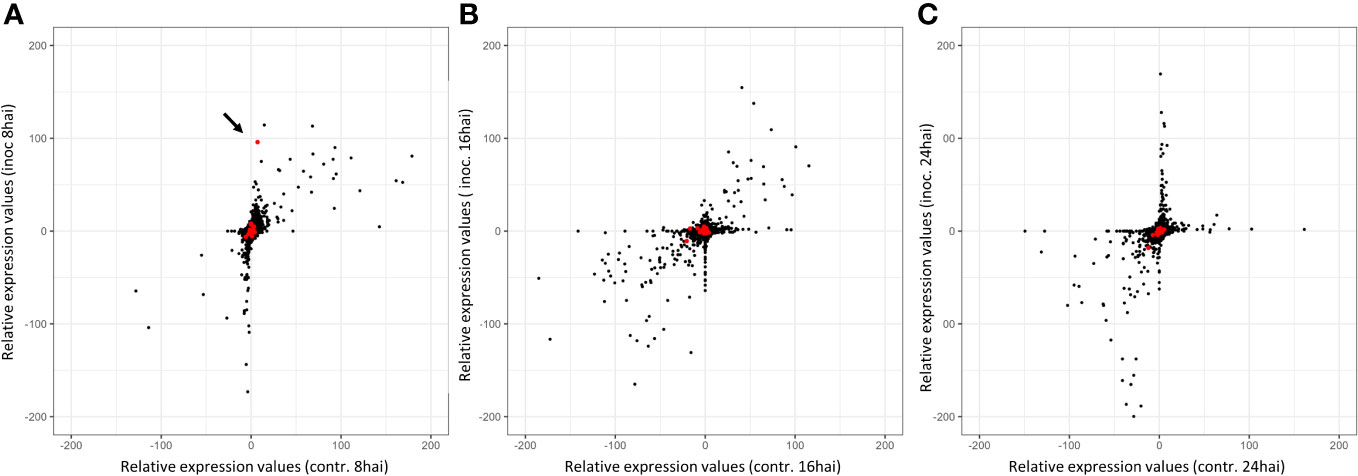
Figure 6 Relative expression values of MACE tags in inoculated and non-inoculated samples 8, 16, and 24 hai. Inoc = Inoculated, contr. = non-inoculated control samples. The number of tags per million (tpm) between PI272560 and 36554 for the same tags was compared (according to the REV1 and REV2 equations). Therefore, negative relative expression values indicate a stronger expression of the MACE tag in the parent 36554, whereas positive values indicate a stronger expression in the resistant parent PI272560. Red dots indicate the MACE of the genes within the QTL interval on chromosome five. Relative expression values were illustrated (A) 8 hai, (B)16 hai, and (C) 24 hai. The arrow highlights the position of the MACE with the highest differential expression in the QTL interval on chromosome 5A. This MACE belongs to a Berberine bridge enzyme (BBE) and is 95-fold higher expressed in the resistant accession PI272560 8 hai.
Today, only a few known Lr-genes are used in wheat varieties. Most are seedling resistances, which are generally vulnerable to being broken down by races with a changed virulence pattern (Periyannan et al., 2017; Zetzsche et al., 2020). Only a few non-race-specific resistances have been described, for instance, Lr34 and Lr67, which are quantitative and active at the adult plant development stages only (Hou et al., 2023). In most cases, obligate biotrophic fungal pathogens such as leaf rust are strictly host-specific. Therefore, one possibility to introduce durable leaf rust in wheat cultivars is single genes from alien species. Examples of these are the stem rust resistance genes Sr31, powdery mildew resistance Pm21, and resistance to eyespot disease resistance Pch1 (Ellis et al., 2014; Wulff and Moscou, 2014). Alien introgressions from rye (Secale cereale) contribute several resistance genes for powdery mildew, leaf, stripe, and stem rust, for example, Yr9, Lr25, and Lr26 (Johannson et al., 2020).
Hybridization between wheat and its wild relatives Aegilops sp., Triticum timopheevii, and Thinopyrum ponticum (Keilwagen et al., 2019) occurs naturally and is conducted during the breeding process. However, only a few rust resistances have been introgressed from diploid T. monococcum (Yr34, Chen et al., 2021; Sr22, Kerber and Dyck, 1973). A transfer of leaf rust resistance to wheat was reported by Hussien et al. (1997), whereas Noweiska et al. (2022) and Feuillet et al. (2003) showed that Lr10 is conserved in grass species with similarities to RPM1 in A. thaliana. Most T. monococcum accessions (84%) show a high level of resistance in contrast to most T. boeoticum accessions, including the partially susceptible T. boeoticum accession 36554 (Anker et al., 2001).
Hussien et al. (1997) analyzed three leaf rust resistances derived from T. monococcum, but did not identify their respective genetic positions. Two of them, Lr63 and LrTM16, were mapped on chromosome 3A and 2A in T. monococcum so far (Sodkiewicz et al., 2008; Noweiska et al., 2022). Loci associated to leaf rust resistances on chromosome 5A were identified in wheat based on the Bavarian MAGIC wheat (BMW) population (QLr.jki-5A.1; QLr.cim-5AC, Rollar et al., 2021), in a DH population derived from the Canadian wheat cultivar Carberry (Bokore et al., 2021) and the cultivar Lillian (Bokore et al., 2023). Remarkably, these QTLs explain only a low level of phenotypic variance with regard to the resistance level. Furthermore, they are either effective at the seedling or adult plant stage. In contrast to that, the resistance in Pi272560 is effective at all developmental stages (Figure 2C). To our best knowledge, no resistance with such a high efficiency was described on chromosome 5A so far. To understand the background of the prehaustorial leaf rust resistance of T. monococcum accessions, the development of fungal structures was analyzed (Jacobs et al., 1996). Expression studies and microscopical analyses have been performed in different studies (Anker et al., 2001; Sánchez-Martín et al., 2012; Serfling et al., 2016). Recognition of the pathogen by resistant accessions and first defense reactions based on hydrogen peroxide accumulation and antifungal compounds could already be observed 6 hai, so that the generation of hmc, haustoria, hyphae, and pustules was inhibited (Anker et al., 2001; Serfling et al., 2016). The number of hmc at 72 hai and rating data from the F2 genotypes showed right-skewed or binominal distribution but no segregation known for a single gene in the background. Furthermore, due to a possible nonhost resistance of T. monococcum to wheat leaf rust, an identification of different loci from both parents was expected since 36554 turned out to be partially resistant against P. triticina as well (Serfling et al., 2016).
A QTL analysis was performed to identify the effects of both genotypes on the segregating F2 population. The comparison of parental lines during the first 24 hai revealed a complex defense reaction comprising various mechanisms leading to an inhibition of the infection process. In accordance with previous studies of the host–pathogen interaction, a higher expression of genes known to be involved in the reaction to leaf rust could be observed. The comparison of the PI272560 and 36554 transcriptome showed clearly that pathogenesis-related genes such as Pr1, β-1,3-glucanases (Pr2), chitinases (Pr3), peroxidases (Pr9), and other Pr-genes were significantly more expressed in PI272560 after inoculation with wheat leaf rust (Table S7, Serfling et al., 2016). Remarkably, however, these genes are not located within the corresponding genomic interval (Ling et al., 2018) of the QTLs detected in the course of our study (Table 4). Hence, transcriptome analysis provided information regarding the different expressions of genes but not necessarily about the actual resistance gene in the background of an effective (prehaustorial) resistance.
Such a resistance includes an early onset of hypersensitive response (HR), which could be triggered by genes involved in upstream metabolic processes. This study aimed to combine a MACE approach with the construction of genetic mapping and QTL detection to identify the actual candidate genes for the observed resistance against leaf rust. As expected from the partial resistance of accession 36554, a minor QTL of accession 36554 was identified on chromosome 7A (Table 4), resulting in a reduced number of hmc 48 hai (Figure 2D). However, this QTL is of limited importance as it has no impact on pustule development (Figure 2F). One reason is most likely the host specificity of leaf rust to wheat, while T. monococcum is almost a nonhost for P. triticina (Dracatos et al., 2018).
Complex defense reactions could be observed shortly after the inoculation with leaf rust together with a high number of differentially expressed genes. According to our results, in a nonhost reaction of wheat to barley leaf rust, Delventhal et al. (2017) could detect 2,498 differentially expressed genes, while Serfling et al. (2016) could identify 311 different defense-related genes. However, these findings offer an overview of the entire transcriptome after infection and do not narrow down regions of the genome where genes are linked to the resistance response. Consequently, an F2 population of 182 F2 plants segregating for the hmc generation 48 and 72 hai and a visual rating are suitable to detect QTL resistance.
Remarkably, one QTL that could be detected on chromosome 5A from PI272560 (Table 4) appears to have a major effect on the resistance level (Figure 2). This effect was confirmed within the three different maps and phenotypic data, the hmc (72 hai), and rating data (Table 4, Figure 3). It is conceivable that owing to the recessive nature of the resistance (Figure 2C), the QTL was detected more clearly in the map showing dominant 36554 markers (Table 4) and not in the PI272560 map since repulsion effects of the recessive alleles, within the QTL and the dominant PI272560 markers, might have hampered the QTL identification. Interestingly, the QTL explains the reduced hmc generation of approximately 26% of the phenotypic variance (Table 4). However, almost all—49 of 50 plants—were homozygous for the PI272560 allele of the marker SNP_1364455 and showed phr (Figure 2C). The QTLs’ percentage of explained variance (P.E.V.) was likely underestimated because genotypes, being homozygous for the 36554 allele of marker SNP_1364455, were not clearly susceptible (Figure 2C). We know that 36554 is not completely susceptible to P. triticina (Serfling et al., 2016); thus, this observation is unsurprising. However, the underestimation of the P.E.V. value in this study is a useful example of how the actual effect of a QTL is determined depending on the parent’s resistance properties.
The identification of the QTL region on chromosome 5A reduced the number of possible candidate genes to 217. After the selection of exclusively expressed tags (Table 5) only six genes are related to defense responses to biotic stress. From these genes, one, coding for a microtubule binding protein (exclusively expressed in PI272560), is known to be involved in hypersensitive response including an accumulation of hydrogen peroxide in an incompatible interaction between wheat and wheat stripe rust (Wang et al., 2016).
The highest tpm could be detected constitutively in 36554 expressed uncharacterized protein with unknown function. Other genes, for instance, coding for a Wall-associated receptor kinase 3 are described as activators of signal cascades and have been identified as involved in leaf rust resistance comparable to APR. Hence, a significant impact on resistance at the seedling stage could not be expected in our investigation. Finally, the greatest differences in expression could be observed between the parental genotypes for an AT-hook motif nuclear-localized protein 10, which was 25.2 times higher expressed in 36554 and a BBE, which was 95.9 times higher expressed in PI272560 at 8 hai than in 36554 (Figures 4–6).
BBEs belong to the flavin-dependent oxidoreductases and are described as enzymes that can interact with damage-associated molecular pattern (DAMP) and initiate hypersensitive reactions (Locci et al., 2019). Daniel et al. (2017) termed BBEs in A. thaliana a “treasure trove of oxidative reactions”. A higher expression of BBE was also observed in a nonhost response of barley to wheat powdery mildew (Andrzejczak et al., 2020). In the case of the coffee Hemileia vastatrix (coffee rust) interaction, this enzyme could be identified as a biomarker for the initial phr against the fungus (Guerra-Guimarães et al., 2015; Silva et al., 2022). According to the results of Serfling et al. (2016), during the T. monococcum–wheat leaf rust interaction, as a defense reaction within the first 24 hai in coffee, increased peroxidase activity and PR-like proteins, for instance, chitinases, were detected. The BBE might initiate and trigger hypersensitive cell death, as observed by Serfling et al. (2016). The early time of higher expression could also explain the phr with a strongly reduced number of haustorial mother cells in resistant genotypes of the F2 population (Figures 2A–C).
Hence, the BBE could be one key enzyme for the basal defense response (Guerra-Guimarães et al., 2015), but is also an important enzyme in (nearly) nonhost resistance (Andrzejczak et al., 2020; Wan et al., 2021). As already mentioned by Anker et al. (2001), T. monococcum phenotypically shows almost nonhost resistance to wheat leaf rust. A typical sign of nonhost resistance to leaf rust is an early start of effective resistance reactions before the formation of the haustorium (Anker et al., 2001). In accession PI272560, such reactions and no haustoria could be observed (Serfling et al., 2016), but a BBE could not be detected in the study due to the restriction to specific gene ontology terms. To find suitable markers and detect genes in the background of the phr, a segregating population is a prerequisite. If molecular-assisted selection (MAS), for example, the SNP marker SNP_1364455, could be applied to transmit the resistance of PI272560 in current wheat elite varieties, this would be a possibility to establish a potential nonhost resistance with very long persistence and race independence. Examples of successful alien gene transmission of resistance genes into wheat are, for instance, the stem rust resistance genes Sr21, Sr22 (The, 1973), Sr35 (McIntosh et al., 1995), a leaf rust resistance (Hussien et al., 1997; Anker et al., 2001), and the powdery mildew resistance gene PmTmb (Shi et al., 1998).
The original contributions presented in the study are included in the article/Supplementary Material. Further inquiries can be directed to the corresponding author.
MD and AS established the plant material, performed the experiments, and wrote the manuscript. AS and FO conceived the basic idea of this research project and helped to improve the manuscript. All authors contributed to the article and approved the submitted version.
This work was financially supported by the Deutsche Forschungsgemeinschaft (DFG) under the project number OR72/6-1.
We would especially like to thank Nico Pastor-Käppner for evaluating the experiments.
The authors declare that the research was conducted in the absence of any commercial or financial relationships that could be construed as a potential conflict of interest.
All claims expressed in this article are solely those of the authors and do not necessarily represent those of their affiliated organizations, or those of the publisher, the editors and the reviewers. Any product that may be evaluated in this article, or claim that may be made by its manufacturer, is not guaranteed or endorsed by the publisher.
The Supplementary Material for this article can be found online at: https://www.frontiersin.org/articles/10.3389/fpls.2023.1252123/full#supplementary-material
Hai, hours after inoculation; MACE, massive analysis of cDNA ends; DArT, Diversity Arrays Technology; TKW, thousand kernel weight; DAB, diaminobenzidine; P.E.V., percentage of explained variance; DAMP, damage-associated molecular pattern; MAS, molecular-assisted selection; HR, hypersensitive response; dai, days after inoculation.
Andrzejczak, O. A., Sørensen, C. K., Wang, W.-Q., Kovalchuk, S., Hagensen, C. E., Jensen, O. N., et al. (2020). The effect of phytoglobin overexpression on the plant proteome during nonhost response of barley (Hordeum vulgare) to wheat powdery mildew (Blumeria graminis f. sp. tritici). Sci. Rep. 10, 9192. doi: 10.1038/s41598-020-65907-z
Anker, C. C., Niks, R. E. (2001). Prehaustorial resistance to the wheat leaf rust fungus, Puccinia triticina, in Triticum monococcum (s.s.). Euphytica 117, 209–215. doi: 10.1023/A:1026577307163
Anker, C. C., Buntjer, J. B., Niks, R. E. (2001). Morphological and molecular characterisation confirm that Triticum monococcum s.s. is resistant to wheat leaf rust. Theor. Appl. Genet. 103, 1093–1098. doi: 10.1007/s001220100667
Bancal, M.-O., Robert, C., Ney, B. (2007). Modelling wheat growth and yield losses from late epidemics of foliar diseases using loss of green leaf area per layer and pre-anthesis reserves. Ann. Bot. 100, 777–789. doi: 10.1093/aob/mcm163
Bokore, F. E., Cuthbert, R. D., Knox, R. E., Hiebert, C. W., Pozniak, C. J., Berraies, S., et al. (2023). Genetic mapping of leaf rust (Puccinia triticina Eriks) resistance genes in six Canadian spring wheat cultivars. Front. Plant Sci. 14. doi: 10.3389/fpls.2023.1130768
Bokore, F. E., Knox, R. E., Hiebert, C. W., Cuthbert, R. D., DePauw, R. M., Meyer, B., et al. (2021). A combination of leaf rust resistance genes, including lr34 and lr46, is the key to the durable resistance of the canadian wheat cultivar, carberry. Front. Plant Sci. 12. doi: 10.3389/fpls.2021.775383
Bolton, M. D., Kolmer, J. A., Garvin, D. F. (2008b). Wheat leaf rust caused by Puccinia triticina. Mol. Plant Pathol. 9, 563–575. doi: 10.1111/j.1364-3703.2008.00487.x
Bolton, M. D., Kolmer, J. A., Xu, W. W., Garvin, D. F. (2008a). Lr34-mediated leaf rust resistance in wheat: transcript profiling reveals a high energetic demand supported by transient recruitment of multiple metabolic pathways. Mol. Plant Microbe Interact. 21, 1515–1527. doi: 10.1094/MPMI-21-12-1515
Chen, S., Hegarty, J., Shen, T., Hua, L., Li, H., Luo, J., et al. (2021). Stripe rust resistance gene Yr34 (synonym Yr48) is located within a distal translocation of Triticum monococcum chromosome 5AmL into common wheat. Theor. Appl. Genet. 134, 2197–2211. doi: 10.1007/s00122-021-03816-z
Daniel, B., Konrad, B., Toplak, M., Lahham, M., Messenlehner, J., Winkler, A., et al. (2017). The family of berberine bridge enzyme-like enzymes: A treasure-trove of oxidative reactions. Arch. Biochem. Biophys. 632, 88–103. doi: 10.1016/j.abb.2017.06.023
Deblieck, M., Fatiukha, A., Grundman, N., Merchuk-Ovnat, L., Saranga, Y., Krugman, T., et al. (2020). GenoTypeMapper: graphical genotyping on genetic and sequence-based maps. Plant Methods 16, 123. doi: 10.1186/s13007-020-00665-7
Delventhal, R., Rajaraman, J., Stefanato, F. L., Rehman, S., Aghnoum, R., McGrann, G. R. D., et al. (2017). A comparative analysis of nonhost resistance across the two Triticeae crop species wheat and barley. BMC Plant Biol. 17, 232. doi: 10.1186/s12870-017-1178-0
Dracatos, P. M., Haghdoust, R., Singh, D., Park, R. F. (2018). Exploring and exploiting the boundaries of host specificity using the cereal rust and mildew models. New Phytol. 218, 453–462. doi: 10.1111/nph.15044
Edet, O. U., Gorafi, Y. S. A., Nasuda, S., Tsujimoto, H. (2018). DArTseq-based analysis of genomic relationships among species of tribe Triticeae. Sci. Rep. 8, 16397. doi: 10.1038/s41598-018-34811-y
Ellis, J. G., Lagudah, E. S., Spielmeyer, W., Dodds, P. N. (2014). The past, present and future of breeding rust resistant wheat. Front. Plant Sci. 5. doi: 10.3389/fpls.2014.00641
Feuillet, C., Travella, S., Stein, N., Albar, L., Nublat, A., Keller, B. (2003). Map-based isolation of the leaf rust disease resistance gene Lr10 from the hexaploid wheat (Triticum aestivum L.) genome. Proc. Natl. Acad. Sci. U.S.A. 100, 15253–15258. doi: 10.1073/pnas.2435133100
Guerra-Guimarães, L., Tenente, R., Pinheiro, C., Chaves, I., Silva, M., d., C., et al. (2015). Proteomic analysis of apoplastic fluid of Coffea arabica leaves highlights novel biomarkers for resistance against Hemileia vastatrix. Front. Plant Sci. 6. doi: 10.3389/fpls.2015.00478
Haghdoust, R., Singh, D., Park, R. F., Dracatos, P. M. (2021). Characterizing the genetic architecture of nonhost resistance in barley using pathogenically diverse Puccinia isolates. Phytopathology 111, 684–694. doi: 10.1094/PHYTO-05-20-0193-R
Hoogkamp, T. J., Chen, W. Q., Niks, R. E. (1998). Specificity of prehaustorial resistance to Puccinia hordei and to two inappropriate rust fungi in barley. Phytopathology 88, 856–861. doi: 10.1094/PHYTO.1998.88.8.856
Hou, W., Lu, Q., Ma, L., Sun, X., Wang, L., Nie, J., et al. (2023). Mapping of quantitative trait loci for leaf rust resistance in the wheat population ‘Xinmai 26/Zhoumai 22’. J. Exp. Bot. 74, 3019–3032. doi: 10.1093/jxb/erad085
Hussien, T., Bowden, R. L., Gill, B. S., Cox, T. S., Marshall, D. S. (1997). Performance of Four New Leaf Rust Resistance Genes Transferred to Common Wheat from Aegilops tauschii and Triticum monococcum. Plant Dis. 81, 582–586. doi: 10.1094/PDIS.1997.81.6.582
Jacobs, A. S., Pretorisu, Z. A., Kloppers, F. J., Cox, T. S. (1996). Mechanisms associated with wheat leaf rust resistance derived from Triticum monococcum. Phytopathology 86, 588–595. doi: 10.1094/Phyto-86-588
Jafary, H., Albertazzi, G., Marcel, T. C., Niks, R. E. (2008). High diversity of genes for nonhost resistance of barley to heterologous rust fungi. Genetics 178, 2327–2339. doi: 10.1534/genetics.107.077552
Ji, Z., Guo, W., Chen, X., Wang, C., Zhao, K. (2022). Plant executor genes. Int. J. Mol. Sci. 23. doi: 10.3390/ijms23031524
Jing, H.-C., Bayon, C., Kanyuka, K., Berry, S., Wenzl, P., Huttner, E., et al. (2009). DArT markers: diversity analyses, genomes comparison, mapping and integration with SSR markers in triticum monococcum. BMC Genomics 10, 458. doi: 10.1186/1471-2164-10-458
Johansson, E., Henriksson, T., Prieto-Linde, M. L., Andersson, S., Ashraf, R., Rahmatov, M. (2020). Diverse wheat-alien introgression lines as a basis for durable resistance and quality characteristics in bread wheat. Front. Plant Sci. 11. doi: 10.3389/fpls.2020.01067
Keilwagen, J., Lehnert, H., Berner, T., Beier, S., Scholz, U., Himmelbach, A., et al. (2019). Detecting large chromosomal modifications using short read data from genotyping-by-sequencing. Front. Plant Sci. 10. doi: 10.3389/fpls.2019.01133
Kerber, E. R., Dyck, P. L. (1973). Inheritance of stem rust resistance transferred from diploid wheat (Triticum monococcum) to tetraploid and hexaploid wheat and chromosome location of the gene involved. Can. J. Genet. Cytol. 15, 397–409. doi: 10.1139/g73-050
Kilian, A., Wenzl, P., Huttner, E., Carling, J., Xia, L., Blois, H., et al. (2012). Diversity arrays technology: a generic genome profiling technology on open platforms. Methods Mol. Biol. 888, 67–89. doi: 10.1007/978-1-61779-870-2_5
Knapp, S. J., Holloway, J. L., Bridges, W. C., Liu, B. H. (1995). Mapping dominant markers using F2 matings. Theor. Appl. Genet. 91, 74–81. doi: 10.1007/BF00220861
Kolmer, J. A. (2005). Tracking wheat rust on a continental scale. Curr. Opin. Plant Biol. 8, 441–449. doi: 10.1016/j.pbi.2005.05.001
Kolmer, J. (2013). Leaf rust of wheat: pathogen biology, variation and host resistance. Forests 4, 70–84. doi: 10.3390/f4010070
Kosambi, D. D. (1943). The estimation of map distances from recombination values. Ann. Eugenics 12, 172–175. doi: 10.1111/j.1469-1809.1943.tb02321.x
Kumar, J., Ramlal, A., Kumar, K., Rani, A., Mishra, V. (2021). Signaling pathways and downstream effectors of host innate immunity in plants. Int. J. Mol. Sci. 22. doi: 10.3390/ijms22169022
Lind, V. (2005). “Evaluation of Triticum monococcum for resistance to fungal pathogens with special emphasis on prehaustorial resistance to leaf rust,” in 2005: Conference paper. Eds. Lipman, E., Maggioni, L., Knüpffer, H., Ellis, R., Leggett, J. M., Kleijer, G., Faberová, L., Blanc, A. (France, La Rochelle: Cereal genetic resources in Europe), 290–293.
Ling, H.-Q., Ma, B., Shi, X., Liu, H., Dong, L., Sun, H., et al. (2018). Genome sequence of the progenitor of wheat A subgenome Triticum urartu. Nature 557, 424–428. doi: 10.1038/s41586-018-0108-0
Locci, F., Benedetti, M., Pontiggia, D., Citterico, M., Caprari, C., Mattei, B., et al. (2019). An Arabidopsis berberine bridge enzyme-like protein specifically oxidizes cellulose oligomers and plays a role in immunity. Plant J. 98, 540–554. doi: 10.1111/tpj.14237
Mapuranga, J., Zhang, N., Zhang, L., Liu, W., Chang, J., Yang, W. (2022). Harnessing genetic resistance to rusts in wheat and integrated rust management methods to develop more durable resistant cultivars. Front. Plant Sci. 13. doi: 10.3389/fpls.2022.951095
McIntosh, R. A., Wellings, C. R., Park, R. F. (1995). Wheat rusts: An atlas of resistance genes (Dordrecht: Kluwer).
Mester, D. I., Ronin, Y. I., Hu, Y., Peng, J., Nevo, E., Korol, A. B. (2003). Efficient multipoint mapping: making use of dominant repulsion-phase markers. Theor. Appl. Genet. 107, 1102–1112. doi: 10.1007/s00122-003-1305-1
Niks, R. E. (1988). Nonhost plant species as donors for resistance to pathogens with narrow host range. II. Concepts and evidence on the genetic basis of nonhost resistance. Euphytica 37, 89–99. doi: 10.1007/BF00037229
Niks, R. E. (1991). Prehaustorial and posthaustorial resistance to wheat leaf rust in diploid wheat seedlings. Phytopathology 81, 847. doi: 10.1094/Phyto-81-847
Nover, I., Lehmann, C. O. (1967). Resistenzeigenschaften im Gersten- und Weizensortiment Gatersleben. Die Kulturpflanze 15, 181–198. doi: 10.1007/BF02095713
Noweiska, A., Bobrowska, R., Kwiatek, M. T. (2022). Structural polymorphisms of chromosome 3Am containing lr63 leaf rust resistance loci reflect the geographical distribution of Triticum monococcum L. and related diploid wheats. Agriculture 12, 966. doi: 10.3390/agriculture12070966
Olivera, P. D., Kilian, A., Wenzl, P., Steffenson, B. J. (2013). Development of a genetic linkage map for Sharon goatgrass (Aegilops sharonensis) and mapping of a leaf rust resistance gene. Genome 56, 367–376. doi: 10.1139/gen-2013-0065
Peng, J., Korol, A. B., Fahima, T., Röder, M. S., Ronin, Y. I., Li, Y. C., et al. (2000). Molecular genetic maps in wild emmer wheat, Triticum dicoccoides: genome-wide coverage, massive negative interference, and putative quasi-linkage. Genome Res. 10, 1509–1531. doi: 10.1101/gr.150300
Periyannan, S., Milne, R. J., Figueroa, M., Lagudah, E. S., Dodds, P. N. (2017). An overview of genetic rust resistance: From broad to specific mechanisms. PloS Pathog. 13, e1006380. doi: 10.1371/journal.ppat.1006380
Rohringer, R. (1977). Calcofluor: an optical brightener for fluorescence microscopy of fungal plant parasites in leaves. Phytopathology 67, 808–810. doi: 10.1094/Phyto-67-808
Rollar, S., Serfling, A., Geyer, M., Hartl, L., Mohler, V., Ordon, F. (2021). QTL mapping of adult plant and seedling resistance to leaf rust (Puccinia triticina Eriks.) in a multiparent advanced generation intercross (MAGIC) wheat population. Theor. Appl. Genet. 134, 37–51. doi: 10.1007/s00122-020-03657-2
Sánchez-Martín, J., Rubiales, D., Sillero, J. C., Prats, E. (2012). Identification and characterization of sources of resistance in Avena sativa, A. byzantina and A. strigosa germplasm against a pathotype of Puccinia coronata f.sp. avenae with virulence against the Pc94 resistance gene. Plant Pathol. 61, 315–322. doi: 10.1111/j.1365-3059.2011.02514.x
Serfling, A., Templer, S. E., Winter, P., Ordon, F. (2016). Microscopic and Molecular Characterization of the Prehaustorial Resistance against Wheat Leaf Rust (Puccinia triticina) in Einkorn (Triticum monococcum). Front. Plant Sci. 7. doi: 10.3389/fpls.2016.01668
Shapiro, S. S., Wilk, M. B. (1965). An analysis of variance test for normality (Complete samples). Biometrika 52, 591. doi: 10.2307/2333709
Shi, A. N., Leath, S., Murphy, J. P. (1998). A major gene for powdery mildew resistance transferred to common wheat from wild einkorn wheat. Phytopathology 88, 144–147. doi: 10.1094/PHYTO.1998.88.2.144
Silva, Guerra-Guimarães, L., Diniz, I., Loureiro, A., Azinheira, H., Pereira, A. P., et al. (2022). An overview of the mechanisms involved in coffee-Hemileia vastatrix interactions: plant and pathogen perspectives. Agronomy 12, 326. doi: 10.3390/agronomy12020326. M. d. C.
Sodkiewicz, W., Strzembicka, A., Apolinarska, B. (2008). Chromosomal location in triticale of leaf rust resistance genes introduced from Triticum monococcum. Plant Breed. 127, 364–367. doi: 10.1111/j.1439-0523.2007.01485.x
Stein, N., Herren, G., Keller, B. (2001). A new DNA extraction method for high-throughput marker analysis in a large-genome species such as Triticum aestivum. Plant Breed. 120, 354–356. doi: 10.1046/j.1439-0523.2001.00615.x
The, T. T. (1973). Chromosome location of genes conditioning stem rust resistance transferred from diploid to hexaploid wheat. Nat. New Biol. 241, 256. doi: 10.1038/newbio241256a0
Van Ooijen, J. W. (2006). JoinMap 4.0, Software for the Calculation of Genetic Linkage Maps in Experimental Populations (Wageningen: Kyazma B.V).
Wang, J., Wang, Y., Liu, X., Xu, Y., Ma, Q. (2016). Microtubule polymerization functions in hypersensitive response and accumulation of H2O2 in wheat induced by the stripe rust. BioMed. Res. Int. 2016, 7830768. doi: 10.1155/2016/7830768
Wan, W.-L., Kim, S.-T., Castel, B., Charoennit, N., Chae, E. (2021). Genetics of autoimmunity in plants: an evolutionary genetics perspective. New Phytol. 229, 1215–1233. doi: 10.1111/nph.16947
Wulff, B. B. H., Moscou, M. J. (2014). Strategies for transferring resistance into wheat: from wide crosses to GM cassettes. Front Plant Sci. 5, 692. doi: 10.3389/fpls.2014.00692
Keywords: Triticum monococcum, leaf rust, hypersensitive response, grain yield, quantitative resistance
Citation: Deblieck M, Ordon F and Serfling A (2023) Mapping of prehaustorial resistance against wheat leaf rust in einkorn (Triticum monococcum), a progenitor of wheat. Front. Plant Sci. 14:1252123. doi: 10.3389/fpls.2023.1252123
Received: 03 July 2023; Accepted: 25 September 2023;
Published: 23 October 2023.
Edited by:
Rodomiro Ortiz, Swedish University of Agricultural Sciences, SwedenReviewed by:
Zhengqiang Ma, Nanjing Agricultural University, ChinaCopyright © 2023 Deblieck, Ordon and Serfling. This is an open-access article distributed under the terms of the Creative Commons Attribution License (CC BY). The use, distribution or reproduction in other forums is permitted, provided the original author(s) and the copyright owner(s) are credited and that the original publication in this journal is cited, in accordance with accepted academic practice. No use, distribution or reproduction is permitted which does not comply with these terms.
*Correspondence: Albrecht Serfling, YWxicmVjaHQuc2VyZmxpbmdAanVsaXVzLWt1ZWhuLmRl
†These authors have contributed equally to this work and share first authorship
Disclaimer: All claims expressed in this article are solely those of the authors and do not necessarily represent those of their affiliated organizations, or those of the publisher, the editors and the reviewers. Any product that may be evaluated in this article or claim that may be made by its manufacturer is not guaranteed or endorsed by the publisher.
Research integrity at Frontiers
Learn more about the work of our research integrity team to safeguard the quality of each article we publish.