 Zeping Cai1†
 Jiajia Luo
95% of researchers rate our articles as excellent or good
Learn more about the work of our research integrity team to safeguard the quality of each article we publish.
Find out more
ORIGINAL RESEARCH article
Front. Plant Sci. , 07 September 2023
Sec. Plant Bioinformatics
Volume 14 - 2023 | https://doi.org/10.3389/fpls.2023.1222414
This article is part of the Research Topic Advances on Genomics and Genetics of Horticultural Crops and their Contribution to Breeding Efforts, volume II View all 12 articles
Light serves not only as a signaling cue perceived by plant photoreceptors but also as an essential energy source captured by chloroplasts. However, excessive light can impose stress on plants. Fern gametophytes possess the unique ability to survive independently and play a critical role in the alternation of generations. Due to their predominantly shaded distribution under canopies, light availability becomes a limiting factor for gametophyte survival, making it imperative to investigate their response to light. Previous research on fern gametophytes’ light response has been limited to the physiological level. In this study, we examined the light response of Adiantum flabellulatum gametophytes under different photosynthetic photon flux density (PPFD) levels and identified their high sensitivity to low light. We thereby determined optimal and stress-inducing light conditions. By employing transcriptome sequencing, weighted gene co-expression network analysis, and Gene Ontology and Kyoto Encyclopedia of Genes and Genomes analyses, we identified 10,995 differentially expressed genes (DEGs). Notably, 3 PHYBs and 5 Type 1 CRYs (CRY1s) were significantly down-regulated at low PPFD (0.1 μmol m-2 s-1). Furthermore, we annotated 927 DEGs to pathways related to photosynthesis and 210 to the flavonoid biosynthesis pathway involved in photoprotection. Additionally, we predicted 34 transcription factor families and identified a close correlation between mTERFs and photosynthesis, as well as a strong co-expression relationship between MYBs and bHLHs and genes encoding flavonoid synthesis enzymes. This comprehensive analysis enhances our understanding of the light response of fern gametophytes and provides novel insights into the mechanisms governing their responses to light.
Ferns, an ancient lineage of land plants, have thrived on Earth for approximately 380 million years and are a fundamental component of the planet’s plant community (Schneider et al., 2004). Their gametophytes exhibit the remarkable ability to survive independently and serve as the site for the production and occurrence of sexual reproductive cells. Additionally, they play a critical role in the alternation of generations (also known as metagenesis) by nourishing the young sporophyte (Krieg and Chambers, 2022).
Light, a pivotal environmental factor for plant growth, serves both as a signal perceived by photoreceptors and as energy captured by chloroplasts to facilitate photosynthesis (de Wit et al., 2016; Poorter et al., 2019). However, excessive light can induce photostress, challenging photoprotective mechanisms (Takahashi and Badger, 2011). Fern gametophytes predominantly inhabit shaded habitats, where light conditions pose a limiting factor for their survival. Previous studies have revealed that gametophytes of Trichomanes speciosum can effectively conduct photosynthesis under weak light conditions, with 85% of the daytime light intensity being less than 1 μmol m-2 s-1 (equivalent to approximately 0.01% to 0.1% of full daylight exposure). Nevertheless, prolonged exposure to higher light levels (>50 μmol m-2 s-1) can lead to the demise of these gametophytes (Johnson et al., 2000). The growth and/or photosynthetic rates of gametophytes from Onoclea sensibilis and Cibotium glaucum exhibit an increasing trend within a certain range of light intensity, but excessive light inhibits their development (Miller and Miller, 1961; Friend, 1974). In contrast, fern gametophytes are adapted to lower light conditions than sporophytes (Nitta et al., 2021). However, research on the light response of fern gametophytes has thus far been confined to the physiological level.
Flavonoids are secondary metabolites that are widely present in bryophytes, pteridophytes (including lycophytes, horsetails, and ferns), and spermatophytes (Santos et al., 2017). These compounds have photoprotective properties and can absorb ultraviolet and some visible light, as well as function as antioxidants to scavenge reactive oxygen species generated by strong light exposure (Ferreyra et al., 2021). Previous studies have shown that environmental factors such as light can regulate the expression of flavonoid biosynthetic enzyme genes in the sporophytes of ferns. However, it is unknown whether the expression of flavonoid biosynthetic enzyme genes in the gametophytes of ferns is regulated by light. For example, research has found that the expression of flavonoid biosynthetic enzyme genes in fronds of Azolla filiculoides, such as CHI, C4H, CHS, and DFR1, is regulated by environmental factors such as light, which affects flavonoid synthesis (Costarelli et al., 2021). Similarly, studies on cultured spores of Dryopteris fragrans have shown that UV-B stress can increase the expression of the DfCHS gene and the total flavonoid content (Sun et al., 2014). Therefore, further research on the expression of flavonoid biosynthetic enzyme genes and their regulation by light in the gametophytes of ferns is of great significance for a deeper understanding of the photoprotective mechanism of fern gametophytes.
Transcription factors/transcriptional regulators are proteins that regulate gene expression (Strader et al., 2022). In the genomes of the model plant Arabidopsis thaliana and sorghum (Sorghum bicolor), the proportion of transcription factors/transcriptional regulators is 7.51% and 7.69%, respectively (Arabidopsis Genome, 2000; Tian et al., 2016). Despite their large genome size, the proportion of transcription factors/transcriptional regulators in ferns is relatively low (Sessa and Der, 2016). For example, in the transcriptomes of ferns Huperzia serrata and Monachosorum maximowiczii, the proportion of transcription factors/transcriptional regulators is only 1.87% and 1.11%, respectively (Liu et al., 2016; Yang et al., 2017). In the transcriptome of the gametophyte of Adiantum flabellulatum that we previously reported, the proportion of transcription factors/transcriptional regulators is 2.25% (Cai et al., 2022a). The genome of Salvinia cucullata, the smallest known genome among ferns, has only 983 transcription factors/transcriptional regulators, accounting for 4.94% of all genes, which is also lower than that in gymnosperms or angiosperms (Li et al., 2018). Currently, research on the regulatory role of transcription factors/transcriptional regulators in ferns is very limited, and we still do not understand how they respond to light, and whether there is a potential regulatory relationship with genes related to photoprotection.
A. flabellulatum, which typically grows under the canopy, is an acid-soil indicator plant (Liao et al., 2017) that has significant value in both ornamental and medicinal uses (Shahriar and Kabir, 2011). In this study, we used transcriptome sequencing, weighted gene co-expression network analysis, Gene Ontology (GO), Kyoto Encyclopedia of Genes and Genomes (KEGG) analysis, and real-time quantitative polymerase chain reaction (qPCR) to explore the genes responsive to light and potential regulatory relationships between transcription factors and genes related to flavonoid biosynthesis. Furthermore, by identifying key genes and pathways, this study enhances our understanding of the light response mechanism of A. flabellulatum gametophytes and provides a foundation for uncovering their molecular mechanism.
Spores of A. flabellulatum were collected from the rubber forest at Ma’an Mountain (109.519°E, 19.501°N) in Danzhou, Hainan Province, China, as described by Cai et al. (2022b). The spores were sterilized with 0.1% HgCl2 for 5 min, washed with sterile water five times, and then plated on 1/4 MS solid medium (3% w/v sucrose and 0.7% w/v agar). The plated spores were exposed to meticulously controlled illumination, with a photosynthetic photon flux density (PPFD) level of 7.1 μmol m-2 s-1, and maintained under an uninterrupted 24-hour photoperiod. Upon spore germination, young gametophytes with diameters ranging from 1 to 2 mm were transferred to fresh 1/4 MS solid medium, also containing 3% w/v sucrose and 0.7% w/v agar. Subsequently, the gametophytes were divided into seven distinct experimental groups, each cultivated under varying PPFD conditions: 0, 0.1, 1.4, 7.1, 14.4, 73.6, and 145.3 μmol m-2 s-1, respectively (Supplementary Table 1, Supplementary Figure 1). These cultivations were carried out over a continuous 40-day period under an uninterrupted 24-hour photoperiod. The perimeter and projected area of the gametophytes were quantified using Image J software (v1.8.0). Each treatment was replicated at least eight times, and the cultivation temperature was maintained at 25°C. Statistical analysis was conducted using the least significant difference (LSD) test.
The gametophytes of A. flabellulatum were cultivated under diverse light conditions: 0, 0.1, 7.1, and 145.3 μmol m-2 s-1, for a period of 12 days, maintaining an uninterrupted 24-hour photoperiod. Subsequently, the four sample groups, denoted as Af0, Af0.1, Af7.1, and Af145.3, were collected for transcriptome sequencing. Three biological replicates were established for each treatment, resulting in a total of 12 samples. Approximately 200 mg of gametophytes were collected from each sample, and total RNA was extracted using the CTAB method. mRNA was then enriched using oligo dT magnetic beads, fragmented, and reverse-transcribed into cDNA for library construction. Sequencing was performed on the DNBSEQ platform. The raw reads were filtered using SOAPnuke software (v1.5.2) to remove reads with adapters, N content exceeding 10%, and more than 50% of bases with a quality score below 15. The clean reads were aligned to the full-length transcriptome of A. flabellulatum gametophytes using Bowtie2 (v2.2.5), and gene expression levels were calculated using RSEM (v1.2.8). These steps were executed by the Beijing Genomics Institute (BGI). Finally, we conducted sequencing saturation analysis, correlation analysis, and principal component analysis using the method described by Cai et al. (2021).
The study involved three comparison groups: Af0 vs Af0.1, Af0.1 vs Af7.1, and Af7.1 vs Af145.3. Genes with average expression levels less than 0.5 in each comparison group were removed, and differentially expressed genes (DEGs) were screened using the criteria of |log2 FoldChange| ≥ 1 and Q-Values < 0.001. The expression levels of all DEGs in the 12 samples were used to construct gene co-expression modules using the WGCNA package in R software, with “sft$powerEstimate=13” and “mergeCutHeight=0.25”. Modules that were strongly correlated with the phenotypes and light conditions of A. flabellulatum gametophyte were selected for further analysis.
The module genes were annotated and classified using Blast2GO (v2.5.0) for Gene Ontology (GO, http://www.geneontology.org/) and Blastx (v2.2.23) and Diamond (v0.8.31) tools for KEGG (http://www.genome.jp/kegg/) annotation and classification, respectively (Cai et al., 2022b). Enrichment analysis was performed using the Phyper function package in the R software. BGI completed the GO and KEGG annotations. Enrichment pathways related to the gametophyte phenotype and light conditions of A. flabellulatum were selected for further analysis and discussion.
In this study, the identification of open reading frames (ORFs) from gene sequences was conducted using getorf (EMBOSS: 6.5.7.0). The resulting ORFs were aligned to transcription factor protein domains (http://plantregmap.gao-lab.org/) using hmmsearch (v3.0) (Tian et al., 2020). The genes’ potential for encoding transcription factors were then identified based on the transcription factor family characteristics outlined in PlantTFDB (http://planttfdb.gao-lab.org/) (Jin et al., 2017) and classified according to their respective transcription factor families.
We used Cytoscape software (v3.9.1) to visualize the co-expression networks of flavonoid biosynthesis genes, as well as MYBs and bHLHs in the green, brown, yellow, and turquoise modules, following the method described by Shannon et al. (2003). In the visualization, nodes represent genes, and the size of each node is positively correlated with its degree. Lines represent the weight of co-expression between genes, with thicker and darker lines indicating higher weights.
Fifteen genes were chosen for validation by quantitative real-time polymerase chain reaction (qRT-PCR) (Supplementary Table 2). A total of 12 samples were used, with three technical replicates per sample. To achieve relative quantification, we selected isoform_78364 (Elongation Factor Ts), which exhibited stable expression across all samples, as the internal control gene, following the method described by Pfaffl (2001). Relative quantification was carried out using the 2-ΔΔCt method, and significance analysis was performed using the LSD method.
The perimeters and projected areas of gametophytes grown under different PPFD levels were measured. The results showed that gametophytes are highly sensitive to low light, with their perimeter increasing significantly under a PPFD as low as 0.1 μmol m-2 s-1. Below 7.1 μmol m-2 s-1, the perimeter and/or projected area of gametophytes increased with increasing PPFD levels and reached a maximum at 7.1 μmol m-2 s-1. When the PPFD levels ranged between 7.1 μmol m-2 s-1 and 73.6 μmol m-2 s-1, the average value of the perimeter and projected area of gametophytes decreased slightly, but no significant differences were observed. However, when the PPFD reached 145.3 μmol m-2 s-1, the perimeter and projected area of gametophytes decreased significantly (Figure 1). Therefore, we conclude that 7.1 μmol m-2 s-1 is the optimal PPFD for the growth of A. flabellulatum gametophytes, while both PPFD levels below 7.1 μmol m-2 s-1 and at 145.3 μmol m-2 s-1 can induce light stress on the gametophytes.
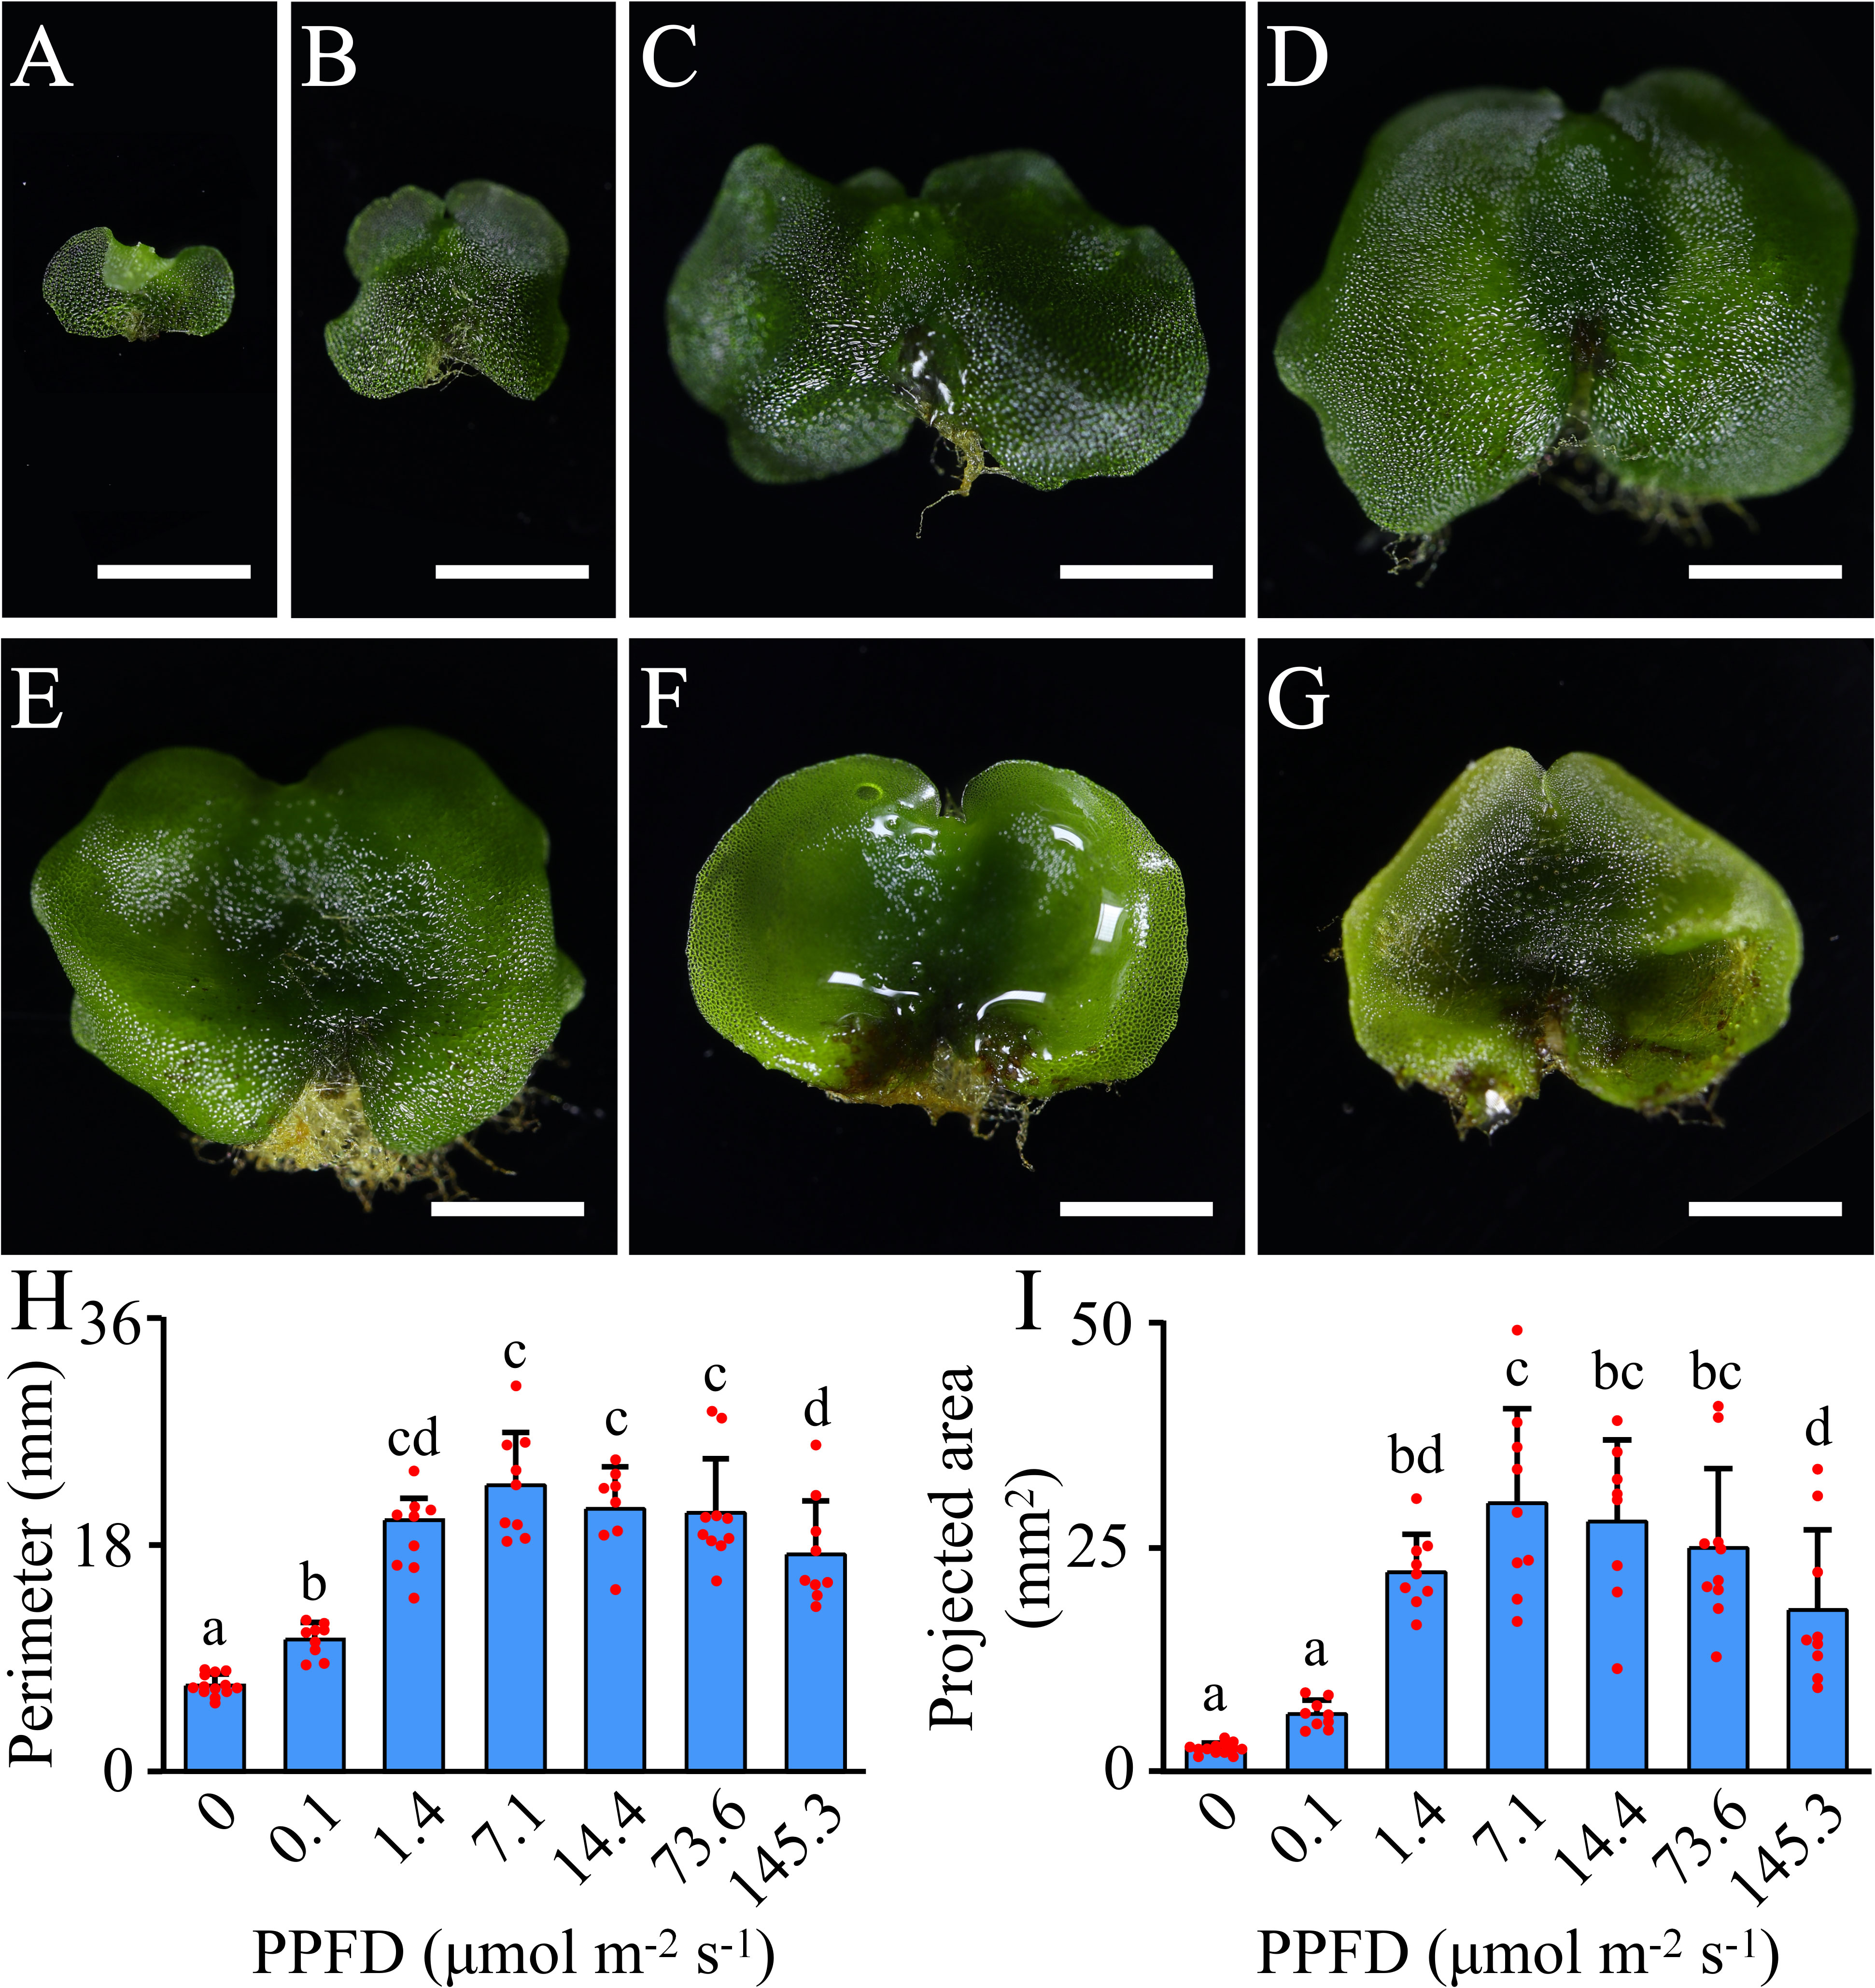
Figure 1 Effects of different PPFD levels on the growth of A. flabellulatum gametophytes. (A–G): A. flabellulatum gametophytes were cultured for 40 days under PPFD levels of 0, 0.1, 1.4, 7.1, 14.4, 73.6, and 145.3 μmol m-2 s-1. (H, I): The gametophyte perimeter (H) and projected area (I) were measured after 40 days of cultivation under different PPFD levels. Lowercase letters indicate significant differences (p < 0.05) between different PPFD levels. Scale bar = 2 mm.
We selected four treatments with PPFD levels of 0, 0.1, 7.1, and 145.3 μmol m-2 s-1 (represented by Af0, Af0.1, Af7.1, and Af145.3, respectively) to explore the genes involved in the response of A. flabellulatum gametophytes to light using transcriptome sequencing, based on previous experimental results. Three biological replicates were performed for each treatment, resulting in a total of 12 samples that were sequenced using the DNBSEQ platform. The full-length transcript sequences of A. flabellulatum gametophytes reported by Cai et al. (2022a) were used as reference genes for relative quantification.
The raw read counts of each sample were greater than 42 M, and after filtering, each sample had at least 41 M clean reads, with a ratio greater than 96.17% and Q20 and Q30 values higher than 94% and 87%, respectively (Supplementary Table 3). Sequencing saturation analysis indicated that the gene identification ratio plateaued when the reads number exceeded 50×100 K, suggesting that the sequencing data had reached saturation (Supplementary Figure 2A). The gene expression level distributions of the 12 samples were analyzed, and the median gene expression levels were all ≥0.97 (Supplementary Figure 2B). Pearson correlation coefficients between biological replicates were ≥0.91 (Figure 2A), and the four treatments were separated from each other on the plane composed of PC1 and PC3 in the principal component analysis (Figure 2B). These results confirm the reliability and high quality of the sequencing data, which can be used for subsequent DEGs screening and analysis. The sequencing data have been deposited in the NCBI SRA database under accession number PRJNA868202.
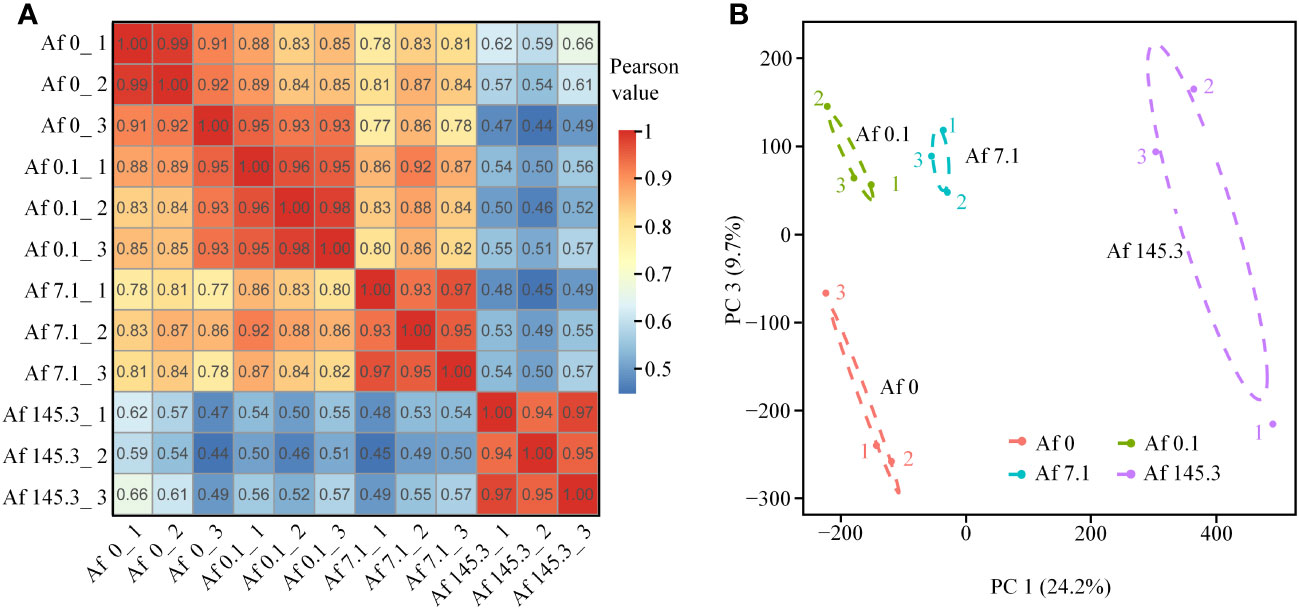
Figure 2 Pearson correlation coefficient analysis and principal component analysis of 12 samples. (A, B): Pearson correlation coefficient analysis (A) and principal component analysis (PCA) (B) based on the expression data of all genes in 12 samples from the four treatments. The PCA results show that the four treatments are separated on a plane constructed by PC1 and PC3, indicating that these two principal components account for most of the variation among the treatments.
A total of 248,028 genes were detected among the 12 samples. Three comparison groups were set: Af0 vs Af0.1, Af0.1 vs Af7.1, and Af7.1 vs Af145.3. In each comparison group, we filtered out genes with an average expression level of less than 0.5 for both treatments and then selected DEGs with |log2 FoldChange| ≥ 1 and Q-Values < 0.001. This resulted in 1,059, 5,536, and 10,152 DEGs, respectively. The Af7.1 vs Af145.3 comparison had the most DEGs, with 7,692 upregulated and 2,460 downregulated genes, followed by Af0.1 vs Af7.1, which had 1,864 upregulated and 3,672 downregulated genes. The Af0 vs Af0.1 comparison had the fewest DEGs (Supplementary Tables 4–6; Figures 3A–C). After removing duplicates, a total of 15,874 DEGs were obtained (Figure 3D).
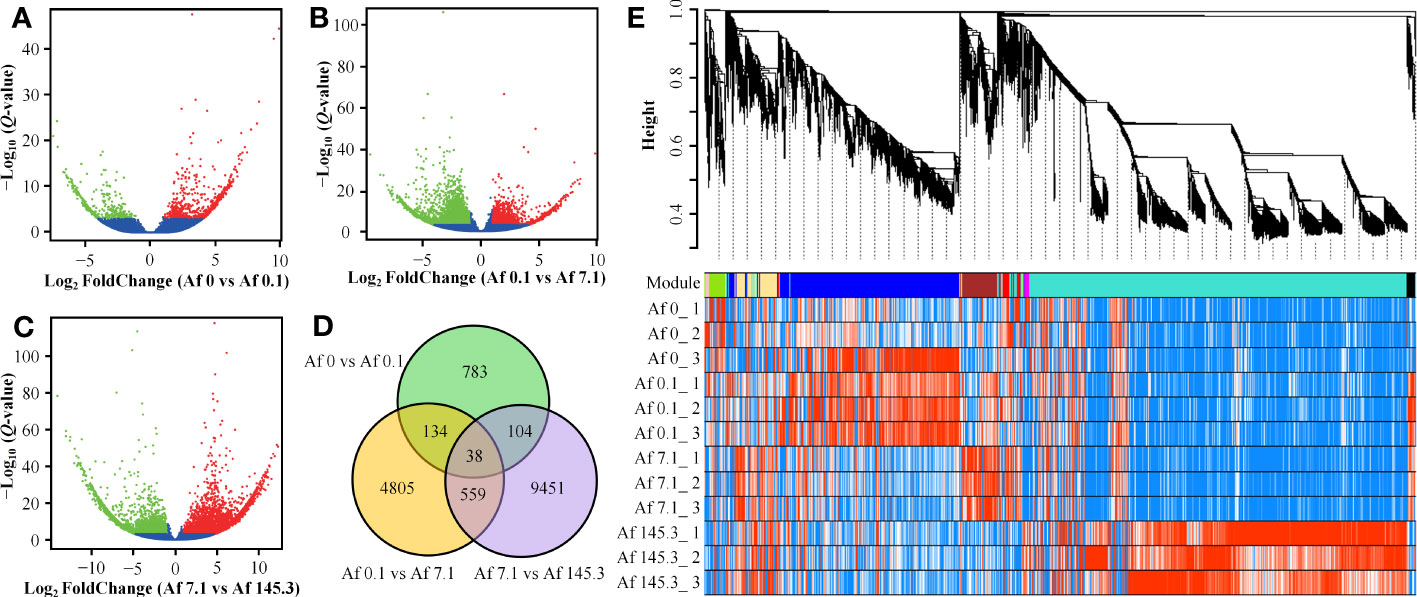
Figure 3 Identification of DEGs and weighted gene co-expression network analysis. (A–C): DEGs were identified using criteria of |log2 FoldChange| ≥ 1 and Q-Values < 0.001. The red and green dots represent up-regulated and down-regulated DEGs in Af0 vs Af0.1 (A), Af0.1 vs Af7.1 (B), and Af7.1 vs Af145.3 (C), respectively. (D): Venn diagram of DEGs distribution among three comparison groups, with the numbers in overlapping regions representing the shared DEGs. (E): Dendrogram and gene modules of a total of 15,874 DEGs obtained through hierarchical clustering analysis. The turquoise module contains the largest number of DEGs.
For these 15,874 DEGs, we performed weighted gene co-expression analysis and obtained 12 gene co-expression modules (Figure 3E). The turquoise module contained 8,796 DEGs and was positively correlated with “PPFD levels,” while the yellow (746 DEGs) and brown (875 DEGs) modules were positively correlated with “gametophyte area.” The green module (387 DEGs) was positively correlated with “presence or absence of light” (Supplementary Table 7). In contrast, the black module (191 DEGs) was negatively correlated with “presence or absence of light” (Supplementary Table 7, Supplementary Figure 3). Based on these results, we selected DEGs from these five modules for further analysis.
We performed GO annotation on a total of 10,995 DEGs from the five gene modules mentioned earlier. Of these, 8,033 were successfully annotated, accounting for 73.06% of the total. These annotations covered three major functional categories: “Biological process,” “Cellular component,” and “Molecular function,” which contained 4,911, 5,451, and 6,424 genes, respectively. In the “Biological process” category, all five modules had the highest number of genes annotated in the “cellular process” term, while in the “Cellular component” category, it was the “cellular anatomical entity.” In the “Molecular function” category, the black and brown modules had the highest number of genes annotated in the “binding” term, while the green, yellow, and turquoise modules were most enriched in the “catalytic activity” term (Supplementary Tables 8, 9; Figure 4A).
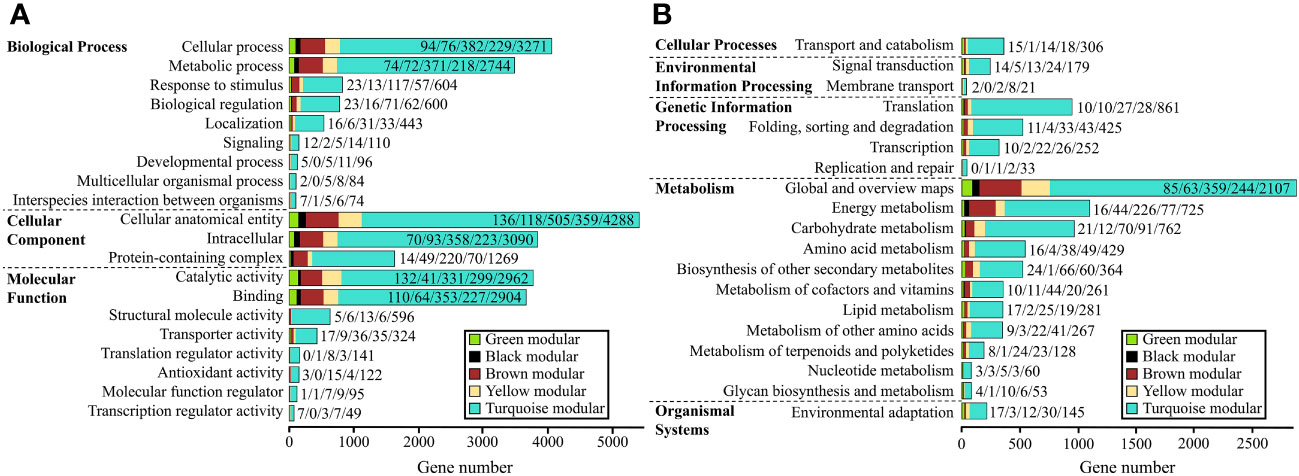
Figure 4 GO and KEGG classifications of the five gene modules. (A, B): GO (A) and KEGG (B) classifications of genes in the five modules. The numbers on each bar represent the count of genes for the green, black, brown, yellow, and turquoise modules, respectively.
We present the top 21 enriched GO terms with Q-values < 0.01. Firstly, the green module was enriched in at least 8 terms related to light signaling (8/21). Among them, “photoreceptor activity” had the smallest Q-value (Q=1.67E-07) and the most genes (8) (Supplementary Table 10, Supplementary Figure 4A). This indicates that the DEGs in the green module play an important role in regulating light signaling during the development of A. flabellulatum’s gametophyte. Secondly, most of the terms in the black and brown modules were related to photosynthesis. For example, “thylakoid” had the smallest Q-value (Q=1.63E-28) and the most genes (52) in the black module, while “regulation of photosynthesis, dark reaction” had the highest enrichment rate (0.11) (Supplementary Table 10, Supplementary Figure 4B). In the brown module, “photosystem II” had the smallest Q-value (Q=2.35E-115) and the most genes (166), while “photosynthetic acclimation” had the highest enrichment rate (0.125) (Supplementary Table 10, Supplementary Figure 4C). This indicates that the DEGs in the black and brown modules mainly participate in regulating photosynthesis during the development of A. flabellulatum’s gametophytes. Additionally, the two terms with the smallest Q-value in the yellow module were “flavonoid biosynthetic process” (Q=3.61E-09) and “flavonoid metabolic process” (Q=3.87E-09), and they both had the most genes (12) (Supplementary Table 10, Supplementary Figure 4D). The terms enriched in the turquoise module were mainly related to cell damage, such as “cell killing” and “killing of cells of other organism,” and they had the most genes (36) (Supplementary Table 10, Supplementary Figure 4E). This indicates that the DEGs in the yellow and turquoise modules mainly participate in resisting light stress caused by strong light.
We performed KEGG annotation on 10,995 DEGs, of which 5,405 genes were successfully annotated with an annotation rate of 49.16%. These genes were classified into five major categories, including “Cellular processes”, “Environmental information processing”, “Genetic Information Processing”, “Metabolism”, and “Organismal Systems”. Among these categories, the “Metabolism” category had the most DEGs, with a total of 3,363 genes. The five gene modules were annotated to the most genes in the “Transport and catabolism” (354 genes) of “Cellular processes”, “Signal transduction” (235 genes) of “Environmental information processing”, “Global and overview maps” (2,858 genes) of “Metabolism”, and “Environmental adaptation” (207 genes) of “Organismal Systems”. In the “Genetic Information Processing” category, the black and turquoise modules had the most genes annotated in “Translation”, while the green, brown, and yellow modules were involved in “Folding, sorting and degradation”. Importantly, in the “Metabolism” category, all five gene modules had a relatively high number of genes annotated in “Energy metabolism” (1,088 genes) and “Carbohydrate metabolism” (956 genes), indicating that the regulation of these two metabolisms by light is also crucial (Supplementary Tables 11, 12; Figure 4B).
We presented the top 10 KEGG pathways with the smallest Q-values in enrichment analysis (Supplementary Figure 5; Figure 5). Firstly, the green, black, and yellow gene modules were all enriched in the “Circadian rhythm-plant” pathway, with the green module having the smallest Q-value and the largest number of genes (14) in this pathway (Supplementary Table 13, Supplementary Figure 5A). Secondly, the black, yellow, brown, and turquoise gene modules were all enriched in multiple pathways related to photosynthesis, such as “Photosynthesis-antenna proteins” and “Photosynthesis” (Supplementary Table 13). The black module had the smallest Q-value (1.63E-20), highest enrichment rate (0.009240924), and the largest number of genes (28) in the “Photosynthesis” pathway (Supplementary Table 13, Supplementary Figure 5B). In the brown module, the “Photosynthesis-antenna proteins” pathway had the smallest Q-value (1.08E-77), highest enrichment rate (0.041363336), and the largest number of genes (125) (Supplementary Table 13; Figure 5A). Additionally, the brown, yellow, and turquoise gene modules were enriched in the “Flavonoid biosynthesis” pathway, which is involved in photoprotection (Supplementary Table 13, Supplementary Figure 5C; Figure 5). In summary, our KEGG analysis results also indicate that light plays an essential regulatory role in light signal transduction, photosynthesis, and photoprotection during gametophyte development in A. flabellulatum.
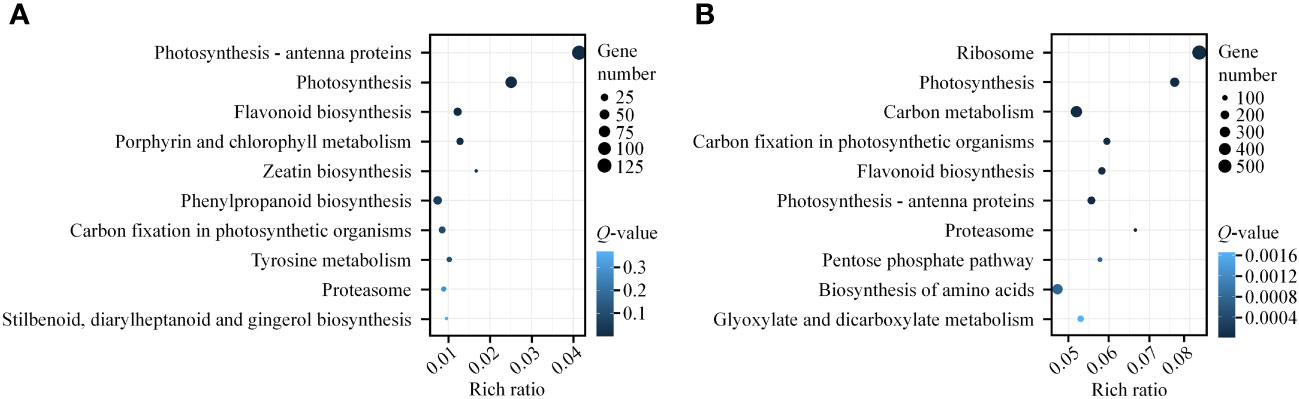
Figure 5 KEGG pathway enrichment analysis of brown and turquoise modules. (A, B): KEGG pathway enrichment analysis of genes in the brown (A) and turquoise (B) modules. The top 10 enriched pathways with the smallest Q-values are presented. The size of the circle corresponds to the number of genes in the pathway, and the color intensity reflects the level of significance (darker colors indicate smaller Q-values).
We predicted transcription factor families for the 10,995 DEGs and identified 34 families, with mTERF, MYB, and bHLH families having the highest number of DEGs at 13 each. The turquoise module had the most predicted transcription factor families (30) and individual transcription factors (95), followed by the yellow module with 13 families and 17 individual factors (Supplementary Table 14, Supplementary Figure 6).
As the “Photosynthesis-antenna proteins” and “Photosynthesis” pathways are significantly enriched in multiple gene modules, we first analyzed the expression of DEGs in these two pathways. The “Photosynthesis-antenna proteins” pathway includes Light-harvesting complex I (LHC I) and Light-harvesting complex II (LHC II), with LHC I containing five subunits (Lhca1-Lhca5) and LHC II containing seven subunits (Lhcb1-Lhcb7). Results showed that among the five gene modules, the “Photosynthesis-antenna proteins” pathway had a total of 327 DEGs, including the 12 subunits mentioned above, mainly belonging to the brown (125) and turquoise (168) modules. These genes were generally expressed at the highest levels under a PPFD of 7.1 μmol m-2 s-1 (brown module) or 145.3 μmol m-2 s-1 (turquoise module) (Supplementary Table 15; Figure 6). In addition, the “Photosynthesis” pathway includes the Photosystem II complex (PSII complex), cytochrome b6/f complex, Photosystem I complex (PSI complex), photosynthetic electron transfer chain, and Adenosine triphosphate synthase (ATP synthase). Results showed that among the five gene modules, the “Photosynthesis” pathway had a total of 370 DEGs, including 30 subunits, such as 11 subunits of the PSII complex (PsbD, PsbO, PsbP, PsbQ, PsbR, PsbS, PsbW, PsbY, PsbZ, Psb27, Psb28), one subunit of the cytochrome b6/f complex (PetC), 10 subunits of the PSI complex (PsaB, PsaD, PsaE, PsaF, PsaG, PsaH, PsaK, PsaL, PsaN, PsaO), 4 subunits of the photosynthetic electron transfer chain (PetE, PetF, PetH, PetJ), and 4 subunits of ATP synthase (gamma, delta, a, b). These DEGs were also mainly distributed in the brown (76) and turquoise (231) modules (Supplementary Table 16, Figure 7).
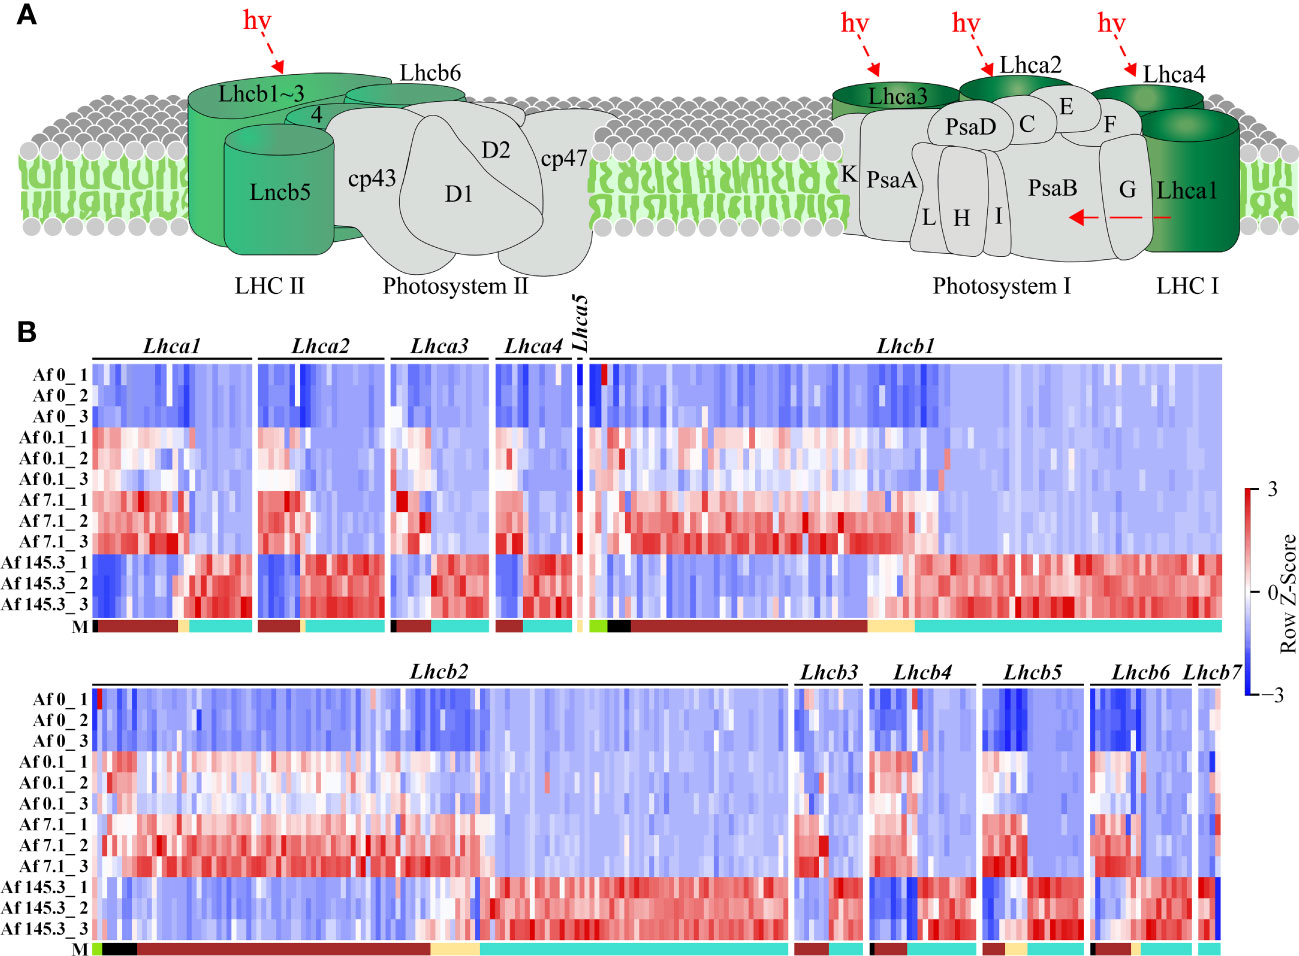
Figure 6 Expression of DEGs in the “Photosynthesis-antenna proteins” pathway across 12 samples. (A): Diagram of the “Photosynthesis-antenna proteins” pathway (source: https://www.kegg.jp/pathway/map00196, accessed on April 14, 2023); (B): Expression profiles of DEGs encoding 12 subunits of LHCI and LHCII across 12 samples. “M” represents the gene module. It can be observed that there are more DEGs in the brown and turquoise modules for this pathway.
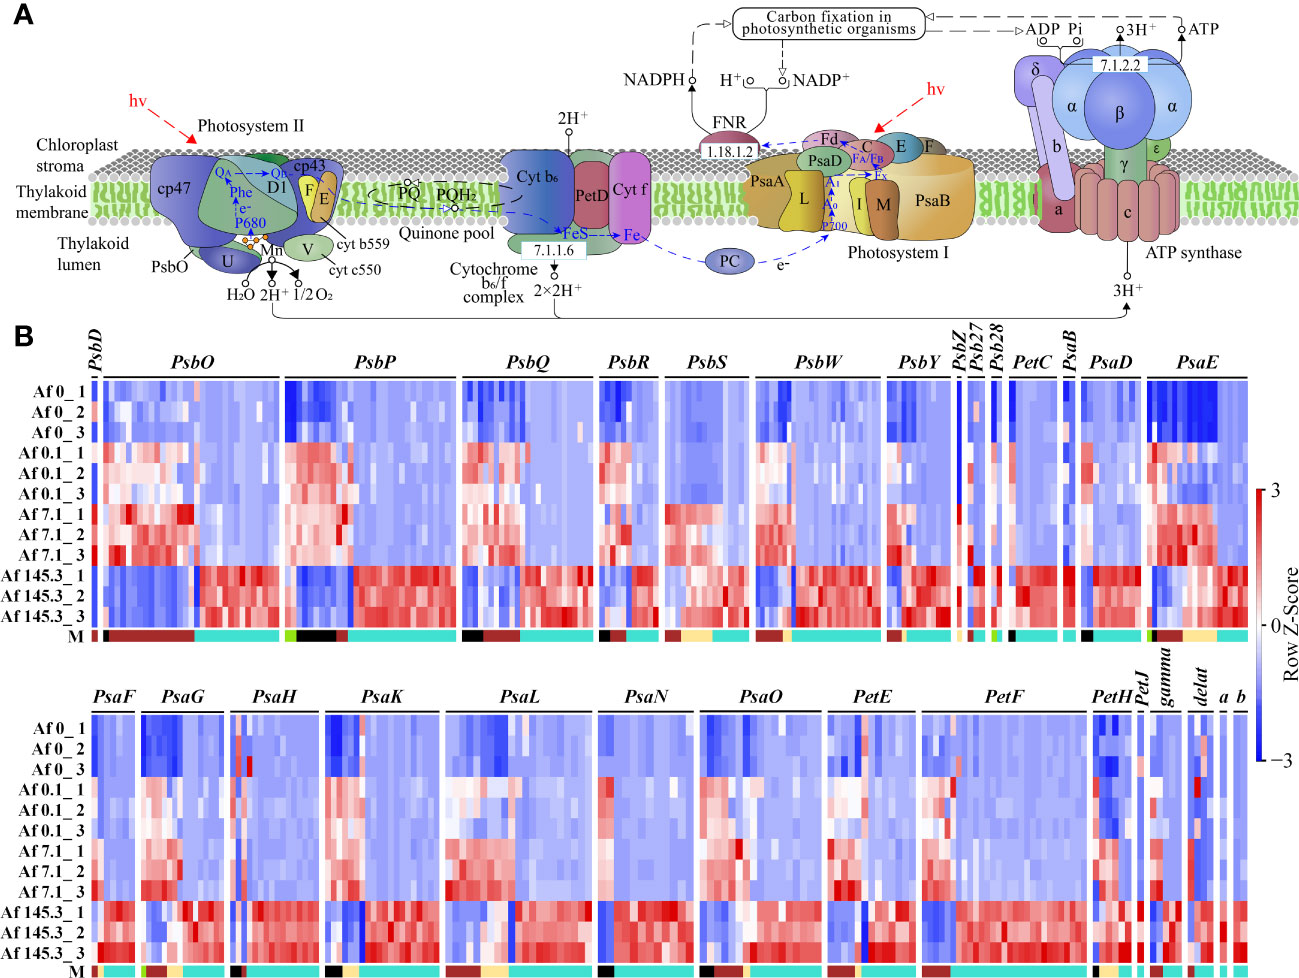
Figure 7 Expression of DEGs in the “Photosynthesis” pathway across 12 samples. (A): Diagram of the “Photosynthesis” pathway (source: https://www.kegg.jp/entry/map00195, accessed on April 14, 2023); (B): Expression profiles of DEGs encoding 30 subunits of the PSII complex (11 subunits: PsbD, PsbO, PsbP, PsbQ, PsbR, PsbS, PsbW, PsbY, PsbZ, Psb27, Psb28), cytochrome b6/f complex (1 subunit: PetC), PSI complex (10 subunits: PsaB, PsaD, PsaE, PsaF, PsaG, PsaH, PsaK, PsaL, PsaN, PsaO), photosynthetic electron transfer chain (4 subunits: PetE, PetF, PetH, PetJ), and ATP synthase (4 subunits: gamma, delta, a, b) in 12 samples. “M” represents gene modules. The brown and turquoise modules contain a larger number of genes.
We also analyzed the DEGs involved in Calvin cycle (141), chlorophyll (61), and carotenoid (28) biosynthesis, and found that these DEGs were mainly classified into the turquoise module (Supplementary Tables 17-19, Supplementary Figures 7-9).
Moreover, mitochondrial transcription termination factors (mTERFs) located in plastids play important regulatory roles in the development and function of chloroplasts. AfmTERFs were detected in the brown, yellow, and turquoise modules, with 1, 1, and 11 members, respectively. Therefore, we constructed a phylogenetic tree of mTERFs from A. flabellulatum and Arabidopsis. The results showed that four AfmTERFs (isoform_43473, isoform_47623, isoform_50012, and isoform_240354) in A. flabellulatum were homologous to AtmTERF6, one (isoform_20996) was homologous to AtmTERF9, and two (isoform_83065 and isoform_91611) were homologous to AtmTERF12 (Supplementary Table 20, Supplementary Figure 10). Interestingly, all seven AfmTERFs belonged to the turquoise module.
Based on the analysis in the previous sections, we found that the flavonoid biosynthesis pathway is significantly enriched in multiple gene modules, particularly in the brown, yellow, and turquoise modules. Therefore, we analyzed the expression of DEGs in this pathway. Our results show that there are 210 DEGs encoding 13 enzymes, including CHS, CHI, F3H, and FLS, which are key enzymes in the flavonoid biosynthesis pathway. These DEGs mainly belong to the turquoise module (Supplementary Table 21; Figure 8). Thus, we suggest that light, especially strong light, strongly upregulates the expression of genes encoding flavonoid biosynthesis enzymes in the gametophyte of A. flabellulatum.
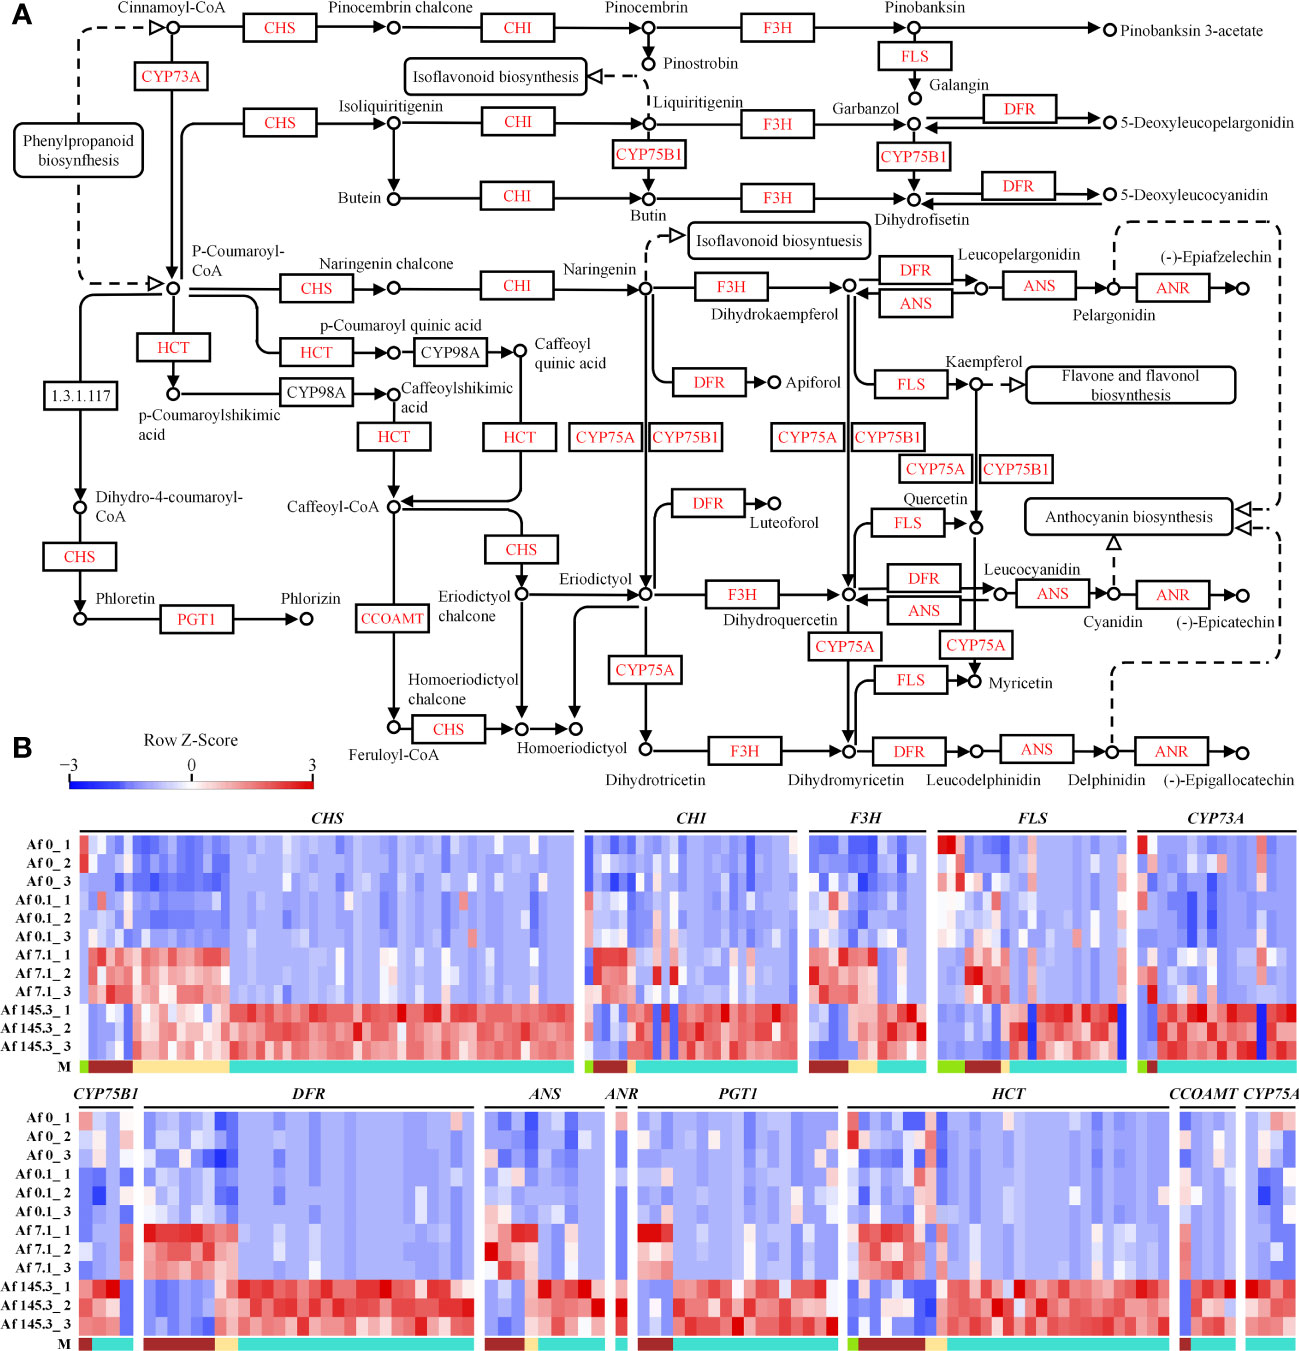
Figure 8 Expression of DEGs in the “Flavonoid Biosynthesis” pathway across 12 samples. (A): “Flavonoid Biosynthesis” pathway (Source: https://www.kegg.jp/pathway/map00941, accessed on April 14, 2023); (B): Expression profiles of DEGs encoding CHS, CHI, F3H, FLS, CYP73A, CYP75B1, DFR, ANS, ANR, PGT1, HCT, CCOAMT, and CYP75A in 12 samples. “M” represents gene modules, with a higher number of DEGs observed in the turquoise module.
The MYB and bHLH families of transcription factors are important in plant responses to abiotic stress. These two types of transcription factors were detected in four modules, with the highest number found in the turquoise module. Therefore, we performed co-expression analysis of flavonoid biosynthesis genes and MYB/bHLH transcription factor genes in A. flabellulatum. Our results showed that the encoding genes of flavonoid biosynthesis enzymes, CHS, DFR, HCT, and CHI, have a wide range of co-expression relationships with MYBs and bHLHs, with 39, 20, 20, and 19 genes in the turquoise module, respectively (Supplementary Table 22; Figure 9). Furthermore, we also found co-expression relationships between MYBs and bHLHs in the turquoise module.
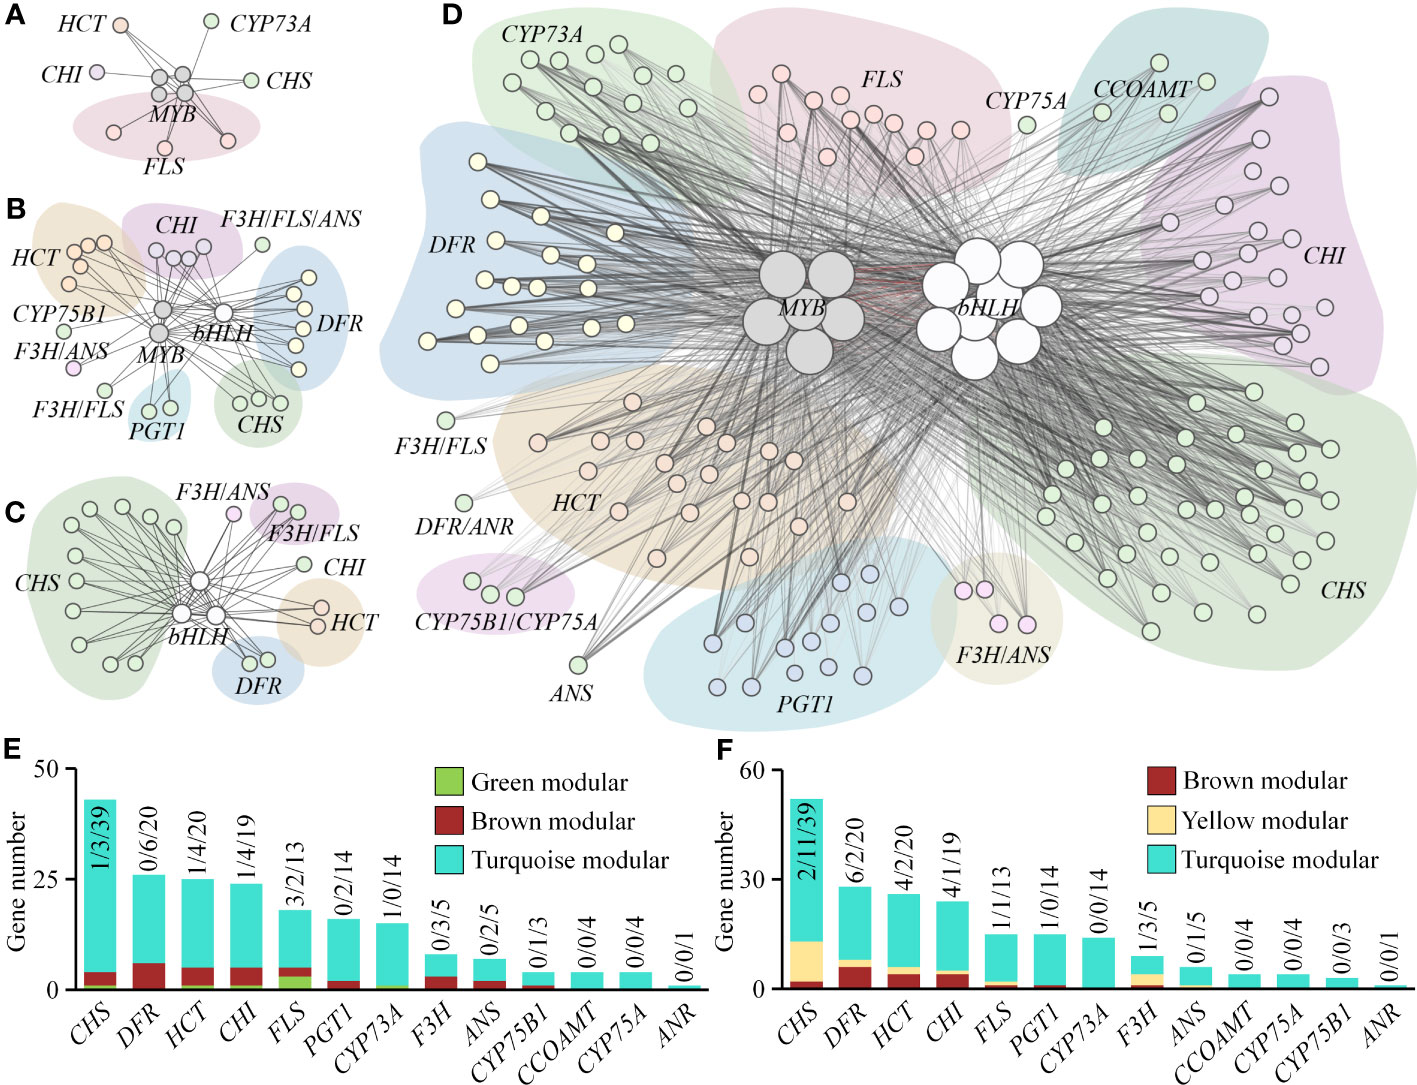
Figure 9 Co-expression network of flavonoid biosynthesis genes and MYB/bHLH transcription factor genes. (A–D): Co-expression networks of flavonoid biosynthesis genes and MYB/bHLH transcription factor genes in green, brown, yellow, and turquoise modules, respectively. Nodes represent genes, with larger nodes indicating higher degree values. Lines represent co-expression weights between genes, with thicker and darker lines indicating higher weight values. (E, F): Number of co-expressed flavonoid biosynthetic enzyme-coding genes with MYB and bHLH transcription factor genes, respectively. Additionally, we found a co-expression relationship between AfMYBs and AfbHLHs in the turquoise module, indicated by red lines.
To validate the accuracy of the transcriptomic data, we selected 15 DEGs for qRT-PCR analysis. These included two genes from the “Photosynthesis-Antenna Proteins” pathway (Lhca3 and Lhcb1/Lhcb2), three genes from the “Photosynthesis” pathway (PsaG, PsaL, and PetE), nine genes from the “Flavonoid Biosynthesis” pathway (CHSs, CHIs, F3H, ANS, DFR, and HCTs), and Cryptochrome (CRY). Our qRT-PCR results demonstrated that the expression patterns of these 15 genes were consistent with the transcriptomic data, confirming the reliability of our transcriptomic analysis (Supplementary Table 23; Figure 10).
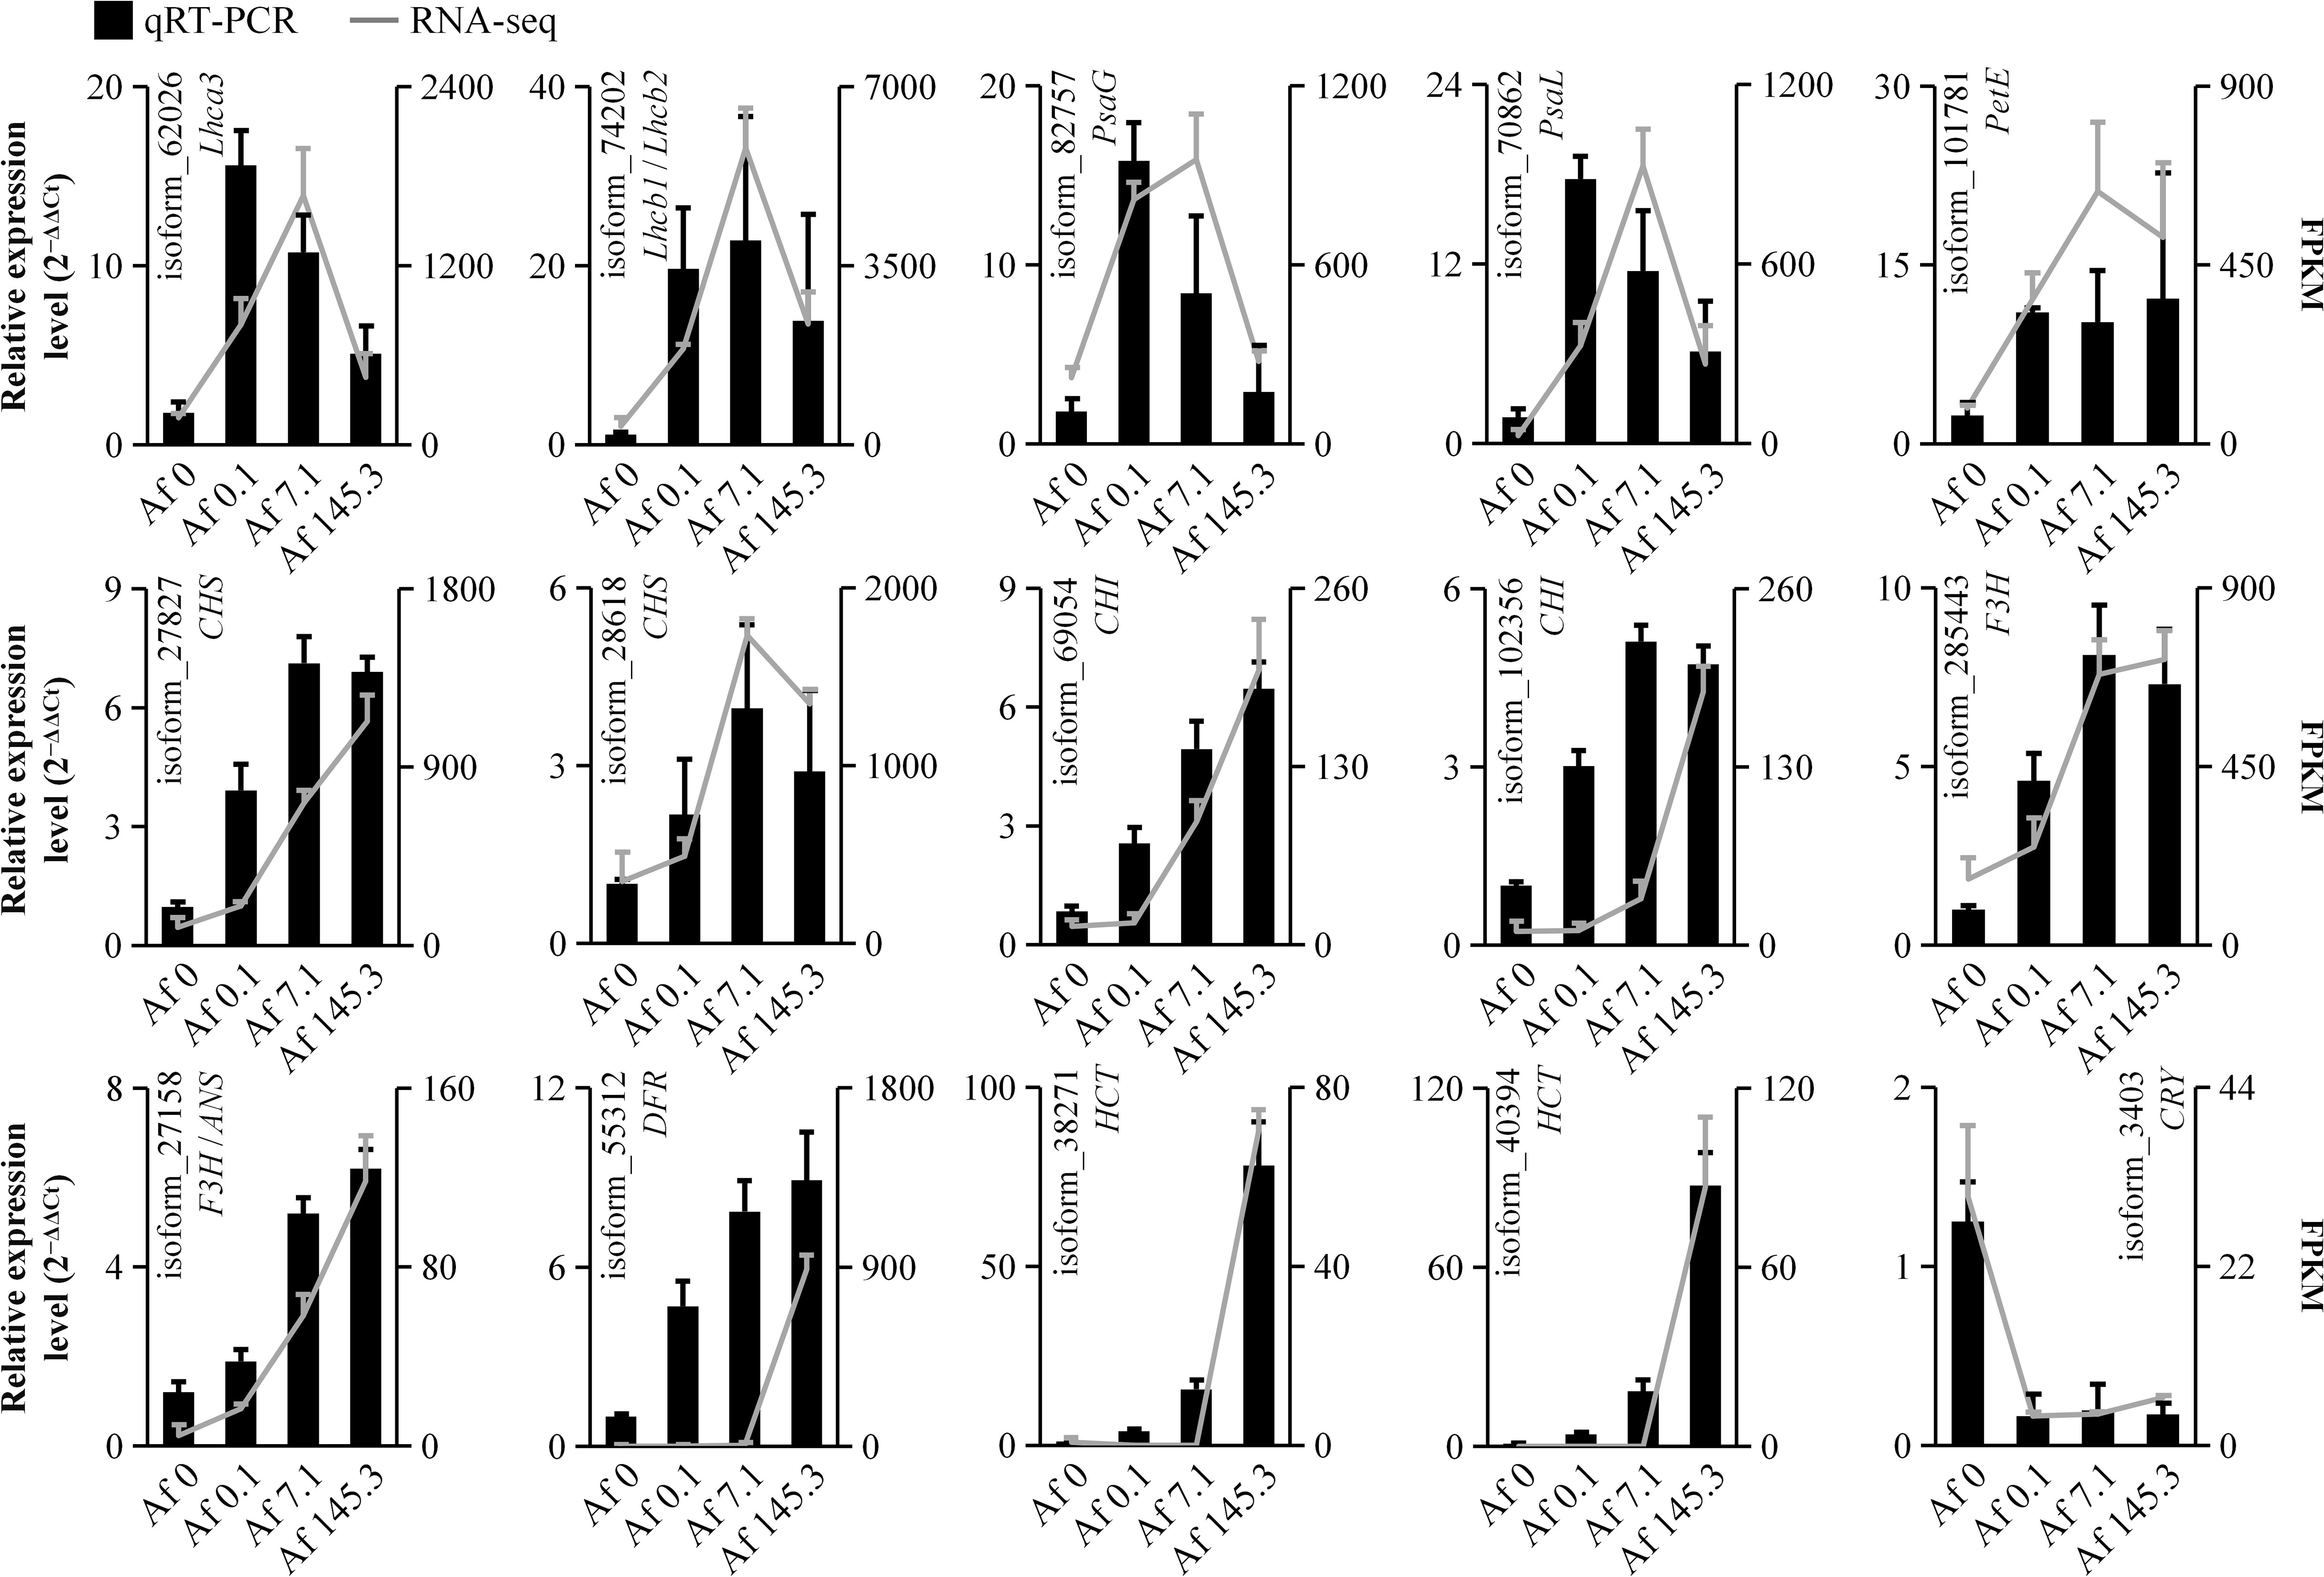
Figure 10 Real-time quantitative polymerase chain reaction. The expression trends of 15 DEGs were validated by qRT-PCR, with the bar chart and line chart representing the results of qRT-PCR and transcriptome, respectively. The consistency between qRT-PCR and transcriptome results suggests the reliability of the transcriptome data.
The gametophytes of ferns are small in size and need to constantly sense and utilize the scattered sunlight that passes through the forest canopy to survive. In our study, GO enrichment analysis of the green module identified 8 out of 21 enriched terms related to light signaling. Notably, “photoreceptor activity” had the smallest Q-value and the highest number of genes (Supplementary Figure 4A). Additionally, KEGG enrichment analysis showed significant enrichment of the “Circadian rhythm-plant” pathway in the green module, with the smallest Q-value and a relatively large number of genes (Supplementary Figure 5A). Phytochromes (PHYs) and cryptochromes (CRYs) are the primary photoreceptors that mediate light-induced signaling and regulate circadian rhythms in plants (Guo et al., 1998; Oakenfull and Davis, 2017). In the green module, we identified three PHYB genes and five CRY1 genes that were significantly downregulated at a PPFD of only 0.1 μmol m-2 s-1 (Supplementary Table 24, Supplementary Figure 11). We also observed a significant increase in gametophyte perimeter under a low PPFD of 0.1 μmol m-2 s-1. As A. flabellulatum predominantly thrives in humid understory environments (Yang, 2015), we conclude that its gametophytes exhibit high sensitivity to low light, a trait likely linked to their adaptation to such conditions.
Mitochondrial transcription termination factors (mTERFs) are a class of transcriptional regulators encoded by nuclear genes. Originally discovered in animal mitochondria, mTERFs have been found to play a role in transcriptional regulation not only in animal mitochondria but also in plant chloroplasts and mitochondria (Roberti et al., 2009; Babiychuk et al., 2011). In Arabidopsis, AtmTERF6 is localized to both chloroplasts and mitochondria, while AtmTERF9 and AtmTERF12 are localized to chloroplasts. Among them, AtmTERF6 and AtmTERF9 have been shown to play important roles in photosynthesis and chloroplast development (Robles et al., 2015; Romani et al., 2015; Xu et al., 2017; Zhang et al., 2018), while the function of AtmTERF12 remains relatively limited (Xu et al., 2017). Single mutants of mterf6 and mterf9 in Arabidopsis exhibited reduced levels of 16S and 23S rRNA of the small and large plastid ribosomal subunits in chloroplasts, decreased number of chloroplast ribosomes, and affected protein translation in chloroplasts, leading to impaired chloroplast development, reduced chlorophyll a and b content, decreased number of mesophyll cells, and leaf whitening (Robles et al., 2015; Romani et al., 2015; Robles et al., 2018; Zhang et al., 2018; Meteignier et al., 2021). In comparison, the double mutant mterf6-5 mterf9 in Arabidopsis seedlings exhibited a more pronounced pale/albino phenotype, indicating a synergistic effect between the genes (Robles et al., 2018). In this study, we discovered that there are five AfmTERFs (isoform_47623, isoform_43473, isoform_20996, isoform_83065, and isoform_91611) in the gametophytes of A. flabellulatum, which show homology to AtmTERF6, AtmTERF9, or AtmTERF12, and their encoding genes were up-regulated under strong light (145.3 μmol m-2 s-1). Given the localization and functional significance of mTERFs in other plant systems, we speculate that these AfmTERFs may play a crucial role in balancing the effects of light damage in fern gametophytes under strong light stimulation, ensuring the safe and efficient photosynthetic process. Further studies should aim to elucidate the precise molecular mechanisms underlying AfmTERF function and their impact on fern gametophyte development and survival.
Flavonoids play a vital role in photoprotection in plants by scavenging free radicals and suppressing the generation of reactive oxygen species (Agati et al., 2012). Strong light exposure promotes the expression of genes encoding flavonoid biosynthesis enzymes, such as CHS, CHI, and F3H, in various angiosperms, including Arabidopsis thaliana, Petunia, and Medicago sativa seedlings, enhancing flavonoid biosynthesis and providing photodamage defense. In this study, we found that light exposure, particularly strong light, significantly increased the expression of genes encoding 13 flavonoid biosynthesis enzymes in A. flabellulatum gametophytes, including key enzymes such as CHS, CHI, and F3H. This is the first report of such induction in fern gametophytes, although it has been reported in various angiosperms (Albert et al., 2009; Gao et al., 2019; Zheng et al., 2021). Meanwhile, we detected stable total flavonoid content in A. flabellulatum gametophytes under different PPFD levels (Supplementary Figure 12). Therefore, we hypothesize that the upregulation of relevant enzyme gene expression maintains the stable total flavonoid content during the process of responding to photodamage in A. flabellulatum gametophytes.
Transcription factors, particularly MYB and bHLH, regulate the expression of flavonoid biosynthesis genes. Previous studies have demonstrated that many MYB transcription factors can regulate the expression of flavonoid biosynthesis genes such as CHS, CHI, F3H, and DFR, promoting flavonoid biosynthesis (Dubos et al., 2010). For instance, AtMYB11, AtMYB12, and AtMYB111 in Arabidopsis can directly bind to the promoter of flavonoid biosynthesis genes like AtCHS, AtCHI, and AtF3H, directly regulating the expression of flavonoid biosynthesis genes (Stracke et al., 2007). Additionally, MYB can form binary or ternary complexes with bHLH and WD40 to co-regulate the expression of flavonoid biosynthesis genes (Xu et al., 2015), as seen in the MYB-bHLH-WD40 ternary complex in Arabidopsis and the MYB10-bHLH3 binary protein complex in red-fleshed apples (Malus sieversii f. niedzwetzkyana), which directly regulate the expression of DFR, promoting anthocyanin biosynthesis (Gonzalez et al., 2016; Wang et al., 2017). Light closely regulates MYB expression, as seen with MdMYB1 in apples (Malus domestica) and PpMYB10 in red Chinese sand pears (Pyrus pyrifolia), which are induced by light and regulate the expression of DFR, CHS, and ANS genes, promoting flavonoid biosynthesis (Takos et al., 2006; Bai et al., 2017). In this study, we found that several MYB and bHLH transcription factors in A. flabellulatum have a strong co-expression relationship with flavonoid biosynthesis genes encoding CHS, CHI, DFR, and F3H. Therefore, we hypothesize that under strong light irradiation, MYB and bHLH transcription factors in A. flabellulatum gametophytes are activated to regulate the expression of flavonoid biosynthesis genes, promoting flavonoid biosynthesis and playing a photoprotective role.
In summary, this study not only provides valuable insights into the protection and cultivation of A. flabellulatum but also serves as a reference for further research on gametophytes of ferns’ responses to light. The comprehensive analysis of the light response in A. flabellulatum gametophytes sheds light on their sensitivity to different light conditions, which is likely an adaptation to their natural understory habitats. Furthermore, the identification of AfmTERFs and their potential role in photoprotection enhances our understanding of fern gametophyte survival strategies under varying light intensities. The upregulation of flavonoid biosynthesis genes under strong light exposure highlights the significance of these secondary metabolites in photoprotection, offering potential avenues for future research on fern photobiology and stress responses.
The datasets presented in this study can be found in online repositories. The names of the repository/repositories and accession number(s) can be found below: https://www.ncbi.nlm.nih.gov/genbank/, PRJNA868202.
ZC and JL conceived and designed the study. ZC, XW and ZX performed experiments. ZC, XW, ZX and ZW analyzed the data. ZC, XW, ZX, ZW, XS and JL drafted the manuscript. ZC, XW, ZX, XY, SX and JL finalized the manuscript. JL, ZC and XY provided the funding acquisition. All authors contributed to the article and approved the submitted version.
This work was supported by the Major Science and Technology plan of Hainan Province (ZDKJ2021018), the Natural Science Foundation of Hainan Province (No.322RC772; No.321QN316; No.319MS017; No.320RC508), the Program of Hainan Association for Science and Technology Plans to Youth Science and Techonology Talent Innovation (QCQTXM202201), the National Natural Science Foundation of China (No.31660229), the Hainan University Scientific Research Startup Fund Project (No.kyqd1620).
We sincerely thank reviewers and editors of the Frontiers in Plant Science for providing valuable suggestions on this paper.
The authors declare that the research was conducted in the absence of any commercial or financial relationships that could be construed as a potential conflict of interest.
All claims expressed in this article are solely those of the authors and do not necessarily represent those of their affiliated organizations, or those of the publisher, the editors and the reviewers. Any product that may be evaluated in this article, or claim that may be made by its manufacturer, is not guaranteed or endorsed by the publisher.
The Supplementary Material for this article can be found online at: https://www.frontiersin.org/articles/10.3389/fpls.2023.1222414/full#supplementary-material
Agati, G., Azzarello, E., Pollastri, S., Tattini, M. (2012). Flavonoids as antioxidants in plants: Location and functional significance. Plant Sci. 196, 67–76. doi: 10.1016/j.plantsci.2012.07.014
Albert, N. W., Lewis, D. H., Zhang, H., Irving, L. J., Jameson, P. E., Davies, K. M. (2009). Light-induced vegetative anthocyanin pigmentation in Petunia. J. Exp. Bot. 60 (7), 2191–2202. doi: 10.1093/jxb/erp097
Arabidopsis Genome, I. (2000). Analysis of the genome sequence of the flowering plant Arabidopsis thaliana. Nature 408 (6814), 796–815. doi: 10.1038/35048692
Babiychuk, E., Vandepoele, K., Wissing, J., Garcia-Diaz, M., De Rycke, R., Akbari, H., et al. (2011). Plastid gene expression and plant development require a plastidic protein of the mitochondrial transcription termination factor family. Proc. Natl. Acad. Sci. U.S.A. 108 (16), 6674–6679. doi: 10.1073/pnas.1103442108
Bai, S. L., Sun, Y. W., Qian, M. J., Yang, F. X., Ni, J. B., Tao, R. Y., et al. (2017). Transcriptome analysis of bagging-treated red Chinese sand pear peels reveals light-responsive pathway functions in anthocyanin accumulation. Sci. Rep. 7 (1), 63. doi: 10.1038/s41598-017-00069-z
Cai, Z. P., Huang, Z., Wang, Z. X., Tao, Y., Wu, F. H., Yu, X. D., et al. (2021). Identification of the related genes on the asymmetric root growth of Oryza sativa induced by ethylene through transcriptome sequencing, GO and KEGG analysis. Acta Physiol Plantarum 43 (7), 99. doi: 10.1007/s11738-021-03271-9
Cai, Z. P., Xie, Z. Y., Huang, L. Y., Wang, Z. X., Pan, M., Yu, X. D., et al. (2022a). Full-length transcriptome analysis of Adiantum flabellulatum gametophyte. PeerJ 10, e13079. doi: 10.7717/peerj.13079
Cai, Z. P., Xie, Z. Y., Wang, X. C., Zhang, S. X., Wu, Q., Yu, X. D., et al. (2022b). Excavation of genes responsive to brassinosteroids by transcriptome sequencing in Adiantum flabellulatum gametophytes. Genes (Basel) 13, (6). doi: 10.3390/genes13061061
Costarelli, A., Cannavo, S., Cerri, M., Pellegrino, R. M., Reale, L., Paolocci, F., et al. (2021). Light and temperature shape the phenylpropanoid profile of Azolla filiculoides fronds. Front. Plant Sci. 12. doi: 10.3389/fpls.2021.727667
de Wit, M., Galvao, V. C., Fankhauser, C. (2016). Light-mediated hormonal regulation of plant growth and development. Annu. Rev. Plant Biol. 67, 513–537. doi: 10.1146/annurev-arplant-043015-112252
Dubos, C., Stracke, R., Grotewold, E., Weisshaar, B., Martin, C., Lepiniec, L. (2010). MYB transcription factors in Arabidopsis. Trends Plant Sci. 15 (10), 573–581. doi: 10.1016/j.tplants.2010.06.005
Ferreyra, M. L. F., Serra, P., Casati, P. (2021). Recent advances on the roles of flavonoids as plant protective molecules after UV and high light exposure. Physiol. Plant 173 (3), 736–749. doi: 10.1111/ppl.13543
Friend, D. J. C. (1974). Shade adaptation of the Hawaiian tree·fern (Cibotium glaucum Vol. 41 (Honolulu (HI: Island Ecosystems IRP, U.S. International Biological Program. International Biological Program Technical Report), 39.
Gao, L. M., Liu, Y., Wang, X. F., Li, Y. F., Han, R. (2019). Lower levels of UV-B light trigger the adaptive responses by inducing plant antioxidant metabolism and flavonoid biosynthesis in Medicago sativa seedlings. Funct. Plant Biol. 46 (10), 896–906. doi: 10.1071/FP19007
Gonzalez, A., Brown, M., Hatlestad, G., Akhavan, N., Smith, T., Hembd, A., et al. (2016). TTG2 controls the developmental regulation of seed coat tannins in Arabidopsis by regulating vacuolar transport steps in the proanthocyanidin pathway. Dev. Biol. 419 (1), 54–63. doi: 10.1016/j.ydbio.2016.03.031
Guo, H. W., Yang, H. Y., Mockler, T. C., Lin, C. T. (1998). Regulation of flowering time by Arabidopsis photoreceptors. Science 279 (5355), 1360–1363. doi: 10.1126/science.279.5355.1360
Jin, J. P., Tian, F., Yang, D. C., Meng, Y. Q., Kong, L., Luo, J. C., et al. (2017). PlantTFDB 4.0: toward a central hub for transcription factors and regulatory interactions in plants. Nucleic Acids Res. 45 (D1), D1040–D1045. doi: 10.1093/nar/gkw982
Johnson, G. N., Rumsey, F. J., Headley, A. D., Sheffield, E. (2000). Adaptations to extreme low light in the fern TrichOmanes speciosum. New Phytol. 148 (3), 423–431. doi: 10.1046/j.1469-8137.2000.00772.x
Krieg, C. P., Chambers, S. M. (2022). The ecology and physiology of fern gametophytes: A methodological synthesis. Appl. Plant Sci. 10, (2). doi: 10.1002/aps3.11464
Li, F. W., Brouwer, P., Carretero-Paulet, L., Cheng, S. F., de Vries, J., Delaux, P. M., et al. (2018). Fern genomes elucidate land plant evolution and cyanobacterial symbioses. Nat. Plants 4 (7), 460–472. doi: 10.1038/s41477-018-0188-8
Liao, J. X., Zhang, H., Mo, L., Huang, Y. Q., Sun, Y. J., Li, Y. Q. (2017). Differences in growth and biomass allocation of Adiantum flabellulatum and A. capillus-veneris as a result of light and water availability. Bot. Lett. 164 (4), 393–400. doi: 10.1080/23818107.2017.1396496
Liu, L., Shu, J. P., Wei, H. P., Zhang, R., Shen, H., Yan, Y. H. (2016). De novo transcriptome analysis of the rare fern Monachosorum maximowiczii (Dennstaedtiaceae) endemic to East Asia. Biodiversity Sci. 24, 1325–1334. doi: 10.17520/biods.2016231
Meteignier, L. V., Ghandour, R., Zimmerman, A., Kuhn, L., Meurer, J., Zoschke, R., et al. (2021). Arabidopsis mTERF9 protein promotes chloroplast ribosomal assembly and translation by establishing ribonucleoprotein interactions in vivo. Nucleic Acids Res. 49 (2), 1114–1132. doi: 10.1093/nar/gkaa1244
Miller, J. H., Miller, P. M. (1961). The effect of different light conditions and sucrose on the growth and development of the gametophyte of the fern. Onoclea sensibilis. Botanical Soc. America 48 (2), 154–159. doi: 10.1002/j.1537-2197.1961.tb11619.x
Nitta, J. H., Watkins, J. E., Holbrook, N. M., Wang, T. W., Davis, C. C. (2021). Ecophysiological differentiation between life stages in filmy ferns (Hymenophyllaceae). J. Plant Res. 134 (5), 971–988. doi: 10.1007/s10265-021-01318-z
Oakenfull, R. J., Davis, S. J. (2017). Shining a light on the Arabidopsis circadian clock. Plant Cell Environ. 40 (11), 2571–2585. doi: 10.1111/pce.13033
Pfaffl, M. W. (2001). A new mathematical model for relative quantification in real-time RT-PCR. Nucleic Acids Res. 29 (9), e45. doi: 10.1093/nar/29.9.e45
Poorter, H., Niinemets, U., Ntagkas, N., Siebenkas, A., Maenpaa, M., Matsubara, S., et al. (2019). A meta-analysis of plant responses to light intensity for 70 traits ranging from molecules to whole plant performance. New Phytol. 223 (3), 1073–1105. doi: 10.1111/nph.15754
Roberti, M., Polosa, P. L., Bruni, F., Manzari, C., Deceglie, S., Gadaleta, M. N., et al. (2009). The MTERF family proteins: mitochondrial transcription regulators and beyond. Biochim. Biophys. Acta 1787 (5), 303–311. doi: 10.1016/j.bbabio.2009.01.013
Robles, P., Micol, J. L., Quesada, V. (2015). Mutations in the plant-conserved MTERF9 alter chloroplast gene expression, development and tolerance to abiotic stress in Arabidopsis thaliana. Physiol. Plant 154 (2), 297–313. doi: 10.1111/ppl.12307
Robles, P., Nunez-Delegido, E., Ferrandez-Ayela, A., Sarmiento-Manus, R., Micol, J. L., Quesada, V. (2018). Arabidopsis mTERF6 is required for leaf patterning. Plant Sci. 266, 117–129. doi: 10.1016/j.plantsci.2017.11.003
Romani, I., Manavski, N., Morosetti, A., Tadini, L., Maier, S., Kuhn, K., et al. (2015). A member of the Arabidopsis Mitochondrial Transcription Termination Factor family is required for maturation of chloroplast transfer RNAIle (GAU). Plant Physiol. 169 (1), 627–646. doi: 10.1104/pp.15.00964
Santos, E. L., Maia, B.H.L.N.S., Ferriani, A. P., Teixeira, S. D. (2017). Flavonoids: Classification, biosynthesis and chemical ecology. In flavonoids : from biosynthesis to human health. (London, UK: IntechOpen) 13, 78–94. doi: 10.5772/67861
Schneider, H., Schuettpelz, E., Pryer, K. M., Cranfill, R., Magallon, S., Lupia, R. (2004). Ferns diversified in the shadow of angiosperms. Nature 428 (6982), 553–557. doi: 10.1038/nature02361
Sessa, E. B., Der, J. P. (2016). Evolutionary genomics of ferns and lycophytes. Adv. Bot. Res. 78, 215–254. doi: 10.1016/bs.abr.2016.02.001
Shahriar, M., Kabir, S. (2011). Analgesic activity of Adiantum flabellulatum. Dhaka Univ. J. Biol. Sci. 20, 91–93. doi: 10.3329/dujbs.v20i1.8877
Shannon, P., Markiel, A., Ozier, O., Baliga, N. S., Wang, J. T., Ramage, D., et al. (2003). Cytoscape: a software environment for integrated models of biomolecular interaction networks. Genome Res. 13 (11), 2498–2504. doi: 10.1101/gr.1239303
Stracke, R., Ishihara, H., Huep, G., Barsch, A., Mehrtens, F., Niehaus, K., et al. (2007). Differential regulation of closely related R2R3-MYB transcription factors controls flavonol accumulation in different parts of the Arabidopsis thaliana seedling. Plant J. 50 (4), 660–677. doi: 10.1111/j.1365-313X.2007.03078.x
Strader, L., Weijers, D., Wagner, D. (2022). Plant transcription factors - being in the right place with the right company. Curr. Opin. Plant Biol. 65, 102136. doi: 10.1016/j.pbi.2021.102136
Sun, L. L., Li, Y., Li, S. S., Wu, X. J., Hu, B. Z., Chang, Y. (2014). Identification and characterisation of DfCHS, a chalcone synthase gene regulated by temperature and ultraviolet in Dryopteris fragrans. Cell Mol. Biol. (Noisy-le-grand) 60 (6), 1–7. doi: 10.14715/cmb/2014.60.6.1
Takahashi, S., Badger, M. R. (2011). Photoprotection in plants: a new light on photosystem II damage. Trends Plant Sci. 16 (1), 53–60. doi: 10.1016/j.tplants.2010.10.001
Takos, A. M., Jaffe, F. W., Jacob, S. R., Bogs, J., Robinson, S. P., Walker, A. R. (2006). Light-induced expression of a MYB gene regulates anthocyanin biosynthesis in red apples. Plant Physiol. 142 (3), 1216–1232. doi: 10.1104/pp.106.088104
Tian, F., Yang, D. C., Meng, Y. Q., Jin, J., Gao, G. (2020). PlantRegMap: charting functional regulatory maps in plants. Nucleic Acids Res. 48 (D1), D1104–D1113. doi: 10.1093/nar/gkz1020
Tian, T., You, Q., Zhang, L., Yi, X., Yan, H. Y., Xu, W. Y., et al. (2016). SorghumFDB: sorghum functional genomics database with multidimensional network analysis. Database 2016, baw099. doi: 10.1093/database/baw099
Wang, N., Xu, H. F., Jiang, S. H., Zhang, Z. Y., Lu, N. L., Qiu, H. R., et al. (2017). MYB12 and MYB22 play essential roles in proanthocyanidin and flavonol synthesis in red-fleshed apple (Malus sieversii f. niedzwetzkyana). Plant J. 90 (2), 276–292. doi: 10.1111/tpj.13487
Xu, W. J., Dubos, C., Lepiniec, L. (2015). Transcriptional control of flavonoid biosynthesis by MYB-bHLH-WDR complexes. Trends Plant Sci. 20 (3), 176–185. doi: 10.1016/j.tplants.2014.12.001
Xu, D. R., Leister, D., Kleine, T. (2017). Arabidopsis thaliana mTERF10 and mTERF11, but not mTERF12, are involved in the response to salt stress. Front. Plant Sci. 8. doi: 10.3389/fpls.2017.01213
Yang, X. B. (2015). "Pteridaceae" in Flora of Hainan: Volume I. Ed. Yang, D. M., et al (Beijing: Science Press), 156.
Yang, M. Q., You, W. J., Wu, S. W., Fan, Z., Xu, B. F., Zhu, M. L., et al. (2017). Global transcriptome analysis of Huperzia serrata and identification of critical genes involved in the biosynthesis of huperzine A. BMC Genomics 18 (1), 245. doi: 10.1186/s12864-017-3615-8
Zhang, Y., Cui, Y. L., Zhang, X. L., Yu, Q. B., Wang, X., Yuan, X. B., et al. (2018). A nuclear-encoded protein, mTERF6, mediates transcription termination of rpoA polycistron for plastid-encoded RNA polymerase-dependent chloroplast gene expression and chloroplast development. Sci. Rep. 8 (1), 11929. doi: 10.1038/s41598-018-30166-6
Zheng, X. T., Yu, Z. C., Tang, J. W., Cai, M. L., Chen, Y. L., Yang, C. W., et al. (2021). The major photoprotective role of anthocyanins in leaves of Arabidopsis thaliana under long-term high light treatment: antioxidant or light attenuator? Photosynth Res. 149 (1-2), 25–40. doi: 10.1007/s11120-020-00761-8
Keywords: fern gametophyte, light signal, photosynthesis, photoprotection, weighted gene co-expression network analysis
Citation: Cai Z, Wang X, Xie Z, Wen Z, Yu X, Xu S, Su X and Luo J (2023) Light response of gametophyte in Adiantum flabellulatum: transcriptome analysis and identification of key genes and pathways. Front. Plant Sci. 14:1222414. doi: 10.3389/fpls.2023.1222414
Received: 14 May 2023; Accepted: 22 August 2023;
Published: 07 September 2023.
Edited by:
Eleni Tani, Agricultural University of Athens, GreeceReviewed by:
Sofia D. Carvalho, Independent Researcher, Laramie, WY, United StatesCopyright © 2023 Cai, Wang, Xie, Wen, Yu, Xu, Su and Luo. This is an open-access article distributed under the terms of the Creative Commons Attribution License (CC BY). The use, distribution or reproduction in other forums is permitted, provided the original author(s) and the copyright owner(s) are credited and that the original publication in this journal is cited, in accordance with accepted academic practice. No use, distribution or reproduction is permitted which does not comply with these terms.
*Correspondence: Jiajia Luo, bHVvamlhamlhQGNhdGFzLmNu; MTM5MDk0ODE5MTlAMTI2LmNvbQ==
†These authors have contributed equally to this work
Disclaimer: All claims expressed in this article are solely those of the authors and do not necessarily represent those of their affiliated organizations, or those of the publisher, the editors and the reviewers. Any product that may be evaluated in this article or claim that may be made by its manufacturer is not guaranteed or endorsed by the publisher.
Research integrity at Frontiers
Learn more about the work of our research integrity team to safeguard the quality of each article we publish.