 Lu Lu
Lu Lu Su Ryun Choi
 Yong Pyo Lim
 Si-Yong Kang3,4*†
 So Young Yi
- 1Institute of Agricultural Science, Chungnam National University, Daejeon, Republic of Korea
- 2Molecular Genetics and Genomics Laboratory, Department of Horticulture, Chungnam National University, Daejeon, Republic of Korea
- 3Department of Horticulture, College of Industrial Sciences, Kongju National University, Yesan, Republic of Korea
- 4Research Center of Crop Breeding for Omics and Artificial Intelligence, Kongju National University, Yesan, Republic of Korea
The production of Brassica oleracea, an important vegetable crop, is severely affected by black rot disease caused by the bacterial pathogen Xanthomonas campestris pv. campestris. Resistance to race 1, the most virulent and widespread race in B. oleracea, is under quantitative control; therefore, identifying the genes and genetic markers associated with resistance is crucial for developing resistant cultivars. Quantitative trait locus (QTL) analysis of resistance in the F2 population developed by crossing the resistant parent BR155 with the susceptible parent SC31 was performed. Sequence GBS approach was used to develop a genetic linkage map. The map contained 7,940 single nucleotide polymorphism markers consisting of nine linkage groups spanning 675.64 cM with an average marker distance of 0.66 cM. The F2:3 population (N = 126) was evaluated for resistance to black rot disease in summer (2020), fall (2020), and spring (2021). QTL analysis, using a genetic map and phenotyping data, identified seven QTLs with LOD values between 2.10 and 4.27. The major QTL, qCaBR1, was an area of overlap between the two QTLs identified in the 2nd and 3rd trials located at C06. Among the genes located in the major QTL interval, 96 genes had annotation results, and eight were found to respond to biotic stimuli. We compared the expression patterns of eight candidate genes in susceptible (SC31) and resistant (BR155) lines using qRT-PCR and observed their early and transient increases or suppression in response to Xanthomonas campestris pv. campestris inoculation. These results support the involvement of the eight candidate genes in black rot resistance. The findings of this study will contribute towards marker-assisted selection, additionally the functional analysis of candidate genes may elucidate the molecular mechanisms underlying black rot resistance in B. oleracea.
1 Introduction
Brassica oleracea is a plant species that includes several popular vegetables such as broccoli, cauliflower, kale, Brussels sprouts, and cabbage, which are grown and consumed worldwide. Black rot is one of the most prevalent diseases among these crops, caused by the bacterial pathogen Xanthomonas campestris pv. campestris (Xcc). Xcc affects B. oleracea crops, causing significant economic losses and reducing production performance and quality (Dhar and Singh, 2014). The disease can be transmitted through infected seeds, infested soil, crop residues, and various environmental and mechanical means (Vicente and Holub, 2013). Xcc can infect plants at any stage of development and enter through hydathodes, wounds, and other entry points. Symptoms include V-shaped yellow lesions progressing from the leaf margins to the middle vein, darkening of the veins and vascular tissue, premature leaf fall, and stunted growth (Agrios and Dawson, 2004). Xcc has 11 physiological races (Vicente et al., 2001; Cruz et al., 2017), with races 1 (R1) and 4 (R4) being the most aggressive and predominant worldwide (Lema et al., 2012; Vicente and Holub, 2013). Control management for black rot is limited but includes copper application, crop rotation, crop debris, cruciferous weed removal, seed treatment, and cultivation of resistant cultivars (Vicente and Holub, 2013). Among all, growing Xcc-resistant cultivars can help achieve sustainable and effective disease control. However, according to previous reports, the R genes that confer resistance to R1 are present in the B genomes of Brassica carinata (BBCC), Brassica juncea (AABB), and Brassica nigra (BB) (Vicente et al., 2001; Taylor et al., 2002). Currently, no major genes have been identified to be responsible for resistance to black rot in cabbage cultivars. The black rot resistance of most B. oleracea lines is considered to be under quantitative control (Taylor et al., 2002; Lema et al., 2012).
The identification of Quantitative Trait Loci (QTL) associated with black rot resistance in cabbage has been a subject of research for several years. Since Xcc R1 and R4 are considered the most virulent and widespread races in B. oleracea, several studies have been conducted to identify the R-genes/QTLs and markers linked to black rot (Xcc R1 and R4) resistance in B. oleracea. Sharma et al. identified the black rot resistance locus Xca1bc on LG B-7 in Indian mustard (Brassica carinata). They also reported that a single dominant gene controls black rot resistance in B. carinata (Sharma et al., 2016). Two sequence characterized amplified region (SCAR) markers, ScOPO-04833 and ScPKPS-11635, were identified in close linkage with the black rot resistance locus (Xca1Bo) in cauliflower and showed 100% accuracy in differentiating the resistant and susceptible plants of cauliflower breeding lines (Kalia et al., 2017). The identification of QTLs related to resistance to R1 of Xcc in cabbage has been a subject of research for several years (Camargo et al., 1995; Doullah et al., 2011; Kifuji et al., 2012; Tonu et al., 2013; Lee et al., 2015; Afrin et al., 2018; Iglesias-Bernabe et al., 2019). QTLs controlling the resistance to Xcc R1 have been mapped, and two significant QTLs have been identified in LG2 and LG9 in B. oleracea (Camargo et al., 1995; Doullah et al., 2011; Tonu et al., 2013). Kifuji et al. reported a QTL for black rot resistance located on LG C02, which comprises the major QTL in cabbage (Kifuji et al., 2012). Furthermore, researchers have mapped the Xcc R1 resistance locus, Xca1bo, on chromosome 3 in Indian cauliflowers using bulk segregant analysis, while several random amplified polymorphic DNA (RAPD) markers have been linked to Xcc R1 resistance locus (Saha et al., 2014a; Saha et al., 2014b). Lee et al. reported a genetic linkage map where they improved the resolution of a previously developed genetic map, and QTL analysis identified one major (BRQTL-C1_2) and three minor QTLs (BRQTL-C1_1, BRQTL-C3, and BRQTL-C6) (Lee et al., 2015). Iglesias-Bernabé et al. measured five traits related to the initial stages of invasion, success of infection, and spread of the pathogen in a BolTBDH mapping population and identified four single-trait QTLs that confirmed the quantitative nature of Xcc R1 resistance in linkage groups 1, 6, 8, and 9 (Iglesias-Bernabe et al., 2019).
In a previous study (Lu et al., 2021), we selected an Xcc-resistant line, Black rot Resistance 155 (BR155), and a susceptible line, SC31, by comparing symptom development. Using these two cabbage lines, we studied the early defense mechanisms of B. oleracea in response to Xcc infection and found that BR155 had a relatively strong antioxidant activity. These results suggest that regulating ROS accumulation during early Xcc–cabbage interactions may be essential for restricting symptom development. In this study, to identify QTLs for Xcc R1 resistance in BR155, we used a reference-based genotyping by sequencing (GBS) approach for single nucleotide polymorphism (SNP) identification and genotyping of a mapping population. The identified SNPs were used to construct linkage maps and to detect loci associated with black rot resistance.
2 Methods
2.1 Plant materials
In a previous study, two inbred cabbage lines (Brassica oleracea L. var. capitate), SC31 and BR155, showed susceptibility and high resistance to Xcc R1, respectively (Lu et al., 2021). In the current study, they were utilized as parents to generate a segregating population (F1, F2, and F2:3). A total of 126 F2 individuals were generated and self-pollinated to generate F2:3 progenies, and the F2 and F2:3 populations were used for genotyping and phenotypic evaluation, respectively. The parental lines and F1 and F2 plant materials examined in this study were obtained from Joeun Seeds Co. (Chungcheongbuk-Do, Korea), and F2 progenies were self-pollinated to produce seeds of F2:3 progenies in a greenhouse facility located at Chungnam National University.
2.2 Phenotypic screening and disease evaluation
Xanthomonas campestris pv. campestris KACC 10377 (Xcc R1) was used for the inoculation tests in this study, which was obtained from the Korean Agricultural Culture Collection (KACC; Suwon, Korea). The inoculum and inoculation protocol was conducted as described previously (Lee et al., 2020) with minor modification. Shortly, using an inoculating loop, the bacterial inoculum was streaked over tryptic soy agar (TSA) plates and incubated for 48 hours at 30°C. To prepare the bacterial solution for inoculation, cultivated bacteria were suspended in distilled water and diluted to an optical density (OD) of 0.125 at 600 nm. F2:3 seeds were sown and grown on 5×8-cell plug trays in a greenhouse. At 14–17 days after sowing, inoculation tests were performed until the plants had two completely expanded true leaves. The leaves were inoculated by spraying a bacterial suspension until the adaxial and abaxial surfaces of the leaves were sufficiently moistened. Subsequently, the inoculated plants were kept at a temperature of 28°C and high humidity for 48 h. Then, the temperature was adjusted to 25°C and other conditions were kept constant for a further 7 days of incubation, and the disease symptoms in two inoculated leaves of each plant were surveyed. The severity of the black rot symptoms was determined based on the infected leaf area using the following disease indexes: (0) no visible symptoms (immune I), (1) 1–25% infection (resistant, R), (2) 26–50% infection (moderately resistant MR), (3) 51–75% infection (moderately susceptible, MS), (4) 76–99% infection (susceptible, S), (5) 100% infection (highly susceptible, HS) (Peňázová et al., 2018).
2.3 Statistical analysis
SPSS software (v. 26.0, IBM, Armonk, NY, USA) was used for descriptive statistics and correlation analyses of each trial. The mean values of the three trials for each test were used to conduct correlation analyses. The coefficient of variation was calculated as σ/µ, where σ represents the standard deviation and µ represents the average.
2.4 GBS library preparation, sequencing, and SNP calling
To construct the GBS library for sequencing, the genomic DNAs of the parental lines and F2 population were isolated from their young leaf tissues via the modified CTAB method. The quantity and quality of the DNA were examined using a NanoDrop ND-1000 (Thermo Fisher Scientific Inc., USA) and agarose gel (1.5%) electrophoresis. For GBS analysis, a library was constructed using 128 genomic DNAs belonging to two parent lines and 126 F2 populations. The library construction was outsourced to SEEDERS sequencing company (Daejeon, Korea; http://www.seeders.co.kr/). Briefly, construction of the GBS library involved the following steps: adaptor annealing, digestion of genomic DNA using ApeKI (New England Biolabs, Ipswitch, MA, USA) restriction enzyme, pooling and purification of ligated products, and PCR amplification. The size distribution of the templates was confirmed by analyzing the PCR-enriched fragments on an Agilent Technologies 2100 Bioanalyzer with a DNA 1000 chip. The quality was then assessed through agarose gel electrophoresis. The barcode sequence was used to separate the raw sequences into individual samples, after which the adapter sequence was removed, trimming the sequence quality. We used cutadapt v.1.8.3 (Martin, 2011) for adapter trimming and the Dynamic Trim (phred score ≥ 20) and the LengthSort (short read length ≥ 25 bp) programs of the SolexaQA v.1.13 package for sequence quality trimming (Cox et al., 2010). To ensure accuracy, we used the consensus sequence of SC31 samples obtained through mapping on the corresponding reference genome (Brassica oleracea, v.2.1.28; EnsemblPlants, http://plants.ensembl.org/index.html) in resequencing as the reference sequence for analysis. This decision was made due to significant differences between the reference genome and the germplasm of the population being studied. Subsequently, the clean reads of each F2 individual were aligned to the SC31 consensus sequence reference sequence using the Burrows-Wheeler Aligner (BWA) program v.0.6.1-r104 (Li and Durbin, 2009). To create an SNP matrix, we compared the raw SNPs from 126 samples using SEEDERS’ in-house script (Kim et al., 2014). Subsequently, the SNPs were classified into homozygous (SNP read depth ≥ 90%), heterozygous (40% ≤ SNP read depth ≤ 60%), and others (homozygous/heterozygous; could not be distinguished by type), followed by SNP filtering (Table S1).
2.5 SNP genotyping and bin construction
Although GBS can rapidly detect thousands of SNPs, not all SNPs detected by GBS can be used to construct genetic maps for genotyping F2 populations. The noise present in sequencing reads can impact the construction of the linkage map. We conducted the chi-square (χ2) test on all SNPs to assess any potential segregation distortion, and SNPs with a segregation distortion test score of p < 0.05, or those with an abnormal base, were removed from the dataset. Additionally, any genotypes with more than 5% deletions were removed, along with corresponding individuals. Finally, we marked specific SNP positions that can be used for calling SNPs in F2 individuals. The genotype of F2 individuals was converted to 2 if the SNP was the same as SC31, the genotype of F2 individuals was converted to 0 if the SNP was the same as BR155, and the genotype of F2 individuals was converted to 0 if the SNP was the same as F1. A sliding-window approach was applied for variant calling errors to calculate the ratio of SNP alleles derived from the two parental lines, BR155 and SC31 (Huang et al., 2009). Genotypic data were scanned using a window size of 15 SNPs and a step size of 1. For each individual, the ratio of the SNP alleles from BR155 to SC31 within the window was calculated. Windows with a sum of 15 SNPs were greater than 24, which were considered from SC31, and less than 6, which were considered from BR155, whereas those with varied sums were classified as heterozygous. Adjacent windows with the same genotype were combined into blocks, and recombinant breakpoints were assumed to be at the boundaries of adjacent blocks with different genotypes. Next, a bin map was generated by aligning and comparing the genotypic maps of individual F2 plants. Consecutive intervals lacking a recombination event within the population were joined into bins that were used as markers. This process was performed using an R script.
2.6 Genetic map construction and QTL mapping
A linkage map was established from the recombination bins that were used as genetic markers via the JoinMap version 5.0 software (https://kyazma.nl/). The Kosambi mapping function was used to convert the recombination frequencies into genetic distances. The disease index for each F2 individual was calculated as the mean grade of 10–15 F2:3 seedlings. QTLs for Xcc resistance were evaluated using a composite interval mapping (CIM) analysis with WinQTL cartographer version 2.5 (Zeng, 1994; Rifkin, 2012).
2.7 RNA extraction and gene expression analysis by quantitative real-time PCR
The infected zones of the leaves were collected at 0, 12, 24, and 48 h after inoculation. For each time point, samples from five leaves were combined and considered biological replicates. The leaves were ground into a powder in liquid nitrogen. Total RNA was extracted using the RNeasy® Plant Mini Kit (Qiagen, Hilden, Germany), following the manufacturer’s instructions. The extracted RNA was purified using RNeasy® Plant Mini Columns (Qiagen, Hilden, Germany). cDNAs was synthesized using 1 μg of total RNA. A real-time PCR detection system (Bio-Rad, Hercules, CA, USA) with TB Green® Premix Ex Taq ® (TaKaRa Bio) was used to quantify the gene expression. Sequences of the gene-specific primers used for quantitative real-time PCR (qRT-PCR) are presented in Supplementary Table S5. The internal standard used was 18S rRNA. Each experiment was performed at least thrice. The 2−ΔΔCt method was used to quantify the relative transcript level (Livak and Schmittgen, 2001).
3 Results
3.1 Evaluation of resistance to black rot
We observed phenotypes 7 days after the Xcc R1 inoculation of parental lines (SC31 and BR155) and 126 F2:3 plants in three environments to evaluate black rot resistance (Figure 1). The average disease score from 10 to 15 plants for F2:3 plants was considered as the disease score of each F2:3 individual (Table S2). Inoculation tests were repeatedly carried out in the summer and fall of 2020, and in the spring of 2021 under the same conditions (Figure 2). The frequency distribution of the black rot disease index of the F2:3 population under the two different environmental conditions appeared to be approximately normally distributed in separate experiments, indicating that the black rot resistance phenotype was governed by multiple genes (Figure 2). The correlation coefficients among the three trials were calculated (Table 1). As a result of the correlation analysis between the three trials using 128 cabbage samples (parents and F2:3), the second and third trials had a positive correlation of approximately 0.66 at the level of α = 0.001 (***). On the other hand, the first and third trails had a negative correlation of roughly -0.20 (Table 1).
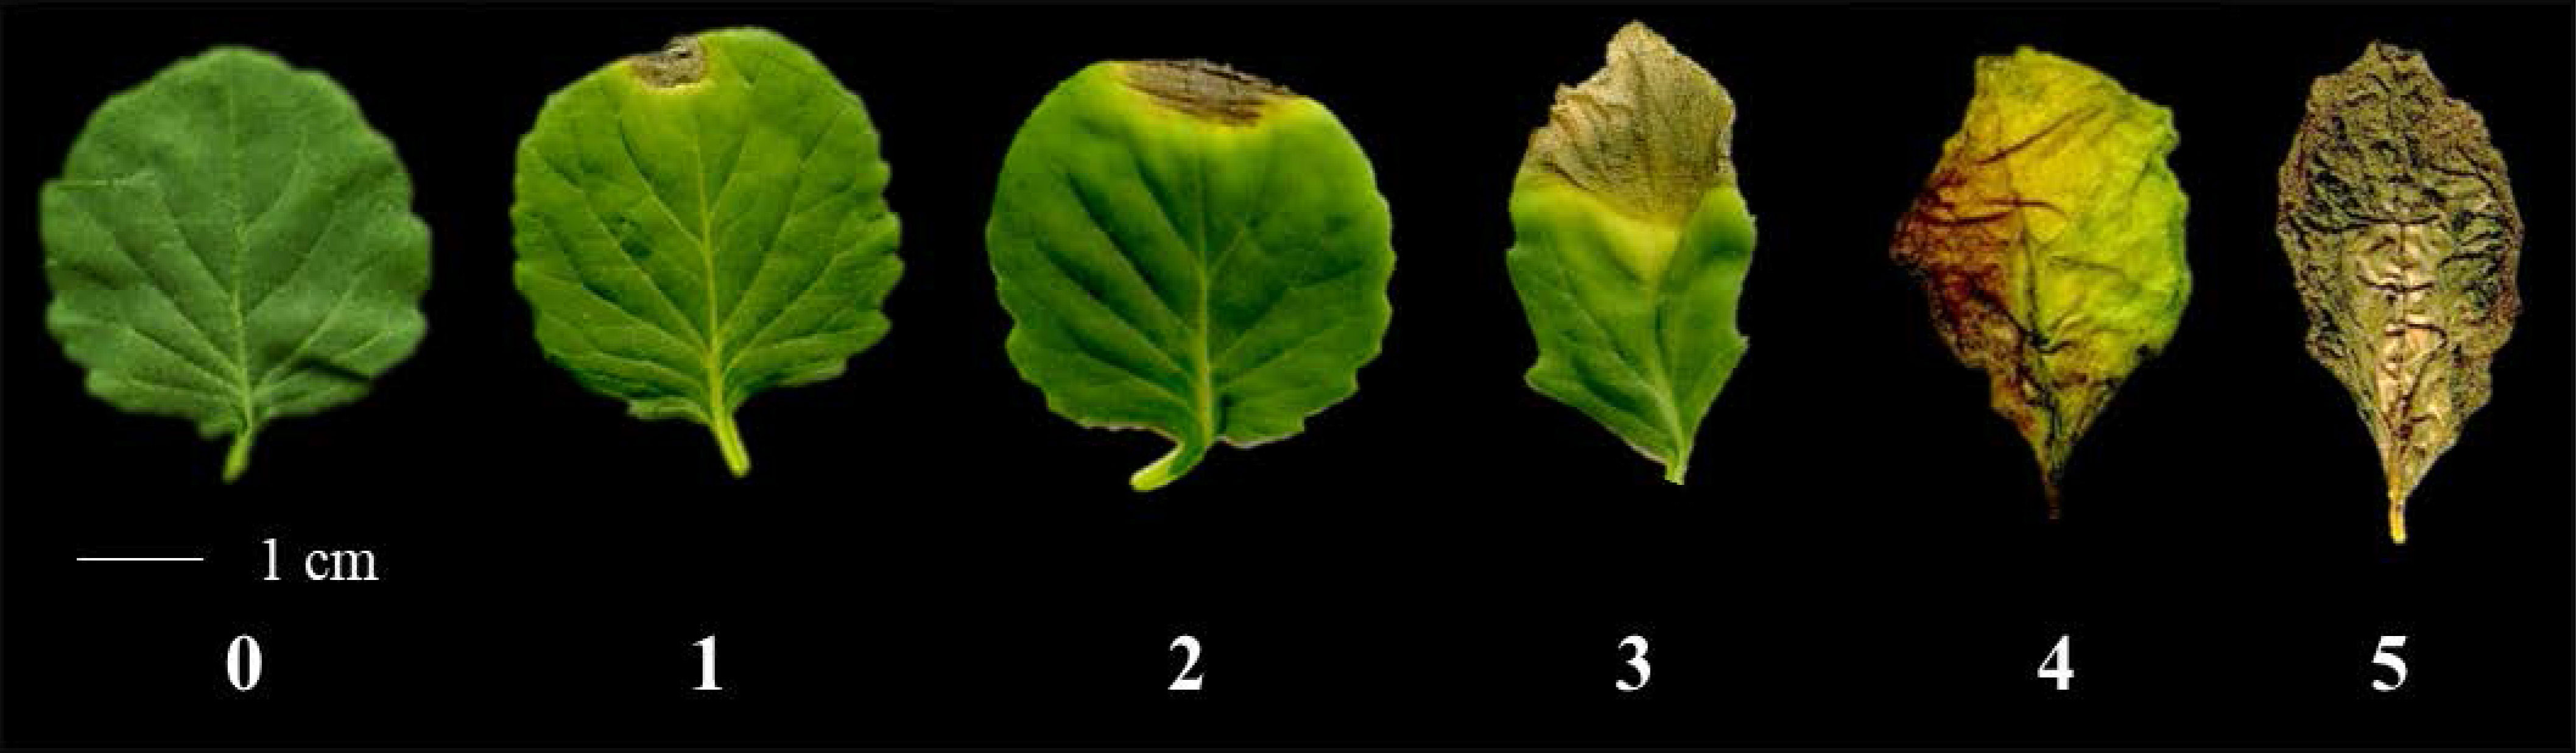
Figure 1 Representative black rot disease symptoms on leaves of cabbage after spraying with Xcc R1 suspension (OD600 = 0.125). The severity of the black rot symptoms was recorded based on infected leaf area, with the following disease indices: (0) no visible symptoms, (1) 1–25% infection (resistant, R), (2) 26–50% infection (moderately resistant MR), (3) 51–75% infection (moderately susceptible, MS), (4) 76–99% infection (susceptible, S), (5) 100% infection (highly susceptible, HS).
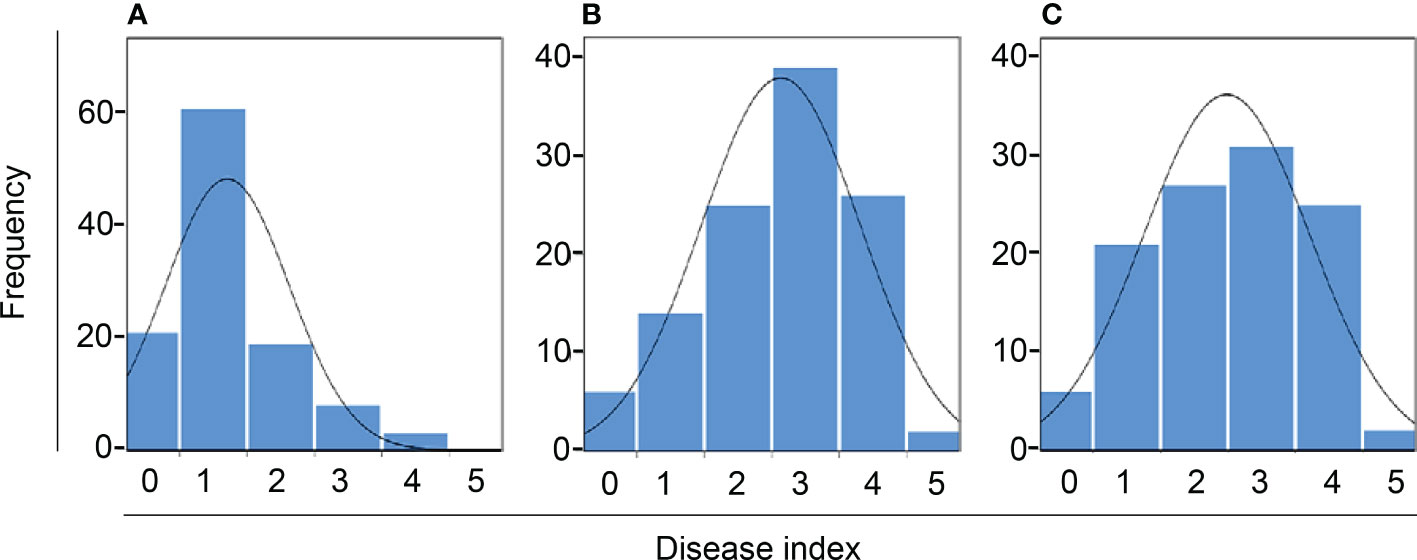
Figure 2 Frequency distribution of black rot disease index of F2:3. (A–C) represent the inoculation test result from summer 2020, fall 2020, and spring 2021, respectively. The curve indicates normal distribution.
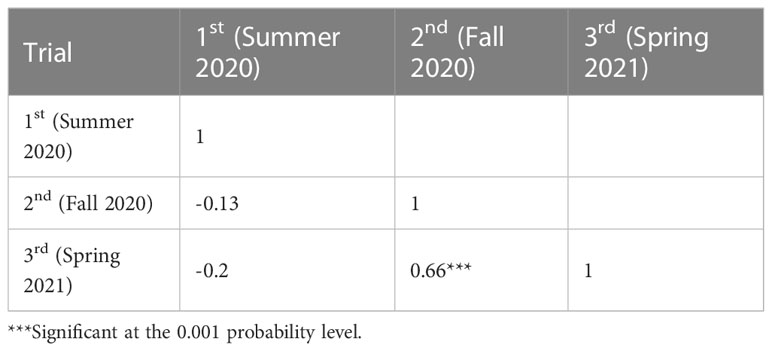
Table 1 Phenotypic correlation for black rot disease index over summer 2020, fall 2020, and spring 2021.
3.2 Whole-genome resequencing of two cabbage parental lines and SNP detection by GBS
The whole-genome sequencing data contained 68 and 67 million raw reads for BR155 and SC31, respectively (Table S3). According to Parkin et al., the genome sequence for B. oleracea is 488.6 Mb, consisting of 446.9 Mb of nine pseudo-chromosomes and 41.2 Mb of unanchored scaffolds, accounting for approximately 75% of the estimated genome size of 648 Mb (Parkin et al., 2014). Our new sequencing data was approximately 24 times the genome size for both parent lines. We successfully mapped each set of paired reads onto the nine pseudo-chromosomes of the reference genome sequence. Of the raw reads obtained, 70.74% and 74.67% from BR155 and SC31, respectively, were successfully aligned to the reference genome, which resulted in a mapped region of 72.44% and 78.39% for BR155 and SC31, respectively (Table S3). The total number of SNPs and average SNP densities varied between the two parental lines. High-quality SNPs were identified in both BR155 and SC31, with approximately 1.02 million and 0.26 million SNPs, respectively. These SNPs were merged and used to detect SNPs between the two parental lines (Table 2).
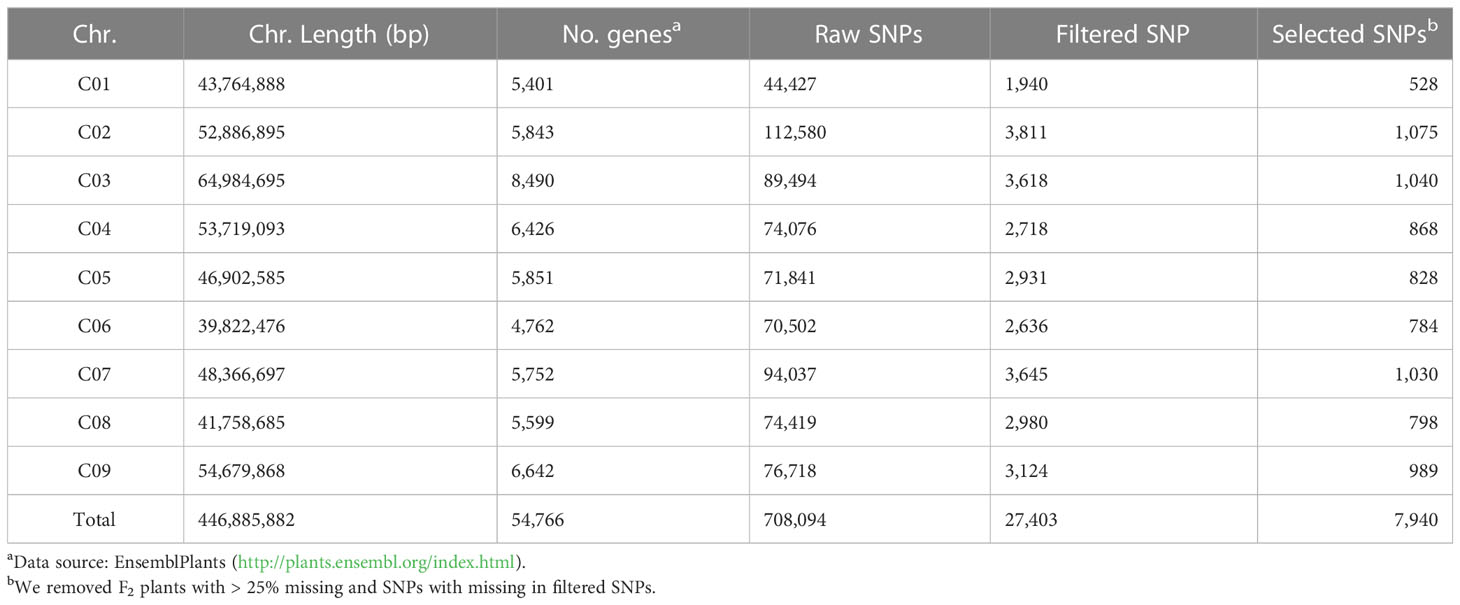
Table 2 Distribution of SNPs on the B. oleracea genome.
For the genome-wide detection of SNPs in cabbage using GBS, the restriction enzyme ApeKI was used to digest genomic DNA and construct GBS libraries of the F2 plants and parents of the intraspecific mapping population (BR155 and SC31). Sequencing was performed on an Illumina high-throughput sequencing platform (Illumina HiSeq X sequencer), and a total of 1,501,825,142 raw sequence reads corresponding to 226.78 GB of sequence length were generated. The raw data contained an average of 97.11% of demultiplexed reads, with the overall GC content of the sequences being approximately 47.66%, And the Q30 score was approximately 91.29%. Raw SNPs were detected by sequence pre-processing and alignment to the SC31 consensus sequence, and a matrix containing 304,184 SNPs was obtained. The SC31 sequence was aligned to the B. oleracea (TO1000) sequence to determine the physical position of each SNP. Based on the filtering process, 27,403 polymorphic SNPs were identified in the cabbage F2 population (Table 2). SNPs were distributed across all nine B. oleracea chromosomes, as illustrated in Figure 3 and Table 3.
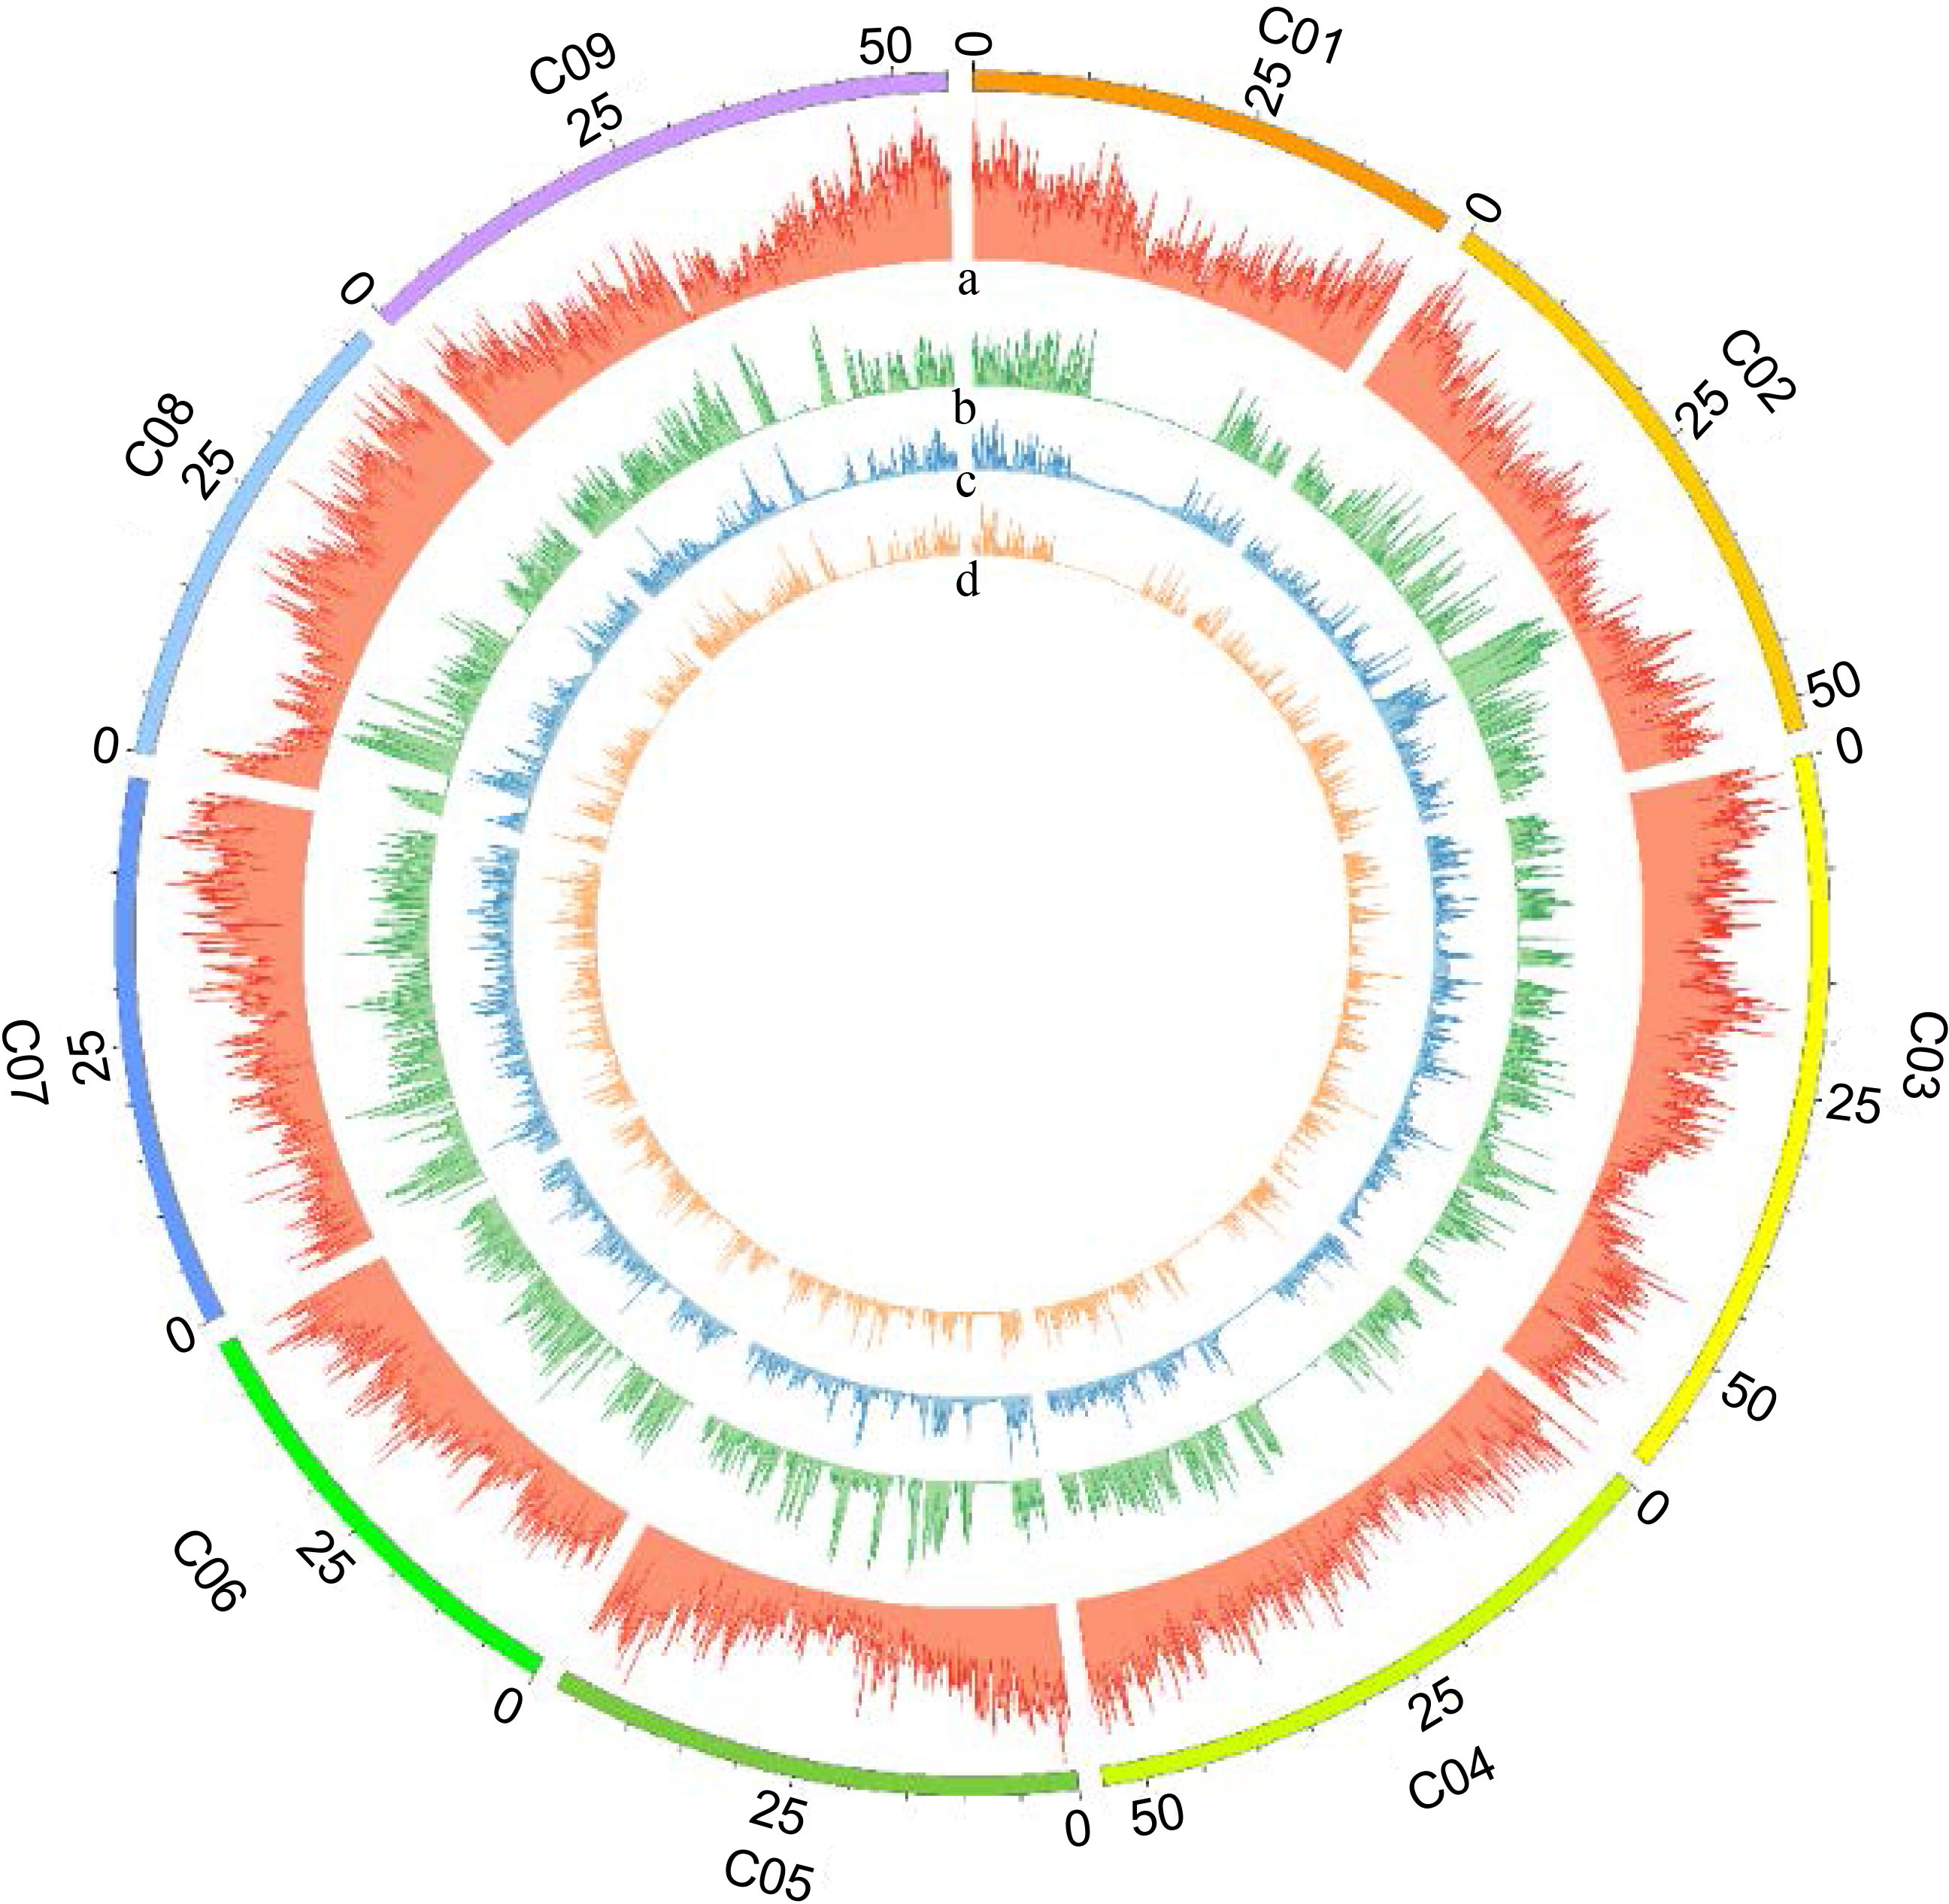
Figure 3 Distribution of identified SNPs on nine B. oleracea chromosomes. Distribution of SNPs detected on each B. oleracea chromosome (100 kb window size) was visualized using Circos diagram-Perl script. The outermost circle represents nine B. oleracea chromosomes designated as “C01-C09”. Panels as seen from outside to inside: (a) gene density, (b) raw SNPs, (c) filtered SNPs, and (d) selected SNPs for mapping on each chromosome.
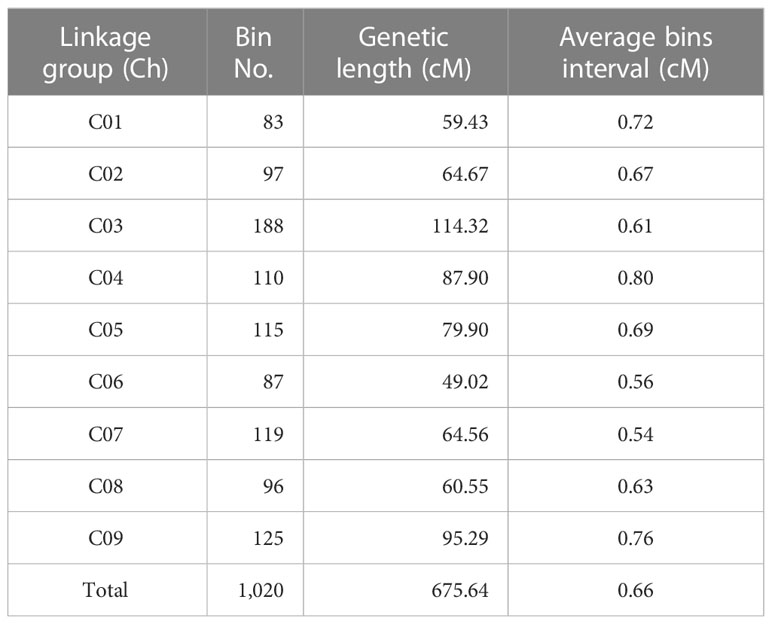
Table 3 Distribution of bin markers on the cabbage genetic map.
3.3 Development of the linkage map for Brassica oleracea
After filtering the SNPs according to the genotyping criteria, 7,940 high-quality SNPs were identified between the two parents to generate bin markers for the F2 population (Table 3). A modified sliding window approach was adopted to determine the recombinant breakpoints for the F2 individuals. The adjacent bins of the same genotype were merged into identical bins. A high-density genetic linkage map was constructed using 1,020 recombination bins (Figure 4, Table 3). The total genetic distance of the linkage map was 675.64 cM with an average distance of 0.66 cM between adjacent bins. Linkage Group 3 (C03) contained the most bins (188), followed by Group C09 (125). Group 3 also comprised the longest linkage group, which spanned 114.32 cM and 95.29 cM with an average 0.61 cM and 0.76 cM marker intervals, respectively. The shortest linkage group was located at C06, which was 49.02 cM in length and harbored 87 bin markers with an average marker interval of 0.56 cM.
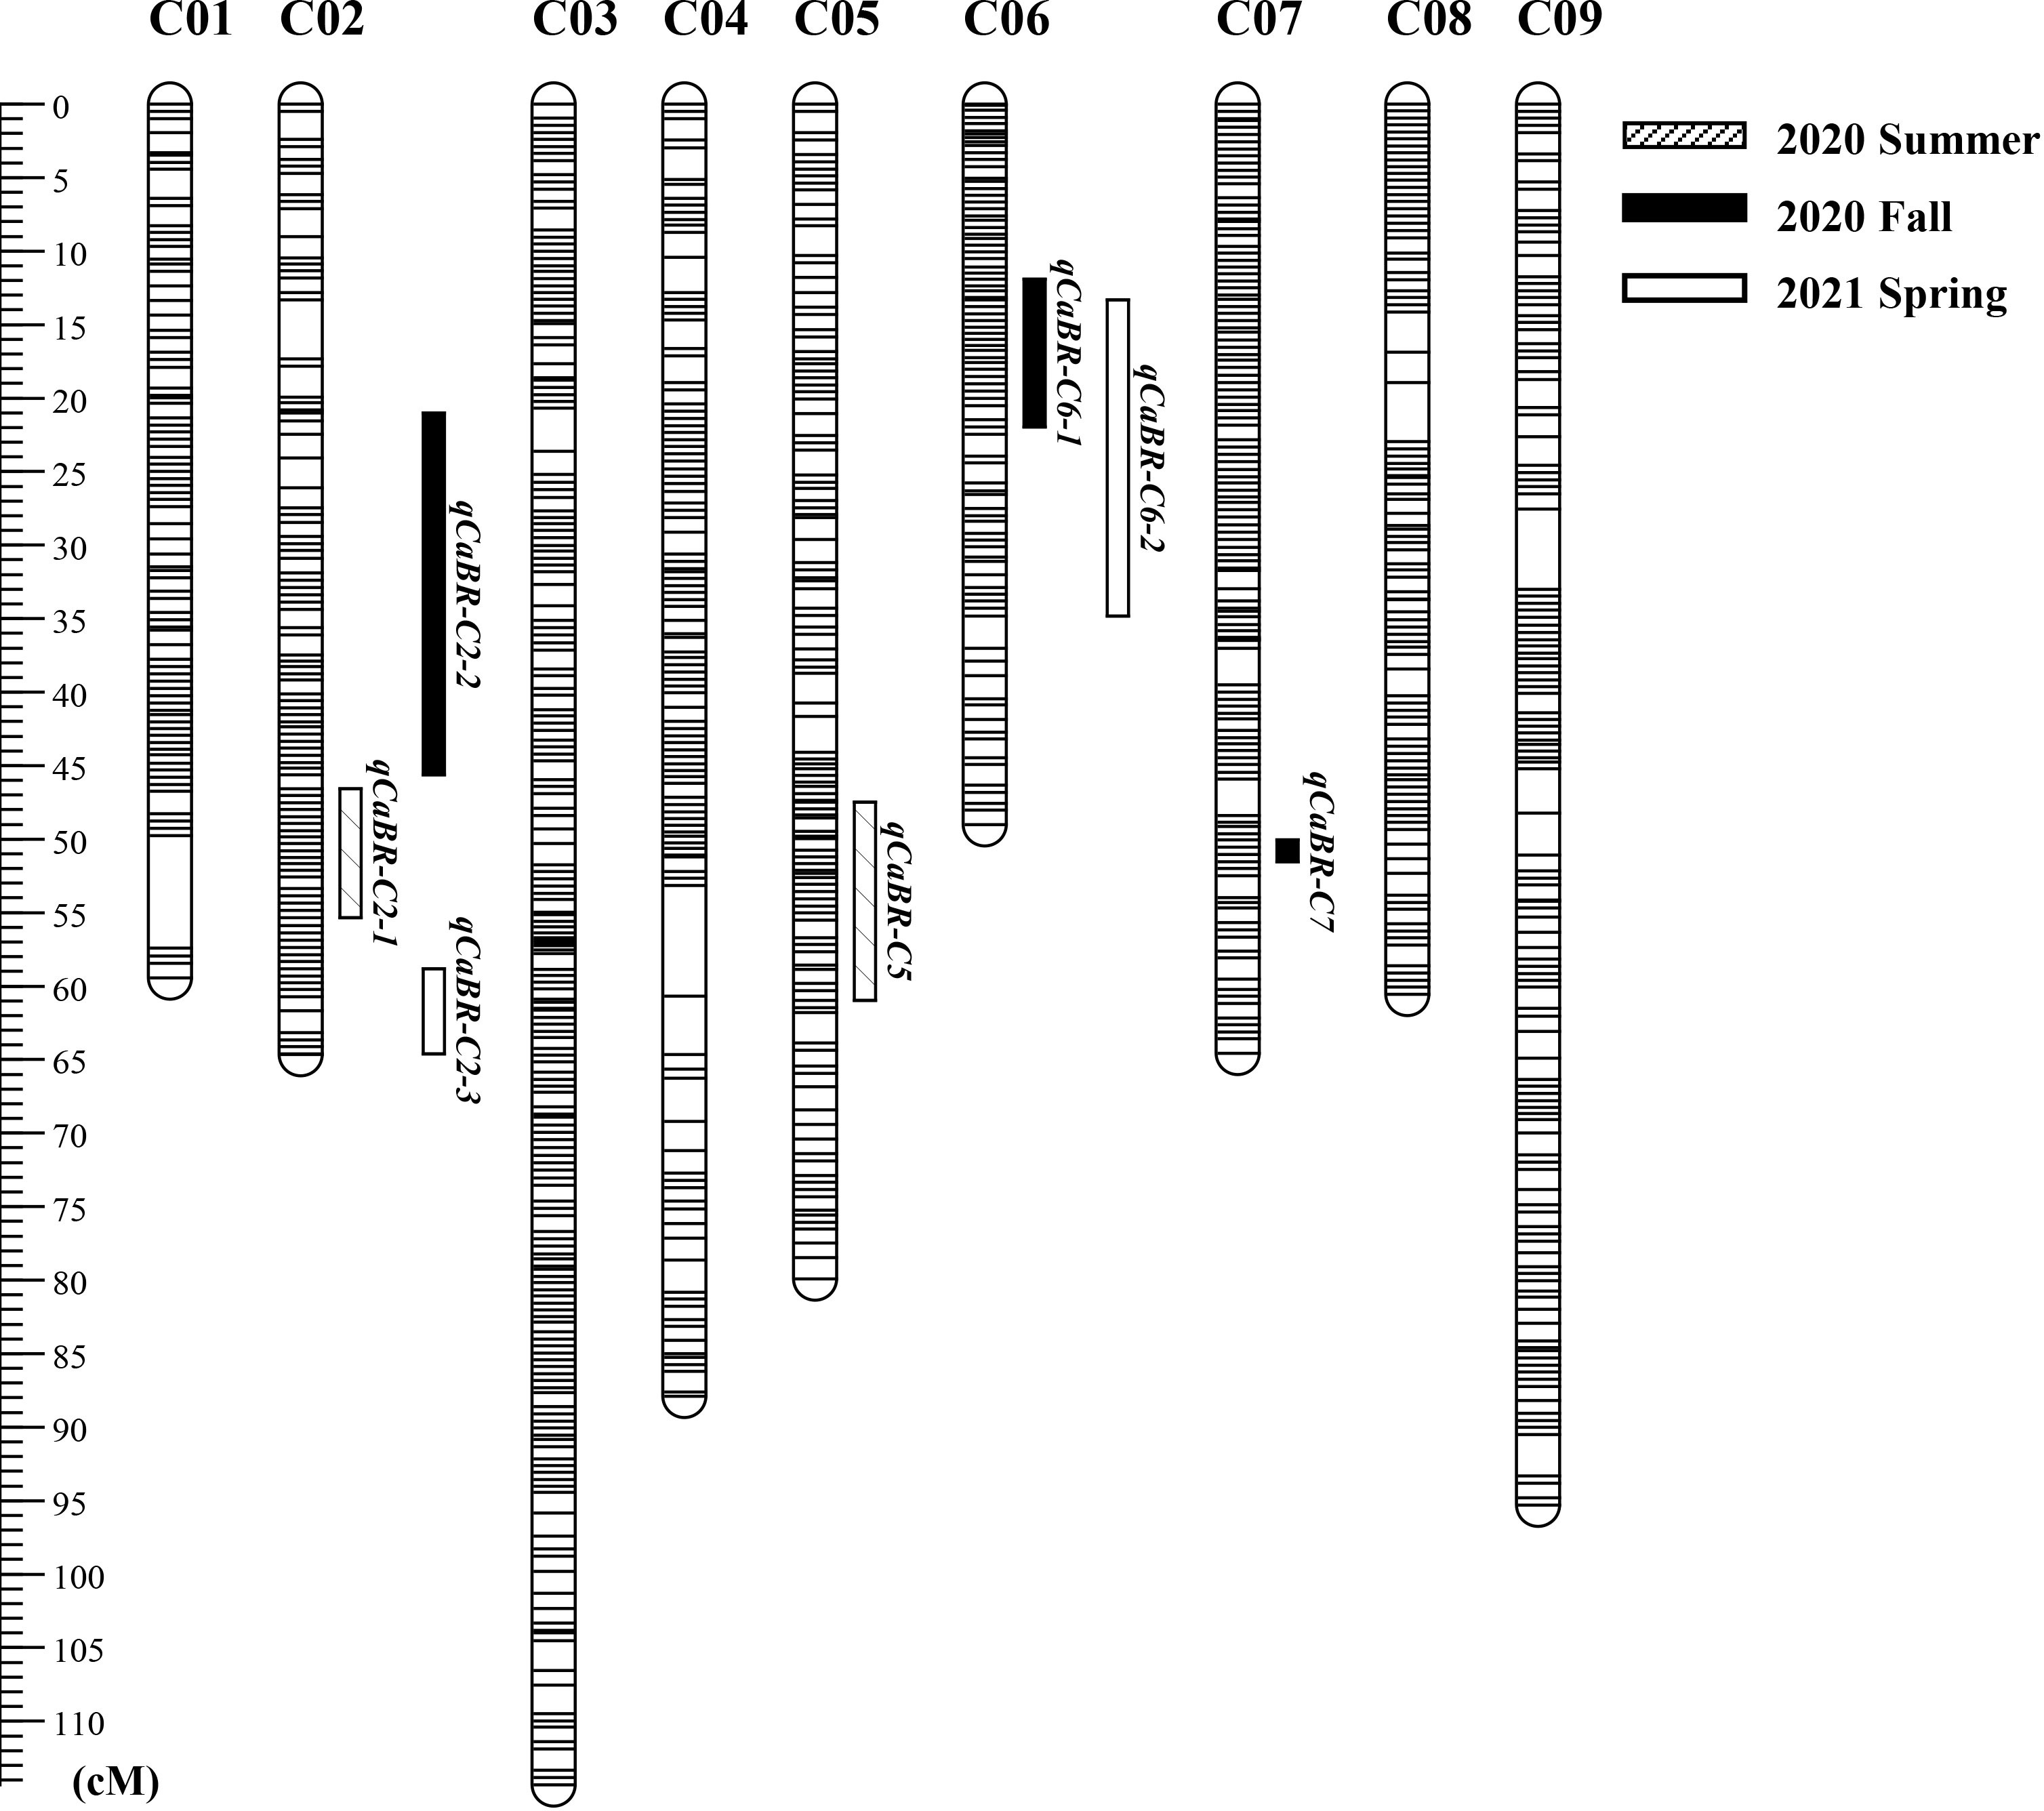
Figure 4 The genetic linkage map of cabbage constructed using the F2 lines derived from the parental lines SC31 × BR155. Detected QTLs were marked by rectangular bars with different fill in the right side of the linkage groups followed by QTL name.
3.4 QTL analysis
Composite interval mapping was conducted using the developed cabbage map to detect black rot resistance QTL. QTL analysis was performed for each trial. QTLs were detected based on LOD scores higher than the threshold (2.0). As a result, a total of seven QTLs were detected in this study, the LOD values between 2.10 and 4.27 (Figure 4, Table 4; Figure S1). In the first test, performed in the summer of 2020, there were two significant QTL regions: qCaBR-C2-1 on chromosome C02 and qCaBR-C5 on chromosome C05 (Figure 4, Table 4; Figure S1). Among these, qCaBR-C5 showed the highest LOD score, 4.27 (Figure 4, Table 4; Figure S1). In fall 2020, the second test identified three QTLs, qCaBR-C2-2, qCaBR-C6-1, and qCaBR-C7 on chromosomes C02, C06, and C07, respectively. Two QTLs were detected in spring 2021: qCaBR-C2-3 and qCaBR-C6-2.
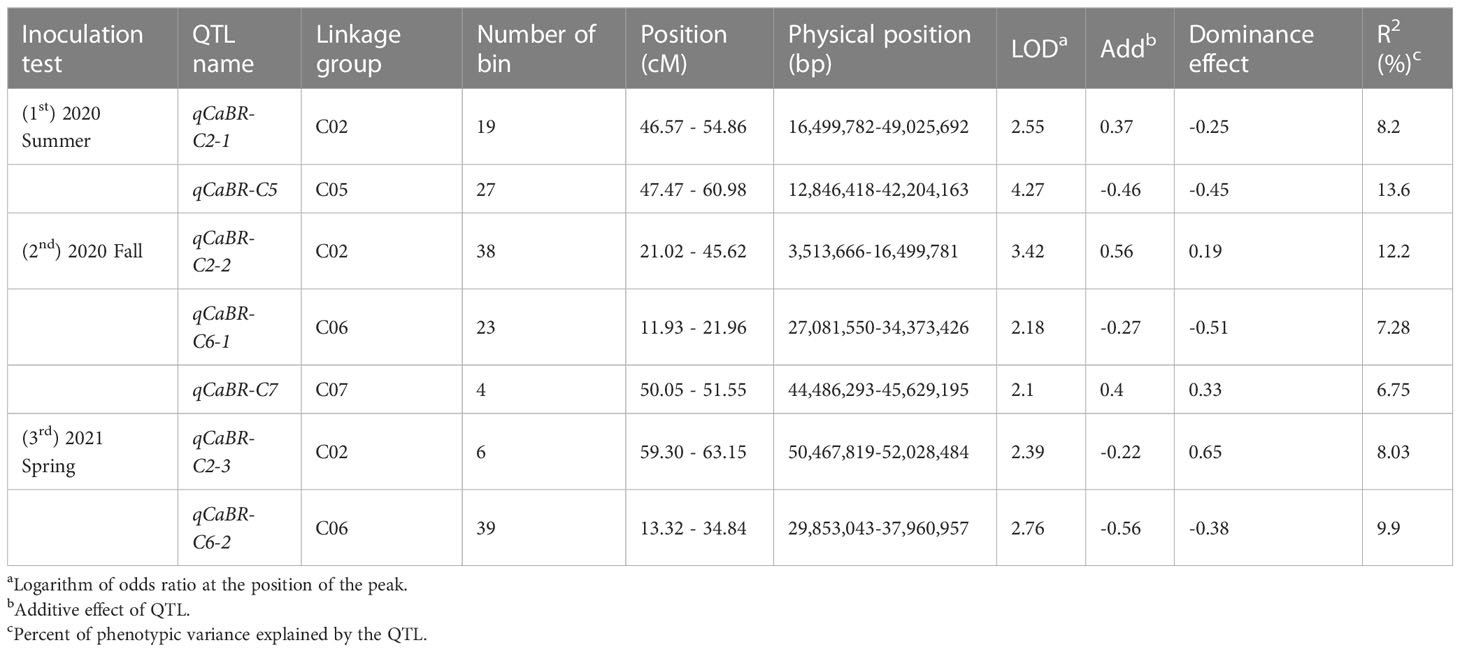
Table 4 Details of resistance QTLs related Xcc R1.
3.5 Prediction of candidate genes for black rot resistance in B. oleracea
Based on the above analysis, among all seven QTLs (Figure 4, Table 5), we found overlapping regions between the second and third trials located on chromosome C06 which were designated as the major QTL loci. The major QTL identified on chromosome 6 was qCaBR1 (Cabbage Black rot Resistance-1) (Figure 5). According to the available B. oleracea (TO1000) genome sequence (http://plants.ensembl.org/index.html), qCaBR1 was detected on C06:29,853,043-34,373,426 (4.52 Mb) (Figure 5, Table 5) and included 591 genes. Of the 591 B. oleracea genes, 96 (Table S4) had putative gene annotation data (Arabidopsis orthologs), for which we could categorize the functional groups (https://www.arabidopsis.org). According to the annotation information, eight out of 96 genes responded to biotic stimuli and were related to defense responses against other organisms (bacteria, fungi, and oomycetes) (Table 6). We compared the expression patterns of eight candidate genes (Figure 6) that may be related to black rot resistance after Xcc R1 inoculation (12, 24, and 48 h) in the two cabbage lines, BR155 and SC31, to assess their defense-related responses. In BR155, two defense-related genes, PR1 and SOD, were rapidly and strongly induced by Xcc inoculation, and thus can be used as early defense response markers (Lu et al., 2021). In this study, we also observed that the Xcc-induced expression levels of PR1 and SOD was more than two times higher than that in BR155 plants when compared to SC31 plants. A high level of relative expression was observed for four genes (Bo6g098480, Bo6g099850, Bo6g101010, and Bo6g106440) at all time points in BR155; these results were similar to those of PR1 and SOD. However, the expression patterns of Bo6g095580 and Bo6g101310 were opposite those of PR1 and SOD. As shown in Figure 6, the Xcc-induced expression levels of Bo6g095580, Bo6g101310, and Bo6g101210 were higher in the susceptible line SC31 than in BR155 (resistant line). Interestingly, the gene expression pattern of Bo6g108870 significantly increased only 24 h post-inoculation in BR155, a resistant parental line (Figure 6). These eight genes showed differential expression patterns between the BR155 and SC31 plants in response to Xcc inoculation. Thus, the qRT-PCR results indicate that all eight genes selected from the major QTL interval may be involved in the black rot resistance of BR155.
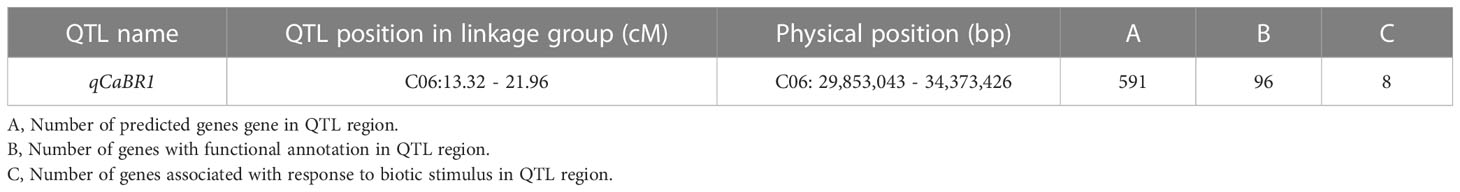
Table 5 The physical position of major QTL related to black rot resistance in B. oleracea.
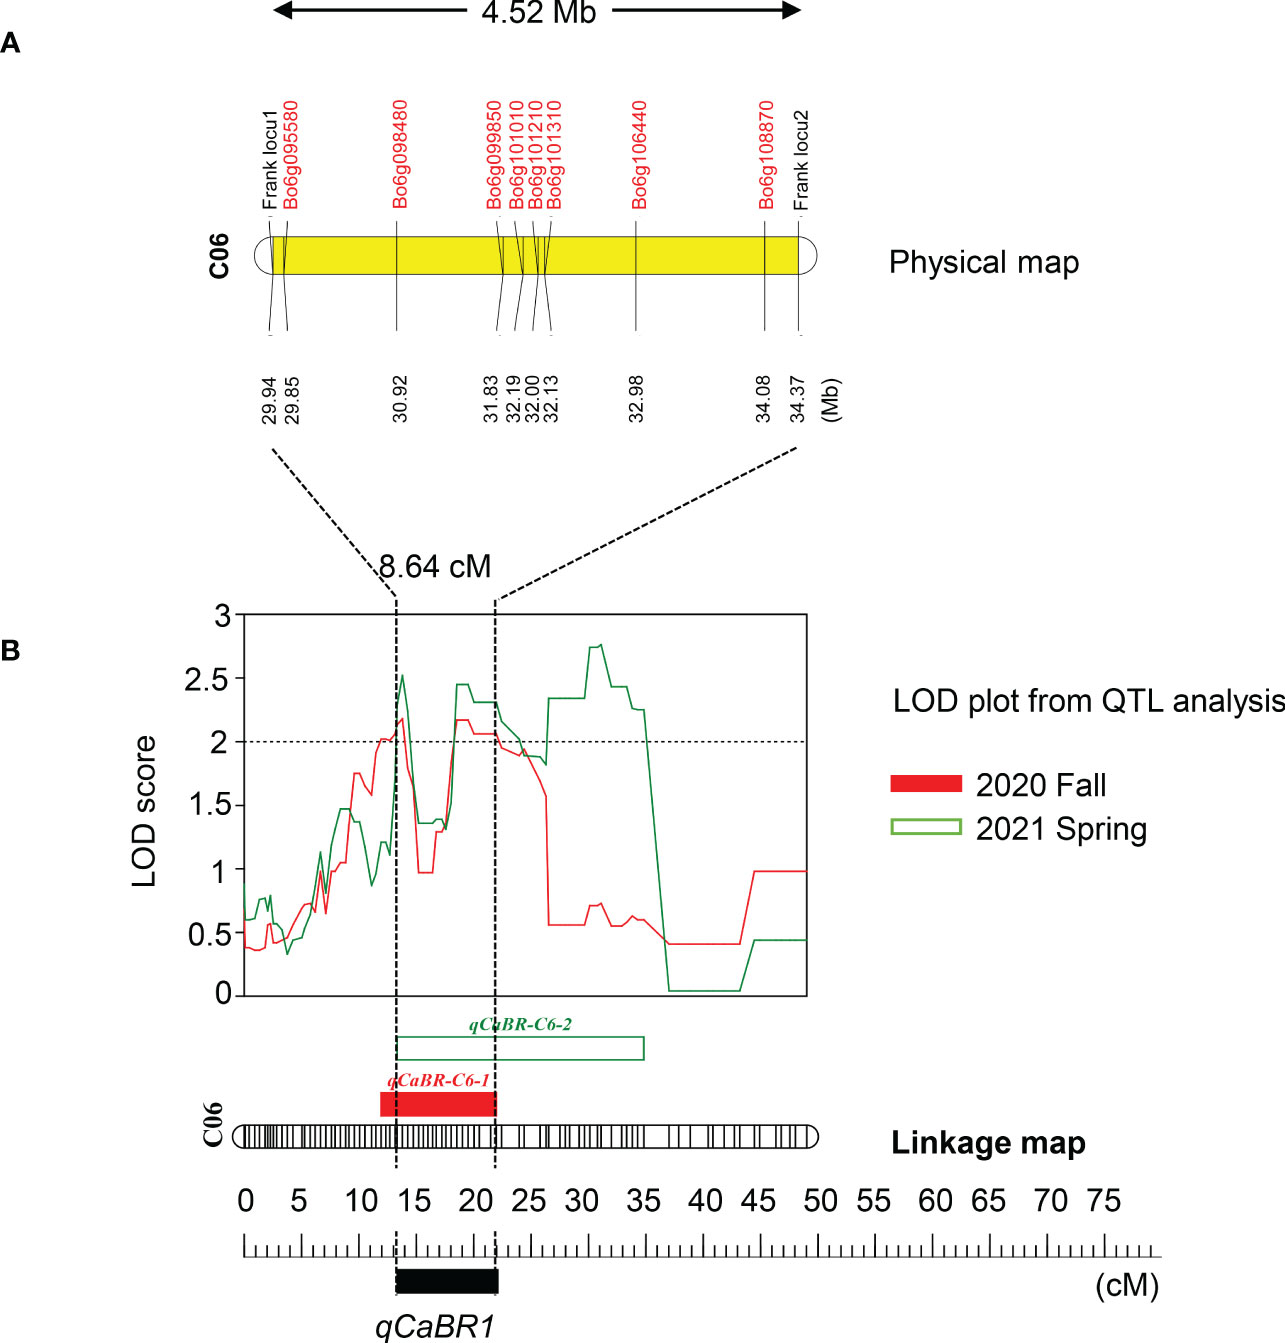
Figure 5 Map of the corresponding qCaBR1 region of the B. oleracea genome. (A) The corresponding physical map showed the location of the major QTL region in the B. oleracea reference genome and the included reference genes associated with biotic stresses. (B) The major QTL was named qCaBR1 as the overlapping section, detected on linkage group six in fall 2020 and spring 2021, respectively. The genetic position of QTLs were indicated in centimorgans (cM) and marked by rectangular bars with a different color in the left side of the linkage group followed by the QTL name. The change curves of LOD values obtained from the results of the three inoculation experiments were shown in red, green, and yellow for fall 2020, spring 2021, and the overlapping section, respectively.
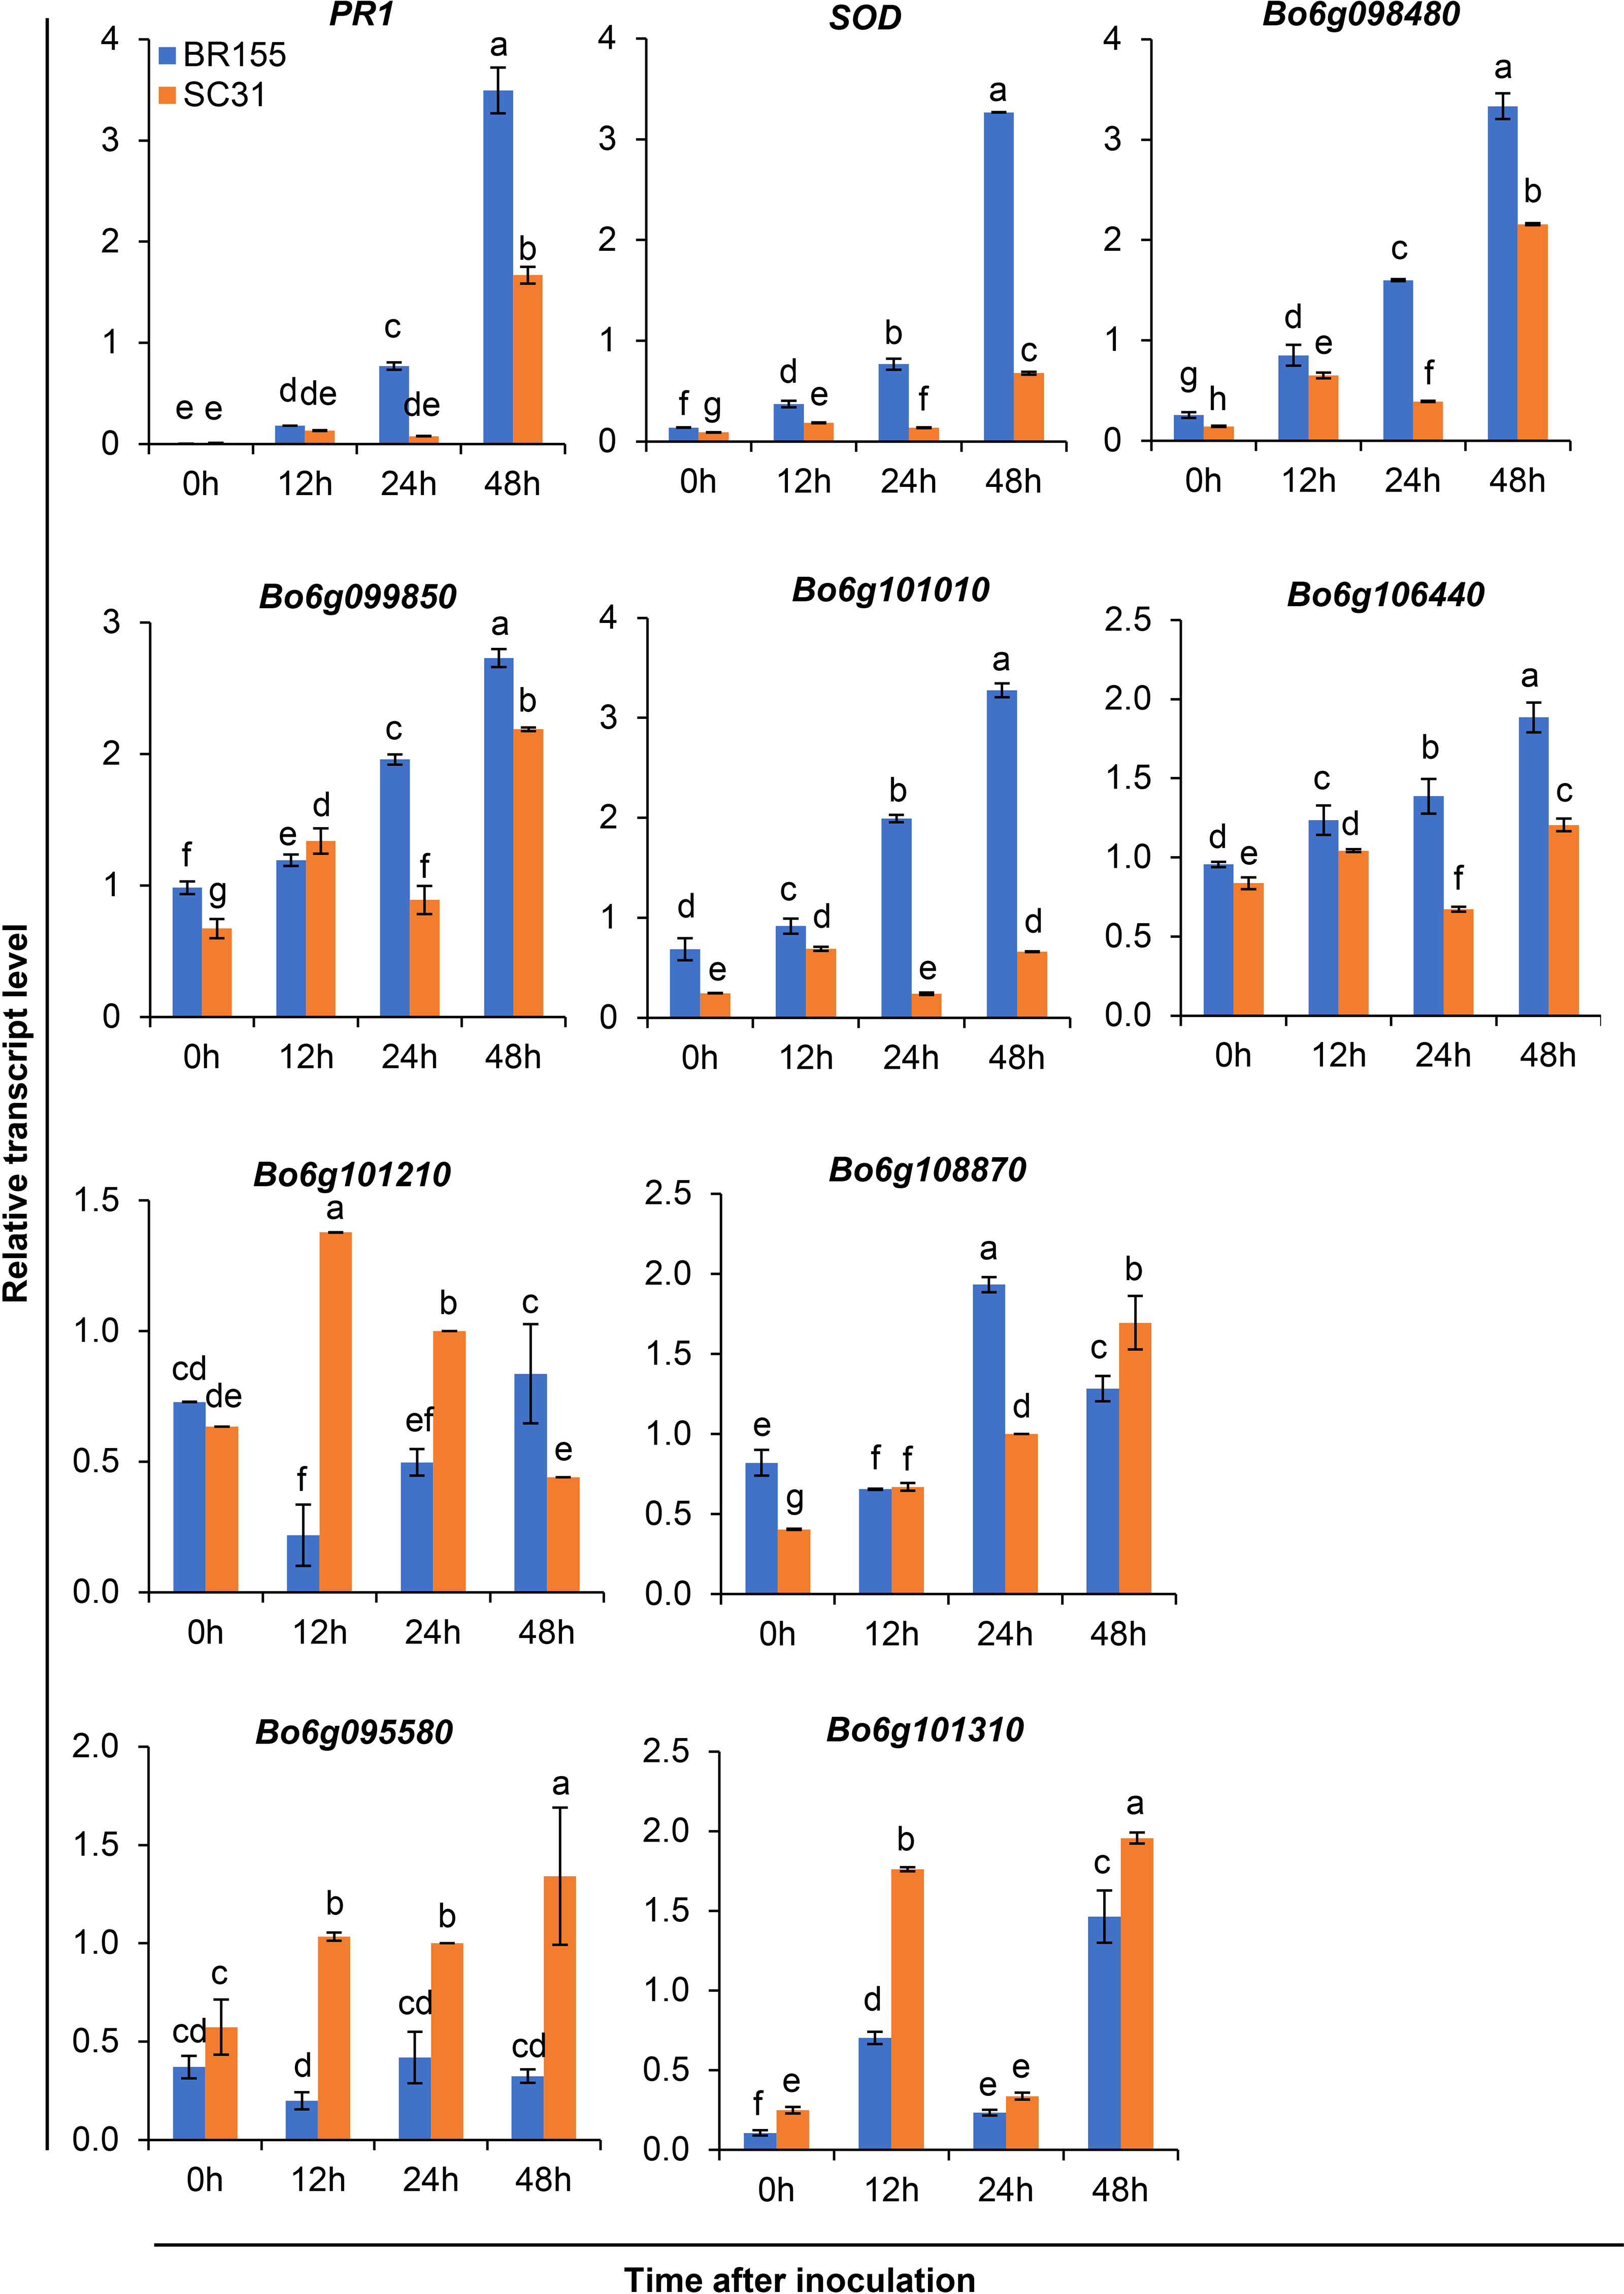
Figure 6 Relative transcript levels of defense-related genes (PR1 and SOD) and eight candidate genes in leaves of resistant (BR155) and susceptible (SC31) cabbage lines. Gene expression level was determined by qRT-PCR at the indicated time after Xcc R1 inoculation and normalized to transcript levels of the 18S rRNA gene. Error bars represent standard deviations of three replicates. Similar results were obtained in at least two independent experiments. Different letters indicate significant differences among samples (a = 0.05, one-way ANOVA and Duncan’s multiple range test).
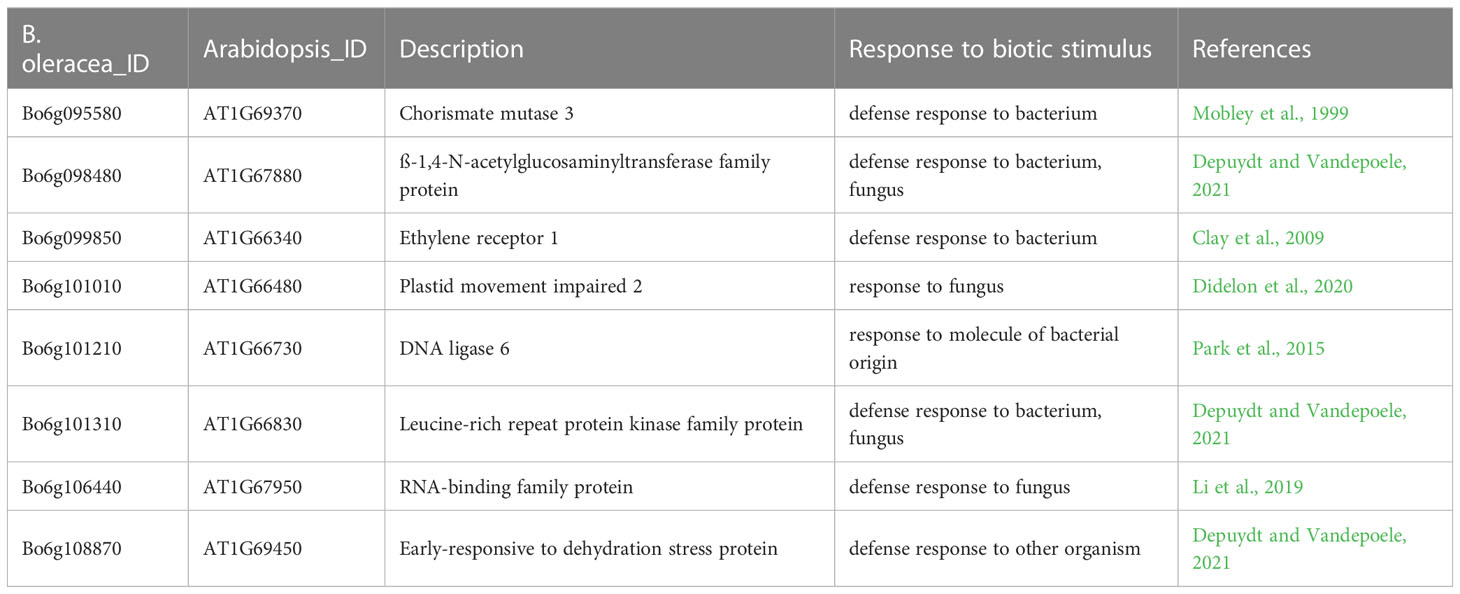
Table 6 A list of genes associated with response to biotic stimulus located in the major QTL interval.
3 Discussion
The resistant line “BR155” and susceptible line “SC31” used in this study were selected from 94 B. oleracea lines by comparing the lesion areas after pathogenicity assays using the scissor-clipping method (Lu et al., 2021). SC31 was one of 23 lines with a symptom area of 90% or more, and BR155 was the most resistant cabbage line with a lesion area of <10%. Previous studies have indicated that BR155 may carry a highly effective resistance gene or locus. We compared the two cabbage lines for the Xcc-induced expression pattern of 13 defense-related genes. Among them, the Xcc-induced expression levels of PR1 and antioxidant-related genes (SOD, POD, APX, Trx H, and CHI) in BR155 were over twice as high as those in SC31. Nitroblue tetrazolium (NBT) and diaminobenzidine tetrahydrochloride (DAB) staining analysis showed that BR155 accumulated less Xcc-induced reactive oxygen species (ROS) than did SC31. Furthermore, 2, 2-diphenyl-1-picrylhydrazyl (DPPH) radical scavenging assays showed that BR155 had higher antioxidant activity than SC31 (Lu et al., 2021). Identifying the resistance locus of BR155 will be crucial for understanding the mechanism of black rot disease resistance. Therefore, in the present study, a GBS-based genetic linkage map was developed and QTL linked to resistance against Xcc R1 in cabbage was identified.
Genotyping-by-sequencing (GBS) technology allows for efficient and cost-effective genotyping of large numbers of markers across the genome. Here, we applied high-throughput GBS technology with the type-II restriction endonuclease ApeKI (Elshire et al., 2011) to the F2 group of cabbage, enabling the simultaneous identification of sufficient polymorphic SNPs and genotyping. This allowed us to create a linkage map with reasonably high density without the need to check or apply existing markers (Figure 4). A modified sliding window approach was adopted to determine the recombinant breakpoints for the F2 individuals. The sliding-window approach involves calculating the recombination frequency between adjacent markers within each window. Recombination frequency measures how often genetic recombination occurs between two markers during meiosis, and can be used to estimate the physical distance between them on the chromosome (Tang et al., 2009; Beissinger et al., 2015). The GBS analysis performed by Parkin et al. identified 826 bins in B. oleracea (Parkin et al., 2014), which was fewer than that identified in this study (1020 bins). Our higher bin numbers are probably due to the difference in the genetic diversity of the parental lines and the number of segregating progenies used for GBS analysis. We used BR155 and SC31 as parental lines, which have variable genetic diversity, whereas Parkin et al. analyzed the population of double haploid (DH) kale-like and DH broccoli lines. We also analyzed 126 F2 plants for mapping. In this study, we identified 708,094 SNPs between BR155 and SC31 using 24x genome coverage whole-genome resequencing (Tables 2; S3). Here, 27,403 GBS-based SNPs were detected between the parental lines, which was 7-fold fewer than those detected by resequencing. After filtering the SNPs according to the genotyping criteria, 7,940 high-quality SNPs were identified between the two parents to generate bin markers for the F2 population (Table 2). The total genetic distance of the linkage map was 675.64 cM, with an average length of 0.66 cM between adjacent bins (Table 3).
We evaluated black rot resistance by observing phenotypes seven days after inoculating parental lines (SC31 and BR155) and 126 F2:3 plants with Xcc R1. The inoculation tests were performed three times throughout the summer and fall of 2020, as well as in the spring of 2021, all under identical conditions (Figure 2). As shown in Table 1, analysis of the correlation between three trials consisting of 128 cabbage samples, including parents and F2:3, revealed that the second and third trials had a strong positive correlation of approximately 0.66 at a significance level of α = 0.001 (***). In contrast, the first and third trials displayed a negative correlation of approximately -0.20. It seems possible that such an unexpected result in the first trials’ outcome was affected by the high temperature during summer. In 1972, Staub and Williams analyzed the impact of temperature on the black rot resistance of cabbage by exposing resistant and susceptible cabbage varieties inoculated with Xcc to various temperatures and analyzing the severity of black rot. Their results showed that although the traits of the resistant cabbage were evident at 20-24°C, the resistant cabbage was just as susceptible to the disease as the susceptible ones at 28°C (Staub, 1972). In Korea, the temperature inside a greenhouse can exceed 30°C during the summer.
Xcc exhibits high genetic diversity, and 11 races have been discovered worldwide. Among these races, R1 and R4 are the most prevalent and highly virulent among many commercial cultivars (Vicente et al., 2001; Cruz et al., 2017). Only a few resistant resources have been identified recently, considerably challenging the breeding of resistant cabbage cultivars. Several studies have identified R-genes/QTLs and markers associated with Xcc R1 and Xcc R4 resistance in B. oleracea (Camargo et al., 1995; Kifuji et al., 2012; Tonu et al., 2013; Saha et al., 2014b; Lee et al., 2015; Iglesias-Bernabe et al., 2019). In total, more than 15 QTLs were identified on the B. oleracea chromosomes, indicating that resistance to black rot is highly complicated. We identified seven QTLs related to the resistance to R1 of Xcc on C02, C05, C06, and C07. Since resistance was quantitative and under polygenic control, we confirmed the results of other studies. The positions of our black rot resistance QTLs coincided with those previously reported (Kifuji et al., 2012; Tonu et al., 2013; Saha et al., 2014b; Iglesias-Bernabe et al., 2019), except for QTL qCaBR-C7, which may represent a novel variation. Among the seven QTLs identified in this study, qCaBR-C6-1 and qCaBR-C6-2 were detected repeatedly in the two independent inoculation tests, had high LOD values, and accounted for a high percentage of the variation in all trials. We designated the overlapping part of these two QTLs on C06 as qCaBR1 QTL. In addition, it was a strong candidate as a major QTL for black rot resistance. Regarding physical location, the major QTL, qCaBR1, found in our work is likely related to BRQTL-C6 (Lee et al., 2015) and Xcc6.1 (Iglesias-Bernabe et al., 2019). Afrin selected five markers capable of distinguishing the resistant lines from the susceptible ones of cabbage consistently (Afrin et al., 2018). The SSR marker OI10G06 is one of these five markers. Interestingly, OI10G06 is located on chromosome C06 (C6:29898028-29898121) and is in the major QTL qCaBR1 (C06:29,853,043–34,373,426) (Table 5). In the case of BRQTL-C6, the exact Xcc race used in the study is yet to be classified, and OI10G06 was able to separate resistant and susceptible lines but did not perfectly match the phenotypic data. However, these repeated reports related to Xcc resistance QTL strongly, supporting the idea that the QTL qCaBR1 is involved in resistance to Xcc R1.
The information on the QTLs identified in this study will assist in the understanding of the molecular mechanisms of disease response in B. oleracea under Xcc stress. According to the available B. oleracea genome sequence (http://plants.ensembl.org/), the qCaBR1 locus was delimited to a 4.53-Mb genomic region, which included 96 functionally annotated Arabidopsis orthologs. We identified candidate genes within this chromosomal region with the FGENESH online program (http://linux1.softberry.com/berry.phtml), and the NCBI BLASTP algorithm (http://blast.ncbi.nlm.nih.g/blast) (Table S4). We also identified gene ontology terms using the “Go Term Enrichment tool” on the Tair home page (https://www.arabidopsis.org/tools/go_term_enrichment.jsp). According to this analysis, eight of the 96 genes were biotic-stimulus-responsive (Table 6). These genes are involved in the resistance responses to bacterial or fungal diseases (Mobley et al., 1999; Clay et al., 2009; Li et al., 2019; Depuydt and Vandepoele, 2021) and microbe-associated molecular patterns (Park et al., 2015; Didelon et al., 2020). Since these genes were also speculated to play a role in defense responses against invading pathogens in cabbage, we designated them as candidate genes associated with black rot resistance in the BR155 line. To further assess their roles in black rot resistance, we performed an expression analysis of eight candidate genes (Figure 6). As expected, most of the candidate genes tested showed more robust expression than in SC31 from BR155 cells, a resistant line. However, in the case of Bo6g095580 and Bo6g101310, their expression was more strongly induced in SC31, a susceptible line, in response to Xcc inoculation. In the case of Bo6g101210, the Xcc-induced expression level was initially high in the susceptible lines; however, after 48 h, it increased in the resistant lines (Figure 6). Bo6g098480, Bo6g101310, and Bo6g108870 showed high homology to AT1G67880, AT1G66830, and AT1G69450, respectively. Depuydt and Vandepoele (2021) inferred the functions of several unknown Arabidopsis genes through omics-supported functional annotation analysis and classified AT1G67880, AT1G66830, and AT1G69450 as having functions related to plant disease resistance (Depuydt and Vandepoele, 2021). Bo6g099850 showed high homology with the Arabidopsis ethylene receptor 1 (AT1G66340). AtETR1, an ET receptor, is required for ET perception (Schaller and Bleecker, 1995) and for the microbe-associated molecular pattern (MAMP)-triggered immune response (MTI). A previous study found that etr1-1 and etr1-3 mutants of the ET signaling pathway were impaired in the Flg22-induced callose response, an MTI (Clay et al., 2009). Bo6g101010 showed a high homology of AT1G66480 to Arabidopsis. AT1G66480 is a protein with pathogen and abiotic stress responses, cadmium tolerance, and disordered region-containing (PADRE) domains. Moreover, the latter is in the top 10% of most induced genes after infection with the fungal pathogen Sclerotinia sclerotiorum (Didelon et al., 2020). Bo6g106440 shows high homology with Arabidopsis BPL2 (AT1G67950). Arabidopsis accelerated cell death11 (ACD11) encodes a sphingosine transfer protein, and knockout of ACD11 activates PCD and defense responses (Brodersen et al., 2002). BPA1 (the binding partner of ACD11) and its close homologs (BPLs, BPA1-Like proteins) are novel regulators controlling the ROS-mediated defense response and are targeted and manipulated by a virulence effector of Phytophthora, RxLR207. RxLR207 promotes pathogen infection by binding and degrading BPA1 and BPLs (Li et al., 2019). Bo6g095580 had high homology with Arabidopsis Chorismate mutase 3 (AtCM3; AT1G69370). CMs are enzymes that catalyze the conversion of chorismate, a key intermediate in the shikimate pathway, to prephenate, a precursor of the aromatic amino acids phenylalanine and tyrosine (Eberhard et al., 1996). In Arabidopsis, two plastid-localized CMs are allosterically regulated (AtCM1 and AtCM3) and one cytosolic isoform (AtCM2) is unregulated (Eberhard et al., 1996; Mobley et al., 1999). AtCM3-like isoforms are found only in the Brassicaceae family, suggesting that AtCM3-like isoforms may play a role in specialized metabolite production and stress responses in Brassicaceae (Westfall et al., 2014). For example, indole glucosinolates (IGs) are plant secondary metabolites derived from the amino acid tryptophan found in the family Brassicaceae, and IG synthesis requires indole- and sulfur-containing amino acids and activation of AtCM3 (Grubb and Abel, 2006). Bo6g101210 shares high homology with AT1G66730 in Arabidopsis. AT1G66730 encodes a novel plant-specific DNA ligase, DNA LIGASE VI, which is involved in the response to molecules of bacterial origin (Park et al., 2015). Expression analysis of these eight candidate genes in major QTL intervals and their functional characterization may provide additional molecular information regarding the role of this genomic region in controlling Xcc R1 resistance in B. oleracea.
In this study, we identified SNPs in the B. oleracea genome using a GBS approach. Using the identified SNPs, a linkage map of BR155 and SC31 was constructed. In addition, we mapped one major QTL and seven minor QTLs for Xcc R1 resistance. The information generated on QTLs is useful for fine mapping and future MAS of traits. In addition, these results can be applied to the development Xcc R1-resistant genotypes and the molecular dissection of Xcc R1 resistance in B. oleracea.
Data availability statement
The datasets presented in this study can be found in online repositories. The name of the repository and accession number can be found below: NCBI; PRJNA974155.
Author contributions
SY: Data curation. SY: Funding acquisition. LL and SY: Investigation. SC, LL and SY: Methodology. SY: Project administration. YL and S-YK: Resources. LL and SY: Visualization. LL, SY, and S-YK: Manuscript writing. All authors contributed to the article and approved the submitted version.
Funding
This study was supported by the Ministry of Education of the Republic of Korea and National Research Foundation of Korea (grant number NRF-2018K1A3A7A03089858).
Acknowledgments
The authors thank the European Union Horizon 2020 Research and Innovation program for allowing us to use B. oleracea germplasm, such as the BRESOV core collection, for this study under grant agreement No 774244 (Breeding for Resilient, Efficient, and Sustainable Organic Vegetable Production; BRESOV).
Conflict of interest
The authors declare that this study was conducted in the absence of any commercial or financial relationships that could be construed as potential conflict of interest.
Publisher’s note
All claims expressed in this article are solely those of the authors and do not necessarily represent those of their affiliated organizations, or those of the publisher, the editors and the reviewers. Any product that may be evaluated in this article, or claim that may be made by its manufacturer, is not guaranteed or endorsed by the publisher.
Supplementary material
The Supplementary Material for this article can be found online at: https://www.frontiersin.org/articles/10.3389/fpls.2023.1205681/full#supplementary-material
References
Afrin, K. S., Rahim, M. A., Park, J.-I., Natarajan, S., Rubel, M. H., Kim, H.-T., et al. (2018). Screening of cabbage (Brassica oleracea l.) germplasm for resistance to black rot. Plant Breed. Biotechnol. 6 (1), 30–43. doi: 10.9787/pbb.2018.6.1.30
Beissinger, T. M., Rosa, G. J., Kaeppler, S. M., Gianola, D., de Leon, N. (2015). Defining window-boundaries for genomic analyses using smoothing spline techniques. Genet. Sel. Evol. 47 (1), 30. doi: 10.1186/s12711-015-0105-9
Brodersen, P., Petersen, M., Pike, H. M., Olszak, B., Skov, S., Odum, N., et al. (2002). Knockout of arabidopsis accelerated-cell-death11 encoding a sphingosine transfer protein causes activation of programmed cell death and defense. Genes Dev. 16 (4), 490–502. doi: 10.1101/gad.218202
Camargo, L. E. A., Williams, P. H., Osborn, T. C. (1995). Mapping of quantitative trait loci controlling resistance of brassica oleracea to xanthomonas campestris pv. campestris in the field and greenhouse. Phytopathol 85, 1296–1300.
Clay, N. K., Adio, A. M., Denoux, C., Jander, G., Ausubel, F. M. (2009). Glucosinolate metabolites required for an arabidopsis innate immune response. Science 323 (5910), 95–101. doi: 10.1126/science.1164627
Cox, M. P., Peterson, D. A., Biggs, P. J. (2010). SolexaQA: At-a-glance quality assessment of illumina second-generation sequencing data. BMC Bioinf. 11 (1), 1–6. doi: 10.1186/1471-2105-11-485
Cruz, J., Tenreiro, R., Cruz, L. (2017). Assessment of diversity of xanthomonas campestris pathovars affecting cruciferous plants in portugal and disclosure of two novel x-campestris pv. Campestris races. J. Plant Pathol. 99 (2), 403–414. Available at: https://www.jstor.org/stable/44686785.
Depuydt, T., Vandepoele, K. (2021). Multi-omics network-based functional annotation of unknown arabidopsis genes. Plant J. 108 (4), 1193–1212. doi: 10.1111/tpj.15507
Dhar, S., Singh, D. (2014). Performance of cauliflower genotypes for yield and resistance against black rot (Xanthomonas campestris pv. campestris). Indian J. Hortic. 71 (2), 197–201.
Didelon, M., Khafif, M., Godiard, L., Barbacci, A., Raffaele, S. (2020). Patterns of sequence and expression diversification associate members of the PADRE gene family with response to fungal pathogens. Front. Genet. 11. doi: 10.3389/fgene.2020.00491
Doullah, M. A. U., Mohsin, G. M., Ishikawa, K., Hori, H., Okazaki, K. (2011). Construction of a linkage map and QTL analysis for black rot resistance in brassica oleracea l. Int. J. Natural Sci. 1 (1), 1–6. doi: 10.3329/ijns.v1i1.8591
Eberhard, J., Ehrler, T. T., Epple, P., Felix, G., Raesecke, H. R., Amrhein, N., et al. (1996). Cytosolic and plastidic chorismate mutase isozymes from arabidopsis thaliana: molecular characterization and enzymatic properties. Plant J. 10 (5), 815–821. doi: 10.1046/j.1365-313x.1996.10050815.x
Elshire, R. J., Glaubitz, J. C., Sun, Q., Poland, J. A., Kawamoto, K., Buckler, E. S., et al. (2011). A robust, simple genotyping-by-sequencing (GBS) approach for high diversity species. PloS One 6 (5), e19379. doi: 10.1371/journal.pone.0019379
Grubb, C. D., Abel, S. (2006). Glucosinolate metabolism and its control. Trends Plant Sci. 11 (2), 89–100. doi: 10.1016/j.tplants.2005.12.006
Huang, X., Feng, Q., Qian, Q., Zhao, Q., Wang, L., Wang, A., et al. (2009). High-throughput genotyping by whole-genome resequencing. Genome Res. 19 (6), 1068–1076. doi: 10.1101/gr.089516.108
Iglesias-Bernabe, L., Madloo, P., Rodriguez, V. M., Francisco, M., Soengas, P. (2019). Dissecting quantitative resistance to xanthomonas campestris pv. campestris in leaves of brassica oleracea by QTL analysis. Sci. Rep. 9 (1), 2015. doi: 10.1038/s41598-019-38527-5
Kalia, P., Saha, P., Ray, S. (2017). Development of RAPD and ISSR derived SCAR markers linked to Xca1Bo gene conferring resistance to black rot disease in cauliflower (Brassica oleracea var. botrytis l.). Euphytica 213 (10), 232. doi: 10.1007/s10681-017-2025-y
Kifuji, Y., Hanzawa, H., Terasawa, Y., Ashutosh, Nishio, T. (2012). QTL analysis of black rot resistance in cabbage using newly developed EST-SNP markers. Euphytica 190 (2), 289–295. doi: 10.1007/s10681-012-0847-1
Kim, J.-E., Oh, S.-K., Lee, J.-H., Lee, B.-M., Jo, S.-H. (2014). Genome-wide SNP calling using next generation sequencing data in tomato. Mol. Cells 37 (1), 36. doi: 10.14348/molcells.2014.2241
Lee, S. M., Choi, Y. H., Kim, H. T., Choi, G. J. (2020). Development of an efficient screening method for resistance of Chinese cabbage cultivars to black rot disease caused by xanthomonas campestris pv. campestris. Hortic. Sci. Technol. 38 (4), 547–558. doi: 10.7235/Hort.20200051
Lee, J., Izzah, N. K., Jayakodi, M., Perumal, S., Joh, H. J., Lee, H. J., et al. (2015). Genome-wide SNP identification and QTL mapping for black rot resistance in cabbage. BMC Plant Biol. 15, 32. doi: 10.1186/s12870-015-0424-6
Lema, M., Cartea, M. E., Sotelo, T., Velasco, P., Soengas, P. (2012). Discrimination of xanthomonas campestris pv. campestris races among strains from northwestern Spain by brassica spp. genotypes and rep-PCR. Eur. J. Plant Pathol. 133 (1), 159–169. doi: 10.1007/s10658-011-9929-5
Li, Q., Ai, G., Shen, D. Y., Zou, F., Wang, J., Bai, T., et al. (2019). A phytophthora capsici effector targets ACD11 binding partners that regulate ROS-mediated defense response in arabidopsis. Mol. Plant 12 (4), 565–581. doi: 10.1016/j.molp.2019.01.018
Li, H., Durbin, R. (2009). Fast and accurate short read alignment with burrows–wheeler transform. bioinformatics 25 (14), 1754–1760. doi: 10.1093/bioinformatics/btp324
Livak, K. J., Schmittgen, T. D. (2001). Analysis of relative gene expression data using real-time quantitative PCR and the 2– ΔΔCT method. methods 25 (4), 402–408. doi: 10.1006/meth.2001.1262
Lu, L., Monakhos, S. G., Lim, Y. P., Yi, S. Y. (2021). Early defense mechanisms of brassica oleracea in response to attack by xanthomonas campestris pv. campestris. Plants-Basel 10 (12), 2705. doi: 10.3390/plants10122705
Martin, M. (2011). Cutadapt removes adapter sequences from high-throughput sequencing reads. EMBnet. J. 17 (1), 10–12. doi: 10.14806/ej.17.1.200
Mobley, E. M., Kunkel, B. N., Keith, B. (1999). Identification, characterization and comparative analysis of a novel chorismate mutase gene in arabidopsis thaliana. Gene 240 (1), 115–123. doi: 10.1016/s0378-1119(99)00423-0
Park, S. Y., Vaghchhipawala, Z., Vasudevan, B., Lee, L. Y., Shen, Y. J., Singer, K., et al. (2015). Agrobacterium T-DNA integration into the plant genome can occur without the activity of key non-homologous end-joining proteins. Plant J. 81 (6), 934–946. doi: 10.1111/tpj.12779
Parkin, I. A., Koh, C., Tang, H., Robinson, S. J., Kagale, S., Clarke, W. E., et al. (2014). Transcriptome and methylome profiling reveals relics of genome dominance in the mesopolyploid brassica oleracea. Genome Biol. 15 (6), R77. doi: 10.1186/gb-2014-15-6-r77
Peňázová, E., Kopta, T., Jurica, M., Pečenka, J., Eichmeier, A., Pokluda, R. (2018). Testing of inoculation methods and susceptibility testing of perspective cabbage breeding lines (Brassica oleracea convar. capitata) to the black rot disease caused by xanthomonas campestris pv. campestris. Acta Universitatis Agriculturae Silviculturae Mendelianae Brunensis 66 (1), 139–148. doi: 10.11118/actaun201866010139
Rifkin, S. A. (2012). Quantitative trait loci (QTL): methods and protocols (New York: Humana Press/Springer).
Saha, P., Kalia, P., Sharma, P., Sharma, T. R. (2014a). Race-specific genetics of resistance to black rot disease [Xanthomonas campestris pv. campestris (Xcc) (Pammel) dowson] and the development of three random amplified polymorphic DNA markers in cauliflower. J. Hortic. Sci. Biotechnol. 89 (5), 480–486. doi: 10.1080/14620316.2014.11513109
Saha, P., Kalia, P., Sonah, H., Sharma, T. R. (2014b). Molecular mapping of black rot resistance locus Xca1bo on chromosome 3 in Indian cauliflower (Brassica oleracea var. botrytis l.). Plant Breed. 133 (2), 268–274. doi: 10.1111/pbr.12152
Schaller, G. E., Bleecker, A. B. (1995). Ethylene-binding sites generated in yeast expressing the arabidopsis ETR1 gene. Science 270 (5243), 1809–1811. doi: 10.1126/science.270.5243.1809
Sharma, B. B., Kalia, P., Yadava, D. K., Singh, D., Sharma, T. R. (2016). Genetics and molecular mapping of black rot resistance locus Xca1bc on chromosome b-7 in Ethiopian mustard (Brassica carinata a. Braun). PloS One 11 (3), e0152290. doi: 10.1371/journal.pone.0152290
Staub, T. (1972). Factors influencing black rot lesion development in resistant and susceptible cabbage. Phytopathology 62, 722–728. doi: 10.1094/Phyto-62-722
Tang, R., Feng, T., Sha, Q., Zhang, S. (2009). A variable-sized sliding-window approach for genetic association studies via principal component analysis. Ann. Hum. Genet. 73 (Pt 6), 631–637. doi: 10.1111/j.1469-1809.2009.00543.x
Taylor, J. D., Conway, J., Roberts, S. J., Astley, D., Vicente, J. G. (2002). Sources and origin of resistance to xanthomonas campestris pv. campestris in brassica genomes. Phytopathology 92 (1), 105–111. doi: 10.1094/Phyto.2002.92.1.105
Tonu, N. N., Doullah, M.-u., Shimizu, M., Karim, M. M., Kawanabe, T., Fujimoto, R., et al. (2013). Comparison of positions of QTLs conferring resistance to <i<Xanthomonas campestris</i< pv. <i<campestris</i< in <i<Brassica oleracea</i>. Am. J. Plant Sci. 04 (08), 11–20. doi: 10.4236/ajps.2013.48A002
Vicente, J. G., Conway, J., Roberts, S. J., Taylor, J. D. (2001). Identification and origin of xanthomonas campestris pv. campestris races and related pathovars. Phytopathology 91 (5), 492–499. doi: 10.1094/Phyto.2001.91.5.492
Vicente, J. G., Holub, E. B. (2013). Xanthomonas campestris pv. campestris (cause of black rot of crucifers) in the genomic era is still a worldwide threat to brassica crops. Mol. Plant Pathol. 14 (1), 2–18. doi: 10.1111/j.1364-3703.2012.00833.x
Westfall, C. S., Xu, A., Jez, J. M. (2014). Structural evolution of differential amino acid effector regulation in plant chorismate mutases. J. Biol. Chem. 289 (41), 28619–28628. doi: 10.1074/jbc.M114.591123
Keywords: Brassica oleracea, black rot, quantitative trait loci, genotyping by sequencing, linkage map, Xanthomonas campestris pv. campestris
Citation: Lu L, Choi SR, Lim YP, Kang S-Y and Yi SY (2023) A GBS-based genetic linkage map and quantitative trait loci (QTL) associated with resistance to Xanthomonas campestris pv. campestris race 1 identified in Brassica oleracea. Front. Plant Sci. 14:1205681. doi: 10.3389/fpls.2023.1205681
Received: 14 April 2023; Accepted: 24 May 2023;
Published: 13 June 2023.
Edited by:
Yuri Shavrukov, Flinders University, AustraliaReviewed by:
Gehendra Bhattarai, University of Arkansas, United StatesZhansheng Li, Chinese Academy of Agricultural Sciences, China
Abdur Rahim, Sher-e-Bangla Agricultural University, Bangladesh
Copyright © 2023 Lu, Choi, Lim, Kang and Yi. This is an open-access article distributed under the terms of the Creative Commons Attribution License (CC BY). The use, distribution or reproduction in other forums is permitted, provided the original author(s) and the copyright owner(s) are credited and that the original publication in this journal is cited, in accordance with accepted academic practice. No use, distribution or reproduction is permitted which does not comply with these terms.
*Correspondence: So Young Yi, eWlzeUBrb25nanUuYWMua3I=; Si-Yong Kang, c3lrYW5nQGtvbmdqdS5hYy5rcg==; Yong Pyo Lim, eXBsaW1AY251LmFjLmty
†ORCID: Yong Pyo Lim, orcid.org/0000-0003-2978-9378
Si-Yong Kang, orcid.org/0000-0002-9526-8733
So Young Yi, orcid.org/0000-0002-1749-8859