 Min Wang
 Xue Li
 Haiyan Ding
 Hongping Chen
 Youping Liu
 Fu Wang
 Lin Chen
95% of researchers rate our articles as excellent or good
Learn more about the work of our research integrity team to safeguard the quality of each article we publish.
Find out more
ORIGINAL RESEARCH article
Front. Plant Sci. , 17 May 2023
Sec. Technical Advances in Plant Science
Volume 14 - 2023 | https://doi.org/10.3389/fpls.2023.1169321
Introduction: Citrus reticulata ‘Chachi’ peel (CRCP), which is named “Guangchenpi” in China, is a geographical indication product with unique flavor properties. CRCP has been used for centuries as a traditional genuine herb because of its excellent therapeutic effects. In addition, owing to its unique odor and high nutrition, it is widely used in various food preparations. Volatile organic compounds (VOCs) are regarded as an important quality marker for CRCP and are highly susceptible to effects in the drying process due to their thermal instability.
Methods: In the current study, the main VOCs in CRCP were processed using different drying methods, including sun-drying, hot air drying, and vacuum-freeze drying. The VOCs were identified by the electronic nose (E-nose), gas chromatography-ion mobility spectrometry (GC-IMS), and headspace solid-phase microextraction-gas chromatography-mass spectrometry (HS-SPME-GC-MS).
Results: The results showed that the CRCP dried by vacuum-freeze exhibited the highest VOCs contents and retained the richest compounds compared to those dried by other methods, which indicated that vacuum-freeze drying is the most suitable for CRCP production. Furthermore, the chemometrics analysis revealed that the primary differential metabolites of the samples generated using different drying methods were terpenes and esters.
Discussion: Overall, our study would help better understand the VOCs present in CRCP with different drying methods. The outcomes of the current study would guide the drying and processing of CRCP, which is beneficial for large-scale storage and industrial production of CRCP.
Citri Reticulatae Pericarpium (CRP) is derived from the dried mature peel of Citrus reticulata Blanco and its cultivars. Citrus reticulata ‘Chachi’ (CRC), Citrus reticulata ‘Dahongpao’, Citrus reticulata ‘Unshiu’ and Citrus reticulata ‘Langerina’ are the main source cultivars (Yu et al., 2018). CRC, primarily produced in Xinhui District, Guangdong Province, is a commercially essential and predominantly cultivated tangerine cultivar. It has been cultivated for more than 700 years in China. Currently, the cultivation area of CRC spans around 100,000 mu in Xinhui, and the output of its primary products exceeds 5000 tons, with nearly 100 kinds of further processed products (Liu G. W. et al., 2022). In addition, the industrial output value is 8.5 billion yuan, which generates more than 1.2 billion yuan of direct income for farmers in the region (Su et al., 2022).
CRCP is derived from the dried peel of mature fruit, considered most famous and valuable for its superior quality and therapeutic effects (Tan et al., 2015; Li et al., 2019). It has been found that the quality of CRCP is improved, with the prolonged storage period (Luo et al., 2019; Wang et al., 2022b). CRCP is not only used in Traditional Chinese medicine (TCM) but also foods, snacks, condiments, and teas, such as “Preserved Mandarin Peel”, “Ganpu Tea”, and “Tangerine Powder”, due to its unique aroma and taste (Lv et al., 2020). As a critical TCM component, CRCP has antitumor, pain and knots relief, antioxidant, and anti-neuroinflammatory activities, and has numerous health benefits for humans (Fu et al., 2017). Previous studies have illustrated several chemical components in CRCP, such as flavonoids, VOCs, alkaloids, phenolic acids, and limonoids (Zheng et al., 2021). Of these, flavonoids and VOCs are generally considered to be the main bioactive and characteristic components of CRCP(Yu et al., 2018). Though numerous studies on CRCP mainly focused on the quantification and efficacy analyses of flavonoids (Matsuo et al., 2019; Shorbagi et al., 2022), the estimation of its VOCs has received little attention. Plant odor is related to volatile components (Feng et al., 2022; Lu et al., 2022). There is a recently odor study on different varieties of peach has shown that (E, E)-2, 6-non-adienal, γ-decenolactone, β-ionone and hexyl hexanoate contributed the most to the overall aroma of peach fruit, which can distinguish different peach fruit samples well (Sun et al., 2022). VOCs are the secondary metabolites in CRCP, and there is a previous study proving that the aromatic odor of CRCP is generally imparted by volatile components (Duan et al., 2016). Previous studies have shown that the major volatile compounds in CRCP are β-myrcene, limonene, β-trans-Ocimene, γ-terpinene, and terpinolene. In contrast, the critical flavor compounds are hydroxymethyl furfural, hesperidin, nobiletin, and tangeretin (Cuevas et al., 2016; Li et al., 2022). Pharmacological studies demonstrated that the VOCs of CRCP exhibit anti-inflammatory and antioxidant properties. Also, these compounds confer protection against vascular damage and have a calming and suppressing effect against asthma and cough (Shen et al., 2017; Shahriari et al., 2018; Wang et al., 2018). VOCs contribute to the overall quality of CRCP and are also considered the main classifying factor between CRCP and other cultivars (Luo et al., 2019; Zheng et al., 2021). Generally, the VOCs are easily changed due to various factors, such as the harvest period or production processes. The traditional production of CRCP mainly includes five stages: fruit picking, peel opening, reverse peel, dry peel, and aging. The natural sun drying method is primarily adopted for the drying process. However, a previous study has revealed that different drying methods can have varying impacts on the aroma-related compounds of food or herbs (Yu et al., 2022). During the drying process, volatile compounds can be lost in the samples, which affects the quality and sensory properties (Xia et al., 2021). In addition, the currently used drying method may cause CRCP deterioration, such as moth-eaten or mildew, which is not conducive to storage and cannot assure the quality of CRCP. Therefore, comparing the effects of different drying methods on the VOCs in CRCP and screening out the best drying methods for CRCP production is of great significance to ensure the quality of CRCP.
VOCs estimation methods can be divided into the instrument-based and sensory-based analyses (Wu et al., 2022). Methods based on the instrument analysis include gas chromatography-mass spectrometry (GC-MS), gas chromatography-olfactometry (GC-O), gas chromatography-ion mobility spectrometry (GC-IMS), and comprehensive two-dimensional gas chromatography time of flight mass spectrometry (GC×GC-TOFMS) (Liu H. et al., 2022). GC-MS is a well-established analytical technique for studying VOCs in CRCP, which can be combined with HS-SPME. HS-SPME has been considered to be the simplest and the most direct method to obtain volatile compounds from plant (Nekoei and Mohammadhosseini, 2018). HS-SPME-GC-MS is a sensitive and comparatively simple method with easy sample preparation steps(Zhao et al., 2022). It is most frequently used for the qualitative and quantitative determination of VOCs in foods and herbs (Nekoei and Mohammadhosseini, 2017; Nekoei and Mohammadhosseini, 2018; Mohammadhosseini et al., 2021). HS-SPME-GC-MS approach was proven to be effective in estimating the effects of a season change on volatile compounds in green tea (Wang et al., 2022c), analyzing the volatile compounds of traditional Chinese sesame oil (Chen et al., 2022), and monitoring VOCs in pear during storage (Gao et al., 2022). GC-IMS is a suitable approach for separating and measuring VOCs (Wang et al., 2022d). It enables VOCs analysis of VOCs in liquid and solid samples without pretreatment (Wang et al., 2020). In addition to providing a more precise reflection of the volatile composition in a sample, this approach is faster, more accurate, and less expensive than GC-MS analysis (Rodriguez-Maecker et al., 2017; Gerhardt et al., 2018; Wang et al., 2019). GC-IMS has been used increasingly for VOCs characterization in recent years due to its ability to effectively and intuitively distinguish the differences in the samples (Ding et al., 2022). A previous study has shown that GC-IMS can identify CRCP and other varieties (Lv et al., 2020). It can also characterize the critical aromatic compounds in wine grape varieties (Cao et al., 2022).
Methods based on sensory mainly include electronic nose (E-nose) and electronic tongue. The E-nose approach, derived from various aroma-sensor technologies, has been used with increasing popularity since it allows the capture of real-time data regarding the chemical and physical nature and quality of plants (Qiu and Wang, 2015). It has been an excellent approach for identifying VOCs in the food, cosmetic, and pharmaceutical industries (Peris and Escuder-Gilabert, 2009). E-nose effectively distinguished the CRCP from different CRP cultivars (Li et al., 2019), and the flavor compounds in Nanjing water-boiled salted duck (Wang et al., 2022a). Therefore, the synergy of E-nose can be exploited with the GC-IMS and HS-SPME-GC-MS approaches for evaluating VOCs.
Previous studies have shown that the VOCs in CRCP are diverse and not homogeneous because the odor is unique (Zheng et al., 2018). Nevertheless, to our knowledge, less study or analysis has been conducted to assess the VOCs in CRCP, which is derived using different drying methods. Therefore, the current study aimed was to analyze the VOCs in CRCP with different drying methods and identify the best approach for CRCP production to effectively retain the maximum variety and the highest content of VOCs. HS-SPME-GC-MS and GC-IMS combined with chemometrics were used to compare the effects of different drying methods on the VOCs of CRCP. The outcomes of our study would help to select the best method for drying CRCP with improved quality, increased production, and enhanced product stability. Further, our work would provide a valuable reference for large-scale CRCP production.
CRC was collected from Sanqingwei, Sanjiang Town, Xinhui District, Jiangmen City, Guangdong Province, and authenticated by the Pharmacy College, Chengdu University of Chinese Medicine. CRCP was washed with clean water, artificially peeled, and randomly divided for different drying approaches such as sun-drying, hot air drying, and vacuum freeze-drying. The sun-dried CRCP (SD) was naturally dried in sunny weather for seven days. The hot air-dried CRCP (HAD) was dried at 60°C for eight hours in the electric blast dryer. The vacuum-freeze dried CRCP (VFD) was freeze-dried at -50°C for 24 hours in the freeze dryer. The production process of the samples is shown in Figure 1. After preparation, all the samples were stored in a dry place at room temperature.
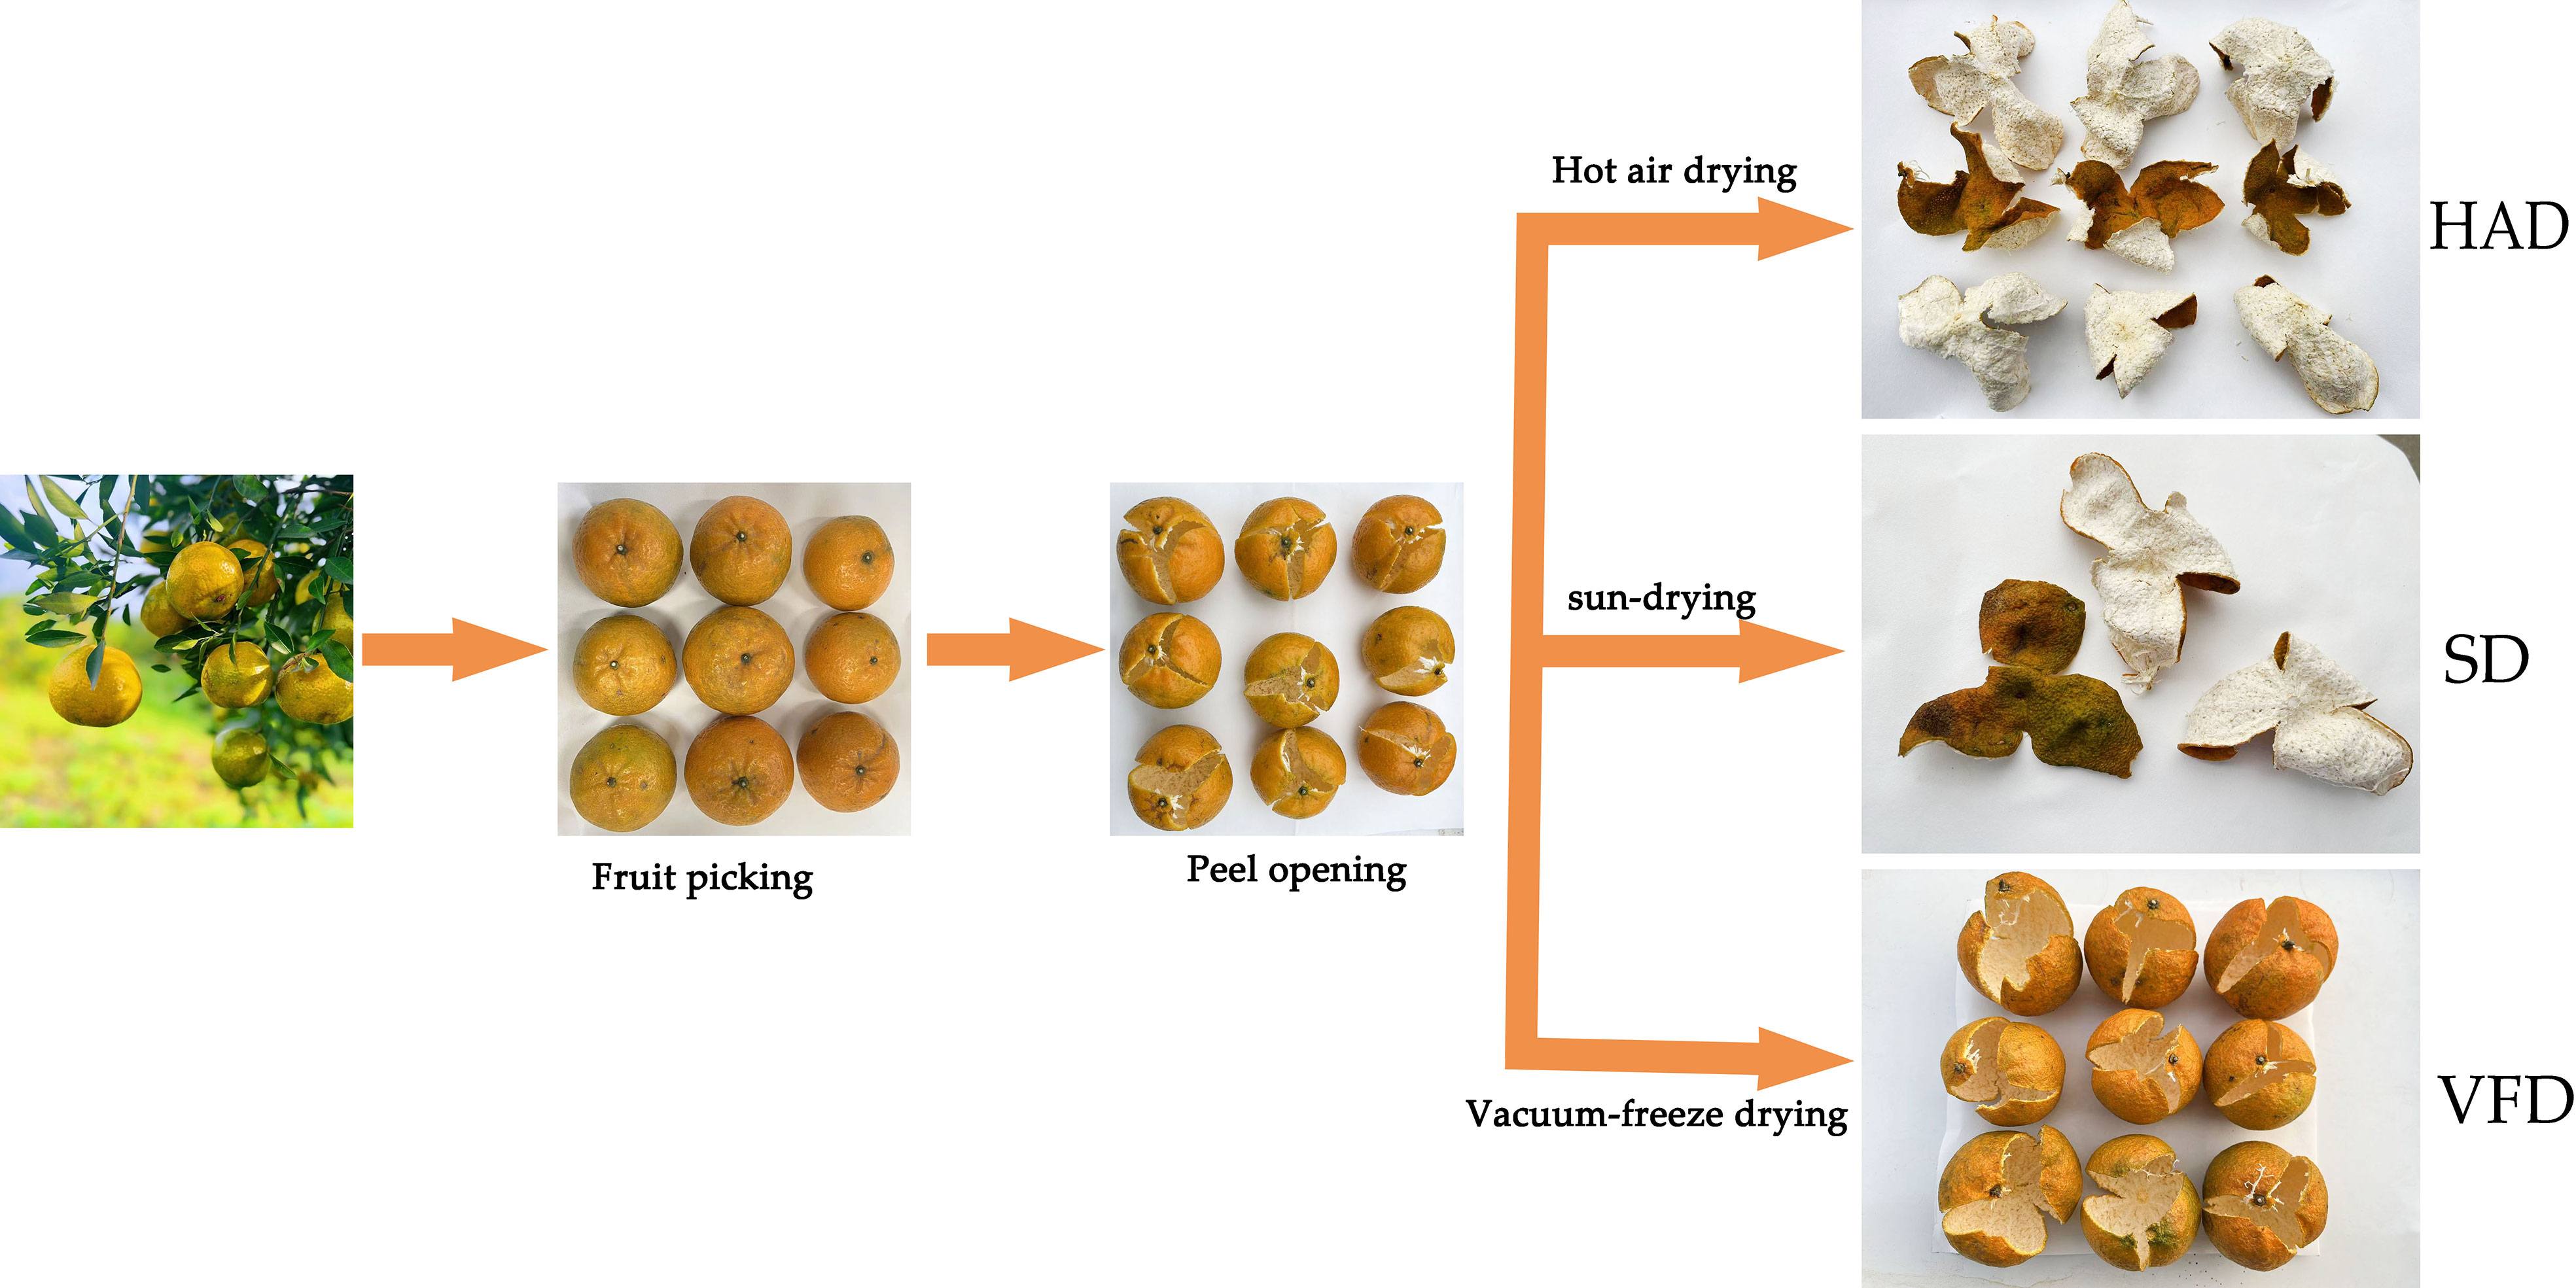
Figure 1 The production process of dry peel samples of Citrus reticulata ′Chachi′ with three different drying methods. HAD, Citrus reticulata ′Chachi′ peel by hot air drying; SD, Citrus reticulata ′Chachi′ peel by sun-drying; VFD, Citrus reticulata ′Chachi′ peel by vacuum-freeze drying.
The standards were purchased from BioBioPha Co., Ltd. (Yunnan, China) and Sigma-Aldrich Chemical Co., Ltd. (Missouri, USA). Normal hexane was purchased from Merck & Co., Inc. (Rahway, USA). The external reference n-ketones (C4-C9) for GC-MS and NaCl were purchased from Sinopharm Chemical Reagent Co., Ltd. (Beijing, China). All other chemicals used in the study were of analytical grade.
E-nose analysis was performed using an 8 MEMS-MOS E-nose (Isensortalk Co., Ltd. Beijing, China). The working principle of E-nose is shown in Figure S1. In the testing process, the samples are detected by the odor analyzer, as the sensors have different responses to the odor of different samples. The samples are defined by the response values of the sensors, and then the samples are analyzed by the corresponding analysis software to distinguish and identify the samples. First, the samples were ground into powder with a mortar at room temperature. For E-nose analysis, 2.0 g of the sample was placed into a 20-mL headspace vial. Two probes were inserted into the headspace vail, one connected to the sensor chamber and the other to a charcoal filter. Each sample was run in triplicates, and data were obtained from the sensor array after 60s injection to determine the stability of the sensor signals. Data from 55s to 58s were taken for subsequent statistical analysis. After sample analysis, the system was purified with filtered clean air for 120 s to re-establish the instrument baseline. All samples were tested at room temperature.
In this study, GC-IMS (FlavourSpec®, G.A.S., Germany) was used to analyze VOCs in CRCP. Figure S2 shows the working principle of GC-IMS. During the detection, the sample enters the instrument with carrier gas. According to the red dotted line, it first goes through the primary separation of the gas chromatographic column, and then enters the ion migration tube. After ionization in the ionization zone, the molecules under test migrate to the Faraday disk under the action of electric field and reverse drift gas for detection, realizing the secondary separation. Firstly, all the samples were cut into small pieces with scissors at room temperature. Then, 1.0 g of the sample was accurately weighed into a 20-mL headspace vial and incubated at 60°C and 500 rpm for 20 min in the shaker. The volume of the automatic headspace injection was 300µL and the temperature of the injection needle was 85°C. Then the volatile compounds were subjected to a chromatographic column (FS-SE-54-CB-1, 15 m, ID: 0.53 mm) for separation at 60°C for 30 min. Each sample was measured three times in parallel. The temperature of the column and IMS was 60°C and 45°C, respectively. High-purity nitrogen (purity 99.99%) was used as the carrier and drift gas. The flow rate of the drift gas was set at 150 mL/min. The programmed flow rate of the whole phase was as follows: 2 mL/min for 2 min, 10 mL/min for 8 min, 100 mL/min for 10 min, and 150 mL/min for 10 min. The total analysis time was 30 min. The VOCs were identified based on the RIs of standard substances in the GC-IMS library (G.A.S.).
In this study, all the samples were ground at room temperature and vortexed to mix well. About 1.0 g of each sample was weighed in 20-mL headspace vials. NaCl-saturated solution and 10 µl of internal standard solution were added to each vial. The samples were mixed by shaking for 5 min at a constant temperature of 100°C. Subsequently, 50/30 µm DVB/CAR/PDMS SPME fibers (Agilent) were inserted into the headspace above the samples in the vails for extraction for 15 min at 100°C. After extraction, the samples were resolved at 250°C for 5 min and GC-MS analysis was performed. Each sample was measured three times in parallel.
The GC-MS system comprised an Agilent 7890B gas chromatograph and an Agilent 7000D series mass spectrometer (Agilent). High-purity Helium (purity 99.999%) gas was passed at 1.2 mL/min through the Agilent DB-5MS capillary column (30 m × 0.25 mm × 0.25 µm). The volatile compounds were first desorbed from the SPME fiber by heating at 250°C for 3.5 min. The heating procedure of the column was as follows: a temperature of 40°C was maintained for 3.5 min; an increase to 100°C at a rate of 10°C/min; an increase to 180°C at a rate of 7°C/min; further an increase to 280°C at a rate of 25°C/min; and finally held for 7 min. Mass spectrometer (MS) recorded in electron impact (EI) ionization mode at 70 eV. The quadrupole mass detector, ion source, and transfer line temperatures were set at 150, 230 and 280°C, respectively. The ion monitoring (SIM) mode was used to identify and quantify analytes.
All experiments were performed in triplicates. For GC-IMS, the VOCal was used for viewing analytical spectra and quantifying the data. The built-in NIST and IMS databases were used for qualitative analysis of VOCs. The Reporter plug-in Laboratory Analytical Viewer (LAV) was used to compare the differences in GC-IMS chromatograms of the samples. For visually and quantitatively comparing the differences in VOCs of the samples, the Gallery Plot plug-in was used for fingerprint comparison. For HS-SPME-GC-MS, the Qualitative Analysis Workflows B.08.00 was used to open and browse the raw data for qualitative analysis. Qualitative and quantitative mass spectrometric analysis of the metabolites of the samples was based on the MWGCSIM1.0 database. MassHunter was used to integrate and corrected chromatographic peaks. The coefficient of variation was used to reflect the degree of data dispersion. Principal component analysis (PCA), hierarchical cluster analysis (HCA), orthogonal partial least squares discriminant analysis (OPLS-DA), Pearson′s correlation coefficient, and heatmap analyses were processed by R Project.
Figure 2A depicts that W1S, W1W, and W5C sensors exhibited more robust responses to VOCs in the samples. This observation indicates that the CRCP might have a higher abundance of methane, broad-methane, broad-range compounds, sulfur compounds, terpenes, organic sulfur compounds, arom-aliph, alkanes, aromatic compounds, and less polar compounds. However, E-nose is not completely sensitive to aromatic substances in CRCP. In addition, it cannot identify these substances qualitatively or quantitatively. Therefore, the E-nose can only represent a part of the aroma characteristics of CRCP.

Figure 2 (A) The radar chart of the E-nose response data; (B) The LDA of the E-nose response data.
The linear discriminant analysis (LDA) maximizes the interclass variance and minimizes the intraclass variance, i.e., reduces the differences within the classes while expanding the variations between different classes (Gerhardt et al., 2019; Xu et al., 2020; Carrillo-Gómez et al., 2021). Thus, the LDA method was used to distinguish the CRCP produced using different drying methods. As shown in Figure 2B, the variance contribution rates of LD1 and LD2 were 76.56% and 13.45%. The distance between the samples was relatively far, indicating that the samples were significantly different from each other. The findings revealed that CRCP with different drying methods has significant differences, which can be identified and compared further.
Unlike GC-MS analysis, which relies on the chemical morphology for analyte identification, the qualitative approach of GC-IMS is based on the two-dimensional (2D) separation of component analytes. A GC-IMS topographic map, composed of many 2D maps, acts as a global fingerprint of VOCs in the samples(Gerhardt et al., 2018). Numerous spots on a 2D topographic plot represented the VOCs of CRCP samples. As shown in Figure 3A, the abscissa and the ordinate are the drift and retention times, respectively. The red vertical line on the left side of the spectrum signifies the reactive ion peak (RIP), which could be used as the standard to determine the activity of the substance. Blue is the image′s background color, and the Ko is 1.987 cm2/Vs. The spots with different color shades represented different concentrations of each substance. In contrast, the color intensity signified the VOC concentrations, with white dots indicating a lower concentration and red dots indicating a higher concentration(Tian et al., 2020). The color strength represented the concentration. The drift time range of 1.0-2.0ms and the retention time with the 2000s were kept. The VOCs of CRCP were determined by combining retention indexes, retention time, drift times, and Ko based on the NIST database. Based on the 2D topographic plot of VFD, many red spots with high concentration were observed in the plots of HAD and SD. Especially, the maximum number of red spots in the 2D topographic plot of SD indicated that the concentration of VOCs in HAD and SD was higher than that in VFD.
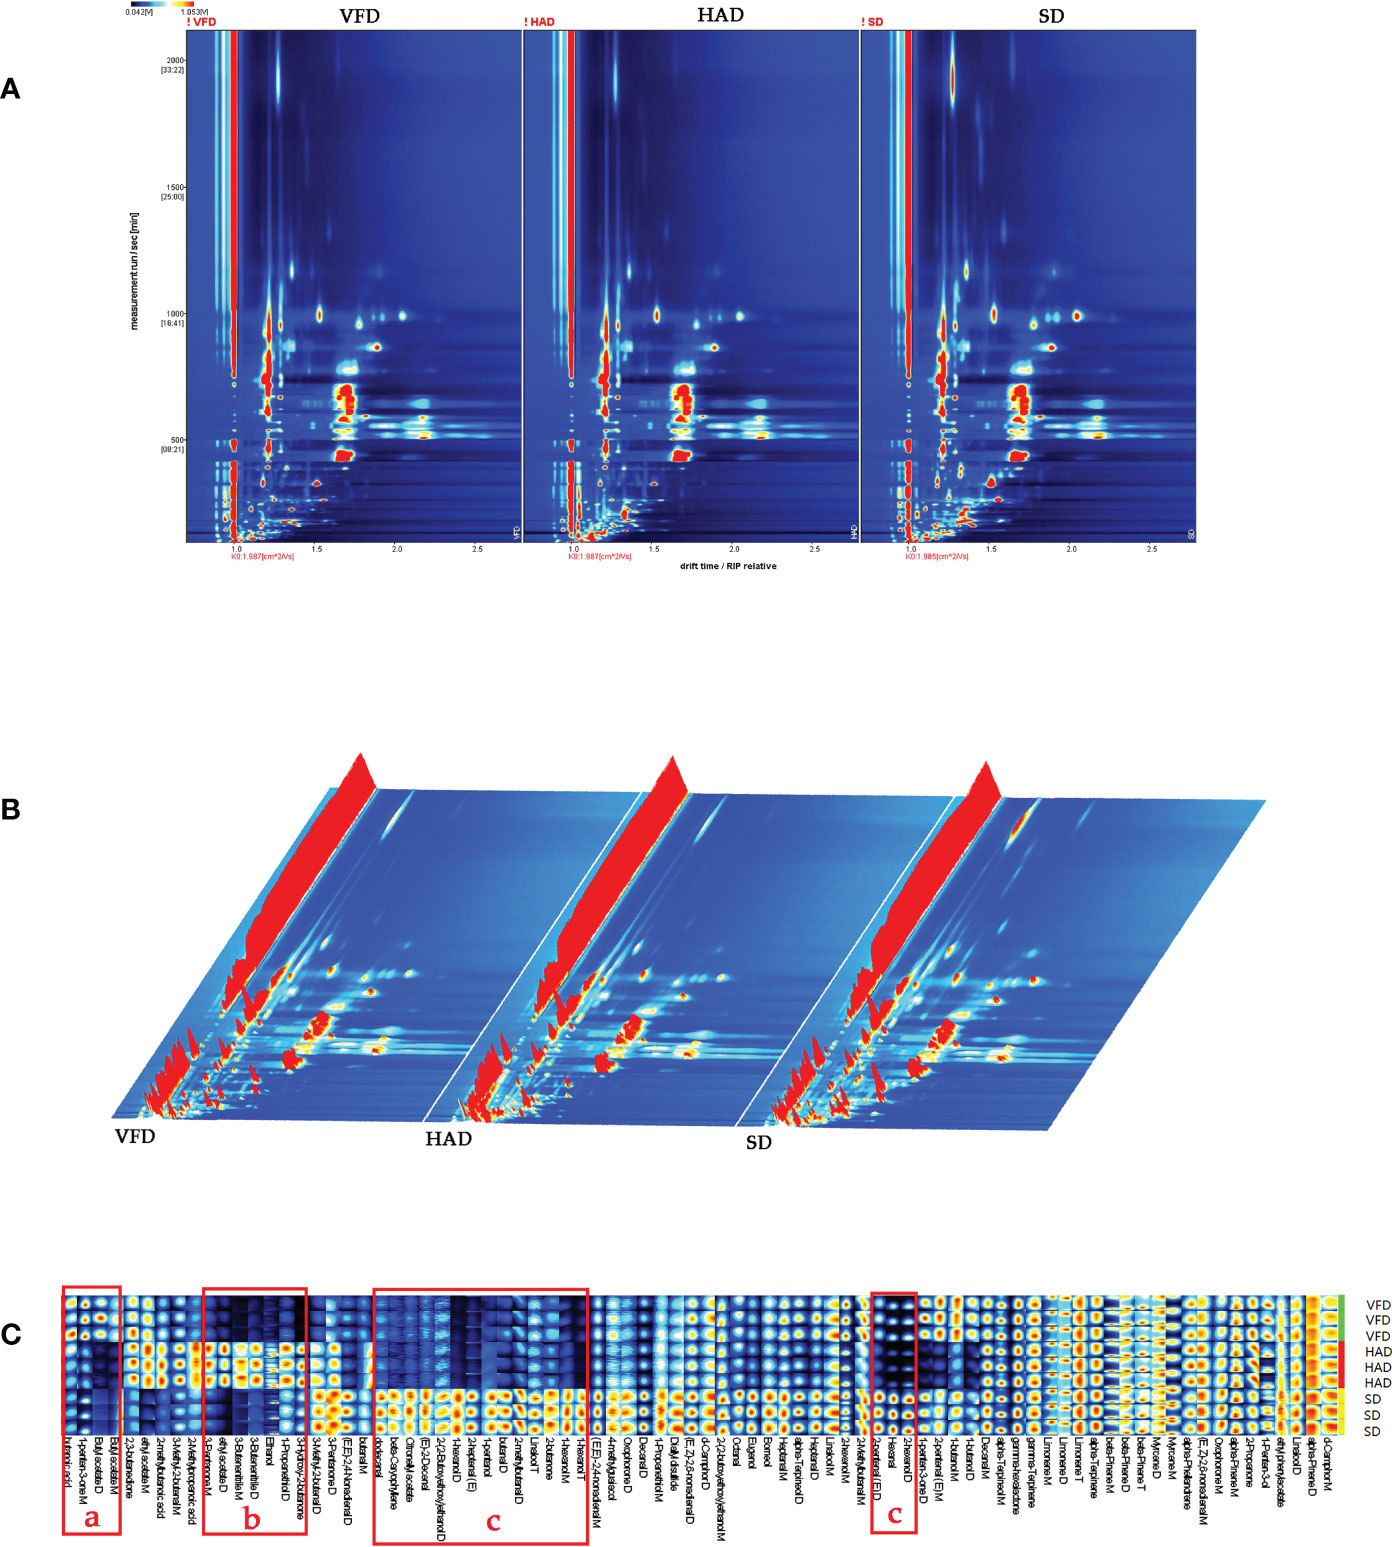
Figure 3 (A) Two-dimensional chromatogram results of VOCs in CRCP with different drying methods; (B) Three-dimensional chromatogram results of VOCs in CRCP with different drying methods; (C) The VOCs fingerprint of CRCP with different drying methods.
A three-dimensional (3D) topographic plot was established to observe the difference directly. As shown in Figure 3B, the x-axis, y-axis, and z-axis of the 3D topographic plot represented the separated ions′ drift time, the detected substances′ retention time, and the signal strength of ionic compounds, respectively. We observed that the ion peak distribution of the three groups of samples is very similar, but the height of the peak signal is different. A comparison with the 3D topographic plot of VFD further revealed that the 3D topographic plot of HAD and SD have more and higher peaks.
Fingerprints can be used to distinguish closely related substances effectively. While comprehensively and visually analyzing the differences in the VOCs composition of three CRCP samples, the software selected the VOCs signal peaks in the spectra of each sample to form the fingerprints. Figure 3C represents the fingerprint of VOCs of CRCP samples produced with different drying methods. The results revealed that the CRCP samples with different drying methods had their characteristic peak regions and common regions. In Figure 3C, part “a” represents the characteristic VOCs of VFD, which mainly includes butanoic acid and butyl acetate. Part “b” indicates the characteristic VOCs of HAD, which majorly includes 1-propanethiol, 2-methylbutanoic acid, 2-methylpropanoic acid, 3-butenenitrile, 3-hydroxy-2-butanone, 3-methyl-2-butenal, 3-pentanone, ethanol, ethyl acetate. Part “c” represents the characteristic VOCs of SD, which includes (E)-2-decenal, (E, Z)-2,6-nonadienal, (E, E)-2,4-nonadienal, 2-heptenal(E), octanal, 2-methylbutanal, butanal, dodecanal decanal, 1-hexanol, 1-pentanol, 2-(2-butoxyethoxy) ethanol, 4-methylguaiacol, borneol, eugenol, linalool, oxophorone, 2-butanone, beta-caryophyllene, citronellyl acetate, D-camphor, diallyl disulfide, and a large number of other substances.
A comprehensive investigation of the topographic plots and fingerprints of various VOCs highlighted the necessity and importance of an in-depth analysis of the data from GC-IMS. GC-IMS detected about 101 volatile compounds. However, as shown in Table 1, only 82 compounds were identified, including 20 alcohols, 21 aldehydes, three sulfur compounds, three acids, 14 terpenes, nine ketones, seven esters, and five other compounds. The VOCs of CRCP with the three drying methods were analyzed and compared, and it was found that the VOCs of these three groups were significantly different. The main common compound was terpene, except for the characteristic compounds present at higher concentrations in each group. It was also observed that the lowest VOCs were in VFD, while the maximum number and highest concentration of VOCs were found in SD.

Table 1 VOCs in CRCP with different drying methods by GC-IMS.
A total of 431 metabolites were detected using the GC-MS detection platform and the MWGCSIM1.0 database. Table S1 represents 41 hydrocarbons, 24 aromatics, 79 esters, 88 terpenes, 45 alcohols, 40 ketones, 32 heterocyclic compounds, 42 aldehydes, five nitrogen compounds, ten amines, eight acids, six sulfur compounds, five phenols, three halogenated hydrocarbons, and three other compounds identified in all CRCP samples. Total ion chromatogram (TIC) overlapping map of quality control sample and TIC map of mixed sample showed in Figure S3. All substances were quantified with the internal standard as a reference, and the contents of various VOCs in CRCP with different drying methods are shown in Figure 4. The quantitative results depicted that the content of all VOCs in VFD was higher than that in the other two groups. The specific compounds in the three sample groups were analyzed, and the results of the highest ten VOCs were shown in Table 2, and their chromatographic integration diagrams are shown in Figure S4. We generated a heatmap for more intuitive observation, as shown in Figure 5A. The cluster heat map represented the VOC concentration in the samples. The content of VOCs in CRCP with different drying methods was significantly different, and the total concentration of VOCs in VFD was markedly higher than that in SD and HAD.
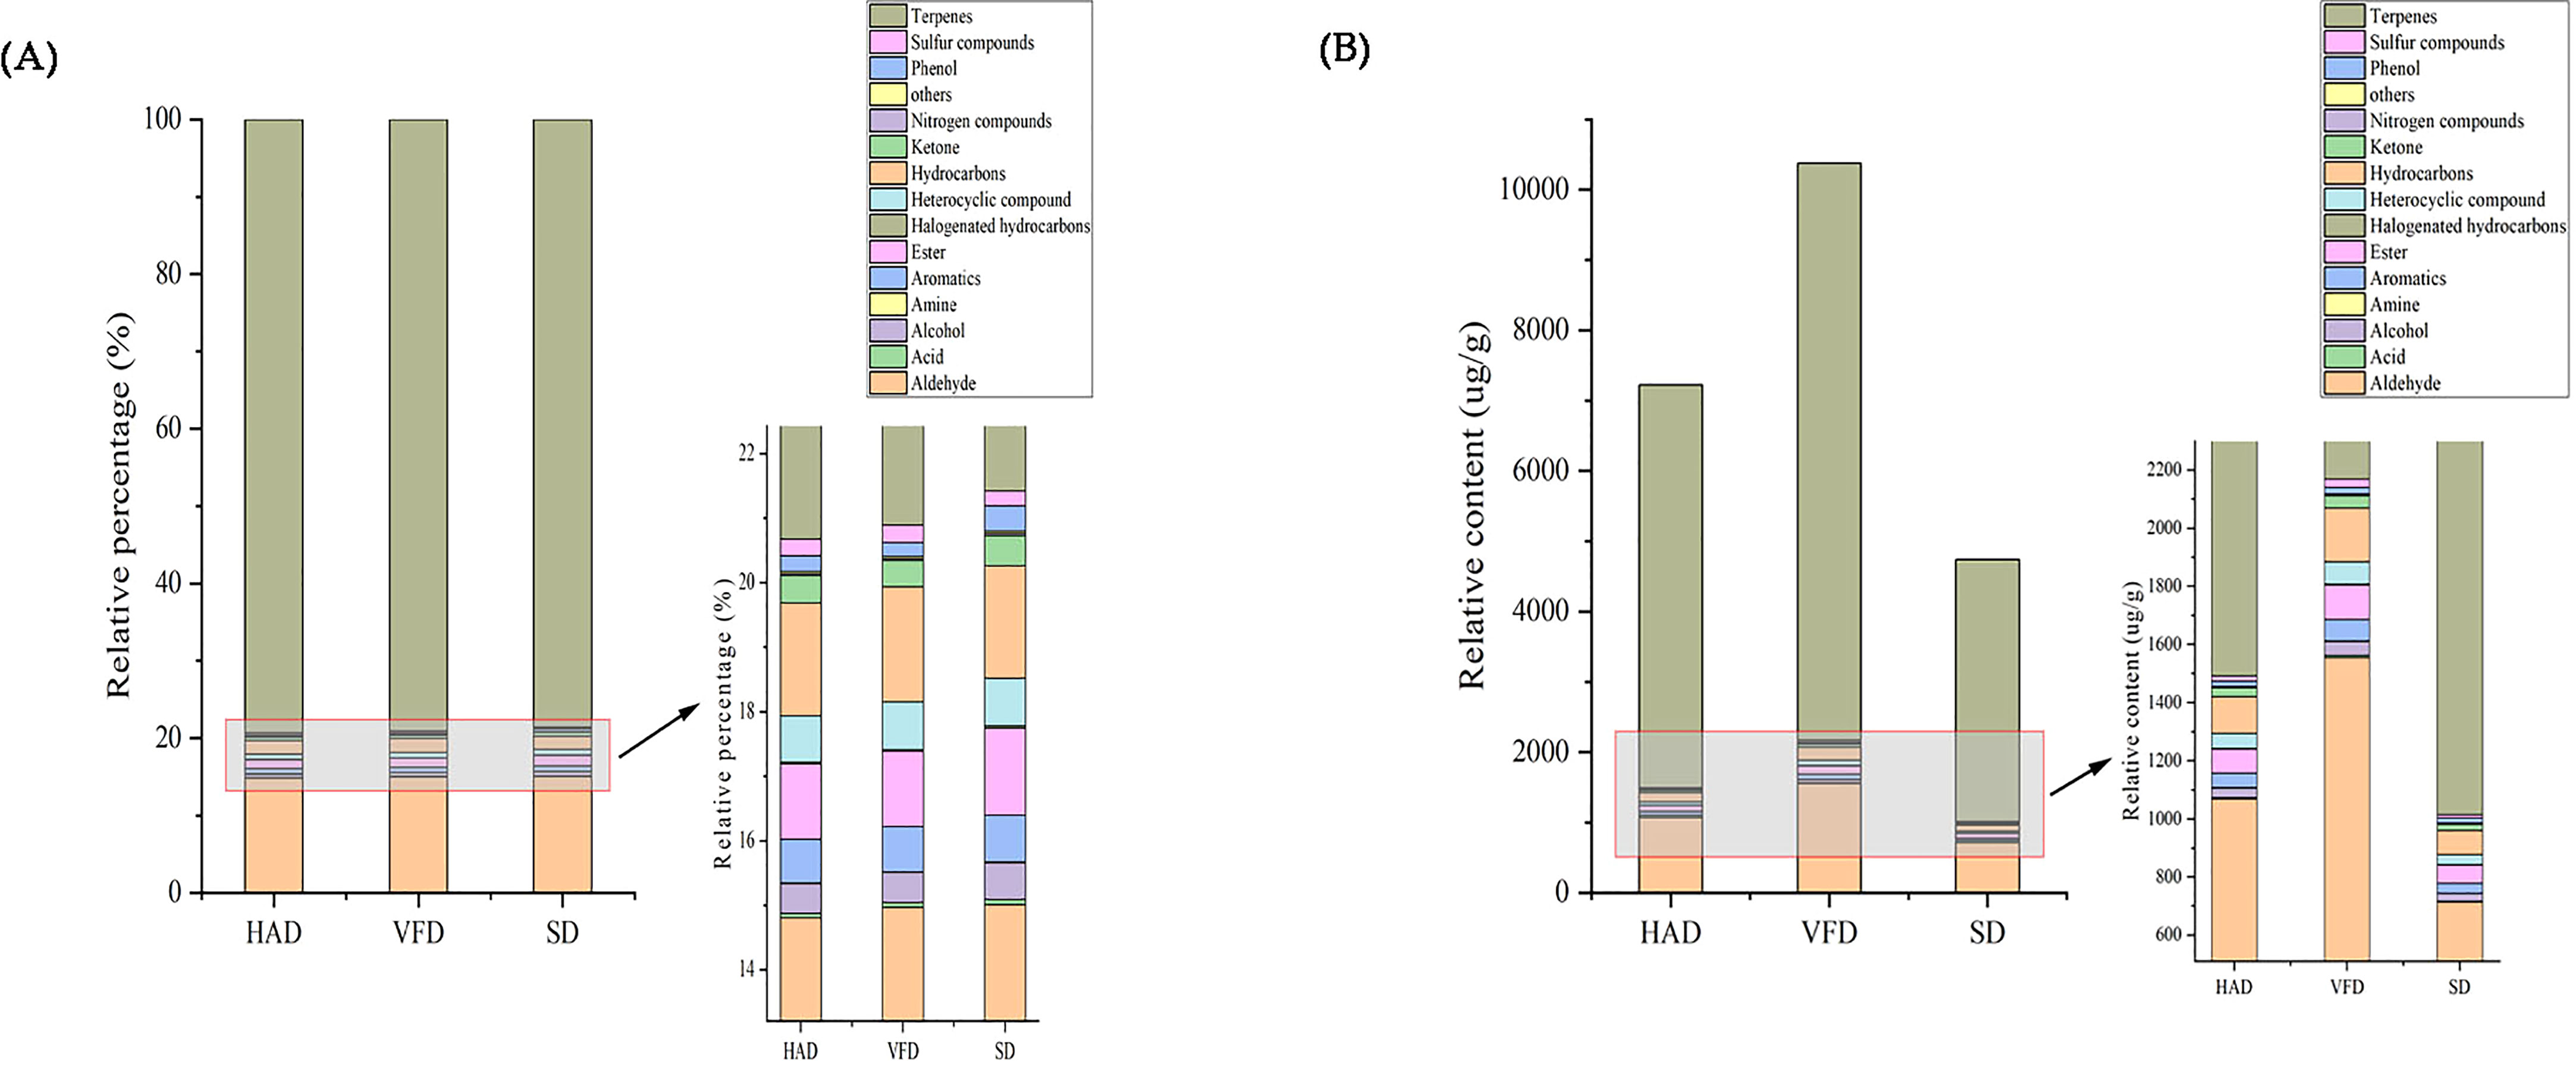
Figure 4 (A) Histogram of relative percentage of different categories of VOCs in CRCP; (B) Histogram of relative content of different categories of VOCs in CRCP.
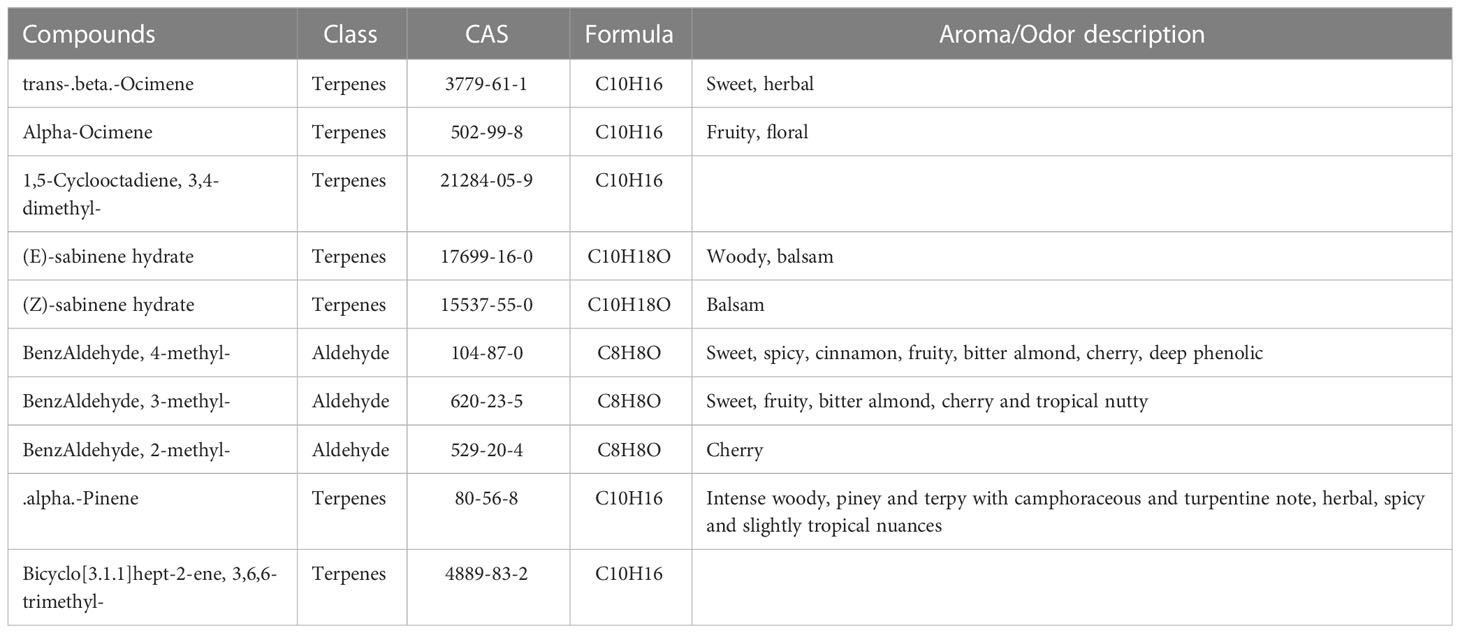
Table 2 The top ten VOCs with higher content in CRCP.
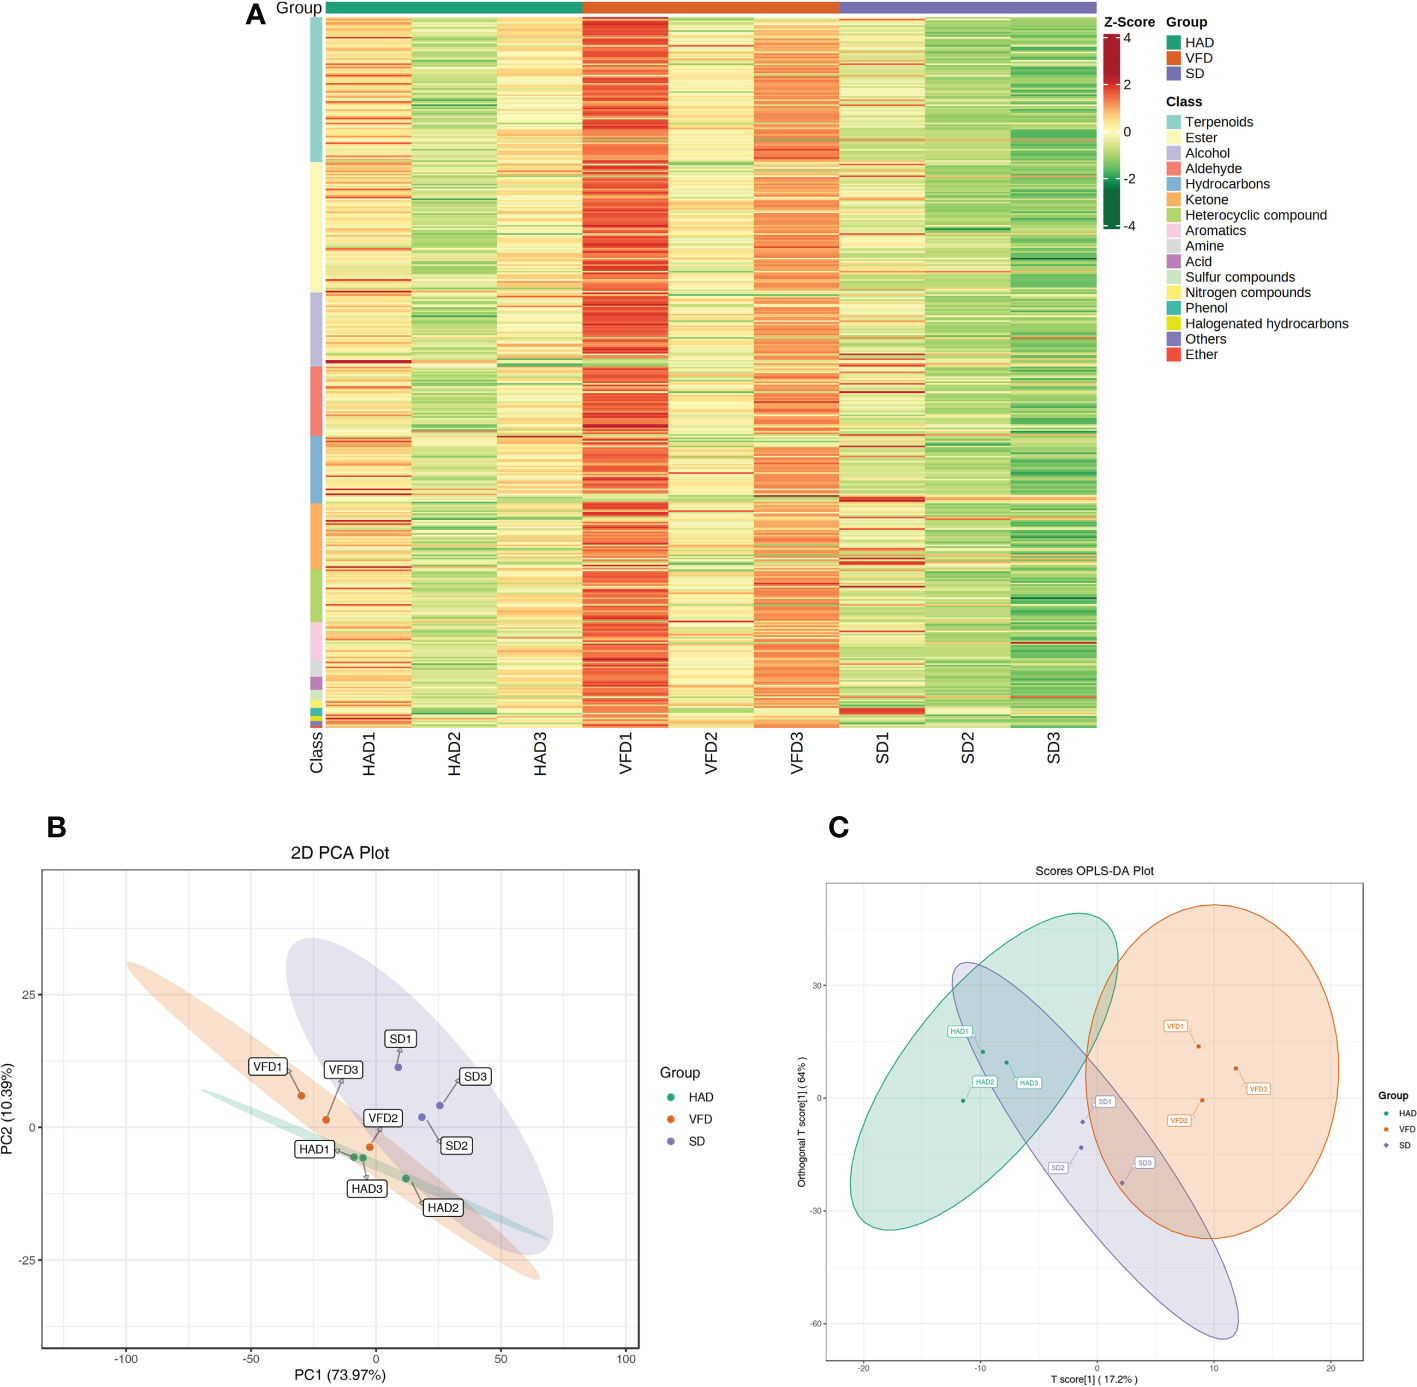
Figure 5 (A) Heat map of VOCs content for CRCP with different drying methods; (B) PCA scores plot of VOCs content for CRCP with different drying methods. (C) OPLS-DA scores plot of VOCs content for CRCP with different drying methods.
PCA analysis of the whole sample can preliminarily estimate the overall differences in metabolites between the groups and the amplitude of variation between the samples within the group. Based on the PCA results, it can be understood whether there is a tendency for metabolome separation between groups and whether there are differences between sample groups (Chen et al., 2009). To further compare and distinguish three drying methods, PCA analysis was performed. Figure 5B demonstrates the PCA scores plot of the mean VOCs contents of CRCP with three drying methods measured by HS-SPME-GC-MS. PCA scores plot revealed that about 84.36% of the total variance is explained by the first two principal compounds, among which PC1 and PC2 accounted for 73.97% and 10.39%, respectively. PCA score plots showed significant differences in the VOCs among the three groups, and the short distance between three parallel samples indicated the repeatability of the data. Altogether, PCA revealed clear separation and good repeatability among the three groups.
The metabolic group data were analyzed using the OPLS-DA model, and the scores of each subgroup were plotted further to demonstrate the differences between each subgroup(Thevenot et al., 2015). Figure 5C shows CRCP with different drying methods could be distinguished. The score plots and flavor variables [variable importance projection (VIP) > 1.0] of each group were drawn using the OPLS-DA model to further explain the flavor determiners between CRCP with different drying methods (Figure 6). While comparing HAD to VFD samples, 4-methylene-5-Hexenal, 1,2,3,5-tetramethyl-Benzene, and 2,4-dimethyl-Decane showed a more significant effect in discrimination. The main differentials between SD and HAD samples were dimethyl Hexanoic Acid, 3-Mercapto-3-methylbutanol, and 3-phenyl-2-Propen-1-ol. The difference between SD and VFD samples was because of the most apparent compounds: Hexanoic Acid, 2-Methylbutanoic anhydride, and E-1-Methoxy-4-hexene.
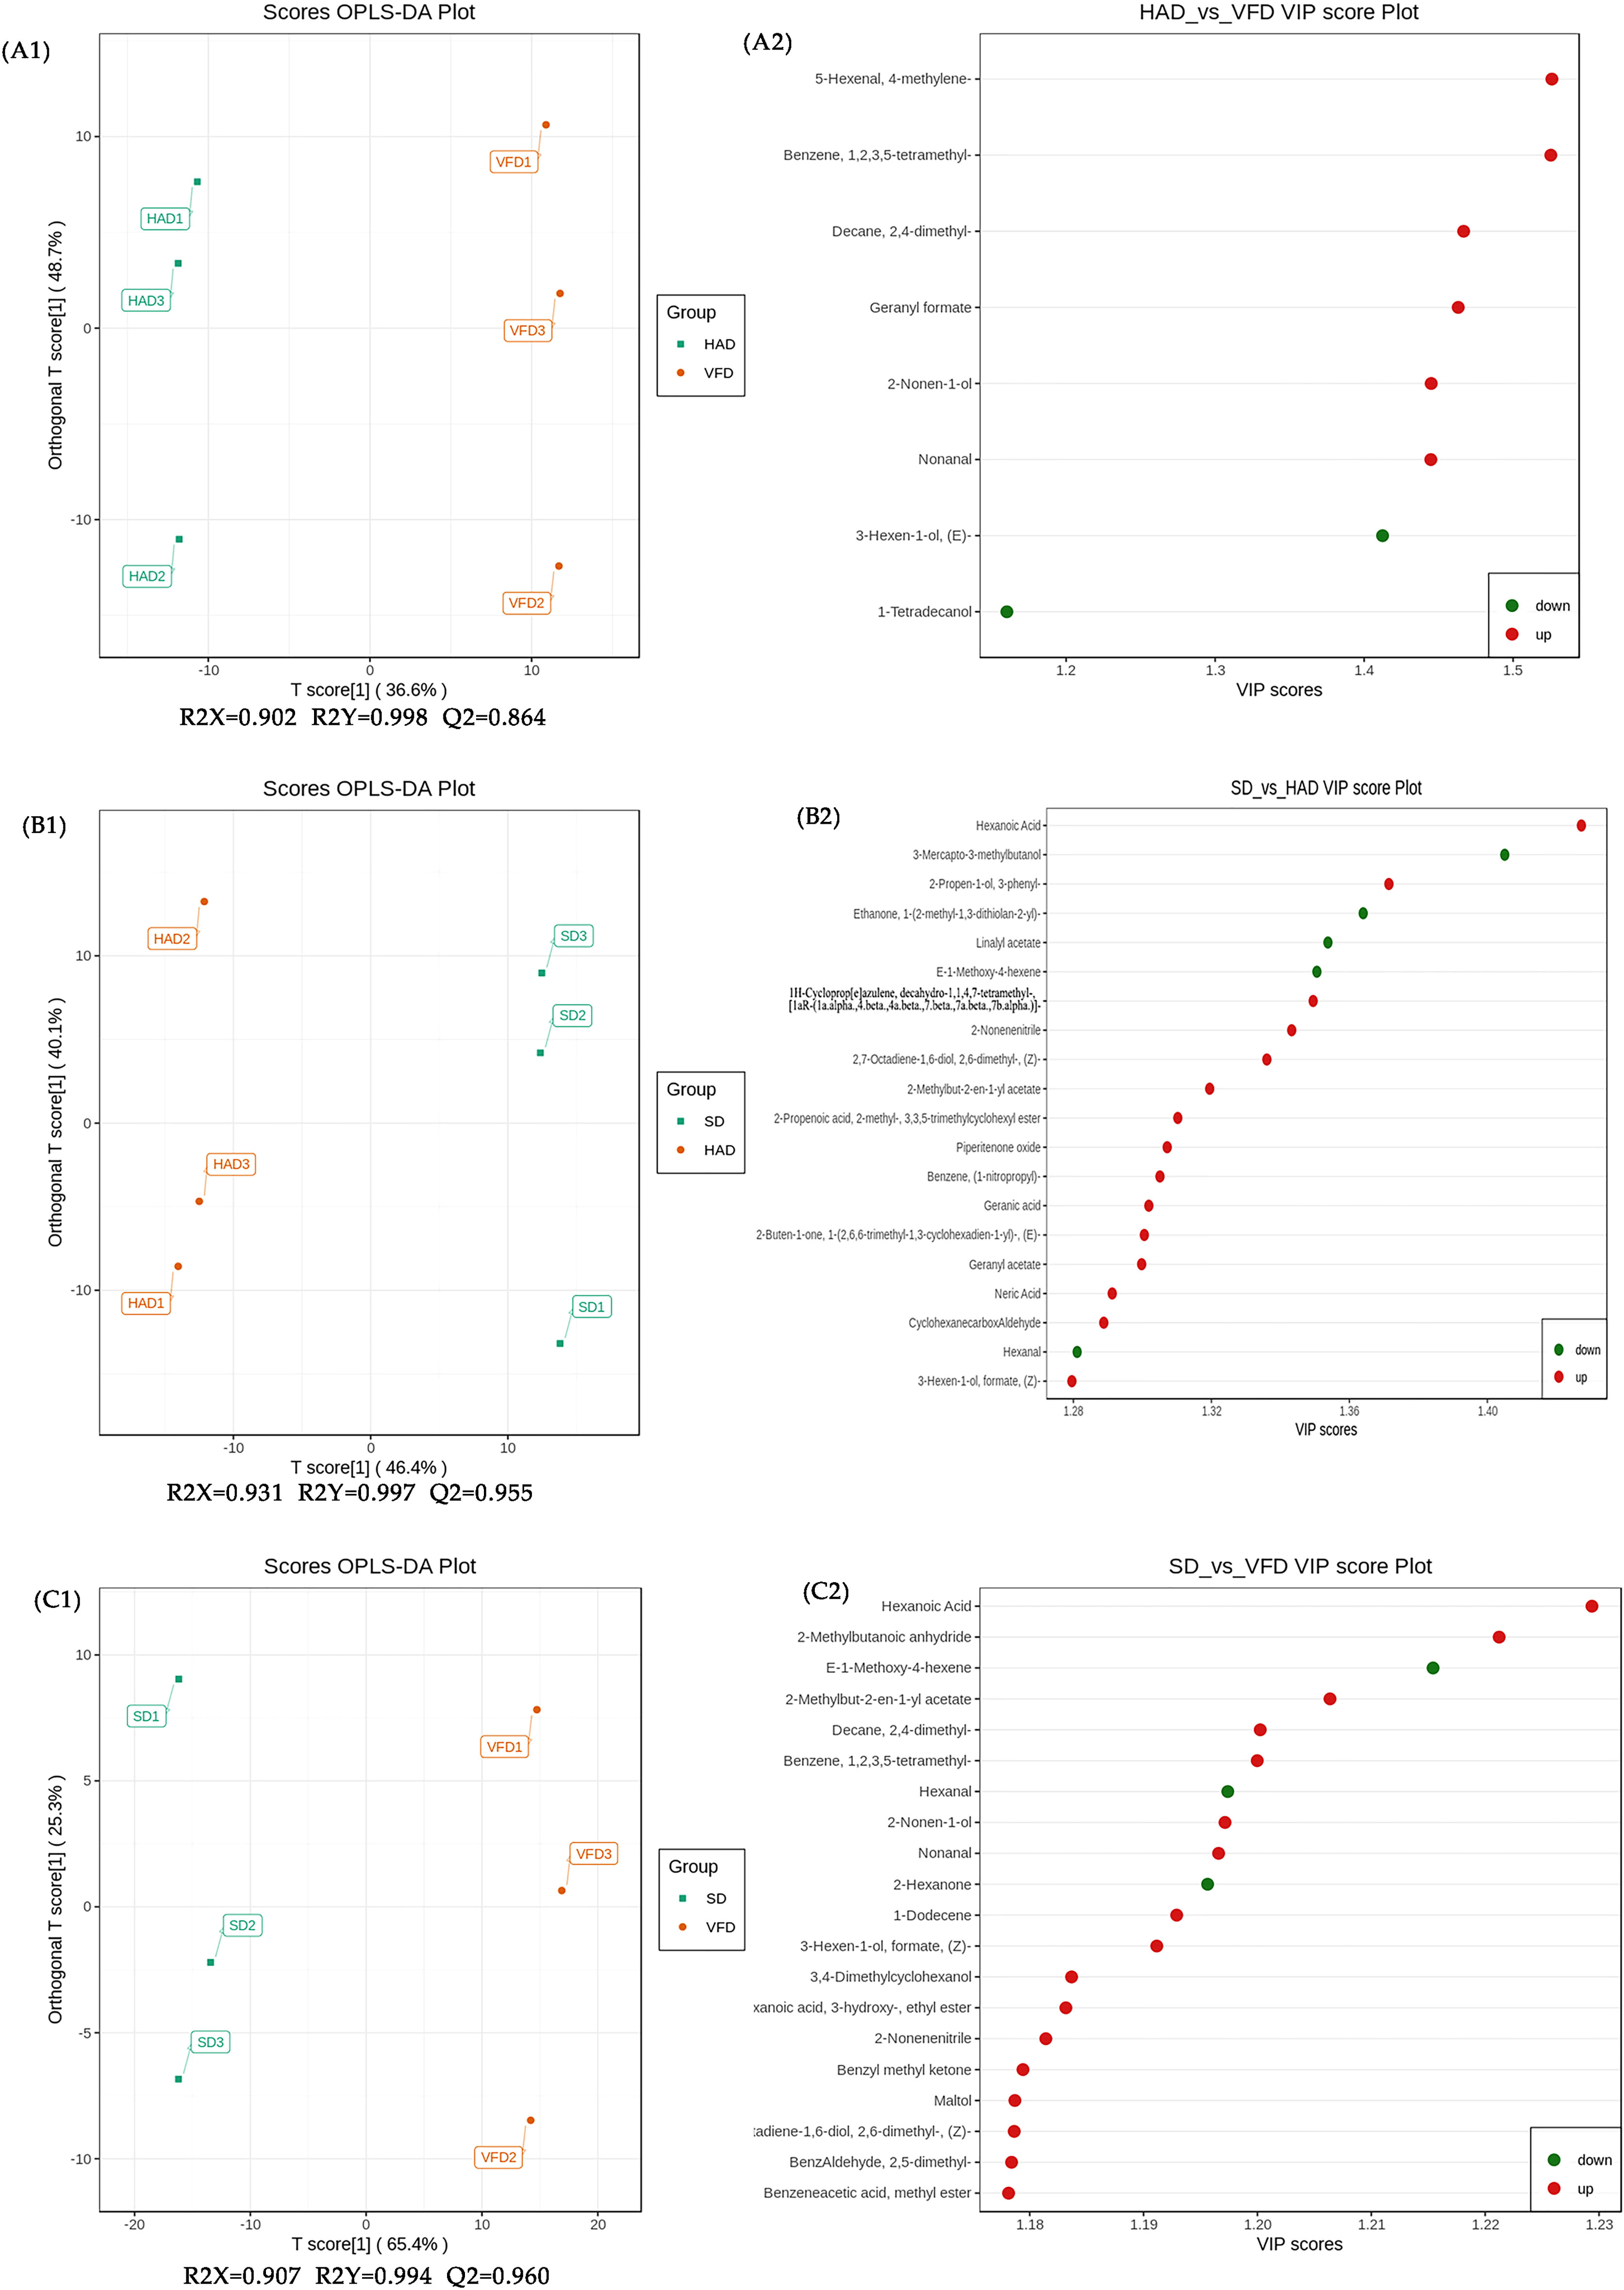
Figure 6 Scores plots (A1, B1, C1) and VIP plots (A2, B2, C2) of the OPLS-DA of VOCs in CRCP with different drying methods by HS-SPME-GC-MS. (A1, A2): HAD vs. VFD; (B1, B2): SD vs. HAD; (C1, C2): SD vs. VFD.
The PCA and OPLS-DA analyses showed that HS-SPME-GC-MS could efficiently distinguish CRCP with different drying methods. Therefore, differential metabolites can be screened to compare three drying methods for CRCP production further. Differential metabolites were screened by the VIP of the OPLS-DA model combined with fold change (FC). The screening criteria were VIP≥1, FC≥1.5, and FC ≤ 0.67. The final results of differential metabolite screening are shown in Table S2, which revealed eight different metabolites in HAD compared to VFD, two of which were down-regulated while six were up-regulated. There were 105 different metabolites in SD and HAD, among which 13 were down-regulated while 92 were up-regulated. There were 156 different metabolites in SD and VFD, of which nine were down-regulated while 147 were up-regulated. The Venn diagram of differential metabolites is shown in Figure 7A. The analysis of three groups of metabolites unraveled that the differential metabolites of HAD and VFD were mainly alcohols. At the same time, SD and HAD, SD and VFD were mainly esters and terpenes. Volcano plots demonstrated the relative content differences of metabolites in two groups of samples as well as their statistical significance. For each comparison group, the differential metabolites are shown in Figure 7B–D, respectively. Each point in the volcano plot represents a metabolite, where green points represent down-regulated differential metabolites, red points represent up-regulated differential metabolites, and gray represents the metabolites that showed no significant difference in the expression. The volcanic map illustrated that the differences were significant, and the screened differential metabolites were reliable.
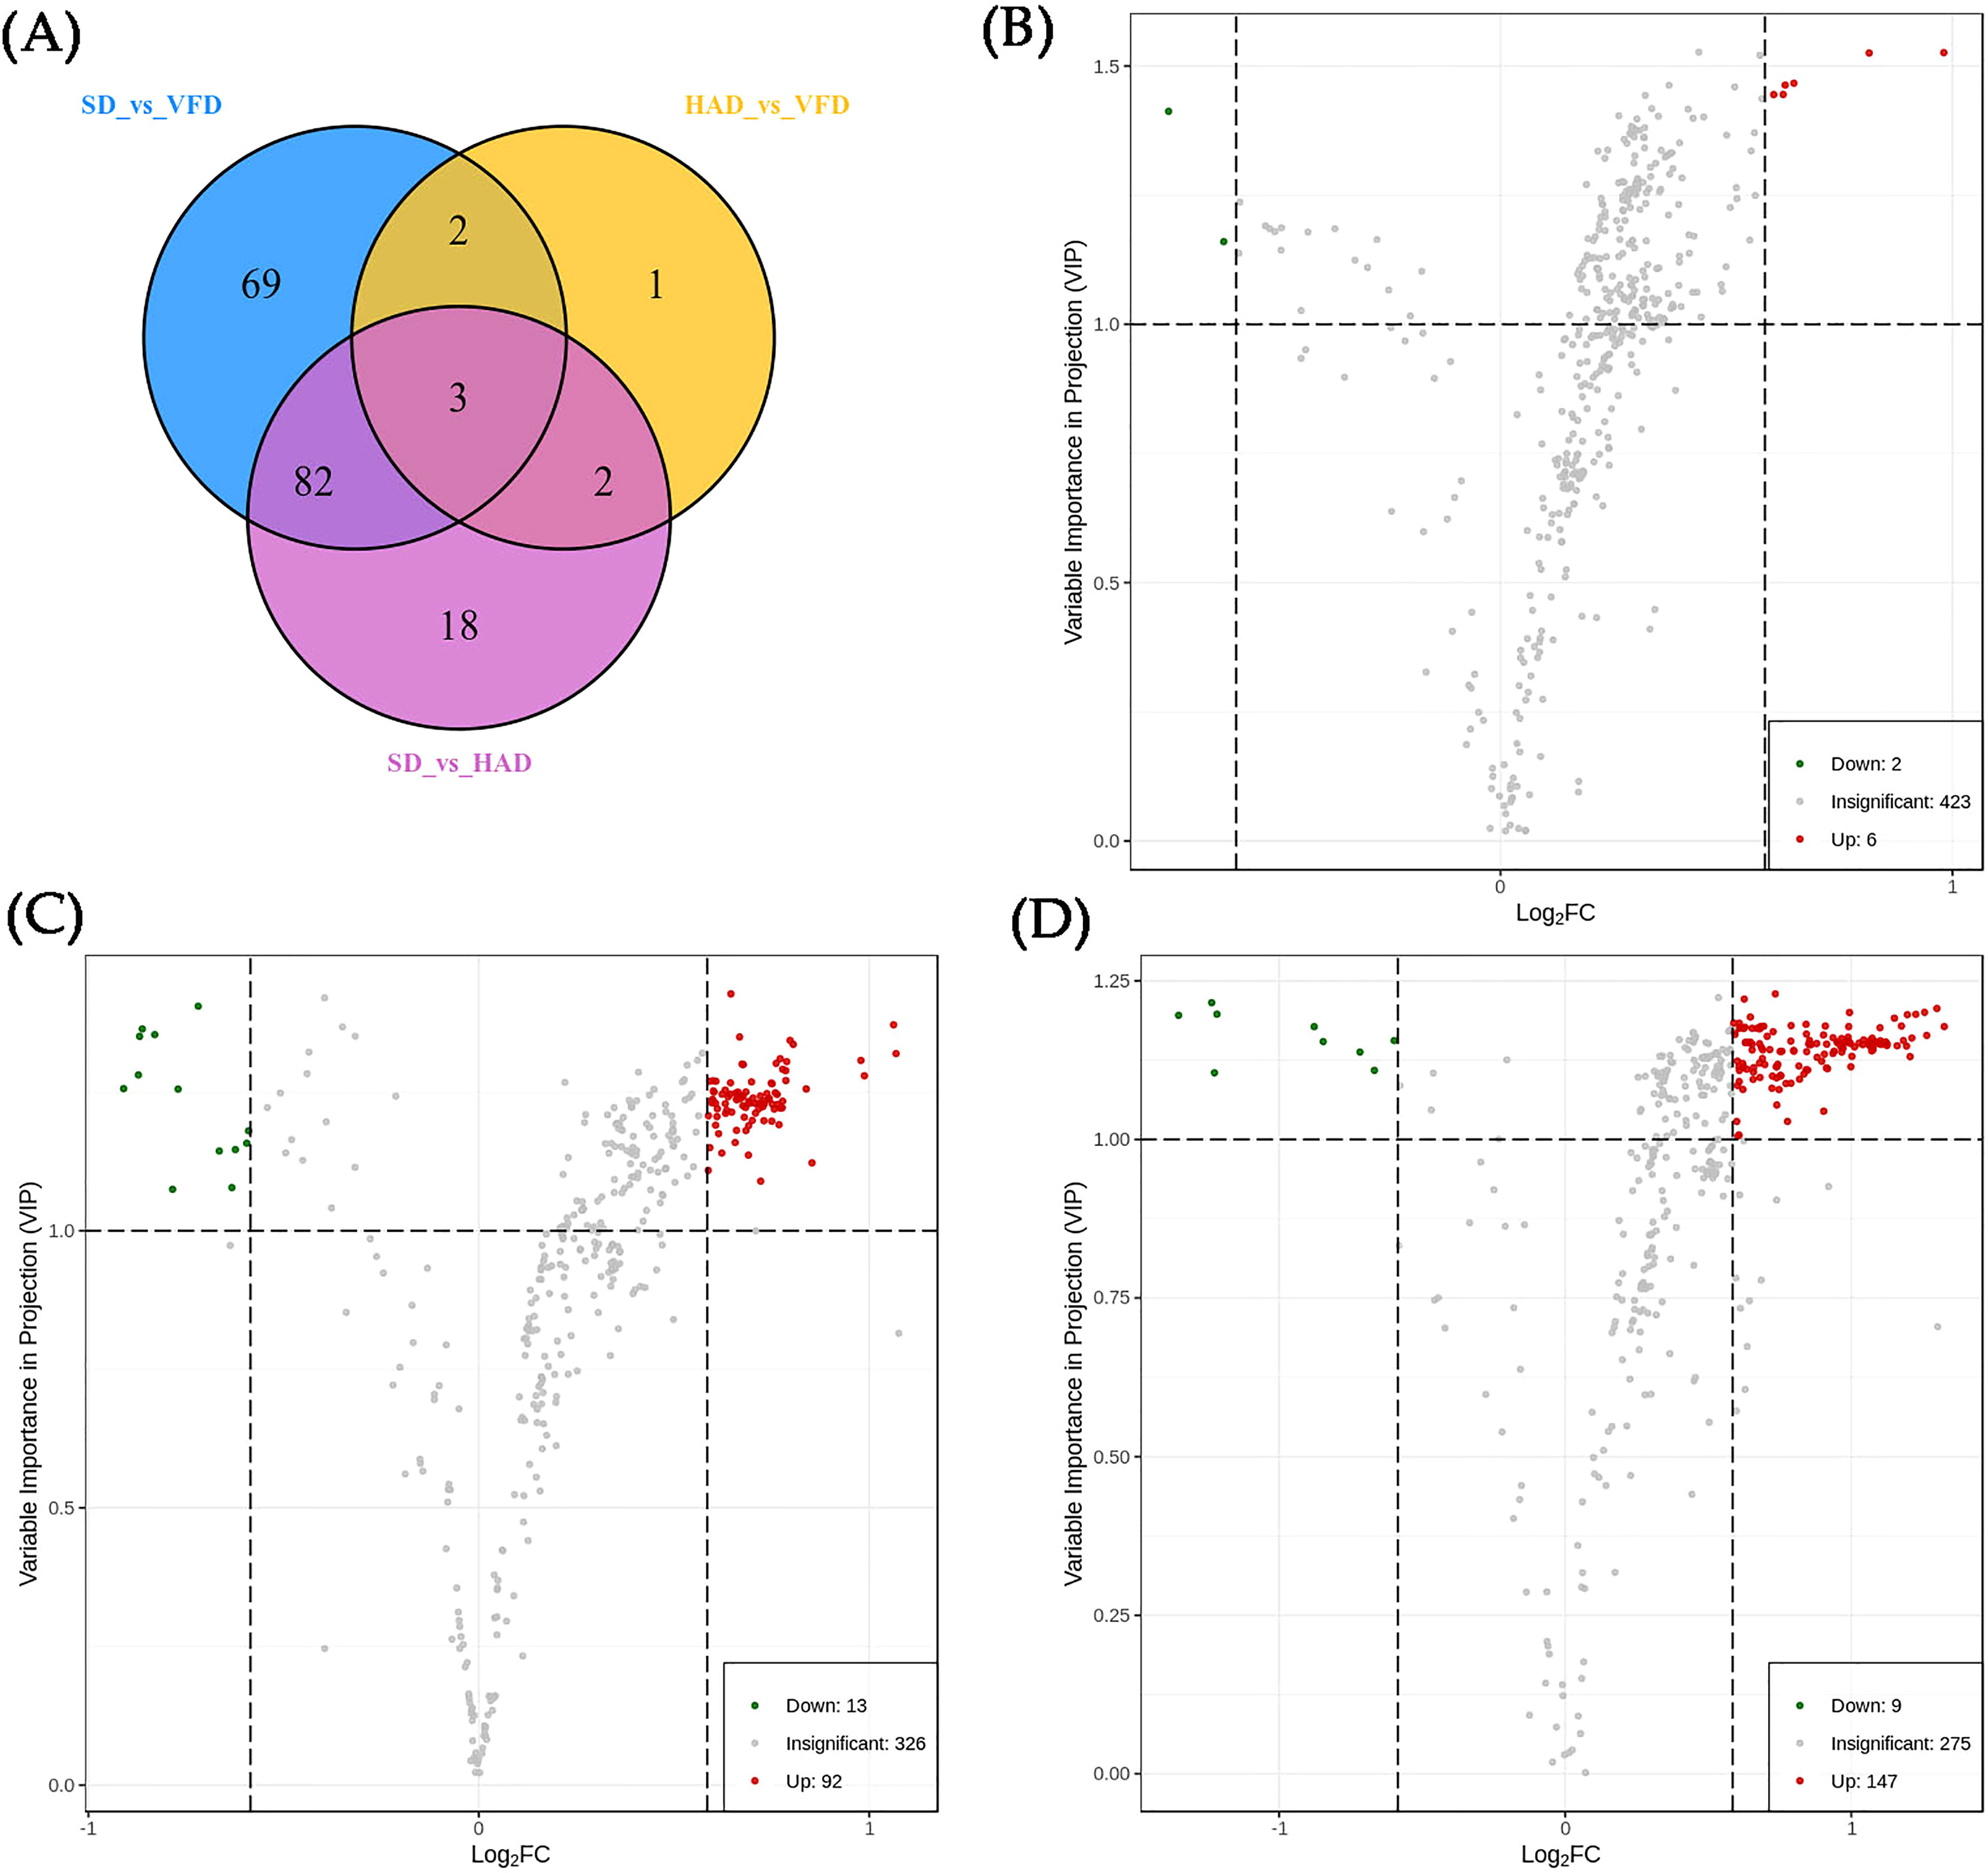
Figure 7 (A) The Venn Diagram of the differential metabolites of each group; (B) Volcanic plots of differential metabolites for HAD vs. VFD; (C) Volcanic plots of differential metabolites for SD vs. HAD; (D) Volcanic plots of differential metabolites for SD vs. VFD.
To investigate the trends of metabolites among different groups, the relative content of all differential metabolites in the comparison groups was normalized by Z-score, and the K-Means cluster analysis was performed as Figure 8. The differential metabolites were divided into six class using K-means clustering analysis. The relative content metabolite of the 5th class was the highest in the SD sample, while the relative metabolite contents of the other five classes were the highest in the VFD sample. These results showed that HS-SPME-GC-MS is suitable for distinguishing and comparing CRCP samples derived using different drying methods. The analysis indicated that the relative content of VOCs in VFD samples was the highest, and the up-regulated differential metabolites were maximum in VFD sample. Overall, these results suggested that vacuum-freeze drying methods can effectively retain the content and type of VOCs in CRCP.
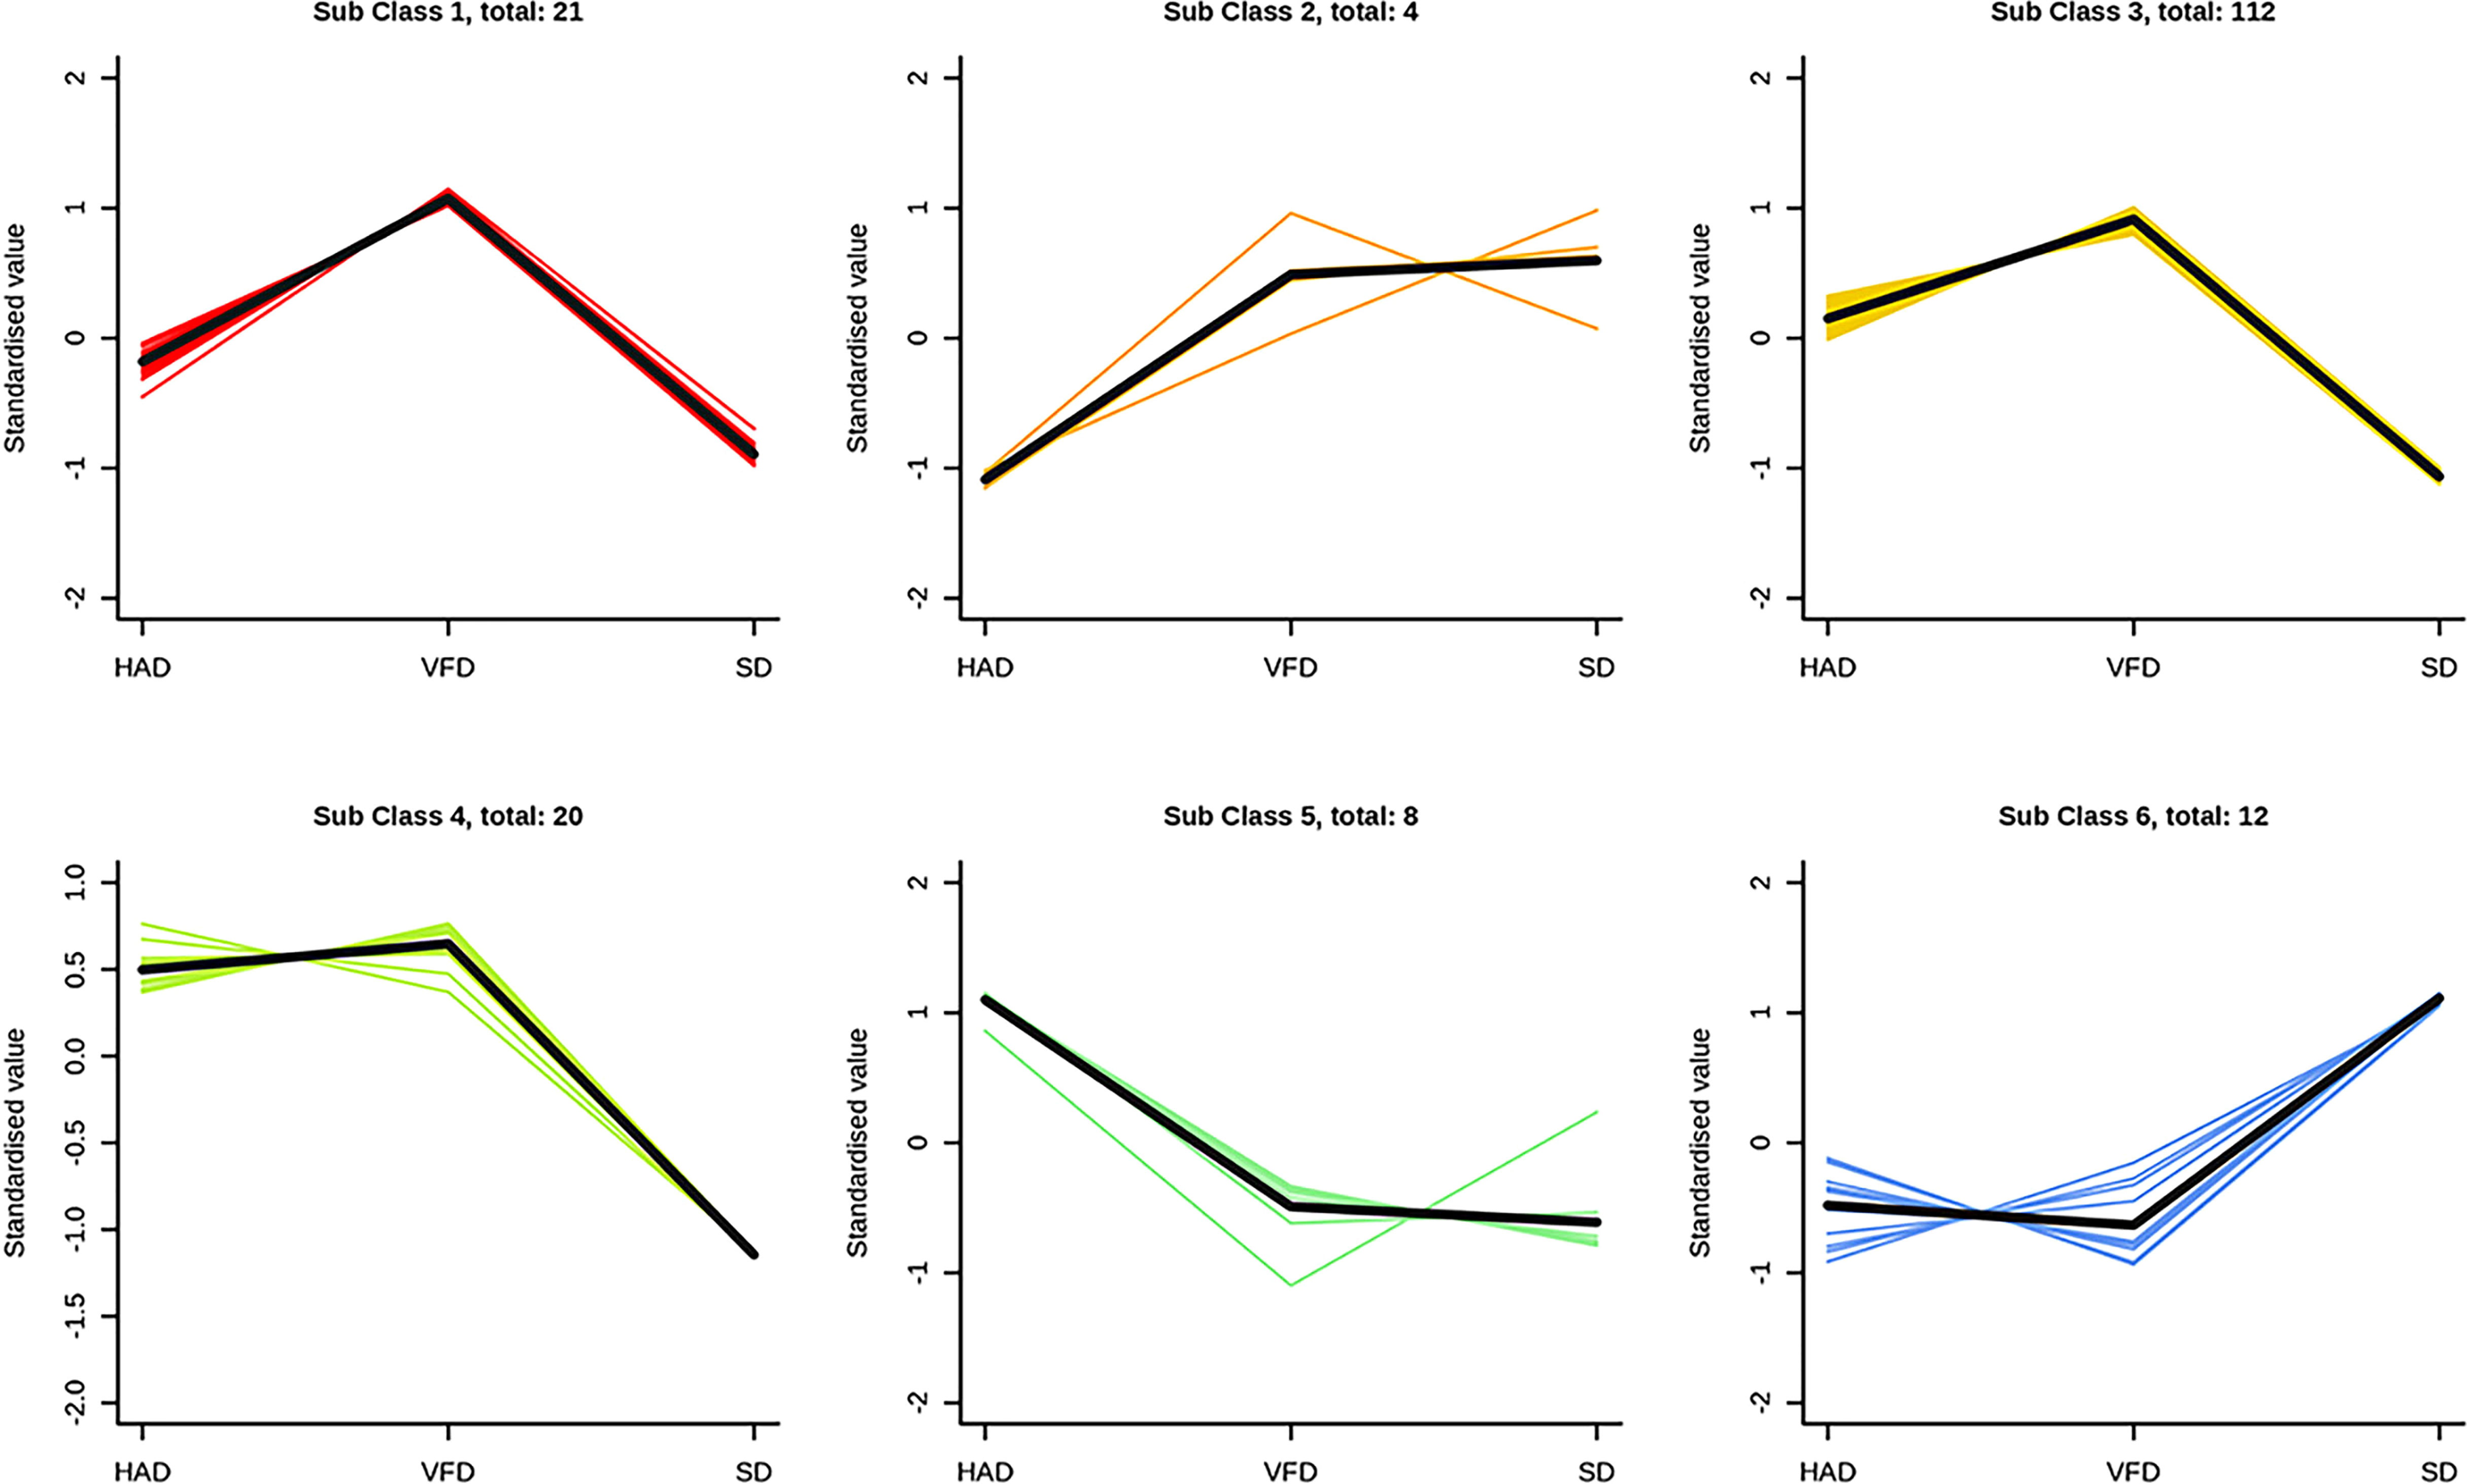
Figure 8 K-Means results of differential metabolites of CRCP with different drying methods. The abscess axis represents the sample name, the ordinate represents the relative content of standardized metabolites. The subclasses represent the number of metabolite classes with a similar trend. The total: *represents the number of metabolites in the class.
Due to its distinctive aroma and flavor, CRCP has been utilized in traditional medicine and as a highly beneficial nutritional food source for centuries (Zhou et al., 2021). In China and around the world, CRCP is widely used in TCM, snacks, functional foods, tea, traditional spices, and condiments (Xiao et al., 2022). The uniqueness and irreplaceability of CRCP primarily depend on its variety, environment, climate, and production technology. A preliminary market survey showed that natural sun-drying is China′s primary drying method for CRCP production. Nevertheless, sun-dried CRCP faces the risk of being prone to moth-eaten and mildewing. Therefore, it is of utmost importance to identify a more efficient drying method for CRCP production to promote the development of the CRCP industry.
In this study, we used E-nose, GC-IMS, and HS-SPME-GC-MS approaches to compare VOCs in CRCP samples generated with different drying methods. About 101 VOCs were detected by GC-IMS in the CRCP samples with three drying methods, while 431 VOCs were detected by HS-SPME-GS-IMS analysis. The main reason for this difference could be that SPME has a strong trapping capacity for high-boiling compounds. Therefore, HS-SPME-GC-MS can detect more high-boiling compounds, and the content of high-boiling compounds is higher (Pu et al., 2019; Pu et al., 2020). In our study, the significant VOCs present in CRCP were terpenes and esters, consistent with the previous report (Duan et al., 2016). A comparison of the VOCs identified using GC-IMS in CRCP samples revealed that the SD contained the maximum types and highest contents of VOCs. However, a comparison by HS-SPME-GC-IMS showed that VFD exhibited the maximum VOCs, and almost all the differential metabolites were up-regulated compared to the other groups. The results of GC-IMS showed that sun-drying is the best drying method, consistent with the drying method used in the traditional production process of CRCP. However, the results of GC-IMS had some limitations, such as the types of compounds detected being incomplete. In the case of “methyl n-methylanthranilate”, a unique compound present in CRCP, as shown in the previous study, was undetected. In addition, 19 of the 101 VOCs detected could not be identified qualitatively. Next, 431 VOCs were detected by HS-SPME-GC-MS in CRCP samples with three drying methods, more than four times the number of GC-IMS. The detected VOCs included their unique volatile compounds as well as several terpenes. The HS-SPME-GC-IMS results indicated that vacuum-freeze drying is the best method for CRCP production.
With the increasing demand for high-quality foods and medicines, it is imperative to identify new herbs with better organic qualities such as texture and color without losing their nutritional or pharmacological properties. The vacuum-freeze drying method can preserve the product′s color, flavor, taste, shape, and nutritional components to the greatest possible extent (Xu et al., 2021). In addition, this process preserves the natural shape of the material without hardening its surface, and prolongs the storage period (Feng et al., 2020). Currently, vacuum-freeze drying has been widely used for various foods (Lu et al., 2022) and herbs (Yu et al., 2022). Currently, there is an excellent demand for CRCP in the market; however, the traditional sun-drying method requires a large area, and a long time, and it is highly susceptible to weather conditions. Therefore, to improve the production efficiency of CRCP, combined with the results of this study and the application of vacuum-freeze drying in the plant drying process, vacuum-freeze drying can be used as the drying method for large-scale drying of CRCP in the future. Vacuum-freeze drying retains more VOCs and maintains better shape and color of the dried CRCP. Moreover, it can avoid the deterioration of CRCP such as moth-eaten and moldy during storage and assure the healthy quality of CRCP. This study would guide the drying and processing of CRCP and promote the development of the CRCP industry.
In the current study, we have compared the VOCs of CRCP samples with different drying methods using E-nose, GC-IMS, and HS-SPME-GC-MS and found that significant differences in the types and contents of VOCs in different CRCP samples. The types and contents of VOCs in CRCP prepared by vacuum-freeze drying were better than those prepared using the other two drying methods. Our study provides new ideas and directions for the drying and processing technology of CRCP production, which might help to shorten the drying time and improve the yield and quality of CRCP. In order to further evaluate the effects of different drying methods on the quality of CRCP, the flavonoids in CRCP with different drying methods can be compared in the future, which will promote the development of CRCP industry based on more comprehensive results.
The original contributions presented in the study are included in the article/Supplementary Material. Further inquiries can be directed to the corresponding authors.
MW, FW and LC designed and coordinated the study. MW, XL, HD and HC collected the samples and performed all of the experiments. YL identified the samples and provided academic support. MW, XL, FW and LC analyzed the data. MW, FW and LC wrote the manuscript with input from all authors. All authors contributed to the article and approved the submitted version.
This research was funded by the National Natural Science Foundation of China (Grant No.82104340).
This research would like to acknowledge Shandong Hanon Scientific Instruments Co., Ltd. (Jinan, China) for kind assistance of technical support of GC-IMS and acknowledge Wuhan Metware Biotechnology Co., Ltd. (Wuhan, China) for kind assistance of technical support of HS-SPME-GC-MS.
The authors declare that the research was conducted in the absence of any commercial or financial relationships that could be construed as a potential conflict of interest.
All claims expressed in this article are solely those of the authors and do not necessarily represent those of their affiliated organizations, or those of the publisher, the editors and the reviewers. Any product that may be evaluated in this article, or claim that may be made by its manufacturer, is not guaranteed or endorsed by the publisher.
The Supplementary Material for this article can be found online at: https://www.frontiersin.org/articles/10.3389/fpls.2023.1169321/full#supplementary-material
Supplementary Figure 1 | Working principle diagram of the E-nose.
Supplementary Figure 2 | Working principle diagram of GC-IMS.
Supplementary Figure 3 | TIC overlapping map of quality control sample (A) and TIC map of mixed sample (B)
Supplementary Figure 4 | Chromatographic integration diagrams of the top ten VOCs with high content in CRCP
Supplementary Table 1 | Volatile flavor compounds in CRCP with different drying methods by HS-SPME-GC-MS.
Supplementary Table 2 | Differential metabolites in each comparison group.
Cao, W., Shu, N., Wen, J., Yang, Y., Jin, Y., Lu, W. (2022). Characterization of the key aroma volatile compounds in nine different grape varieties wine by headspace gas chromatography–ion mobility spectrometry (HS-GC-IMS), odor activity values (OAV) and sensory analysis. Foods 11 (18), 2767. doi: 10.3390/foods11182767
Carrillo-Gómez, J. K., Durán Acevedo, C. M., García-Rico, R. O. (2021). Detection of the bacteria concentration level in pasteurized milk by using two different artificial multisensory methods. Sens. Bio-Sensing Res. 33. doi: 10.1016/j.sbsr.2021.100428
Chen, Y, Zhang, R, Song, Y, He, J, Sun, J, Bai, J, et al. (2009). RRLC-MS/MS-based metabonomics combined with in-depth analysis of metabolic correlation network: finding potential biomarkers for breast cancer. Analyst. 134 (10), 2003–2011. doi: 10.1039/b907243h
Chen, Y., Fu, Y., Li, P., Xi, H., Zhao, W., Wang, D., et al. (2022). Characterization of traditional Chinese sesame oil by using headspace solid-phase Microextraction/Gas chromatography-mass spectrometry, electronic nose, sensory evaluation, and RapidOxy. Foods 11 (22), 3555. doi: 10.3390/foods11223555
Cuevas, F. J., Moreno-Rojas, J. M., Arroyo, F., Daza, A., Ruiz-Moreno, M. J. (2016). Effect of management (organic vs conventional) on volatile profiles of six plum cultivars (Prunus salicina lindl.). a chemometric approach for varietal classification and determination of potential markers. Food Chem. 199, 479–484. doi: 10.1016/j.foodchem.2015.12.049
Ding, Y., Zhou, T., Liao, Y., Lin, H., Deng, S., Zhang, B. (2022). Comparative studies on the physicochemical and volatile flavour properties of traditional deep fried and circulating-air fried hairtail (Trichiurus lepturus). Foods 11 (17), 2710. doi: 10.3390/foods11172710
Duan, L., Guo, L., Dou, L. L., Zhou, C. L., Xu, F. G., Zheng, G. D., et al. (2016). Discrimination of citrus reticulata blanco and citrus reticulata ‘Chachi’ by gas chromatograph-mass spectrometry based metabolomics approach. Food Chem. 212, 123–127. doi: 10.1016/j.foodchem.2016.05.141
Feng, Y., Ping Tan, C., Zhou, C., Yagoub, A. E. A., Xu, B., Sun, Y., et al. (2020). Effect of freeze-thaw cycles pretreatment on the vacuum freeze-drying process and physicochemical properties of the dried garlic slices. Food Chem. 324, 126883. doi: 10.1016/j.foodchem.2020.126883
Feng, X., Wang, H., Wang, Z., Huang, P., Kan, J. (2022). Discrimination and characterization of the volatile organic compounds in eight kinds of huajiao with geographical indication of China using electronic nose, HS-GC-IMS and HS-SPME-GC-MS. Food Chem. 375, 131671. doi: 10.1016/j.foodchem.2021.131671
Fu, M., Xu, Y., Chen, Y., Wu, J., Yu, Y., Zou, B., et al. (2017). Evaluation of bioactive flavonoids and antioxidant activity in pericarpium citri reticulatae (Citrus reticulata ‘Chachi’) during storage. Food Chem. 230, 649–656. doi: 10.1016/j.foodchem.2017.03.098
Gao, G., Zhang, X., Yan, Z., Cheng, Y., Li, H., Xu, G. (2022). Monitoring volatile organic compounds in different pear cultivars during storage using HS-SPME with GC-MS. Foods 11 (23), 3778. doi: 10.3390/foods11233778
Gerhardt, N., Birkenmeier, M., Schwolow, S., Rohn, S., Weller, P. (2018). Volatile-compound fingerprinting by headspace-Gas-Chromatography ion-mobility spectrometry (HS-GC-IMS) as a benchtop alternative to (1)H NMR profiling for assessment of the authenticity of honey. Anal. Chem. 90 (3), 1777–1785. doi: 10.1021/acs.analchem.7b03748
Gerhardt, N., Schwolow, S., Rohn, S., Perez-Cacho, P. R., Galan-Soldevilla, H., Arce, L., et al. (2019). Corrigendum to “Quality assessment of olive oils based on temperature-ramped HS-GC-IMS and sensory evaluation: comparison of different processing approaches by LDA, kNN, and SVM”. Food Chem. 286, 307–308. doi: 10.1016/j.foodchem.2019.01.164
Li, X., Yang, Y., Zhu, Y., Ben, A., Qi, J. (2022). A novel strategy for discriminating different cultivation and screening odor and taste flavor compounds in xinhui tangerine peel using e-nose, e-tongue, and chemometrics. Food Chem. 384, 132519. doi: 10.1016/j.foodchem.2022.132519
Li, S. Z., Zeng, S. L., Wu, Y., Zheng, G. D., Chu, C., Yin, Q., et al. (2019). Cultivar differentiation of citri reticulatae pericarpium by a combination of hierarchical three-step filtering metabolomics analysis, DNA barcoding and electronic nose. Anal. Chim. Acta 1056, 62–69. doi: 10.1016/j.aca.2019.01.004
Liu, G. W., Hu, L., He, H. (2022). Characterization of the volatile compounds of onion with different fresh-cut styles and storage temperatures. Foods 11, 3829. doi: 10.3390/foods11233829
Liu, H., Wen, J., Xu, Y., Wu, J., Yu, Y., Yang, J., et al. (2022). Evaluation of dynamic changes and formation regularity in volatile flavor compounds in citrus reticulata ‘chachi’ peel at different collection periods using gas chromatography-ion mobility spectrometry. Lwt 171. doi: 10.1016/j.lwt.2022.114126
Lu, X., Hou, H., Fang, D., Hu, Q., Chen, J., Zhao, L. (2022). Identification and characterization of volatile compounds in lentinula edodes during vacuum freeze-drying. J. Food Biochem. 46 (6), e13814. doi: 10.1111/jfbc.13814
Luo, Y., Zeng, W., Huang, K. E., Li, D. X., Chen, W., Yu, X. Q., et al. (2019). Discrimination of citrus reticulata blanco and citrus reticulata ‘Chachi’ as well as the citrus reticulata ‘Chachi’ within different storage years using ultra high performance liquid chromatography quadrupole/time-of-flight mass spectrometry based metabolomics approach. J. Pharm. BioMed. Anal. 171, 218–231. doi: 10.1016/j.jpba.2019.03.056
Lv, W., Lin, T., Ren, Z., Jiang, Y., Zhang, J., Bi, F., et al. (2020). Rapid discrimination of citrus reticulata ‘Chachi’ by headspace-gas chromatography-ion mobility spectrometry fingerprints combined with principal component analysis. Food Res. Int. 131, 108985. doi: 10.1016/j.foodres.2020.108985
Matsuo, Y., Miura, L. A., Araki, T., Yoshie-Stark, Y. (2019). Proximate composition and profiles of free amino acids, fatty acids, minerals and aroma compounds in citrus natsudaidai peel. Food Chem. 279, 356–363. doi: 10.1016/j.foodchem.2018.11.146
Mohammadhosseini, M., Venditti, A., Mahdavi, B. (2021). Characterization of essential oils and volatiles from the aerial parts of mentha pulegium l. (Lamiaceae) using microwave-assisted hydrodistillation (MAHD) and headspace solid phase microextraction (HS-SPME) in combination with GC-MS. Natural Prod. Res. 37 (2), 338–342. doi: 10.1080/14786419.2021.1960523
Nekoei, M., Mohammadhosseini, M. (2017). Chemical composition of the essential oils and volatiles ofSalvia leriifoliaby three different extraction methods prior to gas chromatographic-mass spectrometric determination: comparison of HD with SFME and HS-SPME. J. Essential Oil Bearing Plants 20 (2), 410–425. doi: 10.1080/0972060x.2017.1305918
Nekoei, M., Mohammadhosseini, M. (2018). Screening of profiles of essential oils from the aerial parts of sclerorhachis platy-rachis (Boiss.) podlech ex rech.f. using classical and microwave-based methods: comparison with the volatiles using headspace solid-phase microextraction. J. Essential Oil Bearing Plants 21 (5), 1199–1209. doi: 10.1080/0972060x.2018.1467282
Peris, M., Escuder-Gilabert, L. (2009). A 21st century technique for food control: electronic noses. Anal. Chim. Acta 638 (1), 1–15. doi: 10.1016/j.aca.2009.02.009
Pu, D., Duan, W., Huang, Y., Zhang, Y., Sun, B., Ren, F., et al. (2020). Characterization of the key odorants contributing to retronasal olfaction during bread consumption. Food Chem. 318, 126520. doi: 10.1016/j.foodchem.2020.126520
Pu, D., Zhang, H., Zhang, Y., Sun, B., Ren, F., Chen, H., et al. (2019). Characterization of the aroma release and perception of white bread during oral processing by gas chromatography-ion mobility spectrometry and temporal dominance of sensations analysis. Food Res. Int. 123, 612–622. doi: 10.1016/j.foodres.2019.05.016
Qiu, S., Wang, J. (2015). Application of sensory evaluation, HS-SPME GC-MS, e-nose, and e-tongue for quality detection in citrus fruits. J. Food Sci. 80 (10), S2296–S2304. doi: 10.1111/1750-3841.13012
Rodriguez-Maecker, R., Vyhmeister, E., Meisen, S., Rosales Martinez, A., Kuklya, A., Telgheder, U. (2017). Identification of terpenes and essential oils by means of static headspace gas chromatography-ion mobility spectrometry. Anal. Bioanal Chem. 409 (28), 6595–6603. doi: 10.1007/s00216-017-0613-2
Shahriari, M., Zibaee, A., Sahebzadeh, N., Shamakhi, L. (2018). Effects of alpha-pinene, trans-anethole, and thymol as the essential oil constituents on antioxidant system and acetylcholine esterase of ephestia kuehniella zeller (Lepidoptera: pyralidae). Pestic Biochem. Physiol. 150, 40–47. doi: 10.1016/j.pestbp.2018.06.015
Shen, C. Y., Jiang, J. G., Zhu, W., Ou-Yang, Q. (2017). Anti-inflammatory effect of essential oil from citrus aurantium l. var. amara engl. J. Agric. Food Chem. 65 (39), 8586–8594. doi: 10.1021/acs.jafc.7b02586
Shorbagi, M., Fayek, N. M., Shao, P., Farag, M. A. (2022). Citrus reticulata blanco (the common mandarin) fruit: an updated review of its bioactive, extraction types, food quality, therapeutic merits, and bio-waste valorization practices to maximize its economic value. Food Biosci. 47. doi: 10.1016/j.fbio.2022.101699
Su, J., Peng, T., Bai, M., Bai, H., Li, H., Pan, H., et al. (2022). Transcriptome and metabolome analyses provide insights into the flavonoid accumulation in peels of citrus reticulata ‘Chachi’. Molecules 27 (19), 6476. doi: 10.3390/molecules27196476
Sun, P., Xu, B., Wang, Y., Lin, X., Chen, C., Zhu, J., et al. (2022). Characterization of volatile constituents and odorous compounds in peach (Prunus persica l) fruits of different varieties by gas chromatography-ion mobility spectrometry, gas chromatography-mass spectrometry, and relative odor activity value. Front. Nutr. 9. doi: 10.3389/fnut.2022.965796
Tan, H. S., Hu, D. D., Song, J. Z., Xu, Y., Cai, S. F., Chen, Q. L., et al. (2015). Distinguishing radix angelica sinensis from different regions by HS-SFME/GC-MS. Food Chem. 186, 200–206. doi: 10.1016/j.foodchem.2014.05.152
Thevenot, E. A., Roux, A., Xu, Y., Ezan, E., Junot, C. (2015). Analysis of the human adult urinary metabolome variations with age, body mass index, and gender by implementing a comprehensive workflow for univariate and OPLS statistical analyses. J. Proteome Res. 14 (8), 3322–3335. doi: 10.1021/acs.jproteome.5b00354
Tian, X., Li, Z. J., Chao, Y. Z., Wu, Z. Q., Zhou, M. X., Xiao, S. T., et al. (2020). Evaluation by electronic tongue and headspace-GC-IMS analyses of the flavor compounds in dry-cured pork with different salt content. Food Res. Int. 137, 109456. doi: 10.1016/j.foodres.2020.109456
Wang, F., Chen, L., Chen, H., Yan, Z., Liu, Y. (2022b). Discovery of the key active compounds in citri reticulatae pericarpium (Citrus reticulata “Chachi”) and their therapeutic potential for the treatment of COVID-19 based on comparative metabolomics and network pharmacology. Front. Pharmacol. 13. doi: 10.3389/fphar.2022.1048926
Wang, S., Chen, H., Sun, B. (2020). Recent progress in food flavor analysis using gas chromatography-ion mobility spectrometry (GC-IMS). Food Chem. 315, 126158. doi: 10.1016/j.foodchem.2019.126158
Wang, X., Li, G., Shen, W. (2018). Protective effects of d-limonene against transient cerebral ischemia in stroke-prone spontaneously hypertensive rats. Exp. Ther. Med. 15 (1), 699–706. doi: 10.3892/etm.2017.5509
Wang, J., Li, X., Wu, Y., Qu, F., Liu, L., Wang, B., et al. (2022c). HS-SPME/GC-MS reveals the season effects on volatile compounds of green tea in high-latitude region. Foods 11 (19), 3016. doi: 10.3390/foods11193016
Wang, X., Rogers, K. M., Li, Y., Yang, S., Chen, L., Zhou, J. (2019). Untargeted and targeted discrimination of honey collected by apis cerana and apis mellifera based on volatiles using HS-GC-IMS and HS-SPME-GC-MS. J. Agric. Food Chem. 67 (43), 12144–12152. doi: 10.1021/acs.jafc.9b04438
Wang, Z., Wang, J., Chen, X., Li, E., Li, S., Li, C. (2022d). Mutual relations between texture and aroma of cooked rice–a pilot study. Foods 11 (22), 3738. doi: 10.3390/foods11223738
Wang, D., Zhang, J., Zhu, Z., Lei, Y., Huang, S., Huang, M. (2022a). Effect of ageing time on the flavour compounds in nanjing water-boiled salted duck detected by HS-GC-IMS. Lwt 155. doi: 10.1016/j.lwt.2021.112870
Wu, D., Xia, Q., Cheng, H., Zhang, Q., Wang, Y., Ye, X. (2022). Changes of volatile flavor compounds in Sea buckthorn juice during fermentation based on gas chromatography-ion mobility spectrometry. Foods 11 (21), 3471. doi: 10.3390/foods11213471
Xia, J., Guo, Z., Fang, S., Gu, J., Liang, X. (2021). Effect of drying methods on volatile compounds of burdock (Arctium lappa l.) root tea as revealed by gas chromatography mass spectrometry-based metabolomics. Foods 10 (4), 868. doi: 10.3390/foods10040868
Xiao, P. T., Kuang, Y. J., Liu, S. Y., Xie, Z. S., Hao, J. H., Liu, E. H. (2022). The antihyperlipidemic equivalent combinatorial components from peel of citrus reticulata ‘Chachi’. J. Food Drug Anal. 30 (1), 77–87. doi: 10.38212/2224-6614.3388
Xu, M., Wang, J., Zhu, L. (2020). Tea quality evaluation by applying e-nose combined with chemometrics methods. J. Food Sci. Technol. 58 (4), 1549–1561. doi: 10.1007/s13197-020-04667-0
Xu, X., Zhang, L., Feng, Y., Zhou, C., Yagoub, A. E. A., Wahia, H., et al. (2021). Ultrasound freeze-thawing style pretreatment to improve the efficiency of the vacuum freeze-drying of okra (Abelmoschus esculentus (L.) moench) and the quality characteristics of the dried product. Ultrason Sonochem. 70, 105300. doi: 10.1016/j.ultsonch.2020.105300
Yu, D. X., Guo, S., Wang, J. M., Yan, H., Zhang, Z. Y., Yang, J., et al. (2022). Comparison of different drying methods on the volatile components of ginger (Zingiber officinale Roscoe) by HS-GC-MS coupled with fast GC e-nose. Foods 11 (11), 1611. doi: 10.3390/foods11111611
Yu, X., Sun, S., Guo, Y., Liu, Y., Yang, D., Li, G., et al. (2018). Citri reticulatae pericarpium (Chenpi): botany, ethnopharmacology, phytochemistry, and pharmacology of a frequently used traditional Chinese medicine. J. Ethnopharmacol. 220, 265–282. doi: 10.1016/j.jep.2018.03.031
Zhao, Q., Xi, J., Xu, D., Jin, Y., Wu, F., Tong, Q., et al. (2022). A comparative HS-SPME/GC-MS-based metabolomics approach for discriminating selected japonica rice varieties from different regions of China in raw and cooked form. Food Chem. 385, 132701. doi: 10.1016/j.foodchem.2022.132701
Zheng, G., Chao, Y., Liu, M., Yang, Y., Zhang, D., Wang, K., et al. (2021). Evaluation of dynamic changes in the bioactive components in citri reticulatae pericarpium (Citrus reticulata ‘Chachi’) under different harvesting and drying conditions. J. Sci. Food Agric. 101 (8), 3280–3289. doi: 10.1002/jsfa.10957
Zheng, Y., Zeng, X., Peng, W., Wu, Z., Su, W. (2018). Study on the discrimination between citri reticulatae pericarpium varieties based on HS-SPME-GC-MS combined with multivariate statistical analyses. Molecules 23 (5), 1235. doi: 10.3390/molecules23051235
Keywords: Citrus reticulata ‘Chachi’ peel, drying method, E-nose, GC-IMS, HS-SPME-GC-MS, volatile organic compounds
Citation: Wang M, Li X, Ding H, Chen H, Liu Y, Wang F and Chen L (2023) Comparison of the volatile organic compounds in Citrus reticulata ‘Chachi’ peel with different drying methods using E-nose, GC-IMS and HS-SPME-GC-MS. Front. Plant Sci. 14:1169321. doi: 10.3389/fpls.2023.1169321
Received: 19 February 2023; Accepted: 17 April 2023;
Published: 17 May 2023.
Edited by:
Mansour Ghorbanpour, Arak University, IranReviewed by:
Xiao Mei Zhang, Chongqing Academy of Chinese Materia Medica, ChinaCopyright © 2023 Wang, Li, Ding, Chen, Liu, Wang and Chen. This is an open-access article distributed under the terms of the Creative Commons Attribution License (CC BY). The use, distribution or reproduction in other forums is permitted, provided the original author(s) and the copyright owner(s) are credited and that the original publication in this journal is cited, in accordance with accepted academic practice. No use, distribution or reproduction is permitted which does not comply with these terms.
*Correspondence: Fu Wang, d2FuZ2Z1Ym95MjAxOUAxMjYuY29t; Lin Chen, Y2hlbmxpbkBjZHV0Y20uZWR1LmNu
Disclaimer: All claims expressed in this article are solely those of the authors and do not necessarily represent those of their affiliated organizations, or those of the publisher, the editors and the reviewers. Any product that may be evaluated in this article or claim that may be made by its manufacturer is not guaranteed or endorsed by the publisher.
Research integrity at Frontiers
Learn more about the work of our research integrity team to safeguard the quality of each article we publish.