
94% of researchers rate our articles as excellent or good
Learn more about the work of our research integrity team to safeguard the quality of each article we publish.
Find out more
ORIGINAL RESEARCH article
Front. Plant Sci., 12 May 2023
Sec. Plant Abiotic Stress
Volume 14 - 2023 | https://doi.org/10.3389/fpls.2023.1166439
This article is part of the Research TopicPlants for Future Climate: Responses and Adaptations to Combined, Multifactorial, and Sequential StressesView all 8 articles
 S Srinatha Reddy1‡
 Dinesh Kumar Saini2†‡
 G Mahendra Singh1
 Sandeep Sharma1*Vinod Kumar Mishra1*
 Arun Kumar Joshi3,4
Understanding the genetic architecture of drought stress tolerance in bread wheat at seedling and reproductive stages is crucial for developing drought-tolerant varieties. In the present study, 192 diverse wheat genotypes, a subset from the Wheat Associated Mapping Initiative (WAMI) panel, were evaluated at the seedling stage in a hydroponics system for chlorophyll content (CL), shoot length (SLT), shoot weight (SWT), root length (RLT), and root weight (RWT) under both drought and optimum conditions. Following that, a genome-wide association study (GWAS) was carried out using the phenotypic data recorded during the hydroponics experiment as well as data available from previously conducted multi-location field trials under optimal and drought stress conditions. The panel had previously been genotyped using the Infinium iSelect 90K SNP array with 26,814 polymorphic markers. Using single as well as multi-locus models, GWAS identified 94 significant marker-trait associations (MTAs) or SNPs associated with traits recorded at the seedling stage and 451 for traits recorded at the reproductive stage. The significant SNPs included several novel, significant, and promising MTAs for different traits. The average LD decay distance for the whole genome was approximately 0.48 Mbp, ranging from 0.07 Mbp (chromosome 6D) to 4.14 Mbp (chromosome 2A). Furthermore, several promising SNPs revealed significant differences among haplotypes for traits such as RLT, RWT, SLT, SWT, and GY under drought stress. Functional annotation and in silico expression analysis revealed important putative candidate genes underlying the identified stable genomic regions such as protein kinases, O-methyltransferases, GroES-like superfamily proteins, NAD-dependent dehydratases, etc. The findings of the present study may be useful for improving yield potential, and stability under drought stress conditions.
Drought stress is defined as a lack of water that causes dramatic morphological, physiological, biochemical, and molecular changes in plants (Sallam et al., 2019) that restrict plant growth, development, and production. The global warming and climate change are expected to increase the frequency of droughts, resulting in reduced crop production (Sallam et al., 2019). Wheat (Triticum aestivum L.) is an important staple food crop that supplies more protein (approximately 23%) than all animal sources and accounts for more than 20% of human calorific intake (http://www.fao.org/faostat/en/#data/QC; Pal et al., 2022). In the past 50 years, global wheat production increased from 343 million tonnes in 1972 to 770 million tonnes in 2021 (https://knoema.com/atlas/World/topics/Agriculture/Crops-Production-Quantity-tonnes/Wheat-production). During the previous century, there was annual progress of 0.3% to 1.0% in the genetic improvement of wheat’s grain yield (Graybosch and Peterson, 2010; Pal et al., 2022). Nevertheless, it has decreased recently, largely as a result of the limited genetic diversity in the breeding populations, climate change associated abiotic and biotic stresses (Tanin et al., 2022), and lack of novel breeding techniques in many programs. Notably, with the unusual constraints posed by climate change, there is a need to increase wheat yield to feed the growing human population.
Wheat crop is sensitive to heat and drought stresses (Li et al., 2011), particularly during the flowering and grain development stages and both yield and grain quality gets impacted (Sallam et al., 2018). According to an estimate, drought and heat stress accounted for 40% of annual production variability in major wheat producing countries (Zampieri et al., 2017). Several studies have demonstrated drought to be a potential threat to wheat production in a populous country like India (Joshi et al., 2007), South Asia and other similar global ecologies (Singh et al., 2007). Wheat demand is expected to increase by 60% by 2050, but production may decrease by 29% due to climate change-induced environmental stresses (Manickavelu et al., 2012; Kulkarni et al., 2017). These forecasts suggest that understanding wheat adaptation to drought and developing drought-tolerant varieties is crucial for maintaining and increasing global wheat production.
Under drought stress, wheat plants have a restricted ability to absorb nutrients and have low photosynthetic efficiency (Praba et al., 2009). It can also decrease organ size (leaf, spikes, etc.) and growth period of various developmental stages (tillering, booting, heading, anthesis, grain filling, maturity, etc.) (Hossain and Teixeira, 2013; Ihsan et al., 2016). Sensitivity of wheat to drought stress results in interrupted metabolic processes and a shorter life cycle which ultimately reduces plant biomass and grain yield (Itam et al., 2020). Drought tolerance is a complex quantitative trait governed by many genes, some of which have minor effects while others have major effects (Kumar et al., 2012). Further, it has low heritability owing to its polygenic inheritance and significant genotype by environment interaction (Sukumaran et al., 2018; El Gataa et al., 2022; Rabieyan et al., 2022). Drought tolerance can be improved genetically by identifying sources of stress-tolerant traits and/or genotypes, and introgressing and mobilizing the genomic regions controlling these traits into locally adapted cultivars (Shelake et al., 2022). The difficulty in utilizing this approach in breeding programs is the absence of proper knowledge about the most relevant traits for different stress scenarios and their detection in a quick, efficient and cost-effective manner. Our knowledge of the genetic underpinnings and molecular basis of complex traits like drought tolerance has increased as a result of recent developments in high-throughput genotyping (Saini et al., 2022) and phenotyping techniques (Gill T. et al., 2022; Xiao et al., 2022).
Bi-parental mapping is an efficient method for dissecting the genetic architecture of different complex traits in wheat (Singh et al., 2022; http://www.wheatqtldb.net/). However, it generally produces low-resolution maps and mostly uses few polymorphic markers with less genome coverage, which results in a non-significant association of the identified markers with the target traits, creating ambiguity in selecting for marker assisted selection programs. As a result, current genomic mapping attempts are shifting from conventional bi-parental mapping to linkage disequilibrium (LD) based mapping including GWAS which offers two unique advantages- (i) it eliminates the costs and time associated with population development, and (ii) it effectively utilizes the numerous historical crossover events that occurred in the diverse association panel used, and as a result, provides high mapping resolution (Saini et al., 2022; Xiao et al., 2022).
Several earlier GWAS studies have detected the genomic regions associated with traits contributing to drought stress tolerance in wheat either at seedling (e.g., Maulana et al., 2020; Danakumara et al., 2021; Sallam et al., 2022) or at reproductive stage (e.g., Gataa et al., 2021; El Gataa et al., 2022), however, only a few studies identified genomic regions for traits recorded on both seedlings and reproductive stages (e.g., Rufo et al., 2020). The establishment of seedlings is believed to have significant effects on crop stand and therefore crop yield. It has been suggested that early vegetative stages, such as the seedling stage of wheat, have greater stress avoidance and resilience (Sallam et al., 2018). Early generation screening and selection using hydroponics was found successful because it is feasible and practical to perform mass phenotyping and high-throughput characterization of shoot and root related traits during the seedling stage (Ayalew et al., 2015; Islam et al., 2015). These findings necessitated further research into the relationship between drought tolerance performances at various stages of wheat development. Further, as mentioned above, there is a paucity of information on the common genetic determinants conferring tolerance to drought at both seedlings and reproductive stages. Given this, the current study aimed to identify and compare significant genomic regions that were responsible for drought tolerance at the seedling and adult plant stages, which could be used in wheat breeding to increase resilience to drought stress.
The objective of the study was to identify the significant marker-trait associations (MTAs) for drought tolerance at seedling (in hydroponics: PEG 8000 induced drought) and at the reproductive stage (in field conditions) and to find important haplotypes associated with drought stress tolerance at the both developmental stages. GWAS was performed for different seedling traits, including chlorophyll content (CL), shoot length (SLT), root length (RLT), shoot weight (SWT) and root weight (RWT) and several adult plant traits, such as days to heading (DTH), days to maturity (DTM), plant height (PHT), thousand kernel weight (TKW), grain yield (GY), normalized difference vegetative indices at heading (NDVIH), grain filling (NDVIGF), and maturity (NDVIM) stages, and canopy temperature depression at heading (CTDH), grain filling (CTDGF) and maturity (CTDM) stages recorded under both optimum and drought stress conditions.
We evaluated 294 diverse wheat genotypes, a subset from the Wheat Associated Mapping Initiative (WAMI) Panel under field conditions. This WAMI panel was obtained from CIMMYT international nurseries, which are distributed globally each year (Lopes et al., 2015). The genotypes with similar heading dates (within one week) were screened and a subset of 192 genotypes was chosen for the subsequent experiments. The experiment was carried out under hydroponics conditions to assess the responses of genotypes to drought stress at seedling stage.
The genotypes were evaluated in a controlled hydroponic system at the Department of Genetics and Plant Breeding, Institute of Agricultural Sciences, Banaras Hindu University, Varanasi, during the year 2020-21. The plants were grown in half-strength Hoagland solution and the experiment was set up in a completely randomized design (Hoagland and Arnon, 1950) (DC and DI, 1950) (Hoagland and Arnon, 1950). Hoagland solution is a hydroponic nutrient solution and one of the best nutrient compounds for plant growth. Hoagland solution contains all of the nutrients required for plant growth and is appropriate for the growth of many different plant species. Seeds were initially sterilized with sodium hypo chloride solution (1% for 5 min) and rinsed with distilled water for times. The overnight soaked seeds were placed in a petri plate lined with Whatman filter paper. Petri plates were watered for three consecutive days to promote seed germination. The germinated seeds were then put in sterile polystyrene tubes fitted with thermacol and holes, floated on three litres of half strength Hoagland solution, and placed in rectangular plastic trays with a four-litre capacity. The light intensity of 250µmolm-2s-1 with 10/14hrs dark and light duration was maintained using fluorescent tubes (Ayalew et al., 2015). Drought treatment was imposed on 14 days old seedlings by dissolving 20% PEG-8000 (Poly Ethylene Glycol) in Hoagland solution. The treatment was extended for seven days and then replaced with only Hoagland solution, with readings taken after three days of stress recovery. While under control conditions, seedlings were grown by replacing the growing solution with only fresh Hoagland solution every week for 24 days. The data was recorded on CL (using SPAD-502Plus, Konica Minolta, Inc. made in Japan), SLT, RLT, SWT and RWT under both control and stress conditions.
The data available on different morpho-physiological traits recorded during field trials conducted at three locations in India (Varanasi, Pune, and Jabalpur) during the cropping season 2021-22 was also considered for the current study. These morpho-physiological traits included the following: DTH, DTM, PHT, TKW, GY, NDVIH, NDVIGF, NDVIM, CTDH, CTDGF and CTDM (the details on observations recorded and the phenotypic data for the field experiments are provided in one of our earlier study (Reddy et al., 2023).
Following the testing of the data for normal distribution, the analysis of variance (ANOVA) was performed. All descriptive statistics were calculated using Microsoft Excel 2016, and ANOVAs were performed using Genstat 18th edition (32 bit). Further, stress indices were estimated for all the traits at the seedling stage. Stress indices and correlation was calculated using OriginPro 2022 (https://www.originlab.com/). Details on different stress indices calculated are provided in Table 1.
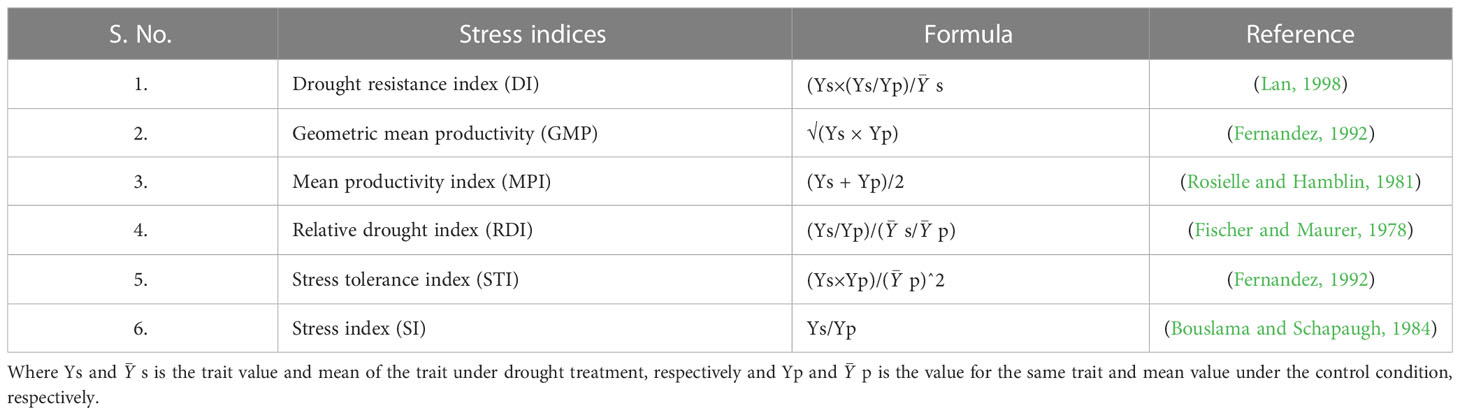
Table 1 Details on different stress indices.
The WAMI panel was previously genotyped using a high-density illumina 90K infinium SNP array which led to the identification of a total of 26,814 polymorphic SNPs. The missing data points in the genotypic data file were imputed using LD-KNN imputation algorithm available in TASSEL. Only 20,713 SNPs were considered for the analysis out of the 26,814 SNPs that had physical positions available from the Wheat URGI database (https://wheat-urgi.versailles.inra.fr/) based on IWGSC ref seq v1.1.
Principal component analysis (PCA) of the imputed genotypic data was then performed in R to examine population structure using the Genomic Association and Prediction Integrated Tool (GAPIT) version 3.0 (Wang and Zhang, 2021). Population structure was also analyzed using STRUCTURE version 2.3.4, a bayesian model-based clustering program that assumes an admixture model (Pritchard et al., 2000) and utilized ten subgroups (K = 1-10), each with five independent runs, with a burn-in period of 10,000 iterations followed by 10,000 Monte-Carlo iterations. To infer the most likely number of subpopulations, an ad hoc statistic (DeltaK) was used, which utilized the rate of alterations in the log probability between runs utilizing successive K-values (Evanno et al., 2005) with STRUCTURE HARVESTER (Earl and Bridgett, 2012). Then, GWAS analysis was performed using the 20,713 high-quality physically anchored SNPs and BLUE (best linear unbiased estimates) values estimated using the data available from three individual environments (Varanasi, Jabalpur, and Pune) for all the traits (recorded under both optimum and drought stress conditions). The BLUE values were computed utilizing META-R which uses LME4 R-package for linear mixed model analysis (Bates et al., 2015).
LD analysis was performed using TASSEL v5.0 software for the whole genome and individual chromosomes by estimating r2 values for all pairwise marker comparisons with a sliding window size of 50 SNPs. The LD decay over genetic distance was calculated by fitting a nonlinear model with the modified Hill and Weir approach (Hill and Weir, 1988), with the r2 threshold set at 0.2 and r2 equalling half the decay distance. Using R, the LD decay distance for each chromosome and the whole genome was shown (R Core Team, 2013).
For GWAS analysis of each trait, two methods were used: Single locus mixed linear model and multi-locus mixed model. The mixed linear model (MLM) was used in the single-locus method to account for population stratification (K-PC model) (Yu et al., 2006), whereas the multi-locus mixed model employed the Bayesian-information and Linkage-disequilibrium Iteratively Nested Keyway (BLINK) and Fixed and random model Circulating Probability Unification (FarmCPU) methods.
All three models (viz., MLM, BLINK, and FarmCPU) were implemented in the R environment using the GAPIT version 3.0 (with default parameters) and involved the first two PCs to compensate for population structure, as determined by evaluation of the scree plot and the DeltaK statistic obtained from STRUCTURE analysis (Wang and Zhang, 2021). The Bonferroni-corrected threshold of P<0.1 was calculated as -log10(P) = 5.61, but it turns out that this threshold is too strict because it takes into account all SNPs in the dataset instead of independent tests. Therefore, for the present study, we employed an exploratory threshold [-log10(P) = 3.00] based on independent tests to consider any SNP as significant in individual environments, as reported in some previous studies (Halder et al., 2019; Pang et al., 2020). Nonetheless, only those MTAs that exceeded this threshold and were detected for the same trait in at least two locations were reported as stable MTAs and those controlling at least two different traits were termed as pleiotropic MTAs.
Alleles of some significant SNPs identified post-GWAS analysis were utilized to evaluate their effects on the traits of interest. For each selected stable MTA, trait values for two groups of alleles (favourable versus unfavourable) were analyzed and visualized using a R package ‘ggstatsplot’ (Patil, 2021) which utilizes its in built parameters to test the statistical significance of the effect sizes. In addition, some significant and stable SNPs for selected traits were utilized for haplotype analysis. Haploview version 4.2. software (Barrett et al., 2005) was used to generate and display the LD-based haplotypes for a few selected regions. The wheat genotypes from the WAMI panel were grouped based on detected haplotypes, and trait data for each haplotype was subjected to analysis using the same R package ‘ggstatsplot’ (Patil, 2021).
The gene models available in the overlapping region and/or within 1 Mb upstream and downstream of some of the selected stable MTAs were extracted using BioMart tool of EnsemblPlants database (http://plants.ensembl.org/index.html; Bolser et al., 2017). Based on the domains in the corresponding protein sequences, which were obtained using the InterPro database (https://www.ebi.ac.uk/interpro/; Hunter et al., 2009), functional annotations of the genes were performed.
In silico gene expression analysis was performed utilizing expVIP-powered wheat expression browser (http://www.wheat-expression.com; Ramírez-González et al., 2018). For this purpose, the appropriate expression datasets containing expression data related to drought stress were utilized (Liu et al., 2015; http://www.wheat-expression.com). The first RNA-seq dataset consisted of data on differential gene expression in a drought and heat-tolerant wheat cv. TAM107 was grown under drought and drought + heat stress conditions, with leaf samples collected separately at 1 and 6 hours after treatments (Liu et al., 2015). Expression data from the plants grown in normal growth conditions were used as the control (Liu et al., 2015). Another RNA-seq dataset (available at http://www.wheat-expression.com) consisted of differential expression of genes available from the plants treated with PEG, with leaf samples collected separately at 2 and 12 h after treatment.
The IDs of different genes available from the significant genomic regions associated with the target traits were uploaded as input to the expVIP-powered wheat expression browser and relevant datasets (as discussed above) were chosen for the expression analysis. Following analysis, expression data for each gene recorded under stress and control conditions [available as TPM (transcripts per million) values] were downloaded and further used to calculate the fold change in gene expression by dividing the TPM values obtained under drought stress by the TPM values obtained under control conditions. Only genes with a fold change (FC ≥ 2 or FC ≤− 2) compared to the control were considered differentially expressed. ClustVis (https://biit.cs.ut.ee/clustvis/; Metsalu and Vilo, 2015) was used to create heat maps of the expression patterns of the genes. The role of the identified genes in the regulation of different drought stress responsive traits was also ascertained using the published literature.
Analysis of variance (ANOVA) reported highly significant differences among the wheat genotypes for all the studied seedling traits under drought stress (Table 2). The percent decline under drought was maximum for SW (54.7%) followed by RW (46.7%), RL (45.6%), SL (33.3%) and CHL (20.4%) (Table 3 and Supplementary Figure 1). Heritability values for different traits ranged from 0.5 (CL(C)) to 0.73(RLT(C)) under hydroponics (Table 3).
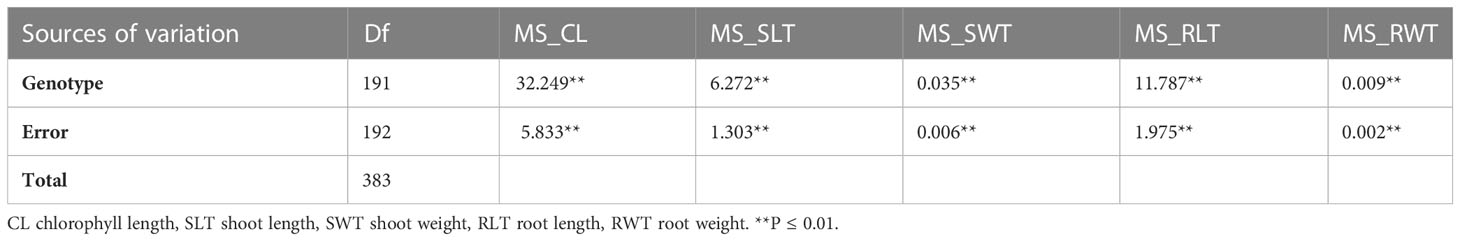
Table 2 ANOVA for the seedling traits recorded under water stress conditions in hydroponics experiment.
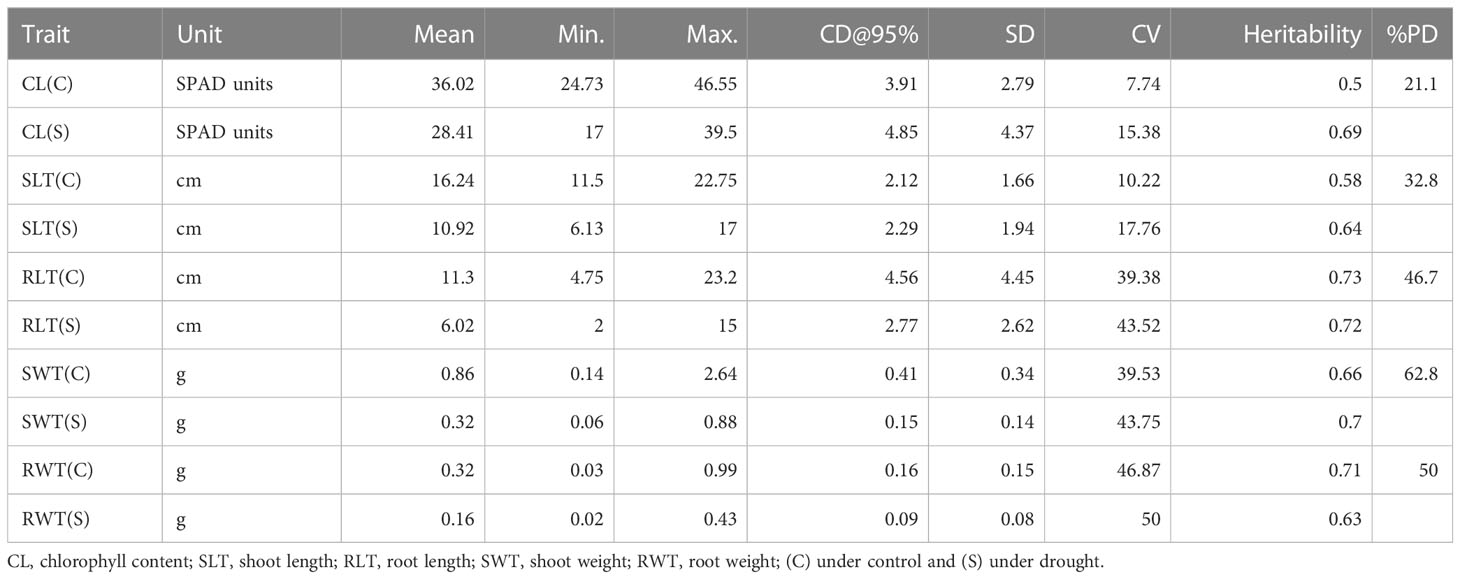
Table 3 Descriptive statistics and broad-sense heritability estimates for seedling traits (hydroponic experiment).
Different patterns of correlation were observed between the traits (recorded under drought stress and control conditions) and stress indices. For instance, chlorophyll SPAD readings(CL) recorded under water stress showed positive and significant correlations with all stress indices, including DI (r2 = 0.96), GMP (r2 = 0.90), MPI (r2 = 0.85), RDI (r2 = 0.83), STI (r2 = 0.90), and YSI (r2 = 0.83), whereas it showed positive correlations with some indices, including DI (r2 = 0.02), GMP (r2 = 0.64), MPI (r2 = 0.72), and STI (r2 = 0.64), and negative correlations with others such as RDI (r2=-0.31), YSI (r2=-0.31)] under control conditions (Figures 1A–E). Furthermore, these stress indices having a high significant correlation for all the studied traits under water stress aided in the categorization of genotypes as drought-tolerant or susceptible. The details on drought-tolerant and susceptible genotypes are presented in the Supplementary Table 1.
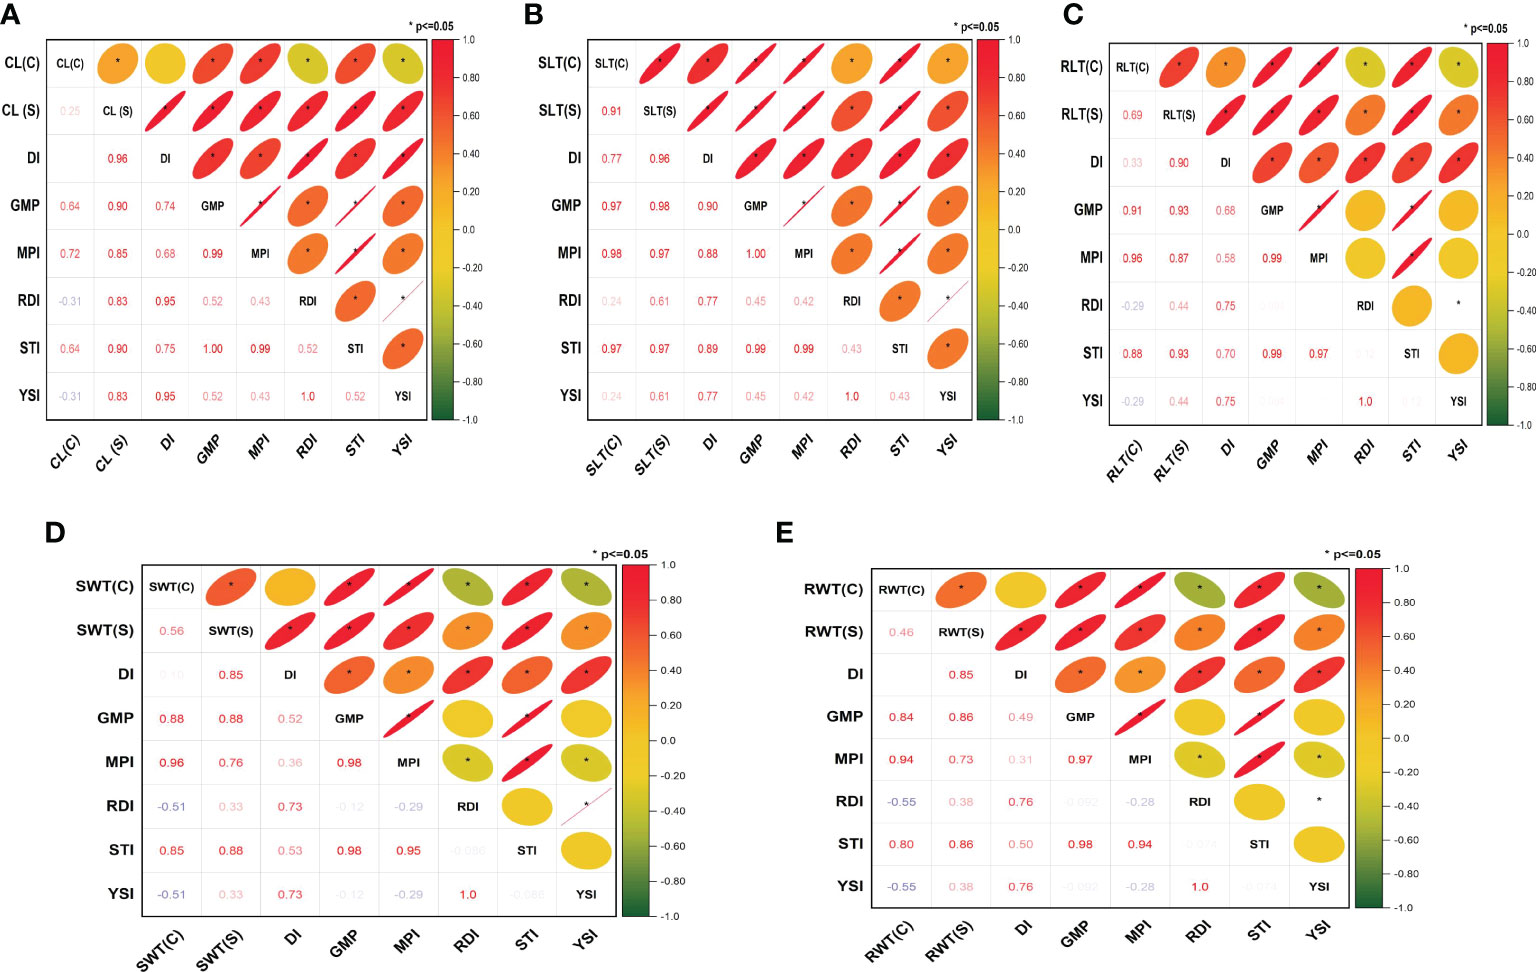
Figure 1 Correlation between stress indices for different traits phenotyped under hydroponics conditions: (A) chlorophyll SPAD readings (CL), (B) shoot length (SLT), (C) root length (RLT), (D) shoot weight (SWT) and (E) root weight (RWT). C, control; S, stress; DI, drought tolerance index; GMP, geometric mean productivity; MPI, mean productivity index; RDI, relative drought index; STI, stress tolerance index; and YSI, yield stability index. *P ≤ 0.05.
Under both hydroponic and field (BHU, Varanasi) conditions, six genotypes were found to be drought-tolerant, while three were reported to be drought susceptible. In contrast, five genotypes were found to be tolerant under hydroponic conditions but susceptible in the field, while six genotypes were susceptible under hydroponic conditions but tolerant in the field (BHU, Varanasi) (Supplementary Figure 2A). Similarly, eight genotypes were found to be drought-tolerant, while two appeared drought susceptible under both hydroponic and field conditions (ARI, Pune). Six genotypes were found to be tolerant under hydroponic conditions but susceptible under ARI, Pune field conditions. Likewise, five were susceptible under hydroponic conditions but tolerant under field conditions (ARI, Pune) (Supplementary Figure 2B). Under both hydroponic and field conditions, seven genotypes were found to be tolerant, while three genotypes were susceptible (BISA, Jabalpur). Three genotypes were found to be tolerant under hydroponic conditions but susceptible in the BISA, Jabalpur field, while seven genotypes were susceptible under hydroponic conditions but tolerant in the field (BISA, Jabalpur) (Supplementary Figure 2C).
Interestingly, four genotypes were found to be tolerant in hydroponic as well as all three field experiments. However, no genotype demonstrated consistent susceptibility to drought in hydroponic and the three field experiments. In contrast, two genotypes were found to be tolerant under hydroponic conditions but susceptible under all three field conditions, and four genotypes were susceptible under hydroponic conditions but tolerant under all three field conditions (Supplementary Figure 2D).
Among 20,713 high-quality physically anchored SNPs, the A and B sub-genomes had six times the number of SNPs as the D sub-genome, with the B sub-genome having the most (10,120; 48.85%) and the D sub-genome having the fewest (2,736; 13.2%). The highest number of SNPs (1,841) were found on chromosome 5B, and the lowest number were found on chromosome 4D (149 SNPs) (Figure 2). Principal component analysis revealed significant genotype admixture, with the first two principal components accounting for most of the variance. The DeltaK statistic from the STRUCTURE analysis revealed a single peak at K = 2, indicating the presence of two subgroups in the panel (Figure 3A). The LD decay distance for individual chromosomes varied from 0.07 Mb (6D) to 4.14 Mb (2A). Whereas, for the whole genome, the average LD decay distance was around 0.48 Mbp (Figure 3B).
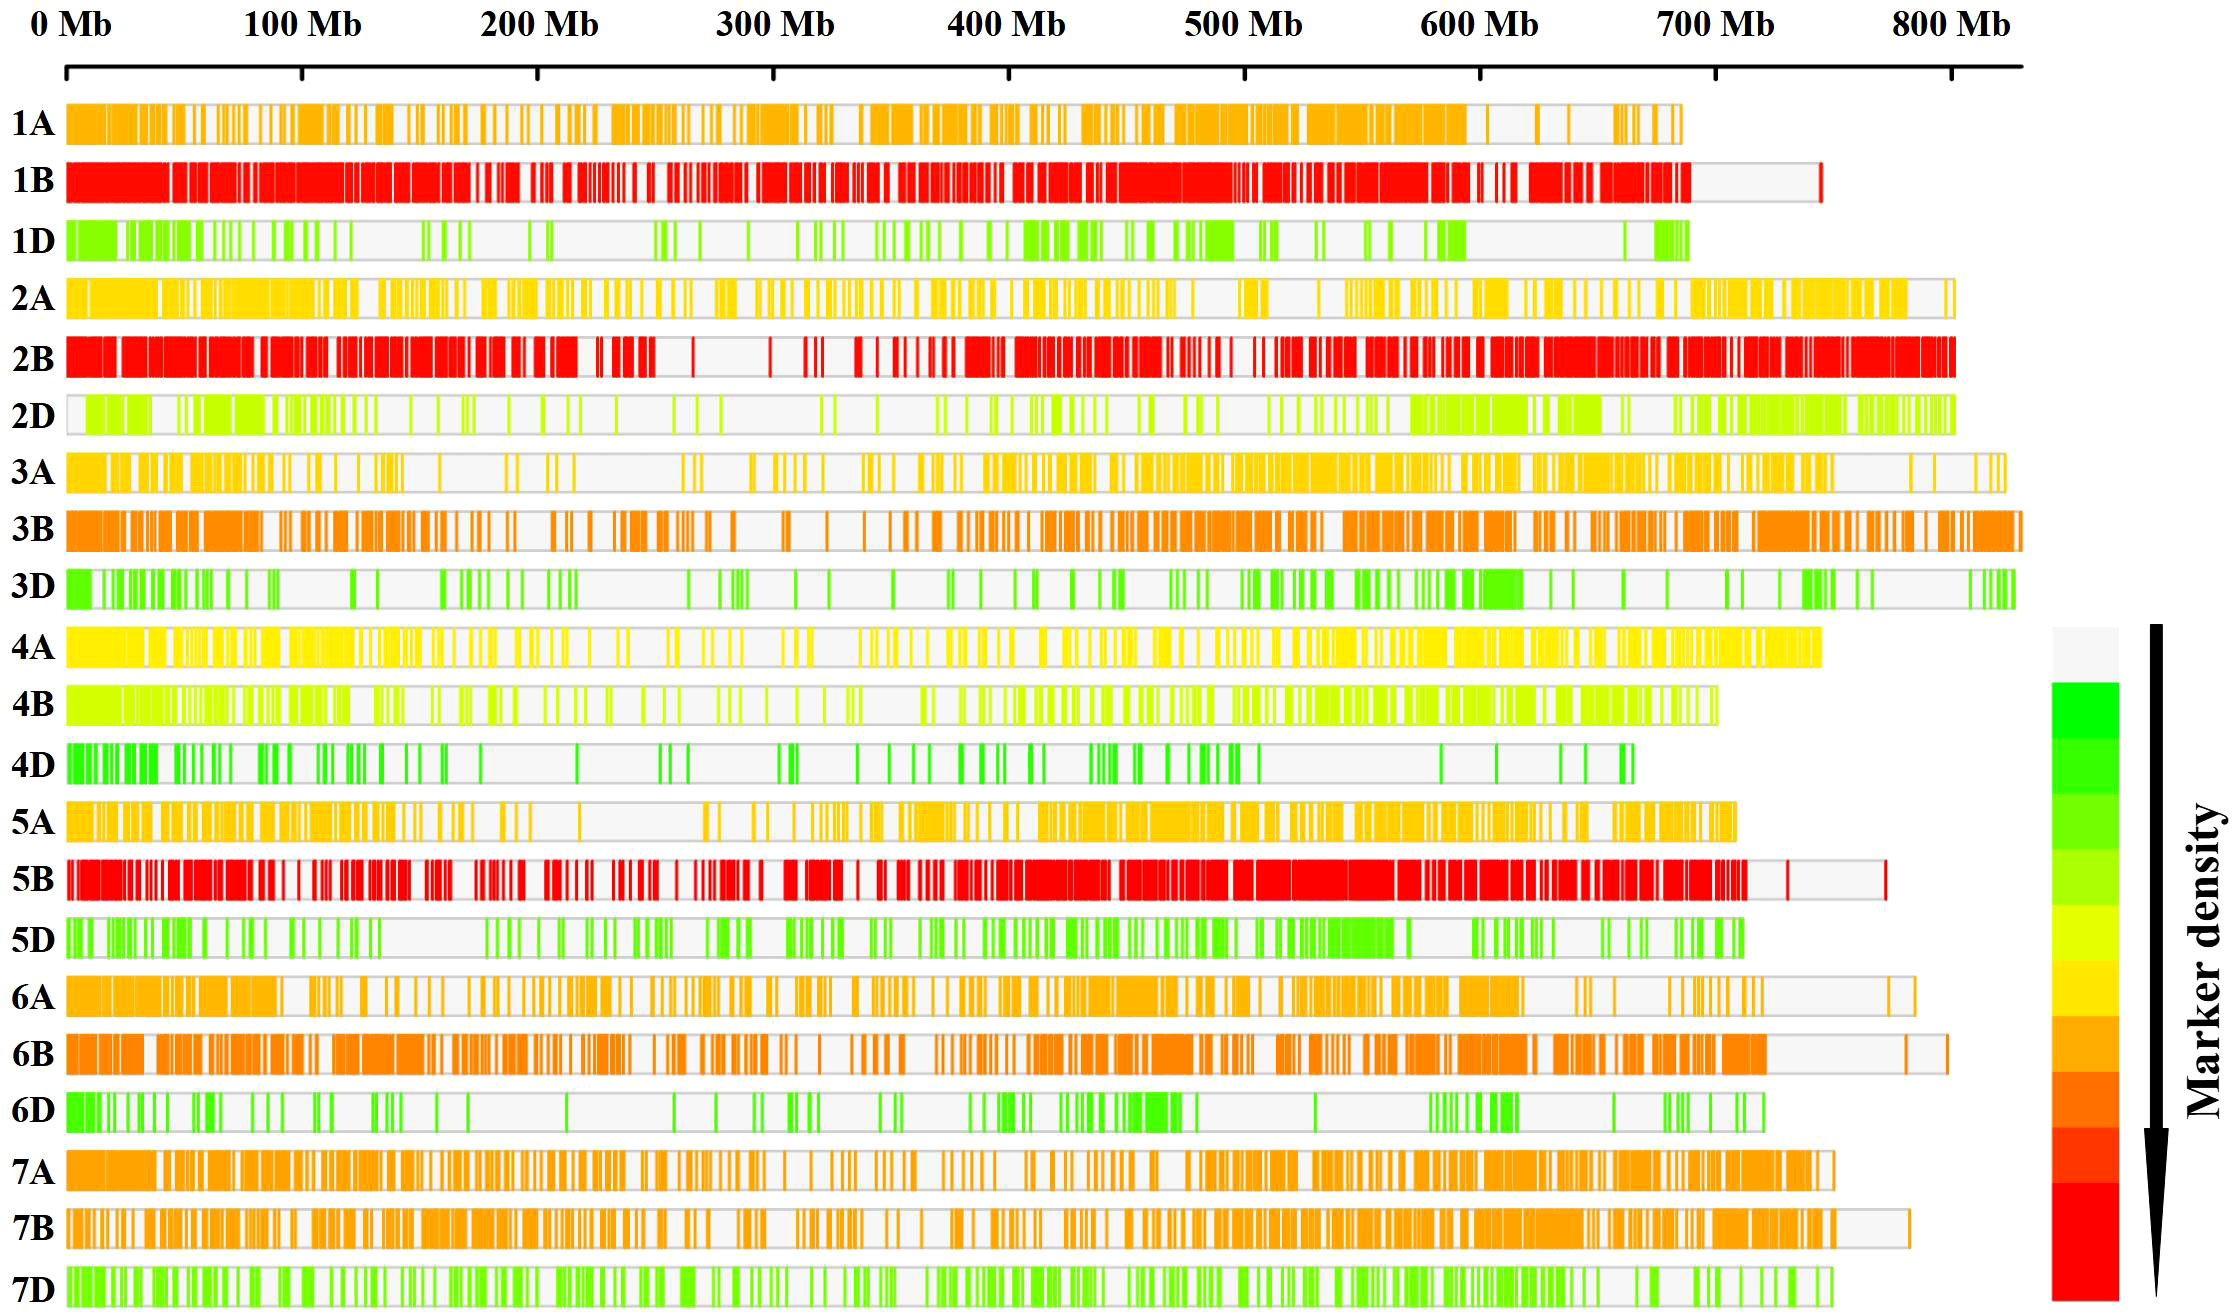
Figure 2 Distribution of the SNPs on different wheat chromosomes. Low-to-high SNP densities are represented by green to red.
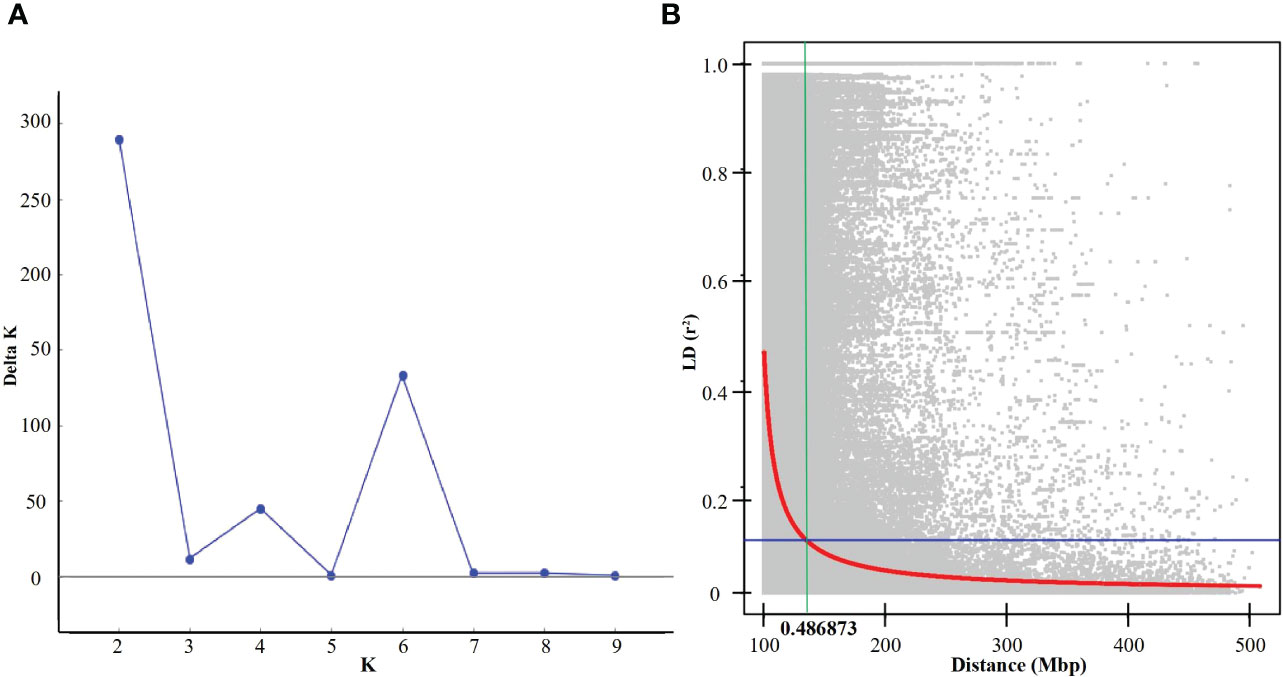
Figure 3 (A) Evanno plot of Delta-K statistic revealing the number of sub-populations in the panel, (B) Linkage disequilibrium (LD) in the panel for the whole genome.
GWAS using phenotypic data from seedlings grown in a hydroponic condition identified 95 MTAs (with MLM; including 57 MTAs for traits measured under control condition and 38 for traits recorded under stress condition), 212 (with FarmCPU; including 108 for traits measured under control condition and 104 for traits recorded under stress condition), and 212 (with BLINK; including 108 for traits measured under control condition and 104 for traits recorded under stress condition) based on the exploratory threshold of -log10(P) = 3.0 (Supplementary Figures 3A–D, Supplementary Table 2). Among these, as many as 94 MTAs were identified using all the three models (Supplementary Table 2). These MTAs involved 55 MTAs (located on chromosomes 1A, 3A, 3B, 4A, 4B, 5B, 5D, 7A, 7B, 7D) identified under control condition which included the following- 4 MTA for RLT, 8 for CL, 9 for RWT, 16 for SWT, and 18 for SLT and 38 MTAs (located on chromosomes 2A, 2B, 3A, 3B, 4A, 4B, 5A, 5B, 5D, 7A) identified under stress condition which included the following- 1 MTA for CL, 2 for SLT, 8 for RLT, 12 for RWT, and 15 for SWT traits (Table 4).
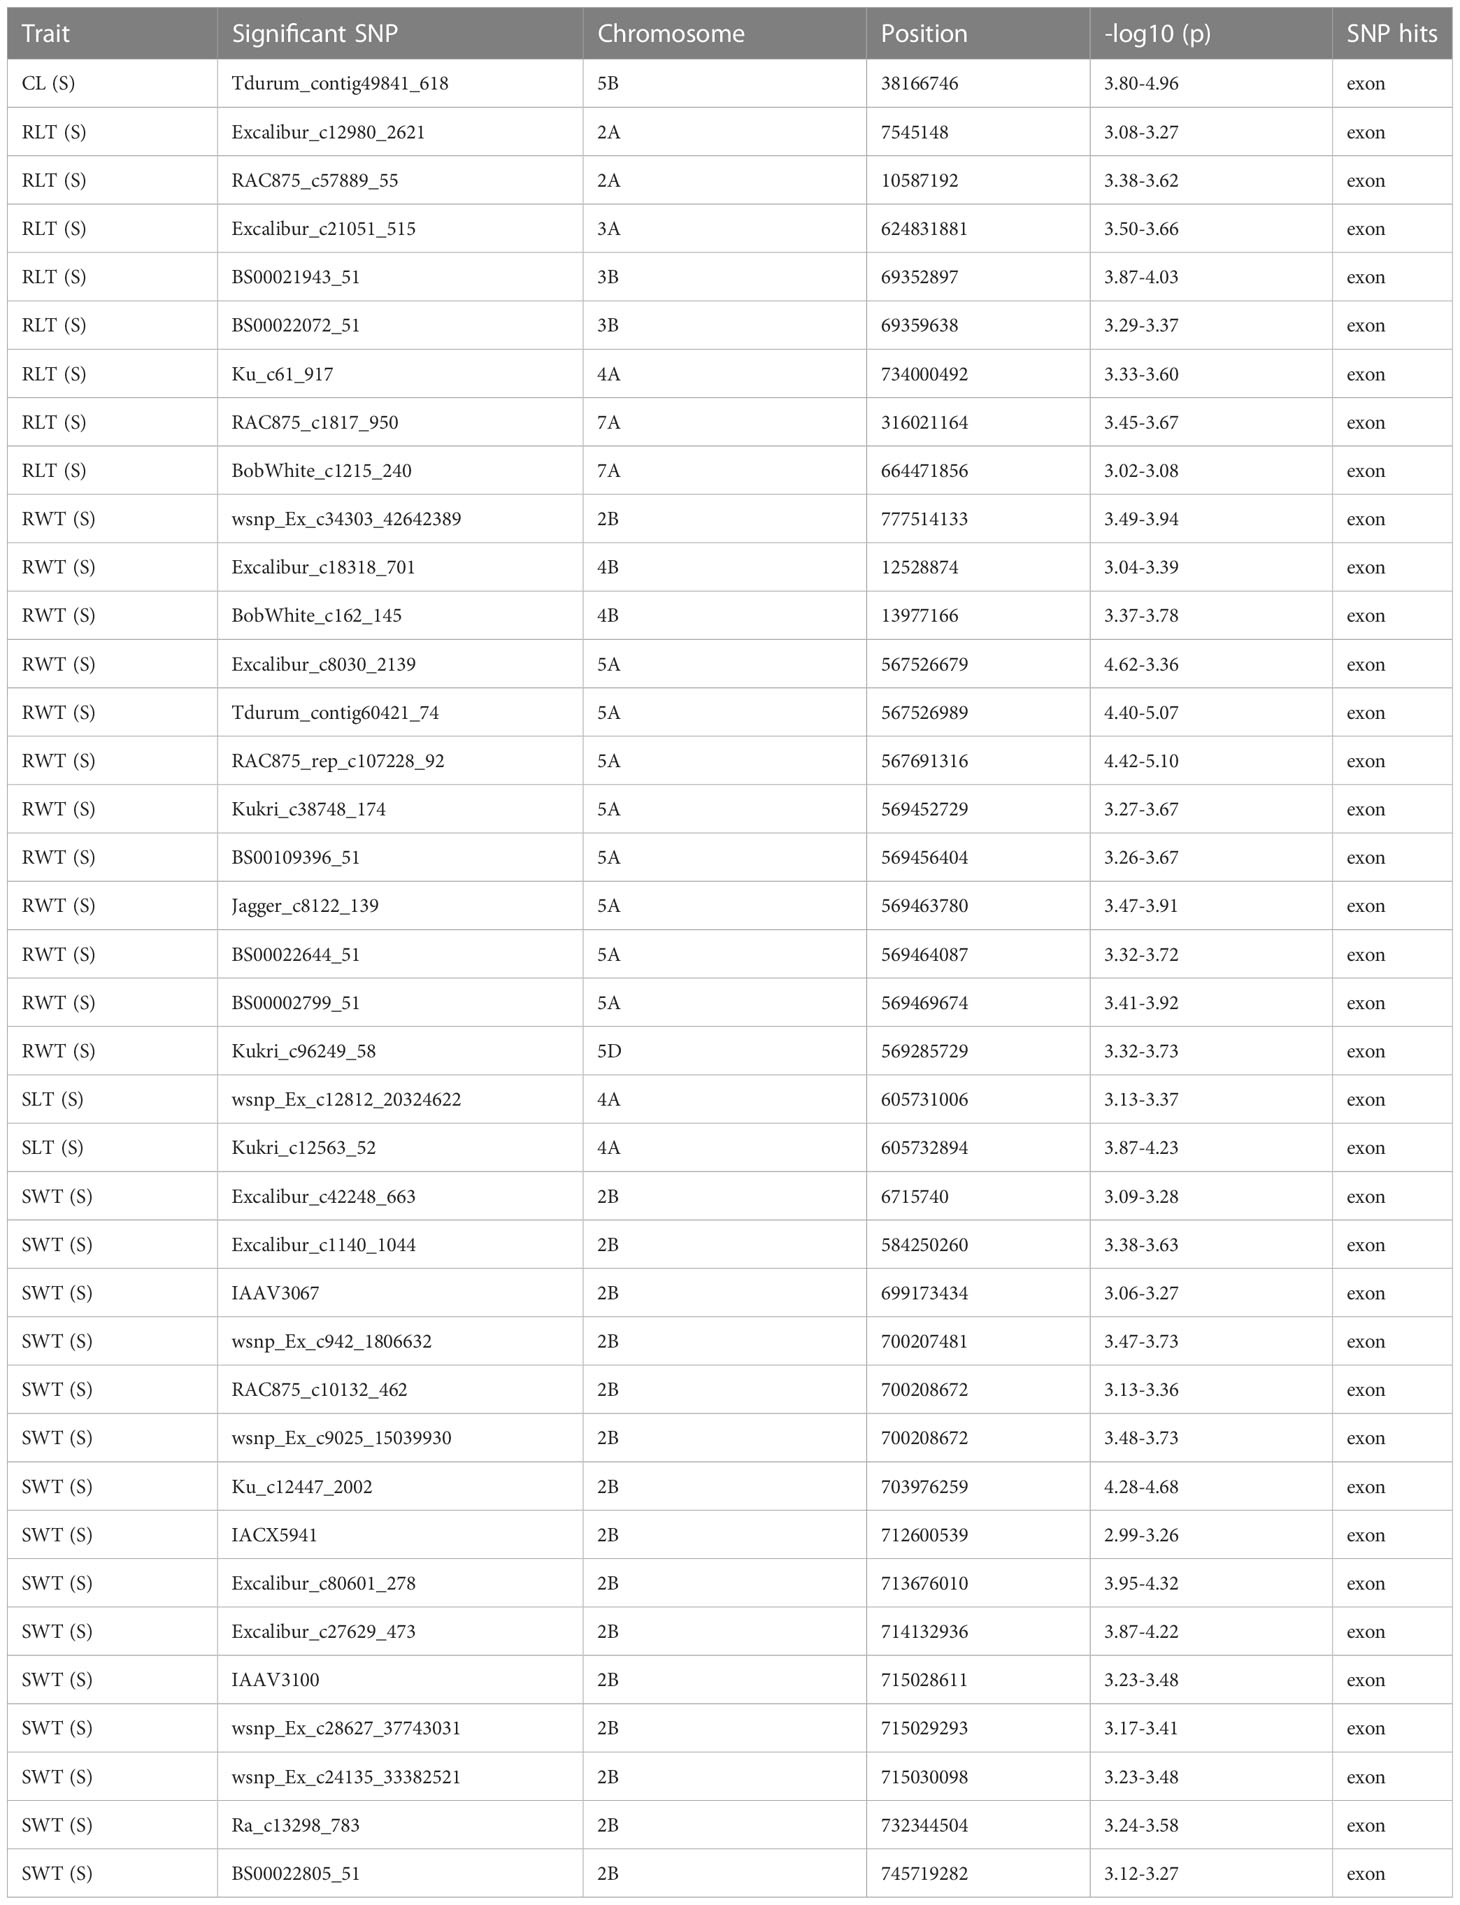
Table 4 Details on significant MTAs associated with seedling traits identified in hydroponics experiment conducted under water deficit conditions (detected with all three models).
GWAS using MLM model identified three SNPs, including BS00021943_51 associated with RLT, Kukri_c12563_52 and wsnp_Ex_c12812_20324622 associated with SLT under both control and stress conditions. It also detected four pleiotropic SNPs including (i) BS00021943_51 associated with RLT (C), RLT (S), and SLT (C), (ii) BS00022072_51 associated with RLT (S) and SLT (C), (iii) Excalibur_c46878_419 associated with RWT (C) and SWT (C), and (iv) wsnp_Ex_c12812_20324622 associated with RLT (C), SLT (C), and SLT (S) (Table 5). Similarly, GWAS using FarmCPU and BLINK models identified four SNPs, including BS00021943_51and BS00022072_51 associated with RLT, Kukri_c12563_52 and wsnp_Ex_c12812_20324622 associated with SLT under both control and stress conditions (Supplementary Table 2). It also detected six pleiotropic SNPs located on chromosomes 3B, 4A, 4B, and 7A, which involved the following- BS00021943_51 and BS00022072_51 associated with RLT (C), RLT (S), SLT (C), Excalibur_c46878_419 associated with RWT (C) and SWT (C), Kukri_c19696_60 associated with RLT (C) and RWT (C), RAC875_c1817_950 associated with RLT (S) and SLT (S), and wsnp_Ex_c12812_20324622 associated with SLT (C), SLT (S), and RLT (C) (Supplementary Table 2).
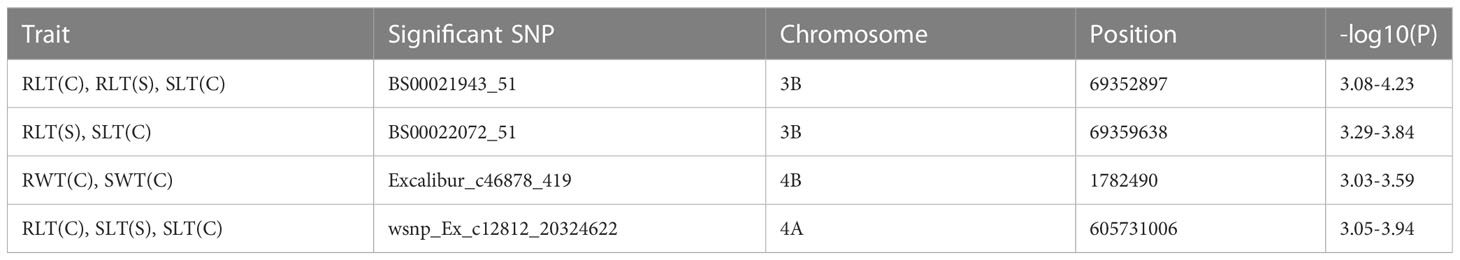
Table 5 Details on pleiotropic MTAs identified in hydroponics experiment (detected with all three models).
GWAS using phenotypic data collected from the field experiments conducted at three different locations during 2021-22 identified several significant MTAs based on the exploratory threshold of -log10(P) = 3.0. Among these, 585 MTAs (146 MTAs with MLM, 209 with FarmCPU, and 230 with BLINK) were detected using BHU field data (Supplementary Table 3), 879 MTAs (286 MTAs with MLM, 318 with FarmCPU, and 275 with BLINK) using BISA field data (Supplementary Table 4), and 1075 MTAs (283 MTAs with MLM, 418 with FarmCPU, and 374 with BLINK) using the ARI field data (Supplementary Table 5 and Supplementary Figures 4A–F). Among these MTAs, 451 MTAs were identified at different locations using all three models; trait-wise distribution of these MTAs is as follows- 48 for CTDGF(C), 20 for CTDGF(S), 15 for CTDH(C), 5 for CTDH(S), 7 for CTDM(C), 17 for CTDM(S), 35 for DH(C), 5 for DH(S), 24 for DM(C), 40 for DM(S), 37 for GY(C), 24 for GY(S), 52 for NDVIGF(C), 20 for NDVIGF(S), 13 for NDVIH(C), 7 for NDVIH(S), 19 for NDVIM(C), 8 for NDVIM(S), 34 for PH(C), 32 for PH(S), 21 for TKW(C), and 7 for TKW(S). Among these, 168 MTAs were associated with different traits recorded under stress conditions (Supplementary Table 6). Fourteen of the 451 MTAs were found to be associated with the same traits under both control and stress conditions (Supplementary Tables 3-5). For instance, Excalibur_c34189_122, wsnp_Ex_c6142_10746442, and wsnp_Ra_c2063_4012957 (all located on 7A) were associated with GY under both optimum and stress conditions, whereas BobWhite_c5654_231, BS00110124_51, BS00110642_51 (all located on 7D) were associated with PHT under both optimum and stress conditions at different locations (Supplementary Tables 3-5).
Furthermore, the 451 MTAs detected using all three models also included as many as 29 MTAs, each associated with at least two traits, either at the same or different locations (Table 6). These 29 MTAs were located on chromosomes 1B, 1D, 2D, 3A, 3D, 4B, 4D, 5A, 6B, 7A and 7B. For instance, BS00022299_51 (5A) was associated with NDVIGF(S), NDVIM(S), NDVIGF(C), and NDVIM(C); Excalibur_c1205_188 (7B) was associated with DH(C), DM(C), and CTDH(C); Excalibur_rep_c106790_155 (4D) was associated with DH(C), PH (S), and DM(C); IAAV4799 (5A) was associated with NDVIM(S), NDVIM(C), CTDGF(S), and CTDM(S); wsnp_Ex_c12223_19533198 (2D) was associated with NDVIH(C), NDVIGF(C), NDVIM(C), and NDVIH(S) and wsnp_Ex_c12850_20377830 (3A) was associated with PH(C), GY(C), and DM(S).
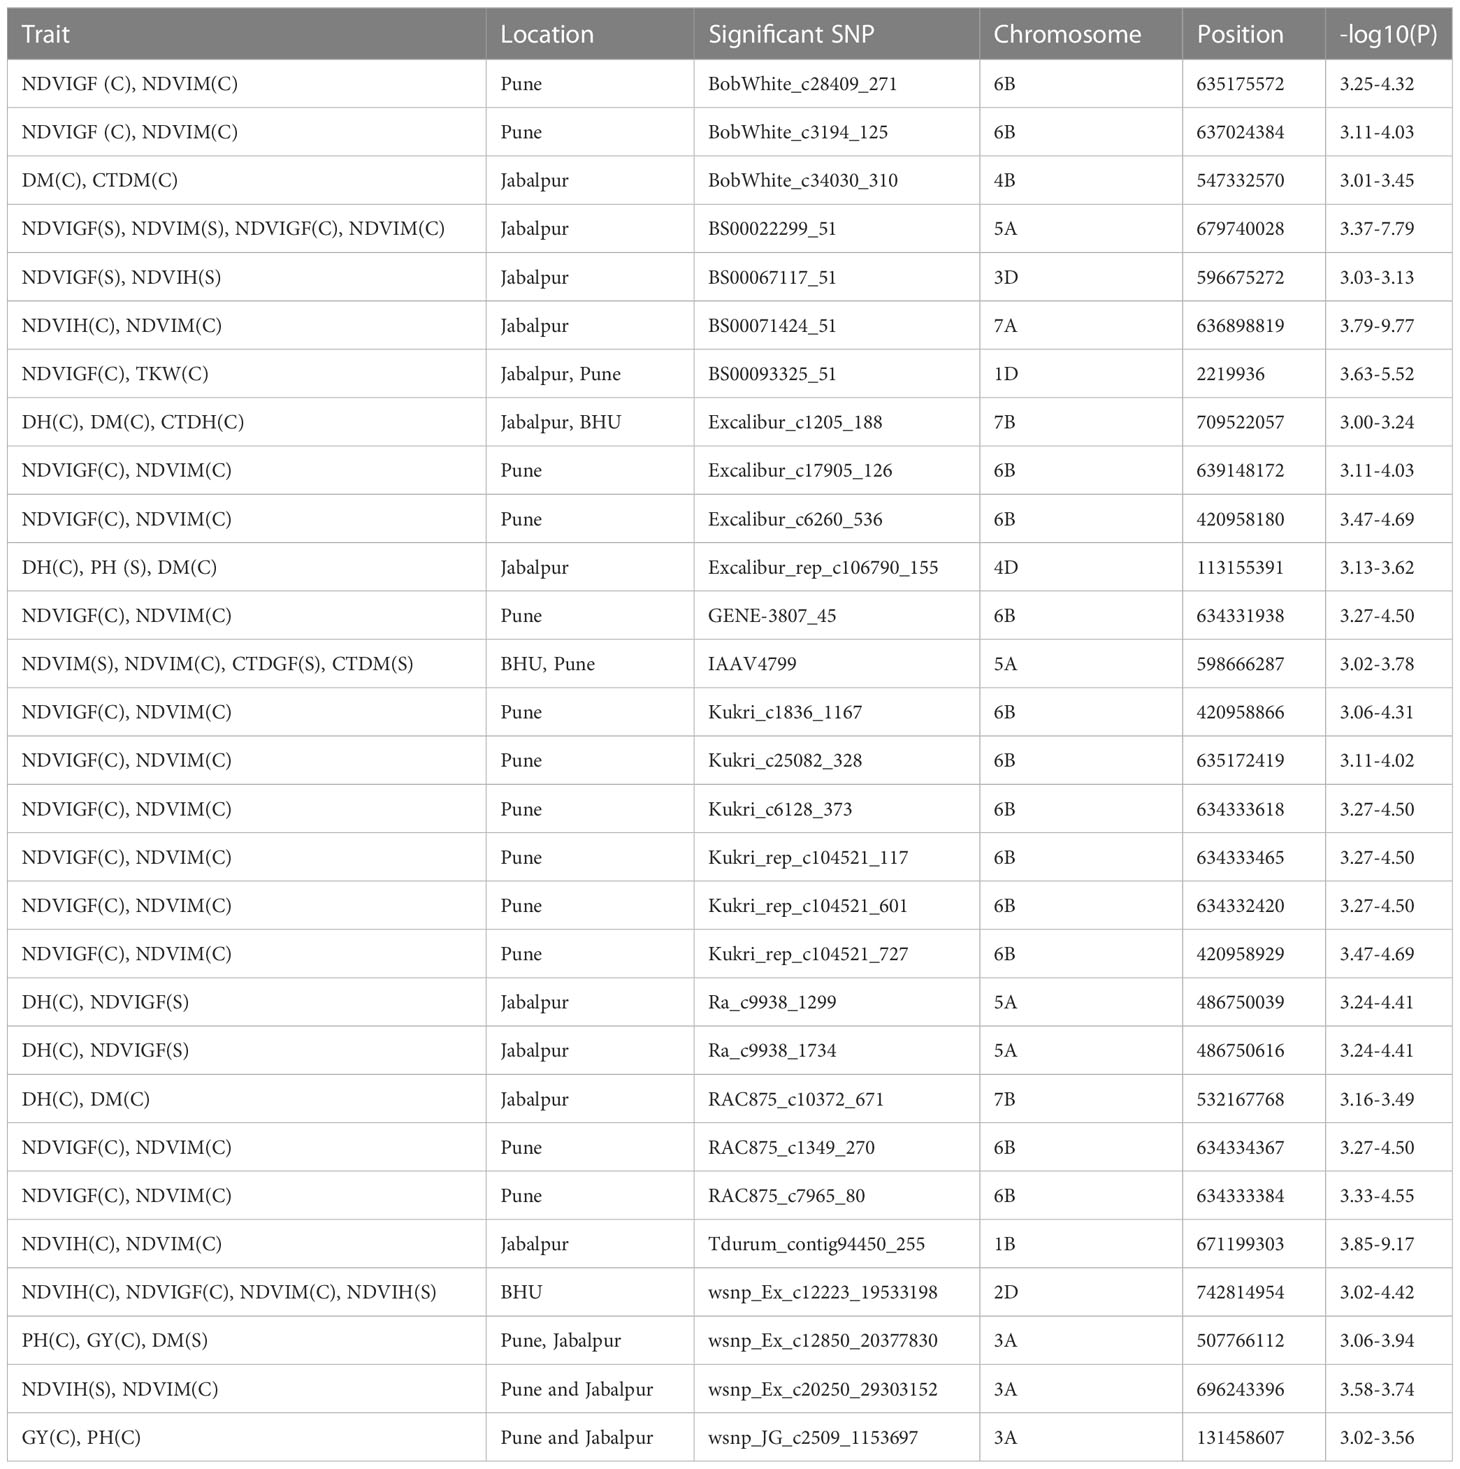
Table 6 Details on pleiotropic MTAs identified in field experiments (detected with all 3 models).
Among the MTAs available for various seedling traits recorded under stress conditions, two highly significant MTAs (detected with all three models) for each of the following traits-RLT (BS00021943_51 and RAC875_c1817_950), RWT (RAC875_rep_c107228_92 and Tdurum_contig60421_74), SLT (Kukri_c12563_52 and wsnp_Ex_c12812_20324622), and SWT (Excalibur_c80601_278 and Ku_c12447_2002), and one highly significant MTA (Tdurum_contig49841_618) associated with CL (detected with two models) were selected to evaluate the effects of their alleles on respective traits under stress conditions (Supplementary Table 7). The results revealed significant differences between the allelic effects for all the studied traits. For instance, significant differences (P= 2.72e-04) between the alleles of Tdurum_contig49841_618 associated with CL were observed, where favorable allele improved average CL by the value of 4.94 (Supplementary Figure 5A). Similarly, significant differences (P= 4.15e-04) between the alleles of BS00021943_51 associated with RLT were observed, where favorable allele improved average RLT by 2.71 cm (Supplementary Figure 5B). In the same way, significant differences (P= 7.98e-04 and 6.26e-04) between the alleles of RAC875_rep_c107228_92 and Tdurum_contig60421_74 associated with RWT were observed, where favorable alleles improved average RWT by the values of 0.06 and 0.05 (g), respectively (Supplementary Figures 5C, D).
Similarly, among the MTAs available for some traits recorded under stress conditions in different field experiments, some stable and significant SNPs including wsnp_Ex_c48789_53586502, Tdurum_contig42858_1256, Tdurum_contig42858_1352, wsnp_Ex_c48789_53586406, RAC875_c29455_79, tplb0035a03_368, RAC875_c8721_212, and Ra_c11721_631 associated with DM(S); Kukri_c6274_1283, BS00009565_51, wsnp_Ex_c9618_15912364, and RAC875_c5834_235 associated with PH(S); Excalibur_c3286_103, wsnp_Ex_c6142_10746442, wsnp_Ra_c7112_12318340, wsnp_Ex_c53387_56641291, BobWhite_c25527_313, wsnp_Ra_c2063_4012957, and Excalibur_c34189_122 associated with GY(S) were selected to evaluate the effects of their alleles on respective traits (combined BLUEs) under stress conditions (Supplementary Table 7). The analysis revealed significant differences between the allelic effects of different SNPs for all the studied traits. For instance, significant differences (P= 2.08E-03) between the alleles of RAC875_c8721_212 associated with DM(S) were observed, where one allele reduced the average DM(S) by 2.53 days (Supplementary Figure 6A). Similarly, significant differences (6.45E-03 and 8.41E-03) were reported between the alleles of Kukri_c6274_1283 and BS00009565_51 associated with PH(S), with favorable alleles reducing the average PH(S) by 2.32 and 2.49 cm, respectively. In the same way, significant differences (with P value ranging from 2.69E-04 to 7.17E-04) between the alleles of Excalibur_c3286_103, wsnp_Ex_c6142_10746442, wsnp_Ra_c7112_12318340 (Supplementary Figures 6B–D), wsnp_Ex_c53387_56641291, BobWhite_c25527_313, wsnp_Ra_c2063_4012957, and Excalibur_c34189_122 (Supplementary Figures 7A–D) associated with GY(S) were observed, where favorable alleles improved average GY(S) by the values ranging from 41.83 to 54.56 g/plot.
Some MTAs (as selected above; Supplementary Table 7) associated with different seedling traits (1 MTA for CL and 2 MTAs for RLT, RWT, SLT, and SWT each) under stress condition were utilized for the haplotype analysis. Based on the allelic distribution of the SNPs in the WAMI panel, for RLT under hydroponic stress conditions, we identified three haplotypes (Hap1, Hap2, and Hap3; involving a total of 4 SNPs) with a frequency of 0.92, 0.05, and 0.02, respectively. Only first two haplotypes were compared for variations in trait means because Hap3 had a very low frequency. The analysis revealed significant differences (P = 6.26e–04) between two haplotypes (Hap1 and Hap2) for RLT, where Hap2 (8.31g) had higher average RLT compared to Hap1(5.83g) (Figures 4A, B). Similarly, we identified three haplotypes (Hap1, Hap2, and Hap3; involving a total of 3 SNPs) for RWT with a frequency of 0.13, 0.84, and 0.01, respectively. Similarly, only first two haplotypes were compared for variations in trait means because Hap3 had a very low frequency. The analysis revealed significant differences (P = 7.26e–04) between two haplotypes (Hap1 and Hap2) for RWT, where Hap1 (0.21g) had a higher average RWT compared to Hap2(0.15g) (Figures 4C, D). In the same way, we identified three haplotypes (Hap1, Hap2, and Hap3; involving a total of 5 SNPs) for SWT with a frequency of 0.04, 0.63, and 0.29, respectively. The analysis revealed significant differences (P = 8.65e-03) between the Hap2 and Hap3 for SWT, where Hap2 (0.36g) had higher average SWT compared to Hap3(0.29g) (Figures 4E, F). There was no significant variation among the SLT haplotypes for the trait means, whereas, no haplotype was detected for the SNPs associated with CL.
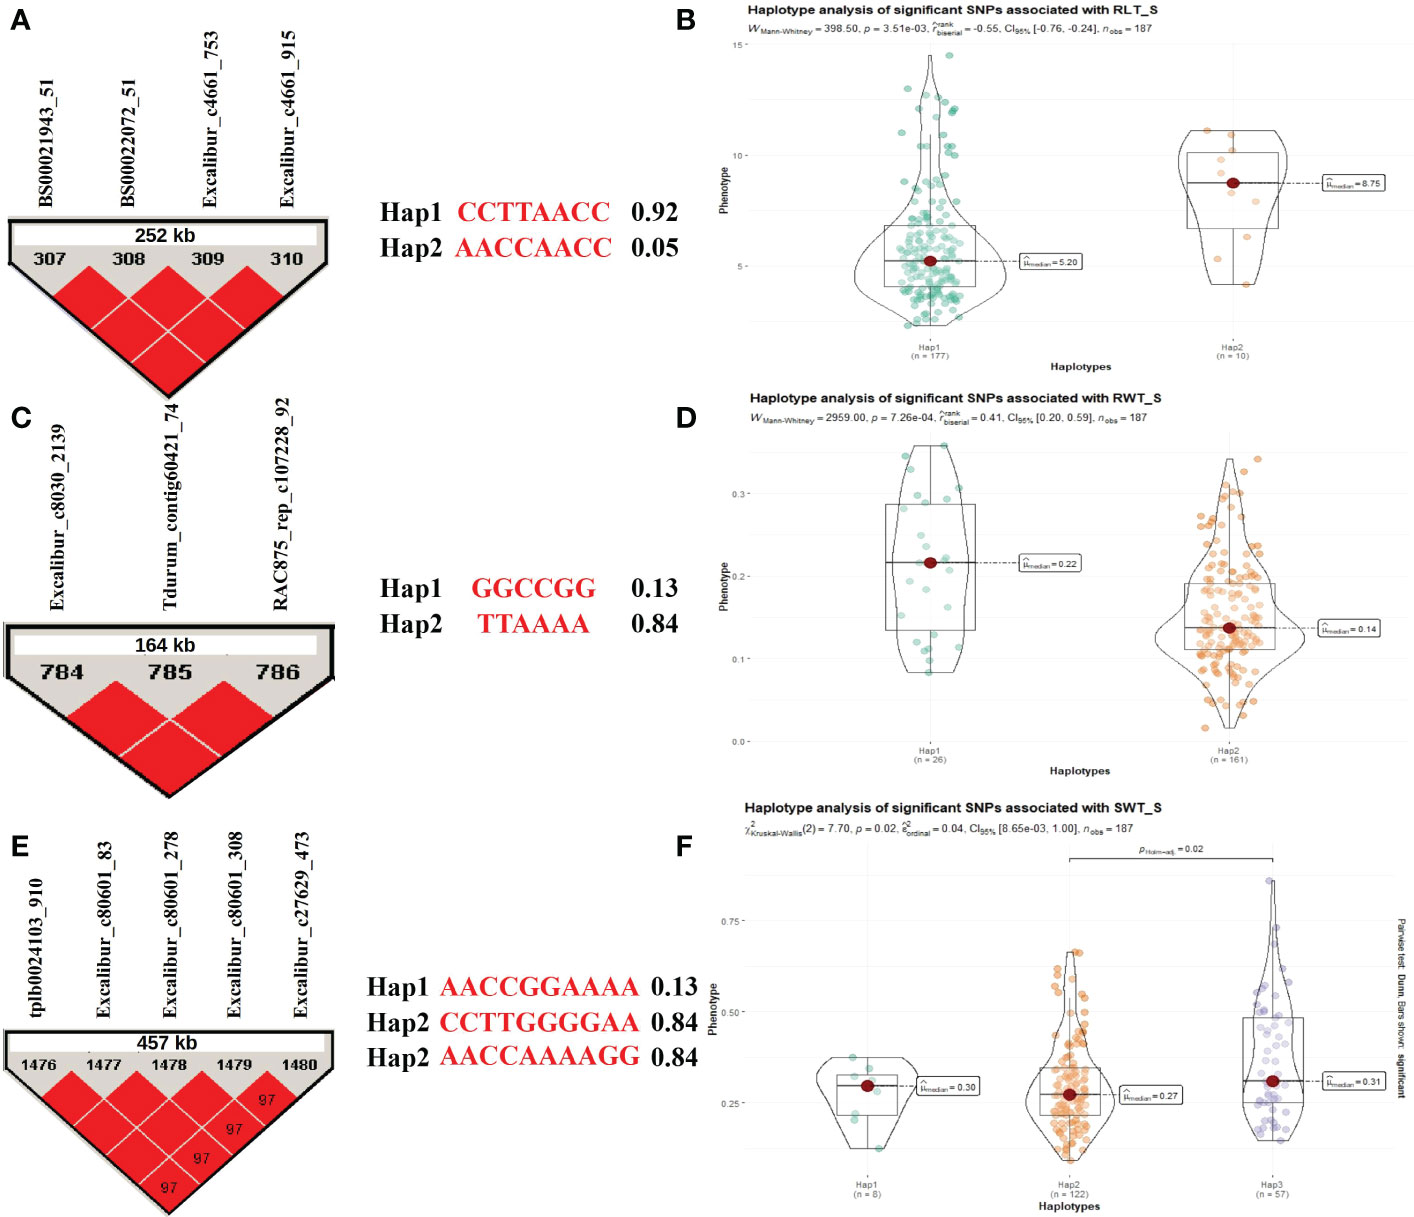
Figure 4 Haplotype analysis for traits recorded under stress conditions during the hydroponics experiment, (A) LD block for the 252 kb region harboring MTA for RLT and two allelic haplotypes identified in the panel based on four SNPs present in the LD block along with frequencies for each haplotype; (B) Differences in RLT between two haplotypes; (C) LD block for the 164 kb region harboring MTA for RWT and two allelic haplotypes identified in the panel based on three SNPs present in the LD block along with frequencies for each haplotype; (D) Differences in RWT between two haplotypes; (E) LD block for the 457 kb region harboring MTA for SWT and three allelic haplotypes identified in the panel based on five SNPs present in the LD block along with frequencies for each haplotype; (F) Differences in SWT among three haplotypes.
Similarly, seven stable and significant SNPs (Excalibur_c3286_103, wsnp_Ex_c6142_10746442, wsnp_Ra_c7112_12318340, wsnp_Ex_c53387_56641291, BobWhite_c25527_313, wsnp_Ra_c2063_4012957, and Excalibur_c34189_122) on chromosome 7A associated with GY under stress condition reported in the field experiments were utilized for the haplotype analysis. Based on the allelic distribution of these SNPs in the WAMI panel, we identified two sets of haplotypes for GY under stress conditions in field experiments. In the first group, we identified six haplotypes (Hap1, Hap2, Hap3, Hap4, Hap5, and Hap6; involving a total of six SNPs) with a frequency of 0.32, 0.35, 0.31, 0.02, 0.01, and 0.01, respectively. Only first three haplotypes were compared for variations in trait means because the last three haplotypes (viz., Hap4, Hap5, and Hap6) had very low frequencies (Figures 5A, B). The analysis revealed significant differences between haplotypes Hap1 and Hap3 (P=0.03) and between haplotypes Hap2 and Hap3 (P=1.27E-03) for GY(S). Among these three haplotypes, Hap3 (mean = 361.16 g/plot) had maximum GY followed by Hap1 (mean =310.47 g/plot) and Hap2 (mean GY(S) =300.42 g/plot). In the second group, we identified five haplotypes (Hap1, Hap2, Hap3, Hap4, and Hap5; involving a total of six SNPs) with a frequency of 0.29, 0.36, 0.27, 0.04, and 0.005, respectively. Among these five haplotypes, first four haplotypes were compared for variations in trait means because the last haplotype (viz., Hap5) had a very low frequency (Figures 5C, D). The analysis revealed significant differences between haplotypes Hap2 and Hap3 (P=6.01E-03) and between haplotypes Hap3 and Hap4 (P=7.96E-03) for GY(S). Among these four haplotypes, Hap3 (mean = 360.75 g/plot) had maximum GY followed by Hap1 (mean =317.49 g/plot), Hap2 (mean =305.29 g/plot), and Hap4 (mean =262.16 g/plot).
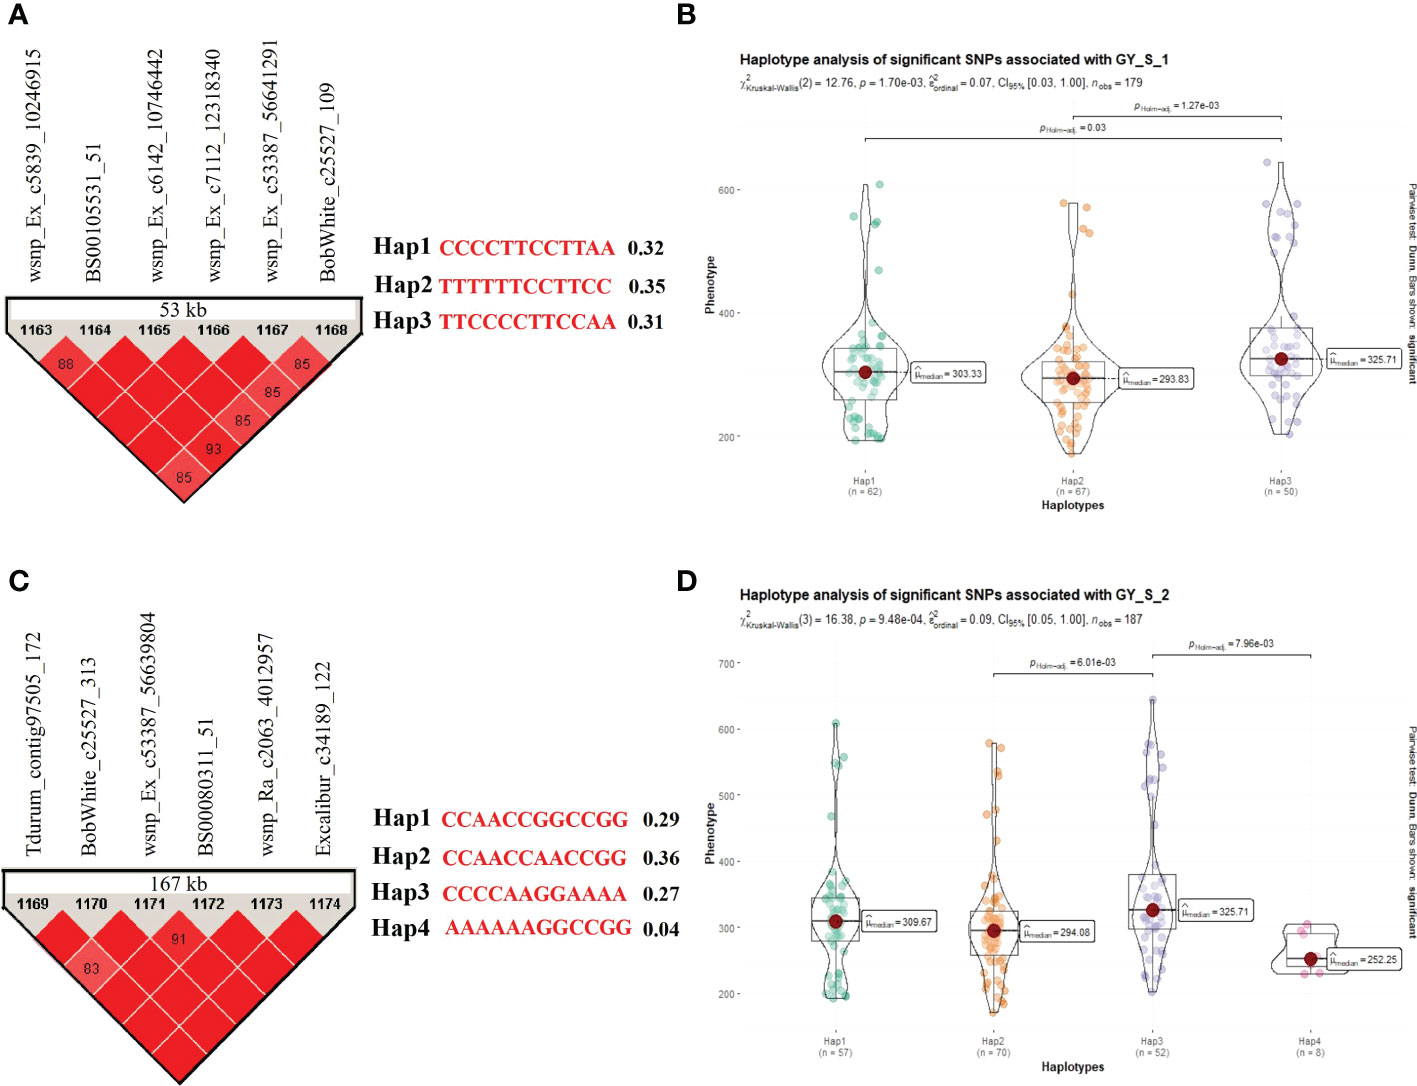
Figure 5 Haplotype analysis for traits recorded under stress conditions during the field experiments, (A) LD block for the 53 kb region harboring MTA for GY and three allelic haplotypes identified in the panel based on six SNPs present in the LD block along with frequencies for each haplotype; (B) Differences in GY among three haplotypes; (C) LD block for the 167 kb region harboring MTA for GY and four allelic haplotypes identified in the panel based on six SNPs present in the LD block along with frequencies for each haplotype; (D) Differences in GY among four haplotypes.
Gene annotation and in silico expression analysis revealed as many as 102 non-redundant important candidate genes (CGs) underlying the nine stable genomic regions (as selected above) detected under stress conditions in hydroponic conditions. These genes encode several important proteins such as F-box-like protein, ABC transporter-like protein, GDSL lipase/esterase, glycosyltransferase, AP2/ERF TF, protein kinase, calcineurin-like phosphodiesterase, GroES-like superfamily protein, WD40 repeat and others (Supplementary Table 8). The above candidate genes were also subjected to an in silico expression analysis utilizing RNA-seq data available from a public database. As many as 23 CGs from different MTAs exhibited differential expression, and these differentially expressed CGs (DECGs) were divided into up-regulating (FC ≥ 2) and down-regulating (FC ≤ − 2) CGs (Supplementary Figure 8 and Supplementary Table 10). These 23 genes primarily encoded for the following proteins: protein kinases, GroES-like superfamily proteins, OTU domain containing proteins, KIX domain superfamily proteins, NAD-dependent epimerase/dehydratase, etc. A few genes (e.g., TraesCS2B02G519900 and TraesCS5B02G035700) with unknown protein products also showed significant differential expression under control and stress conditions. A representative heat map of these DECGs is represented in Supplementary Figure 8.
Similarly, gene annotation and in silico expression analysis revealed as many as 43 non-redundant important candidate genes underlying the 10 stable genomic regions including RAC875_c8721_212 (6A), Kukri_c6274_1283 (4A), BS00009565_51 (4A), and Excalibur_c3286_103, wsnp_Ex_c6142_10746442, wsnp_Ra_c7112_12318340, wsnp_Ex_c53387_56641291, BobWhite_c25527_313, wsnp_Ra_c2063_4012957, and Excalibur_c34189_122 (each located on 7A and associated with GY) detected under stress conditions in field experiments (Supplementary Table 9). The above CGs were also subjected to an in silico expression analysis utilizing RNA-seq data available from a public database. Up to seven CGs exhibited differential expression, and these DECGs were divided into up-regulating (FC ≥ 2) and down-regulating (FC ≤ − 2) CGs (Supplementary Figure 8 and Supplementary Table 10). These genes are known to encode several important proteins such as protein kinases, Bromodomain, Armadillo, Cyanobacterial aminoacyl-tRNA synthetase, O-methyltransferase domain containing proteins, etc.
Breeding for drought tolerance deserves much higher attention and investment to sustain wheat production under the current climate change scenario. Wheat is affected by drought stress at all growth stages. Even though most earlier studies focused on aboveground adult plant traits (El Gataa et al., 2022), seedling traits are equally important since the seedling stage is the most vulnerable stage in warm and dry regions, and their trait values may differ significantly from those of adult plants (Harrison and Laforgia, 2019). This study evaluated a bread wheat panel systematically assembled from the CIMMYT gene bank for seedling traits (viz., CL, SLT, RLT, SWT, and RWT) under hydroponics conditions. The interaction between water treatments and genotypes was highly significant for all the traits studied, indicating substantial genotypic variation in response to water treatments. Significant differences between water treatments and wheat genotypes have been reported in earlier studies (e.g., El Gataa et al., 2022; Sallam et al., 2022).
All the traits evaluated during hydroponics and field experiments reduced significantly but variably under drought stress, indicating the variation in the phenotypic plasticity of the studied traits. Phenotypic plasticity is one of the major mechanisms of adaptation to abiotic stresses through modifications in critical developmental stages (Fatiukha et al., 2021). Various genotypes that exhibited drought tolerance either at the seedling or adult plant stages could be deployed in the breeding programs to achieve tolerance at the desired stage. A few genotypes that demonstrated drought tolerance at both stages appear to be a better choice for use as parents in the breeding program targeting drought stress tolerance. We observed moderate to high heritability estimates for different traits in the hydroponics experiment as obtained in some of the earlier studies conducted under control and water stress conditions (Maulana et al., 2020; Danakumara et al., 2021). Moderate to high broad-sense heritability for most of the traits implies that it may be useful to employ these traits for a better comprehension of the genetics underlying the yield potential of wheat under drought stress conditions.
GWAS is a popular technique for dissecting the genetic architecture of complex traits in wheat (Sidhu et al., 2020; AlTameemi et al., 2021; Saini et al., 2022; Zhang et al., 2022) and other crops, but this strategy is prone to the identification of false positives owing to confounding population structure, cryptic relatedness of the individuals in the population or the effect of phenology traits. In this study, we used one single locus model (i.e., MLM) and two multi-locus models (viz., FarmCPU and BLINK), which have been known to provide the most reliable results (reviewed in Saini et al., 2022). Further, we used the genotypes with similar heading dates for GWAS therefore, minimizing the effect of phenology on the GWAS results. In addition, the Infinium iSelect 90K assay is known to detect polymorphism in allo-hexaploid wheat populations by analyzing over 81,000 gene-associated SNPs (Wang et al., 2014). This SNP array is known for providing greater genome coverage and resolution during the dissection of different complex traits in wheat (Muhu-Din Zhu et al., 2019; Ahmed et al., 2020; Muhammad et al., 2020; Zhang et al., 2021). Unlike several previous studies (Ahmed et al., 2020; Muhammad et al., 2020; Zhang et al., 2021), we considered the physical positions of the SNPs for GWAS analysis, which is consistent with a few previous studies (Zhu et al., 2019; Safdar et al., 2020) using the 90K Infinium iSelect assay for GWAS.
Further, it is essential to establish the p-value threshold. A threshold that is too lenient will flag a false-positive association (a type I error), while one that is too strict will likely miss a true association (a type II error). In this study, we employed an exploratory threshold [-log10(P) = 3.00] based on independent tests to consider any SNP as significant in individual environments, as reported in some previous studies (Halder et al., 2019; Kumar et al., 2021; Gill H. S. et al., 2022).
Most previous studies have identified the genomic regions associated to drought stress tolerance in wheat either at seedling (Maulana et al., 2020; Danakumara et al., 2021; Sallam et al., 2022) or at the reproductive stage (Gataa et al., 2021; El Gataa et al., 2022). However, a few studies conducted GWAS for traits on both seedlings and adult plant stages (e.g., Rufo et al., 2020). The WAMI panel used in this study has previously been studied to screen for drought tolerance under rainfed conditions (Gahlaut et al., 2019; Gahlaut et al., 2021). However, our study is unique in that we imposed drought treatment specifically at the flowering stage, during which soil moisture levels reached approximately 45%. In addition to the field trials, we also conducted hydroponic experiments to identify genomic regions associated with drought tolerance at the seedling stage.
In this study, 94 MTAs associated with various seedling traits were identified using all three models under either normal or stress or both conditions. Two of these MTAs were previously detected to be associated with different seedling traits on chromosomes 3A and 7D (Maulana et al., 2020). The remaining MTAs identified on chromosomes 1A, 2A, 2B, 3A, 3B, 4A, 4B, 5A, 5B, 5D, 7A, 7B, and 7D have not been previously reported and they can be considered novel. In addition, several significant SNPs were reported to be associated with seedling traits under both normal and stress conditions. For instance, BS00021943_51 and BS00022072_51 (RLT), Kukri_c12563_52 and wsnp_Ex_c12812_20324622 (SLT). Some significant SNPs each associated with at least two different seedling traits were also detected, for instance, BS00021943_51 and BS00022072_51 associated with RLT (C), RLT (S), SLT (C), Kukri_c19696_60 associated with RLT (C) and RWT (C), and wsnp_Ex_c12812_20324622 associated with SLT (C), SLT (S), and RLT (C). Earlier studies have also reported a significant association between root and shoot traits (Figueroa-bustos et al., 2018) and shared genetic control of these traits (Danakumara et al., 2021).
Similarly, 451 MTAs associated with different adult plant traits were identified at different locations under normal or stress conditions. Seventy-one of these MTAs were previously detected to be associated with different adult plant traits recorded under normal and drought stress conditions on all 21 chromosomes except 1D, 4B, 4D, and 6B (Mwadzingeni et al., 2017; Bhatta et al., 2018; Sukumaran et al., 2018; Afzal et al., 2019; Gahlaut et al., 2019; Li et al., 2019; Mathew et al., 2019; Qaseem et al., 2019; Ahmed et al., 2020; Shokat et al., 2020; Abou-Elwafa and Shehzad, 2021; Amalova et al., 2021; Rabbi et al., 2021). The remaining MTAs have not been reported and therefore, can be considered novel. Further, several significant SNPs were reported to be associated with adult plant traits under both normal and stress conditions at different locations. Similar results have also been reported in some earlier studies (Maulana et al., 2020; Danakumara et al., 2021; Gataa et al., 2021; Sallam et al., 2022).
As many as 19 significant SNPs each associated with at least two different adult plant traits were also detected, for instance, BS00022299_51 was reported to be associated with NDVIGF(C&S) and NDVIM(C&S); Excalibur_rep_c106790_155 was reported to be associated with DH(C), PH(S), and DM(C); IAAV4799 was found to be associated with NDVIM(C&S), CTDGF(S), and CTDM(S); wsnp_Ex_c12223_19533198 was reported to be associated with NDVIH(C&S), NDVIGF(C), and NDVIM(C), and wsnp_Ex_c12850_20377830 was found to be associated with PH(C), GY(C), and DM(S). A significant positive correlation between NDVIGF and NDVIM has been reported (Sultana et al., 2014). Additionally, Hassan et al., 2019 described that NDVI measured at the grain filling stage may be a useful tool for predicting wheat yield. Stay-green, calculated as NDVI at physiological maturity showed a positive correlation with yield in heat and heat combined with drought environments (Lopes and Reynolds, 2012). There was a significant positive linear relationship between CTDGF and CTDM, as well as between CTDGF and GY. Further, a cooler plant canopy during mid-grain filling in wheat appeared to be an important indicator of greater drought tolerance and yield under dryland conditions (Thapa et al., 2018).
Overall, there were significant differences in the distribution of MTAs associated with the seedling and adult plant traits on different chromosomes, with 45.50% of MTAs identified on the A sub-genome, 37.79% in the B sub-genome, and only 16.69% in the D sub-genome. These findings align with the previous findings of lower genetic diversity and occurrence of higher LD in the D genome (Mwadzingeni et al., 2017; Bhatta et al., 2018; Sukumaran et al., 2018; Abou-Elwafa and Shehzad, 2021; El Gataa et al., 2022; Rabieyan et al., 2022). Furthermore, among the MTAs detected using all three models, as many as 19 significant SNPs associated with adult plant traits at different locations were found to be overlapped with as many as 13 significant SNPs associated with different seedling traits. Relationships between seedling and adult plant traits under drought stress have also previously been reported (Dodig et al., 2015; Rufo et al., 2020).
As many as 13 significant SNPs identified using the data from field experiments on chromosomes 3A, 4A, 4B, 5A, 6B, 7A, 7B, and 7D were found to be overlapping with several major genes known to be associated with various yield component traits under either optimum or stress conditions; these genes included the following- TaGS5-3A (Ma et al., 2016), TaTGW6-A1 (Hanif et al., 2016), 6-SFT-A2 (Yue et al., 2015), TaSnRK2.10-4B (Zhang Z. et al., 2017), TaSnRK2.9-5A (Rehman et al., 2019), TaGL3-5A (Yang et al., 2019), TaPRR1-6B (Sun et al., 2020), WAPO-A1 (Kuzay et al., 2019), TaSPL20-7B (Zhang B. et al., 2017), and TaGS-D1 (Zhang et al., 2014).These observations indirectly validated the findings of the present study.
Functional annotation and gene expression analysis of genes available from significant genomic regions associated with different seedling traits identified 23 important genes with differential expression under control and stress conditions. These genes encoded a variety of important proteins, which are known to play significant roles during drought stress conditions, such as protein kinases (Lim et al., 2020), GroES-like superfamily proteins (Wang et al., 2004), OTU domain-containing proteins (Zang et al., 2020), KIX domain superfamily proteins (Han et al., 2006), NAD-dependent epimerase/dehydratase (Chaichi et al., 2019), etc. Some genes encoding unpredicted or uncharacterized proteins also showed significant expressions in different plant tissues which may also be utilized for future research. Similarly, functional annotation and gene expression analysis identified seven important genes associated with adult plant traits that had differential expression under control and stress conditions. These genes also encoded a number of important proteins, such as protein kinases (Lim et al., 2020), bromodomain (Duque and Chua, 2003), armadillo (Sharma et al., 2014), cyanobacterial aminoacyl-tRNA synthetase (Shahinnia et al., 2021), O-methyltransferase domain containing proteins (Chun et al., 2021), etc., which are known to play critical roles during drought stress conditions.
The WAMI association panel used in this study showed significant variations for different traits to drought stress recorded at the seedling stage under hydroponic conditions, including CL, SLT, RLT, SWT, and RWT, as well as traits recorded in field experiments, including DTH, DTM, PHT, NDVIH, NDVIGF, NDVIM, CTDH, CTDGF, CTDM, TKW, and GY. This demonstrates that germplasm selection based on these traits may benefit breeding for drought-tolerant wheat genotypes. Contrasting genotypes identified in this study could be used to develop mapping populations for further genetic dissection of the trait(s), while agronomically superior drought-tolerant genotypes could be used as donors in a breeding program. The construction of breeder-friendly Kompetitive allele-specific PCR (KASP) markers for the significant and stable MTAs identified may facilitate the deployment of these genomic regions through marker-assisted selection in the early stages of the wheat breeding process. In addition, the significant MTAs identified during the current study can be integrated into genomic prediction models to evaluate their potential for selection under drought stress conditions. Desirable haplotypes can be used for haplotype-based breeding in wheat to improve yield stability, potential, and performance under drought stress. The identified important genes may also be validated using functional genomics techniques and CG-based association mapping.
The original contributions presented in the study are included in the article/Supplementary Material. Further inquiries can be directed to the corresponding author.
SS conceptualized, designed, and monitored the research, SR and GS performed field and hydroponic experiments, DS performed genomic analysis, SR, DS, and GS prepared the initial draft, and SS, VM and AJ edited and finalized the manuscript. All authors contributed to the article and approved the submitted version.
SS is thankful to the Department of Science and Technology, Govt. of India (M14/73) and Institute of Eminence, BHU for financial assistance. VKM thanks Institute of Eminence, BHU for financial support. SR thanks DST for Junior Research Fellowship.
The authors declare that the research was conducted in the absence of any commercial or financial relationships that could be construed as a potential conflict of interest.
All claims expressed in this article are solely those of the authors and do not necessarily represent those of their affiliated organizations, or those of the publisher, the editors and the reviewers. Any product that may be evaluated in this article, or claim that may be made by its manufacturer, is not guaranteed or endorsed by the publisher.
The Supplementary Material for this article can be found online at: https://www.frontiersin.org/articles/10.3389/fpls.2023.1166439/full#supplementary-material
Abou-Elwafa, S. F., Shehzad, T. (2021). Genetic diversity, GWAS and prediction for drought and terminal heat stress tolerance in bread wheat (Triticum aestivum l.). Genet. Resour. Crop Evol. 68 (2), 711–728. doi: 10.1007/s10722-020-01018-y
Afzal, F., Li, H., Gul, A., Subhani, A., Ali, A., Mujeeb-Kazi, A., et al. (2019). Genome-wide analyses reveal footprints of divergent selection and drought adaptive traits in synthetic-derived wheat. G3: Genes Genomes Genet. 9 (6), 1957–1973. doi: 10.1534/g3.119.400010
Ahmed, H. G. M. D., Sajjad, M., Li, M., Azmat, M. A., Rizwan, M., Maqsood, R. H., et al. (2019). Selection criteria for drought-tolerant bread wheat genotypes at seedling stage. Sustainability 11 (9), 1–17. doi: 10.3390/su11092584
Ahmed, H. G. M., Sajjad, M., Zeng, Y., Iqbal, M., Khan, S. H., Ullah, A., et al. (2020). ) ‘Genome-wide association mapping through 90K SNP array for quality and yield attributes in bread wheat against water-deficit conditions’. Agriculture 10 (9), 392. doi: 10.3390/agriculture10090392
AlTameemi, R., Gill, H. S., Ali, S., Ayana, G., Halder, J., Sidhu, J. S., et al. (2021). Genome-wide association analysis permits characterization of stagonospora nodorum blotch (SNB) resistance in hard winter wheat. Sci. Rep. 11 (1), 1–13. doi: 10.1038/s41598-021-91515-6
Amalova, A., Abugalieva, S., Sandukash, A. B. (2021). ‘Genome-wide association study of yield components in spring wheat collection harvested under two water regimes in northern kazakhstan’. PeerJ 9, 11857. doi: 10.7717/peerj.11857
Ayalew, H., Ma, X., Yan, G. (2015). Screening wheat (Triticum spp.) genotypes for root length under contrasting water regimes: potential sources of variability for drought resistance breeding. J. Agron. Crop Sci. 201 (3), 189–194. doi: 10.1111/jac.12116
Barrett, J. C., Fry, B., Maller, J., Daly, M. J. (2005). ) ‘Haploview : analysis and visualization of LD and haplotype maps’. Bioinformatics 21 (2), 263–265. doi: 10.1093/bioinformatics/bth457
Bates, D., Kliegl, R., Vasishth, S., Baayen, R. H. (2015). ‘Parsimonious mixed models’. arXiv 1506, 4967. doi: 10.48550/arXiv.1506.04967
Bhatta, M., Stephen Baenziger, P., Waters, B. M., Poudel, R., Belamkar, V., Poland, J., et al. (2018). ‘Genome-wide association study reveals novel genomic regions associated with 10- grain minerals in synthetic hexaploid wheat’ Int. J. Mol. Sci. 19 (10), 3011. doi: 10.3390/ijms19103237
Bolser, D. M., Staines, D. M., Perry, E., Kersey, P. J. (2017). Ensembl plants: integrating tools for visualizing, mining, and analyzing plant genomic data. Plant Genomics Databases: Methods Protoc., 1–31. doi: 10.1007/978-1-4939-3167-5_6
Bouslama, M., Schapaugh, W. T. (1984). ‘Stress tolerance in soybean. part 1. evaluation of three screening techniques for heat and drought tolerance.’. Crop Sci. 24 pp, 933–937. doi: 10.2135/cropsci1984.0011183x002400050026x
Chaichi, M., Sanjarian, F., Razavi, K., Gonzalez-hernandez, J. L. (2019). ‘Analysis of transcriptional responses in root tissue of bread wheat landrace ( triticum aestivum l .) reveals drought avoidance mechanisms under water scarcity’. PloS One 14 (3), e0212671. doi: 10.1371/journal.pone.0212671
Chun, H. J., Lim, L. H., Cheong, M. S., Baek, D., Park, M. S., Cho, H. M., et al. (2021). ‘Arabidopsis CCoAOMT1 plays a role in drought stress response via ROS- and ABA-dependent manners’. Plants 10 (5), 831. doi: 10.3390/plants10050831
Danakumara, T., Kumari, J., Singh, A. K., Sinha, S. K. (2021). ‘Genetic dissection of seedling root system architectural traits in a diverse panel of hexaploid wheat through multi-locus genome-wide association mapping for improving drought tolerance’. Int. J. Mol. Sci. 22 (13), 7188. doi: 10.3390/ijms22137188
Hoagland, D. R., Arnon, D. I. (1950). The water-culture method for growing plants without soil. Calif. Agric. Exp. Station Circ. 347, 1–32. doi: 10.1016/S0140-6736(00)73482-9
Dodig, D., Zoric, M., Jovic, M., Kandic, V., Stanisavljevic, R., Surlan-momirovic, G. (2015). Wheat seedlings growth response to water deficiency and how it correlates with adult plant tolerance to drought. J. Agric. Sci. 153 (3), 466–480. doi: 10.1017/S002185961400029X
Duque, P., Chua, N. (2003). IMB1 , a bromodomain protein induced during seed imbibition , regulates ABA- and phyA-mediated responses of germination in arabidopsis. Plant J. 35 (6), 787–799. doi: 10.1046/j.1365-313X.2003.01848.x
Earl, D. A., Bridgett, M. (2012). ‘STRUCTURE HARVESTER : a website and program for visualizing STRUCTURE output and implementing the evanno method’. Conserv. Genet. Resour. 4, 359–361. doi: 10.1007/s12686-011-9548-7
El Gataa, Z., Samir, K., Tadesse, W. (2022). ‘Genetic dissection of drought tolerance of elite bread wheat (Triticum aestivum l.) genotypes using genome wide association study in morocco’. Plants 11 (20), 2705. doi: 10.3390/plants11202705
Evanno, G., Regnaut, S., Goudet, J. (2005). ‘Detecting the number of clusters of individuals using the software STRUCTURE : a simulation study’. Mol. Ecol. 14 (8), 2611–2620. doi: 10.1111/j.1365-294X.2005.02553.x
Fatiukha, A., Deblieck, M., Klymiuk, V., Merchuk-ovnat, L., Peleg, Z., Ordon, F., et al. (2021). ‘Genomic architecture of phenotypic plasticity in response to water stress in tetraploid wheat’. Int. J. Mol. Sci. 22 (4), 1723. doi: 10.3390/ijms22041723
Fernandez, G. C. J., Kuo, C. G. (1992). "Effective selection criteria for assessing plant stress tolerance," in Adaptation of Food Crops to Temperature and Water Stress. Ed. Kuo, C. G., Proceedings of the International Symposium, August 13-18 (1992) Tainan, Taiwan 257–270.
Figueroa-bustos, V., Palta, J. A., Chen, Y., Siddique, K. H. M. (2018). ‘Characterization of root and shoot traits in wheat cultivars with putative differences in root system size’. Agronomy 8 (7), 109. doi: 10.3390/agronomy8070109
Fischer, R. A., Maurer, R. (1978). Drought resistance in spring wheat cultivars. i. grain yield response. Aust. J. Agricult. Res. 29 (5), 897–912. doi: 10.1071/AR9780897
Gahlaut, V., Jaiswal, V., Singh, S., Balyan, H. S., Gupta, P. K. (2019). Multi-locus genome wide association mapping for yield and its contributing traits in hexaploid wheat under different water regimes. Sci. Rep. 9 (1), 1–15. doi: 10.1038/s41598-019-55520-0
Gahlaut, V., Jaiswal, V., Balyan, H. S., Joshi, A. K., Gupta, P. K. (2021). Multi-locus GWAS for grain weight-related traits under rain-fed conditions in common wheat (Triticum aestivum l.). Front. Plant Sci. 2266. doi: 10.3389/fpls.2021.758631
Gataa, Z., Hanafi, S., Messoadi, K., Samir, K., Kehel, Z., Tadesse, W. (2021). ‘Genome wide association and prediction studies of agronomic and quality traits in spring beard wheat ( triticum aestivum l .) under rain-fed environment with terminal moisture stress’. J. Cereal Sci. 101 (6), p. doi: 10.1016/j.jcs.2021.103278
Gill, T., Gill, S. K., Saini, D. K., Chopra, Y., de Koff, J. P., Sandhu, K. S. (2022). A comprehensive review of high throughput phenotyping and machine learning for plant stress phenotyping. Phenomics 2 (3), 156–183. doi: 10.1007/s43657-022-00048-z
Gill, H. S., Halder, J., Zhang, J., Rana, A., Kleinjan, J., Amand, P. S., et al. (2022). Whole-genome analysis of hard winter wheat germplasm identifies genomic regions associated with spike and kernel traits. Theor. Appl. Genet. 135 (9), 2953–2967. doi: 10.1007/s00122-022-04160-6
Graybosch, R. A., Peterson, C. J. (2010). Genetic improvement in winter wheat yields in the great plains of north america 1959-2008. Crop Sci. 50 (5), 1882–1890. doi: 10.2135/cropsci2009.11.0685
Halder, J., Zhang, J., Ali, S., Sidhu, J. S., Gill, H. S., Talukder, S. K., et al. (2019). Mining and genomic characterization of resistance to tan spot, stagonospora nodorum blotch (SNB), and fusarium head blight in Watkins core collection of wheat landraces. BMC Plant Biol. 19 (1), 1–15. doi: 10.1186/s12870-019-2093-3
Han, S., Song, J., Noh, Y., Noh, B., Biotechnology, E., Core, N., et al. (2006). Role of plant CBP / p300-like genes in the regulation of flowering time. Plant J. 49 (1), 103–114. doi: 10.1111/j.1365-313X.2006.02939.x
Hanif, M., Gao, F., Liu, J., Wen, W. (2016). TaTGW6 - A1 , an ortholog of rice TGW6 , is associated with grain weight and yield in bread wheat. Mol. Breed. 36 (1), 1–8. doi: 10.1007/s11032-015-0425-z
Harrison, S., Laforgia, M. (2019). Seedling traits predict drought-induced mortality linked to diversity loss. Proc. Natl. Acad. Sci. 116 (12), 5576–5581. doi: 10.1073/pnas.1818543116
Hassan, M. A., Yanga, M., Rasheeda, A., Yang, G., Matthew Reynold, X. X., Xiao, Y., et al. (2019). Plant science a rapid monitoring of NDVI across the wheat growth cycle for grain yield prediction using a multi-spectral UAV platform. Plant Sci. 282 (10), 95–103. doi: 10.1016/j.plantsci.2018.10.022
Hill, W. G., Weir, B. S. (1988). Variances and covariances of squared linkage disequilibria in finite populations. Theor. Popul. Biol. 33, 54–78. doi: 10.1016/0040-5809(88)90004-4
Hossain, A., Teixeira, J. A. (2013). ‘Wheat production in Bangladesh : its future in the light of global warming’. AoB Plants 5, 1–24. doi: 10.1093/aobpla/pls042
Hunter, S., Apweiler, R., Attwood, T. K., Bairoch, A., Bateman, A., Binns, D., et al. (2009). InterPro: the integrative protein signature database. Nucleic Acids Res. 37, D211–D215. doi: 10.1093/nar/gkn785
Ihsan, M. Z., El-Nakhlawy, F. S., Ismail, S. M., Fahad, S., Daur, I. (2016). ‘Wheat phenological development and growth studies as affected by drought and late season high temperature stress under arid environment’. Front. Plant Sci. 7 (6). doi: 10.3389/fpls.2016.00795
Islam, M., Begum, M. C., Kabir, A. H., Alam, M. F. (2015). ‘Molecular and biochemical mechanisms associated with differential responses to drought tolerance in wheat ( triticum aestivum l .)’. J. Plant Interact. 10, 195–201. doi: 10.1080/17429145.2015.1064174
Itam, M., Mega, R., Tadano, S., Abdelrahman, M., Matsunaga, S., Yamasaki, Y., et al. (2020). Metabolic and physiological responses to progressive drought stress in bread wheat. Sci. Rep. 10 (1), 1–14. doi: 10.1038/s41598-020-74303-6
Joshi, A. K., Mishra, B., Chatrath, R., OrtizFerrara, G., Singh, R. P. (2007). ‘Wheat improvement in India: present status, emerging challenges and future prospects’. Euphytica 157, 431–446. doi: 10.1007/s10681-007-9385-7
Kulkarni, M., Soolanayakanahally, R., Ogawa, S., Uga, Y., Selvaraj, M. G., Kagale, S. (2017). ) ‘Drought response in wheat: key genes and regulatory mechanisms controlling root system architecture and transpiration efficiency’. Front. Chem. 5 (12). doi: 10.3389/fchem.2017.00106
Kumar, S., Pratap, V., Dinesh, S., Saini, K. (2021). ‘Meta − QTLs , ortho − MQTLs , and candidate genes for thermotolerance in wheat ( triticum aestivum l .)’. Mol. Breed. 41, 1–21. doi: 10.1007/s11032-021-01264-7
Kumar, S., Sehgal, S. K., Kumar, U., Prasad, P. V. V., Joshi, A. K., Gill, B. S. (2012). Genomic characterization of drought tolerance-related traits in spring wheat. Euphytica 186, 265–276. doi: 10.1007/s10681-012-0675-3
Kuzay, S., Xu, Y., Zhang, J., Katz, A., Pearce, S., Su, Z., et al. (2019). ‘Identification of a candidate gene for a QTL for spikelet number per spike on wheat chromosome arm 7AL by high − resolution genetic mapping’. Theor. Appl. Genet. 132 (9), 2689–2705. doi: 10.1007/s00122-019-03382-5
Lan, J. (1998). ‘Comparison of evaluating methods for agronomic drought resistance in crops’. Acta Agriculturae Boreali-occidentalis Sin. 7, 85–87.
Li, X., Ingvordsen, C. H., Weiss, M., Rebetzke, G. J., Condon, A. G., James, R. A., et al. (2019). Deeper roots associated with cooler canopies, higher normalized difference vegetation index, and greater yield in three wheat populations grown on stored soil water. J. Exp. Bot. 70 (18), 4963–4974. doi: 10.1093/jxb/erz232
Li, X., Waddington, S. R., Dixon, J., Joshi, A. K., de Vicente, M. C. (2011). ‘The relative importance of drought and other water-related constraints for major food crops in south Asian farming systems’. Food Secur. 3 (1), 19–33. doi: 10.1007/s12571-011-0111-x
Lim, J., Lim, C. W., Lee, S. C. (2020). ‘Pepper novel serine-threonine kinase CaDIK1 regulates drought tolerance via modulating ABA sensitivity’. Front. Plant Sci. 11 (7). doi: 10.3389/fpls.2020.01133
Liu, H., Searle, I. R., Mather, D. E., Able, A. J., Able, J. A. (2015). Morphological, physiological and yield responses of durum wheat to pre-anthesis water-deficit stress are genotype-dependent. Crop Pasture Sci. 66 (10), 1024–1038. doi: 10.1071/CP15013
Lopes, M. S., Dreisigacker, S., Peña, R. J., Sukumaran, S., Reynolds, M. P. (2015). Genetic characterization of the wheat association mapping initiative (WAMI) panel for dissection of complex traits in spring wheat. Theor. Appl. Genet. 128 (3), 453–464. doi: 10.1007/s00122-014-2444-2
Lopes, M. S., Reynolds, M. P. (2012). Stay-green in spring wheat can be determined by spectral reflectance measurements (normalized difference vegetation index) independently from phenology. J. Exp. Bot. 63 (10), 3789–3798. doi: 10.1093/JXB/ERS071
Ma, L., Li, T., Hao, C., Wang, Y., Chen, X., Zhang, X. (2016). TaGS5-3A , a grain size gene selected during wheat improvement for larger kernel and yield. Plant Biotechnol. J. 14 (5), 1269–1280. doi: 10.1111/pbi.12492
Manickavelu, A., Kawaura, K., Oishi, K., Shin-I, T., Kohara, Y., Yahiaoui, N., et al. (2012). Comprehensive functional analyses of expressed sequence tags in common wheat (Triticum aestivum). DNA Res. 19 (2), 165–177. doi: 10.1093/dnares/dss001
Mathew, I., Shimelis, H., Shayanowako, A. I. T., Laing, M., Chaplot, V. (2019). Genome-wide association study of drought tolerance and biomass allocation in wheat. PloS One 14 (12), 1–21. doi: 10.1371/journal.pone.0225383
Metsalu, T., Vilo, J. (2015). ClustVis: a web tool for visualizing clustering of multivariate data using principal component analysis and heatmap. Nucleic Acids Res. 43, W566–W570. doi: 10.1093/nar/gkv468
Maulana, F., Huang, W., Anderson, J. D., Ma, X.-F. (2020). Genome-wide association mapping of seedling drought tolerance in winter wheat. Front. Plant Sci. 11 (10). doi: 10.3389/fpls.2020.573786
Muhammad, A., Hu, W., Li, Z., Li, J., Xie, G., Wang, J., et al. (2020). ‘Appraising the genetic architecture of kernel traits in hexaploid wheat using GWAS’. Int. J. Mol. Sci. 21, 5649. doi: 10.3390/ijms21165649
Mwadzingeni, L., Shimelis, H., Rees, D. J. G., Tsilo, T. J. (2017). ‘Genome-wide association analysis of agronomic traits in wheat under drought-stressed and non-stressed conditions’. PLoS One 12 (2), e0171692. doi: 10.1371/journal.pone.0171692
Pal, N., Saini, D. K., Kumar, S. (2022). Breaking yield ceiling in Wheat: Progress and future prospects (India: Wheat. Intech.Open. ). doi: 10.5772/intechopen.102919
Pang, Y., Liu, C., Wang, D., St. Amand, P., Bernardo, A., Li, W., et al. (2020). High-resolution genome-wide association study identifies genomic regions and candidate genes for important agronomic traits in wheat. Mol. Plant 13 (9), 1311–1327. doi: 10.1016/j.molp.2020.07.008
Patil, I. (2021). ‘Visualizations with statistical details : the “ ggstatsplot “ approach’. J. Open Source Software 6, 3167. doi: 10.21105/joss.03167
Praba, M. L., Cairns, J. E., Babu, R. C., Lafitte, H. R. (2009). Identification of physiological traits underlying cultivar differences in drought tolerance in rice and wheat. J. Agron. Crop Sci. 195 (1), 30–46. doi: 10.1111/j.1439-037X.2008.00341.x
Pritchard, J. K., Stephens, M., Donnelly, P. (2000). ‘Inference of population structure using multilocus genotype data’. Genetics 155 (2), 945–959.
Qaseem, M. F., Qureshi, R., Shaheen, H. (2019). ‘Effects of pre-anthesis drought, heat and their combination on the growth, yield and physiology of diverse wheat (Triticum aestivum l.) genotypes varying in sensitivity to heat and drought stress’. Sci. Rep. 9 (1), 6955. doi: 10.1038/s41598-019-43477-z
Rabbi, S. M. H. A., Kumar, A., Naraghi, S. M., Simsek, S., Kianian, S., Missaoui, A., et al. (2021). ‘Genome-wide association mapping for yield and related traits under drought stressed and non-stressed environments in wheat’. Front. Genet. 12 (6). doi: 10.3389/fgene.2021.649988
Rabieyan, E., Bihamta, M. R., Moghaddam, M. E. (2022). ‘Genome − wide association mapping and genomic prediction of agronomical traits and breeding values in Iranian wheat under rain − fed and well − watered conditions’. BMC Genomics 23 (1), 1–25. doi: 10.1186/s12864-022-08968-w
Ramírez-González, R. H., Borrill, P., Lang, D., Harrington, S. A., J.B., L., Davey, M., et al. (2018). ‘The transcriptional landscape of polyploid wheat’. Science 361, p. doi: 10.1126/science.aar6089
R Core Team (2013). R: a language and environment for statistical computing (Vienna, Austria: R Foundation for Statistical Computing).
Reddy, S. S., Singh, G. M., Kumar, U., Bhati, P., Navathe, S., Yashavanthakumar, K. J., et al. (2023). ‘Spatio-temporal evaluation of drought adaptation in wheat revealed NDVI and MTSI as powerful tools for selecting tolerant genotypes’. bioRxiv, 2023–2001. doi: 10.1101/2023.01.29.526148v1.abstract
Rehman, S. U., Wang, J., Chang, X., Zhang, X., Mao, X., Jing, R. (2019). ‘A wheat protein kinase gene TaSnRK2 . 9 − 5A associated with yield contributing traits’. Theor. Appl. Genetics 132(4), 907–919. doi: 10.1007/s00122-018-3247-7
Rosielle, A. A., Hamblin, J. (1981). Theoretical aspects of selection for yield in stress and non-stress environment. Crop Sci. 21 (6), 943–946. doi: 10.2135/cropsci1981.0011183X002100060033x
Rufo, R., Salvi, S., Royo, C., Soriano, J. M. (2020). ‘Exploring the genetic architecture of root-related traits in Mediterranean bread wheat landraces by genome-wide association analysis’. Agronomy 10 (5), 613. doi: 10.3390/agronomy10050613
Safdar, L., Andleeb, T., Latif, S., Umer, M. J. (2020). ‘Genome-wide association study and QTL meta-analysis identi fi ed novel genomic loci controlling potassium use ef fi ciency and agronomic traits in bread wheat’. Front. Plant Sci. 11 (2). doi: 10.3389/fpls.2020.00070
Saini, D. K., Chopra, Y., Singh, J., Sandhu, K. S., Kumar, A., Bazzer, S., et al. (2022). Comprehensive evaluation of mapping complex traits in wheat using genome-wide association studies. Mol. Breed 42, 1. doi: 10.1007/s11032-021-01272-7
Sallam, A., Alqudah, A. M., Dawood, M. F. A., Baenziger, P. S., Borner, A. (2019). ‘Drought stress tolerance in wheat and barley: advances in physiology, breeding and genetics research’. Int. J. Mol. Sci. 20 (13), 3137. doi: 10.3390/ijms20133137
Sallam, A., Eltaher, S., Alqudah, A. M., Belamkar, V., Baenziger, P. S. (2022). ‘Genomics combined GWAS and QTL mapping revealed candidate genes and SNP network controlling recovery and tolerance traits associated with drought tolerance in seedling winter wheat’. Genomics 114 (3), 110358. doi: 10.1016/j.ygeno.2022.110358
Sallam, A., Mourad, A. M. I., Hussain, W., Stephen Baenziger, P. (2018). Genetic variation in drought tolerance at seedling stage and grain yield in low rainfall environments in wheat (Triticum aestivum l.). Euphytica 214 (9), 1–18. doi: 10.1007/S10681-018-2245-9/FIGURES/7
Shahinnia, F., Tula, S., Hensel, G., Reiahisamani, N. (2021). ‘Plastid-targeted cyanobacterial flavodiiron proteins maintain carbohydrate turnover and enhance drought stress tolerance in barley’. Front. Plant Sci. 11. doi: 10.3389/fpls.2020.613731
Sharma, M. A., Singh, A. M., Shankar, A. L. K. A., Pandey, A. M., Baranwal, V. I., Kapoor, S. A., et al. (2014). ‘Comprehensive expression analysis of rice armadillo gene family during abiotic stress and development’. DNA Res. 21 (3), 267–283. doi: 10.1093/dnares/dst056
Shelake, R. M., Kadam, U. S., Kumar, R., Pramanik, D., Singh, A. K., Kim, J. (2022). ‘Engineering drought and salinity tolerance traits in crops through CRISPR-mediated genome editing : targets , tools , challenges , and perspectives’. Plant Commun. 6), 100417. doi: 10.1016/j.xplc.2022.100417
Shokat, S., Sehgal, D., Liu, F., Singh, S. (2020). ‘GWAS analysis of wheat pre-breeding germplasm for terminal drought stress using next generation sequencing technology’. Preprints 21, 3156. doi: 10.20944/preprints202002.0272.v1
Sidhu, J. S., Singh, D., Gill, H. S., Brar, N. K., Qiu, Y., Halder, J., et al. (2020). Genome-wide association study uncovers novel genomic regions associated with coleoptile length in hard winter wheat. Front. Genet. 10 (2). doi: 10.3389/fgene.2019.01345
Singh, R. P., Huerta-Espino, J., Sharma, R., Joshi, A. K., Trethowan, R. (2007). High yielding spring bread wheat germplasm for global irrigated and rainfed production systems. Euphytica 157 (3), 351–363. doi: 10.1007/s10681-006-9346-6
Singh, K., Saini, D. K., Saripalli, G., Batra, R., Gautam, T., Singh, R., et al. (2022). ‘WheatQTLdb V2 . 0 : a supplement to the database for wheat’. Mol. Breed. 42 (10), 56. doi: 10.1007/s11032-022-01329-1
Sukumaran, S., Reynolds, M. P., Sansaloni, C. (2018). ‘Genome-wide association analyses identify QTL hotspots for yield and component traits in durum wheat grown under yield potential, drought, and heat stress environments’. Front. Plant Sci. 9 (2). doi: 10.3389/fpls.2018.00081
Sultana, S. R., Ali, A., Ahmad, A., Mubeen, M., Ahmad, S., Ercisli, S., et al. (2014). ‘Normalized difference vegetation index as a tool for wheat yield Estimation : a case study from faisalabad Vol. 2014(1) (Pakistan: The Scientific World Journal).
Sun, H., Zhang, W., Wu, Y., Gao, L., Cui, F. (2020). ‘The circadian clock gene , TaPRR1 , is associated with yield-related traits in wheat ( triticum aestivum l .)’. Front. Plant Sci. 11 (3). doi: 10.3389/fpls.2020.00285
Tanin, M. J., Saini, D. K., Sandhu, K. S., Pal, N., Gudi, S., Chaudhary, J., et al. (2022). Consensus genomic regions associated with multiple abiotic stress tolerance in wheat and implications for wheat breeding. Sci. Rep. 12 (1), 1–17. doi: 10.1038/s41598-022-18149-0
Thapa, S., Jessup, K. E., Pradhan, G. P., Rudd, J. C., Liu, S., Mahan, J. R., et al. (2018). Field crops research canopy temperature depression at grain filling correlates to winter wheat yield in the U.S. southern high plains Field Crops Res. 217 (12), 11–19. doi: 10.1016/j.fcr.2017.12.005
Wang, W., Vinocur, B., Shoseyov, O., Altman, A. (2004). Role of plant heat-shock proteins and molecular chaperones in the abiotic stress response. Trends Plant Sci. 9 (5), 244–252. doi: 10.1016/j.tplants.2004.03.006
Wang, S., Wong, D., Forrest, K., Allen, A., Chao, S., Huang, B. E., et al. (2014). Characterization of polyploid wheat genomic diversity using a high-density 90 000 single nucleotide polymorphism array. Plant Biotechnol. J. 12 (6), 787–796. doi: 10.1111/pbi.12183
Wang, J., Zhang, Z. (2021). ‘GAPIT version 3 : boosting power and accuracy for genomic’, Genomics. Proteomics Bioinf. 19 (4), 629–640. doi: 10.1016/j.gpb.2021.08.005
Xiao, Q., Bai, X., Zhang, C., He, Y. (2022). Advanced high-throughput plant phenotyping techniques for genome-wide association studies: a review. J. Advanced Res. 35, 215–230. doi: 10.1016/j.jare.2021.05.002
Yang, J., Zhou, Y., Wu, Q., Chen, Y., Zhang, P., Weiguo, Z. (2019). ‘Molecular characterization of a novel TaGL3 − 5A allele and its association with grain length in wheat ( triticum aestivum l .)’. Theor. Appl. Genet. 132 (6), 1799–1814. doi: 10.1007/s00122-019-03316-1
Yu, J., Pressoir, G., Briggs, W. H., Bi, I. V., Yamasaki, M., Doebley, J. F., et al. (2006). A unified mixed-model method for association mapping that accounts for multiple levels of relatedness. Nat. Genet. 38 (2), 203–208. doi: 10.1038/ng1702
Yue, A., Li, A., Mao, X., Chang, X., Li, R., Jing, R. (2015). Identification and development of a functional marker from 6-SFT-A2 associated with grain weight in wheat. Mol. Breed. 35 (2), 1–10. doi: 10.1007/s11032-015-0266-9
Zampieri, M., Ceglar, A., Dentener, F., Toreti, A. (2017). ‘Wheat yield loss attributable to heat waves, drought and water excess at the global, national and subnational scales’. Environ. Res. Lett. 16, 064008. doi: 10.1088/1748-9326/aa723b
Zang, Y., Gong, Y., Wang, Q., Guo, H., Xiao, W. (2020). Arabidopsis OTU1, a linkage-specific deubiquitinase, is required for endoplasmic reticulum-associated protein degradation. Plant J. 101 (1), 141–155. doi: 10.1111/tpj.14524
Zhang, J., Gill, H. S., Halder, J., Brar, N. K., Ali, S., Bernardo, A., et al. (2022). Multi-locus genome-wide association studies to characterize fusarium head blight (FHB) resistance in hard winter wheat. Front. Plant Sci. 13 (7). doi: 10.3389/fpls.2022.946700
Zhang, Y., Liu, J., Xia, X. (2014). TaGS - D1 , an ortholog of rice OsGS3 , is associated with grain weight and grain length in common wheat. Mol. Breed. 34, 1097–1107. doi: 10.1007/s11032-014-0102-7
Zhang, Z., Lv, G., Li, B., Wang, J., Zhao, Y., Kong, F., et al. (2017). ‘Isolation and characterization of the TaSnRK2 . 10 gene and its association with agronomic traits in wheat ( triticum aestivum l .)’. PLoS one 12(3), e0174425. doi: 10.1371/journal.pone.0174425
Zhang, B., Xu, W., Liu2, X., Mao, X., Li, A., Wang, J., et al. (2017). ‘Functional conservation and divergence among homoeologs of TaSPL20 and TaSPL21,Two SBP-box genes governing yield-related traits in hexaploid wheat’. Plant Physiol. 174 (6), 1177–1191, pp. doi: 10.1104/pp.17.00113
Zhang, P., Yan, X., Weldu, T., Zhou, Y., Yang, E., Xia, X. (2021). ‘Genome − wide association mapping of leaf rust and stripe rust resistance in wheat accessions using the 90K SNP array’. Theor. Appl. Genet. 134 (4), 1233–1251. doi: 10.1007/s00122-021-03769-3
Keywords: drought, hydroponics, seedling, reproductive, wheat, GWAS, haplotype
Citation: Reddy SS, Saini DK, Singh GM, Sharma S, Mishra VK and Joshi AK (2023) Genome-wide association mapping of genomic regions associated with drought stress tolerance at seedling and reproductive stages in bread wheat. Front. Plant Sci. 14:1166439. doi: 10.3389/fpls.2023.1166439
Received: 15 February 2023; Accepted: 14 April 2023;
Published: 12 May 2023.
Edited by:
Suprasanna Penna, Bhabha Atomic Research Centre (BARC), IndiaReviewed by:
Harshraj Shinde, University of Kentucky, United StatesCopyright © 2023 Reddy, Saini, Singh, Sharma, Mishra and Joshi. This is an open-access article distributed under the terms of the Creative Commons Attribution License (CC BY). The use, distribution or reproduction in other forums is permitted, provided the original author(s) and the copyright owner(s) are credited and that the original publication in this journal is cited, in accordance with accepted academic practice. No use, distribution or reproduction is permitted which does not comply with these terms.
*Correspondence: Sandeep Sharma, c2tzYmh1QGdtYWlsLmNvbQ==; Vinod Kumar Mishra, dmttaXNocmEuZ3BiQGJodS5hYy5pbg==
†Present address: Dinesh Kumar Saini, Department of Agronomy, Horticulture and Plant Science, South Dakota State University, Brookings, SD, United States
‡These authors contributed equally to this work
Disclaimer: All claims expressed in this article are solely those of the authors and do not necessarily represent those of their affiliated organizations, or those of the publisher, the editors and the reviewers. Any product that may be evaluated in this article or claim that may be made by its manufacturer is not guaranteed or endorsed by the publisher.
Research integrity at Frontiers
Learn more about the work of our research integrity team to safeguard the quality of each article we publish.