 Hengjia Zhang
 Zeyi Wang
 Shouchao Yu1
94% of researchers rate our articles as excellent or good
Learn more about the work of our research integrity team to safeguard the quality of each article we publish.
Find out more
ORIGINAL RESEARCH article
Front. Plant Sci., 16 June 2023
Sec. Plant Abiotic Stress
Volume 14 - 2023 | https://doi.org/10.3389/fpls.2023.1153835
This article is part of the Research TopicAbiotic Stress in Plants: Sustainability and ProductivityView all 13 articles
To investigate the evapotranspiration and crop coefficient of oasis watermelon under water deficit (WD), mild (60%–70% field capacity, FC)and moderate (50%–60% FC) WD levels were set up at the various growth stages of watermelon, including seedling stage (SS), vine stage (VS), flowering and fruiting stage (FS), expansion stage (ES), and maturity stage (MS), with adequate water supply (70%–80% FC) during the growing season as a control. A two-year (2020-2021) field trial was carried out in the Hexi oasis area of China to explore the effect of WD on watermelon evapotranspiration characteristics and crop coefficient under sub-membrane drip irrigation. The results indicated that the daily reference crop evapotranspiration showed a sawtooth fluctuation which was extremely significantly and positively correlated with temperature, sunshine hours, and wind speed. The water consumption during the entire growing season of watermelon varied from 281–323 mm (2020) and 290–334 mm (2021), among which the phasic evapotranspiration valued the maximum during ES, accounting for 37.85% (2020) and 38.94% (2021) in total, followed in the order of VS, SS, MS, and FS. The evapotranspiration intensity of watermelon increased rapidly from SS to VS, reaching the maximum with 5.82 mm·d-1 at ES, after which it gradually decreased. The crop coefficient at SS, VS, FS, ES, and MS varied from 0.400 to 0.477, from 0.550 to 0.771, from 0.824 to 1.168, from 0.910 to 1.247, and from 0.541 to 0.803, respectively. Any period of WD reduced the crop coefficient and evapotranspiration intensity of watermelon at that stage. And then the relationship between LAI and crop coefficient can be characterized better by an exponential regression, thereby establishing a model for estimating the evapotranspiration of watermelon with a Nash efficiency coefficient of 0.9 or more. Hence, the water demand characteristics of oasis watermelon differ significantly during different growth stages, and reasonable irrigation and water control management measures need to be conducted in conjunction with the water requirements features of each growth stage. Also, this work aims to provide a theoretical basis for the irrigation management of watermelon under sub-membrane drip irrigation in desert oases of cold and arid environments.
Desert oases are an essential barrier to guaranteeing regional food and ecological security. In the interior of northwest China, the oasis agricultural region of Hexi features a temperate continental desert climate with little to no annual rainfall and a severe water resource constraint (Deng et al., 2017). As is well known, oasis agriculture is dominated by irrigated agriculture, so without irrigation, there would be no agriculture (Li et al., 2016). The proportion of agricultural water use in the total water resources of the Hexi area is the largest, at 88.40% (Wang et al., 2019). At present, agricultural cultivation in most areas of the Hexi Oasis region still uses the traditional check-field flood irrigation, with its backward and unreasonable irrigation techniques and low water use efficiency (WUE) (Wang et al., 2020a). Moreover, together with the long years of machine well extraction, this has led to the overexploitation of local groundwater resources, aggravating the degree of arable desert and deteriorating the ecological environment (Chai et al., 2014). Although, the area has long sunshine hours, a short frost-free period, abundant light and heat resources, and a 15–20°C temperature difference between day and night, all of which make it an ideal base for melon cultivation (Yang et al., 2018; Li et al., 2022a). A shortage of water resources and water waste in the region (Huang et al., 2017; Zhou et al., 2022), along with the recent blind expansion of watermelon and other specialty cash crops, has severely hampered the development of the local watermelon industry. Thus, studies on water consumption and evapotranspiration of oasis watermelon under water deficit conditions are of vital practical value for water resources deployment and to ensure stable and high watermelon yields.
The production of special melons in the oasis is a highly advantageous enterprise. But the watermelon’s growth can be significantly affected by changes in water availability because of its high water requirements and sensitivity to soil moisture (Leskovar et al., 2007; Zhang et al., 2009). During certain growth periods maintaining an appropriate water deficit (WD) not only enhances the conversion of photosynthetic products to fruits but also suppresses excessive nutrient growth in the above-ground parts and promotes root growth, thereby improving yield and quality (Rahmati et al., 2018; Zuniga et al., 2018). The results of a study using daily evaporation from the water surface of the evaporation dish as the water control criterion showed that the overall benefits for watermelon were best when the evaporation coefficients were determined at 0.75, 0.75, 1.25, and 1.00 for the seedling (SS), flowering and fruiting (FS), expansion (ES) and maturity (MS) stages in that order (Lin et al., 2010). As for the study that used drip irrigation frequency as a water control criterion, the recommended drip irrigation system for greenhouse watermelon in the arid zone was one drip every four days at both SS and ES, while one drip every two days at FS and one drip every six days at MS (Liu et al., 2014). In addition, the results of the experiment by Wu and Wang (2008) showed that soil water content (SWC) in watermelon fields was controlled at 70.92%–81.24% while leaf area index (LAI) was between 1.44–1.32, which both enhanced leaf photosynthetic efficiency and promoted the accumulation of assimilates. Kuscu et al. (2015) achieved an optimum balance between water productivity, quantity, and quality in watermelon fruits under semi-humid conditions with 100% crop evapotranspiration (ETc) before maturity and 50% ETc recovery afterward. Accordingly, by scientifically managing the water demand pattern during the watermelon’s growing season in the oasis, high-quality and efficient ecological watermelon cultivation may be achieved.
Evapotranspiration (ET) is a critical component of farmland water balance during the hydrologic cycle, which has a significant effect on crop development and yield (Cui et al., 2008b). The water in farmland under sub-membrane drip irrigation is mainly consumed by ETc (Skaggs et al., 2010; Feng et al., 2018). Thus, accurate estimation of ETc is crucial to reducing water consumption during the crop reproductive period, improving WUE, and developing water-saving agriculture (Liu et al., 2002; He et al., 2013). There are two main methods for calculating ETc: one is a direct calculation approach, and the other uses the reference crop evapotranspiration (ET0) and the crop coefficient (Kc). Since most of the direct calculation methods are empirical formulas with strong geographical limitations, the prevailing method is based on ET0 (Liu et al., 2009). Related studies have indicated that the ET0 calculated using the Penman-Monteith (P-M) is the closest to the measured values in both humid and arid regions, so it is a preferred calculation method that is widely used (Allen et al., 1989; Allen et al., 2011).
The LAI is an essential growth indicator that reflects the quality of crop population and is strongly linked to photosynthesis, transpiration, and water productivity (Zhao et al., 2018; Wang et al., 2021). A study has shown that variation in plant leaf area has a substantially greater effect on evapotranspiration than that of variation in the climate and that climatic factors have a stronger influence on evapotranspiration indirectly through plant cover (Yang et al., 2022). As well known, Kc is relevant to LAI dynamics, intercepted solar radiation, and crop phenological stage (Netzer et al., 2009). Meanwhile, crop stage water requirement is equal to the product of stage ET0 and Kc (Meng, 2011).
For apple trees under irrigated conditions, Du et al. (2017) discovered a positive correlation between transpiration and LAI, while Juhasz and Hrotko (2014) reached the same conclusion for the Hungarian sweet cherry. Munitz et al. (2019) reported a significant linear relationship between LAI and Kc for irrigated vineyards, i.e., Kc could be estimated by measuring the LAI of the vineyard and combining it with meteorological data from neighboring weather stations to calculate ET0, and then ETc is obtained. As can be seen, it is feasible to establish a regression model of LAI against Kc (Zhang et al., 2019). However, Kc is greatly influenced by environmental conditions such as climate, soil, and degree of WD in different areas (Wang et al., 2020b). Therefore, investigating the relationship between LAI and Kc under WD conditions is critically valuable for accurately predicting oasis watermelon ET in the Hexi region.
In conclusion, a model can be established to estimate the ET of oasis watermelon in the Hexi region using LAI and meteorological factors, thereby letting the model to master the dynamic water consumption law of local watermelon during various growth periods, which has excellent practical significance for enhancing the level of watermelon precision management, formulating a reasonable water dynamic management plan, and maintaining the stability of fruit yield. However, there exists a seriously limited knowledge in the Hexi region about the water consumption characteristics of watermelon under mulched drip irrigation, and studies on the determination of Kc and ET estimation models for oasis watermelon have not been reported. Therefore, the aims of this study were: (1) to analyze the stages evapotranspiration characteristics of oasis watermelon under WD and its change law; (2) to accurately calculate ET0 during the reproductive period of watermelon based on the PM equation and then invert Kc of oasis watermelon; and (3) to establish an estimation model of oasis watermelon evapotranspiration, thereby achieving precise irrigation at various growth phases of oasis watermelon and effectively improving the water productivity in the Hexi region.
The experiment was conducted from May to August 2020 and 2021 at the Yimin Irrigation Experiment Station (100°43′ E, 38°39′ N, altitude: 1,970 m, total area: 20 mu), which is a joint scientific research and training base of Gansu Agricultural University. The test site is in a typical desert oasis of China’s northwestern arid region, where the annual average temperature is 6°C, the frost-free period is 165 days, the annual precipitation mostly ranges between 183–285 mm, the annual average evaporation is 2,000 mm, the annual average sunshine hours is 3,000 h, and the climate is temperate continental grassland. The soil texture of the test site is a light loam with a soil bulk density of 1.4 g·cm-3 and a pH of 7.2. The field capacity (FC) of tilled soil is 24.0% (mass water content), and the wilting point is 8.2%. The salinization hazard is negligible due to the large depth of groundwater burial.
The watermelon variety tested was the “Xinong 8,” a local main planting. The main growth period of oasis watermelon was divided into five stages: seedling stage (SS), vine stage (VS), flowering and fruiting stage (FS), expansion stage (ES), and maturity stage (MS). Deep plowing, weeding, fertilizer application, drip irrigation, and mulching were carried out before sowing so that the initial conditions of water and nutrients in each plot were similar. Planting was done manually by breaking the film in a north-south direction, with two rows at 30 cm × 210 cm spacing in each plot. The irrigation method was sub-membrane drip irrigation, with one pipe controlling one row of crops and the length of the pipe equaling the length of the plot. Specific agronomic management measures are presented in Table 1.
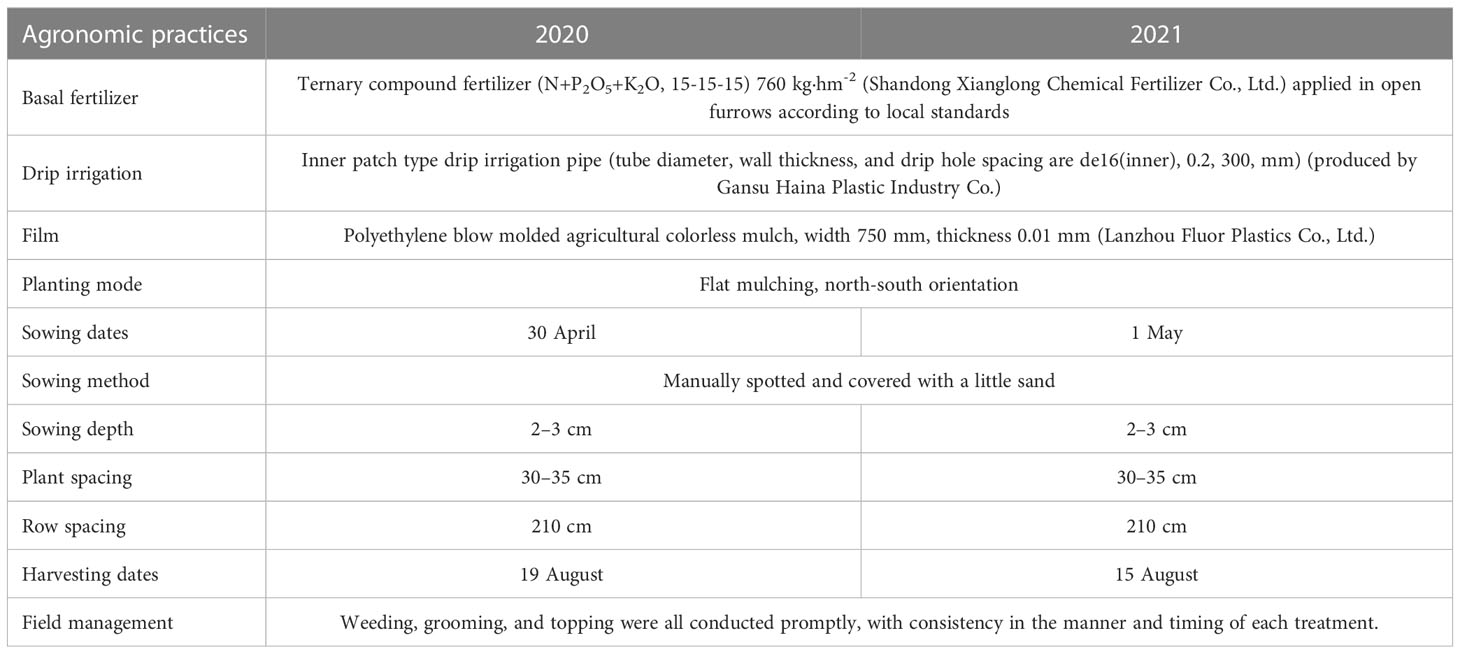
Table 1 Agronomic management practices in the oasis watermelon trial plots.
The experiment was a one-way completely randomized design. WD treatments were applied mainly at the watermelon SS, VS, ES, and MS. The amount of irrigation was calculated as the average SWC as a percentage of the FC in the planned wet layer (0–60 cm), and irrigation was applied immediately to the upper limit when the measured SWC was below (or close to) the design lower limit of the treatment. A total of nine treatments were set up, with three replications of each treatment, in which suitable irrigation was performed throughout the reproductive period and served as the control treatment. The specific experimental design scheme is illustrated in Table 2.
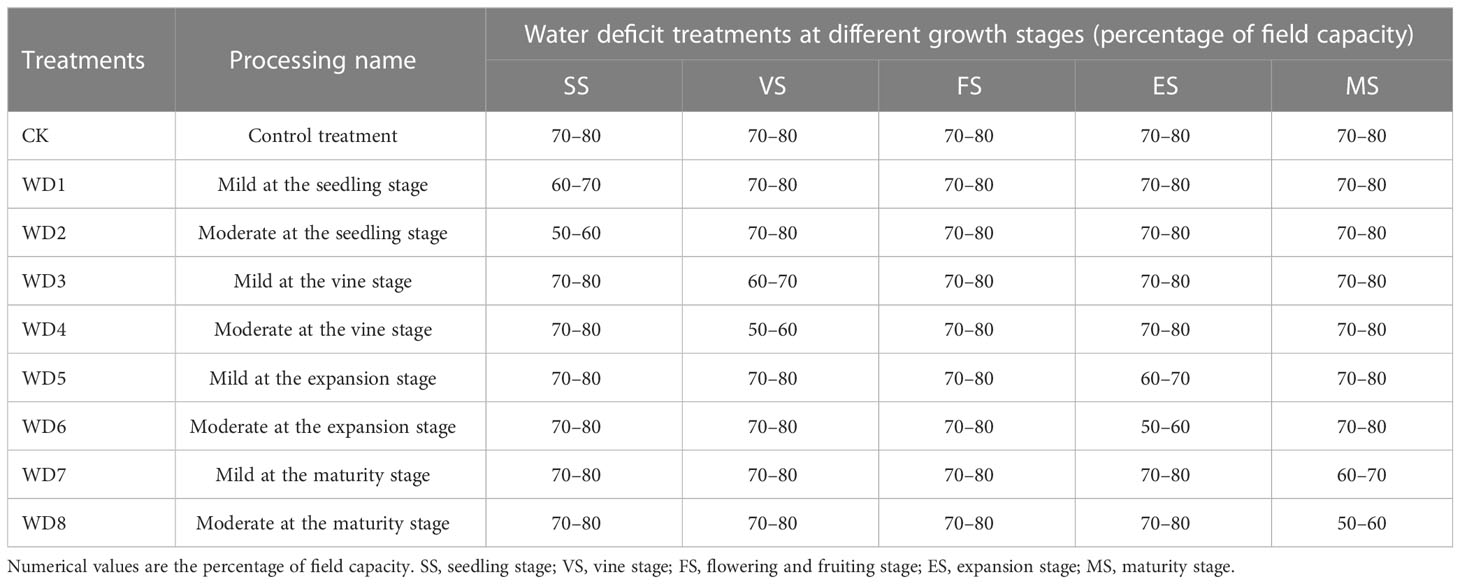
Table 2 The experimental design scheme of oasis watermelon.
Meteorological data was achieved from a fully automatic weather station located at the experimental site. Meteorological factors such as precipitation (P), air temperature (T), relative humidity (RH), sunshine hours (n), wind speed (u), wind direction, and air pressure were automatically measured in the test area.
The SWC of the planned wet layer (sampled every 20 cm) was determined layer by layer using the dry method every 7–10 days after the start of the treatment, with the sampling points randomly selected in the middle of two watermelon plants and the average value taken to determine the amount and timing of irrigation, with additional measurements before and after irrigation.
The non-linear regression equation for single leaf area (LA) against leaf width (w) was established according to the reference (Zheng, 2009): LA = exp-0.096w1.758, where the determination coefficient R2 = 0.912 (p< 0.01). The LAI was gained by calculating the total LA of all plants per unit of land and then comparing it to the land area.
Crop evapotranspiration (ETc) was calculated by using the water balance equation (Cui et al., 2008a).
where Pr is the effective precipitation in each period (mm); U is the groundwater recharge (mm), the test site is in an inland arid area, the groundwater burial depth is below 20 m, so the groundwater recharge can be neglected, i.e., U=0. I is the amount of irrigation water during the period (mm); D is the amount of deep seepage (mm), because the soil moisture design is lower than the field capacity, and the design flow rate of under-film drip irrigation is 2 L·h-1, there is no deep seepage problem, so the amount of deep seepage is negligible, i.e., D=0; S is the surface runoff (mm), the test field is in flat mulching, there is no surface runoff, i.e., S=0; ΔW is the change of soil water storage in the 0–100 cm-layer during the period (mm).
Hence, Eq. (1) can be simplified as follows.
ΔW and I in Eq. (2) are calculated as follows.
where θi2 and θi1 are the volumetric SWC of i-layer at the end and beginning of the calculation period, respectively (%); Hi is the thickness of i-layer (mm); I is the volume of single irrigation (mm); ρ is the soil bulk density (g·cm-3); H is the depth of the plan wetted layer (cm); p is the design wetting ratio, 0.65 is taken for this test; θmax is the design upper limit of SWC (%); θt is the SWC before irrigation (%); η is the irrigation water utilization ratio, taken as 0.95 in this experiment.
The stage evapotranspiration intensity and water consumption modulus can be found in Wei et al. (2017).
ET0 was calculated using the Penman-Monteith (P-M) formula, strongly recommended by FAO 1998 (Allen et al., 1998).
where ET0 is the reference crop evapotranspiration (mm); Rn is the net radiation (MJ·m-2·d-1); G is the soil heat flux (MJ·m-2·d-1); Δ is the slope of the saturation water vapor pressure against temperature curve (kPa·°C-1); γ is the hygrometer constant (kPa·°C-1); T is the mean air temperature (°C); u2 is the wind speed at a height of 2 m above ground (m·s-1); es is the saturation water vapor pressure of air (kPa); ea is the actual water vapor pressure of air (kPa).
The crop coefficient (Kc) under no WD conditions is determined by the ratio of evapotranspiration under adequate water supply conditions to the ET0. This is calculated by Eq. (6).
where Kc0 is the Kc without water stress; ETc is the evapotranspiration under adequate water supply (mm); ET0 is the reference crop evapotranspiration (mm).
When soil moisture is insufficient, the Kc is not only affected by meteorological factors and the crop’s characteristics but also by the SWC. Therefore, the moisture stress coefficient is introduced into the calculation of the Kc. The moisture stress coefficient is derived from the evapotranspiration measured under WD conditions, the ET0, and the Kc0 (Allen et al., 1998) and is calculated as follows.
where Ks is the water stress coefficient; ETWD is the evapotranspiration under water stress conditions (mm); ET0 is the reference crop evapotranspiration (mm).
The Kc is calculated as follows.
The correlation coefficient (r), Nash efficiency coefficient (NSE), and total equilibrium coefficient (R) were considered as statistical coefficients to evaluate the merits of the ET estimation model (Wang et al., 2014). The error analysis was performed quantitatively using average relative error (ARE) and mean absolute percentage errors (MAPE).
The average and standard deviation (± SD) of the data were calculated in Microsoft Excel 2010 (Microsoft Corp., Raymond, Washington, USA). The software Origin 2020 (Origin Lab, Corp., Hampton, Massachusetts, USA) was used for graphing and regression analysis. Significance analysis with Duncan’s multiple range test was performed at a 5% level using SPSS 19.0 (IBM, Inc., New York, USA).
The daily ET0 variation and effective rainfall distribution for oasis watermelon during two consecutive growing seasons from 2020–2021 are indicated in Figures 1A, B. We can see from Figure 1, the daily ET0 fluctuated in a sawtooth pattern with sharp fluctuations, especially in late July and early August, but the overall trend was relatively stable, with the peak occurring from late July to early August. Moreover, the higher ET0 was concentrated after the fruit set, among which the frequency of daily variation was higher in 2020 and reached a peak of 6.40 mm on 28 July, while the frequency of daily variation was relatively low in 2021 and reached a maximum of 6.66 mm on 1 August. This is mainly related to the climatic characteristics (temperature) of the trial site. Besides, the distribution of rainfall also showed that the greater the daily rainfall on a rainy day, the smaller the corresponding daily ET0, with a negative correlation between them.
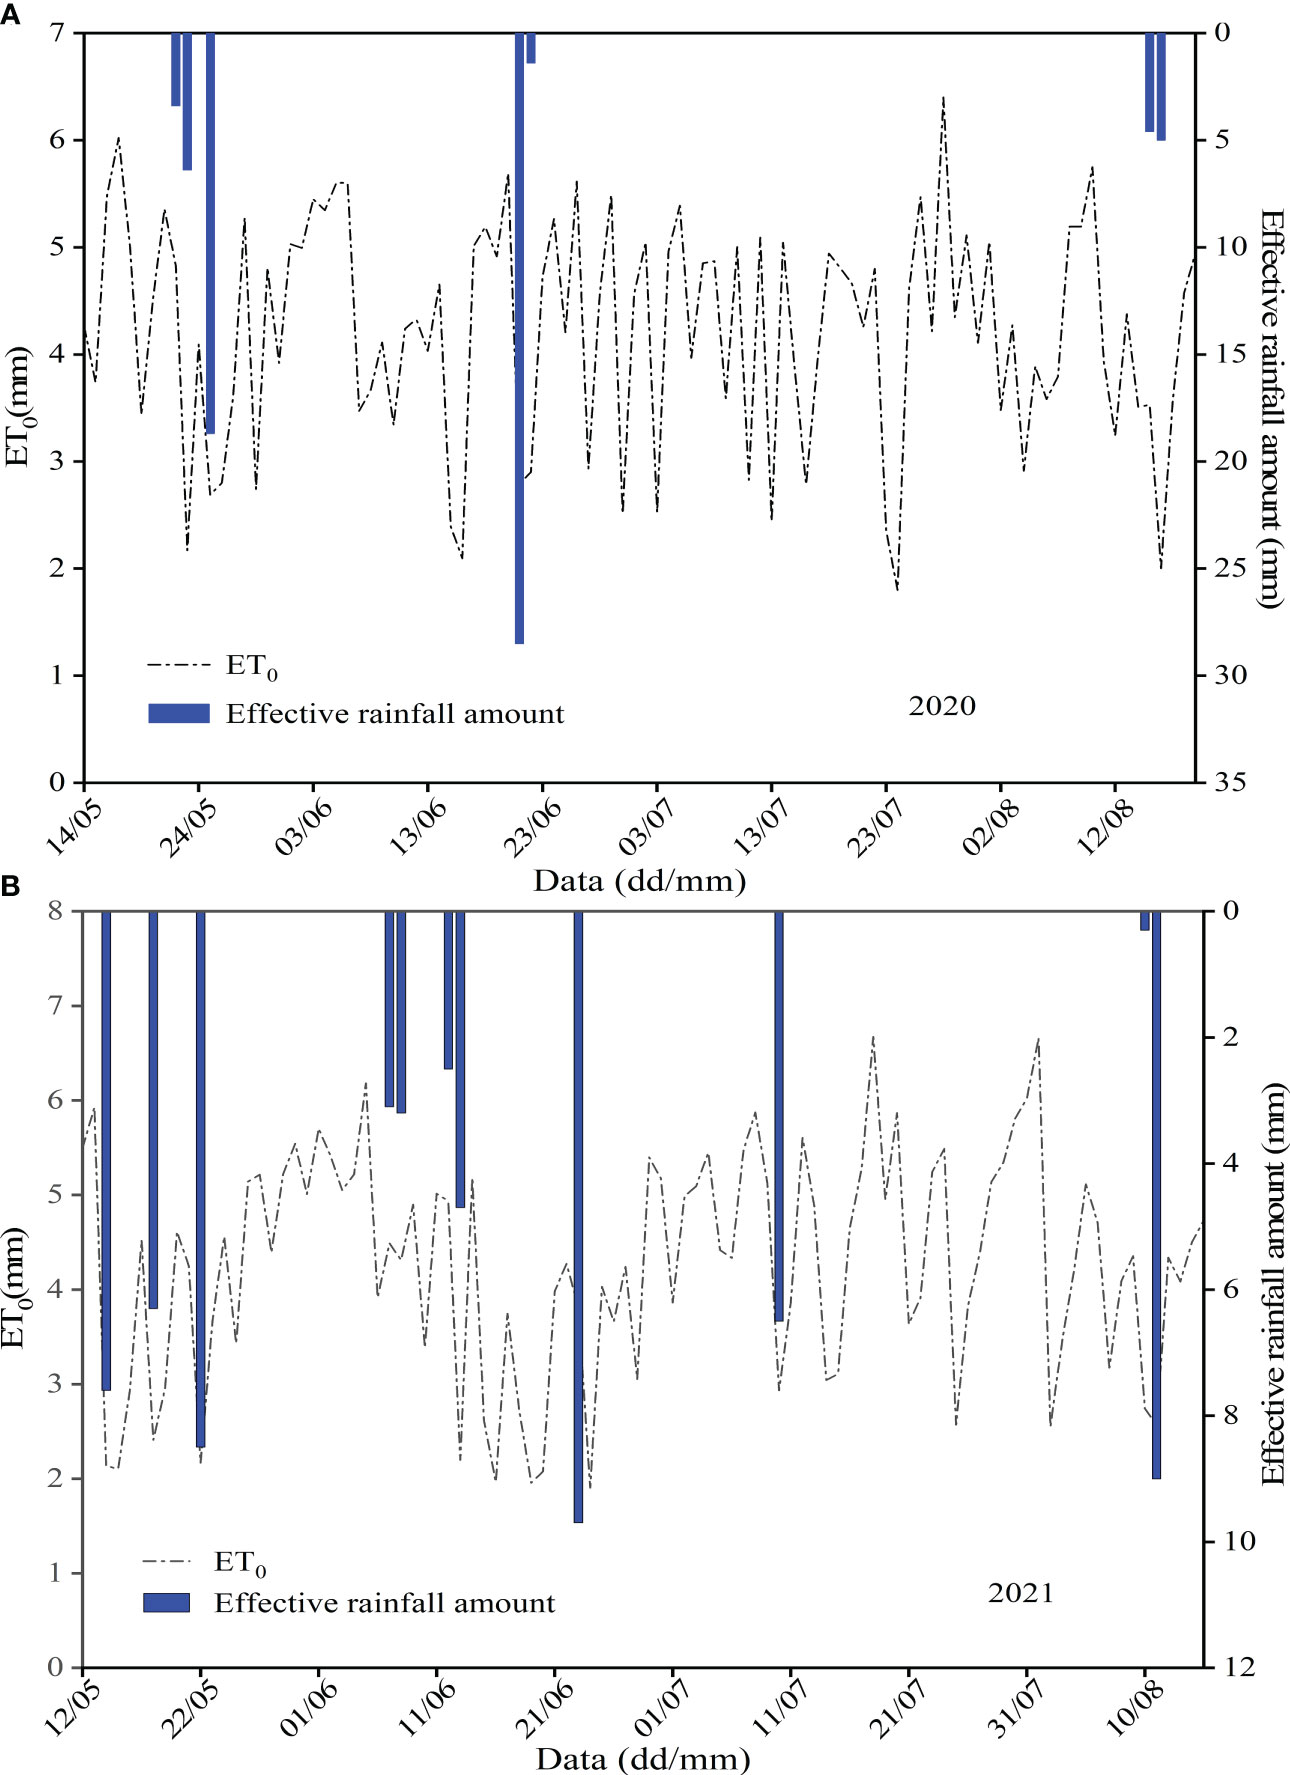
Figure 1 Variation of daily ET0 and effective precipitation distribution during the growing season of oasis watermelon in 2020 (A) and 2021 (B).
As seen in Figure 1, the effective rainfall during the watermelon reproductive period in 2020 was 68 mm, and the rainfall during the SS, VS, FS, ES, and MS was 28.50 mm, 29.90 mm, 0.00 mm, 0.00 mm, and 9.60 mm, respectively, with the highest rainfall of 28.5 mm on 21 June. Similarly, it can be seen that the effective rainfall in 2021 for different growth stages and the whole reproductive period was 28.70 mm, 16.90 mm, 0.00 mm, 6.50 mm, 9.30 mm, and 61.40 mm, respectively. The largest amount of rainfall was 9.7 mm on 23 June. It can be concluded that irrigation should be controlled during the SS in watermelon cultivation to avoid excessive irrigation consuming the less water-demanding reproductive period, and on the contrary, timely irrigation is required during the melon ES to replenish soil water to avoid WD. It is also clear from Figure 1 that the ET0 of stage cumulative was highest at the VS (128.32 mm in 2020 and 117.17 mm in 2021), while the ET0 of the FS was relatively lowest because of its shortest duration (19.30 mm in 2020 and 23.27 mm in 2021). The mean of daily ET0 results was highest at SS and lowest at FS in 2020, highest at ES and lowest at VS in 2021.
ET0 and its composition for different growing periods of oasis watermelon in the Hexi region are illustrated in Table 3. The ET0 calculated by the P-M equation is derived from the sum of the solar radiation term (ETrp) and the aerodynamic term (ETop), both of which constitute the effect on the ET0 (Glasbey and Allcroft, 2008). As can be seen in Table 3, the proportion of ETrp in each stage of oasis watermelon (in 2020, for example) was 71.48%, 76.67%, 80.09%, 78.14%, and 75.97%, in that order. The proportion of ETrp in ET0 showed a single-peak trend of increasing and then decreasing as the growth period progressed and increased to the largest proportion at FS and ES. Meanwhile, the weight of ETrp influencing ET0 was greater than 70%, much higher than ETop, while the total ETrp share was 75.60% throughout the growing season. This is mainly because the respective ratios of ETrp and ETop are affected by the regional geography and climatic environment and change over time. The Hexi Oasis lies in the interior, where there is an enormous amount of ETrp rather than ETop in ET0 due to the region’s arid environment, lack of precipitation, high evaporation intensity, and long daylight hours.
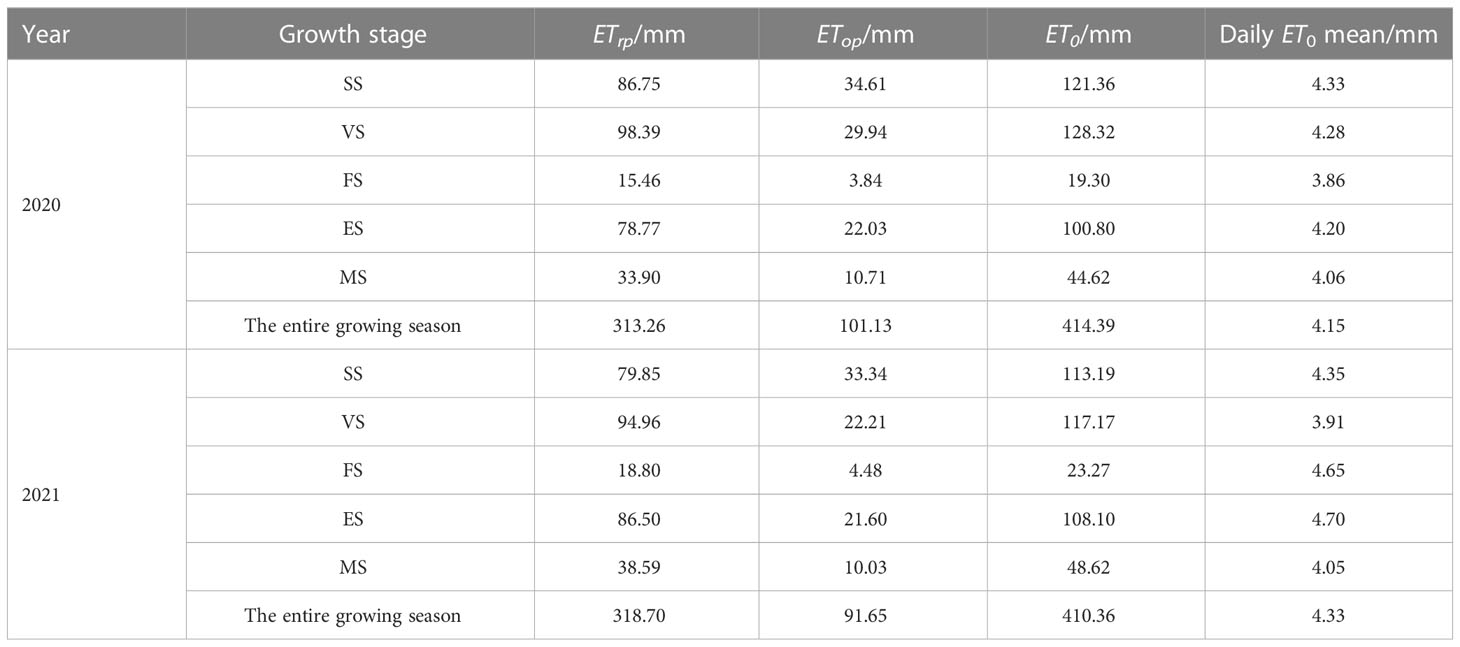
Table 3 Cumulative ET0 and its composition for oasis watermelon.
The results of the ET0 calculation are directly influenced by the meteorological factors needed in the P-M equation. Due to the unique climatic conditions of the Hexi Oasis region, it is imperative to examine the correlations between the following meteorological variables: daily maximum temperature (Tmax), daily minimum temperature (Tmin), daily mean temperature (Tmean), sunshine hours (n), atmospheric pressure (P), relative air humidity (RH), water vapor pressure (ea), wind speed (u2) and ET0, as well as the correlation between ET0 and meteorological data under the interaction of multiple factors. The meteorological data for 2021 was used as an example in the study that was done above.
Figure 2 presents the bivariate correlation analysis between meteorological factors and ET0 during the watermelon growing season. The Pearson correlation analysis shows that ET0 had a highly significant positive correlation with Tmax, Tmean, n, and u2 whose coefficients were 0.721, 0.644, 0.870, and 0.392, respectively; a significant positive correlation with Tmin whose coefficient was 0.234; and a negative correlation with P, RH, and ea whose coefficients were -0.439, -0.761, and -0.195, which were negatively correlated.
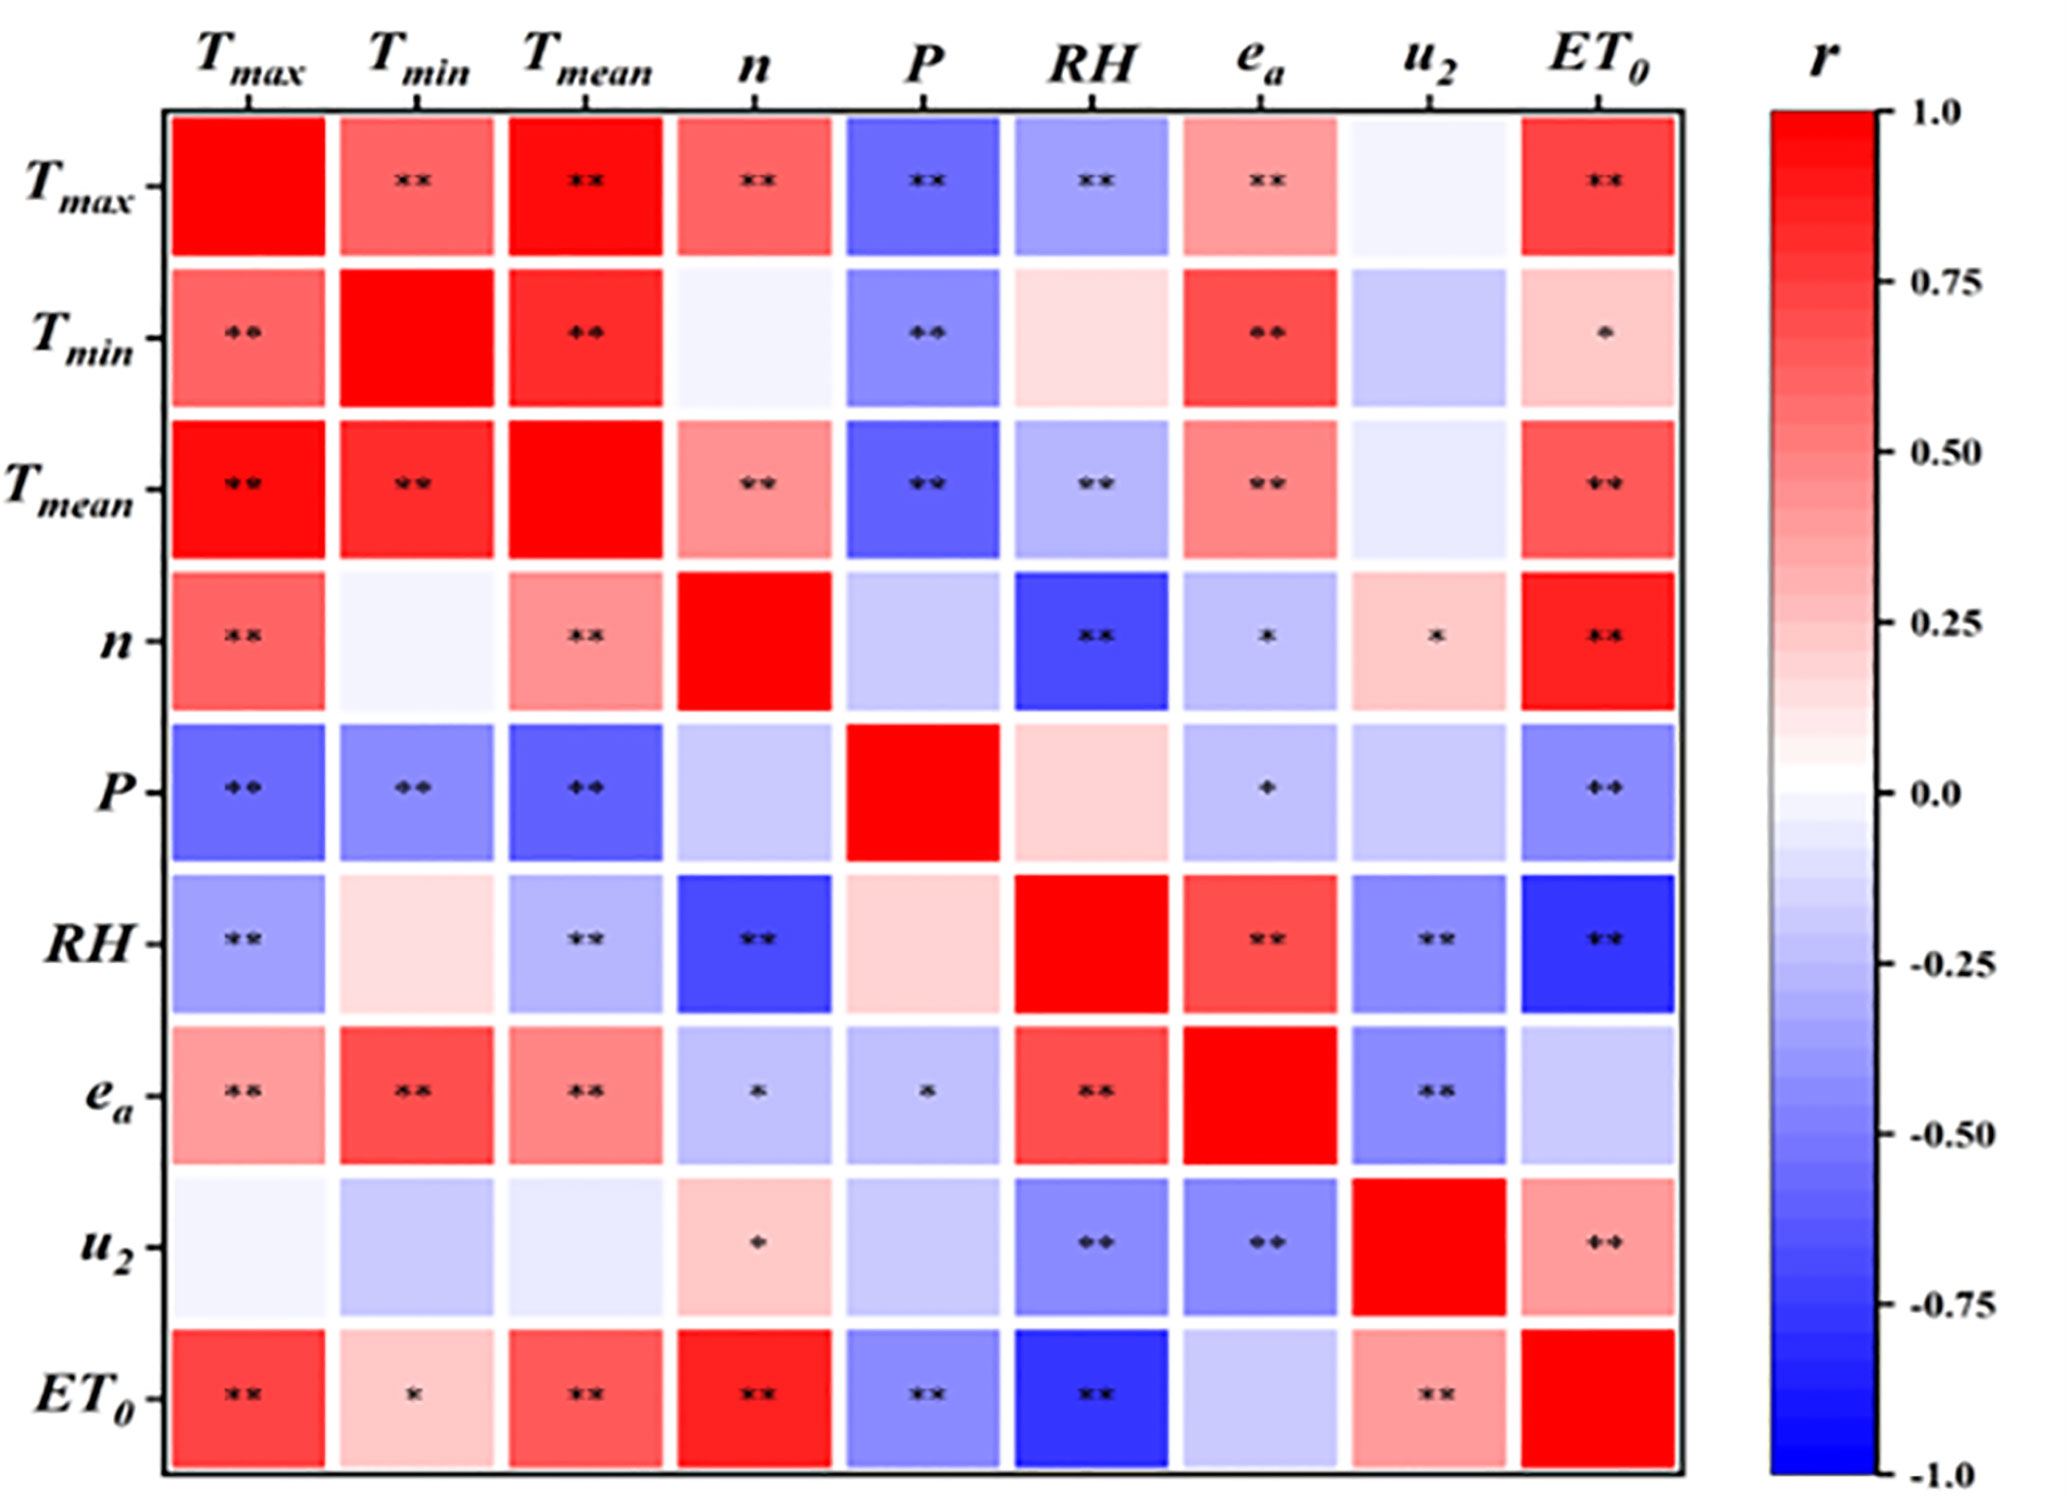
Figure 2 Correlation analysis of ET0 and meteorological elements during the watermelon growing period in 2021. Correlations between the two indicators were significant at *p< 0.05 and **p< 0.01. Tmax, daily maximum temperature; Tmin, daily minimum temperature; Tmean, daily mean temperature; n, sunshine hours; P, atmospheric pressure; RH, relative air humidity; ea, water vapor pressure; u2, wind speed.
Figures 3A–H shows the functional correlation between a particular meteorological factor and ET0 during the watermelon growing season. From Figure 3, we can see that Tmax, Tmean, n, and RH were highly correlated with ET0 with an R2 > 0.4 (p< 0.05); and P was somewhat negatively correlated with ET0, but the R2 was only 0.1933. While Tmin, ea, and u2 did not demonstrate a functional relationship for the effect of ET0. With an R2 of 0.757, both T and n were significantly and positively correlated with ET0, indicating that temperature, sunshine duration, and wind speeds had a significant promoting effect on ET0.
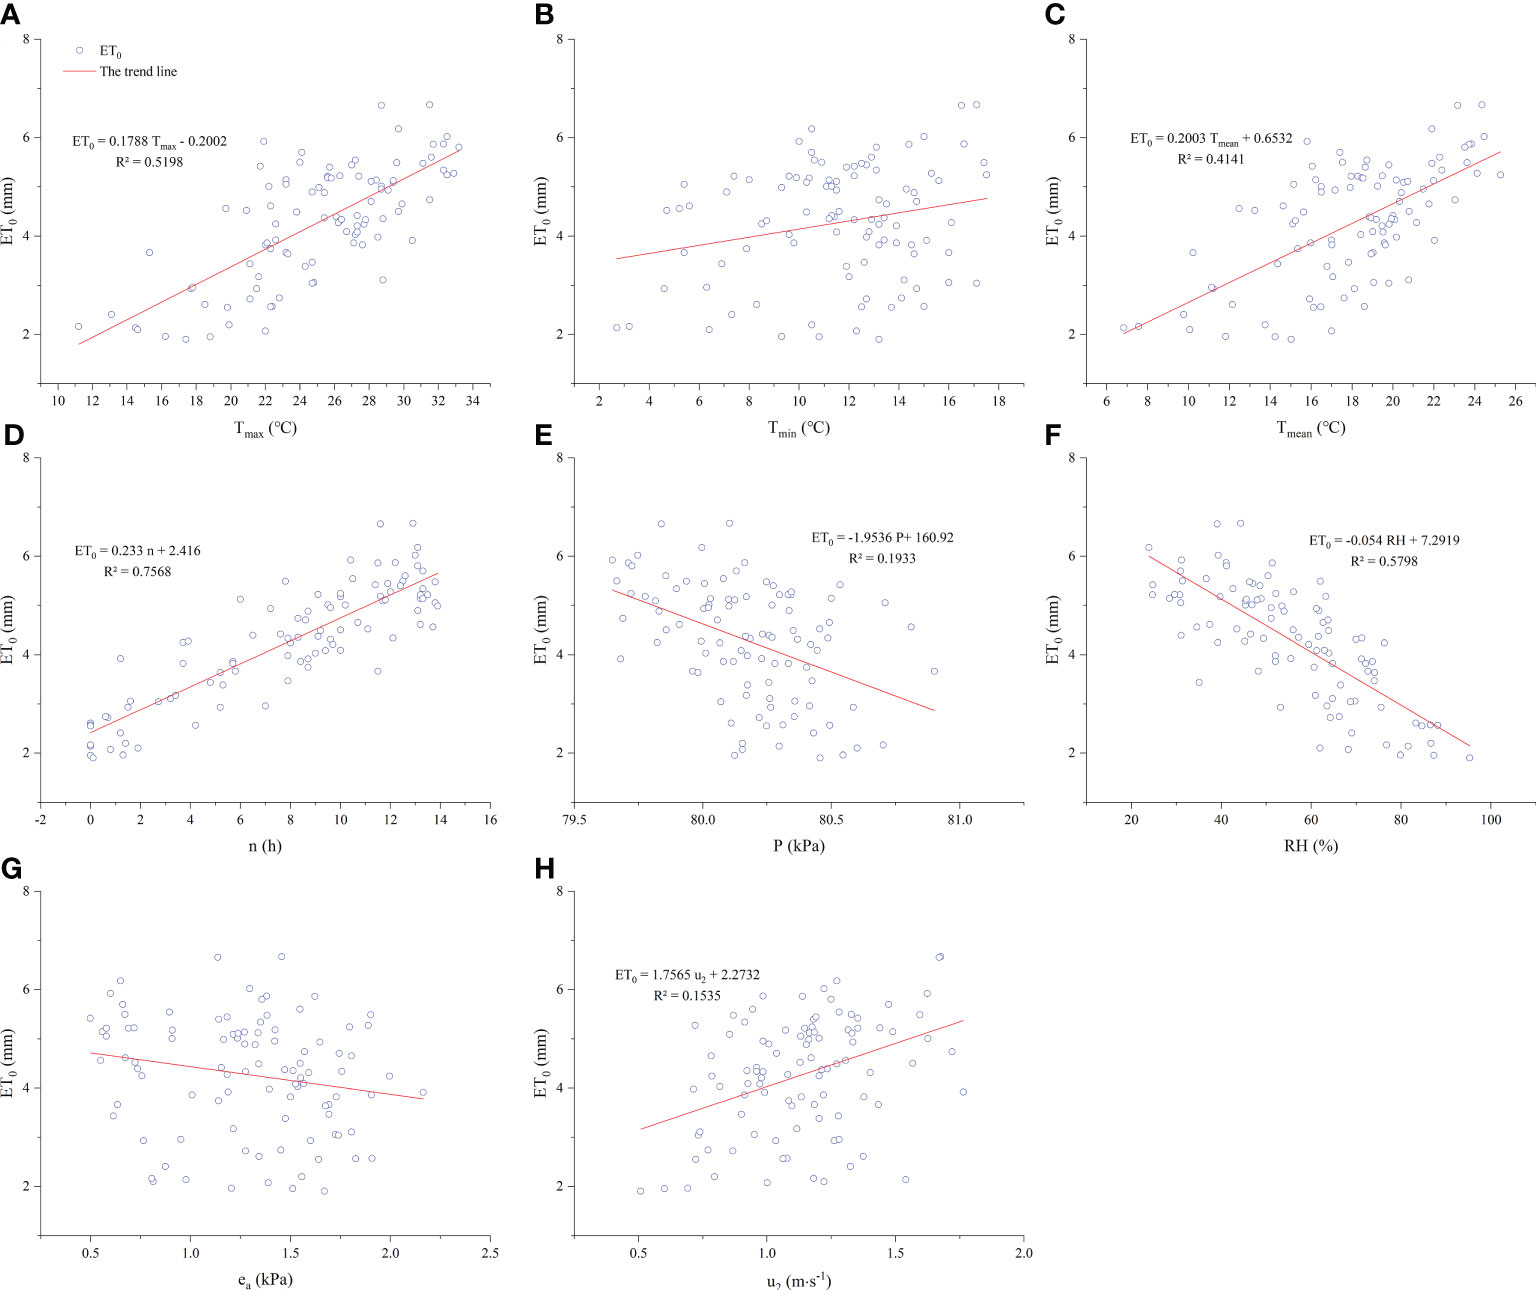
Figure 3 Relationships between meteorological elements and ET0 during the growing season in 2021. (A–H) describes the relationship between daily maximum temperature (Tmax), daily minimum temperature (Tmin), daily mean temperature (Tmean), sunshine hours (n), atmospheric pressure (P), relative air humidity (RH), water vapour pressure (ea), wind speed (u2) and reference crop evapotranspiration (ET0), respectively.
The r and significance analysis was subsequently computed for each step to conduct a thorough investigation into the relationship between ET0 and various climatic parameters within each growth stage. The results are displayed in Figure 4. The correlations between meteorological factors and total ET0 during the entire growing season were consistent with the results of the above analysis. The correlations between ET0 and each meteorological factor within different growth stages had co-factor influences, although there was some variability. Both the r of n at FS and P at MS with ET0 were 0.823 and 0.509, but neither was statistically significant. This was mostly because the growing time was not significantly affected by the relatively small sample size. Tmin peaked at the SS and became extremely significant, but they were unimportant at all other growth stages and had negative correlations at the VS and MS. While u2 demonstrated a highly significant positive correlation at both the VS and ES with no significant influence at any other stage, ea displayed a highly significant negative correlation at both the SS and the ES.
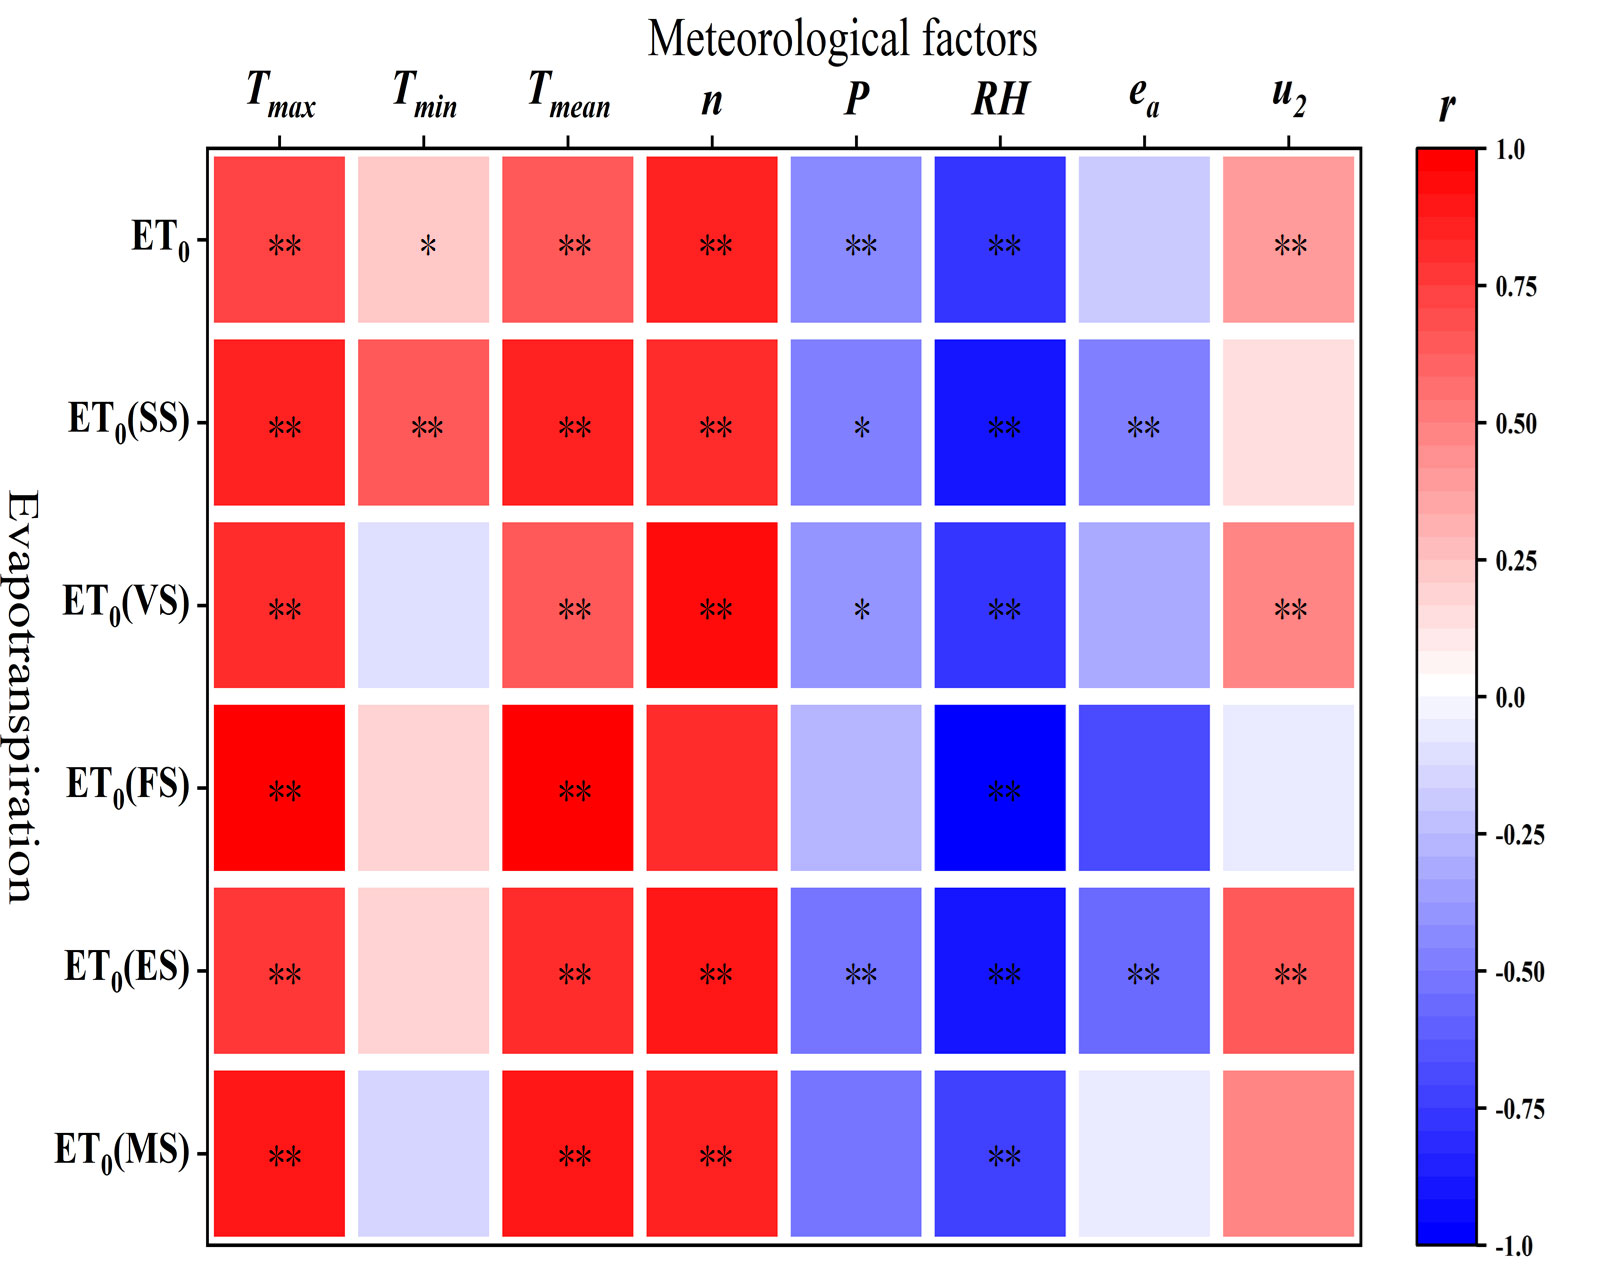
Figure 4 Correlation analysis of ET0 and meteorological elements during the watermelon growth period. * and ** represent significance at the p<0.05 and 0.01 levels , respectively.
To further explore the role of multiple factors in driving the dependent variable, a multiple linear regression equation was constructed between ET0 and the meteorological parameters subsumed in its calculation for the watermelon growing season and each period. Table 4 displays the specific results, and the R2 was all above 0.9 (p< 0.01), which was a better fit.
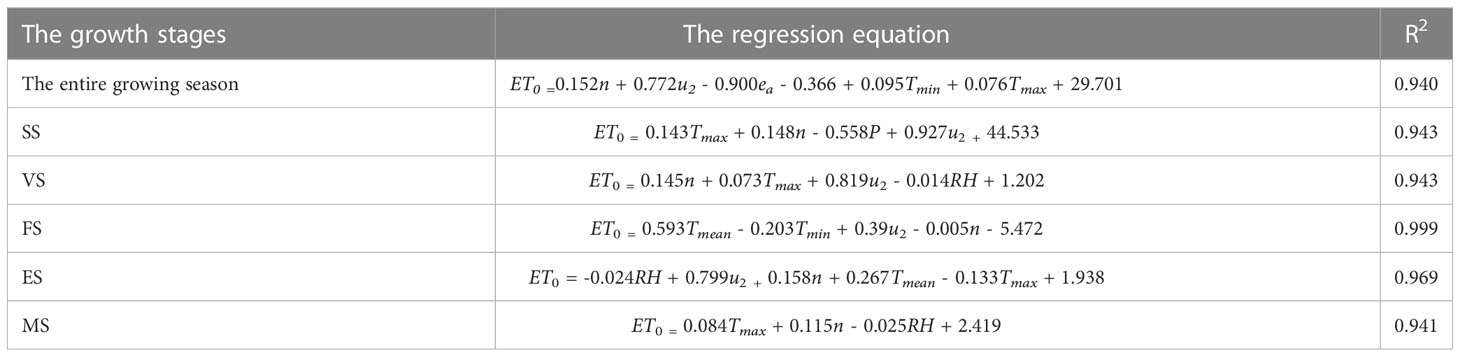
Table 4 Multiple linear regression analysis of meteorological elements and ET0 in each growth stage.
Tables 5–9 show the ET, Kc, ET intensity, and water consumption modulus of oasis watermelon under various water treatments during various growing period. The ET of watermelon during the whole growing season was 323 mm and 334 mm in 2020 and 2021, respectively, with adequate water supply. Compared with CK, the ET of WD treatments decreased to different degrees, and the most significant was the WD treatment at the ES, while the water consumption of watermelon showed a bimodal trend during the growing season.
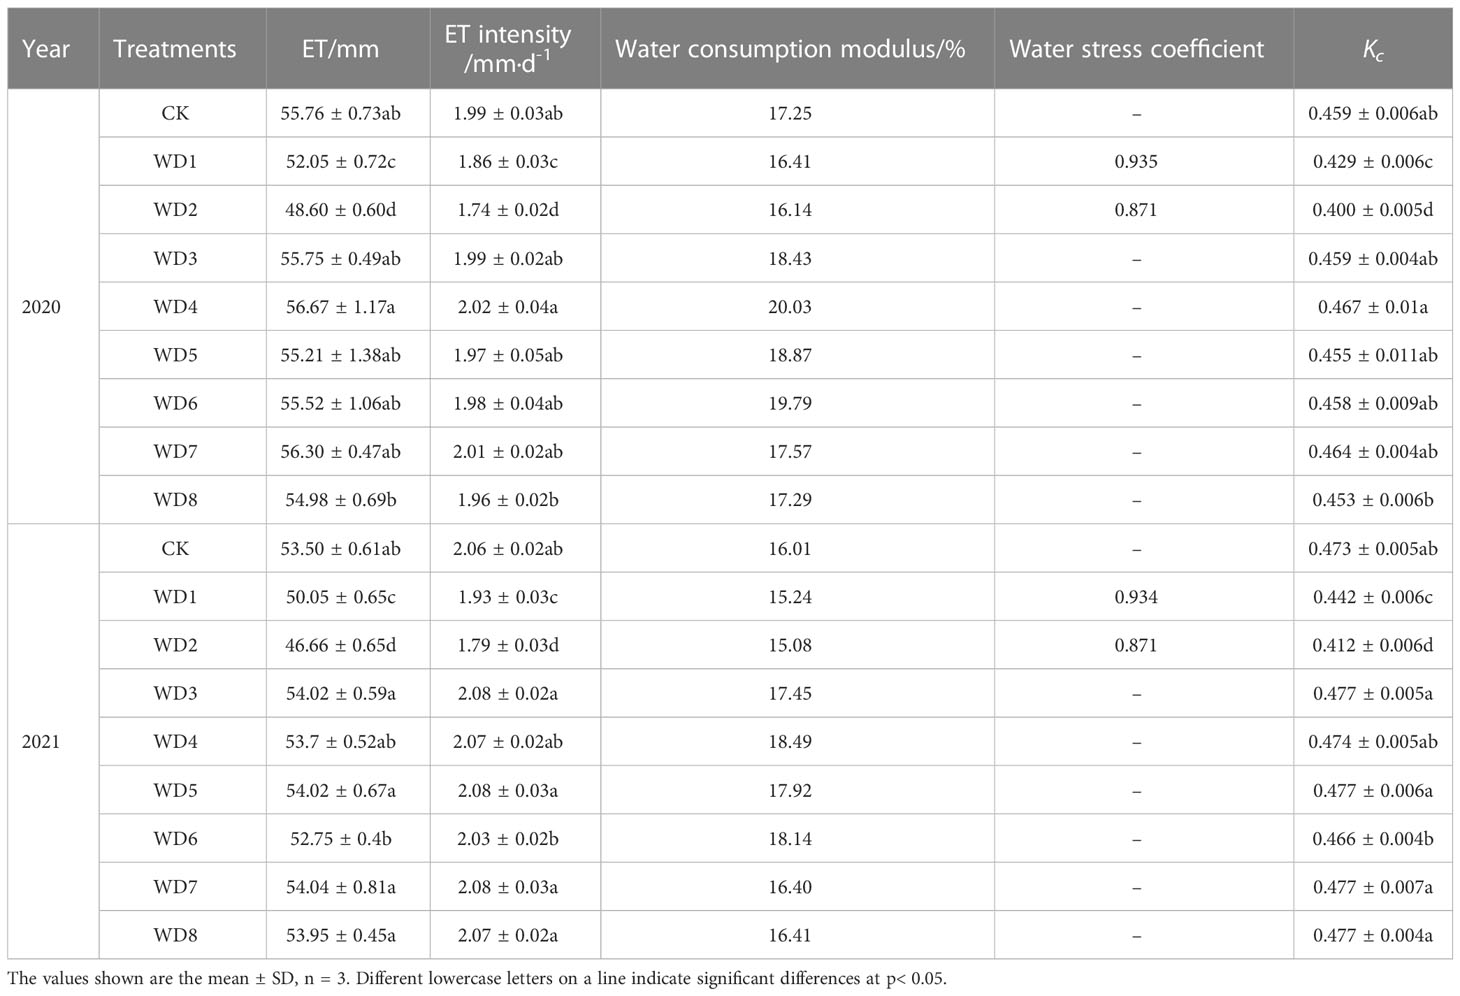
Table 5 ET, Kc, ET intensity, and water consumption modulus under different water treatments at the SS.
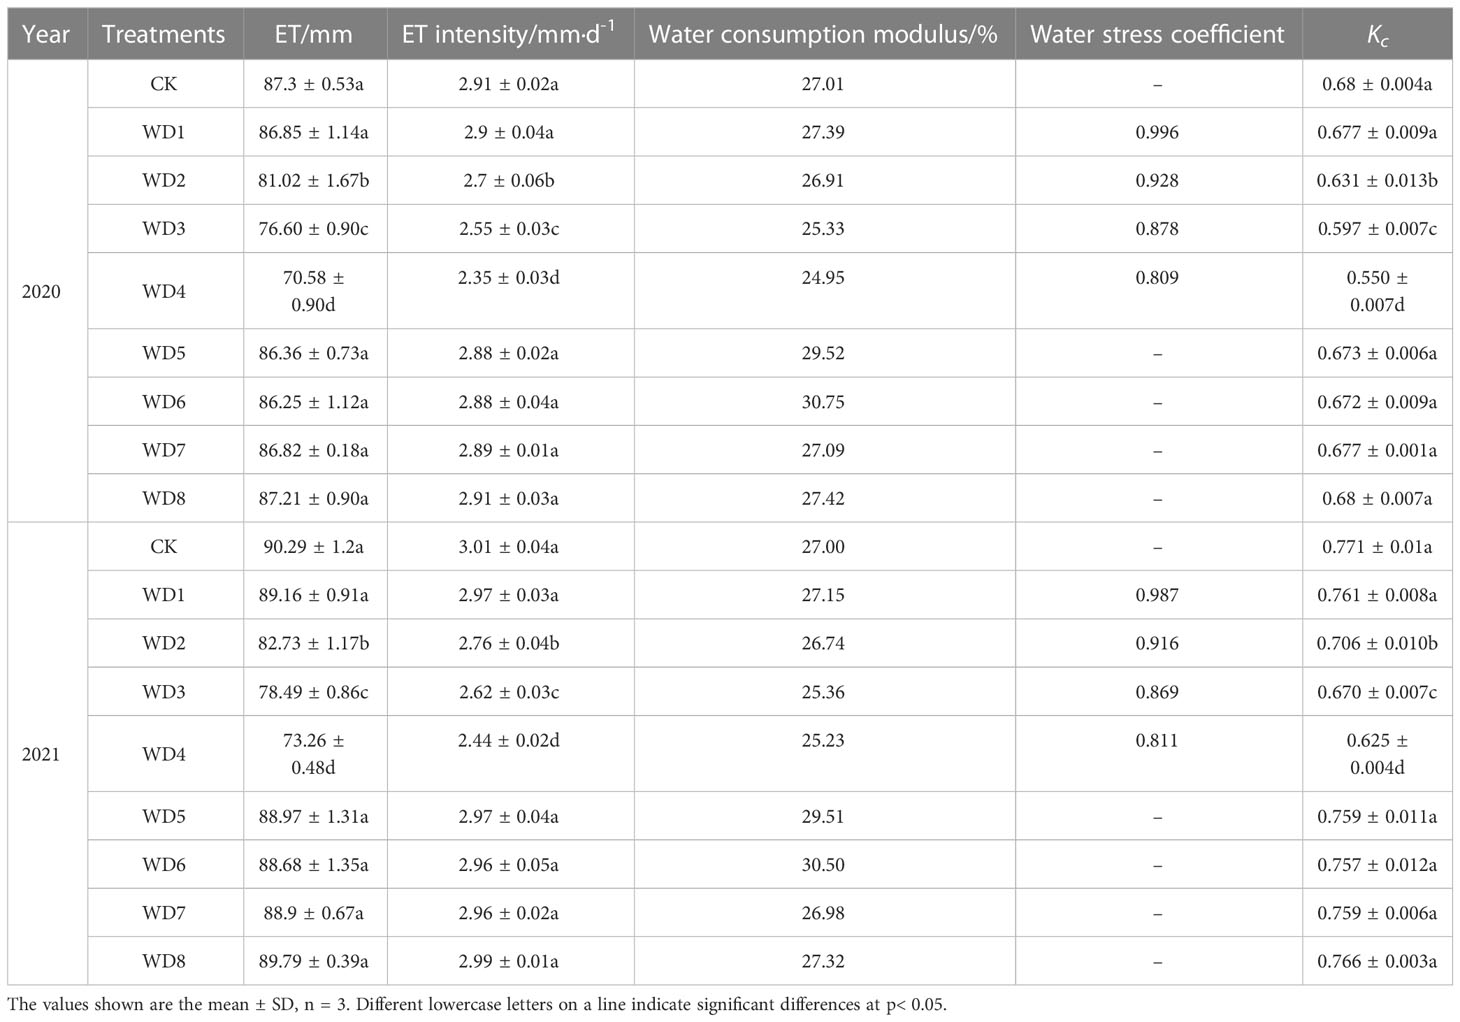
Table 6 ET, Kc, ET intensity, and water consumption modulus under different water treatments at the VS.
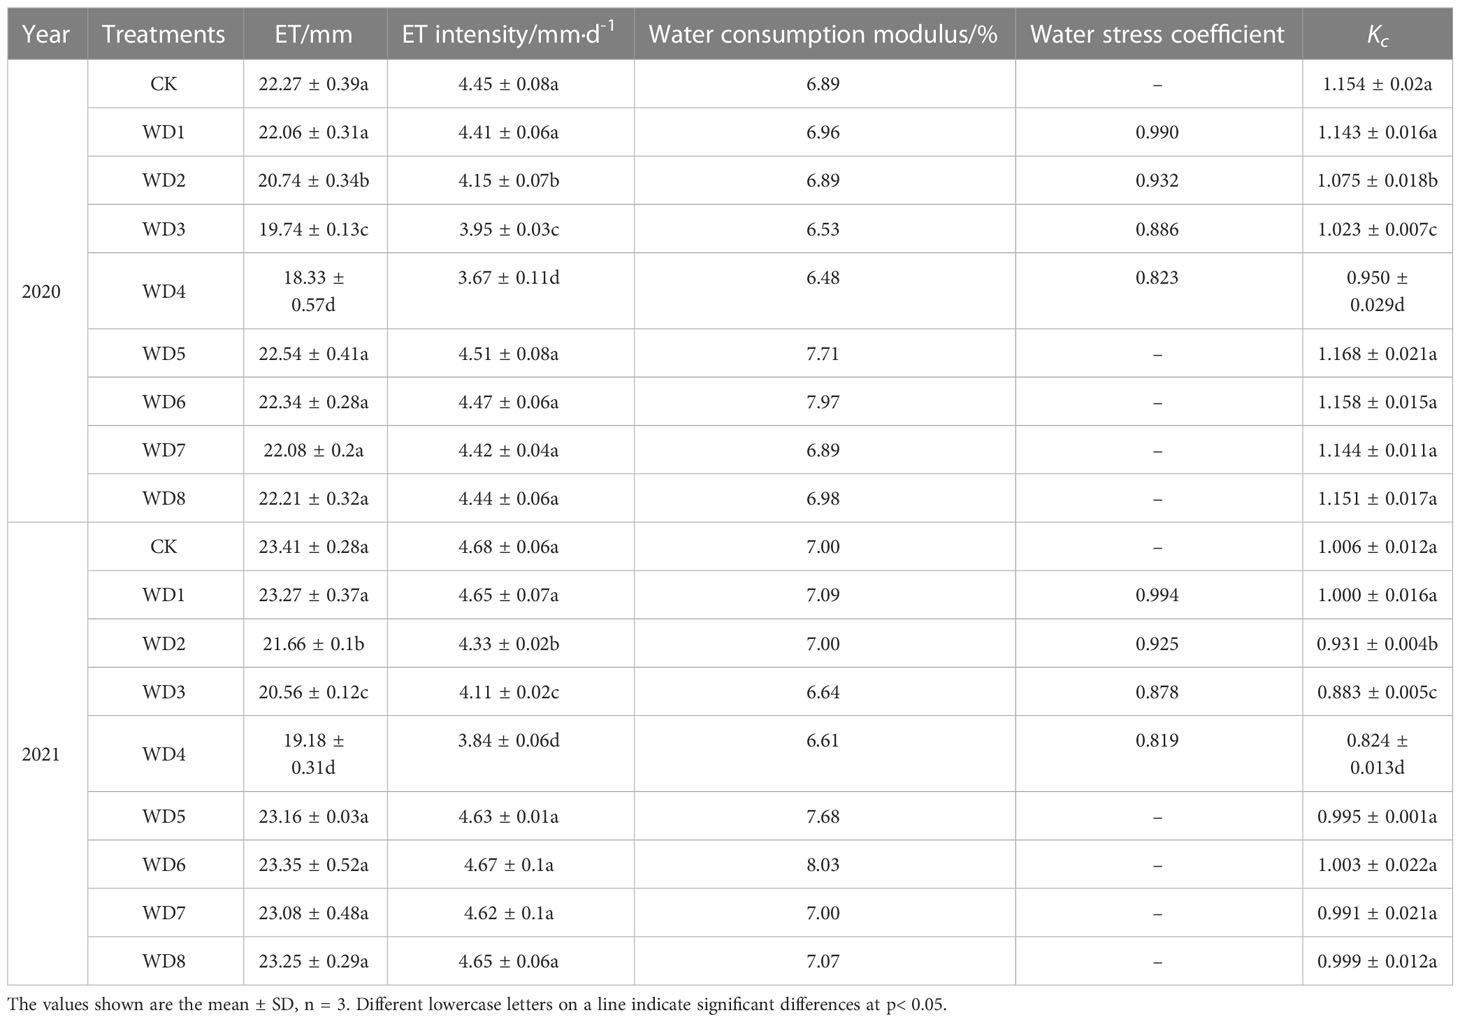
Table 7 ET, Kc, ET intensity, and water consumption modulus under different water treatments at the FS.
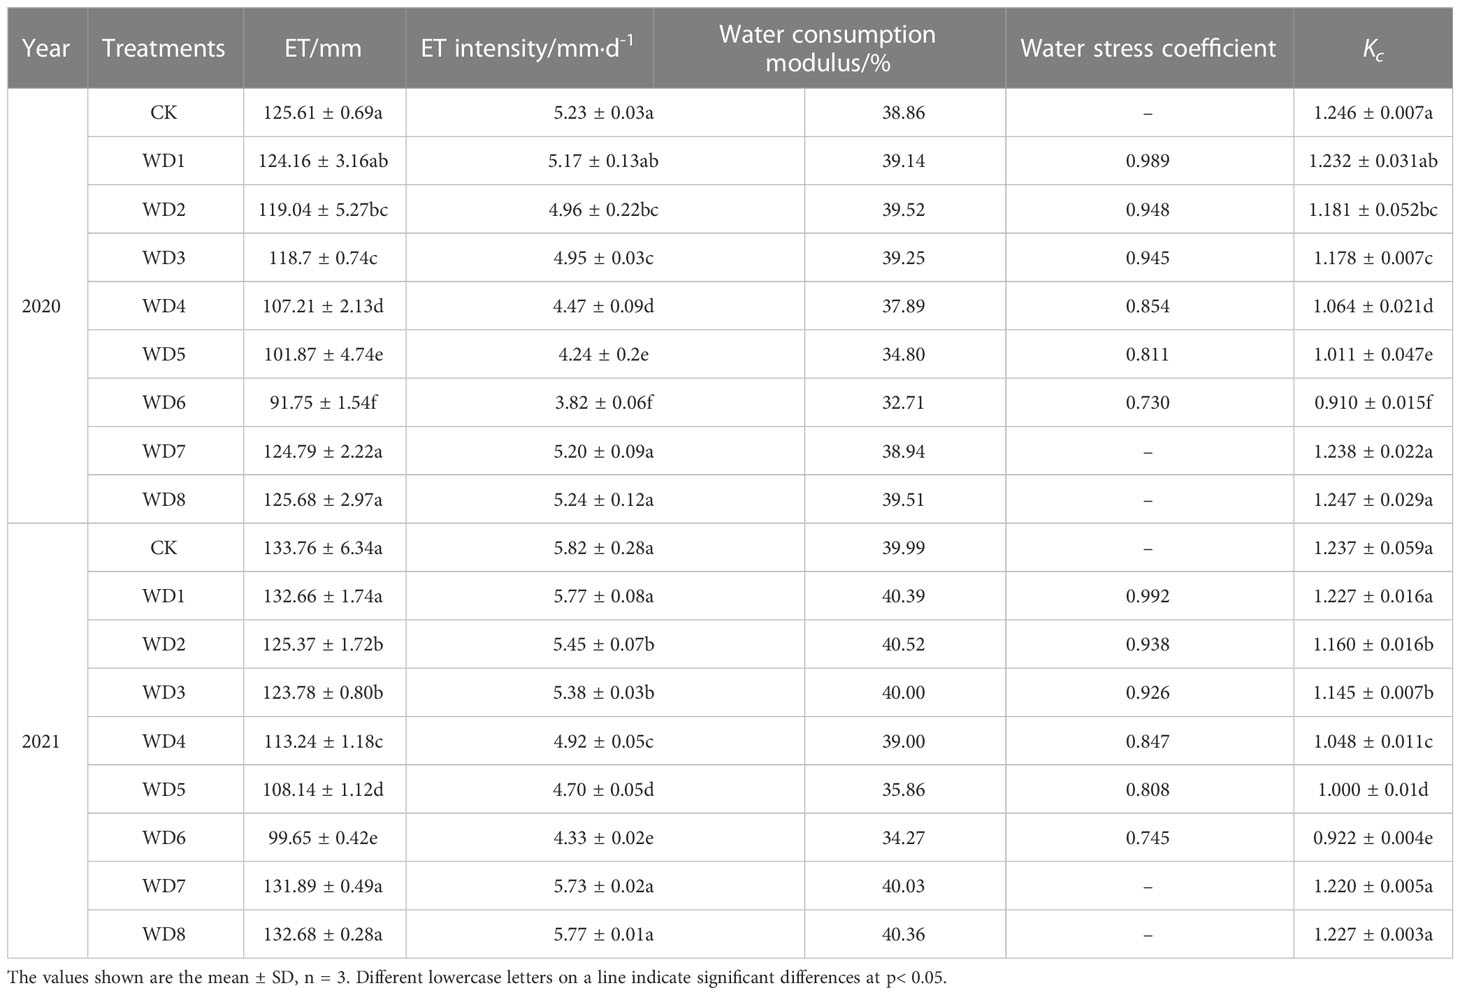
Table 8 ET, Kc, ET intensity, and water consumption modulus under different water treatments at the ES.
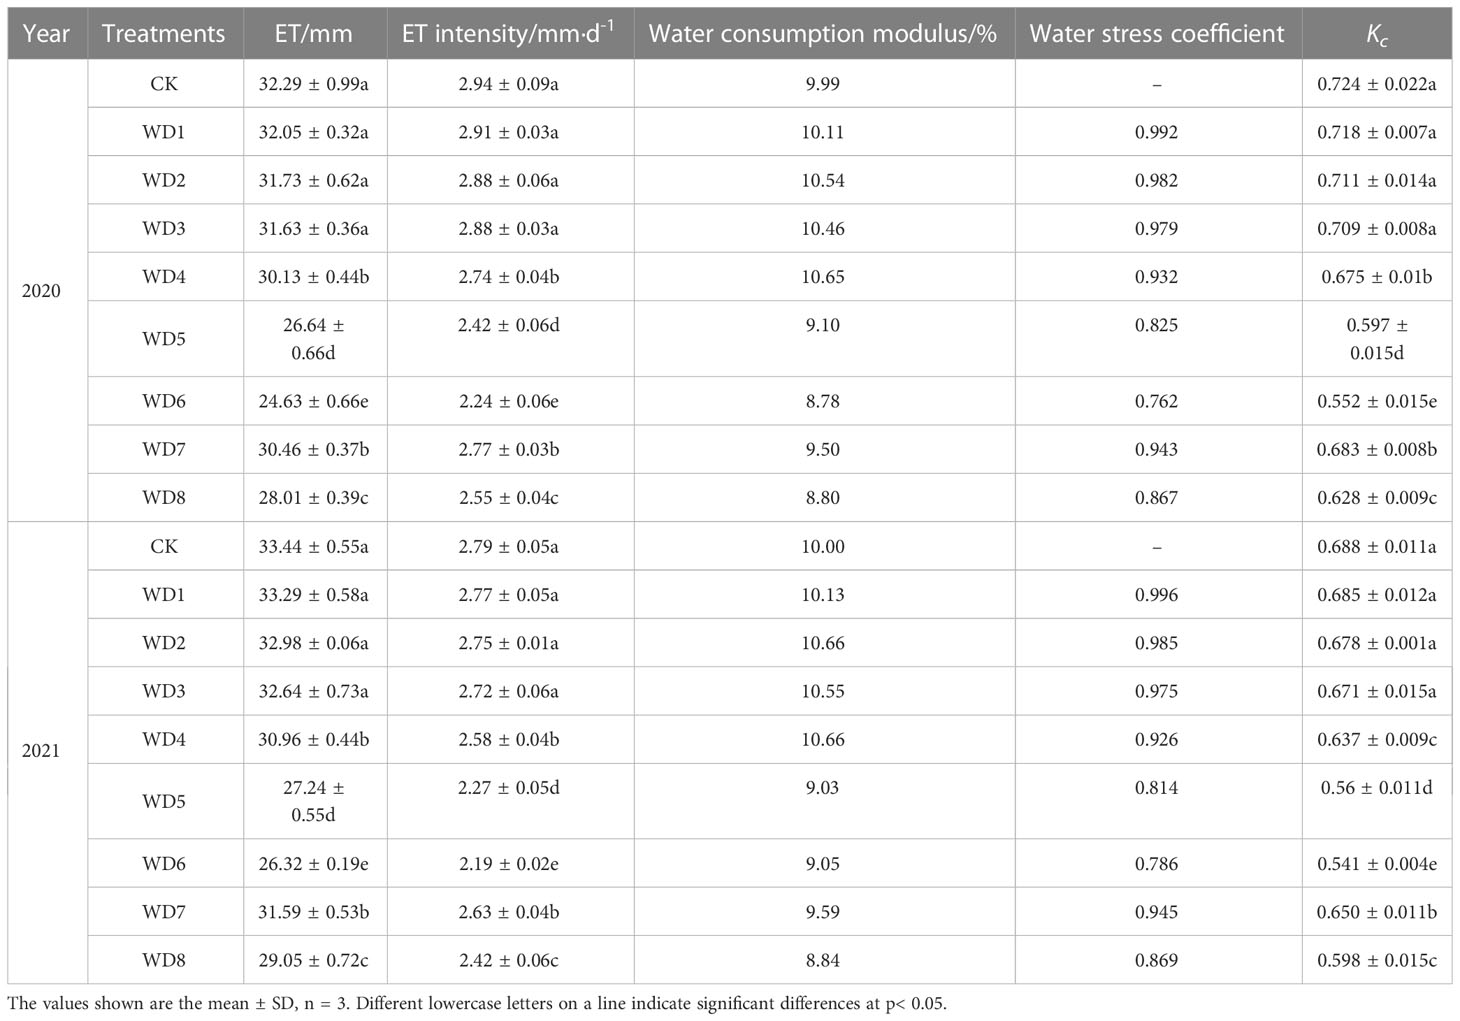
Table 9 ET, Kc, ET intensity, and water consumption modulus under different water treatments at the MS.
Table 5 shows that for mild (WD1) and moderate (WD2) WD, respectively, the ET was considerably reduced in 2020 and 2021 compared with CK by 6.45%–6.65% and 12.79%–12.84%, respectively (p< 0.05), whereas the other treatments did not significantly differ from CK (p > 0.05). The ET intensities of WD1 and WD2 were 1.85–1.93 mm·d-1 and 1.74–1.79 mm·d-1, respectively, and both were significantly lower than CK. The moderate treatment saw a higher decline, whereas the other treatments did not differ significantly from CK. The water consumption modulus of the treatments ranged from 15.08%–20.03% in both years due to short, slow-growing watermelon plants and relatively low temperatures during the SS.
As can be seen from Table 6, ET was highest in 2020 with 87.30 mm for CK, and 89.79 mm for treatment WD8 in 2021, which was only 2.85% higher than that of CK, but the difference was not significant, while ET was lowest in 2a moderate WD treatment WD4 with a decrease of 16.08%–19.15%, while mild WD treatment WD3 decreased by 10.09%–12.26%, and the rehydration treatment WD1 was at the same level as CK. The ET intensity was highest in CK, with 2a at 2.91 mm·d-1 and 3.01 mm·d-1 respectively, followed by the rehydration treatment WD1. The ET intensity of treatment WD4 was significantly reduced by 18.85%–19.15% compared to CK, and the reduction in treatment WD3 was 12.26%–13.07%. When watermelon entered the VS, the root crown developed rapidly, the temperature rose gradually and the water consumption modulus increased, which ranged from 24.95% to 30.75%.
Table 7 indicates that the water consumption of the various water treatments was the same as that of the preceding stage, with a relatively small water consumption modulus of 6.48%–8.03%. This was caused by the stage’s brief duration as well as the stage’s higher ET intensity of approximately 4.30 mm·d-1, which occurred as the plants were in a crucial stage of transition from nutritional to reproductive growth.
As can be seen from Table 8, ET was highest for CK in 2020 and 2021, with treatments WD1 and WD3 not significantly different from CK, while ET for the mild (WD5) and moderate (WD6) WD treatments decreased significantly by 18.90% and 26.95%, respectively, compared to CK, while WD treatments WD3 and WD4 were still smaller than CK during the VS, and the differences were significant. The ET intensity was highest in CK, reaching 5.23 mm·d-1 and 5.82 mm·d-1, but the effect of WD on watermelon water consumption was greater at this stage, with treatments WD5 decreasing by 18.93%–19.24%, while treatment WD6 had the least ET intensity, decreasing by 25.60%–26.96%. Since the ES was the critical period of water demand for watermelon, to ensure the rapid expansion of the flesh cells, water demand was at its maximum, with a water consumption modulus of 32.71%–41.18%.
As can be seen from Table 9, in 2020 and 2021, evapotranspiration was highest in CK, while treatment WD6 remained the lowest at 24.63 mm and 26.32 mm, significantly lower than CK by 23.72% and 21.29%, respectively, while treatments WD2 and WD3 were not significantly different from CK, while mild (WD7) and moderate (WD8) WD treatments were significantly lower than CK by 5.53%–5.67% and 13.13%–13.25%, respectively. The evapotranspiration intensity of CK was still the highest, with treatments WD1–WD3 at the same level as CK, but WD8 demonstrated a significant decrease of 13.26%–18.45% compared with CK, and WD7 indicated a decrease of 5.67%–2.73%. Moreover, at watermelon MS, the growth rate also slowed down and the water consumption modulus dropped to 8.78%–10.66%.
In summary, (1) the ET results revealed that the ET of the SS in 2020 was similar to that of the SS in 2021, and the remaining treatments except for the WD at this stage were not significantly different from CK. The ET at the VS and ES decreased with increasing WD levels, with a significant decrease compared with CK, and the ET at the ES in 2021 was higher than that in 2020. The ET of CK was the highest at the MS. (2) The ET intensity showed that it was lowest at the SS (about 1.94 mm·d-1), higher at the VS and MS (about 2.81 and 2.59 mm·d-1), and highest at the FS (about 4.36 and 5.14 mm·d-1). The ET intensity of oasis watermelon ranged from 1.74 to 5.82 m·d-1 under different water treatments throughout the entire reproductive period. (3) The water consumption modulus showed a relatively similar distribution pattern for watermelon during the two-year reproductive period, i.e., 32.71%–40.52% at the ES, 24.95%–30.75% at the VS, 15.24%–20.03% at the SS and 8.78%–10.66% at the MS. This is mainly since many factors influence the water consumption modulus, such as ET intensity, total evapotranspiration during the growing season, environmental factors, and the duration of the growth stage, which cannot be directly related to the magnitude of the WD.
The Kc is related to the crop type, variety, reproductive period, and LAI, reflecting the physiological characteristics of the crop itself. As can be seen from Tables 5-9, Kc generally showed a single-peaked curve fluctuation of increasing and then decreasing, reaching peaks of 1.246 and 1.237 at the ES, followed by 1.154 and 1.006 at the FS, and a minimum of 0.459 and 0.473 at the SS. Irrigation had a large effect on Kc, with any stage of WD reducing the Kc for that stage, and the greater the stress the smaller the corresponding Kc. Kc for both years was smallest at 0.400 and 0.412 for the moderate WD treatment at SS (WD2), largest in 2020 (1.247), and largest in 2021 (1.237) for the moderate WD treatment at ES (WD8), while the average values of Kc were 0.803 and 0.784 for the whole reproductive period.
Figure 5 shows the variation curves of watermelon LAI with time under different water treatments. The trend of the LAI of oasis watermelon under different water treatments is generally similar, with the LAI gradually increasing from the beginning of the growing season, and the LAI increasing rapidly during the VG, which is a critical stage for the growth of watermelon vine leaves and other nutrient organs, reaching a peak in the early ES. The late ES to the MS, the plant’s nutritional growth stalled, most of the vine-leaves nutrients were absorbed by the fruit, the crop metabolism tended to slow down, the base leaves gradually withered and fell off, and the LAI showed a slow decrease trend.
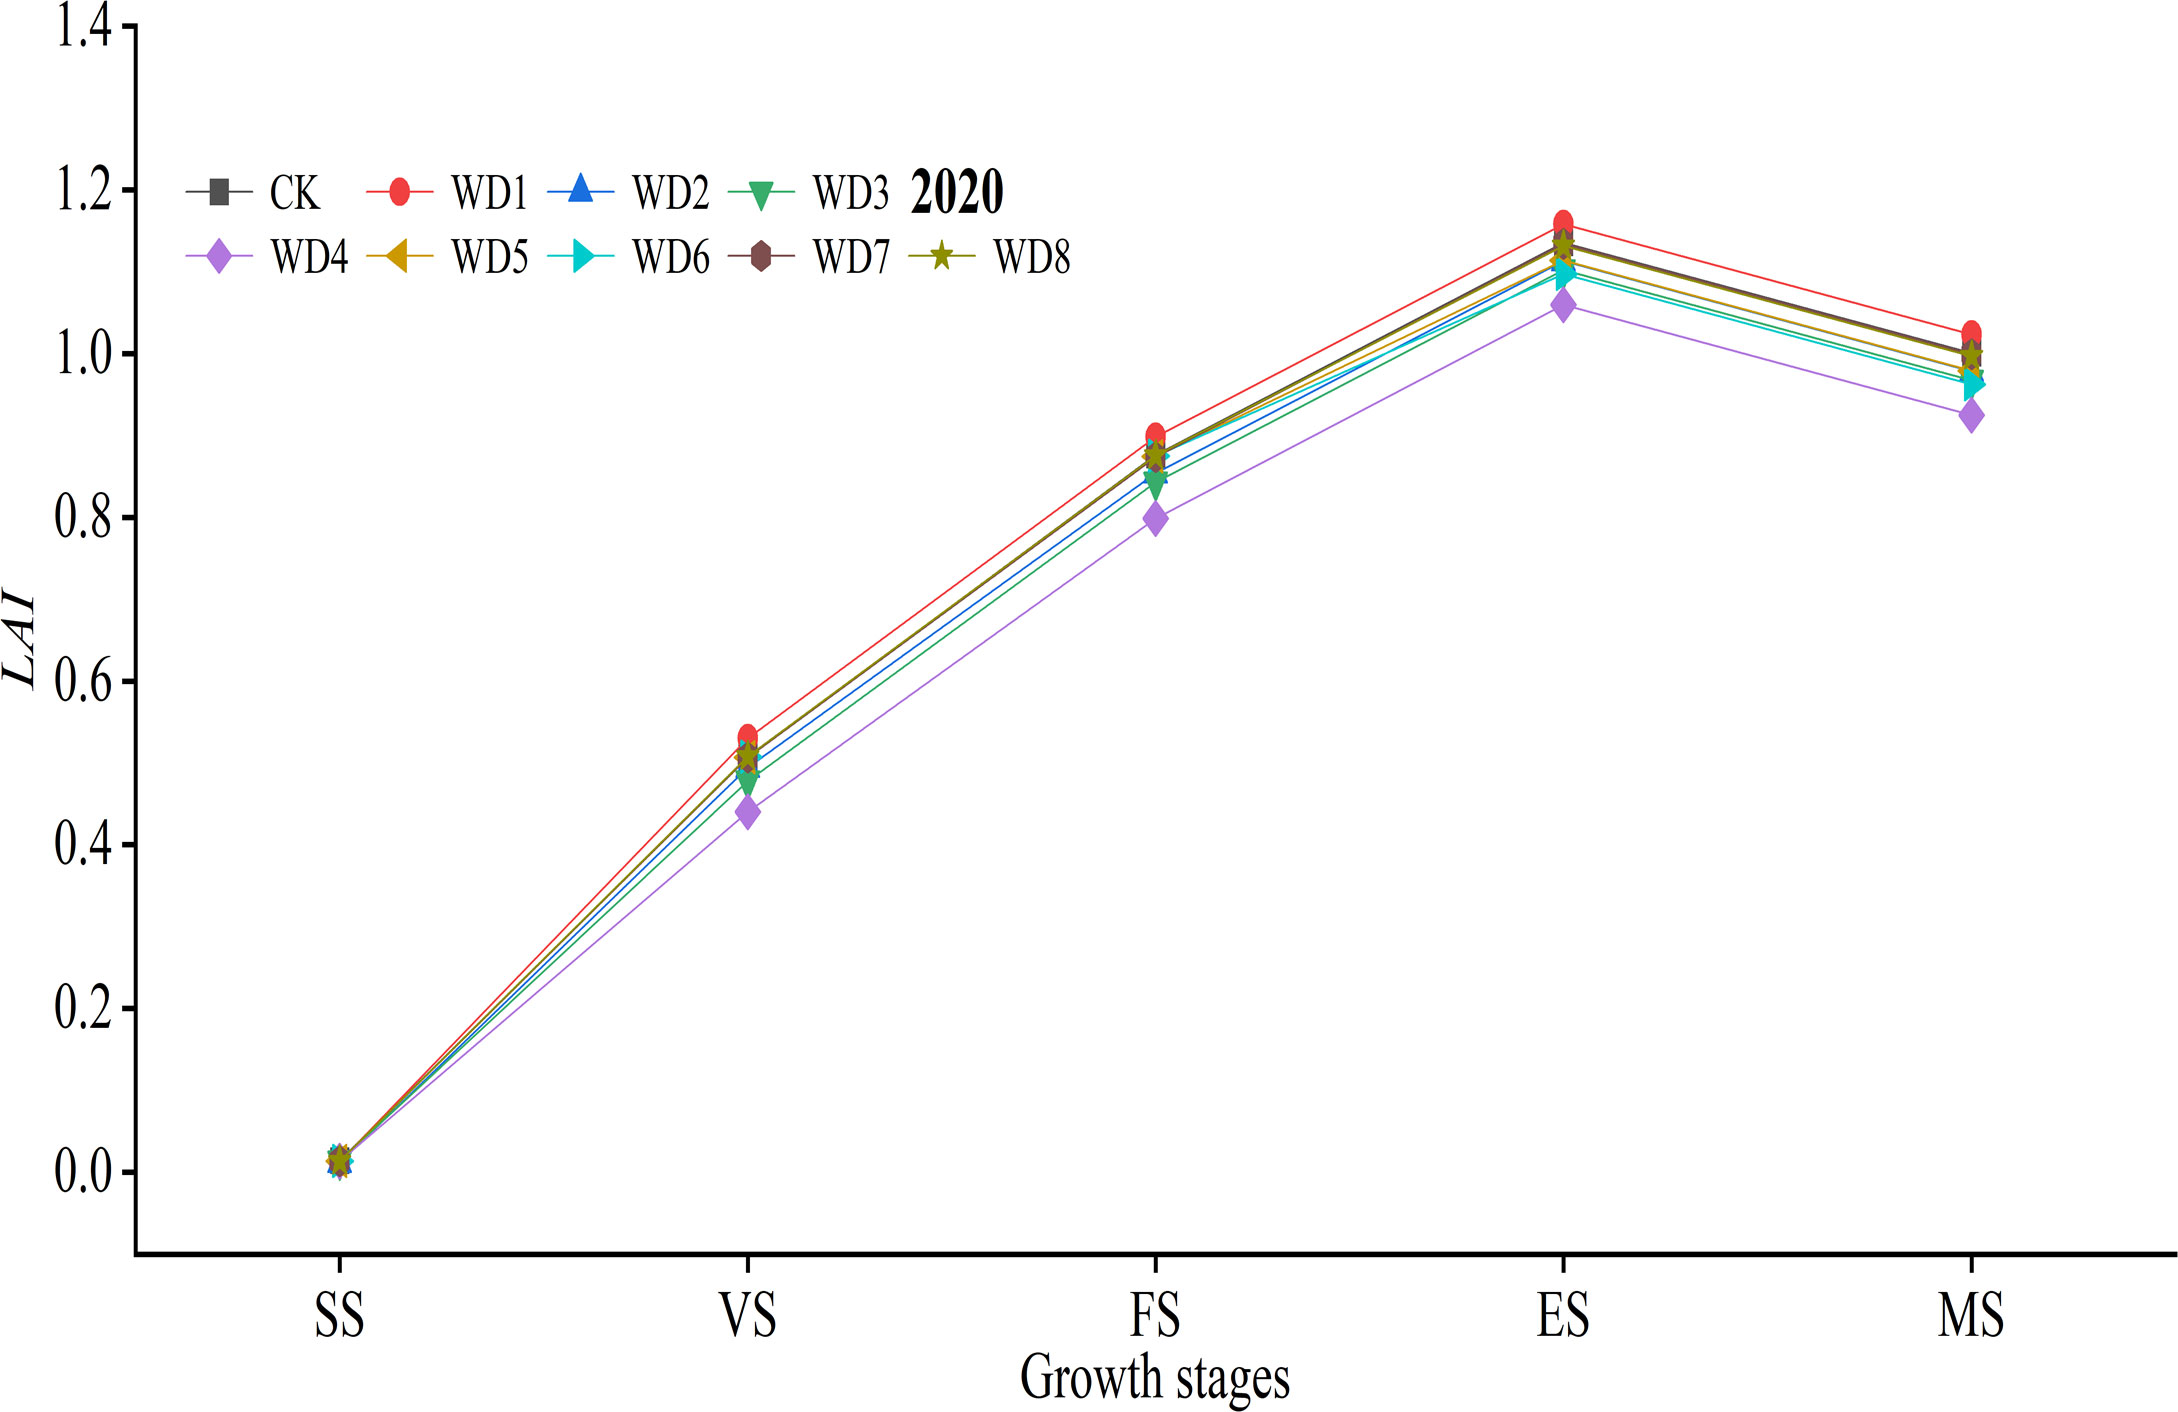
Figure 5 LAI curve with time for different water treatments.
For reasons of length, only 2020 data was analyzed. Compared with CK, WD treatments WD1 and WD2 at SS reduced LAI by 6.35% and 16.90%, respectively, with significant differences (p< 0.05). At VS, WD1 grew faster and higher than CK by 4.42% after rehydration, but the difference was not significant (p > 0.05), while WD2 still decreased by 2.58%, and the LAI of WD treatments WD3 and WD4 decreased significantly by 5.80% and 13.25%, respectively, compared with CK. The results of all treatments at FS were the same as that of VS. Upon entering the ES, the LAI of treatment WD1 was the largest, while the leaf growth of treatments WD2 and WD3 accelerated after rehydration and were still lower than that of CK but not significantly different, and the WD treatments WD5 and WD6 were both lower than that of CK during this period, with a significant difference for treatment WD6. By the end of MS, the LAI of all treatments decreased, among which all treatments were lower than CK except for the mild WD treatment at the SS, with a decrease of 0.11%–7.53%, while treatment WD4 (moderate WD at the VS) was significantly different from CK. The LAI was affected differently by different WD treatments at different growth stages. SS to the beginning of FS was the rapid formation stage of watermelon stems and leaves and other nutrient organs, WD at this stage had a significant effect on the LAI, but it is not significantly different from CK due to the compensation result of light stress after rehydration.
Kc has a dynamic process of change during the reproductive period, and it is generally accepted that there is a correlation between Kc and LAI. In this paper, the regression equation between Kc and mean LAI under different water treatments was established based on the actual data measured in two consecutive growing seasons of oasis watermelon in the Hexi region, as shown in Figure 6.
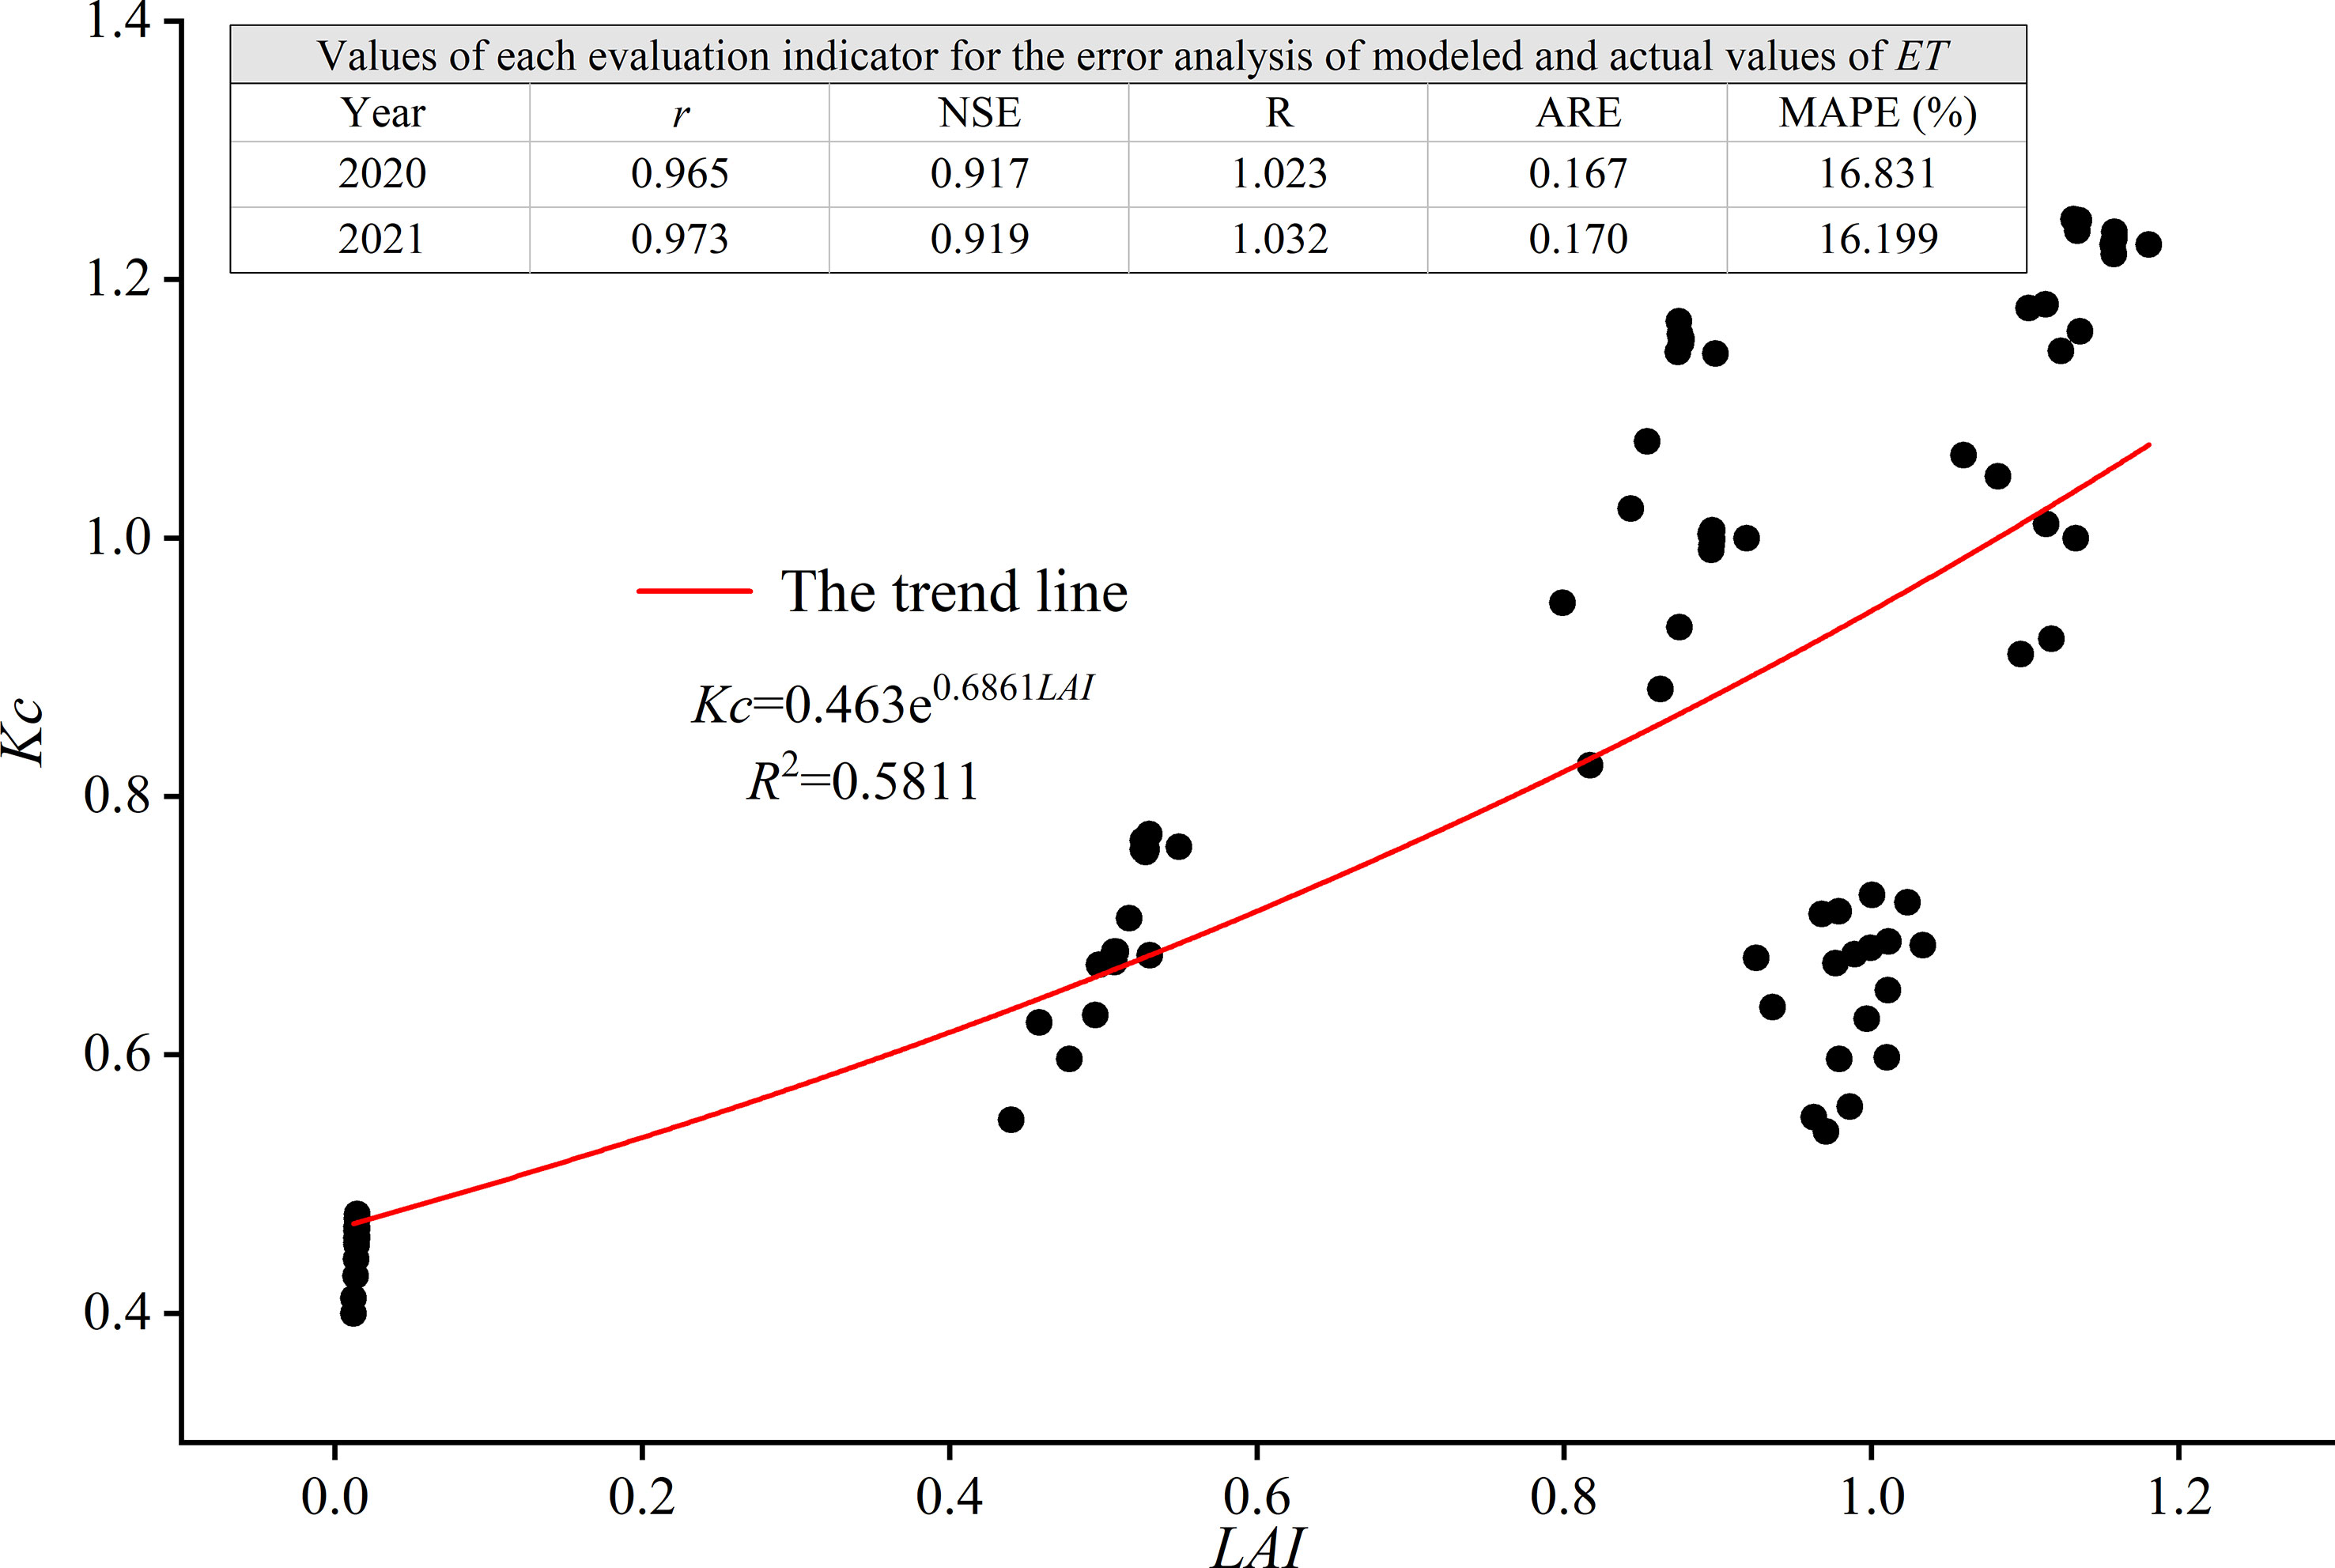
Figure 6 Relationship between Kc and LAI for oasis watermelon.
The LAI and Kc were first analyzed for correlation, with r = 0.759 (p< 0.01), indicating a highly significant positive correlation between the LAI and Kc of oasis watermelon. The regression analysis in Figure 6 shows that there was a good exponential relationship between Kc and LAI for oasis watermelon, with the fitted relationship equation and R2 = 0.5811 (p< 0.01), indicating that it is possible to estimate the Kc by measuring the LAI of watermelon using this relationship equation, thereby providing a practical reference for watermelon irrigation.
The quantitative relationship between the LAI and Kc and the integrated P-M equation enabled the modeling of the actual ET of oasis watermelon in the Hexi region with the LAI and meteorological factors.
To evaluate the reliability of the model established under different water treatment conditions, the experimental data from 2020 and 2021 were employed to validate the established ET estimation model. The quantitative evaluation analysis was conducted by comparing the actual evapotranspiration values (ETs) obtained from the water balance equation with the modeled values (ETm). The evaluation results are shown in Figure 6.
Figure 6 shows the results of the statistical coefficients comparing ETs with ETm for the assessment phase of the model equation. The r for the actual values obtained from the water balance method and the estimated model modeling values in 2020 and 2021 were 0.965 and 0.973 respectively (p< 0.01), i.e., the correlation between both was good; the NSE was 0.917 and 0.919 respectively, i.e., the NSH of the model constructed was close to 1, indicating that the model had better fitting accuracy and high reliability; the R was 1.023 and 1.032 respectively, i.e., the totals were similar, which showed that the model has a better performance in the evaluation phase. In addition, ARE values for two-year were small and the MAPE values were 16.831% and 16.199%, indicating that the errors in the modeling results were relatively small. It can be shown that the model constructed in this study can better estimate the watermelon ET under the conditions of sub-membrane drip irrigation in the Hexi Oasis by using LAI and meteorological factors.
ET0 is a critical parameter for calculating crop water requirements and irrigation management (Ahmad et al., 2017; Kadam et al., 2021), and the ET0 calculated based on the P-M equation is directly affected by the local climate (Neto et al., 2015; Borges and Pinheiro, 2019). In this study, the average ET0 values during the watermelon growing season were found to be 4.15 mm (2020) and 4.33 mm (2021), with the relatively smallest ET0 at MS. Simple correlation analysis between meteorological factors and ET0 during the growing period showed that ET0 was positively correlated with T, n, and u2, while it was negatively correlated with P, RH, and ea. Similar findings were obtained by Zeng (2018), which were mainly related to the evaporative properties of water. To further clarify the influence of meteorological factors on ET0, a multiple linear regression model was established between ET0 and the meteorological factors involved in the calculation for the whole reproductive period and stage, and the fitting results were high. Wang et al. (2014) achieved similar results for the ET0 estimation in the Hetao areas.
ET0 is determined by soil, irrigation, crop varieties, and meteorology, but WD can effectively reduce ET of melon crops (Leite et al., 2015; Qin and Leskovar, 2020), especially at the fruit growth and development stage, which has a more significant effect (Yavuz et al., 2021). According to the water consumption of the two-year, WD at the VS and ES had a greater impact on the stage ET of watermelon, thereby leading to a significant reduction in total ET. Compared with CK, stage ET was significantly reduced by 10.09%–1.32% for mild WD at VS (WD3), and by 16.08%–19.15% for moderate WD treatment (WD4), and the difference between WD3 and WD4 was significant. During the ES, stage water consumption was highest in CK at 125.61 mm in 2020 and 133.76 mm in 2021, and was significantly reduced by 18.90%–19.16% and 25.50%–26.95% in the mild (WD5) and moderate (WD6) WD treatments, respectively, during this period. The difference between them was also significant. This is consistent with the findings of Zhang et al. (2021), where stage WD resulted in a linear decrease in the average daily ET of watermelon, with the greatest decrease occurring during the ES.
Studies (Ji et al., 2015) have shown that water regulation effectively reduced the stage water consumption modulus and ET intensity of crops. The results of two consecutive growing seasons indicated that ET showed an increasing and then decreasing law, with the highest water consumption modulus (about 40%) at the ES, followed by the second highest (29%) at the VS, the smallest (about 7%) at the FS, and about 19% and 10% at the SS and MS. The ET intensity is the smallest at the SS (about 1.9 mm·d-1), relatively large at the VS and MS (about 2.8 mm·d-1), and the largest at the FS (4–5 mm·d-1). This is because crop water requirements are mainly influenced by growth characteristics, meteorology, and agronomic management practices, but also follow the corresponding habitual and quantitative patterns. Furthermore, WD at various growth stages caused a decrease in both water consumption modulus and ET intensity of watermelon, and the more the corresponding stage ET, the more significant the effect of WD-induced decrease in water consumption. This is similar to the results of Wang et al. (2018b) and Huang et al. (2021) on the water requirements patterns of WD peppers.
Kc can be employed to describe the effect of crop biological features, water productivity, and soil tillage conditions on crop water requirements as an indirect parameter for determining ET0 (Wright, 1982; Pereira et al., 1999). Related studies (Yun et al., 2015; Li et al., 2022b) revealed that between crop LAI and Kc existed a more favorable exponential relationship, which was consistent with the results of this work but differed from the findings of Hu et al. (2012) and He and Wu (2018), who discovered a quadratic curve relationship between Kc and LAI of drip irrigated jujube trees. This might be related to crop varieties and cultivation areas. In addition, this paper established an ET estimation model for watermelon with under-mulched drip irrigation in the Hexi region based on the above-mentioned exponential regression relationship, and after evaluation and validation, the NSE reached more than 0.9, which was higher than the NSE of ET models established in different approaches by Wang et al. (2018a), thereby filling a research gap in the estimation of Kc and ET for oasis watermelon.
(1) Water deficit at various growth stages led to a decrease in the evapotranspiration intensity of watermelon. Evapotranspiration was relatively highest at the ES, which is a critical water requirement period for oasis watermelon, ranging from 91.75 to 133.76 mm with an average evapotranspiration intensity of 5.06 mm·d-1.
(2) There was a promotion of ET0 by temperature, hours of sunlight, and wind speed, and the potential impact of high-temperature variation on watermelon growth was greater than other climatic factors. The crop coefficients for field watermelon at the SS, VS, FS, ES, and MS were in the order of 0.400–0.477, 0.550–0.771, 0.824–1.168, 0.910–1.237, and 0.552–0.803, under water deficit conditions in Hexi region.
(3) The leaf area index varied more significantly among the different water treatments and increased with increasing irrigation. Moreover, there was a strongly significant correlation between crop coefficient and leaf area index, showing a well-exponential relationship. Based on this relationship, a model for estimating the evapotranspiration of oasis watermelons concerning the leaf area index was also established, and the modeling results of the proposed model were empirically analyzed to be in good agreement with the actual values.
The model in this work is based on the results of two consecutive growing seasons trials of water deficit watermelon, and only single crop coefficient method were used to calculate and establish the estimation model, which might have some bias. In future studies, we will combine years of actual measurement data to build an evapotranspiration estimation model according to the dual-crop coefficient method to further improve the accuracy and practical application of the model.
The original contributions presented in the study are included in the article/Supplementary Material. Further inquiries can be directed to the corresponding author.
ZW and HZ prepared the experimental scheme. ZW prepared data analysis and drafted the article. HZ was responsible for the funding acquisition. HZ and SY revised the experimental protocol and article format. ZW, AT, CZ, LL, YB, and XC performed part of the experiments and provided some of the experimental results for the manuscript. All authors contributed to the article and approved the submitted version.
This work was funded by the National Natural Science Foundation of China (no. 52269008, 51669001), the Industrial Support Plan Project of Gansu Provincial Department of Education (no. 2022CYZC-51), the Discipline Team Construction Project of Gansu Agricultural University (no. GAU-XKTD-2022-07 GAU-XKTD-2022-07), and the Key Research and Planning Projects of Gansu Province (no. 18YF1NA073).
We thank editors and reviewers for their valuable comments and suggestions on the manuscript. We thank Xin Dong and Sanli Zhou for their help during the trial. We also thank the Hongshui River Management Office of Minle County for its enormous support. In addition, we would like to thank the National Natural Science Foundation of China (no. 52269008, 51669001), the Industrial Support Plan Project of the Gansu Provincial Department of Education (no. 2022CYZC-51), the Discipline Team Construction Project of Gansu Agricultural University (no. GAU-XKTD-2022-07 GAU-XKTD-2022-07), and the Key Research and Planning Projects of Gansu Province (no. 18YF1NA073).
The authors declare that the research was conducted in the absence of any commercial or financial relationships that could be construed as a potential conflict of interest.
All claims expressed in this article are solely those of the authors and do not necessarily represent those of their affiliated organizations, or those of the publisher, the editors and the reviewers. Any product that may be evaluated in this article, or claim that may be made by its manufacturer, is not guaranteed or endorsed by the publisher.
The Supplementary Material for this article can be found online at: https://www.frontiersin.org/articles/10.3389/fpls.2023.1153835/full#supplementary-material
Ahmad, L., Parvaze, S., Parvaze, S., Kanth, R. H. (2017). FAO reference evapotranspiration and crop water requirement of apple (Malus pumila) in Kashmir valley. J. Agrometeorol. 19, 262–264. doi: 10.54386/jam.v19i3.668
Allen, R. G., Jensen, M. E., Wright, J. L., Burman, R. D. (1989). Operational estimates of reference evapotranspiration. Agron. J. 81, 650–662. doi: 10.2134/agronj1989.00021962008100040019x
Allen, R. G., Pereira, L. S., Howell, T. A., Jensen, M. E. (2011). Evapotranspiration information reporting: i. factors governing measurement accuracy. Agric. Water Manage. 98, 899–920. doi: 10.1016/j.agwat.2010.12.015
Allen, R. G., Pereira, L. S., Raes, D., Smith, M. (1998). Crop evapotranspiration-guidelines for computing crop water requirements-FAO irrigation and drainage paper 56 (Rome: Food and Agriculture Organization of the United Nations), D05109.
Borges, J. C. F., Pinheiro, M. A. B. (2019). Daily reference evapotranspiration based on temperature for brazilian meteorological stations. J. Irrig. Drain. Eng. 145, 04019029. doi: 10.1061/(ASCE)IR.1943-4774.0001437
Chai, Q., Gan, Y., Turner, N. C., Zhang, R., Yang, C., Niu, Y., et al. (2014). Water-saving innovations in Chinese agriculture. Adv. Agron. 126, 149–201. doi: 10.1016/B978-0-12-800132-5.00002-X
Cui, N., Du, T., Kang, S., Li, F., Zhang, J., Wang, M., et al. (2008a). Regulated deficit irrigation improved fruit quality and water use efficiency of pear-jujube trees. Agric. Water Manage. 95, 489–497. doi: 10.1016/j.agwat.2007.11.007
Cui, X., Xue, C., Yang, X., Yang, J., Zhang, Q., Bouman, B. A. M. (2008b). Field evapotranspiration characteristics and water use efficiency of aerobic rice under different water treatments. trans. chin. Soc Agric. Eng. 24, 49–54. doi: 10.3321/j.issn:1002-6819.2008.04.009
Deng, Y., Gou, X., Gao, L., Yang, M., Zhang, F. (2017). Tree-ring recorded moisture variations over the past millennium in the hexi corridor, northwest China. Environ. Earth Sci. 76, 1–9. doi: 10.1016/j.agwat.2022.107983
Du, S., Kang, S., Li, F., Du, T. (2017). Water use efficiency is improved by alternate partial root-zone irrigation of apple in arid northwest China. Agric. Water Manage. 179, 184–192. doi: 10.1016/j.agwat.2016.05.011
Feng, H., Chen, J., Zheng, X., Xue, J., Miao, C., Du, Q., et al. (2018). Effect of sand mulches of different particle sizes on soil evaporation during the freeze–thaw period. Water 10, 536. doi: 10.3390/w10050536
Glasbey, C. A., Allcroft, D. J. (2008). A spatiotemporal auto-regressive moving average model for solar radiation. J. R. Stat. Soc C-Appl. 57, 343–355. doi: 10.1111/j.1467-9876.2007.00617.x
He, J., Cai, H., Bai, J. (2013). Irrigation scheduling based on CERES-wheat model for spring wheat production in the minqin oasis in Northwest China. Agric. Water Manage. 128, 19–31. doi: 10.1016/j.agwat.2013.06.010
He, Z., Wu, M. (2018). Crop coefficient and water consumption rule of jujube trees in bubbled-root irrigation of loess plateau region. J. Irrig. Drain. 37, 5–9. doi: 10.13522/j.cnki.ggps.20180249
Hu, Y., Li, Y., Zhang, Y. (2012). Experiment on crop coefficient and water requirement of drip-irrigation jujube in loess plateau of china. trans. chin. Soc Agric. Mach. 43, 87–91+79. doi: 10.6041/j.issn.1000-1298.2012.11.016
Huang, S., Feng, Q., Lu, Z., Wen, X., Deo, R. (2017). Trend analysis of water poverty index for assessment of water stress and water management polices: a case study in the hexi corridor China. Sustainability 9, 756. doi: 10.3390/su9050756
Huang, H., Han, D., Chen, N., Huang, D., Zhang, Z., Zhang, K. (2021). Water consumption pattern of capsicum annuum under regulated deficit irrigation in desert oasis. J. Natural Resour. 27, 747–756. doi: 10.11849/zrzyxb.2012.05.004
Ji, X., Cheng, Z., Zhang, R., Zhao, X. (2015). Experimental research on drip irrigation by water controlling for wine grape in arid desert oasis. Agric. Res. Arid Areas 33, 135–140. doi: 10.16302/j.cnki.1000-7601.2015.02.022
Juhasz, A., Hrotko, K. (2014). Comparison of the transpiration part of two sources evapotranspiration model and the measurements of sap flow in the estimation of the transpiration of sweet cherry orchards. Agric. Water Manage. 143, 142–150. doi: 10.1016/j.agwat.2014.06.014
Kadam, S. A., Gorantiwar, S. D., Mandre, N. P., Tale, D. P. (2021). Crop coefficient for potato crop evapotranspiration estimation by field water balance method in semi-arid region, maharashtra, India. Potato Res. 64, 421–433. doi: 10.1007/s11540-020-09484-8
Kuscu, H., Turhan, A., Ozmen, N., Aydinol, P., Buyukcangaz, H., Demir, A. O. (2015). Deficit irrigation effects on watermelon (Citrullus vulgaris) in a sub humid environment. J. Anim. Plant Sci. 25, 1652–1659. doi: 10.3969/10.1016/0042-207X(72)91189-X
Leite, K. N., Cabello, M. J., Valnir, M., Tarjuelo, J. M., Dominguez, A. (2015). Modelling sustainable salt water management under deficit irrigation conditions for melon in Spain and Brazil. J. Sci. Food Agric. 95, 2307–2318. doi: 10.1002/jsfa.6951
Leskovar, D. I., Bang, H., Kim, S. L., Yoo, K. S., King, S. R., Crosby, K. (2007). Environmental and genetic factors on carotenoids and quality in watermelon fruits. Acta Hortic. 744, 233–241. doi: 10.17660/ActaHortic.2007.744.24
Li, Z., Fei, L., Yin, Y., Li, Z., Liu, T., Hao, K., et al. (2022b). Crop coefficient and evapotranspiration estimation of apple in northern shaanxi under surge-root irrigation. J. Water Resour. Water Eng. 33, 209–215. doi: 10.11705/j.issn.1672-643x.2022.02.28
Li, X., Zhang, H., Li, F., Deng, H., Wang, Z., Chen, X. (2022a). Evaluating effects of regulated deficit irrigation under mulched on yield and quality of pumpkin in a cold and arid climate. Water 14, 1563. doi: 10.3390/w14101563
Li, X., Zhang, X., Niu, J., Tong, L., Kang, S., Du, T., et al. (2016). Irrigation water productivity is more influenced by agronomic practice factors than by climatic factors in hexi corridor, Northwest China. Sci. Rep. 6, 37971. doi: 10.1038/srep37971
Lin, J., Cai, H., Zheng, J., Wang, J. (2010). Study on high-yielding indicators of greenhouse mini-watermelon under deficit irrigation. Agric. Res. Arid Areas 28, 127–131. doi: 10.7606/j.issn.1000-7601.2010.02.26
Liu, L., Mo, Y., Yang, X., Li, X., Wu, M., Zhang, X., et al. (2014). Reasonable drip irrigation frequency improving watermelon yield and quality under regulated deficit irrigation in plastic greenhouse. Trans. Chin. Soc Agric. Eng. 30, 95–104. doi: 10.3969/j.issn.1002-6819.2014.24.012
Liu, Y., Wang, L., Ni, G., Cong, Z. (2009). Spatial distribution characteristics of irrigation water requirement for main crops in China. Trans. Chin. Soc Agric. Eng. 25, 6–12. doi: 10.3969/j.issn.1002-6819.2009.12.002
Liu, C., Zhang, X., Zhang, Y. (2002). Determination of daily evaporation and evapotranspiration of winter wheat and maize by large-scale weighing lysimeter and micro-lysimeter. Agric. For. Meteorol. 111, 109–120. doi: 10.1016/S0168-1923(02)00015-1
Meng, Q. (2011). Soil moisture consumption pattern and growth response of hilly apple orchard in the loess plate (Shangxi: Northwest A & F University).
Munitz, S., Schwartz, A., Netzer, Y. (2019). Water consumption, crop coefficient and leaf area relations of a vitis vinifera cv. ‘Cabernet sauvignon’ vineyard. Agric. Water Manage. 219, 86–94. doi: 10.1016/j.agwat.2019.03.051
Neto, A. J. S., Borges, J. C. F., Andrade, C. L. T., Lopes, D. C., Nascimento, P. T. (2015). Reference evapotranspiration estimates based on minimum meteorological variable requirements of historical weather data Chilean. J. Agric. Res. 75, 366–374. doi: 10.4067/S0718-58392015000400014
Netzer, Y., Yao, C., Shenker, M., Bravdo, B. A., Schwartz, A. (2009). Water use and the development of seasonal crop coefficients for superior seedless grapevines trained to an open-gable trellis system. Irrig. Sci. 27, 109–120. doi: 10.1007/s00271-008-0124-1
Pereira, L. S., Perrier, A., Allen, R. G., Alves, I. (1999). Evapotranspiration: concepts and future trends. J. Irrig. Drain. Eng. 125, 45–51. doi: 10.1061/(asce)0733-9437(1999)125:2(45
Qin, K., Leskovar, D. I. (2020). Assessments of humic substances application and deficit irrigation in triploid watermelon. HortScience 55, 716–721. doi: 10.21273/HORTSCI14872-20
Rahmati, M., Miras-Avalos, J. M., Valsesia, P., Lescourret, F., Genard, M., Davarynejad, G. H., et al. (2018). Disentangling the effects of water stress on carbon acquisition, vegetative growth, and fruit quality of peach trees by means of the QualiTree model. Front. Plant Sci. 9. doi: 10.3389/fpls.2018.00003
Skaggs, T. H., Trout, T. J., Rothfuss, Y. (2010). Drip irrigation water distribution patterns: effects of emitter rate, pulsing, and antecedent water. Soil Sci. Soc Am. J. 74, 1886–1896. doi: 10.2136/sssaj2009.0341
Wang, Y., Kou, D., Muneer, M., Fang, G., Su, D. (2020a). The effects of irrigation regimes on soil moisture dynamics, yield and quality of lucerne under subsurface drip irrigation. Appl. Ecol. Environ. Res. 18, 4179–4194. doi: 10.15666/aeer/1803_41794194
Wang, H., Li, J., Fan, F., Han, X., Liu, S., Li, Z., et al. (2018a). Evapotranspiration model and crop coefficient of greenhouse eggplant in north China. Chin. J. Eco-Agric. 26, 1819–1827. doi: 10.13930/j.cnki.cjea.180192
Wang, X., Liu, H., Zhang, R., Li, Y. (2014). Research on the estimating methods for reference crop evapotranspiration in hetao irrigation district. Agric. Res. Arid Areas 32, 95–101. doi: 10.7606/j.issn.1000-7601.2014.03.016
Wang, Q., Wang, K., Su, L., Zhang, J., Wei, K. (2021). Effect of irrigation amount, nitrogen application rate and planting density on cotton leaf area index and yield. Trans. Chin. Soc Agric. Mach. 52, 300–312. doi: 10.6041/j.issn.1000-1298.2021.12.032
Wang, S., Zhang, H., Ba, C., Wang, Y., Huang, C., Xue, X., et al. (2018b). Effect of regulated deficit irrigation on growth and water use of pepper with mulched drip irrigation. Agric. Res. Arid Areas 36, 31–38. doi: 10.7606/j.issn.1000-7601.2018.03.05
Wang, Y., Zhang, X., Lu, L., Gu, N., Wang, Z., Liu, M., et al. (2020b). Estimation of crop coefficient and evapotranspiration of summer maize by path analysis combined with BP neural network. Trans. Chin. Soc Agric. Eng. 36, 109–116. doi: 10.11975/j.issn.1002-6819.2020.07.012
Wang, W., Zhao, X., Zhang, M., Li, H., Lan, H., Shi, Y. (2019). Public perception of water resources and water-saving intention in arid inland river basins of northwestern China: a case study of the hexi corridor in gansu province. China Popul. Resour. Environ. 29, 148–157. doi: 10.12062/cpre.20190512
Wei, Y., Ma, Y., Feng, D., Xiong, J., Zhang, Y., Zhang, Y. (2017). Characteristics of water dynamic response and growth of root and crown of maize under drip irrigation of regulated deficit irrigation. Trans. Chin. Soc Agric. Mach. 48, 180–188. doi: 10.6041/j.issn.1000-1298.2017.07.023
Wright, J. (1982). New evapotranspiration crop coefficients. J. Irrig. Drain. Division-ASCE 108, 57–74. doi: 10.1061/jrcea4.0001372
Wu, G., Wang, K. (2008). Effect of water treatment on vegetative and fruit growth and fruit quality of watermelon. J. Agric. Univ. Hebei 31, 37–41. doi: 10.3969/j.issn.1000-1573.2008.02.008
Yang, H., Liu, H., Zheng, J., Huang, Q. (2018). Effects of regulated deficit irrigation on yield and water productivity of chili pepper (Capsicum annuum l.) in the arid environment of Northwest China. Irrig. Sci. 36, 61–74. doi: 10.1007/s00271-017-0566-4
Yang, W., Zhao, J., Zhao, Y., Wang, Q. (2022). Factors affecting evapotranspiration analyzed based on a structural equation model. J. Tsinghua Univ. (Science Technology) 62, 581–588. doi: 10.16511/j.cnki.qhdxxb.2021.22.031
Yavuz, D., Seymen, M., Yavuz, N., Çoklar, H., Ercan, M. (2021). Effects of water stress applied at various phenological stages on yield, quality, and water use efficiency of melon. Agric. Water Manage. 246, 106673. doi: 10.1016/j.agwat.2020.106673
Yun, W., Hou, Q., Li, J., Miao, B., Feng, X. (2015). Yield prediction of sunflower based on crop coefficient and water production function. J. Appl. Meteorol. Sci. 26, 705–713. doi: 10.11898/1001-7313.20150607
Zeng, J. (2018). Water consumption characteristics and irrigation schedule of mountain apple tree of surge-root irrigation in loess hilly-gullied area of northern shaanxi (Shangxi: Xi’an University of Technology).
Zhang, B., Liu, G., Dai, Y., Zhou, J., Li, Y., Chen, Z., et al. (2009). Effect of irrigation frequency on plant growth, yield and fruit quality of greenhouse mini watermelon. China Cucurbits Veg. 91, 7–9. doi: 10.3969/j.issn.1673-2871.2009.06.003
Zhang, Z., Liu, S., Jia, S., Du, F., Qi, H., Li, J., et al. (2021). Precise soil water control using a negative pressure irrigation system to improve the water productivity of greenhouse watermelon. Agric. Water Manage. 258, 107144. doi: 10.1016/j.agwat.2021.107144
Zhang, Y., Zhang, L., Zhang, H., Song, C., Lin, G., Han, W. (2019). Crop coefficient estimation method of maize by UAV remote sensing and soil moisture monitoring. Trans. Chin. Soc Agric. Eng. 35, 83–89. doi: 10.11975/j.issn.1002-6819.2019.01.010
Zhao, X., Lei, O., Zhao, P., Zhang, C. (2018). Effects of size and microclimate on whole-tree water use and hydraulic regulation in schima superba trees. PeerJ 6, e5164. doi: 10.7717/peerj.5164
Zheng, J. (2009). Research on high efficient water use mechanism and irrigation model of mini-watermelon in greenhouse (Shangxi: Northwest A & F University).
Zhou, C., Zhang, H., Li, F., Wang, Y., Wang, Y., Wang, Z. (2022). Deficit mulched drip irrigation improved yield and quality while reduced water consumption of Isatis indigotica in a cold and arid environment. Front. Plant Sci. 13. doi: 10.3389/fpls.2022.1013131
Zuniga, M., Ortega-Farias, S., Fuentes, S., Riveros-Burgos, C., Poblete-Echeverria, C. (2018). Effects of three irrigation strategies on gas exchange relationships, plant water status, yield components and water productivity on grafted carménère grapevines. Front. Plant Sci. 9. doi: 10.3389/fpls.2018.00992
Keywords: water stress, reference crop evapotranspiration, water consumption characteristics, meteorogical factors, watermelon, leaf area index
Citation: Zhang H, Wang Z, Yu S, Teng A, Zhang C, Lei L, Ba Y and Chen X (2023) Crop coefficient determination and evapotranspiration estimation of watermelon under water deficit in a cold and arid environment. Front. Plant Sci. 14:1153835. doi: 10.3389/fpls.2023.1153835
Received: 30 January 2023; Accepted: 03 May 2023;
Published: 16 June 2023.
Edited by:
Silvana Scalon, Federal University of Grande Dourados, BrazilReviewed by:
Semih Metin Sezen, Çukurova University, TürkiyeCopyright © 2023 Zhang, Wang, Yu, Teng, Zhang, Lei, Ba and Chen. This is an open-access article distributed under the terms of the Creative Commons Attribution License (CC BY). The use, distribution or reproduction in other forums is permitted, provided the original author(s) and the copyright owner(s) are credited and that the original publication in this journal is cited, in accordance with accepted academic practice. No use, distribution or reproduction is permitted which does not comply with these terms.
*Correspondence: Hengjia Zhang, NTk2MDg4NjgzQHFxLmNvbQ==
†These authors have contributed equally to this work
Disclaimer: All claims expressed in this article are solely those of the authors and do not necessarily represent those of their affiliated organizations, or those of the publisher, the editors and the reviewers. Any product that may be evaluated in this article or claim that may be made by its manufacturer is not guaranteed or endorsed by the publisher.
Research integrity at Frontiers
Learn more about the work of our research integrity team to safeguard the quality of each article we publish.