
95% of researchers rate our articles as excellent or good
Learn more about the work of our research integrity team to safeguard the quality of each article we publish.
Find out more
ORIGINAL RESEARCH article
Front. Plant Sci. , 07 September 2023
Sec. Plant Nutrition
Volume 14 - 2023 | https://doi.org/10.3389/fpls.2023.1144514
This article is part of the Research Topic Increasing Production of Crops with Bioavailable Micronutrients: A Solution to Reduce Global Malnutrition View all 8 articles
 Yan-Fang Xue1,2,3*
 Xiao-Jing Li1,2,4
 Wei Yan1,2Qi Miao5Chun-Yan Zhang6Meng Huang1,2Jin-Bian Sun1,2,3Shi-Jun Qi1,2Zhao-Hua Ding1,2
 Zhen-Ling Cui1,2,5*
Fertilizer-based biofortification is a strategy for combating worldwide malnutrition of zinc (Zn), iron (Fe) and selenium (Se). Field experiments were conducted to investigate the effects of foliar treatments on concentrations of Zn, Fe, Se, N and bioavailability of Zn and Fe in grains of three maize cultivars grown at three locations. We compared the efficacy of ZnO nanoparticles (ZnO-NPs), Zn complexed chitosan nanoparticles (Zn-CNPs), conventional ZnSO4 and a cocktail solution (containing Zn, Fe and Se). All treatments were foliar-applied at rate of 452 mg Zn L–1, plus urea. Applying ten-fold less Zn (at rate of 45.2 mg Zn L–1) plus urea in the form of ZnO-NPs, Zn-CNPs, or ZnSO4 resulted in no increase, or a negligible increase, in grain Zn concentration compared with deionized water. By contrast, among the different Zn sources plus urea applied by foliar sprays, conventional ZnSO4 was the most efficient in improving grain Zn concentration. Furthermore, foliar application of a cocktail solution effectively improved grain concentrations of Zn, Fe, Se and N simultaneously, without a grain yield trade-off. For example, the average grain concentrations were simultaneously increased from 13.8 to 22.1 mg kg–1 for Zn, from 17.2 to 22.1 mg kg–1for Fe, from 21.4 to 413.5 ug kg–1 for Se and from 13.8 to 14.7 g kg–1 for N by foliar application of a cocktail solution. Because grain yield was significantly negatively correlated with grain nutrient concentrations, the magnitude of increase in grain concentrations of Zn and Fe was most pronounced in the maize cultivar with the lowest grain yield (Zhengdan958 grown in Linyi). Foliar application of a cocktail solution also significantly decreased the phytic acid (PA) concentration, ratios of PA/Fe and PA/Zn in grains, indicating an increased bioavailability of Fe and Zn for human health. In conclusion, we found that a foliar application of a cocktail solution including Zn, Fe, Se and N was most effective for biofortification, but that the grains with the lowest yield contained the greatest concentration of these elements. This finding highlights the need to breed maize varieties that are capable of achieving both high grain yield and high grain nutritional quality to address food security and human health challenges.
Malnutrition of micronutrients including zinc (Zn), iron (Fe), and selenium (Se), commonly known as hidden hunger, is a serious global health problem because these micronutrient deficiencies affect more than one-third of the global population (Welch et al., 2013). Deficiencies of these micronutrients not only impair growth and development owing to their essential roles in metabolism but also negatively affect the immune system of the body against virulent pathogens (Bailey et al., 2015; Read et al., 2019). Insufficient dietary intake of micronutrients and limited dietary diversity are thought to be responsible for human micronutrient deficiencies. These factors are especially important in developing countries, where high proportions of cereal grains with inherently low concentrations of Zn, Fe and Se, such as wheat, rice and maize, are consumed as staple foods (Wang et al., 2013; Beal et al., 2017; Cakmak and Kutman, 2018). The bioavailability of Zn and Fe in cereal grains is also relatively low due to the presence of antinutritional compounds such as phytic acid (PA) and phenolic compounds (Welch and Graham, 2004).
Maize is a major cereal crop and food source for both humans and animals, with a global production of 1210 million tons in 2021. In China, maize production reached 273 million tons in 2021, accounting for 43% of Chinese cereal production and 22.5% of the global maize output (Food and Agriculture Organization of the United Nations (FAO), 2022). It is estimated that maize, as a dietary staple for more than 200 million people, provides around 15% of the world’s protein and 20% of the world’s calories (Nuss and Tanumihardjo, 2010). Micronutrient concentrations in feed and food derived from plants positively affect animal and human health and wellbeing (Grujcic et al., 2018). Therefore, adequate micronutrient concentrations in maize plants are very important for crop productivity and nutritional value.
Among the approaches for biofortification of micronutrient in staple foods, genetic (i.e. plant breeding) and agronomic (i.e. use of fertilizers) approaches are used widely. Fe-biofortified rice, beans, and pearl millet, Zn-biofortified wheat and rice, and provitamin A-biofortified maize, cassava and sweet potatoes have been achieved by conventional breeding strategies (Andersson et al., 2017; Maqbool and Beshir, 2018). Maize, has a much smaller genetic range in grain concentrations of Zn and Fe, limiting the utility of selection-based biofortification (Ortiz-Monasterio et al., 2007; Maqbool and Beshir, 2018). Agronomic biofortification, a fertilizer-based approach, is highly effective in improving grain concentrations of the targeted micronutrients in food crops, as has been demonstrated in wheat, rice, and maize for Zn, Fe, Se and I (Zhang et al., 2010; Wang et al., 2012; Zou et al., 2012; Wang et al., 2013; Mao et al., 2014; Cakmak et al., 2017). These studies also showed that foliar applcations of Zn, I or Se were more effective compared with soil applications for increasing grain concentrations (Wang et al., 2012; Zou et al., 2012; Wang et al., 2013; Cakmak et al., 2017). Compared with foliar appliation of Zn alone, foliar spray of Zn plus nitrogen (N) further improves Zn concentration and Zn bioavailability in wheat grain and flour, indicating a promising strategy for Zn fortification of wheat (Li et al., 2015). Recently, several studies showed that foliar spray of a mixture of micronutrient solution containing simultaneously Zn, Se, I and/or Fe to wheat and rice grown in different countries greatly increased grain concentrations of Zn, Se and I (Zou et al., 2019; Prom-u-thai et al., 2020; Naeem et al., 2022). However, little information is available regarding the effects of foliar spraying a mixture of micronutrients in solution on grain concentrations and bioavailability in maize.
Although foliar application of Zn fertilizer generally had beneficial effects on grain Zn concentration of crops, the effect was dependent on the formulation, the source and the particle size (Palacio-Márquez et al., 2021). The most commonly used Zn foliar sprays are soluble Zn solutions (e.g. ZnSO4·7H2O and ZnCl2) and chelated Zn formulations (e.g. Zn-EDTA) (Montalvo et al., 2016; Veena and Puthur, 2022). Wei et al. (2012) reported that the effectiveness of foliar applied Zn-amino acid and ZnSO4·7H2O were higher than Zn-EDTA and Zn-citrate for improvement of Zn concentration in rice. Another study revealed that foliar application of ZnSO4·7H2O alone was more efficient at promoting Zn sorption of cotton plants and citrus leaf compared with ZnSO4·7H2O combined with EDTA (Stacey and Oosterhuis, 2007). Recently, Zn oxide nanoparticles (ZnO-NPs) have garnered much research interest because nanoparticles are known to be efficiently absorbed, accumulated, and metabolized in plants due to their high surface area to volume ration and less volatilization (Milani et al., 2015). Several studies have shown that, compared to the conventional ZnSO4·7H2O fertilizers, foliar-applied ZnO-NPs were more effcicent at increasing grain Zn concentration of wheat and maize (Subbaiah et al., 2016; Zhang et al., 2018). In addtion, foliar application of Zn complexed chitosan nanoparticles (Zn-CNPs) resulted in a 26.4% of increase in wheat grain yield and 51.3% increase in wheat grain Zn concentration from 31.0 to 46.9 mg kg–1 (Kumar et al., 2021). Furthemore, foliar spray of Zn-CNPs containing the equivalent of 40 mg Zn kg–1 could enhance grain Zn concentration in wheat by 36%, similar to the level achieved with 400 mg Zn kg–1 applied conventionally an ZnSO4·7H2O. This comparison highlights the utility of Zn-CNPs as a novel nanofertilizer which enhanced fertilizer use efficiency (Dapkekar et al., 2018). Zn-CNPs have spherical-shaped porous architecture made of cross-linked chitosan sodium tripolyphosphate nanomatrix with -NH2 and –OH functional groups to enable encapsulation of Zn ions. The main incentive of encapsulating Zn into a chitosan nanomatrix is to manage the slow release of Zn ions through diffusion via dissolution of the chitosan nanomatrix (Choudhary et al., 2019). Therefore, it is necessary to evaluate the effects of foliar application of nano-Zn fertilizers (e.g. ZnO-NPs and Zn-CNPs) on the grain Zn concentration and its bioavailability and to quantify the fertilizer-saving potential in comparison with the conventional ZnSO4·7H2O under field conditions.
The objective of the present study was therefore to investigate: (i) the effects of foliar spray of a cocktail solution including Zn, Fe, Se and N simultaneously on grain yield and grain concentrations of these nutrients in different maize cultivars grown at different filed locations; (ii) the effects of different forms (conventional ZnSO4·7H2O, ZnO-NPs, and Zn-CNPs) and doses of foliar Zn fertilizers on grain Zn concentration; and (iii) the effects of foliar treatments on the Fe and Zn bioavailability in maize grain.
Chitosan (Mol. Wt. 50,000–190,000 Da and 75-85% N-deacetylation) and sodium tripolyphosphate were purchased from Sigma-Aldrich (Shanghai) Trading Co.Ltd. Commercial ZnO NPs were purchased from Shanghai Macklin Biochemical Co., Ltd, with a purity of 99.9% and particle size of 30 ± 10 nm provided by the producer. Zinc sulphate heptahydrate (ZnSO4·7H2O) and other analytical reagents were purchased from Sinopharm Chemical Regent Co., Ltd, China.
The Zn-CNPs solution was prepared as described by Dapkekar et al. (2018) with some modifications. Briefly, chitosan (3 g) was dissolved in 960 mL of acetic acid (1%, v/v) and the solution was stirred on a magnetic stirrer at ambient temperature (25 ± 3°C) for 1 h and ZnSO4·7H2O (2 g) was dissolved in chitosan solution. 40 mL of sodium tripolyphosphate (1%, w/v) was then added dropwise to the above solution to form Zn-CNPs solution, which was stirred continuously on magnetic stirrer until there was no precipitation. The content of Zn in this prepared Zn-CNPs solution is 452 mg kg−1. In addition, this Zn-CNPs solution was also diluted to 45.2 mg Zn kg−1 for foliar Zn treatments.
Field experiments were conducted at three field locations from June to October in 2021 in a winter wheat–summer maize rotation system. The three experimental sites were located at Longshan experimental station of Shandong Academy of Agricultural Sciences in Jinan, Jingzhong experimental station in Zibo and Linyi Academy of Agricultural Sciences in Linyi. The three test sites above are located in Shandong Province, which is one of the major agriculture regions of China and provides around 10% of the national maize production (National Bureau of Statistics of China, 2022). Soil pH (1:2.5 w/v in water), organic carbon, total N, Olsen P, NH4OAc-K, DTPA-extractable concentrations of Zn, Fe, Mn and Cu and total Se were shown in Table 1.
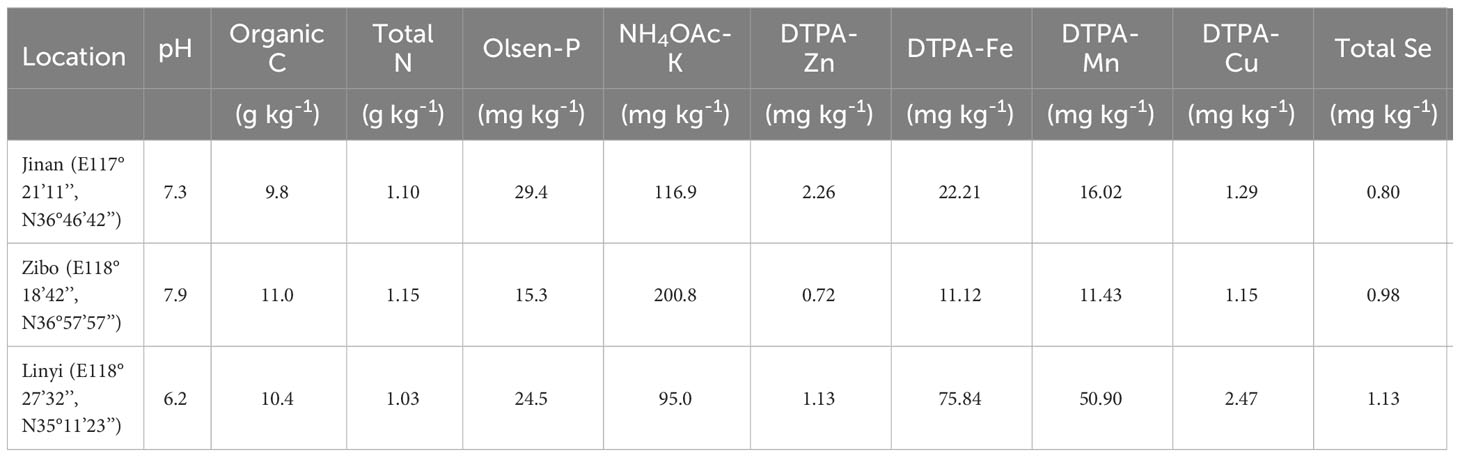
Table 1 Soil properties for the 0–30 cm depth at three experimental locations.
The experimental design was a split plot design with three replicates. Three maize cultivars (Zea mays L.) were planted as the main plots and eight foliar treatments were designated as subplots. Zhengdan958, Denghai605 and Ludan510 (recorded as ZD958, DH605 and LD510, respectively) developed in different years were used in this study. ZD958, released in 1996, represented most widely cultivated new-era cultivar nationally. DH605, released in 2010, represented most widely cultivated new-era cultivar in Shandong Province, China. LD510, newly released in 2021, had high-yielding potential with good performance in rust resistance and lodging resistance. The latter two green-stay hybrids (Figure S1) also had the characteristics of dual-purpose grain and silage. Each main plot was designed with an area of 180 m2, containing 30 rows (a row spacing of 60 cm) with each row being 10 m long. The average harvest densities were 7.0, 5.7 and 6.2 plants m–2 for each cultivar in Jinan, Zibo and Linyi, respectively. In Jinan, 108 kg N ha–1 as urea, 60 kg of P2O5 ha–1 as superphosphate and 90 kg of K2O ha–1 as potassium sulphate were applied before sowing and 72 kg N ha–1 as urea was topdressed at 12-leaf stage. Controlled-release fertilizer at the rate of 900 kg ha–1 was single applied as basal fertilizer in Zibo (N-P2O5-K2O:26-11-8) and Linyi (N-P2O5-K2O:26-11-11). After the fertilizers were applied, the field plots were immediately irrigated at each location. No obvious water, weed, or pest was observed during the growing season.
Eight foliar treatments were designated as follows: deionized water (control), urea alone (U), urea plus ZnO-NPs at low rate (U+LZnONPs); urea plus Zn-CNPs at low rate (U+LZnCNP), urea plus ZnO-NPs at high rate (U+HZnONPs), urea plus Zn-CNPs at high rate (U+HZnCNP), urea plus ZnSO4·7H2O (U+Zn), and mixture of urea, ZnSO4·7H2O, FeSO4·7H2O and Na2SeO3 (Cocktail) (Table 2). Our preliminary experiment shows that foliar spray of ZnSO4·7H2O at rate of 2000 mg kg–1 (equivalent to 452 mg Zn kg–1) is suitable, above which the leaves of maize exhibit obvious toxicity symptoms. Therefore, the different Zn forms were foliar applied at 452 mg Zn kg–1 for the latter four treatments. To evaluate the fertilizer-saving potential by use of nano-Zn fertilizers (ZnO-NPs and Zn-CNPs) versus conventional ZnSO4·7H2O, 10-fold less Zn was foliar applied for treatments U+LZnO and U+LCNP (equivalent to 45.2 mg Zn kg–1) (Table 2). The Zn content was calculated by considering 22.6% of Zn in ZnSO4·7H2O and 80% of Zn in ZnO-NPs. For all the foliar treatments, tween 20 as a surfactant (0.01%, w/v) and/or urea (2%, w/v) were freshly added before starting foliar spray. All suspensions were ultrasonicated before leaf application. In order to avoid mutual contamination during foliar treatments, a total of eight rows of maize (with 2 rows of maize spaced between each foliar treatment) were selected and twenty-eight plants grown uniformly from the same row were tagged from each main plots before tasseling stage. The foliar applications were conducted three times every 7–10 days (depending on weather conditions) from tasseling stage on cloudy days or after sunset with windless conditions. 950 L ha–1 of each solution was used up at each foliar application for a total of nine split plots at each location.
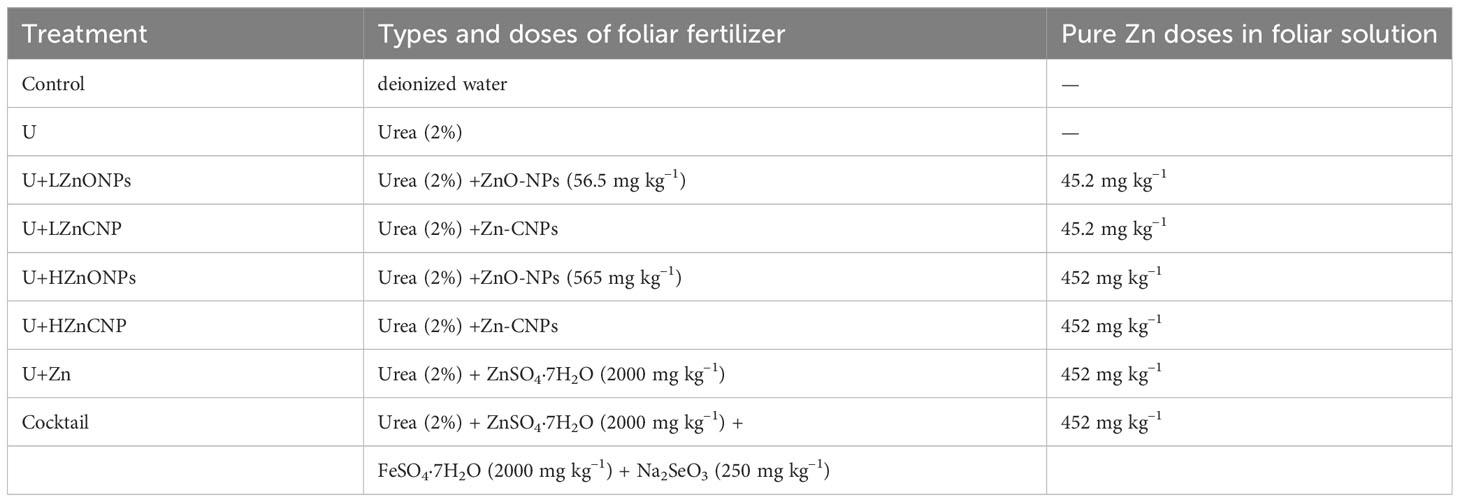
Table 2 Eight foliar treatments including fertilizer types and doses.
Photosynthetic parameters including net photosynthetic rate (Pn), transpiration rate (Tr), stomatal conductance (gs), and intercellular CO2 concentration (Ci) were measured using a portable Li-6800 photosynthesis system (LI-COR Inc., Lincoln, NE, United States). The ear leaves of plants at 30 and 45 days after silking (DAS) were selected for measurement between 09:00 and 11:00. The photosynthetically active radiation, temperature, and CO2 concentration during measurement collection were set at 1200 μmolm−2 s−1, 25 °C and 400 μmol mol−1, respectively. During each measurement, three leaves were taken from each of three replicates of each cultivar grown only in Jinan with four selected foliar treatments including U+HZnONPs, U+HZnCNP, U+Zn and control treatment.
At maturity, twenty spikes treated with foliar application in one row of each split plot were harvested to determine the grain yield (at 15.5% moisture). Sub-samples of three-plant samples were collected and divided into grain and straw. All samples were rapidly washed with deionized water and then oven-dried at 70 °C to determine the dry weight. The dried samples were ground with a stainless steel grinder and then digested using an acid mixture of HNO3–H2O2 in a microwave accelerated reaction system (CEM Corp., Matthews, NC, United States). The concentrations of Zn, Fe, manganese (Mn), copper (Cu), calcium (Ca), magnesium (Mg), phosphorus (P), and K (potassium) in the digested solutions were determined by inductively coupled plasma optical emission spectrometry (ICP-OES, Avio™ 200, PerkinElmer, Waltham, MA, United States). Selenium and boron (B) in the digested solutions were determined by inductively coupled plasma optical emission spectrometry (ICP-MS, NexION® 1000, PerkinElmer, Waltham, MA, United States). Two blanks and a certified reference material (IPE556 grain or IPE883 straw, Wageningen University, the Netherlands) were included in each batch of digestion to ensure analytical quality. Nitrogen concentration in grain samples was determined using a CN analyzer (vario Macro cube, Elementar, Hanau, Germany). Phytate P concentration was analyzed according to the method of Haug and Lantzsch (1983). Phytate P was converted to PA by dividing by 0.282. A tri-variate model that considers Zn and PA in diet, as well as Zn homeostasis in the human intestine has been developed widely used to predict total daily absorbed Zn (TAZ) (Miller et al., 2007). The TAZ is based on reference adults who consume maize flour (300 g day–1) as a sole source of Zn and PA and is termed “estimated Zn bioavailability”. The molar ratios of PA to Fe or Zn are often used as indicators for the bioavailability of these minerals (Ryan et al., 2008).
The significance of the effects of the experimental locations, maize cultivars and foliar treatments as well as their double and triple interactions on the reported parameters was evaluated by analysis of variance (ANOVA) using SAS software (SAS 8.0, SAS Institute, Cary, NC, USA). Significant differences between treatment means were determined using Fisher’s protected least significant difference (LSD) test at the 5% level (P < 0.05). The relationships among all the investigated parameters were determined by Pearson’s correlation analysis performed by OriginPro 2021. Principal component analysis (PCA) was performed using RStudio to compare the effects of experimental locations, maize cultivars and foliar treatments on various parameters investigated.
Three-way ANOVA revealed that grain yield and biomass were first significantly affected by experimental locations, followed by maize cultivars, but not foliar treatments and their double and triple interactions with an exception of a significant effect of the interaction between locations and cultivars on the biomass accumulation (Supplementary Table 1). Figure 1 showed that grain yield gradually increased in the order ZD958<DH605<LD510 at each experimental location. The average grain yield of LD510 and DH605 was 11.6% and 5.2% of higher than ZD958, respectively. Across the three locations, average grain yield in Jinan and Zibo was 28.2% and 25.6% of higher than in Linyi, respectively. However, compared with the control treatment, other foliar treatment generally had less effect on grain yield (Figures 1A-C). Similar results were also found for biomass accumulation (Figures 1D-F).
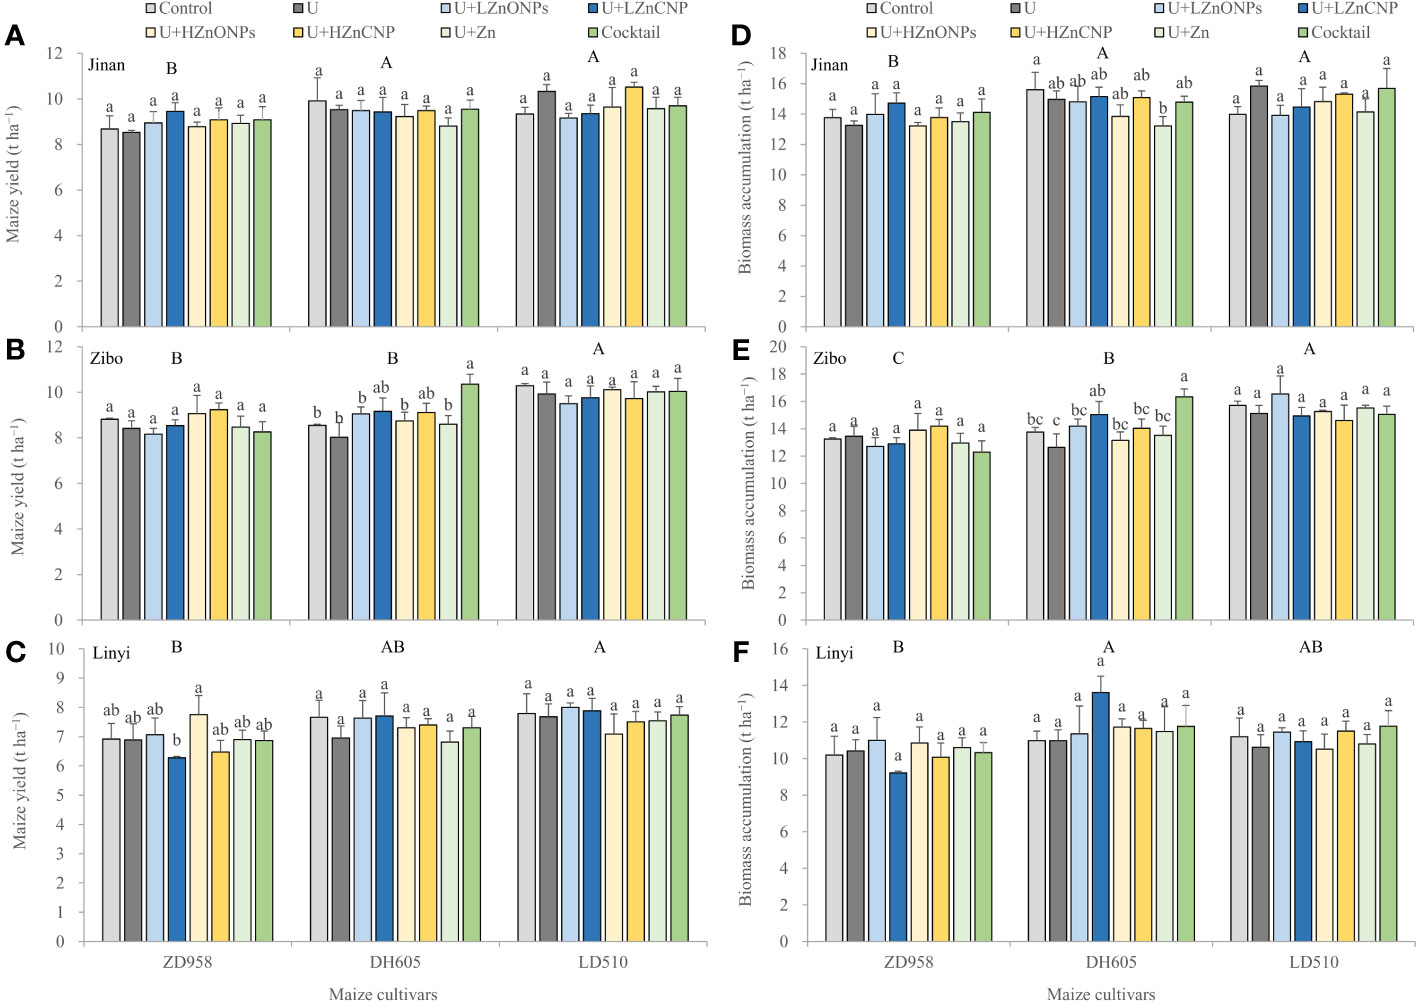
Figure 1 Effects of foliar treatments on grain yield (A-C) and biomass accumulation (D-F) of different maize cultivars grown in Jinan, Zibo and Linyi, respectively. Error bars represent the standard error of the mean (n = 3). Bars with different lowercase letters represent significant differences among the different foliar treatments within each maize cultivar; bars with different uppercase letters represent significant differences between different maize cultivars (P < 0.05). Control: deionized water; U: urea alone; U+LZnONPs: urea plus ZnO-NPs at low rate; U+LZnCNP: urea plus Zn-CNPs at low rate; U+HZnONPs: urea plus ZnO-NPs at high rate; U+HZnCNP: urea plus Zn-CNPs at high rate; U+Zn: urea plus ZnSO4·7H2O; Cocktail: mixture of urea, ZnSO4·7H2O, FeSO4·7H2O and Na2SeO3.
Two-way ANOVA revealed significant differences between maize cultivars grown in Jinan in the leaf Pn, Gs, Tr and Ci values, but no significant effects of foliar treatments and the interaction between maize cultivars and foliar treatments on these photosynthetic parameters at 30 DAS and 45 DAS (Supplementary Table 2). Therefore, data from different foliar treatments were pooled for each maize cultivar for further statistical analysis. Figure 2 showed that DH605 had significantly higher leaf Pn compared with ZD958 while LD510 had an immediate value at 30 DAS. In addition, LD510 had significantly higher leaf Gs, Tr and Ci values compared with ZD958 while DH605 had immediate values at 30 DAS. At 45 DAS, LD510 and DH605 had significantly higher Pn and Gs compared with ZD958 while there was no significant different between LD510 and DH605. There were also no significant differences in Tr and Ci values among the three cultivars at 45 DAS. With the advance of maize growth, leaf photosynthetic parameters including Pn, Gs, Tr and Ci decreased significantly at 45 DAS compared with at 30 DAS.
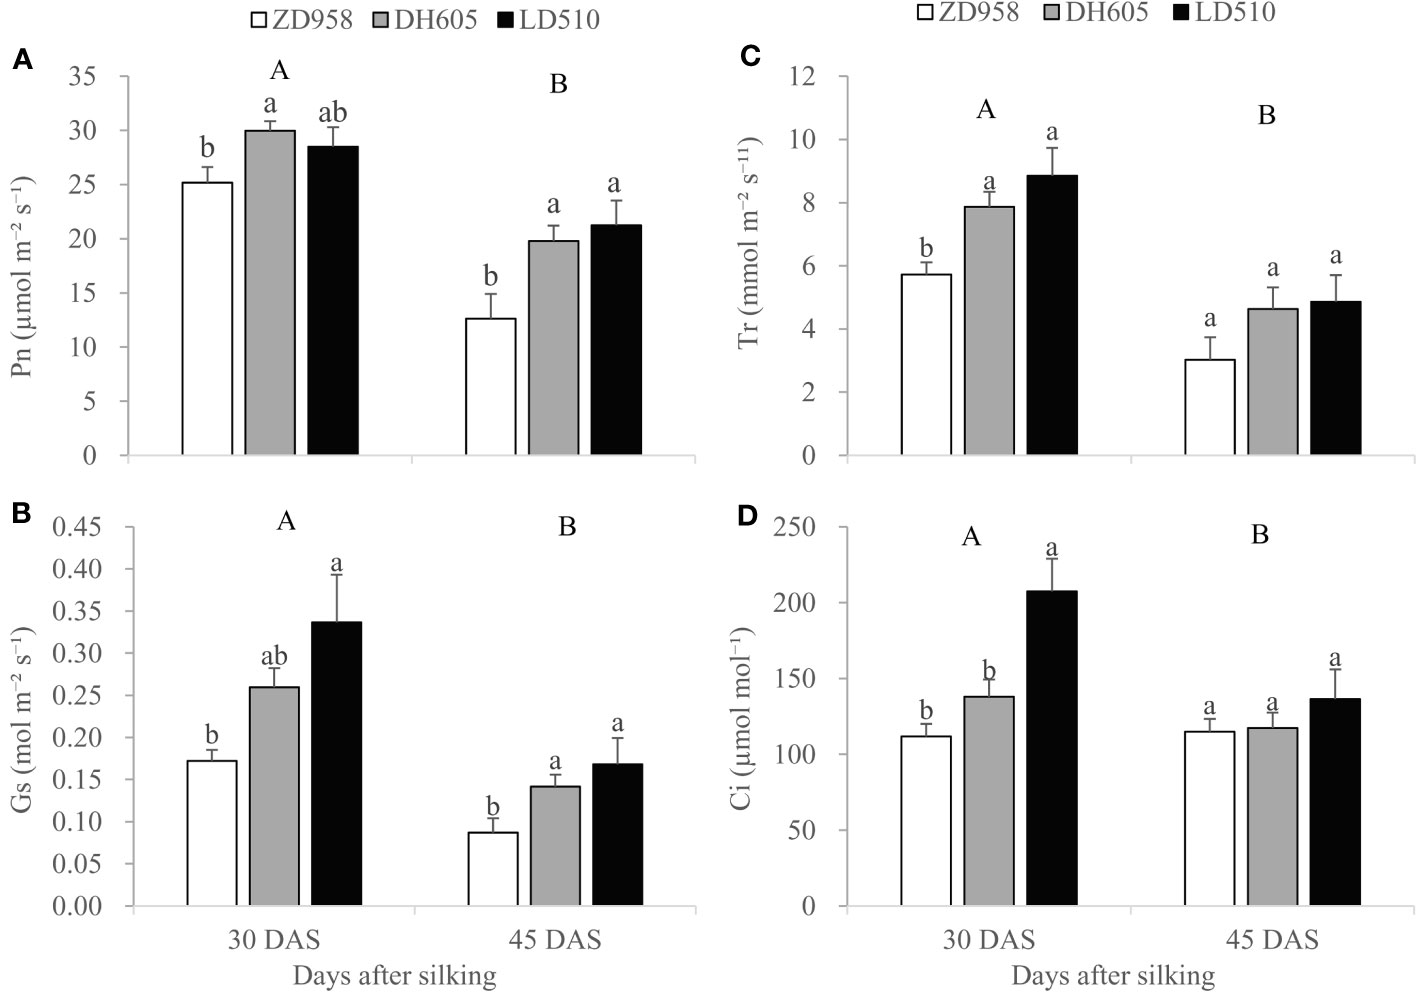
Figure 2 Photosynthetic parameters including Pn(A), Gs (B), Tr (C), and Ci (D) of ear leaves of three maize cultivars at 30 and 45 days after silking (DAS) grown in Jinan. Error bars represent the standard error of the mean (n = 3). Bars with different lowercase letters represent significant differences among the different maize cultivars within each growth stage; bars with different uppercase letters represent significant differences between different growth stages (P < 0.05). Pn, photosynthetic rate; Gs, conductance to H2O; Tr, transpiration rate; Ci, intercellular CO2 concentration.
As shown in Figures 3A-C, grain Zn concentration ranged from 11.2 to 31.8 mg kg–1. Irrespective of maize cultivars and locations, compared with control treatment, treatment U did not significantly increased grain Zn concentration with an exception of a significant increase in LD510 grown in Jinan. Treatments U+LZnONPs and U+LZnCNP did not also significantly or slightly increased grain Zn concentration compared with control. However, grain Zn concentration was substantially increased by 36.6–134.0% for ZD958, 11.1–77.1% for DH605 and 18.5–74.9% for LD510 by treatments U+HZnONPs, U+HZnCNP, U+Zn and cocktail compared with control across the three locations. Among the three maize cultivars, the average grain Zn concentration increased in the order LD510<DH605<ZD958. Across the three locations, the average grain Zn concentration increased in the order Jinan<Zibo<Linyi. With high foliar Zn application rate, treatments U+Zn and especially cocktail generally resulted in the highest grain Zn concentration, followed by U+HZnONPs and then U+HZnCNP compared with control (Figures 3A-C). Totally, treatments U+Zn and cocktail resulted in the most obvious improvement in grain Zn concentration of ZD958 grown in Linyi. For example, in Linyi, grain Zn concentration was substantially increased from 13.6 to 31.2 mg kg–1 for ZD958, from 15.3 to 26.1 mg kg–1 for DH605 and from 11.9 to 20.6 mg kg–1 for LD510 by treatments U+Zn and cocktail compared with the control treatment, respectively.
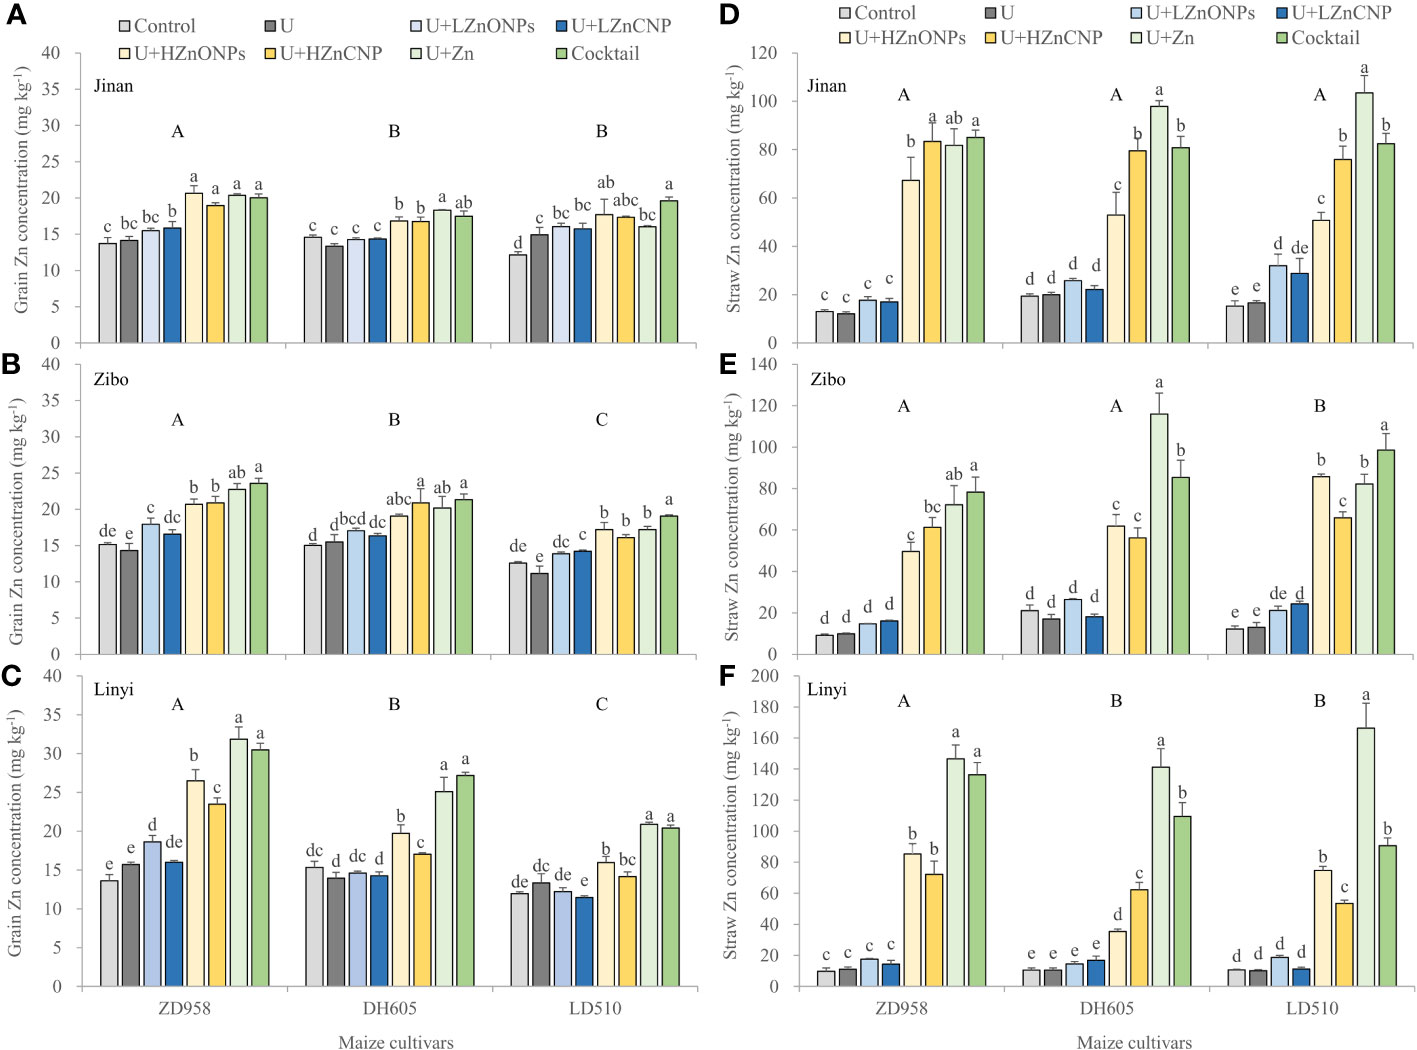
Figure 3 Effects of foliar treatments on Zn concentrations of grain (A-C) and straw (D-F) of different maize cultivars grown in Jinan, Zibo and Linyi, respectively. Error bars represent the standard error of the mean (n = 3). Bars with different lowercase letters represent significant differences among the different foliar treatments within each maize cultivar; bars with different uppercase letters represent significant differences between different maize cultivars (P < 0.05). Control: deionized water; U: urea alone; U+LZnONPs: urea plus ZnO-NPs at low rate; U+LZnCNP: urea plus Zn-CNPs at low rate; U+HZnONPs: urea plus ZnO-NPs at high rate; U+HZnCNP: urea plus Zn-CNPs at high rate; U+Zn: urea plus ZnSO4·7H2O; Cocktail: mixture of urea, ZnSO4·7H2O, FeSO4·7H2O and Na2SeO3.
Grain Fe concentration ranged from 14.4 to 33.1 mg kg–1 (Figure S2), grain Se concentration ranged from 11.5 to 717.6 ug kg–1 (Figure S3) and grain N concentration ranged from 12.4 to 16.6 g kg–1 (Figure S4), all of which were significantly affected by locations, cultivars, foliar treatments and their double and triple interactions (Table 3). Across the three locations, the average concentrations of grain Fe, Se and N consistently and significantly increased in the order Jinan<Zibo<Linyi. However, grain PA concentration was significantly lower in Zibo than in Jinan and Linyi. Among the three maize cultivars, the average grain Fe concentration significantly increased in the order LD510<DH605<ZD958. Grain Se concentration of LD510 was significantly lower than that of DH605 and ZD958. There was no significant difference between DH605 and ZD958 in grain Se concentration. Average grain concentrations of N and PA significantly increased in the order ZD958<LD510<DH605 (Table 3). For the foliar treatments, grain Fe concentration was not significantly affected by treatment U and U+LZnCNP, and was increased by 6.4% by treatment U+LZnONPs, increased by around 15% by treatments U+HZnONPs and U+HZnCNP, substantially increased by 26.2% by treatment U+Zn and 29.4% by treatment cocktail, compared with the control. Grain Se concentration was substantially increased from a mean value of 21.4 ug kg–1 with control treatment to 413.5 ug kg–1 with cocktail while it was not significantly affected by the other foliar treatments (Table 3, Figure S3). Compared with the control, grain N concentration was significantly increased by 4.4–7.1% by the other seven foliar treatments. However, grain PA concentration was significantly decreased by 6.3–10.6% by the latter four foliar treatments (U+HZnONPs, U+HZnCNP, U+Zn and cocktail) and was not significantly affected by treatments U, U+LZnONPs and U+LZnCNP compared with the control (Table 3). In addition, eight foliar treatments did not significantly affect grain concentrations of Mn, Cu, B, K, Mg and Ca (Supplementary Table 3).
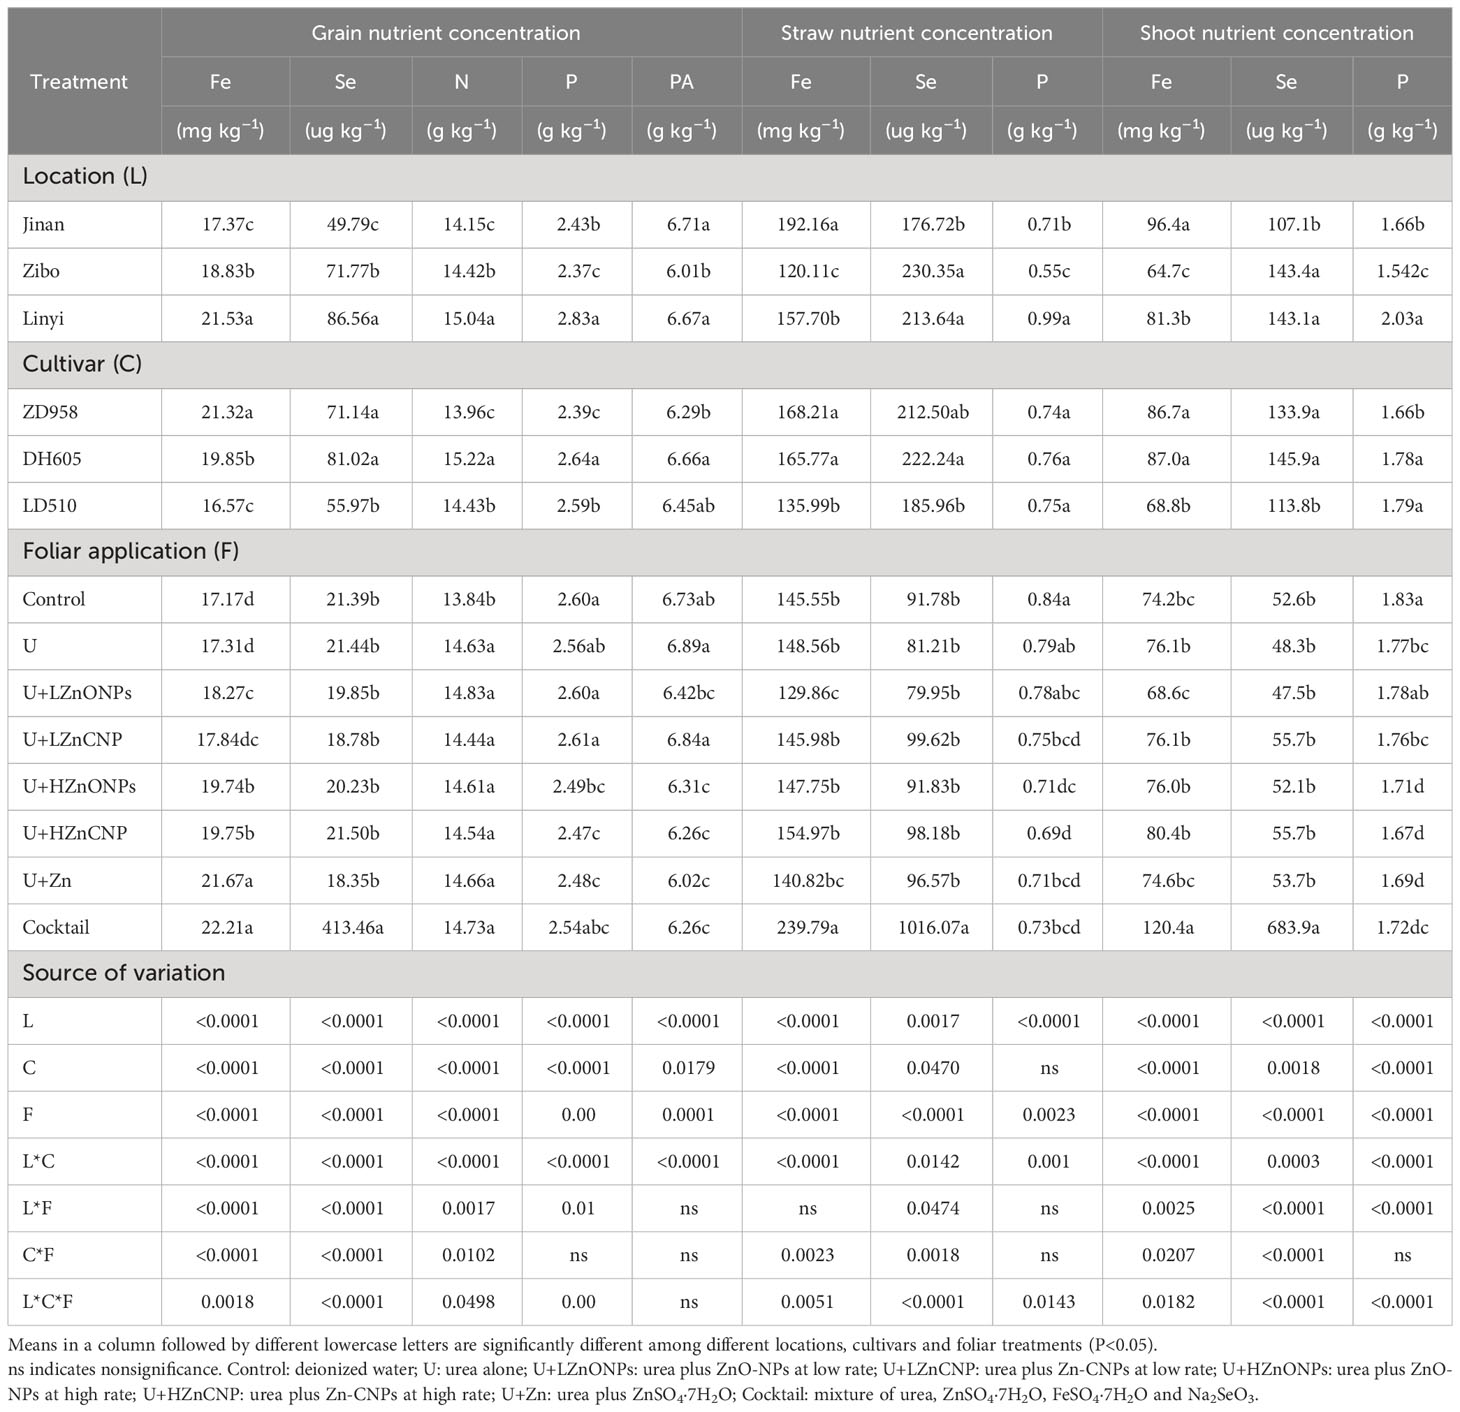
Table 3 Nutrient concentrations in grain (Fe, Se, N, P and PA), straw and shoot (Fe, Se and P) of three maize cultivars with foliar treatments at three experimental locations.
Straw Zn concentration ranged from 9.2 to 166.3 mg kg–1 (Figures 3D-F), straw Fe concentration ranged from 79.1 to 347.9 mg kg–1 (Figure S2), and straw Se concentration ranged from 37.0 to 1512.1 ug kg–1 (Figure S3). Irrespective of locations and maize cultivars, treatments U, U+LZnONPs and U+LZnCNP did not significantly increase straw Zn concentration with exceptions of slight increases in LD510 grown in Jinan with treatment U+LZnONPs and grown in Zibo with treatment U+LZnCNP compared with the control. However, compared with the control, the latter four foliar treatments with high Zn spray rates (U+HZnONPs, U+HZnCNP, U+Zn and cocktail) substantially increased straw Zn concentration by 4.2–14.1-fold, 1.7–12.3-fold and 2.3–14.6-fold corresponding to ZD958, DH605 and LD510 among the three locations, respectively, with treatment U+Zn resulting in the greatest increase in straw Zn concentration (Figures 3D-F). Compared with the control, only treatment cocktail substantially increased the straw concentrations of Fe by 0.6-fold and Se by 10.1-fold. However, there was no significant difference in the straw concentrations of Fe and Se among the foliar treatments excluding treatment cocktail with an exception of a significant decrease in straw Fe concentration with treatment U+LZnONPs (Table 3). Similar results were also found for shoot concentrations of Fe and Se (Table 3). Foliar treatments generally decreased P concentration in straw and especially in shoot compared with the control (Table 3).
As shown in Table 4, among the three locations, the average molar ratios of PA/Zn and PA/Fe generally increased in the order Zibo<Linyi<Jinan. Among the three cultivars, the average molar ratios of PA/Zn and PA/Fe gradually increased in the order ZD958<DH605<LD510. For foliar treatments, compared with the control and treatment U, the other foliar treatments generally resulted in a significant decrease in the molar ratio of PA/Zn and PA/Fe in grain. For the ratios of P/Zn in straw, compared with the control, the other foliar treatments significantly decreased the molar ratio of P/Zn in straw by 8.6–90.7% with the treatment U+Zn resulting in the greatest magnitude of decrease. For the molar ratio of P/Fe in straw, there was no significant difference among the four foliar treatments including control, U, U+LZnONPs and U+Zn. Compared with the control, the molar ratio of P/Fe in straw was significantly decreased by 12.2–25.6% by the treatments U+LZnCNP, U+HZnONPs and U+HZnCNP and substantially decreased by 50.5% by the treatment cocktail (Table 4).
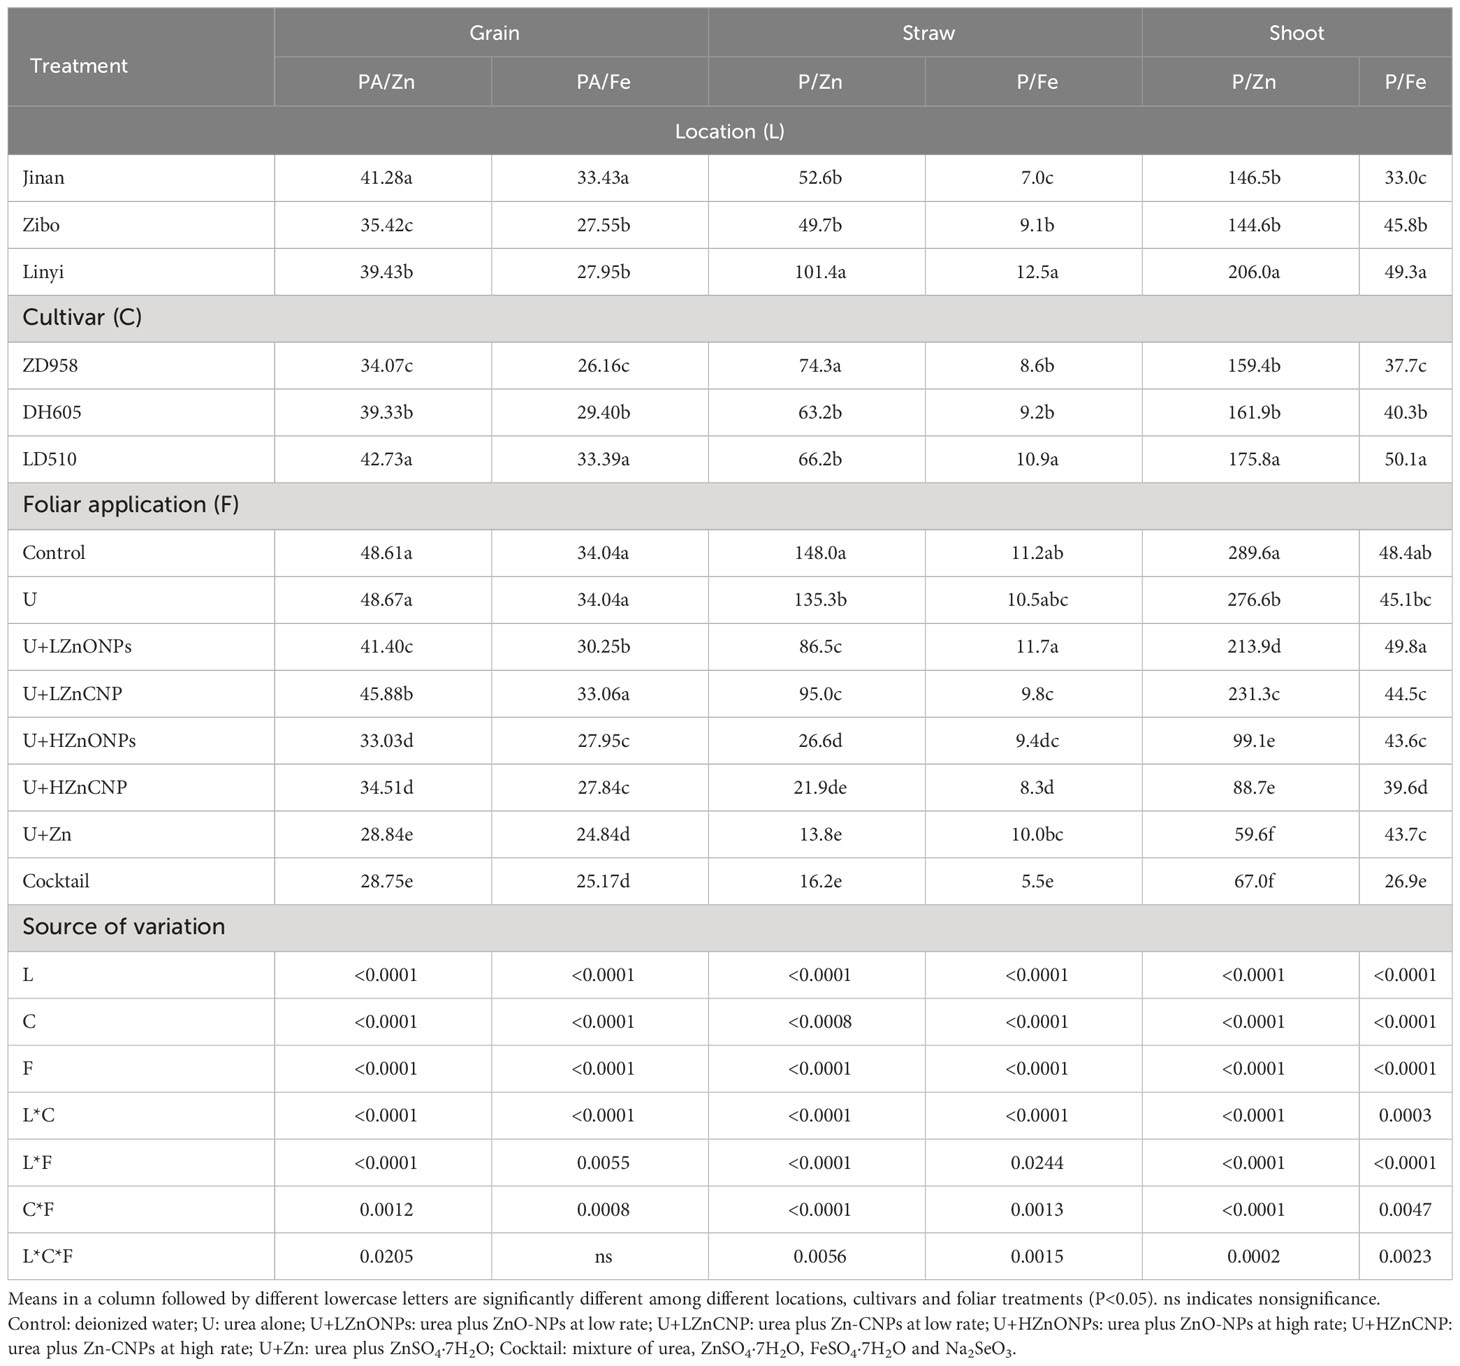
Table 4 Molar ratios of PA/Zn and PA/Fe in grain and molar ratios of P/Zn and P/Fe in straw and shoot of three maize cultivars with foliar treatments at three experimental locations.
Irrespective of locations and maize cultivars, compared with the control, treatments U, U+LZnONPs and U+LZnCNP did not affect or slightly increased the TAZ while the latter four foliar treatments with high Zn spray rates (especially for treatments U+Zn and cocktail) generally increased the TAZ significantly (Figure 4). Due to the fact that TAZ could be well predicted by a negative power function based on the ratios of PA/Zn in grain (R2 = 1.00***) (Figure 5A), different maize cultivars, experimental locations and foliar treatments had opposite effects on TAZ and the ratios of PA/Zn (Table 4). Furthermore, TAZ could be predicted by a linear equation based on grain Zn concentration (R2 = 0.7699***) (Figure 5B). The relationship between grain Zn concentration and the ratios of PA/Zn in grain could also be described by a negative power function (R2 = 0.7584***) (Figure 5C).
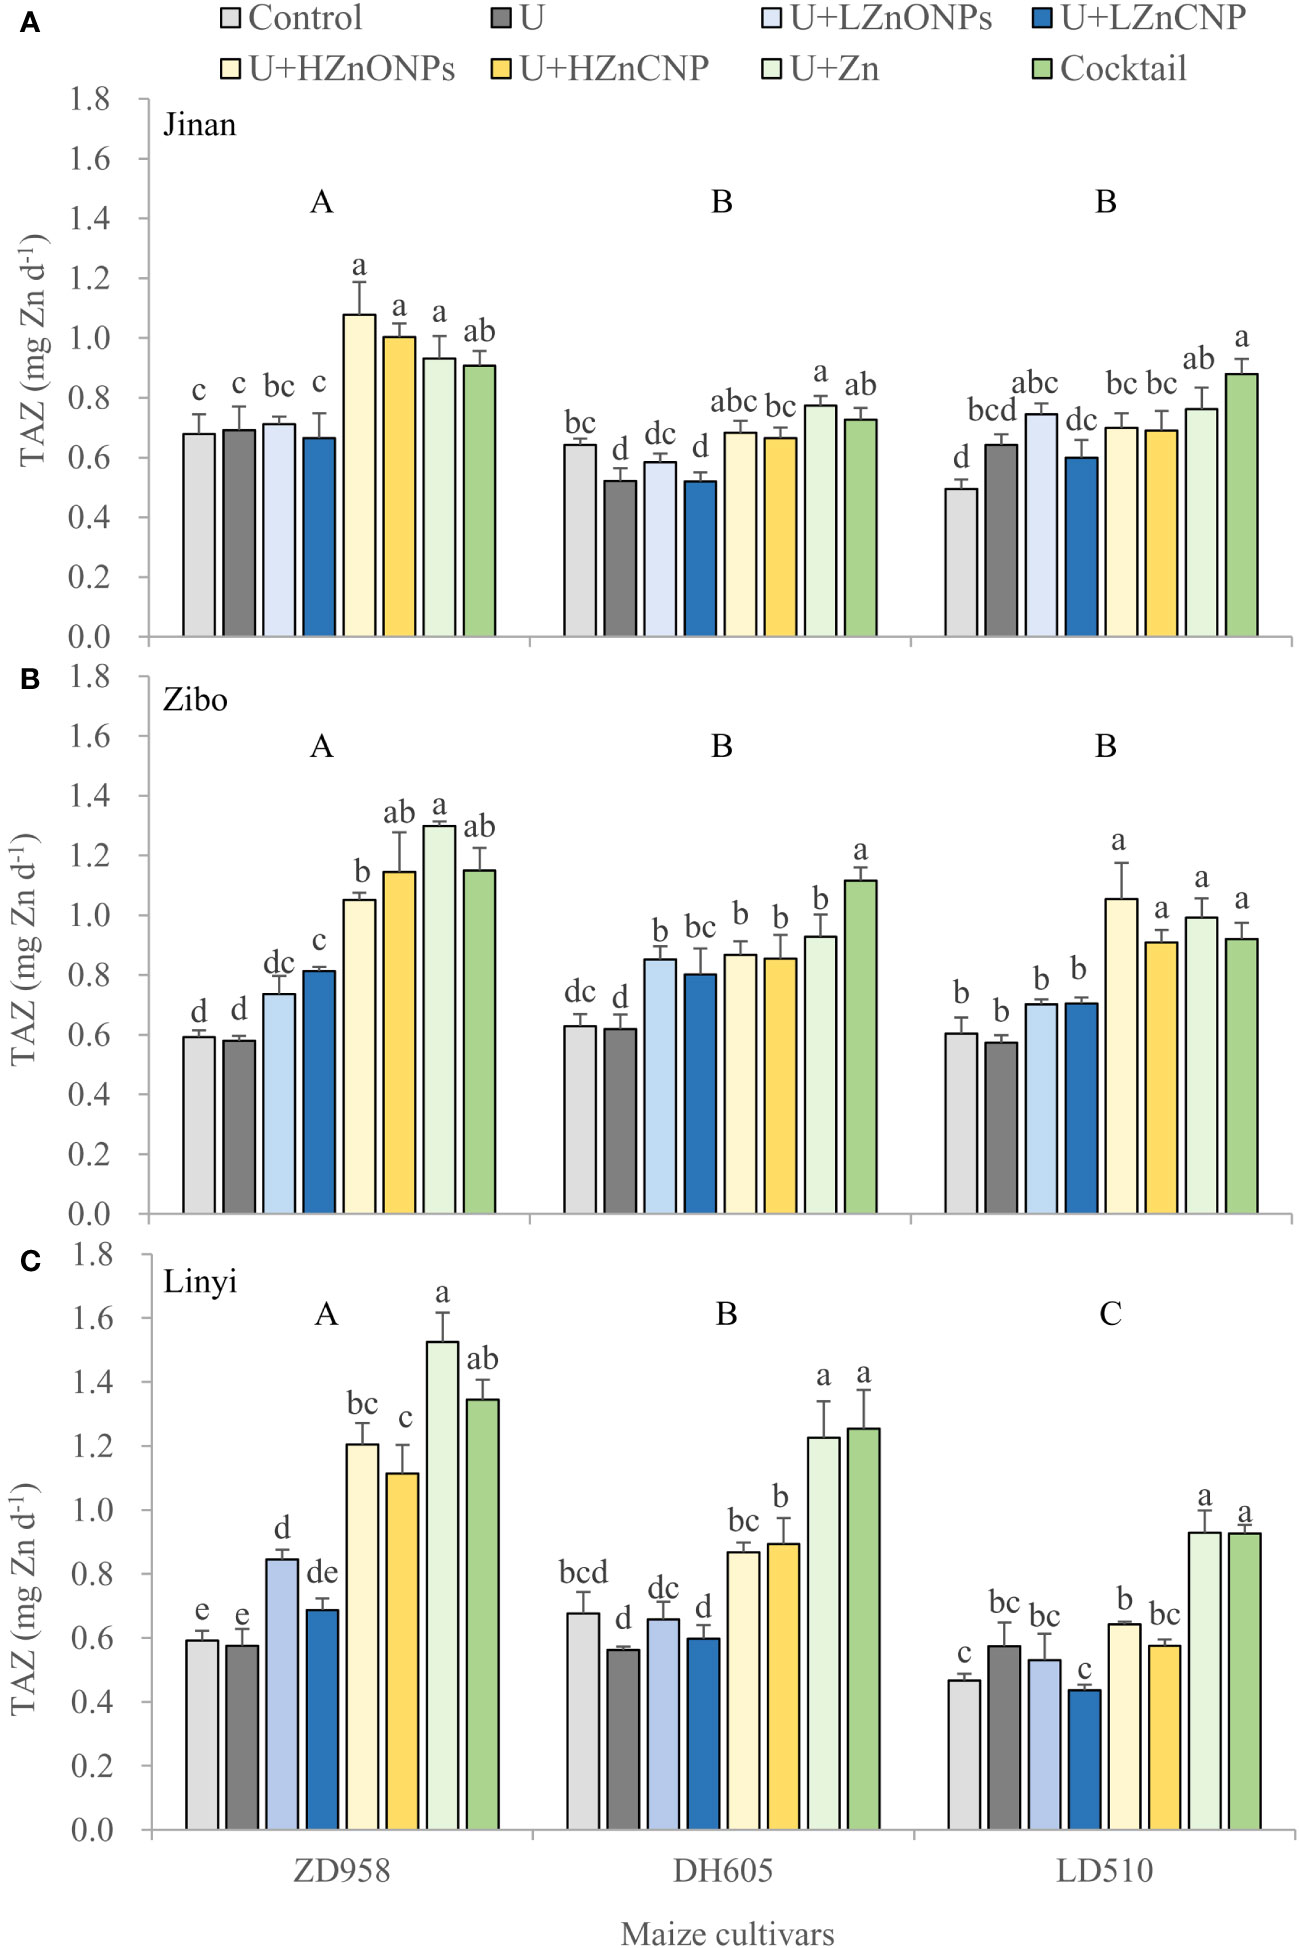
Figure 4 Effects of foliar treatments on total daily absorbed Zn (TAZ) of three maize cultivars grown in Jinan (A), Zibo (B) and Linyi (C). Error bars represent the standard error of the mean (n = 3). Bars with different lowercase letters represent significant differences among the different foliar treatments within each maize cultivar; bars with different uppercase letters represent significant differences between different maize cultivars (P < 0.05). Control: deionized water; U: urea alone; U+LZnONPs: urea plus ZnO-NPs at low rate; U+LZnCNP: urea plus Zn-CNPs at low rate; U+HZnONPs: urea plus ZnO-NPs at high rate; U+HZnCNP: urea plus Zn-CNPs at high rate; U+Zn: urea plus ZnSO4·7H2O; Cocktail: mixture of urea, ZnSO4·7H2O, FeSO4·7H2O and Na2SeO3.
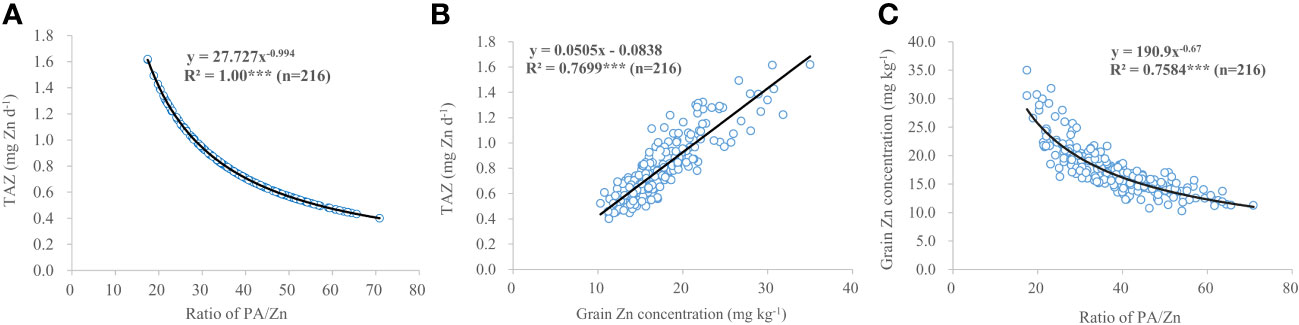
Figure 5 Correlations between ratio of PA/Zn (A), grain Zn concentration (B) and TAZ as well as ratio of PA/Zn and grain Zn concentration (C) of three maize cultivars grown at three experimental locations. *** indicate correlation coefficient significantly different at P < 0.001.
Figure 6 shows a graphical display of the correlation matrix by corrplot. Grain yield was significantly negatively correlated with all most of grain nutrient concentrations with the correlation coefficient (r values) decreasing in the order Mn, Mg, K, Ca, Cu, P, B, Fe, Zn, N and TAZ. Grain yield was not correlated with the grain Se and PA concentrations. Grain concentrations of N, Zn, Fe, Mn, Cu, B, Ca and Mg have significant positive correlations with each other with the correlation coefficient being the highest between grain concentrations of Zn and Fe (r=0.849***) except that there was no significant correlation between grain Cu concentration and grain Ca and Mg concentrations. In addition, grain Se concentration was significantly positively correlated with grain concentrations of Zn (r=0.461***), Fe (r=0.398***) and TAZ (r=0.403***).
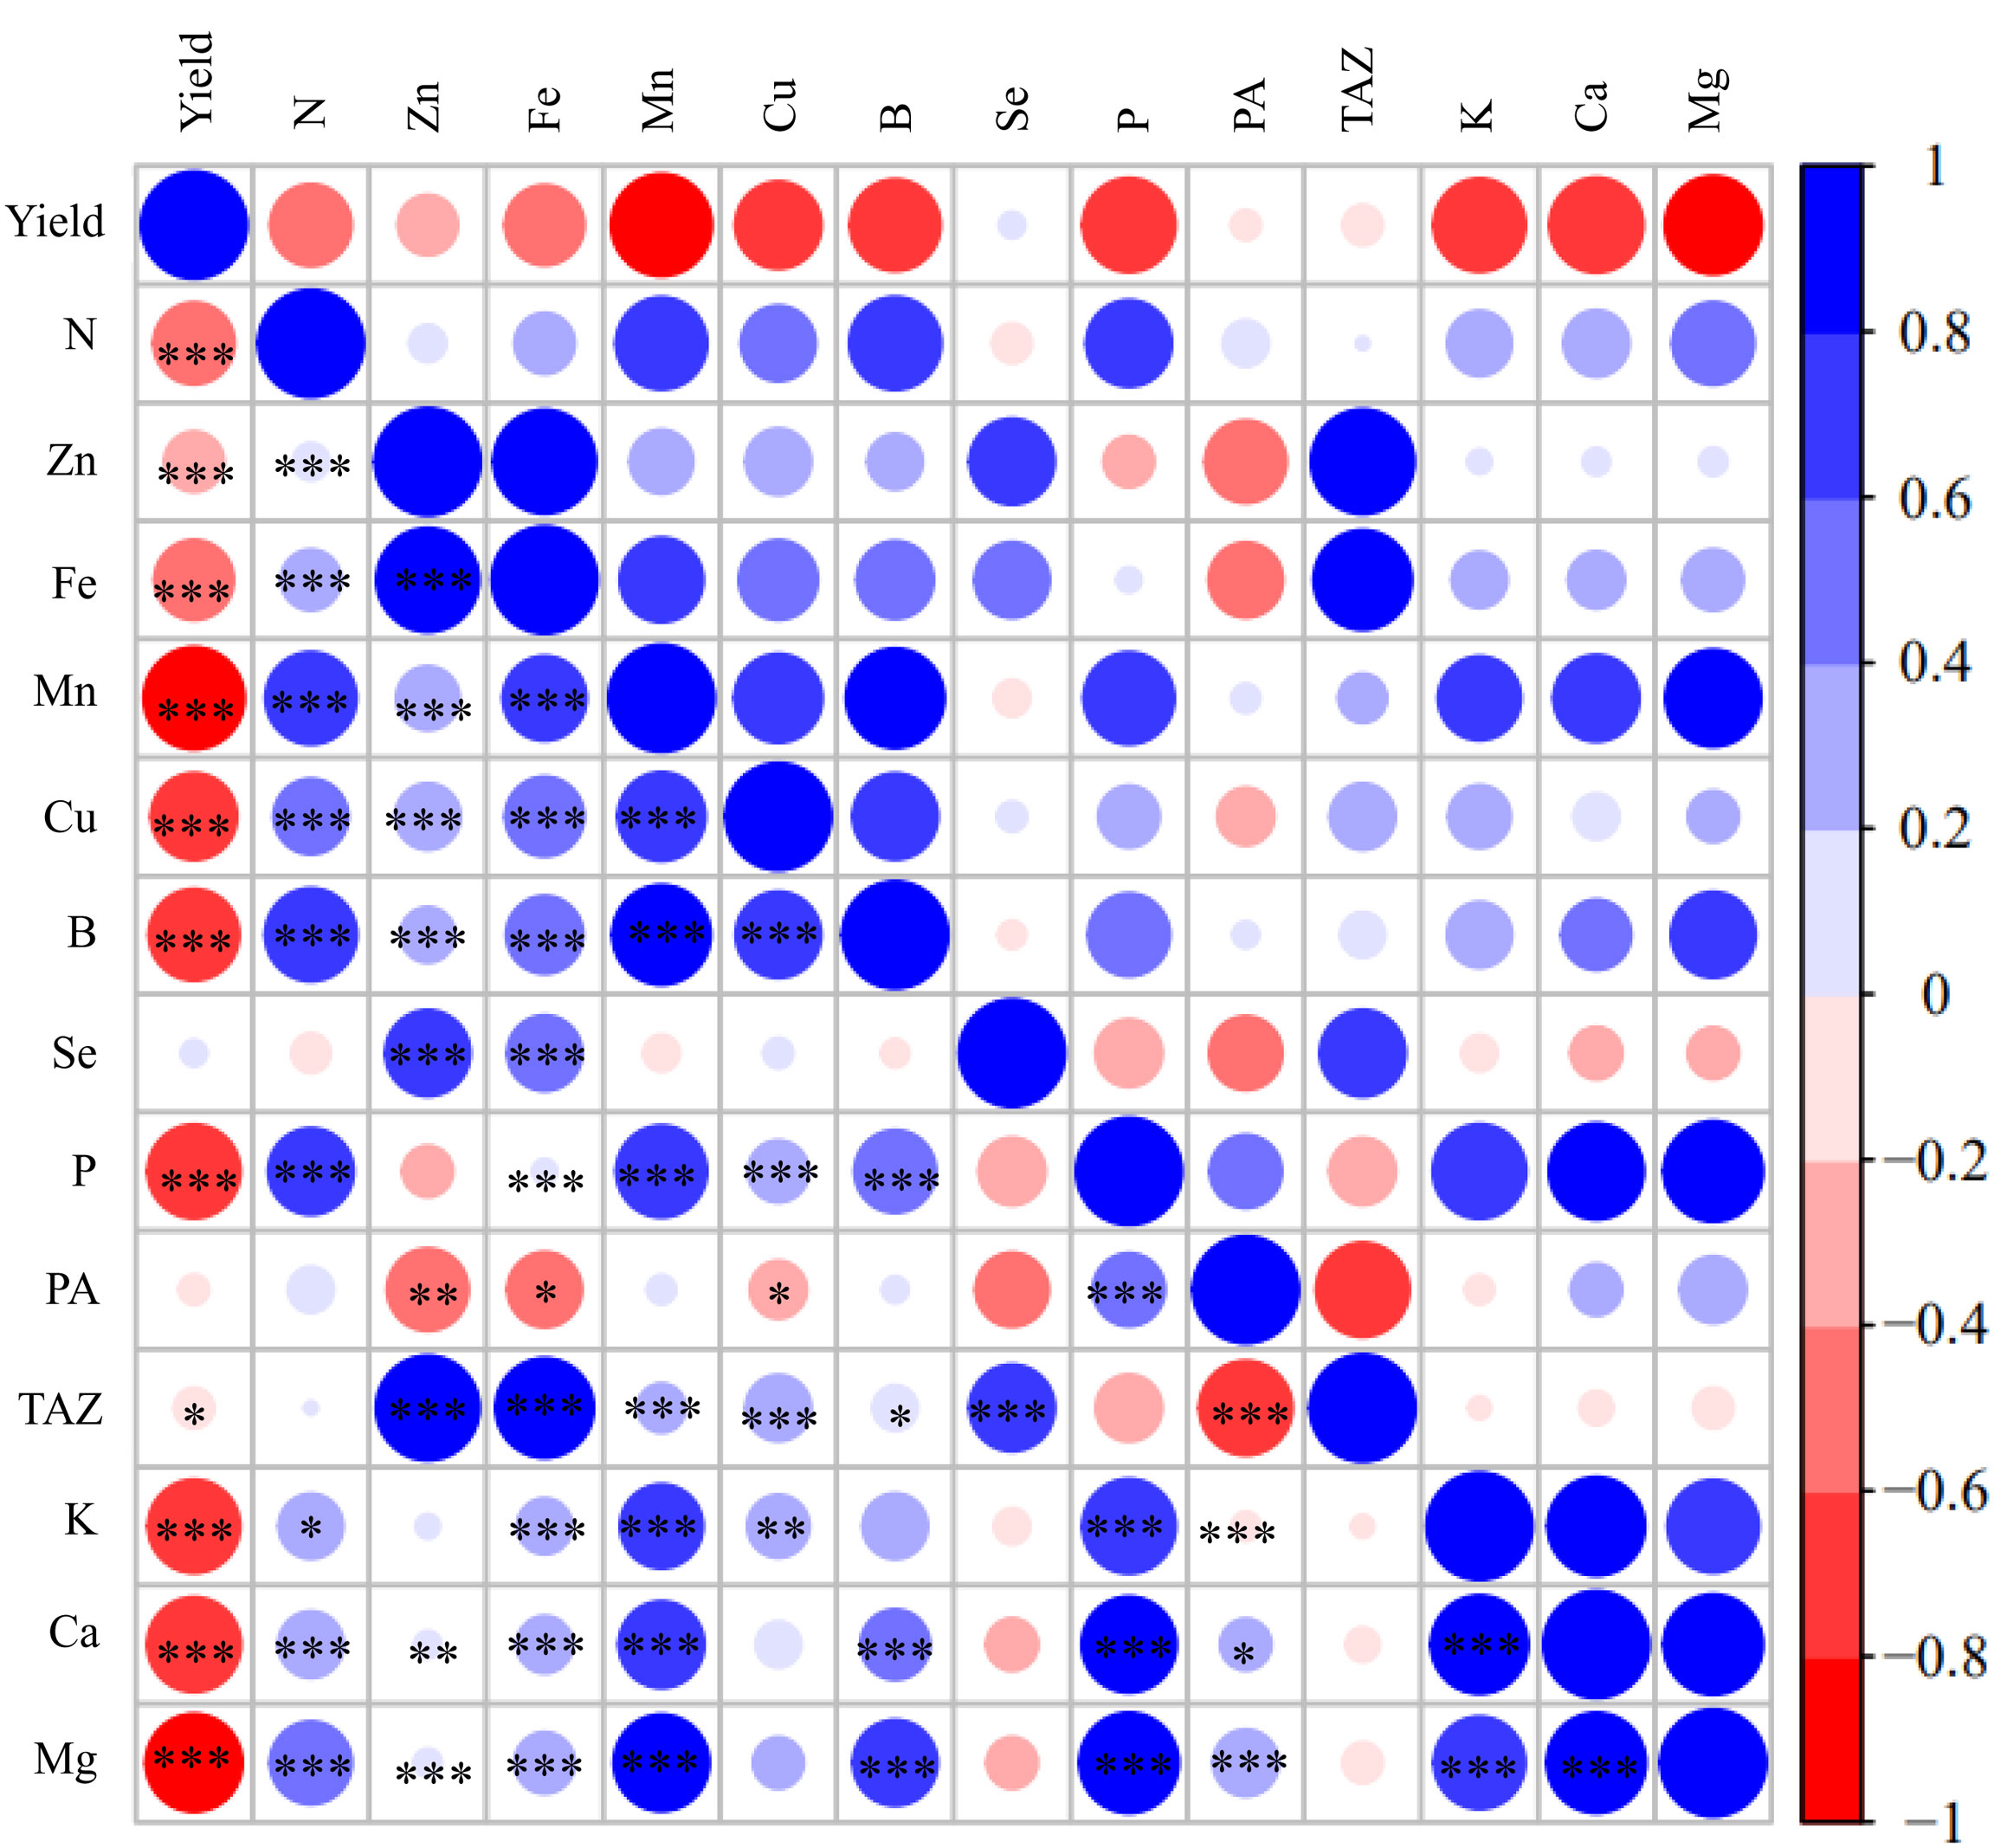
Figure 6 Corrplot representing correlations among measured grain yield and grain concentrations of N, Zn, Fe, Mn, Cu, B, Se, P, phytate acid (PA), TAZ, K, Ca, Mg across different foliar treatments, maize cultivars and experimental locations (n=216). Positive correlations are displayed in red and negative correlations are displayed in blue. The color legend on the right-hand side of corrplot shows correlation coefficients and the corresponding colors. The intensity of the color and the circle size are proportional to the correlation coefficients. *, ** and *** indicate significant correlations at P < 0.05, P < 0.01 and P < 0.001, respectively.
The PCA showed a better visualization of the relationships and great variation present among all investigated parameters of maize, and it also revealed the data distribution of various treatments performed on the maize crop (Figure 7). Two principal components accounted for 57.9% (PC1–37.3%, PC2–20.6%) of the total variance of all 216 data points, which clustered according to experimental locations (Figure 7A), maize cultivars (Figure 7B) and foliar applications (Figure 7C), respectively. There was a clear separation/difference in data distribution areas among three experimental locations and among eight foliar treatments. However, there was much overlap of data distribution areas among the maize cultivars. In addition, in each PCA biplot graph, bigger ellipses indicate less concentrated data and more variation within a cluster. The experimental location in Linyi (Figure 7A), maize cultivar of ZD958 (Figure 7B) and foliar treatments U+Zn or cocktail (Figure 7C) showed the biggest ellipse.
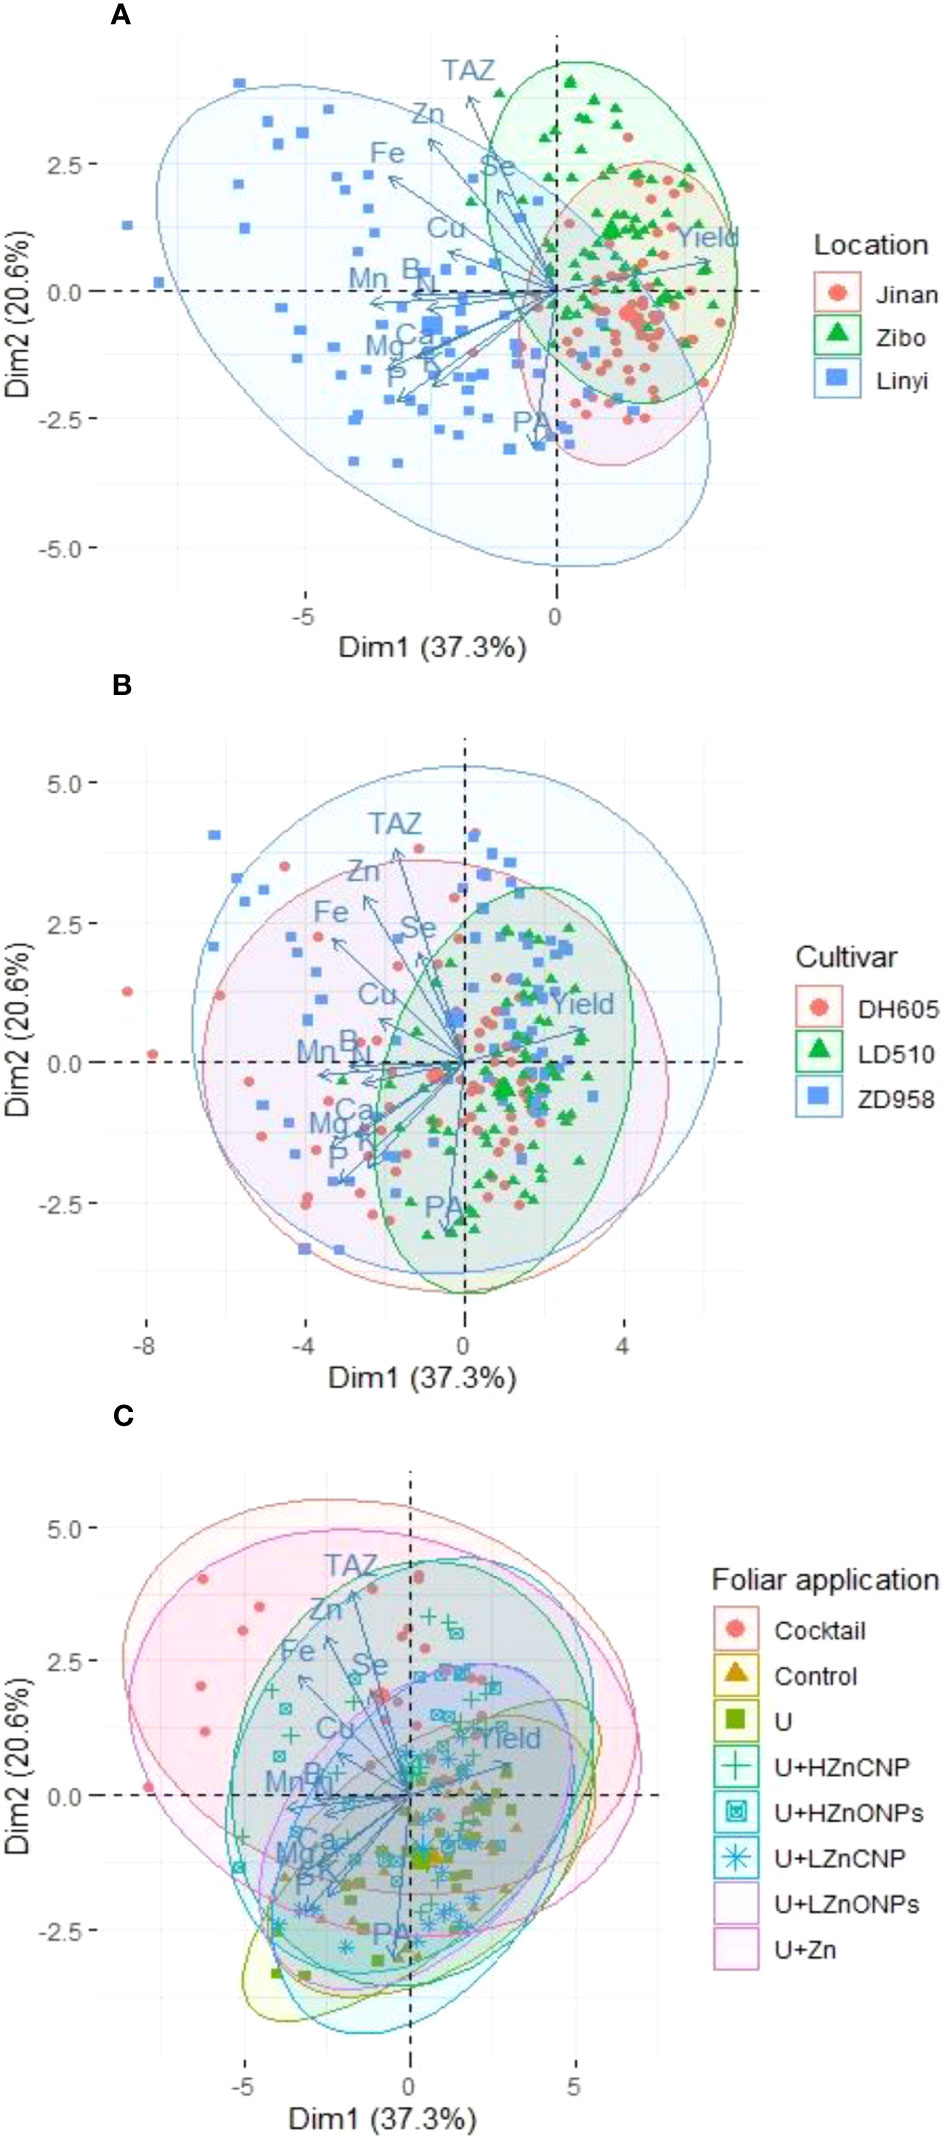
Figure 7 Principal component analysis (PCA) of the effects of different experimental locations (A), maize cultivars (B) and foliar treatments (C) on various investigated grain yield and nutritional parameters in maize grain (grain concentrations of N, Zn, Fe, Mn, Cu, B, Se, P, PA, TAZ, K, Ca and Mg). Control: deionized water; U: urea alone; U+LZnONPs: urea plus ZnO-NPs at low rate; U+LZnCNP: urea plus Zn-CNPs at low rate; U+HZnONPs: urea plus ZnO-NPs at high rate; U+HZnCNP: urea plus Zn-CNPs at high rate; U+Zn: urea plus ZnSO4·7H2O; Cocktail: mixture of urea, ZnSO4·7H2O, FeSO4·7H2O and Na₂SeO3.
In this study, maize grain yield was first significantly affected by experimental locations, followed by maize cultivars, but not affected by foliar treatments (Figures 1A–C, Supplementary Table 1). This observation agrees with other studies about wheat, rice and maize (Zhang et al., 2010; Wei et al., 2012; Xia et al., 2019; Zou et al., 2019; Stewart et al., 2020; Wang et al., 2020; Naeem et al., 2022). The non-significant effects of foliar treatments on maize yield might be due to the relatively high concentrations of available Zn and Fe in the three experimental soils (Table 1), which were higher than the critical levels in China (0.5 mg kg–1 for DTPA-extractable Zn and 5 mg kg–1 for DTPA-extractable Fe). Grain yield was significantly negatively correlated with all most of grain nutrient concentrations, with the exception of grain concentrations of Se and PA (Figure 6). These results suggest that maize grain nutritional quality tends to decrease with increasing grain yield, especially for high-yielding cultivars, possibly due to the so-called “dilution effect”. Previous studies also demonstrated that maize grain yield was generally negatively correlated with grain concentrations of Fe and Zn as a result of increased carbohydrate content in high-yielding genotypes, which dilutes a given concentration of Fe and Zn (Banziger and Long, 2000; Brkić et al., 2004). Guo et al. (2020) also reported that maize grain yield increased with the year of cultivar release, while the grain concentrations of N, Cu, Mn and Zn significantly declined in the new-era cultivars. Similar results were also found in wheat (Fan et al., 2008). In this study, the significantly higher concentrations of N, Zn, Fe, Se, Mn, B, K, Mg and Ca in grain of maize grown in Linyi than the other two experimental locations were most likely attributed to the lowest grain yield (Table 3, Figures 1, 3). Irrespective of experimental locations, the LD510 variety had higher grain yield and biomass compared with ZD958 and DH605, but had the lowest grain concentrations of Zn, Fe, Se, Mn, B and Mg (Figures 1, 3, Table 3, Table S3). The excessive stay-green LD510 variety may impair the remobilization of these nutrients from vegetative organs to grain, compared with earlier-senescing hybrid ZD958, during the grain filling stage (Figure S1), thereafter reducing the grain concentrations of these nutrients. Chen et al. (2016) reported that increasing the translocation of nutrients from vegetative organs to grain could effectively increase the maize grain concentrations of nutrients such as N, P, K, Zn and Mn.
We observed a highly significant positive correlation between maize grain concentrations of Zn and Fe (r=0.849 ***), in agreement with other studies (Chakraborti et al., 2009; Wang et al., 2012; Xia et al., 2019; Zhao et al., 2020), indicating possible synergies between these traits. Co-localization of QTLs for Fe and Zn concentrations revealed that concentration of these minerals could be improved simultaneously by targeting the same chromosomal regions through marker-assisted selection (Qin et al., 2012). Therefore, it is understandable that the U+Zn treatment improved grain concentrations of Zn, Fe and N equally effectively as a cocktail treatment (Table 3, Figure S2). We also found that foliar application of the cocktail solution was surprisingly effective in increasing maize grain Se concentration, on average by 18-fold (Table 3), which is much more pronounced than increases observed in rice (around 4-fold) and wheat (about 3.8-fold) (Zou et al., 2019; Prom-u-thai et al., 2020). Furthermore, grain concentrations of Se were signficantly and positively correlated with Zn and Fe (Figure 6). These results suggest that foliar application of a cocktail solution represents an effective strategy to biofortify maize simultaneously with Zn, Se and partly with Fe and N without yield trade-off in maize.
Some researchers (Pfeiffer and McClafferty, 2007; Cakmak et al., 2010) have stated that grain Zn concentrations should be increased by at least 10 mg kg–1 to achieve a measurable biological influence on human health. In this present study, the grain Zn concentration of ZD958, DH605 and LD510 grown in Linyi was increased by 17.6 mg kg–1, 10.8 mg kg–1 and 8.7 mg kg–1 by the ZnSO4 and micronutrient cocktail treatments (on average) compared with the control treatment, respectively. Thus, the increase in the grain Zn concentration by foliar applications of ZnSO4 or a micronutrient cocktail should be sufficient to have a measurable influence on human health. However, the biofortified grain concentrations of Zn and Fe (with a mean of 31.2 mg Zn kg–1 and 32.5 mg Fe kg–1 of ZD958 grown in Linyi) still could not fulfill the dietary requirements of 38 mg Zn kg–1 and 45–60 mg Fe kg–1 recommended by HarvestPlus program (Bouis et al., 2011) and therefore, further work is required in this regard. Previous studies revealed a negative effect of foliar application of Zn (with and without urea) on PA concentration in wheat grain and flour (Li et al., 2015). Recent studies also indicated that although the application of ZnO-NPs increased the total Zn within the grain, it did not accumulate within the grain as ZnO-NPs (an important consideration for food safety), but rather mainly as Zn-phytate, with the remainder of the Zn complexed with either cysteine or phosphate (Zhang et al., 2018; Sun et al., 2023). PA, an antinutritional compounds, was significantly decreased by foliar treatements of ZnSO4 and the micronutrient cocktail and resulted in the lowest ratios of PA/Fe and PA/Zn and the highest TAZ in maize grain (Table 4, Figure 4), representing the highest Fe and Zn bioavailability observed in this study. Furthermore, the TAZ could be well estimated by a negative power function based on the ratios of PA/Zn in maize grain (Figure 5A).
The effects of different Zn forms and doses on the grain Zn concentration were also investigated in this present study. Results indicates that there was no increase or a negligible increase in grain Zn concentration when 10-fold less Zn (equivalent to 45.2 mg Zn kg–1) was foliar applied as nano-fertilizers, compared with the control (deionized water) (Figures 3A-C). In contrast, higher rates of foliar-applied Zn forms resulted in a significant increase in grain Zn concentration with the positive effects being dependent on experimental locations and maize cultivars. In case of the Linyi experiment, the magnitude of increase in grain Zn concentration revealed the greater efficacy of conventional ZnSO4 than either ZnO-NPs or Zn-CNPs (Figures 3A-C). Similarly, Doolette et al. (2020) reported that conventional formulations such as ZnCl2 and especially Zn-EDTA were more effective in terms of the proportion of applied 65Zn translocated to grain compared with ZnO-NPs and microparticles by applying 65Zn radio-labelled formulations onto the youngest fully emerged leaf of wheat. In disagreement with these results, Zhang et al. (2018) reported the improvement in grain Zn concentration of wheat was more pronounced by foliar-applied ZnO NPs than conventional ZnSO4 based on the same level of Zn. It is possible that ZnO-NPs or Zn-CNPs provide benefits beyond simply increasing grain micronutrient concentrations. For example, Choudhary et al. (2019) found that Zn-chitosan nanoparticles exhibited significant disease control through strengthening of plant innate immunity by elevating antioxidant and defense enzymes, balancing of reactive oxygen species, and enhancing lignin accumulation. Furthermore, seed treatment together with foliar application of Zn-chitosan nanoparticles at rates of 0.01–0.16% significantly controlled Curvularia leaf spot disease and increased grain yield from 20.5% to 39.8% alongside an improvement in grain Zn concentration from 41.3 to 62.2 mg kg–1 (Choudhary et al., 2019). The differences between different Zn sources, different cultivars, and different experimental locations on grain Zn biofortification could be explained by a number of factors. First, plant physiology between different crop species and cultivars may affect Zn demand and cuticle properties (e.g. cuticle thickness, and stomata and trichome density). Second, the difference in nanoparticle particle size may affect the adhesion and rate of Zn uptake by the leaf. Third, the different concentrations and dosages of Zn for foliar application may affect Zn uptake by the leaf. In our study we applied 45.2 or 452 mg Zn kg–1 but rates of 1600 mg Zn kg–1 have been applied by others (Zhang et al., 2018). Finally, the growing conditions (field vs solution culture and pot experiments) and yield levels may also affect the Zn uptake and allocation to grain.
The maize cultivars DH605 and LD510 used in this study are intended for dual use of grain and silage. The maize is usually harvested by farmers as grain or silage based on local maize purchase prices and silage corn is often purchased by large dairy farmers/farm. Previous studies report the recommended dietary requirements of minerals (based on dry weight) for dairy cows (Supplementary Table 4). Considering the requirements of dairy cattle for Mn and Fe, the average shoot concentrations of the two maize cultivars across the three locations were sufficient to meet Mn (12–14 mg kg–1) and Fe (12.3–18 mg kg–1) requirements with or without foliar treatments. However, the average shoot concentrations of Cu, K, Mg and Ca could not easily meet the dietary requirements of dairy cattle, irrespective of foliar treatments. The shoot Se concentration achieved 765.2 ug kg–1 for DH605 and 562.1 ug kg–1 for LD510 with foliar treatment cocktail, which indicated that Se biofortified silage could easily meet the requirement of 300 ug Se kg–1 for dairy cattle (Supplementary Table 4). The shoot Zn concentration of the two maize cultivars ranged between 51.6–66.6 mg kg–1 when treated with the ZnSO4 and micronutrient cocktail foliar treatments. This indicates that the Zn biofortified silage could meet the requirements of 43–60 mg Zn kg–1 for dairy cattle. Furthermore, the ratios of P/Zn and P/Fe in shoot and straw were also reduced by foliar treatments ZnSO4 and the micronutrient cocktail (Table 4), indicating a higher bioavailability of Zn and Fe for dairy cattle by biofortification.
Results from this present study have clearly demonstrated that grain yield was first significantly affected by the experimental locations, followed by maize cultivars, but not affected by foliar treatments. Additionally, grain yield was significantly negatively correlated with all most of grain nutrient concentrations with an exception of grain concentrations of Se and PA. Consequently, the high grain yield of cultivar LD510 or high grain yield in Jinan and Zibo nonorally resulted in the lower grain nutritional quality possibly due to “dilution effect”. Therefore, foliar fertilizer sprays should be preferentially applied under these conditions to improve grain nutritional quality while maintaining higher grain yield. It was shown that foliar application of a cocktail solution including Zn, Fe, Se and N simultaneously has effectively improved the concentrations of Zn, Fe, Se and N in grain of the three maize cultivars grown at three locations without grain yield trade-off. Furthermore, foliar application of a cocktail solution also significantly decreased the PA concentration, the ratios of PA/Fe and PA/Zn in grains while increased the TAZ, indicating an increased Fe and Zn bioavailability. Among the different Zn sources, foliar application of conventional ZnSO4·7H2O was more pronounced in improve the grain Zn concentration of maize than that of ZnO-NPs and Zn-CNPs in this study and the relevant mechanisms need to be further investigated in the future. It is also important to mention that the ongoing breeding activities for developing high-yield genotypes should be integrated with agronomic approaches (e.g. foliar application of a cocktail solution including Zn, Fe, Se and N simultaneously) to achieve both high grain yield and high grain nutritional quality for human health.
The original contributions presented in the study are included in the article/Supplementary material. Further inquiries can be directed to the corresponding authors.
Y-FX and Z-LC conceived and designed the experiments. X-JL, WY, QM, C-YZ, MH, J-BS, S-JQ, Z-HD performed the experiments. Y-FX and Z-LC analyzed the data and wrote the paper. All the authors read and approved the final manuscript.
This research was funded by National Key Research and Development Program of China (2021YFD1901003, 2017YFD0301005), the Innovative Talent Introduction and Innovation Project of Shandong Academy of Agricultural Sciences (CXGC2023G23, CXGC2023A22), the project of Science and Technology commissioners in Shandong Province (2022DXAL0125), the Key Laboratory of Trace Element Nutrition, National Health Commission of the Peoples' Republic of China (wlkfz202318) and the Taishan Scholarship Project of Shandong Province (No.TS201712082).
The authors are grateful to Tom Sizmur in Reading University in the United Kingdom for his English language improvements in the manuscript.
The authors declare that the research was conducted in the absence of any commercial or financial relationships that could be construed as a potential conflict of interest.
All claims expressed in this article are solely those of the authors and do not necessarily represent those of their affiliated organizations, or those of the publisher, the editors and the reviewers. Any product that may be evaluated in this article, or claim that may be made by its manufacturer, is not guaranteed or endorsed by the publisher.
The Supplementary Material for this article can be found online at: https://www.frontiersin.org/articles/10.3389/fpls.2023.1144514/full#supplementary-material
Supplementary Figure 1 | The growth of three maize cultivars at 45 days after silking grown in Jinan.
Supplementary Figure 2 | Effects of foliar treatments on Fe concentrations of grain (A-C) and straw (D-F) of different maize cultivars grown in Jinan, Zibo and Linyi, respectively. Error bars represent the standard error of the mean (n = 3). Bars with different lowercase letters represent significant differences among the different foliar treatments within each maize cultivar; bars with different uppercase letters represent significant differences between different maize cultivars (P < 0.05). Control: deionized water; U: urea alone; U+LZnONPs: urea plus ZnO-NPs at low rate; U+LZnCNP: urea plus Zn-CNPs at low rate; U+HZnONPs: urea plus ZnO-NPs at high rate; U+HZnCNP: urea plus Zn-CNPs at high rate; U+Zn: urea plus ZnSO4·7H2O; Cocktail: mixture of urea, ZnSO4·7H2O, FeSO4·7H2O and Na2SeO3.
Supplementary Figure 3 | Effects of foliar treatments on Se concentrations of grain (A-C) and straw (D-F) of different maize cultivars grown in Jinan, Zibo and Linyi, respectively. Error bars represent the standard error of the mean (n = 3). Bars with different lowercase letters represent significant differences among the different foliar treatments within each maize cultivar; bars with different uppercase letters represent significant differences between different maize cultivars (P < 0.05). Control: deionized water; U: urea alone; U+LZnONPs: urea plus ZnO-NPs at low rate; U+LZnCNP: urea plus Zn-CNPs at low rate; U+HZnONPs: urea plus ZnO-NPs at high rate; U+HZnCNP: urea plus Zn-CNPs at high rate; U+Zn: urea plus ZnSO4·7H2O; Cocktail: mixture of urea, ZnSO4·7H2O, FeSO4·7H2O and Na2SeO3.
Supplementary Figure 4 | Effects of foliar treatments on grain N concentrations of different maize cultivars grown in Jinan (A), Zibo (B) and Linyi (C). Error bars represent the standard error of the mean (n = 3). Bars with different lowercase letters represent significant differences among the different foliar treatments within each maize cultivar; bars with different uppercase letters represent significant differences between different maize cultivars (P < 0.05). Control: deionized water; U: urea alone; U+LZnONPs: urea plus ZnO-NPs at low rate; U+LZnCNP: urea plus Zn-CNPs at low rate; U+HZnONPs: urea plus ZnO-NPs at high rate; U+HZnCNP: urea plus Zn-CNPs at high rate; U+Zn: urea plus ZnSO4·7H2O; Cocktail: mixture of urea, ZnSO4·7H2O, FeSO4·7H2O and Na2SeO3.
Andersson, M. S., Saltzman, A., Virk, P. S., Pfeiffer, W. H. (2017). Progress update:crop development of biofortified staple food crops under harvestplus. Afr. J. Food Agric. Nutr. Dev. 17, 11905–11935. doi: 10.18697/ajfand.78.harvestplus05
Bailey, R. L., West, K. P., Black, R. E. (2015). The epidemiology of global micronutrient deficiencies. Ann. Nutr. Metab. 2, 22–33. doi: 10.1159/000371618
Banziger, M., Long, J. (2000). The potential for increasing the iron and zinc density of maize through plant-breeding. Food Nutr. Bull. 21, 397–400. doi: 10.1177/156482650002100410
Beal, T., Massiot, E., Arsenault, J. E., Smith, M. R., Hijmans, R. J. (2017). Global trends in dietary micronutrient supplies and estimated prevalence of inadequate intakes. PloS One 12, e0175554. doi: 10.1371/journal.pone.0175554
Bouis, H. E., Hotz, C., McClafferty, B., Meenakshi, J. V., Pfeiffer, W. H. (2011). Biofortification: a new tool to reduce micronutrient malnutrition. Food Nutr. Bull. 32, S31–S40. doi: 10.1177/15648265110321S105
Brkić, I., Šimić, D., Zdunić, Z., Jambrović, A., Ledencan, T., Kovacević, V., et al. (2004). Genotypic variability of micronutrient element concentrations in maize kernels. Cereal Res. Commun. 32, 107–112. doi: 10.1007/BF03543287
Cakmak, I., Kalayci, M., Kaya, Y., Torun, A. A., Aydin, N., Wang, Y., et al. (2010). Biofortification and localization of zinc in wheat grain. J. Agric. Food Chem. 58, 9092–9102. doi: 10.1021/jf101197h
Cakmak, I., Kutman, U. B. (2018). Agronomic biofortification of cereals with zinc: a review. Eur. J. Soil Sci. 69, 172–180. doi: 10.1111/ejss.12437
Cakmak, I., Prom-U-Thai, C., Guilherme, L. R. G., Rashid, A., Ozturk, L. (2017). Iodine biofortification of wheat, rice and maize through fertilizer strategy. Plant Soil 1-2, 1–17. doi: 10.1007/s11104-017-3295-9
Chakraborti, M., Prasanna, B., Hossain, F., Singh, A., Guleria, S. K. (2009). Genetic evaluation of kernel Fe and Zn concentrations and yield performance of selected maize (Zea mays L.) genotypes. Range Manage. Agrofor. 30, 109–114.
Chen, Q. W., Mu, X. H., Chen, F. J., Yuan, L. X., Mi, G. H. (2016). Dynamic change of mineral nutrient content in different plant organs during the grain filling stage in maize grown under contrasting nitrogen supply. Eur. J. Agron. 80, 137–153. doi: 10.1016/j.eja.2016.08.002
Choudhary, R. C., Kumaraswamy, R. V., Kumari, S., Sharma, S. S., Pal, A., Raliya, R., et al. (2019). Zinc encapsulated chitosan nanoparticle to promote maize crop yield. Int. J. Biol. Macromol. 127, 126–135. doi: 10.1016/j.ijbiomac.2018.12.274
Dapkekar, A., Deshpande, P., Oak, M. D., Paknikar, K. M., Rajwade, J. M. (2018). Zinc use efficiency is enhanced in wheat through nanofertilization. Sci. Rep. 8, 6832. doi: 10.1038/s41598-018-25247-5
Doolette, C. L., Read, T. L., Howell, N. R., Cresswell, T., Lombi, E. (2020). Zinc from foliar-applied nanoparticle fertiliser is translocated to wheat grain: a 65Zn radiolabelled translocation study comparing conventional and novel foliar fertilisers. Sci. Total Environ. 749, 142369. doi: 10.1016/j.scitotenv.2020.142369
Fan, M. S., Zhao, F. J., Fairweather-Tait, S. J., Poulton, P. R., Dunham, S. J., McGrath, S. P. (2008). Evidence of decreasing mineral density in wheat grain over the last 160 years. J. Trace Elem. Med. Biol. 22, 315–324. doi: 10.1016/j.jtemb.2008.07.002
Food and Agriculture Organization of the United Nations (FAO) (2022) FAOSTAT database. Available at: http://www.fao.org/faostat/en/#data (Accessed Dec 26, 2022).
Grujcic, D., Drinic, M., Zivanovic, I., Cakmak, I., Singh, B. R. (2018). Micronutrient availability in soils of Northwest Bosnia and Herzegovina in relation to silage maize production. Acta Agric. Scand. Sect. B. Soil Plant Sci. 68, 301–310. doi: 10.1080/09064710.2017.1398781
Guo, S., Chen, Y. H., Chen, X. C., Chen, Y. L., Yang, L., Wang, L. F., et al. (2020). Grain mineral accumulation changes in Chinese maize cultivars released in different decades and the responses to nitrogen fertilizer. Front. Plant Sci. 10. doi: 10.3389/fpls.2019.01662
Haug, W., Lantzsch, H. J. (1983). Sensitive method for the rapid determination of phytate in cereals and cereal products. J. Sci. Food Agric. 34, 1423–1426. doi: 10.1002/jsfa.2740341217
Kumar, A., Prajapati, D., Devi, K. A., Pal, A., Choudhary, U., Dashora, A., et al. (2021). Slow-release Zn application through Zn-chitosan nanoparticles in wheat to intensify source activity and sink strength. Plant Physiol. Bioch. 168, 272–281. doi: 10.1016/j.plaphy.2021.10.013
Li, M., Wang, S. X., Tian, X. H., Zhao, J. H., Li, H. Y., Guo, C. H., et al. (2015). Zn distribution and bioavailability in whole grain and grain fractions of winter wheat as affected by applications of soil N and foliar Zn combined with N or P. J. Cereal Sci. 61, 26–32. doi: 10.1016/j.jcs.2014.09.009
Mao, H., Wang, J., Wang, Z., Zan, Y., Zou, C. (2014). Using agronomic biofortification to boost zinc, selenium, and iodine concentrations of food crops grown on the loess plateau in China. J. Soil Sci. Plant Nutr. 14, 459–470. doi: 10.4067/S0718-95162014005000036
Maqbool, M. A., Beshir, A. R. (2018). Zinc biofortification of maize (Zea mays L.): status and challenges. Plant Breed. 138, 1–28. doi: 10.1111/pbr.12658
Milani, N., Hettiarachchi, G. M., Kirby, J. K., Beak, D. G., Stacey, S. P., Mclaughlin, M. J. (2015). Fate of zinc oxide nanoparticles coated onto macronutrient fertilizers in an alkaline calcareous soil. PloS One 10, e0126275. doi: 10.1371/journal.pone.0126275
Miller, L. V., Krebs, N. F., Hambidge, K. M. (2007). A mathematical model of zinc absorption in humans as a function of dietary zinc and phytate. J. Nutr. 137, 135–141. doi: 10.3164/jcbn.40.148
Montalvo, D., Degryse, F., Silva, R. C. D., Baird, R., Mclaughlin, M. J. (2016). Agronomic effectiveness of zinc sources as micronutrient fertilizer. Adv. Agron. 139, 215–267. doi: 10.1016/bs.agron.2016.05.004
Naeem, A., Aslam, M., Ahmad, M., Asif, M., Yazici, M. A., Cakmak, I., et al. (2022). Biofortification of diverse basmati rice cultivars with iodine, selenium, and zinc by individual and cocktail spray of micronutrients. Agronomy 12, 1–16. doi: 10.3390/agronomy12010049
National Bureau of Statistics of China (2022). Available at: http://www.stats.gov.cn/ (Accessed Dec 26, 2022).
Nuss, E. T., Tanumihardjo, S. A. (2010). Maize:a paramount staple crop in the context of global nutrition. Comp. Rev. Food Sci. F. 9, 417–436. doi: 10.1111/j.1541-4337.2010.00117.x
Ortiz-Monasterio, J. I., Palacios-Rojas, N., Meng, E., Pixley, K., Trethowan, R., Peña, R. J. (2007). Enhancing the mineral and vitamin content of wheat and maize through plant breeding. J. Cereal Sci. 46, 293–307. doi: 10.1016/j.jcs.2007.06.005
Palacio-Márquez, A., Ramírez-Estrada, C., Gutiérrez-Ruelas, N., Sánchez, E., Ojeda-Barrios, D. L., Chávez-Mendoza, C., et al. (2021). Efficiency of foliar application of zinc oxide nanoparticles versus zinc nitrate complexed with chitosan on nitrogen assimilation, photosynthetic activity, and production of green beans (Phaseolus vulgaris L.). Sci. Hortic. 288, 110297. doi: 10.1016/j.scienta.2021.110297
Pfeiffer, W. H., McClafferty, B. (2007). HarvestPlus:breeding crops for better nutrition. Crop Sci. 47, S88–S105. doi: 10.2135/cropsci2007.09.0020IPBS
Prom-u-thai, C., Rashid, A., Ram, H., Zou, C. Q., Guilherme, L. R. G., Corguinha, A. P. B., et al. (2020). Simultaneous biofortification of rice with zinc, iodine, iron and selenium through foliar treatment of a micronutrient cocktail in five countries. Front. Plant Sci. 11. doi: 10.3389/fpls.2020.589835
Qin, H. N., Cai, Y. L., Liu, Z. Z., Wang, G. Q., Wang, J. G., Guo, Y., et al. (2012). Identification of QTL for zinc and iron concentration in maize kernel and cob. Euphytica 187, 345–358. doi: 10.1007/s10681-012-0692-2
Read, S. A., Obeid, S., Ahlenstiel, C., Ahlenstiel, G. (2019). The role of zinc in antiviral immunity. Adv. Nutr. 10, 696–710. doi: 10.1093/advances/nmz013
Ryan, M. H., McInerney, J. K., Record, I. R., Angus, J. F. (2008). Zinc bioavailability in wheat grain in relation to phosphorus fertiliser, crop sequence and mycorrhizal fungi. J. Sci. Food Agric. 88, 1208–1216. doi: 10.1002/jsfa.3200
Stacey, S. P., Oosterhuis, D. M. (2007). Effect of EDTA on the foliar absorption of trace element fertilizers. Univ. Arkansas 558, 58–61.
Stewart, Z. P., Paparozzi, E. T., Wortmann, C. S., Jha, P. K., Shapiro, C. A. (2020). Foliar micronutrient application for high-yield maize. Agronomy 10, 1946. doi: 10.3390/agronomy10121946
Subbaiah, L. V., Prasad, T. N. V. K. V., Krishna, T. G., Sudhakar, P., Reddy, B. R., Pradeep, T. (2016). Novel effects of nanoparticulate delivery of zinc on growth, productivity, and zinc biofortification in maize (Zea mays L.). J. Agric. Food Chem. 64, 3778–3788. doi: 10.1021/acs.jafc.6b00838
Sun, H. D., Guo, W., Zhou, Q. Q., Gong, Y. F., Lv, Z. Y., Wang, Q., et al. (2023). Uptake, transformation, and environmental impact of zinc oxide nanoparticles in a soil-wheat system. Sci. Total Environ. 857, 159307, 1–11. doi: 10.1016/j.scitotenv.2022.159307
Veena, M., Puthur, J. T. (2022). Seed nutripriming with zinc is an apt tool to alleviate malnutrition. Environ. Geochem. Health 44, 2355–2373. doi: 10.1007/s10653-021-01054-2
Wang, J. W., Mao, H., Zhao, H. B., Huang, D. L., Wang, Z. H. (2012). Different increases in maize and wheat grain zinc concentrations caused by soil and foliar applications of zinc in Loess Plateau, China. Field Crops Res. 135, 89–96. doi: 10.1016/j.fcr.2012.07.010
Wang, S. X., Sun, N. H., Yang, S., Tian, X. H., Liu, Q. (2020). The effectiveness of foliar applications of different zinc source and urea to increase grain zinc of wheat grown under reduced soil nitrogen supply. J. Plant Nutr. 44, 644–659. doi: 10.1080/01904167.2020.1849286
Wang, J. W., Wang, Z. H., Mao, H., Zhao, H. B., Huang, D. L. (2013). Increasing Se concentration in maize grain with soil- or foliar-applied selenite on the Loess Plateau in China. Field Crops Res. 150, 83–90. doi: 10.1016/j.fcr.2013.06.010
Wei, Y. Y., Shohag, M. J. I., Yang, X. E. (2012). Biofortification and bioavailability of rice grain zinc as affected by different forms of foliar zinc fertilization. PloS One 7, e45428. doi: 10.1371/journal.pone.0045428
Welch, R. M., Graham, R. D. (2004). Breeding for micronutrients in staple food crops from a human nutrition perspective. J. Exp. Bot. 55, 353–364. doi: 10.1093/jxb/erh064
Welch, R. M., Graham, R. D., Cakmak, I. (2013) in Linking agricultural production practices to improving human nutrition and health Expert paper written for ICN2 Second International Conference on Nutrition Preparatory Technical Meeting, Rome, Italy, November 13-15, 2013. Available at: http://www.fao.org/3/a-as574e.pdf.
Xia, H. Y., Kong, W. L., Wang, L., Xue, Y. H., Liu, W. L., Zhang, C. Y., et al. (2019). Foliar Zn spraying simultaneously improved concentrations and bioavailability of Zn and Fe in maize grains irrespective of foliar sucrose supply. Agronomy 9, 386. doi: 10.3390/agronomy9070386
Zhang, Y. Q., Shi, R. L., Rezaul, K. M., Zhang, F. S., Zou, C. Q. (2010). Iron and zinc concentrations in grain and flour of winter wheat as affected by foliar application. J. Agric. Food Chem. 58, 12268–12274. doi: 10.1021/jf103039k
Zhang, T., Sun, H. D., Lv, Z. Y., Cui, L. L., Mao, H., Kopittke, M. (2018). Using synchrotron-based approaches to examine the foliar application of ZnSO4 and ZnO nanoparticles for field-grown winter wheat. J. Agric. Food Chem. 66, 2572–2579. doi: 10.1021/acs.jafc.7b04153
Zhao, Q. Y., Xu, S. J., Zhang, W. S., Zhang, Z., Yao, Z., Chen, X. P., et al. (2020). Identifying key drivers for geospatial variation of grain micronutrient concentrations in major maize production regions of China. Environ. pollut. 266, 115114. doi: 10.1016/j.envpol.2020.115114
Zou, C. Q., Du, Y. F., Rashid, A., Ram, H., Savasli, E., Pieterse, P. J., et al. (2019). Simultaneous biofortification of wheat with zinc, iodine, selenium, and iron through foliar treatment of a micronutrient cocktail in six countries. J. Agric. Food Chem. 67, 8096–8106. doi: 10.1021/acs.jafc.9b01829
Keywords: maize, zinc, iron, selenium, bioavailability, ZnO nanoparticles, foliar application
Citation: Xue Y-F, Li X-J, Yan W, Miao Q, Zhang C-Y, Huang M, Sun J-B, Qi S-J, Ding Z-H and Cui Z-L (2023) Biofortification of different maize cultivars with zinc, iron and selenium by foliar fertilizer applications. Front. Plant Sci. 14:1144514. doi: 10.3389/fpls.2023.1144514
Received: 14 January 2023; Accepted: 22 August 2023;
Published: 07 September 2023.
Edited by:
Spyridon Alexandros Petropoulos, University of Thessaly, GreeceReviewed by:
Abdul Wakeel, University of Agriculture, Faisalabad, PakistanCopyright © 2023 Xue, Li, Yan, Miao, Zhang, Huang, Sun, Qi, Ding and Cui. This is an open-access article distributed under the terms of the Creative Commons Attribution License (CC BY). The use, distribution or reproduction in other forums is permitted, provided the original author(s) and the copyright owner(s) are credited and that the original publication in this journal is cited, in accordance with accepted academic practice. No use, distribution or reproduction is permitted which does not comply with these terms.
*Correspondence: Yan-Fang Xue, eHlmYW5nMTk4NjkyQDE2My5jb20=; Zhen-Ling Cui, Y3VpemxAY2F1LmVkdS5jbg==
Disclaimer: All claims expressed in this article are solely those of the authors and do not necessarily represent those of their affiliated organizations, or those of the publisher, the editors and the reviewers. Any product that may be evaluated in this article or claim that may be made by its manufacturer is not guaranteed or endorsed by the publisher.
Research integrity at Frontiers
Learn more about the work of our research integrity team to safeguard the quality of each article we publish.