
94% of researchers rate our articles as excellent or good
Learn more about the work of our research integrity team to safeguard the quality of each article we publish.
Find out more
ORIGINAL RESEARCH article
Front. Plant Sci. , 10 May 2023
Sec. Plant Breeding
Volume 14 - 2023 | https://doi.org/10.3389/fpls.2023.1144486
 Xiaoyu Yi1,2,3†Yingtong Ye1,2,3†Jinhui Wang1,2,3Zhen Li1,2,3Jiamin Li1,2,3Yuqi Chen2
 Guoyue Chen1,3
 Jian Ma1,3
 Zhien Pu1,2,3Yuanying Peng1,3
 Pengfei Qi1,3
 Yaxi Liu1,3
 Qiantao Jiang1,3
 Jirui Wang1,2
 Yuming Wei1,3
 Youliang Zheng1,3
 Wei Li1,2,3*
The total number of spikelets (TSPN) and the number of fertile spikelets (FSPN) affect the final number of grains per spikelet in wheat. This study constructed a high-density genetic map using 55K single nucleotide polymorphism (SNP) arrays from a population of 152 recombinant inbred lines (RIL) from crossing the wheat accessions 10-A and B39. Twenty-four quantitative trait loci (QTLs) for TSPN and 18 QTLs for FSPN were localized based on the phenotype in 10 environments in 2019–2021. Two major QTLs, QTSPN/QFSPN.sicau-2D.4 (34.43–47.43 Mb) and QTSPN/QFSPN.sicau-2D.5(32.97–34.43 Mb), explained 13.97%–45.90% of phenotypic variation. Linked kompetitive allele-specific PCR (KASP) markers further validated these two QTLs and revealed that QTSPN.sicau-2D.4 had less effect on TSPN than QTSPN.sicau-2D.5 in 10-A×BE89 (134 RILs) and 10-A×Chuannong 16 (192 RILs) populations, and one population of Sichuan wheat (233 accessions). The alleles combination haplotype 3 with the allele from 10-A of QTSPN/QFSPN.sicau-2D.5 and the allele from B39 of QTSPN.sicau-2D.4 resulted in the highest number of spikelets. In contrast, the allele from B39 for both loci resulted in the lowest number of spikelets. Using bulk-segregant analysis–exon capture sequencing, six SNP hot spots that included 31 candidate genes were identified in the two QTLs. We identified Ppd-D1a from B39 and Ppd-D1d from 10-A and further analyzed Ppd-D1 variation in wheat. These results identified loci and molecular markers with potential utility for wheat breeding and laid a foundation for further fine mapping and cloning of the two loci.
Common wheat (Triticum aestivum L., 2n = 6x = 42, AABBDD) is a hexaploid species (Consortium et al., 2014) with a large and complex genome (Bonjean and Angus, 2001; Choulet et al., 2014). Wheat is the most widely grown, with the world’s highest production and most traded food crop, sustaining one-third of the world’s population (Gupta et al., 2008). Wheat yield is a complex trait affected by multiple genetic and environmental factors. Usually, it comprises three main components: spike number per unit area, grain number per spike, and thousand-grain weight (Kuzay et al., 2019). Among these components, grain number per spike is predominantly determined by the total number of spikelets and the number of fertile spikelets, which show low environmental sensitivity and high heritability (Zhang et al., 2018; Gao et al., 2019). Therefore, understanding the genetic factors that regulate spikelet number is crucial for improving wheat yield.
The wheat spikes of wheat are characteristically unbranched inflorescences comprising an indeterminate number of florets (Koppolu and Schnurbusch, 2019). Light and temperature are the dominant factors impacting wheat spike development (Langer and Hanif, 1973). Spike fertility is affected by environmental and genetic factors (Guo et al., 2015; Sakuma et al., 2019) and is a complex quantitative trait controlled by multiple genes (Ma et al., 2007). The number, chromosomal location, and genetic effects of these multiple genes must be determined to generate optimal genotypes in breeding.
Only a few genes associated with spikelet numbers have been cloned to date. For example, WAPO1 on chromosome 7AL regulates spikelet number by affecting inflorescence development (Kuzay et al., 2019). The domestication gene Q on chromosome 5A regulates spikelet density (Simons et al., 2006; Zhang et al., 2011; Debernardi et al., 2017; Greenwood et al., 2017). The genes TaDEP1 (homologous to rice DENSE AND ERECT PANICLE 1) (Vavilova et al., 2019; Huang et al., 2022) and TaCOL-b5 modify wheat spike structure to increase yield (Zhang et al., 2022). The genes mined on chromosome 2D include the photoperiod-sensitive gene Ppd-D1, TaMOC1 (the ortholog of rice MONOCULM 1), and the FZP gene. The Ppd system includes the Ppd-A1, Ppd-B1, and Ppd-D1 genes located in the second homologous group, which are responsive to changes in photoperiod (i.e., day length) (Law et al., 1978; Scarth and Law, 1983). The FZP gene is a crucial regulator of inflorescence development and a determinant of complex spikelet formation (Dobrovolskaya et al., 2015).
Many quantitative trait loci (QTLs) for spikelet number have been identified on almost all the 21 chromosomes of wheat. The QTLs associated with spikelet number explain 2.15%–67.6% of the phenotypic variation of spikelets (Cui et al., 2012; Dan et al., 2017). Many QTLs related to spikelet number are located on chromosome 2D, and their physical locations range from 9.34 to 648.11 Mb on this chromosome (Li et al., 2002; Sourdille et al., 2003; Quarrie et al., 2006; Ma et al., 2007; Cui et al., 2012; Liu et al., 2014; Zhai et al., 2016; Deng et al., 2019; Ma et al., 2019; Li et al., 2021; Saini et al., 2022). However, few of these QTLs are stably correlated with spikelet numbers in different genetic backgrounds and environments. The contribution rate is relatively low, hinders these QTLs’ application in wheat breeding.
This study constructed a genetically stable high-generation (F2:8) recombinant inbred line (RIL) population using the wheat germplasm resources 10-A and B39, which differ significantly in spikelet number. The interactions between the mapped QTLs were analyzed. Exon capture sequencing was used to analyze the differential single nucleotide polymorphism (SNP) loci within the main QTL interval to detect hot spots and predict the target gene by combining of an expression database and differential SNP loci. The reported genes located in the interval were cloned and identified. The results identify loci and molecular markers of potential utility for wheat breeding and lay a foundation for further fine mapping and cloning of the loci.
The wheat germplasm 10-A is an unbranched common multi-spikelet line formed by introducing of the heterologous genes of rye, which has the characteristics of multi-flower and multi-grain and large spikes. The wheat lines B39 and Chuannong 16 (CN16) were bred by the Triticeae Research Institute of Sichuan Agricultural University, China. BE89 is descended from the cross between ‘Batavia’ and ‘Erine’.
Four populations were used in this study. An F2:8 RIL (152 lines) population derived from the cross of 10-A and B39 was used for the construction of genetic maps and mapping QTLs. The remaining three populations comprised a population of 134 F2:8 RIL lines derived from the cross between 10-A and BE89, a population of 192 F2:5 RIL lines from the cross of 10-A and CN16, and a natural population (CD) comprising 233 accessions of Sichuan landraces and cultivars (Supplementary Tables 3, 4). The Triticeae Research Institute of Sichuan Agricultural University provided the materials.
Phenotypic traits of the 10-A/B39 population were measured in 10 environments: Wenjiang in 2019, 2020, and 2021 (E1, E4, and E7), Chongzhou in 2019, 2020, and 2021 (E2, E5, and E8), Ya’an in 2019, 2020, and 2021 (E3, E6, and E9), and Shifang in 2021 (E10). The three validation populations were planted at the Wenjiang Experimental Teaching Base of Sichuan Agricultural University in 2021. Two replications were performed in each environment for each population. The local practices for wheat production performed field management and disease control. At maturity, five representative plants of similar growth status were randomly selected to measure agronomic traits for the main spike, comprising the heading period, flowering period, productive tillers number (FTN), plant height (PH), spike length (SL), awn length (AL), TSPN, FSPN, number of sterile spikelets per spike (SSPN), grain number per spike (GNS), and thousand-kernel weight (TKW). SL was measured as the distance from the rachis’s base to the terminal spikelet’s tip, excluding the awns. The spikelet number per spike was determined by counting the number of spikelets in the main spike.
The QTL mapping analysis was performed using the 152 RILs of the 10-A/B39 population. Leaves were sampled at the seedling stage and extracted DNA using the cetyltrimethylammonium bromide (CTAB) method. The ratio of A260/A280 of the DNA extracts was 1.70/2.10, the ratio of A260/A230 was >1.50, and the DNA concentration was >25 ng/μL. The Wheat_55K SNP chip was used for SNP sequencing and genotyping of the two parental and RIL populations (predominantly performed by the China Golden Marker (Beijing) Biotechnology Co., Ltd., Beijing, China). Mapping was conducted using the inclusive composite interval mapping function of QTL IciMapping 4.1 (https://www.isbreeding.net) software. The environment-specific QTLs were detected using the bi-parental population’s module with walking step = 0.001 cM, probability value for entering variables in stepwise regression of phenotype on marker variables (PIN) = 0.0001, and the logarithm of the odds (LOD) score ≥ 3. A QTL that explained more than 10% of the phenotypic variation and detected in more than four environments (including the best linear unbiased prediction [BLUP] dataset) was treated as a major stable QTL. The QTL loci were named according to the International Rules of Genetic Nomenclature: sicau indicates Sichuan Agricultural University, TSPN stands for total spikelet number, and FSPN represents the number of effective spikelets.
Based on the preliminary QTL mapping results, the lateral markers of the main QTLs were converted into kompetitive allele-specific PCR (KASP) markers to track the main QTLs, and new markers were developed within the interval. The flanking markers of the major QTLs were converted into KASP primers by Li et al. (2021). The addition of a FAM signal and a HEX signal to the primers differentiated the two parental genotypes. The KASP assay results were detected with the Bio-Rad CFX96 Real-Time PCR system. The newly developed markers were integrated into the genetic map to determine whether the developed KASP markers were tightly linked to major QTLs,. QTL IciMapping 4.2 software targeted the re-positioned QTLs in the 10-A/B39 population of 152 RILs.
In the F2:10 RIL 10-A/B39 population, 20 lines with the maximum TSPN and 20 with the minimum TSPN were selected to generate extreme pools. Leaves were sampled at the seedling stage, and DNA was extracted using the CTAB method. The respective DNA extracts were mixed to form the maximum and minimum extreme pools. The same method was used to extract DNA from 10-A and B39 to construct mixed parental pools. Sequencing and genotyping were predominantly performed by the Chengdu Tiancheng Future Technology Co., Ltd., Chengdu, China). The QTLseqr software package was used to calculate the allele frequency within the segment based on the SNP index and G′ value of the sliding window, as well as the allele frequency difference for the two pools, to detect the segment with the most strongly significant difference.
The interval range was further narrowed within the target QTL interval based on the marker sites of the SNP differences determined by exon capture sequencing. The Ensembl Plants database (http://plants.ensembl.org/index.html), in combination with wheat IWGSC RefSeq v1.1 gene annotations, was used to compare the physical location of the variant site and to locate the mutation site. WheatOmics 1.0 (http://202.194.139.32/) was used to analyze the gene expression levels in the different tissue sites. The target genes were annotated with gene ontology (GO) terms using the GOEnrichment tool in the TriticaeGeneTribe database (http://wheat.cau.edu.cn/TGT/index.html).
The CTAB method was used to extract DNA for the 10-A and B39 parents and offspring. Specific primers were designed using NCBI (https://www.ncbi.nlm.nih.gov/) based on the genome sequence (DQ885766) of the Chinese spring light cycle gene Ppd-D1. The PCR amplifications were conducted using Phanta Max Super-Fidelity DNA Polymerase (1 U/μL, Vazyme Biotech Co., Ltd) following the manufacturer’s instructions. Amplification of Ppd-D1 was performed with the gene-specific primers for the parental materials and ‘Chinese Spring’. The PCR products were electrophoresed in 2% agarose gel (160 V, 400 mA, 25 min) and observed with a gel imager (Tocan 240). The target bands were excised and placed in a 2.0 mL EP tube. The PCR products were recovered using the OMEGA Best Standard Agarose gel DNA recovery kit following the manufacturer’s instructions. The PCR products were connected with the target gene cloning vector (T-vector) using the Novizan 5min™ TA/Blunt-Zero Cloning Kit. The chemically competent Escherichia coli strain DH5α (Trelief™ 5α Chemically Competent Cell) cells were transformed by heat shock. The monoclonals were detected by PCR amplification. The monoclonals were cultured on an LB medium, and the universal primer M13 was used for PCR amplification of the insert in the cloning vector. Amplification of the target gene sequence indicated that the monoclonal was positive. The bacterial suspension containing the target band was submitted to the Beijing Qingke Biotechnology Co., Ltd. (Beijing, China) for sequencing. The Ppd-D1 gene sequence was analyzed using DNAMAN 9.0 (https://www.lynnon.com/qa.html) software.
In the ten environments (Figure 1), the TSPN of 10-A ranged from 25 to 30, and the average was 27.87. The FSPN of 10-A ranged from 23 to 29, averaging 25.76. The TSPN of B39 ranged from 16 to 24; the average was 20.17. The number of effective spikelets of B39 varied from 15 to 23, and the average was 19.13. Comparing TSPN and FSPN between 10-A and B39 in all environments, the target traits of the female parent (10-A) were significantly higher than those of the male parent (B39).
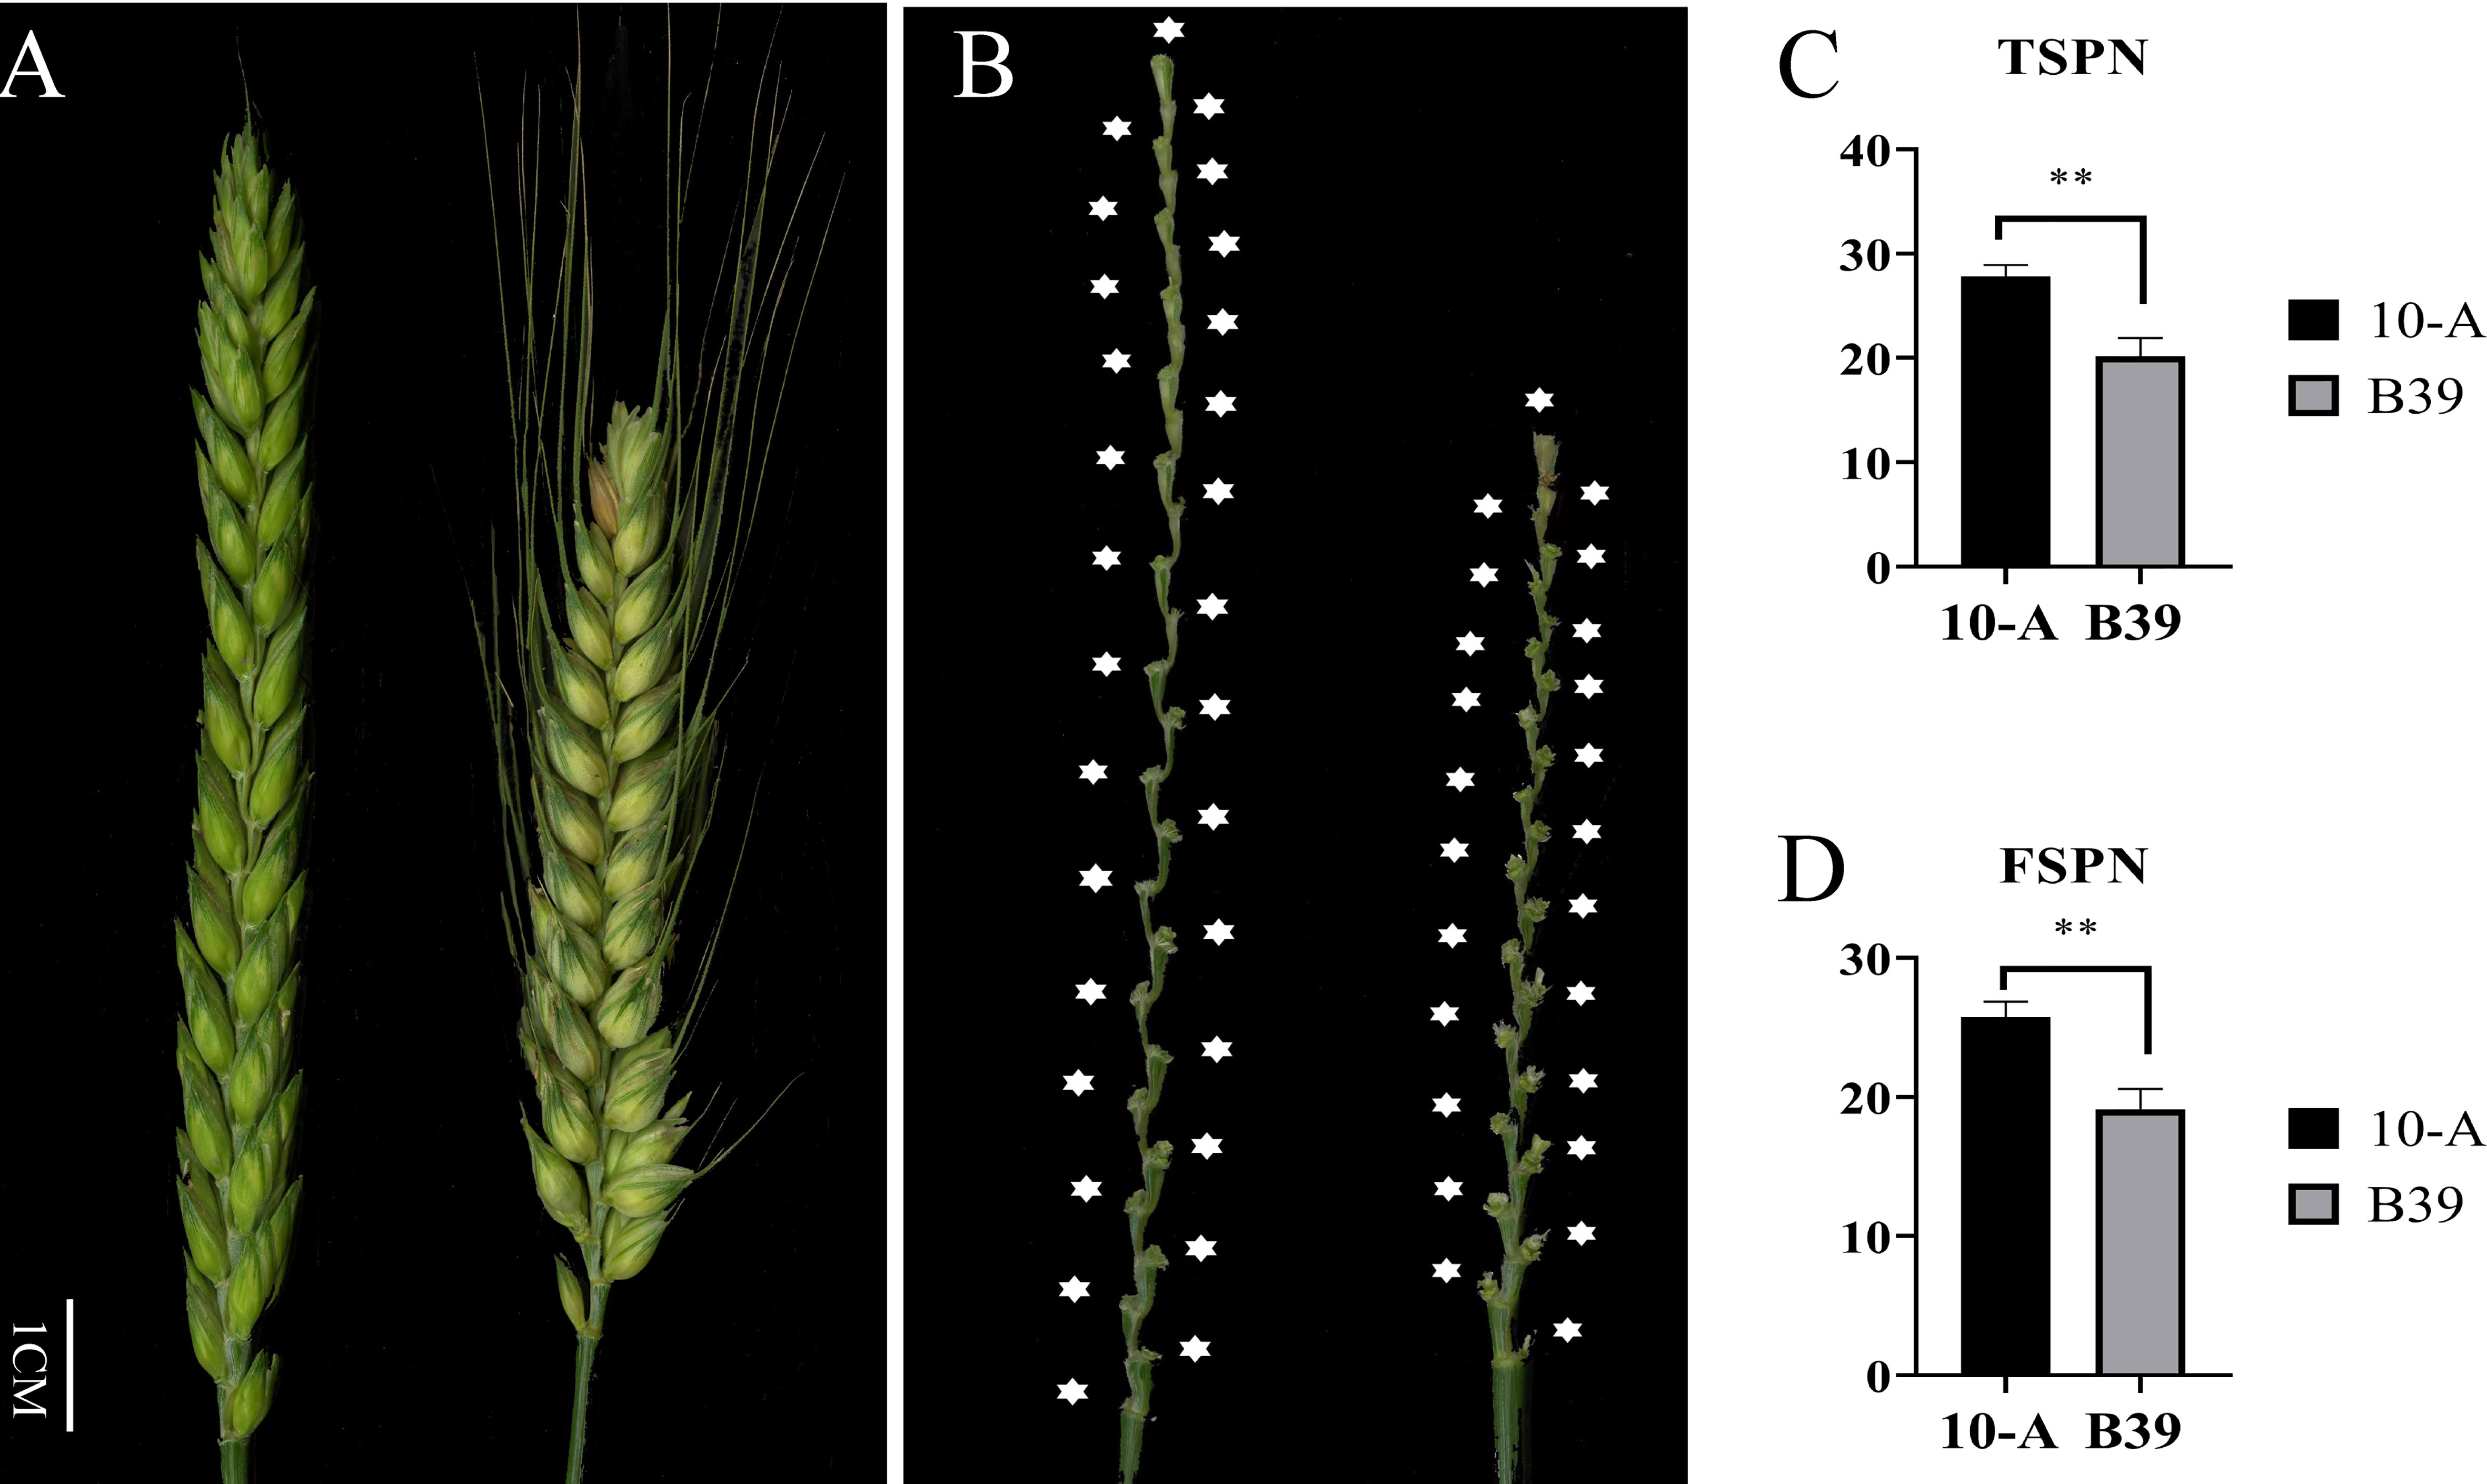
Figure 1 Spike morphology of the parents. The morphology of spikes of 10-A and B39 at the filling period (A) and rachis (B). The mean of total spikelet number per spike (TSPN) (C) and the fertile spikelet number per spike (FSPN) (D) of 10-A and B39 at maturity in ten environments. ** represents significance at P < 0.01.
Among the ten environments and the BLUP dataset (Supplementary Table 1), the number of spikelets in the population of 152 RILs derived from 10-A and B39 ranged from 14 to 38. The mean value in the population ranged from 22.03 to 26.44, and the coefficient of variation ranged from 8.14% to 14.04% fluctuated, and the same traits did not fluctuate much in different environments. The broad-sense heritability was 0.84 for TSPN and 0.76 for FSPN, indicating that genetic factors mainly controlled the traits.
Correlation analysis between TSPN and FSPN in all environments and BLUP values showed that TSPN and FSPN were highly significantly positively correlated in all environments (Supplementary Figure 1). In the 10-A/B39 population, significant positive correlations between TSPN and FSPN (Supplementary Table 2), and negative correlations between TSPN and TKW, were observed. TSPN was strongly positively correlated with SL, SSPN, heading period, and flowering period and weakly positively correlated with TGW. No significant correlation was detected for TSPN with FTN, PH, and AL. Significant correlations were detected for FSPN with SL, heading period, and flowering periods.
The scores for the probes were classified into six categories by the Affymetrix software: (I) Poly High Resolution (PHR) (26,485; 49.9%); (II) No Minor Homozygote (10457; 19.7%); (III) Off-Target Variant (3437; 6.5%); (IV) Mono High Resolution (278; 0.5%); (V) Call Rate Below Threshold (1475; 2.8%); and (VI) Other (10931; 20.6%). Only the probes from the first group (PHR) with the highest reliability were retained (defined as frequency < 0.3). Ultimately, 8719 SNP markers were used for linkage analysis and map construction. Linkage analysis revealed that 1354 bin markers were mapped on the genetic maps. The total genetic distance of the genetic linkage map was 2407.17 cM, the average genetic distance was 2.42 cM/SNP, and the map contained 1247 SNP markers (Table 1). The percentages of markers contained in the chromosomes of subgenomes A, B, and D were 38.89%, 37.77%, and 23.34%, respectively. The SNPs were distributed on all 21 chromosomes. Based on the SNP flanking sequences, we assigned all mapped SNPs to the wheat genome assembly IWGSC RefSeq v1.0. The SNP order in the present genetic map showed good agreement with that in the wheat genome assembly (Supplementary Figure 2).
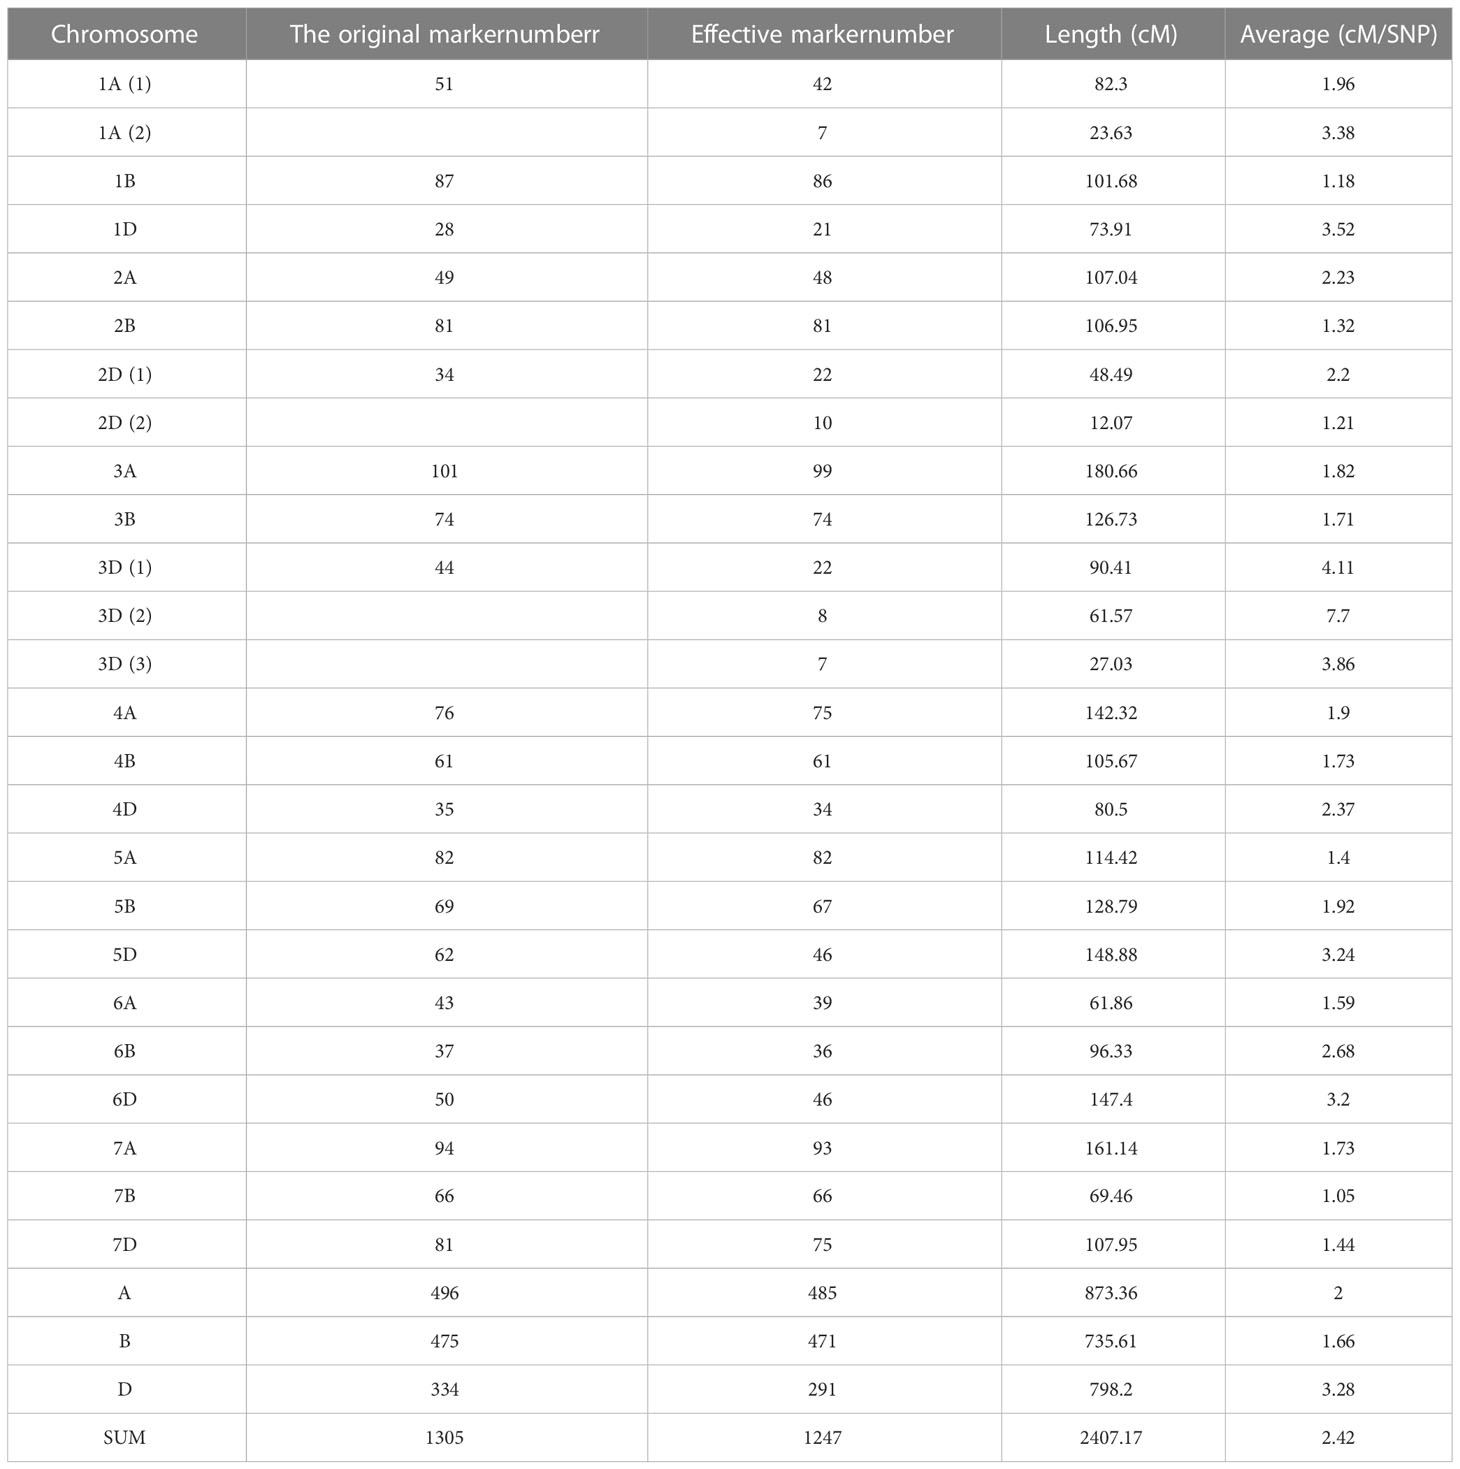
Table 1 The information of genetic map.
Mapping of QTLs was performed based on the phenotypic data and BLUP values for TSPN in the ten environments (Tables 1, 2). Twenty-four QTLs for TSPN were identified and distributed on chromosomes 1B (two QTLs), 2A (three), 2D (three), 3A (one), 3B (one), 3D (one), 4B (five), 5A (four), 5B (one), and 7D (three). The proportion of the phenotypic variance explained ranged from 3.36% to 20.92%. QTSPN.sicau-2D.1 was detected between AX-109465277 and AX-109785183 in ten environments and the BLUP dataset and explained 10.38%–20.92% of the total phenotypic variation with LOD values of 4.10–13.10. QTSPN.sicau-2D.1 was repeatedly detected in the ten environments and BLUP dataset. This QTL was considered an environmentally stable and major QTL, and its additive effect was derived from 10-A. QTSPN.sicau-2D.3 was detected in six environments (E2, E3, E4, E5, E6, and BLUP), and explained 12.59%–17.52% of the total phenotypic variance with LOD values of 4.77–10.89. QTSPN.sicau-2A.3 was detected in three environments (E2, E4, and BLUP) and explained 6.57%–10.11% of the phenotypic variance. Both QTSPN.sicau-2D.2 and QTSPN.sicau-3B.1 were detected in two environments, while the remaining QTLs were detected in a single environment, explaining 3.36%–11.34% of the phenotypic variance. Among these QTLs, QTSPN.sicau-3B.1, QTSPN.sicau-5B.1, QTSPN.sicau-7D.1, QTSPN.sicau-7D.2, and QTSPN.sicau-7D.3 alleles were derived from B39. The remaining QTL alleles were derived from 10-A.
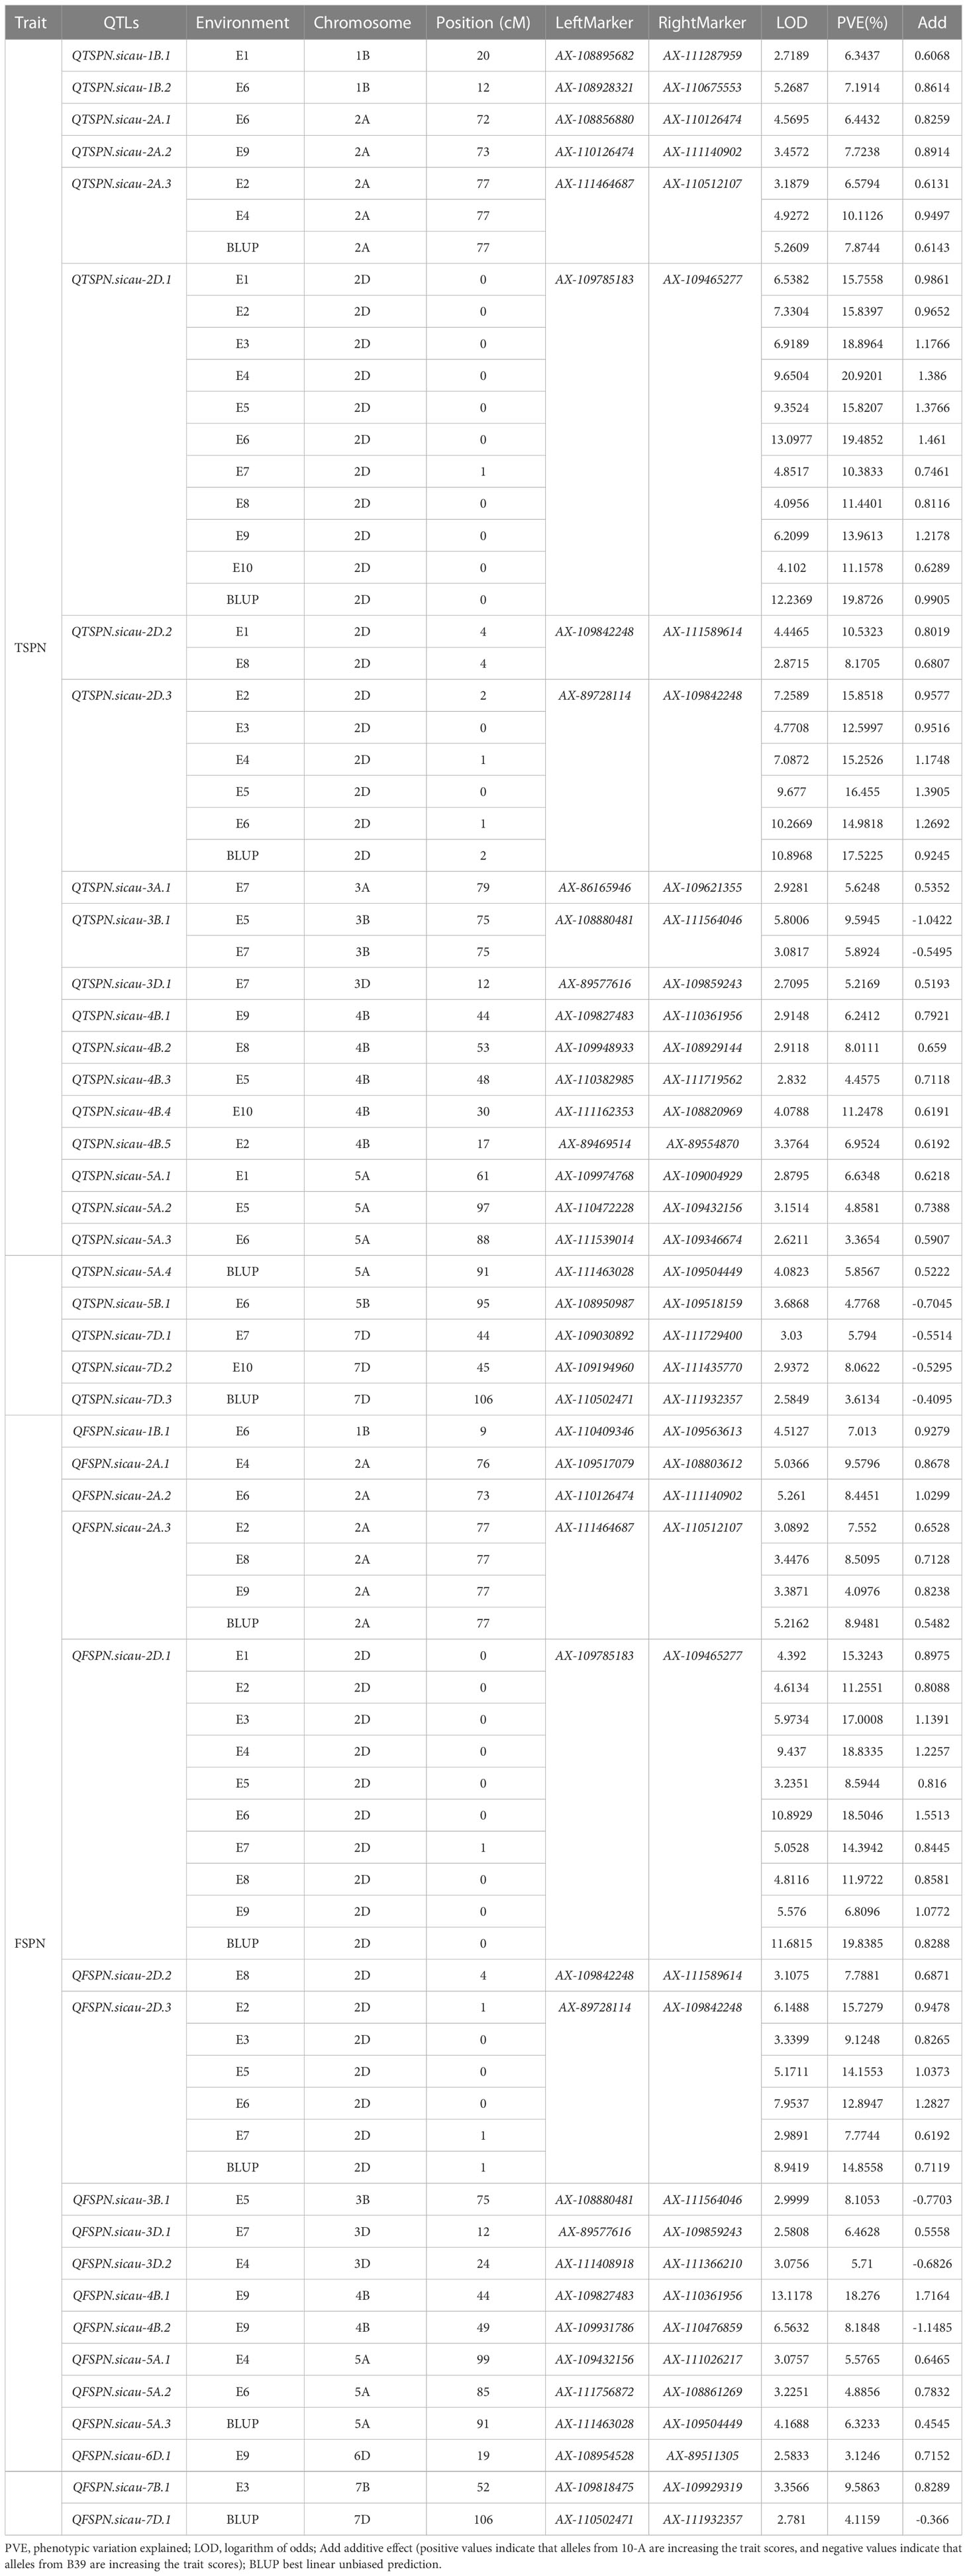
Table 2 QTL mapping for the total spikelets per spike and the fertile spikelets per spike in wheat from “10-A×B39”RIL population at 55K SNP chip.
Eighteen QTLs for FSPN were co-localized on chromosomes 1B (one QTL), 2A (three), 2D (three), 3B (one), 3D (two), 4B (two), 5A (three), 6D (one), 7B (one), and 7D (one). QFSPN.sicau-2D.1 was detected in 10 environments (E1, E2, E3, E4, E5, E6, E7, E8, E9, and BLUP) with LOD values of 3.23–11.68. This QTL was located between AX-109465277 and AX-109785183, explaining 6.80%–19.83% of the phenotypic variance, and the phenotypic contribution rate was >10% in eight environments. The additive effect of the QTL was derived from 10-A. QFSPN.sicau-2D.3 was detected in six environments (E2, E3, E5, E6, E7, and BLUP) with LOD values of 2.99–8.94, explained 7.77%–15.92% of the phenotypic variation, and its additive effects were derived from 10-A. QFSPN.sicau-2A.3 was detected in four environments (E2, E8, E9, and BLUP) and explained 4.08%–8.94% of the phenotypic variation. The remaining QTLs were detected in a single environment and explained 3.12%–18.27% of the phenotypic variation. Among these QTLs, QFSPN.sicau-3B.1, QFSPN.sicau-3D.2, QFSPN.sicau-4B.2, and QFSPN.sicau-7D.1 alleles were derived from B39. The remaining QTL alleles were derived from 10-A.
To narrow the QTL mapping range, based on the results of the wheat 55K SNP array, eight pairs of KASP markers were developed on either side and within the interval for QTSPN.sicau-2D.1 (the marker information is shown in Supplementary Table 5). Combining the genotyping results for the eight pairs of KASP markers and the wheat 55K array genotype identification results for the 10-A/B39 population, QTL mapping was repeated for TSPN and FSPN (Table 3; Figure 2), which were mapped to two new QTLs for TSPN (QTSPN.sicau-2D.4 and QTSPN. sicau-2D.5) and two new QTLs for FSPN (QFSPN.sicau-2D.4 and QFSPN.sicau-2D.5). Detected in five environments (E1, E3, E4, E5, and E8), QTSPN.sicau-2D.4 explained 21.76%–38.49% of the phenotypic variation with LOD values of 7.20–24.49 and was located between AX-110071222 and KASP-AX-111956072. QTSPN.sicau-2D.5 was detected in seven environments (E2, E4, E6, E7, E9, E10, and BLUP), explaining 20.59%–44.83% of the phenotypic variation with LOD values of 7.47–24.88, and was located between KASP-AX-111956072 and KASP-AX-111096297. QFSPN.sicau-2D.4 was detected in four environments (E1, E3, E8, and E9) and explained 17.19%–34.81% of phenotypic variation with LOD values of 6.62–14.80. QFSPN.sicau-2D.5 was detected in seven environments (E2, E4, E5, E6, E7, E10, and BLUP) and explained 13.97%–45.90% of the phenotypic variation with LOD values of 4.83–21.66. The additive effects of these QTLs were all derived from 10-A.
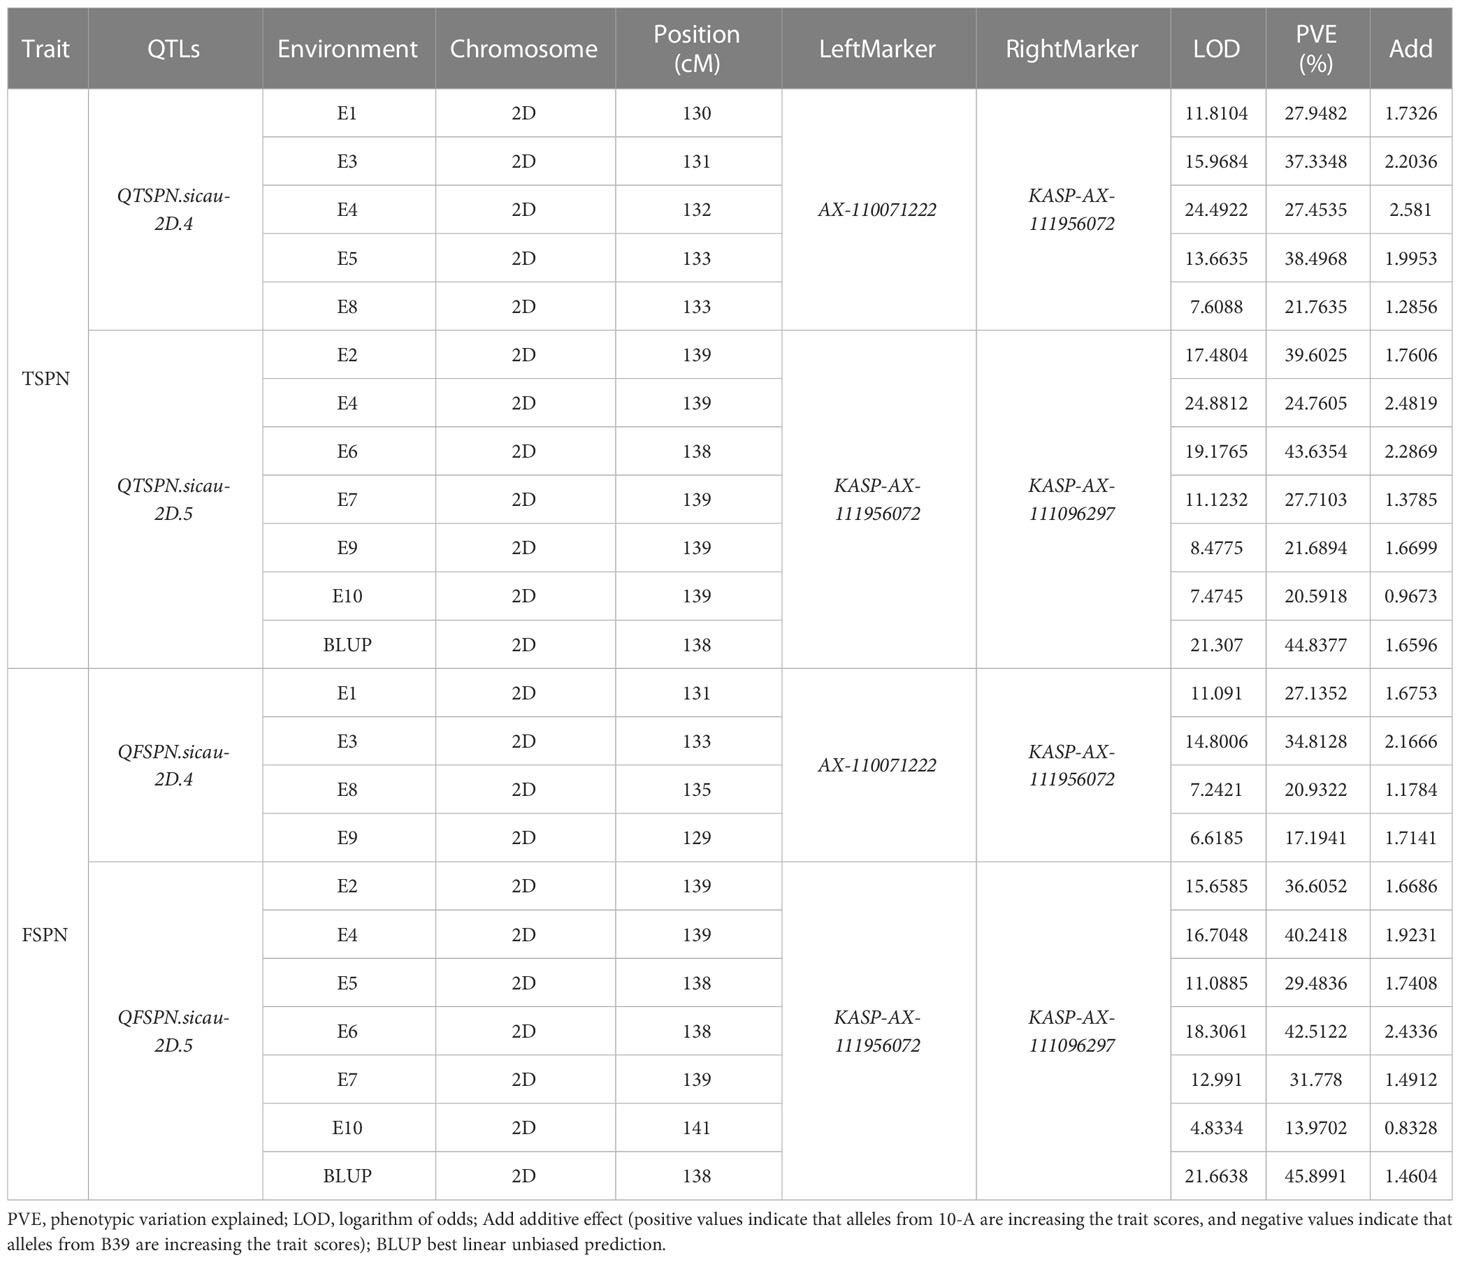
Table 3 QTL mapping for the total spikelets per spike and the fertile spikelets per spike in wheat from “10-A×B39”RIL population at 55K SNP chip and KASP.
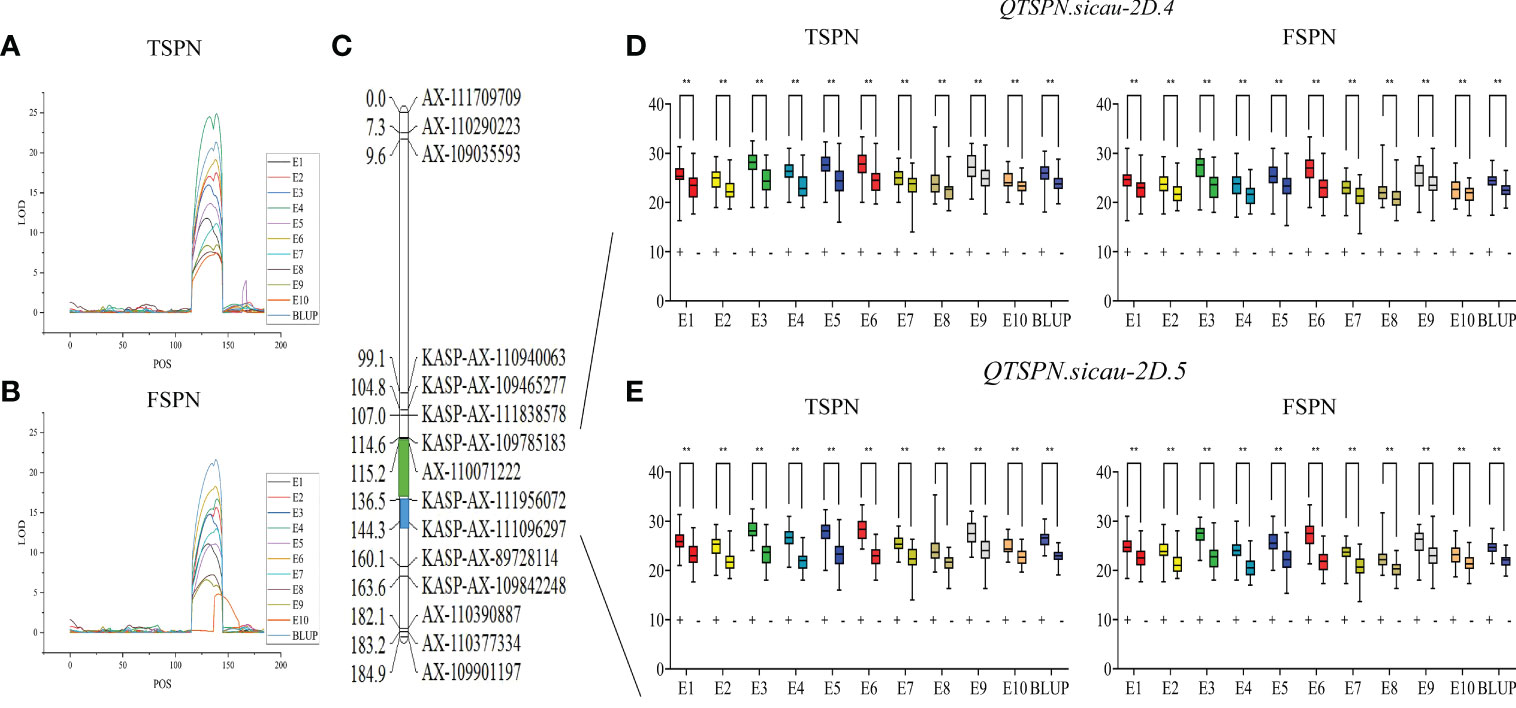
Figure 2 Genetic map of the major quantitative trait locus (QTL) QTSPN.sicau-2D.4 and QTSPN.sicau-2D.5 and its effect. LOD value of TSPN QTL (A) and LOD value of FSPN QTL (B) on chromosome 2D among ten environmental and BLUP values. Genetic map integrated with the developed Kompetitive Allele-Specific PCR (KASP) marker (C). The green and blue areas represent the major QTL QTSPN.sicau-2D.4 and QTSPN.sicau-2D.5, respectively. The total spikelet number per spike (TSPN) and fertile spikelet number per spike (FSPN) were shown as box plots calculated after grouping the 10-A/B39 population into two classes based on the KASP marker of the QTL QTSPN.sicau-2D.4 (D) and QTSPN.sicau-2D.5 (E); + and - indicate the lines with and without positive alleles of QTL; ** represents significance at P < 0.01.
The KASP_AX_109785183 marker closely linked to QTSPN.sicau-2D.4, and the KASP_AX_111956072 marker closely linked to QTSPN.sicau-2D.5 both detected polymorphism between 10-A and B39. Thus, the 10-A/BE89 population, 10-A/CN16 population, and the CD population of Sichuan wheat accessions were employed to verify QTSPN.sicau-2D.4 and QTSPN.sicau-2D.5 in different genetic backgrounds (Figure 3).
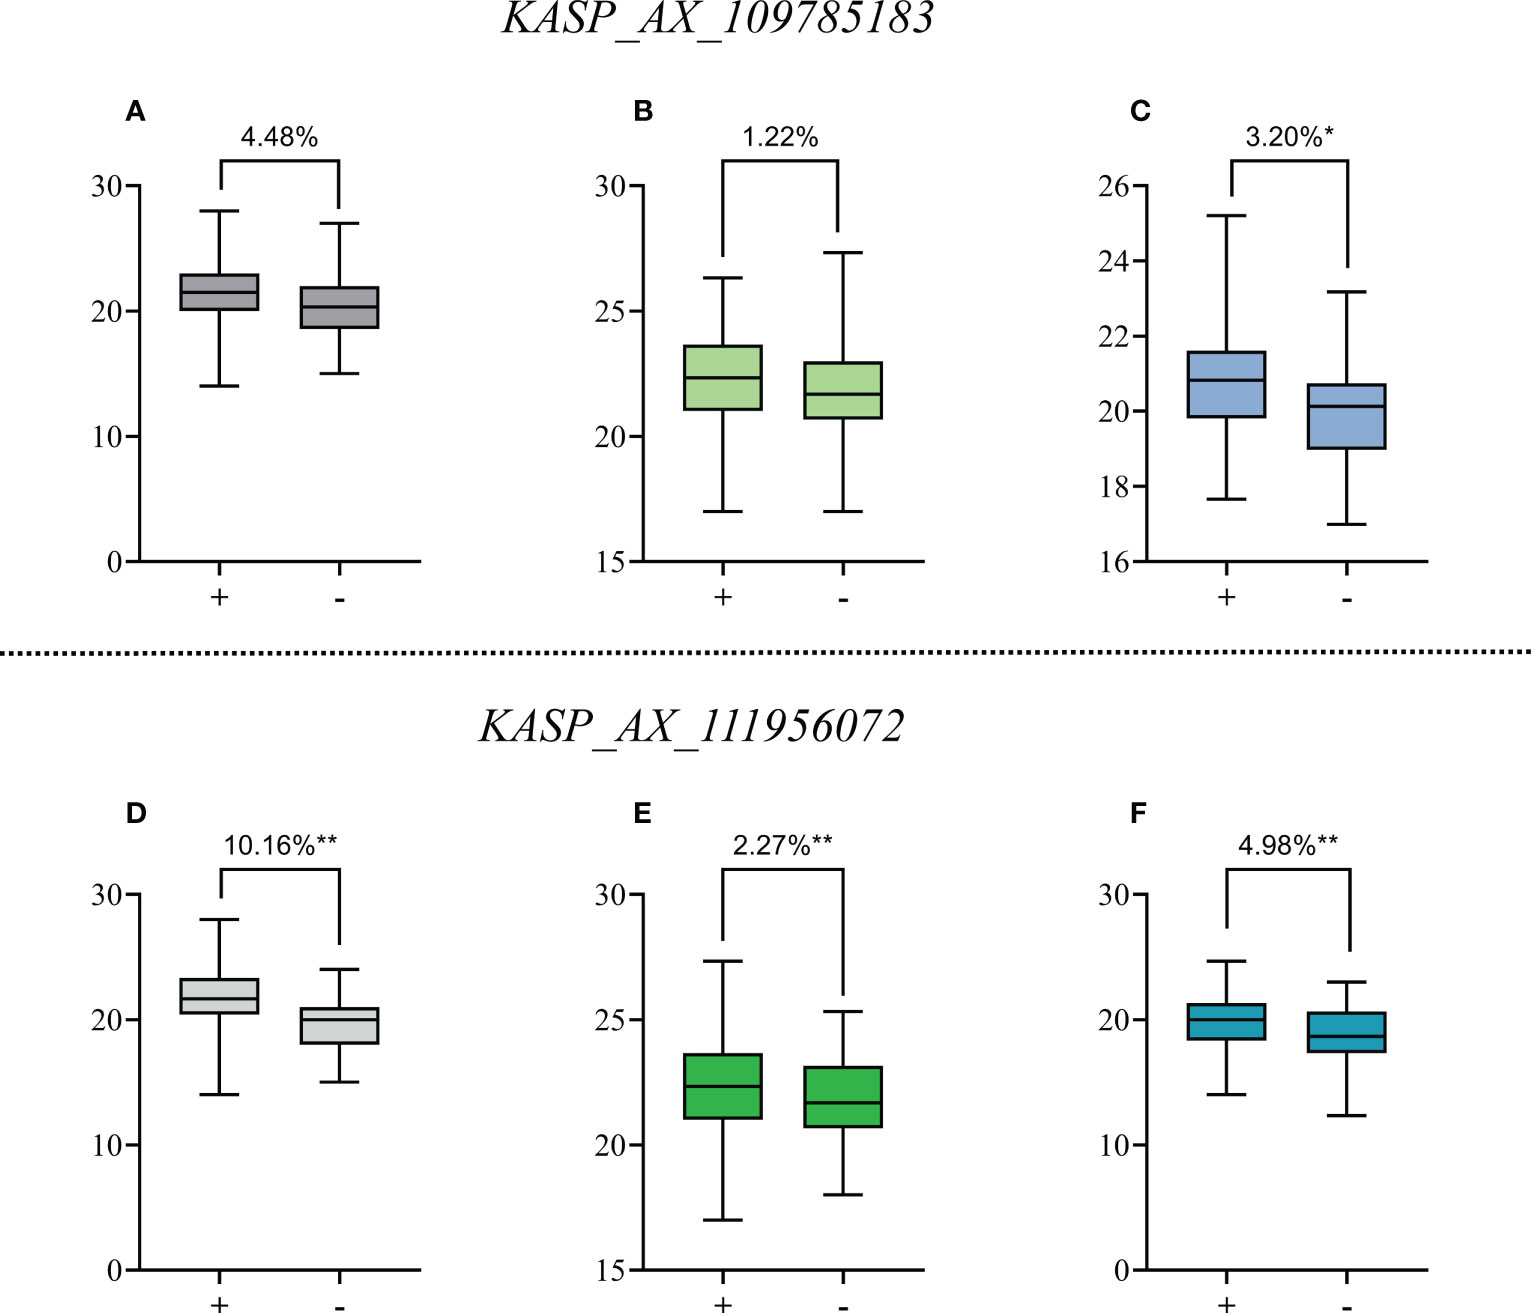
Figure 3 Effects of QTSPN.sicau-2D.4 and QTSPN.sicau-2D.5 on total spikelet number per spike (TSPN) in the 10-A/BE89 population (A, D), 10-A/CN16 population (B, E) and CD population (C, F). + and - indicate the lines with and without positive alleles of QTSPN.sicau-2D.4 and QTSPN.sicau-2D.5; * and ** represent significance at P < 0.05 and P < 0.01, respectively.
The marker KASP_AX_109785183 successfully genotyped all populations. Among the CD population, 83 lines were type A from 10-A, 71 were type B from B39, and 27 were heterozygous. Significant differences in TSPN between the parental types were detected (P < 0.05). TSPN of the A-type was increased by 3.20% compared with the B-type. In the 10-A/BE89 population, 68 lines were A-type-, 56 were type-B, and ten were heterozygous. The TSPN of the parent types was not significantly different (P>0.05). In the 10-A/CN16 population, 88 lines were A-type, 75 were B-type, and 29 were heterozygous. The TSPN of the parent types was not significantly different (P > 0.05), and the TSPN of the A-type was increased by 1.22% compared with the B-type.
The KASP_AX_109785183 marker successfully genotyped all three populations. Among the CD population, 42 lines were A-type, 172 were B-type, and 15were heterozygous. The difference in TSPN between the parental types was strongly significant (P < 0.01). The TSPN of the A-type was increased by 4.98% compared with the B-type. In the 10-A/BE89 population, 68 lines were A-type, 58 were B-type, and 15 were heterozygous. The difference in TSPN between the parental types was strongly significant (P < 0.01), and the TSPN of the A-type was increased by 10.16% compared with the B-type. In the10-A/CN16 population, 91 lines were A-type, 77 were B-type, and 24 were heterozygous. The difference in TSPN between the parental types was highly significant (P < 0.01), and the TSPN of the A-type was increased by 2.27% compared with the B type.
A total of 203 SNP sites were captured in the interval of QTSPN.sicau-2D.4/QFSPN.sicau-2D.4 by bulk-segregant analysis–exon capture sequencing (Figure 4). The results revealed that 168 mutated SNPs were concentrated in three intervals. The SNPs were mapped to the IWGSC RefSeq v1.1 genome assembly. Thirty-two mutation sites were located between 37.25 and 37.52 Mb, accounting for 15.76% of the total mutation sites. Eighty-three mutation sites were located between 38.20 and 38.79 Mb, accounting for 40.88% of the total mutation sites. Fifty-three mutation sites were located between 43.22 and 43.90 Mb, accounting for 26.11% of the total number. KASP markers were developed based on the SNP mutation hot spots in the candidate region, namely KASP_35677660 and KASP_45881230 (Supplementary Table 5), and genotyping of the 10-A/B39 population was performed. Genotyping was successful for both markers. Using KASP_35677660, 85 lines with the 10-A allele and 48 with the B39 allele were identified. Three lines were heterozygous and genotyping failed for the remaining 16 lines. The difference in TSPN between the parental types was strongly significant (P < 0.01). Using KASP_45881230, 81 lines with the 10-A allele and 56 with the B39 allele were identified. Two lines were heterozygous, and genotyping failed for the remaining 13 lines. The difference in TSPN between the parental types was significant (P < 0.05). KASP_35677660 and KASP_45881230 were tightly linked markers for QTSPN.sicau-2D.4.
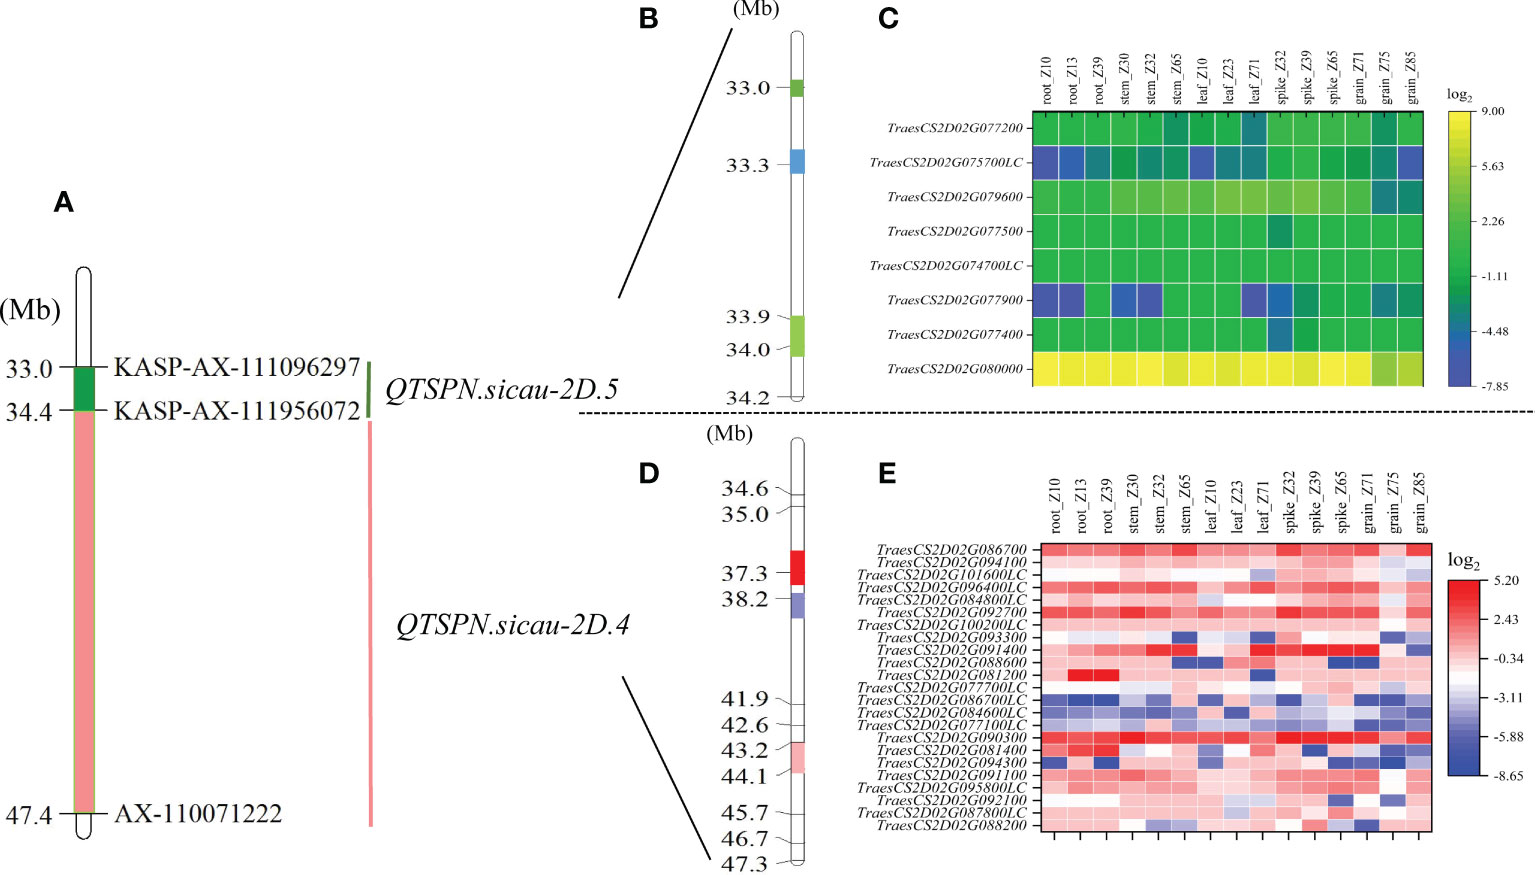
Figure 4 Physical maps and exon capture results of major quantitative trait loci (QTL) QTSPN.sicau-2D.4 and QTSPN.sicau-2D.5. Physical map integrated with the developed Kompetitive Allele-Specific PCR (KASP) marker (A). The green area is the interval of the major QTL QTSPN.sicau-2D.5 (B). The three colored areas represent the three hot spots, and the numbers on the left are the physical locations. (C) is the expression map of the predicted genes within QTSPN.sicau-2D.5 in different wheat tissues at different stages. The Pink area is the interval of the major QTL QTSPN.sicau-2D.4 (D). The three colored areas represent the three hot spots, and the numbers on the left are the physical locations. The expression map of the predicted genes within QTSPN.sicau-2D.4 in different wheat tissues at different stages (E).
Eighteen mutated SNP sites were captured in the interval for QTSPN.sicau-2D.5 and QFSPN.sicau-2D.5 (Figure 4). Seventeen mutation sites were concentrated in three intervals, with four mutation sites located between 32.97 and 33.04 Mb, accounting for 22.22% of the total mutation sites. Eight mutation sites were located between 33.31 and 33.32 Mb, accounting for 44.44%. Five mutation sites were located between 33.89 and 34.02 Mb, accounting for 27.78% of the total.
The combination of four tightly linked KASP markers, i.e., KASP_AX_111096297 and KASP_AX_111956072 for QTSPN.sicau-2D.5, and KASP_35677660 and KASP_AX_109785183 for QTSPN.sicau-2D.4, was applied to genotype the 10-A/B39 population (Figure 5). A total of 16 combinations were detected, indicating that there was no co-segregation between QTSPN.sicau-2D.4 and QTSPN.sicau-2D.5.
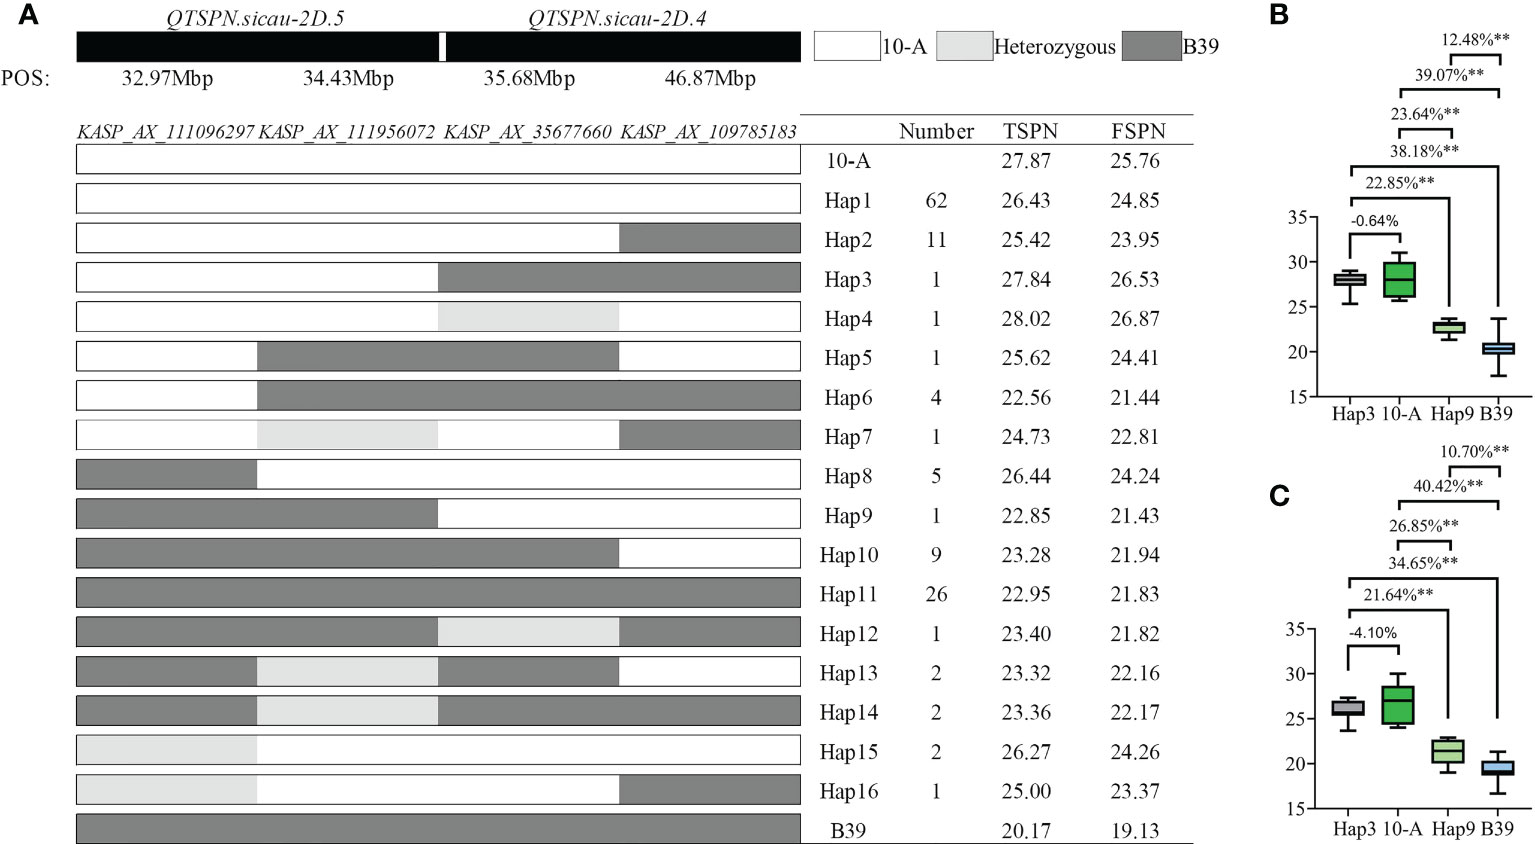
Figure 5 Genotyping map of QTSPN.sicau-2D.4 and QTSPN.sicau-2D.5 loci in 10-A/B39 population. (A) is different types of two QTLs in the 10-A/B39 population; the total spikelet number per spike (B) and fertile spikelet number per spike (C) in tye3, tye 9, 10-A, B39 were compared. ** represents significance at P < 0.01.
In the genotyping results with the four pairs of KASP markers for the 10-A/B39 population, the haplotype represents the combination of the allelic variation of the four markers in 10-A and B39. The phenotype data yielded the following results: haplotype 1 of 10-A comprised 62 lines, and haplotype 11 of B39 comprised 26 lines. The spikelet number of haplotype 1 was strongly significantly higher than that of haplotype 11 (P < 0.01). The number of spikelets of haplotype 3 lines exceeded that of 10-A in 10 environments, and the TSPN of haplotype 9 lines was significantly higher than that of B39 in ten environments (P < 0.01). The TSPN of haplotype 3 was significantly higher than that of haplotype 9 in the 10 environments. About TSPN, the ranking haplotype 3 > 10-A > haplotype 9 > B39 was observed, indicating that the combination of QTSPN.sicau-2D.5 with the 10-A allele and QTSPN.sicau-2D.4 with the B39 allele resulted in the highest number of spikelets.
The mutated SNP sites co-captured in the QTSPN.sicau-2D.4/QFSPN.sicau-2D.4 interval were individually aligned to the wheat genome. In total, 148 mutation sites corresponded to 23 candidate genes in the wheat genome. Twenty-three genes were functionally annotated (Supplementary Table 6), mainly proteins and ubiquitin. A GO enrichment analysis was performed on the 23 genes. Six genes (TraesCS2D02G081400, TraesCS2D02G086700, TraesCS2D02G088200, TraesCS2D02G090300, TraesCS2D02G092100, and TraesCS2D02G094100) were involved in response to biological stimuli, anchoring components of membranes, cytoskeleton, ubiquitin-like modifier activating enzyme activity, toxin activity, negative regulation of translation, ribosomal RNA N-glycosylase activity, serine-type peptidase activity, and calmodulin binding. The 18 mutated SNP sites captured in the QTSPN.sicau-2D.5/QFSPN.sicau-2D.5 interval were aligned to the wheat genome, and 13 mutation sites were detected, corresponding to the exons of eight candidate genes. Functional annotation of the eight genes in wheat genome assembly version 1.1 indicated comprised proteins, reductases, and subunits. The GO functional annotation analysis of the eight genes (Table 4) revealed two genes, TraesCS2D02G079600 (Ppd-D1) and TraesCS2D02G080000, were annotated with four functions, namely negative regulation of long-day photoperiod phenomenon, phosphorescence relay signal transduction system, peroxidase activity, and response to oxidative stress.
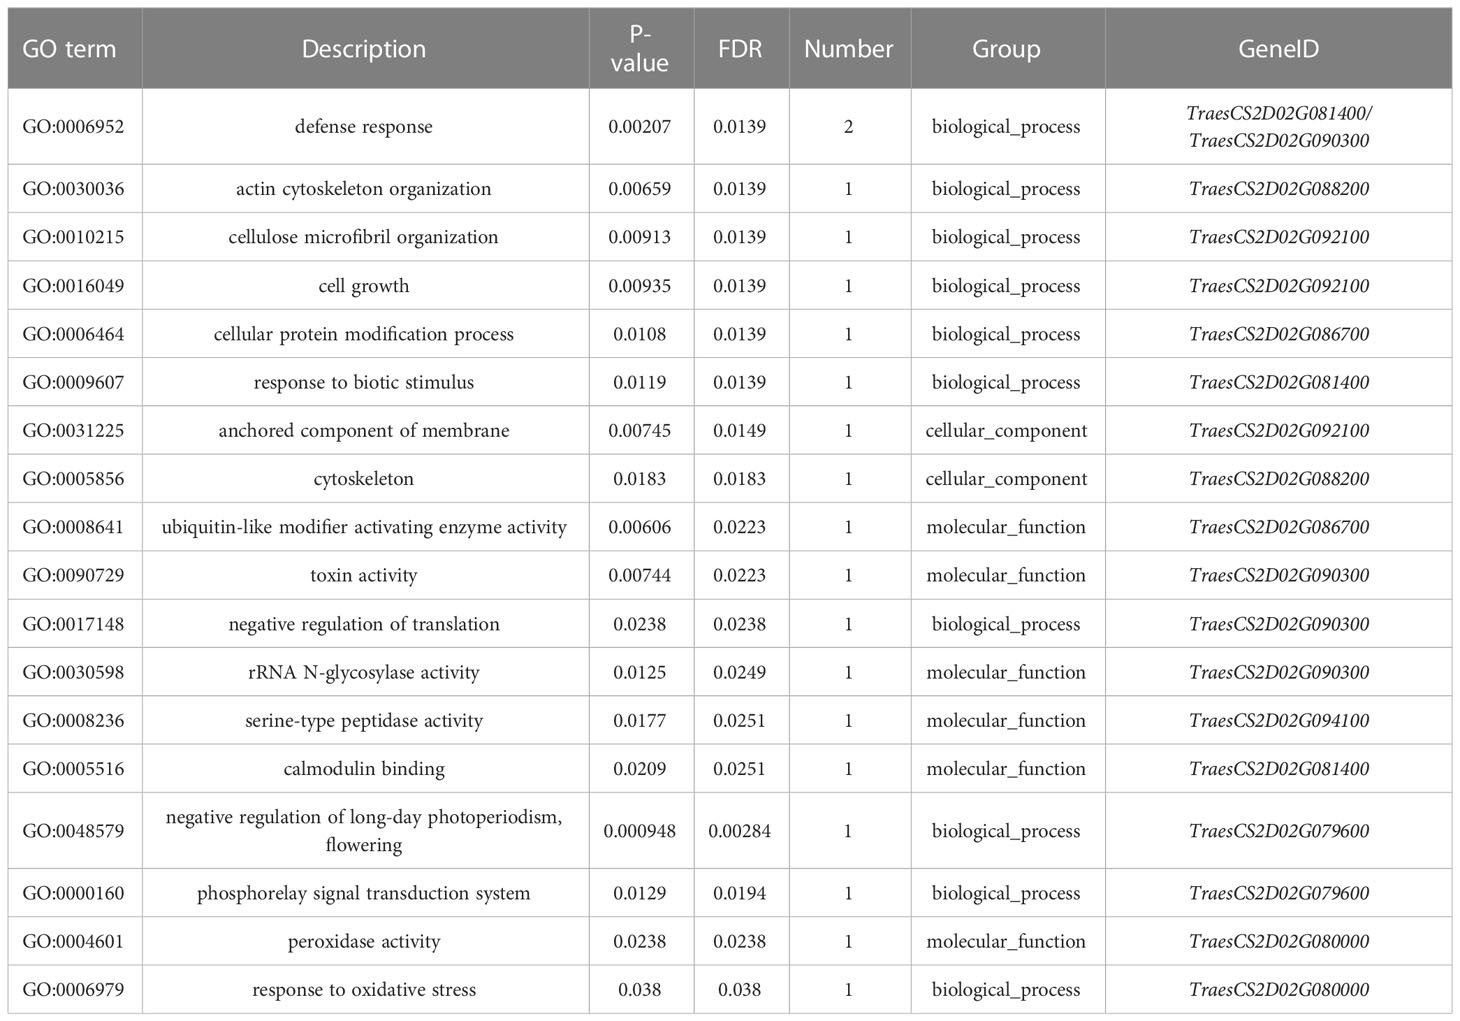
Table 4 GO annotation results of 31 target genes.
The expression levels of 31 candidate genes were predicted in the roots, stems, leaves, spikes, and seeds of wheat during three spike developmental stages using WheatOmics 1.0 (Figure 4). The genes TraesCS2D02G090300, TraesCS2D02G091400, TraesCS2D02G080000, and TraesCS2D02G079600 had higher predicted expression levels in the spike in the three developmental stages. Homologous gene alignment for the target genes with the TriticeaeGeneTribe database detected homologs in rice and Arabidopsis (Table 4). Most of the genes corresponded to multiple homologous genes in rice and Arabidopsis, and the consistency was 22.16%–90.00%. Moreover, a significant difference in spikelet number between the parental types was observed (P <0.01) using the molecular markers of the TraesCS2D02G079600 (Ppd-D1) gene.
The 5981 bp sequence, including the coding region of Ppd-D1 was amplified using all coding regions of the NCBI website (Figure 6). Fragments of 5976 bp (10-A) and 3892 bp (B39) were amplified. Alignment of the 10-A and B39 amplified sequences with the sequence from Chinese Spring revealed that the Ppd-D1 gene shares eight exon regions. The sequence from B39 lacked a 2089 bp fragment in the promoter region, and the sequence from 10-A contained a five bp deletion in exon 7. These results indicated that the Ppd-D1 gene from B39 and 10-A was the Ppd-D1a allele and Ppd-D1d allele, respectively. Translation of the sequence of B39 is affected by the large deletion in the promoter region, which significantly affects the expression of Ppd-D1a; the expressed protein of 10-A is altered owing to the five bp deletion in exon seven, and thus it may not perform its original function.
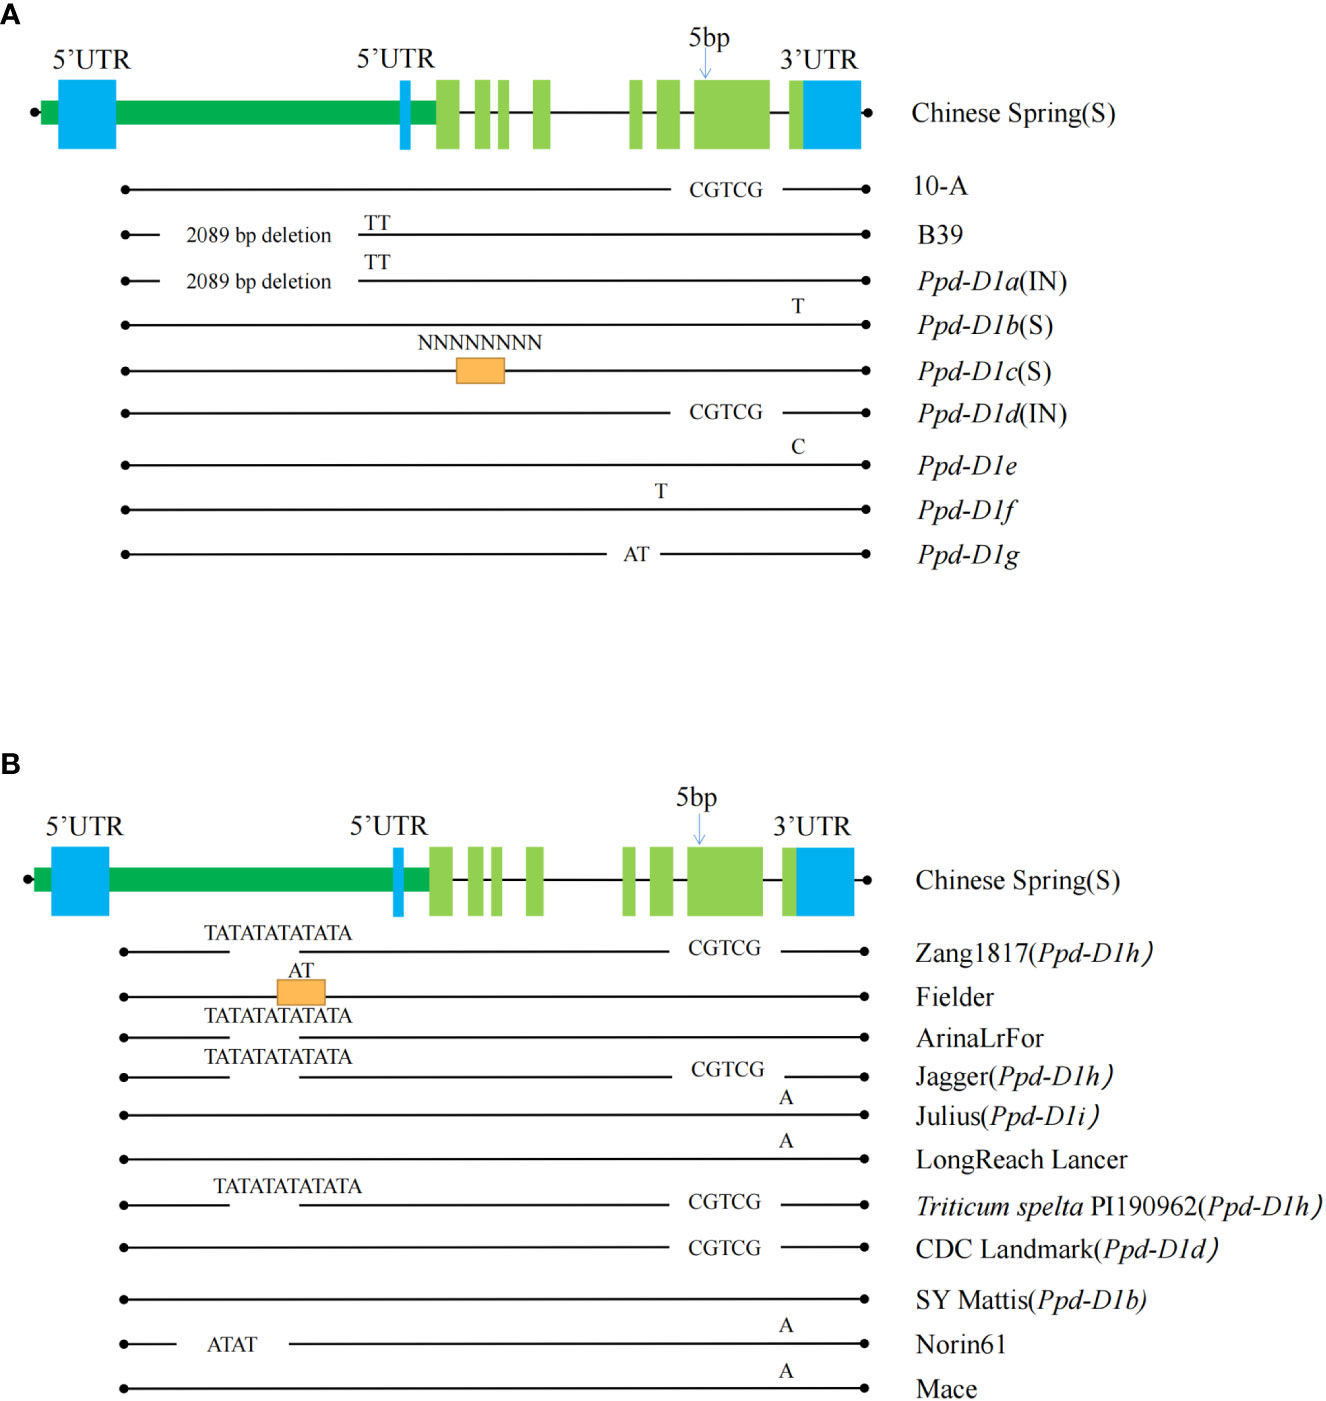
Figure 6 The sequence characteristics of the pseudo-response regulator (Ppd-D1) gene. Comparing the Ppd-D1 genes among 10-A, B39, and seven other allelic variation types (A) and the other types of variation of the Ppd-D1 gene in different wheat varieties (B). Allelic variant type sequences found from other cultivars are shown in the black line below each ‘Chinese Spring’ sequence. Black dots indicate the edges. Chinese spring sequence is shown as rectangles (dark green long rectangle indicates promoter region, blue rectangle for 5’ UTR and 3’ UTR regions. Light green rectangles indicate the exon regions). Regions with missing lines show deletions of the sequence, and orange rectangles indicate the presence of an insertion in that region. Specific deletion and inserted sequences are annotated above them. S indicates that this allelic variant type is photoperiod-sensitive, and IN is photoperiodic-insensitive. The SNP shows the position of the single-nucleotide variants.
After BLAST alignment of Ppd gene sequences in NCBI, seven mutation types in the Ppd-D1 gene of hexaploid wheat were detected. Chinese Spring had the Ppd-D1b (accession: KJ147478) type, which is light-sensitive. Compared with the complete sequence of Ppd-D1, Ppd-D1a (accession: KJ147477) contained the 2089 bp deletion in the promoter region, Ppd-D1c (accession: KJ147483) included insertion of an unknown sequence in exon 2, Ppd-D1d (accession: KJ147481) had a five bp deletion in exon 7, Ppd-D1e (accession: KJ147482) has a single-base mutation in exon 8, Ppd-D1f (accession: KJ147479) included an AT base mutation between exons 5 and 6, and Ppd-D1h (accession: KJ147484) contained an AT deletion in exon 5.
To further understand the variation of Ppd-D1, the WheatOmics platform (http://202.194.139.32/) was used to compare the Ppd-D1 gene in different wheat varieties. In addition to the seven mentioned above types, five variant types were detected, including an AT deletion in the promoter. This mutation directly affects the function of a protein type showing reduced photoperiod sensitivity, similar to the Ppd-D1a mutant type, and thus could be used as an alternative allele to Ppd-D1a. The five bp deletion in exon 7 of Ppd-D1 was observed in various wheat cultivars, including Zang1817, Jagger, Triticum spelta PI190962, and CDC Landmark. Among these cultivars, CDC Landmark is of the Ppd-D1d type. Thus, the variation in Ppd-D1 tended to be photoperiod-insensitive in the wheat materials examined.
To date, QTLs controlling spikelet number have been detected on all 21 chromosomes of wheat; for example, the QTLs Xwmc181.1-Xaf12d, Xaf12–Xcfd239, Xcfd267–Xmag3596, Xbarc228–Xwmc181.1, and QTsn.czm-2D.3 are located on chromosome 2D (Ma et al., 2007; Cui et al., 2012; Zhou et al., 2017; Li et al., 2021). Those QTLs on the long arm of chromosome 2D are mainly concentrated between 480 and 650 Mb (Li et al., 2002; Zhou et al., 2017; Deng et al., 2019; Li et al., 2021; Saini et al., 2022). The reported QTLs on the short arm of 2D include Xbcd611–Xgwm484. The present positioning results indicated that most QTLs were concentrated between 10.00 and 43.00 Mb. The QTLs identified in this study located on the short arm of 2D were QTSPN.sicau-2D.4 (chr2D: 34.43–47.43 Mb) and QTSPN.sicau-2D.5 (chr2D: 32.97–34.43 Mb).
Deng et al. (2019) detected QTSS.sicau-2D.2 in four environments and BLUP values, and the QTL explained 12.8%–18.5% of the phenotypic variation. We mapped the resulting QTL QTSPN.sicau-2D.4, similar to QTSS.sicau-2D.2, and observed that QTSPN.sicau-2D.4 explained 21.76%–38.49% of the phenotypic variation in five environments. Ma et al. (2019) constructed a RIL population from 20828 and CN16, and detected QSns.sau-2D in six environments and BLUP values, explaining 10.16%–45.68% of the phenotypic variation. In addition, these authors detected QTSPN.sicau-2D.5 in seven environments and BLUP values, similar to QSns.sau-2D, which explained 20.59%–44.83% of the phenotypic variation. In previous studies, only one similar QTL on chromosome 2D was mapped in each population. In the present study, we detected two similar QTLs in one RIL population, suggesting that two QTLs in this region control spikelet number, providing an opportunity to investigate the regulation and interaction of these two QTLs. These results contribute to elucidating the regulatory mechanism of spikelet number in wheat.
Allele aggregation is an effective method to enhance phenotypic traits in wheat breeding (Tu et al., 2021). Previous studies compared the relationship between QTLs mapped for different traits (Li et al., 2021), and some compared the relationship between QTLs on different chromosomes obtained by mapping the same trait (Shao et al., 2018). In the present study, we investigated the relationship between QTSPN.sicau-2D.4 and QTSPN.sicau-2D.5 and observed that the two QTLs had simultaneous effects in only one environment among the ten environments. We speculated that QTSPN.sicau-2D.4 and QTSPN.sicau-2D.5 can only be co-expressed in specific environments. In a previous study (Deng et al., 2019), the TSPN of the parents SHW-L1 and Chuanmai 32 was 19.6–21.6 and 19.6–25. In some environments, the differences in TSPN between the parents were small or non-significant. The reason may be that the effect of QTSS.sicau-2D.2 is only detected in a specific environment, and the additive effect is small. The present study showed that a tightly linked marker for QTSPN.sicau-2D.4 could be used successfully to genotype the 10-A/BE89 and the 10-A/CN16 population, but not significant. This result may be because the environment in which these two populations were grown did not meet the conditions necessary to express QTSPN.sicau-2D.4. The present results showed the effect on wheat spikelet number of genes located in QTSPN.sicau-2D.4 was a lower than that of genes located in QTSPN.sicau-2D.5.
Genotyping with the four closely linked KASP marker pairs of the 10-A/B39 population revealed 16 haplotypes of progeny populations, indicating no co-segregation between the two QTLs. About TSPN, the types were ranked as haplotype 3 > 10-A > haplotype 9 > B39. Thus, we speculated that QTSPN.sicau-2D.4 and QTSPN.sicau-2D.5 both include genes that increase TSPN, but the expression of genes in QTSPN.sicau-2D.4 may affect the expression of genes in QTSPN.sicau-2D.5, and thus the haplotype 3 spikelet number was higher than that of the 10-A type. However, owing to the small number of RILs used, further study of the relationship between the two QTLs will require an increase in the number of RILs or the construction of near-isogenic lines.
Previous studies have used exon capture to identify wheat mutants resistant to yellow rust and leaf rust and to identify an SNP mutation in the Lr21 gene (Harrington et al., 2019). Exome capture has also been used to study the processes of gene introgression and gene improvement in wheat (He et al., 2019). In the current study, to narrow the target QTL interval, bulk-segregant analysis–exon capture sequencing was used to detect six hot spots in QTSPN.sicau-2D.4 and QTSPN.sicau-2D.5. The mutation sites in these six regions were much higher than those in other regions. Therefore, we believed that the probability that the target gene is in these six regions was higher than its location in other regions, so the subsequent experiments considered these six regions as the main target interval to narrow the scope of the target interval. By comparing the physical locations of the detected mutated SNPs, we identified 31 candidate genes. The SNP loci of these genes differed between the parents and offspring, so that these genes will be the focus of a future study. Li et al. (2021) identified target genes by comparing their expression levels in different tissues. Therefore, we analyzed the expression levels of the 31 candidate genes in different tissues at three stages of spike development. TraesCS2D02G080000 and TraesCS2D02G090300 were highly expressed in the spike. TraesCS2D02G092700 was highly expressed in the early and weakly expressed in the final stages of spike development. These results will also help the further development of the future study.
Through exon capture and sequencing, 203 mutant SNP sites were captured in the QTSPN.sicau-2D.4/QFSPN.sicau-2D.4 interval. Of the 203 mutation sites, 148 corresponded to exon sequences of 23 genes, and the remaining mutation sites were located in intronic regions. Compared with the five target genes obtained in previous studies (Deng et al., 2019), one target gene, COBL7, was typical. COBL7 is a homologous gene of TraesCS2D02G092100 and affects pistil development and function (Scutt et al., 2003; Izadi et al., 2021). The homologous genes of TraesCS2D02G077100LC are OsMYB3R-2 and ATU2AF65A. Overexpression of OsMYB3R-2 increases tolerance to low temperature, drought, and salt stress in Arabidopsis (Dai et al., 2007). ATU2AF65A is a splicing factor involved in regulating of ABA-mediated flowering time in Arabidopsis (Park et al., 2017; Cavallari et al., 2018). The homologous gene of TraesCS2D02G081200 is the OsYSL family gene, which is mainly responsible for iron uptake during the early growth of seedlings (Kobayashi et al., 2009). TraesCS2D02G086700 is ubiquitin activating enzyme 2, and its homolog is SAE2, which is involved in plant meiosis (Uanschou et al., 2007). The homologous gene of TraesCS2D02G095800LC is ACD11, a mediator of phytoceramide levels (Simanshu et al., 2014). The TraesCS2D02G093300 homolog is OsRFP, a positive regulatory gene that responds to salt stress by regulating Na+ uptake (Kim et al., 2021). TraesCS2D02G101600LC is a leucine-rich repeat receptor-like kinase involved in specifying of anther cell identity, controlling of early sporogenesis and development, and anther wall formation (Nonomura et al., 2003). These genes may be the candidate genes that control spikelet number and require further screening.
In the QTSPN.sicau-2D.5/QFSPN.sicau-2D.5 interval, 18 SNP sites were captured and aligned to the wheat genome. Thirteen of the 18 SNP sites corresponded to exons of eight genes. The homologous genes of TraesCS2D02G077200 are TRM19, TRM20, and TRM21 in Arabidopsis. Modified nucleosides in the TRM gene in Arabidopsis are essential for protein translation. For example, TRM5 affects the growth of Arabidopsis, is associated with delayed flowering, and affects the abundance of photosynthetic proteins (Guo et al., 2019). TraesCS2D02G077400 and TraesCS2D02G077500 both contain the DUF569 domain of the unknown function. In Arabidopsis, AtDUF569 negatively regulates biotic stress responses and differentially regulates plant growth under nitrogen oxidative stress (Nabi et al., 2020). TraesCS2D02G077900 contains the structure of the heat shock protein DnaJ, identified initially as a heat shock protein in E. coli. It belongs to a highly diverse family of molecular chaperones. It plays an important role in the regulating protein folding, various physiological activities, and plant development and stress response (Cyr and Langer, 1994; Li et al., 2020; Zhang et al., 2021; Jin et al., 2022). TraesCS2D02G079600 is a Ppd-D1 gene that affects plant growth and development and is an important photosensitive gene. The Ppd-D1-derived InDel marker showed that the QSns.sau-2D of total spikelet number per spike was not associated with Ppd-D1 (Ma et al., 2019). TraesCS2D02G080000 is an ascorbate peroxidase involved in the homeostasis of reactive oxygen species, chloroplast protection, carbohydrate metabolism, plant structure, fertility maintenance, and other physiological activities. Its homologous gene in rice is APX2, which is involved in hydrogen peroxide homeostasis, chloroplast protection, plant configuration, and fertility maintenance (Wu et al., 2018). These eight genes will be the focus of future research.
The QTSPN.sicau-2D.5 interval partially overlaps with the physical interval of Ppd-D1 (photoperiod). Ppd-D1 is a photoperiod-sensitive gene closely related to wheat adaptability to the environment and affects plant flowering and higher traits. However, the genetic mechanism of how Ppd-D1 affects the spikelet number in wheat has not been reported. Multiple allelic variant types of the Ppd-D1 gene are currently known (Guo. et al., 2010). Those relatively familiar in Asian wheat germplasm are Ppd-D1a, Ppd-D1b, and Ppd-D1d. Interaction of Ppd-D1 and vernalization genes (Vrn1, Vrn2, and Vrn3) affects the wheat reproductive period (Foulkes et al., 2004; Mokanu and Fayt, 2008; Quraishi et al., 2011). The interaction of Ppd-D1 with dwarfing genes (Rht8, Rht-B1b, and Rht-D1b) affects plant height (Flintham et al., 1997; Reynolds et al., 2012; Cane et al., 2013). Beales et al. (2007) isolated the wheat Ppd-A1, Ppd-B1, and Ppd-D1 genes using a wheat bacterial artificial chromosome library. Sequence analysis revealed that Ppd-D1a contained a 2089 bp deletion upstream of the coding region. This deletion in Ppd-D1b is crucial to the origin of the photoperiod-insensitive allele Ppd-D1a. The deletion not only changes the gene’s expression pattern but also changes the expression of the downstream genes CO1 and FT. The Ppd-D1 gene plays an important role in forming paired spikelets by regulating flower-promoting signals (FT) strength during early reproductive development (Boden et al., 2015). The 5-bp-deletion mutation of Ppd-D1d in exon seven leads to a frameshift of the amino acid reading frame, producing a functional protein but destroying the CCT domain (CCT plays a critical role in the flowering regulation of sunlight length). CCT plays an important role in the day-length regulation of flowering, and the CCT domain is required to respond to light. The allele Ppd-D1d is equivalent to an alternative allele of Ppd-D1a, and the role of Ppd-D1d is to delay heading relative to Ppd-D1a (Nishida et al., 2013).
In this study, the deletion of a large fragment in the promoter region of B39 (Ppd-D1a) meant that the Ppd-D1a mutant was phenotypically insensitive to photoperiod and early flowering regardless of day length. In contrast, the 10-A (Ppd-D1d) accession attains heading later and has a greater number of spikelets, and a statistically significant difference in TSPN between the two variant types was observed. Previous research indicated that the Ppd-D1a and Ppd-D1d mutants have little effect on wheat yield (Eagles et al., 2014) and that Ppd-D1d, as an alternative allele of the Ppd-D1a variant, should have less of a statistical impact on phenotypes. Thus, it is speculated that additional genes are in the positioning interval and that their interaction with the Ppd-D1 gene affects the number of spikelets. Further exploration of whether other genes in the QTL interval affect the number of spikelets in wheat is required.
The original contributions presented in the study are included in the article/Supplementary Material. Further inquiries can be directed to the corresponding author.
XY: Visualization, Writing-original draft. YY: Visualization, Writing-original draft. JinW: Visualization, Writing-original draft. ZL: Investigation, Data curation. JL: Investigation, Data curation. YC: Investigation, Data curation. GC: Methodology. JM: Methodology. ZP: Methodology. YP: Formal analysis, Software. PQ: Methodology. YL: Formal analysis, Software, Resources. QJ: Formal analysis, Software, Resources. JirW: Formal analysis, Software, Resources. YW: Conceptualization. YZ: Writing-review and editing. WL: Conceptualization, Funding acquisition, Project administration, Writing-review and editing, Supervision. All authors contributed to the article and approved the submitted version.
This work is supported by Major Program of National Agricultural Science and Technology of China (NK 20220607), and Sichuan Science and Technology Program (2022ZDZX0014, 2021YFYZ0002), the Applied Basic Research Programs of Science and Technology Department of Sichuan Province (2018JY0020), and the Sichuan Undergraduate Innovation and Entrepreneurship Training Program (S202210626108).
The authors declare that the research was conducted in the absence of any commercial or financial relationships that could be construed as a potential conflict of interest.
All claims expressed in this article are solely those of the authors and do not necessarily represent those of their affiliated organizations, or those of the publisher, the editors and the reviewers. Any product that may be evaluated in this article, or claim that may be made by its manufacturer, is not guaranteed or endorsed by the publisher.
The Supplementary Material for this article can be found online at: https://www.frontiersin.org/articles/10.3389/fpls.2023.1144486/full#supplementary-material
Supplementary Figure 1 | Phenotypic performances, distribution, and correlation coefficients for total spikelet number per spike (TSPN) (A) and fertile spikelet number per spike(FSPN) (B) of parents and 10-A/B39 lines in ten environments and their corresponding best linear unbiased prediction (BLUP) values; *** represents significance at P < 0.001.
Supplementary Figure 2 | Schematic representation of the syntenic relationships between a given marker in wheat genetic and physical maps. 1A to 7D represent the 21 wheat chromosomal genetic maps released in this paper; Phy-1A to Phy-7D represent the 21 wheat chromosomal physical maps.
Beales, J., Turner, A., Griffiths, S., Snape, J. W., Laurie, D. A. (2007). A pseudo-response regulator is misexpressed in the photoperiod insensitive ppd-D1a mutant of wheat (Triticum aestivum l.). Theor. Appl. Genet. 115, 721–733. doi: 10.1007/s00122-007-0603-4
Boden, S. A., Cavanagh, C., Cullis, B. R., Ramm, K., Greenwood, J., Jean, Finnegan, E., et al. (2015). Ppd-1 is a key regulator of inflorescence architecture and paired spikelet development in wheat. Nat. Plants. 1, 1–6. doi: 10.1038/nplants.2014.16
Bonjean, A. P., Angus, W. J. (2001). The world wheat book: A history of wheat breeding (Lavoisier Publishing). doi: 10.1006/anbo.2001.1537
Cane, K., Eagles, H., Laurie, D., Trevaskis, B., Vallance, N., Eastwood, R., et al. (2013). Ppd-B1 and Ppd-D1 and their effects in southern Australian wheat. Crop Pasture Sci. 64, 100–114. doi: 10.1071/CP13086
Cavallari, N., Nibau, C., Fuchs, A., Dadarou, D., Barta, A., Doonan, J. H. (2018). The cyclin-dependent kinase G group defines a thermo-sensitive alternative splicing circuit modulating the expression of arabidopsis ATU 2 AF 65A. Plant J. 94, 1010–1022. doi: 10.1111/tpj.13914
Choulet, F., Alberti, A., Theil, S., Glover, N., Barbe, V., Daron, J., et al. (2014). Structural and functional partitioning of bread wheat chromosome 3B. Science 345, 1249721. doi: 10.1126/science.1249721
Consortium, I. W. G. S., Mayer, K. F., Rogers, J., Doležel, J., Pozniak, C., Eversole, K., et al. (2014). A chromosome-based draft sequence of the hexaploid bread wheat (Triticum aestivum) genome. Science 345, 1251788. doi: 10.1126/science.1251788
Cui, F., Ding, A., Li, J., Zhao, C., Wang, L., Wang, X., et al. (2012). QTL detection of seven spike-related traits and their genetic correlations in wheat using two related RIL populations. Euphytica 186, 177–192. doi: 10.1007/s10681-011-0550-7
Cyr, D. M., Langer, T. (1994). DnaJ-like proteins: molecular chaperones and specific regulators of Hsp70. Trends Biochem. Sci. 19, 176–181. doi: 10.1016/0968-0004(94)90281-X
Dai, X., Xu, Y., Ma, Q., Xu, W., Wang, T., Xue, Y., et al. (2007). Overexpression of an R1R2R3 MYB gene, OsMYB3R-2, increases tolerance to freezing, drought, and salt stress in transgenic arabidopsis. Plant Physiol. 143, 1739–1751. doi: 10.1104/pp.106.094532
Dan, C., Wu, X., Kuo, W., Zhang, J., Liu, W., Yang, X., et al. (2017). Novel and favorable genomic regions for spike related traits in a wheat germplasm pubing 3504 with high grain number per spike under varying environments. J. Integr. agriculture. 16, 2386–2401. doi: 10.1016/S2095-3119(17)61711-8
Debernardi, J. M., Lin, H., Chuck, G., Faris, J. D., Dubcovsky, J. (2017). microRNA172 plays a crucial role in wheat spike morphogenesis and grain threshability. Development 144, 1966–1975. doi: 10.1242/dev.146399
Deng, M., Wu, F., Zhou, W., Li, J., Shi, H., Wang, Z., et al. (2019). Mapping of QTL for total spikelet number per spike on chromosome 2D in wheat using a high-density genetic map. Genet. Mol. Biol. 42, 603–610. doi: 10.1590/1678-4685-gmb-2018-0122
Dobrovolskaya, O., Pont, C., Sibout, R., Martinek, P., Badaeva, E., Murat, F., et al. (2015). FRIZZY PANICLE drives supernumerary spikelets in bread wheat. Plant Physiol. 167, 189–199. doi: 10.1104/pp.114.250043
Eagles, H. A., Cane., K., Trevaskis., B., Vallance., N., Eastwood., R. F., Gororo., N. N., et al. (2014). Ppd1, Vrn1, ALMT1 and Rht genes and their effects on grain yield in lower rainfall environments in southern Australia. Crop Pasture Sci. 65, 159–170. doi: 10.1071/CP13374
Flintham, J., Börner, A., Worland, A., Gale, M. (1997). Optimizing wheat grain yield: effects of rht (gibberellin-insensitive) dwarfing genes. J. Agric. Sci. 128, 11–25. doi: 10.1017/S0021859696003942
Foulkes, M. J., Sylvester-Bradley, R., Worland, A. J., Snape, J. W. (2004). Effects of a photoperiod-response gene ppd-D1 on yield potential and drought resistance in UK winter wheat. Euphytica 135, 63–73. doi: 10.1023/B:EUPH.0000009542.06773.13
Gao, X. Q., Wang, N., Wang, X. L., Zhang, X. S. (2019). Architecture of wheat inflorescence: Insights from rice. Trends Plant Sci. 24, 802–809. doi: 10.1016/j.tplants.2019.06.002
Greenwood, J. R., Finnegan, E. J., Watanabe, N., Trevaskis, B., Swain, S. M. (2017). New alleles of the wheat domestication gene Q reveal multiple roles in growth and reproductive development. Development 144, 1959–1965. doi: 10.1242/dev.146407
Guo, Z., Chen, D., Schnurbusch, T. (2015). Variance components, heritability and correlation analysis of anther and ovary size during the floral development of bread wheat. J. Exp. botany. 66, 3099–3111. doi: 10.1093/jxb/erv117
Guo, Q., Ng, P. Q., Shi, S., Fan, D., Li, J., Zhao, J., et al. (2019). Arabidopsis TRM5 encodes a nuclear-localised bifunctional tRNA guanine and inosine-N1-methyltransferase that is important for growth. PloS One 14, e0225064. doi: 10.1371/journal.pone.0225064
Guo., Z., Song., Y., Zhou., R., Ren., Z., Jia., J. (2010). Discovery, evaluation and distribution of haplotypes of the wheat ppd-D1 gene. New Phytol. Vol. 185 (3), 841–851. doi: 10.1111/j.1469-8137.2009.03099.x
Gupta, P., Mir, R., Mohan, A., Kumar, J. (2008). Wheat genomics: present status and future prospects. Int. J. Plant Genomics. 896451, 1687–5370. doi: 10.1155/2008/896451
Harrington, S. A., Cobo, N., Karafiátová, M., Doležel, J., Borrill, P., Uauy, C. (2019). Identification of a dominant chlorosis phenotype through a forward screen of the triticum turgidum cv. Kronos TILLING population. Front. Plant science. 10, 963. doi: 10.3389/fpls.2019.00963
He, F., Pasam, R., Shi., F., Kant, S., Keeble-Gagnere, G., Kay, P., et al. (2019). Exome sequencing highlights the role of wild-relative introgression in shaping the adaptive landscape of the wheat genome. Nat. Genet. 51, 896–904. doi: s41588-019-0382-2
Huang, H., Ye, Y., Song, W., Li, Q., Han, R., Wu, C., et al. (2022). Modulating the c-terminus of DEP1 synergistically enhances grain quality and yield in rice. J. Genet. Genomics 49, 506–509. doi: 10.1016/j.jgg.2022.01.009
Izadi, M., Seemann, E., Schlobinski, D., Schwintzer, L., Qualmann, B., Kessels, M. M. (2021). Functional interdependence of the actin nucleator cobl and cobl-like in dendritic arbor development. Elife 10, e67718. doi: 10.7554/eLife.67718.sa2
Jin, T., Shan, Z., Zhou, S., Yang, Q., Gai, J., Li, Y. (2022). GmDNAJC7 from soybean is involved in plant tolerance to alkaline-salt, salt, and drought stresses. Agronomy 12, 1419. doi: 10.3390/agronomy12061419
Kim, J. H., Lim, S. D., Jang, C. S. (2021). C4HC3-type really interesting new gene (RING), OsRFPv6, is a positive regulator in response to salt stress by regulating na+ absorption. Physiol. Plantarum. 173, 883–895. doi: 10.1111/ppl.13481
Kobayashi, T., Itai, R. N., Ogo, Y., Kakei, Y., Nakanishi, H., Takahashi, M., et al. (2009). The rice transcription factor IDEF1 is essential for the early response to iron deficiency, and induces vegetative expression of late embryogenesis abundant genes. Plant J. 60, 948–961. doi: 10.1111/j.1365-313X.2009.04015.x
Koppolu, R., Schnurbusch, T. (2019). Developmental pathways for shaping spike inflorescence architecture in barley and wheat. J. Integr. Plant Biol. 61, 278–295. doi: 10.1111/jipb.12771
Kuzay, S., Xu, Y., Zhang, J., Katz, A., Pearce, S., Su, Z., et al. (2019). Identification of a candidate gene for a QTL for spikelet number per spike on wheat chromosome arm 7AL by high-resolution genetic mapping. Theor. Appl. Genet. 132, 2689–2705. doi: 10.1007/s00122-019-03382-5
Langer, R. H. M., Hanif, M. (1973). A study of floret development in wheat (Triticum aestivum l.). Ann. Botany. 37, 743–751. doi: 10.1093/oxfordjournals.aob.a084743
Law, C., Sutka, J., Worland, A. (1978). A genetic study of day-length response in wheat. Heredity 41, 185–191. doi: 10.1038/hdy.1978.87
Li, T., Deng, G., Tang, Y., Su, Y., Wang, J., Cheng, J., et al. (2021). Identification and validation of a novel locus controlling spikelet number in bread wheat (Triticum aestivum l.). Front. Plant science. 12, 611106. doi: 10.3389/fpls.2021.611106
Li, W., Nelson, J., Chu, C., Shi, L., Huang, S., Liu, D. (2002). Chromosomal locations and genetic relationships of tiller and spike characters in wheat. Euphytica 125, 357–366. doi: 10.1023/A:1016069809977
Li, G., Zhao, H., Guo, H., Wang, Y., Guo, X. (2020). Analyses of the function of DnaJ family proteins reveal an underlying regulatory mechanism of heat tolerance in honeybee. Sci. Total Environment. 716, 137036. doi: 10.1016/j.scitotenv.2020.137036
Liu, G., Jia, L., Lu, L., Qin, D., Zhang, J., Guan, P., et al. (2014). Mapping QTLs of yield-related traits using RIL population derived from common wheat and Tibetan semi-wild wheat. Theor. Appl. Genet. 127, 2415–2432. doi: 10.1007/s00122-014-2387-7
Ma, J., Ding, P., Liu, J., Li, T., Zou, Y., Habib, A., et al. (2019). Identification and validation of a major and stably expressed QTL for spikelet number per spike in bread wheat. Theor. Appl. Genet. 132, 3155–3167. doi: 10.1007/s00122-019-03415-z
Ma, Z., Zhao, D., Zhang, C., Zhang, Z., Xue, S., Lin, F., et al. (2007). Molecular genetic analysis of five spike-related traits in wheat using RIL and immortalized F2 populations. Mol. Genet. Genomics 277, 31–42. doi: 10.1007/s00438-006-0166-0
Mokanu, N. V., Fayt, V. I. (2008). Differences in the effects of alleles of the genes Vrd1 and Ppd-D1 with respect to winter hardiness, frost tolerance and yield in winter wheat. Cytol. Genet. 42, 384–390. doi: 10.3103/S0095452708060054
Nabi, R., Tayade, R., Imran, Q., Hussain, A., Shahid, M., Yun, B. (2020). Functional insight of nitric-oxide induced DUF genes in arabidopsis thaliana. Front. Plant Sci. 11. doi: 10.3389/fpls.2020.01041
Nishida, H., Yoshida, T., Kawakami, K., Fujita, M., Long, B., Akashi, Y., et al. (2013). Structural variation in the 5′ upstream region of photoperiod-insensitive alleles ppd-A1a and Ppd-B1a identified in hexaploid wheat (Triticum aestivum l.), and their effect on heading time. Mol. breeding. 31, 27–37. doi: 10.1007/s11032-012-9765-0
Nonomura, K.-I., Miyoshi, K., Eiguchi, M., Suzuki, T., Miyao, A., Hirochika, H., et al. (2003). The MSP1 gene is necessary to restrict the number of cells entering into male and female sporogenesis and to initiate anther wall formation in rice. Plant Cell. 15, 1728–1739. doi: 10.1105/tpc.012401
Park, H.-Y., Lee, K. C., Jang, Y. H., Kim, S.-K., Thu, M. P., Lee, J. H., et al. (2017). The arabidopsis splicing factors, AtU2AF65, AtU2AF35, and AtSF1 shuttle between nuclei and cytoplasms. Plant Cell Rep. 36, 1113–1123. doi: 10.1007/s00299-017-2142-z
Quarrie, S., Pekic Quarrie, S., Radosevic, R., Rancic, D., Kaminska, A., Barnes, J., et al. (2006). Dissecting a wheat QTL for yield present in a range of environments: from the QTL to candidate genes. J. Exp. botany. 57, 2627–2637. doi: 10.1093/jxb/erl026
Quraishi, U. M., Abrouk, M., Murat, F., Pont, C., Foucrier, S., Desmaizieres, G., et al. (2011). Cross-genome map based dissection of a nitrogen use efficiency ortho-metaQTL in bread wheat unravels concerted cereal genome evolution. Plant J. 65, 745–756. doi: 10.1111/j.1365-313X.2010.04461.x
Reynolds, M., Foulkes, J., Furbank, R., Griffiths, S., King, J., Murchie, E., et al. (2012). Achieving yield gains in wheat, plant. Cell environment. 35, 1799–1823. doi: 10.1111/j.1365-3040.2012.02588.x
Saini, D. K., Srivastava, P., Pal, N., Gupta, P. (2022). Meta-QTLs, ortho-meta-QTLs and candidate genes for grain yield and associated traits in wheat (Triticum aestivum l.). Theor. Appl. Genet. 135, 1049–1081. doi: 10.1007/s00122-021-04018-3
Sakuma, S., Golan, G., Guo, Z., Ogawa, T., Tagiri, A., Sugimoto, K., et al. (2019). Unleashing floret fertility in wheat through the mutation of a homeobox gene. Proc. Natl. Acad. Sci. U S A. 116, 5182–5187. doi: 10.1073/pnas.1815465116
Scarth, R., Law, C. (1983). The location of the photoperiod gene, Ppd2 and an additional genetic factor for ear-emergence time on chromosome 2B of wheat. Heredity 51, 607–619. doi: 10.1038/hdy.1983.73
Scutt, C. P., Vinauger-Douard, M., Fourquin, C., Ailhas, J., Kuno, N., Uchida, K., et al. (2003). The identification of candidate genes for a reverse genetic analysis of development and function in the arabidopsis gynoecium. Plant Physiol. 132, 653–665. doi: 10.1104/pp.102.017798
Shao, M., Bai, G., Rife, T. W., Poland, J., Lin, M., Liu, S., et al. (2018). QTL mapping of pre-harvest sprouting resistance in a white wheat cultivar danby. Theor. Appl. Genet. 131, 1683–1697. doi: 10.1007/s00122-018-3107-5
Simanshu, D. K., Zhai, X., Munch, D., Hofius, D., Markham, J. E., Bielawski, J., et al. (2014). Arabidopsis accelerated cell death 11, ACD11, is a ceramide-1-phosphate transfer protein and intermediary regulator of phytoceramide levels. Cell Rep. 6, 388–399. doi: 10.1016/j.celrep.2013.12.023
Simons, K. J., Fellers, J. P., Trick, H. N., Zhang, Z., Tai, Y.-S., Gill, B. S., et al. (2006). Molecular characterization of the major wheat domestication gene Q. Genetics 172, 547–555. doi: 10.1534/genetics.105.044727
Sourdille, P., Cadalen, T., Guyomarc'h, H., Snape, J., Perretant, M., Charmet, G., et al. (2003). An update of the courtot× Chinese spring intervarietal molecular marker linkage map for the QTL detection of agronomic traits in wheat. Theor. Appl. Genet. 106, 530–538. doi: 10.1007/s00122-002-1044-8
Tu, Y., Liu, H., Liu, J., Tang, H., Mu, Y., Deng, M., et al. (2021). QTL mapping and validation of bread wheat flag leaf morphology across multiple environments in different genetic backgrounds. Theor. Appl. Genet. 134, 261–278. doi: 10.1007/s00122-020-03695-w
Uanschou, C., Siwiec, T., Pedrosa-Harand, A., Kerzendorfer, C., Sanchez-Moran, E., Novatchkova, M., et al. (2007). A novel plant gene essential for meiosis is related to the human CtIP and the yeast COM1/SAE2 gene. EMBO J. 26, 5061–5070. doi: 10.1038/sj.emboj.7601913
Vavilova, V. Y., Konopatskaia, I., Blinov, A., Goncharov, N. (2019). Goncharov, interspecific polymorphism of DEP1 genes and the spike shape in wheats. Russian J. Genet. 55, 908–913. doi: 10.1134/S1022795419070147
Wu, B., Li, L., Qiu, T., Zhang, X., Cui, S. (2018). Cytosolic APX2 is a pleiotropic protein involved in H2O2 homeostasis, chloroplast protection, plant architecture and fertility maintenance. Plant Cell Rep. 37, 833–848. doi: 10.1007/s00299-018-2272-y
Zhai, H., Feng, Z., Li, J., Liu, X., Xiao, S., Ni, Z., et al. (2016). QTL analysis of spike morphological traits and plant height in winter wheat (Triticum aestivum l.) using a high-density SNP and SSR-based linkage map. Front. Plant science. 7, 1617. doi: 10.3389/fpls.2016.01617
Zhang, J., Bai, Z., Ouyang, M., Xu, X., Xiong, H., Wang, Q., et al. (2021). The DnaJ proteins DJA6 and DJA5 are essential for chloroplast iron–sulfur cluster biogenesis. EMBO J. 40, e106742. doi: 10.15252/embj.2020106742
Zhang, Z., Belcram, H., Gornicki, P., Charles, M., Just, J., Huneau, C., et al. (2011). Duplication and partitioning in evolution and function of homoeologous Q loci governing domestication characters in polyploid wheat. Proc. Natl. Acad. Sci. U S A. 108, 18737–18742. doi: 10.1073/pnas.1110552108
Zhang, J., Gizaw, S. A., Bossolini, E., Hegarty, J., Howell, T., Carter, A. H., et al. (2018). Identification and validation of QTL for grain yield and plant water status under contrasting water treatments in fall-sown spring wheats. Theor. Appl. Genet. 131, 1741–1759. doi: 10.1007/s00122-018-3111-9
Zhang, X., Jia, H., Li, T., Wu, J., Nagarajan, R., Lei, L., et al. (2022). TaCol-B5 modifies spike architecture and enhances grain yield in wheat. Science 376, 180–183. doi: 10.1126/science.abm0717
Keywords: genetic linkage map, multiple spikelets, QTL mapping, exon capture trapping, genetic localization
Citation: Yi X, Ye Y, Wang J, Li Z, Li J, Chen Y, Chen G, Ma J, Pu Z, Peng Y, Qi P, Liu Y, Jiang Q, Wang J, Wei Y, Zheng Y and Li W (2023) Identification and validation of two major QTLs for spikelet number per spike in wheat (Triticum aestivum L.). Front. Plant Sci. 14:1144486. doi: 10.3389/fpls.2023.1144486
Received: 14 January 2023; Accepted: 23 March 2023;
Published: 10 May 2023.
Edited by:
Kun Lu, Southwest University, ChinaReviewed by:
Xiaojun Nie, Northwest A&F University, ChinaCopyright © 2023 Yi, Ye, Wang, Li, Li, Chen, Chen, Ma, Pu, Peng, Qi, Liu, Jiang, Wang, Wei, Zheng and Li. This is an open-access article distributed under the terms of the Creative Commons Attribution License (CC BY). The use, distribution or reproduction in other forums is permitted, provided the original author(s) and the copyright owner(s) are credited and that the original publication in this journal is cited, in accordance with accepted academic practice. No use, distribution or reproduction is permitted which does not comply with these terms.
*Correspondence: Wei Li, bGl3MDNAMTYzLmNvbQ==
†These authors have contributed equally to this work
Disclaimer: All claims expressed in this article are solely those of the authors and do not necessarily represent those of their affiliated organizations, or those of the publisher, the editors and the reviewers. Any product that may be evaluated in this article or claim that may be made by its manufacturer is not guaranteed or endorsed by the publisher.
Research integrity at Frontiers
Learn more about the work of our research integrity team to safeguard the quality of each article we publish.