 Guangyi Chen1†
 Ligong Peng2†Jing Gong1Jin Wang1Chaoyue Wu1Xiaodong Sui1Yunfeng Tian3Mingming Hu1Congmei Li1Xingmei He1Hong Yang1Qiuqiu Zhang1Yuyuan Ouyang4Yan Lan5*Tian Li1*
- 1College of Agronomy, Sichuan Agricultural University, Chengdu, China
- 2College of Agronomy, South China Agricultural University, Guangzhou, China
- 3Rice Research Institute, Sichuan Agricultural University, Chengdu, China
- 4Crop Research Institute, Sichuan Academy of Agricultural Sciences, Chengdu, China
- 5College of Life Science and Engineering, Southwest University of Science and Technology, Mianyang, China
Rice is a water intensive crop and soil water conditions affect rice yield and quality. However, there is limited research on the starch synthesis and accumulation of rice under different soil water conditions at different growth stages. Thus, a pot experiment was conducted to explore the effects of IR72 (indica) and Nanjing (NJ) 9108 (japonica) rice cultivars under flood-irrigated treatment (CK, 0 kPa), light water stress treatment (L, -20 ± 5 kPa), moderate water stress treatment (M, -40 ± 5 kPa) and severe water stress treatment (S, -60 ± 5 kPa) on the starch synthesis and accumulation and rice yield at booting stage (T1), flowering stage (T2) and filling stage (T3), respectively. Under LT treatment, the total soluble sugar and sucrose contents of both cultivars decreased while the amylose and total starch contents increased. Starch synthesis-related enzyme activities and their peak activities at mid-late growth stage increased as well. However, applying MT and ST treatments produced the opposite effects. The 1000-grain weight of both cultivars increased under LT treatment while the seed setting rate increased only under LT3 treatment. Compared with CK, water stress at booting stage decreased grain yield. The principal component analysis (PCA) showed that LT3 got the highest comprehensive score while ST1 got lowest for both cultivars. Furthermore, the comprehensive score of both cultivars under the same water stress treatment followed the trend of T3 > T2 > T1, and NJ 9108 had a better drought-resistant ability than IR72. Compared with CK, the grain yield under LT3 increased by 11.59% for IR72 and 16.01% for NJ 9108, respectively. Overall, these results suggested that light water stress at filling stage could be an effective method to enhance starch synthesis-related enzyme activities, promote starch synthesis and accumulation and increase grain yield.
1 Introduction
Rice (Oryza sativa L.) is one of the main food crops consumed worldwide and provides about 35% of the dietary calorie intake for more than 3 billion people (Fageria, 2011). Rice is also the largest consumer of water and water management will have important impacts on its yield and quality (Bam et al., 2007). China is the main producer of rice with planting area and production accounting for 23% and 30% of the world total, respectively (Wei et al., 2020). At present, traditional continuous flooding irrigation is the major rice production system which consuming nearly 70% of the irrigated fresh water resources in China (Yao et al., 2014; Wang, 2021). However, China is one of the 13 countries with water shortage which has only 8% of the world’s available fresh water resources (Zhou, 2013). Water deficit is a serious environmental stress and the major constraint to rice production (Rehmani et al., 2014). Losses in rice yield due to water shortage probably exceed losses from all other causes combined and the extent of the yield loss depends on both the severity and duration of the water stress (Wu et al., 2014). In recent years, the water deficit problems are likely to worsen in the future with predicted climate change scenarios (Passioura, 2007; Cao et al., 2017). Due to the high temperature, the uneven spatial and temporal distribution of rainfall during rice large water requirement period (July and August) (Wang et al., 2013; Wang et al., 2015b), water stress has become the major challenge limiting rice production in Sichuan (Pandey and Shukla, 2015). Therefore, how to improve water use efficiency and optimize rice water management without decreasing rice yield and quality have always been hot research topics and are also of great significance to food security and social stability (Liu et al., 2014a).
Rice quality is mainly determined by starch which accounts for 80% of the total mass of rice grains. Sucrose is the initial substance and starch is the final product during rice grain carbohydrate metabolism. As starch in rice endosperm contributes 90% of the final dry weight of an unpolished grain, the rice grain filling is actually a process of sucrose conversion and starch accumulation which may have direct impact on rice yield and quality (Li et al., 2018). It has been reported that there are over 30 enzymes involved in starch synthesis. Among them, five enzymes are considered to play key roles in this process, which are adenosine diphosphate-glucose pyrophosphorylase (AGPase), granule bound starch synthetase (GBSS), soluble starch synthase (SSS), starch branching enzyme (SBE) and starch debranching enzyme (DBE) (Chen et al., 2021). The activities of these five enzymes are closely related to total starch, amylose and amylopectin accumulation in rice endosperm. Studies have shown that appropriate water stress (re-watered when soil water potential reached at -15 kPa) could enhance the activities of the key enzymes involved in the conversion from sucrose to starch and promote the translocation and redistribution of reserved carbohydrates in vegetative organs to grain yield (Cai et al., 2008; Xu et al., 2018). A moderate dry-wet alternate irrigation (re-watered when soil water potential reached at -25 kPa) during the grain filling stage increased the activities of AGPase, SBE, sucrose synthase (SuS) and starch synthase (StS) and improve rice quality while the results were reversed for the severe dry-wet alternate irrigation (re-watered when soil water potential reached at -50 kPa) (Yang et al., 2005). Both moderate soil-drying (soil water potential at -10~-30 kPa) and alternate wetting and moderate-drying irrigation (re-watered when soil water potential reached at -25 kPa) could improve rice quality, resulting from the physiological mechanism of enhancing activities of AGPase, SBE, SuS, and StS and decreasing ethylene production in grains (Liu et al., 2008; Liu et al., 2014b).
Although many studies have investigated the effects of water stress on rice water use efficiency, water-requiring property, plant type, stomatal characteristics, leaf photosynthesis and transpiration characteristics, root morphology and physiology, water absorption and transportation, plant hormones and so on. However, conclusions differed due to the different ecological conditions, cultivars, water stress severity and duration (Zhang et al., 2008). There is still limited information on the dynamic changes of starch accumulation and related enzyme activities under different soil water conditions before rice maturity stage. A better understanding of physiological and biochemical changes at different growth stages of rice will be helpful in choosing appropriate water management to achieve high yield and quality. Thus, we conducted a pot experiment to explore the effects of flood-irrigated condition, light water stress condition, moderate water stress condition and severe water stress condition on starch synthesis and accumulation and rice yield at booting stage, flowering stage and filling stage, respectively. The present study was aimed to provide a theoretical basis for high-yield and water-saving cultivation of rice.
2 Materials and methods
2.1 Experimental site and materials
Pot experiments were conducted during the growing seasons of 2018 and 2019 at the research farm of Sichuan Agricultural University, Wenjiang city, Sichuan Province, China (30°43′ N, 103°47′ E). The soil of the plot was clay soil. Prior to the establishment of the pot experiment, soil samples from the topsoil layer (0.20 m) were analyzed. The climate data and analysis results of the top soil layer were shown in Figure 1 and Table 1, respectively. Two rice cultivars with significant differences in total starch content were used as the test materials. NJ 9108 (Jiangsu Academy of Agricultural Sciences, the whole growth period is about 153 days) is a japonica rice cultivar and IR72 (International Rice Research Institute, the whole growth period is about 133 days) is an indica rice cultivar, both with high yield and good quality.
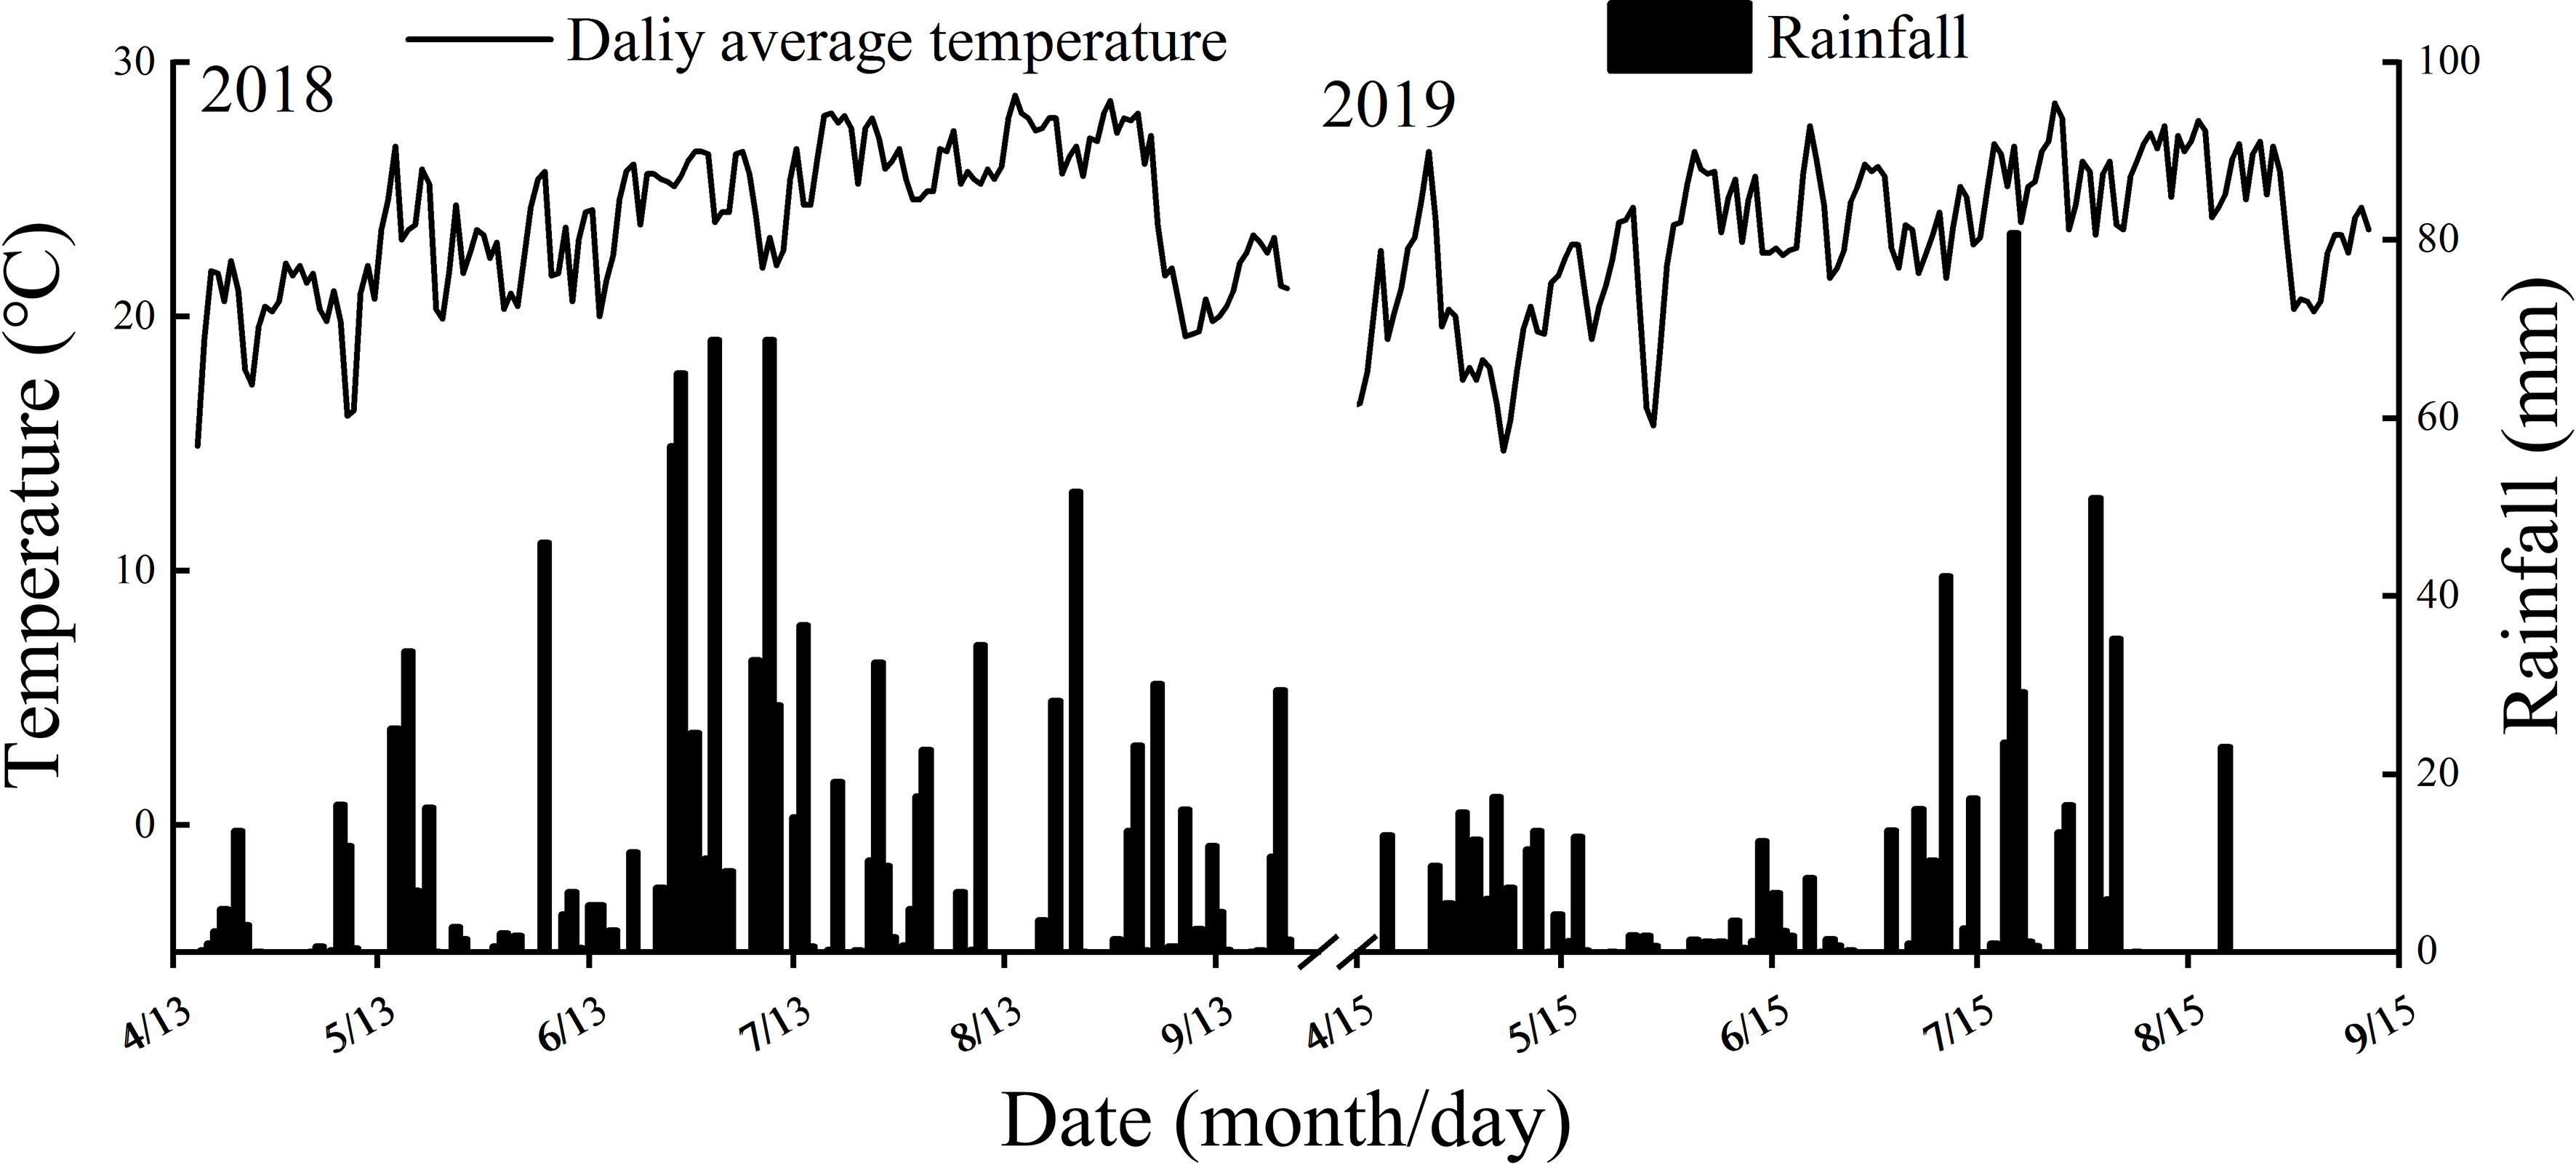
Figure 1 Climate data during the experimental periods.

Table 1 Soil properties of the top soil layer (0.20 m) at the experimental sites.
2.2 Experimental design
A randomized block design with 30 replicates per treatment was employed at booting stage (T1, 30% of rice enter the panicle differentiation stage), flowering stage (T2, 30% of rice begin to flower) and filling stage (T3, 30% of rice enter the milk stage), respectively. Four water treatments were assigned: flood-irrigated treatment (CK, 0 kPa), light water stress treatment (L, -20 ± 5 kPa), moderate water stress treatment (M, -40 ± 5 kPa) and severe water stress treatment (S, -60 ± 5 kPa), respectively. The water treatments were 10 days at each growth stage. And after the water treatments, plants were re-watered to permit recovery. A 2.5-meter-high rain shelter consisting of a steel frame covered with transparent film (the top to the bottom was not closed, and the transparent film was mounted approximately 0.5-0.6 m above the plant canopy to ensure ventilation) was built in each treatment to avoid the effect of rainfall precipitation on the treatments, and was removed after the treatment.
2.3 Field management and plant cultivation
Plastic pots (27 cm in height, 22 cm in bottom inside diameter, and 30 cm in top inner diameter) were filled with 12 kg soil where 2.16 g N, 1.08 g P2O5, and 2.16 g K2O fertilizers as urea, calcium superphosphate, and potassium chloride, respectively, were mixed. Before pot filling, the soil was kept under shade and air-dried, crushed and passed through a 2-mm sieve. N fertilizer was used as basal manure and top dressing at a 3:7 ratio. Basal N, P and K were applied to the soil 1 day (d) before transplanting. Seeds were sown on 17 April 2018 and 14 April 2019, and the seedlings were transplanted on 27 May 2018 and 24 May 2019, respectively. The seedlings were transplanted into each pot with two hills per pot and two seedlings per hill. Every pot was flooded with tap water to maintain 1-3 cm water layer except during the treatment application periods. The pots were regularly hand weeded, and insecticides were applied to control insect pests.
2.4 Water measurements
To record soil water potential, a soil moisture tensiometer (2725 ARL, Soil moisture Equipment Corp., Santa Barbara, CA, USA) with sensors immersed in below 10 cm of soil layer was used. Soil water content in pots was measured by a soil moisture sensors (EM 50, Decagon, Pullman, WA, USA). The soil moisture sensors were set with the tips of sensors at the middle point between plant and pot border, 5 cm below the soil surface. Sensors measured the dielectric constant of bulk soil and then converted these data to the values of volumetric water content. The recording interval time was 30 min, and then raw recorded data were averaged for each day. Average values of soil water potential and soil volumetric water content during the treatment application periods are shown in Figure 2.
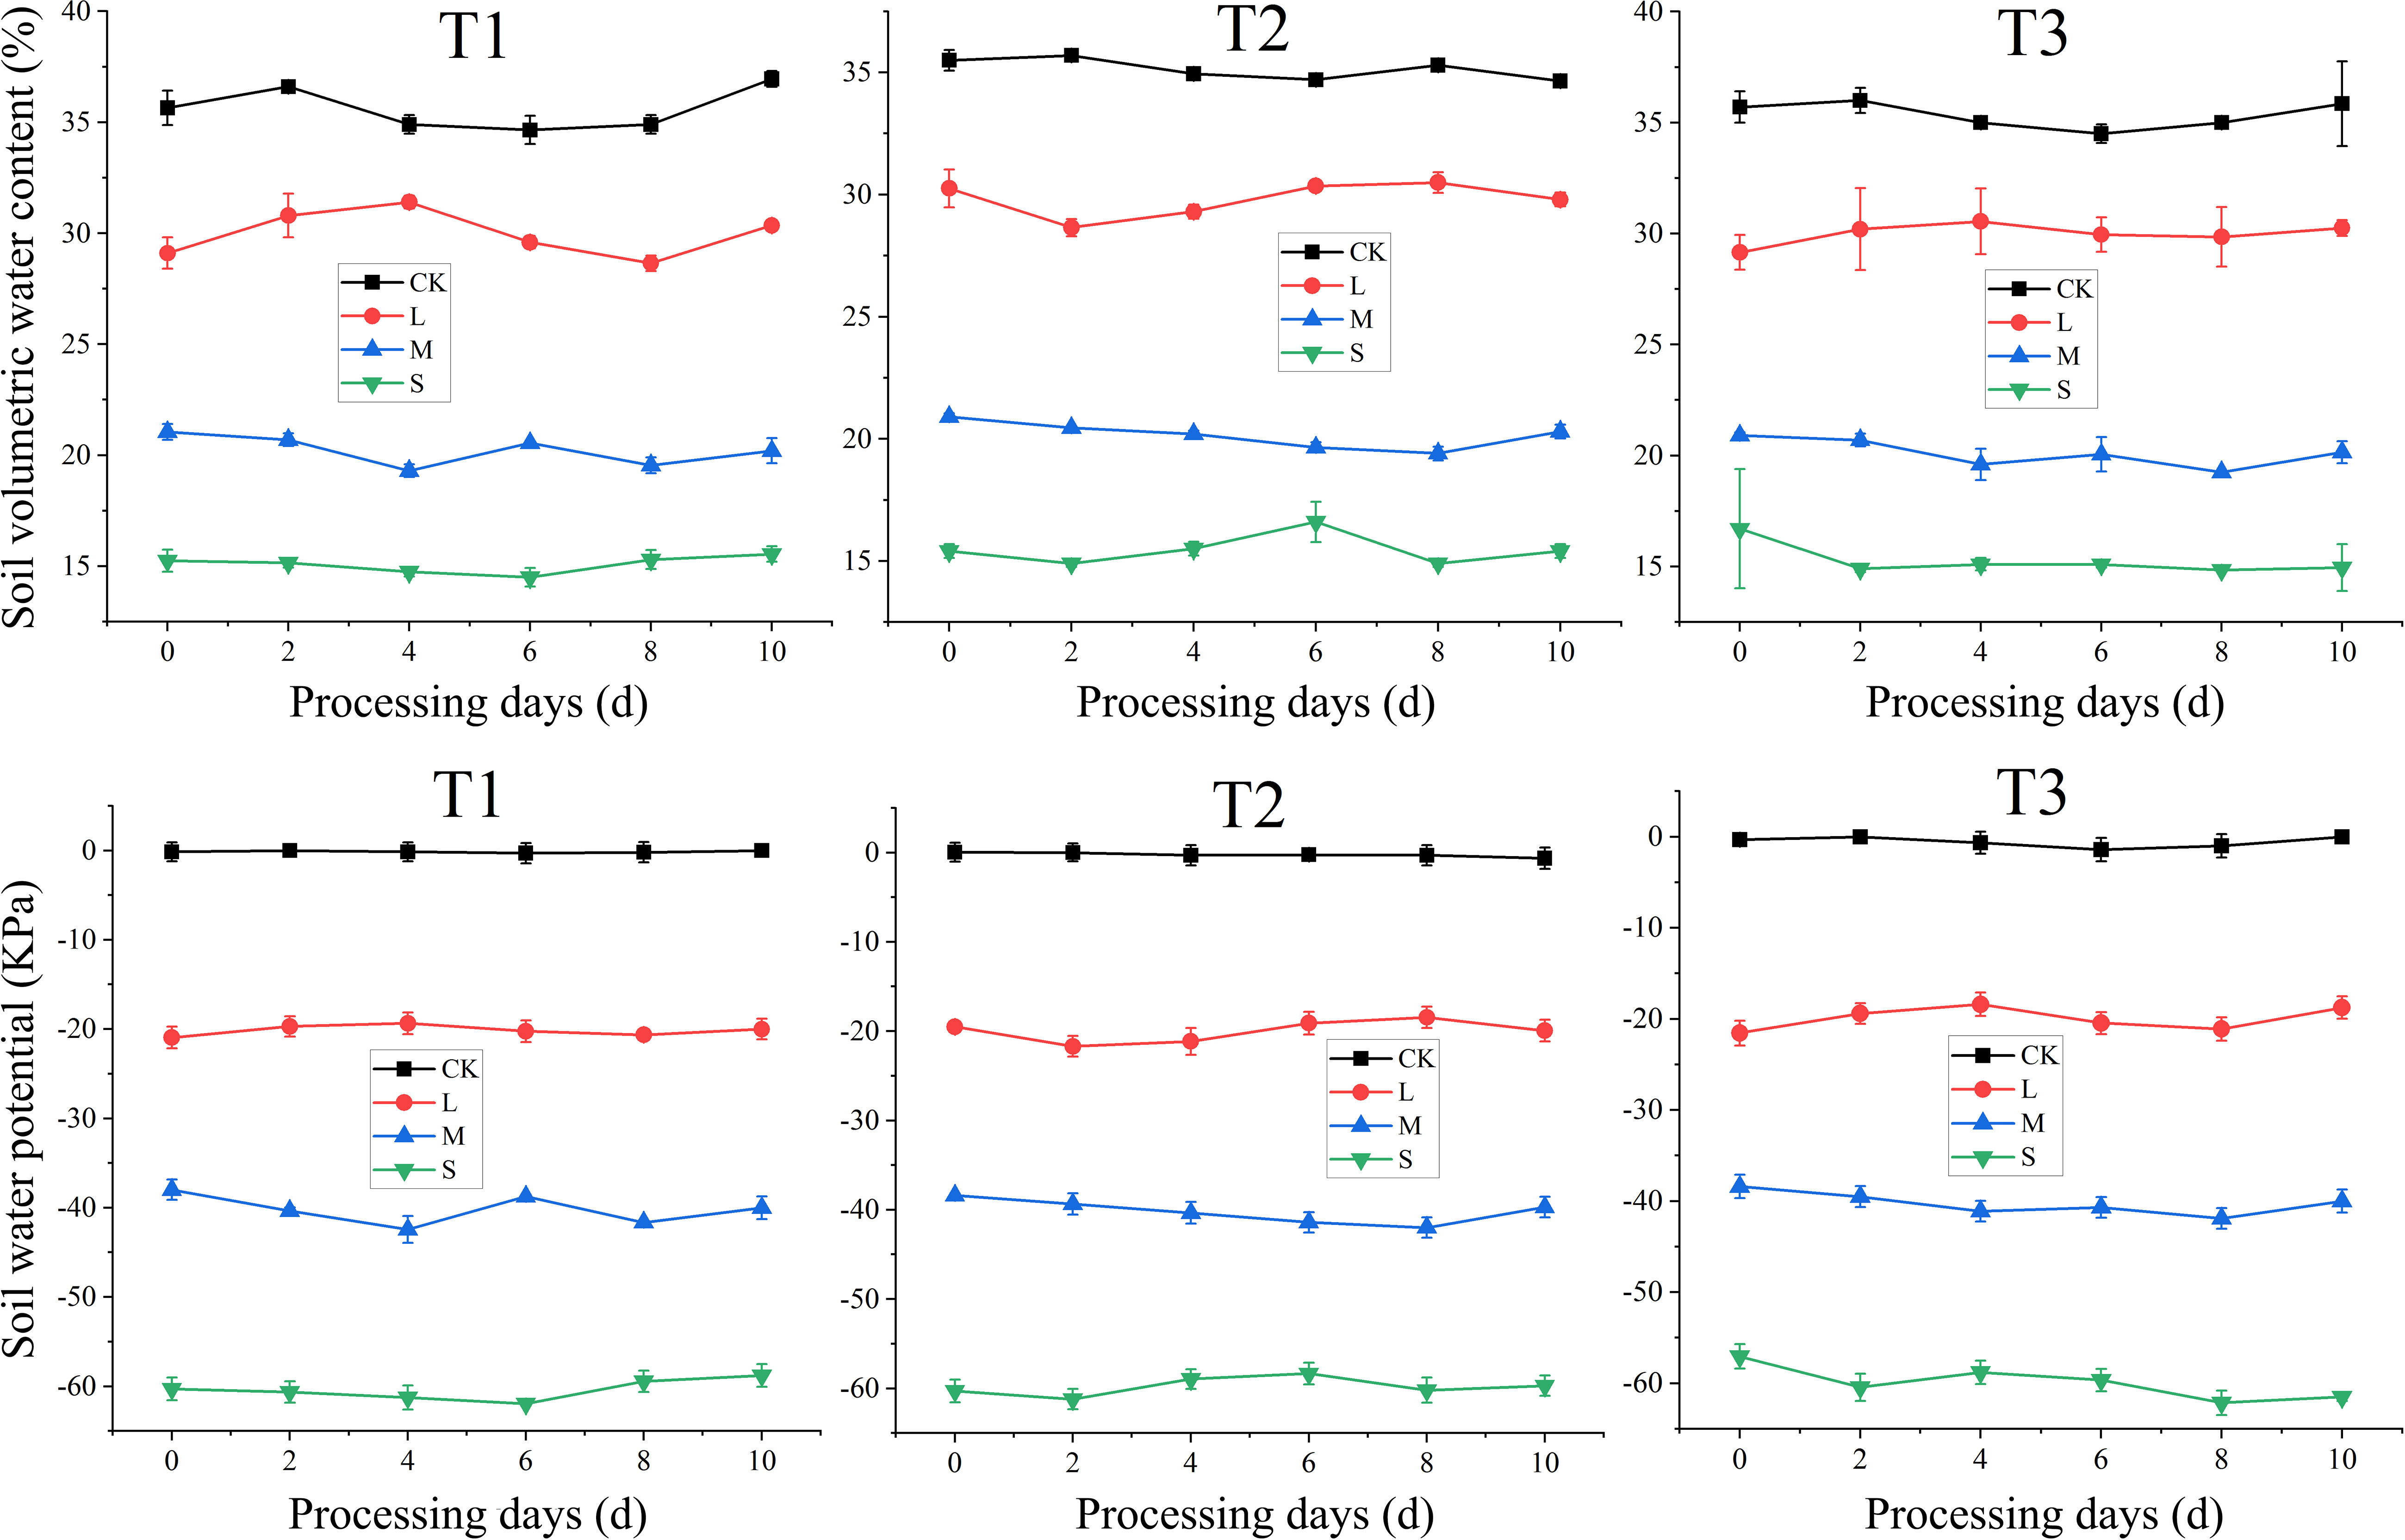
Figure 2 Soil water potential and soil volumetric water content during the treatment application periods. T1, T2, and T3 refer to the different growth stages (booting stage, flowering stage and filling stage, respectively). CK, L, M and S refer to the different water treatments (flood-irrigated treatment, 0 kPa, light water stress treatment, -20 ± 5 kPa, moderate water stress treatment, -40 ± 5 kPa and severe water stress treatment, -60 ± 5 kPa, respectively).
2.5 Experimental conditions and procedures
2.5.1 Preparation for determination
After flowering, approximately 200 panicles were selected on the same day and tagged for each treatment. After full heading, 30 tagged panicles were sampled from each treatment every 6 d at 10:00 a.m. The collected panicles were divided into two groups. Twenty tagged panicles were dried at 80°C, after which the brown rice was crushed and sieved through a 100-mesh screen for measurements of sucrose, total soluble sugar, amylose and total starch contents. Another 10 tagged panicles were placed in liquid nitrogen for 3 min and then stored at -80°C for enzymatic analysis and RNA extraction. At harvest, 6 pots from each treatment were sampled randomly and allowed to dry naturally in the sun to assess grain yield after the material was stored at room temperature for 3 months.
2.5.2 Sucrose, total soluble sugar, amylose and total starch contents
The contents of sucrose, total soluble sugar and total starch (mg g-1 of dry brown rice weight) were measured by the anthrone colorimetric method (Gao, 2006). 0.1 g rice flour sample was extracted by 5.0 mL 80% ethanol at 80°C for 30 min. After repeated extraction and centrifugation (6000 r min-1 for 5 min) for three times, the supernatant (testing solution) was combined and the volume was adjusted to 100 mL. Aliquots (2 mL) of the extract were analyzed for sucrose and total soluble sugar content. The remaining precipitate was used for the determination of total starch content.
The amylose content (mg g-1 of dry brown rice weight) was measured by the iodine reagent method (Chen et al., 2020). 10 mL 0.5 mol L-1 KOH was added to 1.0 g rice flour sample, followed by the addition of 5.0 mL 1.0 mol L-1 HCl and 0.5 mL iodine reagent. After adjustment to 100 mL with distilled water, the absorbance was measured at 620 nm after 20 min by scanning the iodine absorption spectrum from 400 to 900 nm with a spectrophotometer (Ultrospec 6300 pro, Amershan Biosciences, Cambridge, Sweden). The values were converted to amylose content by reference to a standard curve prepared from rice.
2.5.3 Activities of starch synthesis enzymes
The activities of AGPase, GBSS, SSS, SBE and DBE were measured by using ELISA Kits (Shanghai Fankel Industrial Co., Ltd., Shanghai, China). One unit of enzyme activity was defined as the amount that causes one unit absorbance increment per g of fresh weight per min. Based on the double antibody sandwich method, the optical density of samples was measured at 450 nm by using a microplate reader (Multiskan SkyHigh, Thermo Fisher Scientific, Waltham, MA, USA), and then the concentration of enzyme activity in the sample were calculated according to the standard curve.
2.5.4 RNA isolation and RT-qPCR
Total RNA samples were obtained from rice grains at different growth stages (12 days after flowering for IR72 and 18 days after flowering for NJ 9108) using RNA Trizol reagent (Invitrogen, Carlsbad, CA, USA) and reverse-transcribed into cDNA using Revertase Transcription kit (Nanjing Vazyme Medical Technology Co., Ltd., Nanjing, China). The products were quantified using a real-time PCR detection system, following the manufacturer’s instructions (SYBR Green Master Mix, Vazyme). The rice Actin gene was used as an internal control. The PCR primers used were listed in Supplementary Table 1.
2.5.5 Yield and yield components
Rice was harvested at maturity stage and the yield in each treatment was recorded after measuring moisture content and removing impurities. Grain yield was adjusted to a moisture content of 14%. The number of effective tillers per hill was determined before harvest using 6 pots per treatment. A total of 24 selected plants were separated into single tillers according to the marked date and were used to measure productive panicle number per pot, filled grain number per panicle, 1000-grain weight, seed setting rate and grain yield per pot.
2.6 Statistical analysis
An analysis of variance (ANOVA) model was performed to test the effects of the water stress on starch accumulation, starch synthesis-related enzyme activities and rice yield. And principal component analysis (PCA) of 10 indexes including starch synthesis-related enzyme activities, amylose and total starch content, seed setting rate, 1000-grain weight and yield of two cultivars among different water treatments was used to establish a comprehensive evaluation model. For the analysis, year, cultivar, water treatment and sampling time were considered fixed effects, whereas the replicates were considered random effects. The means of each treatment were compared based on the least significant difference (LSD) test at the 0.05 probability level by using SPSS 20.0 (Statistical Product and Service Solutions Inc., Chicago, IL, USA). Origin Pro 2020 (OriginLab, Northampton, MA, USA) was used to draw the figures. The differences of the main indicators are shown in Table 2. Variance analysis showed that the results of key enzyme activities during starch synthesis showed the same trend in both 2018 and 2019. Therefore, we showed the results in 2018 at further results sections.
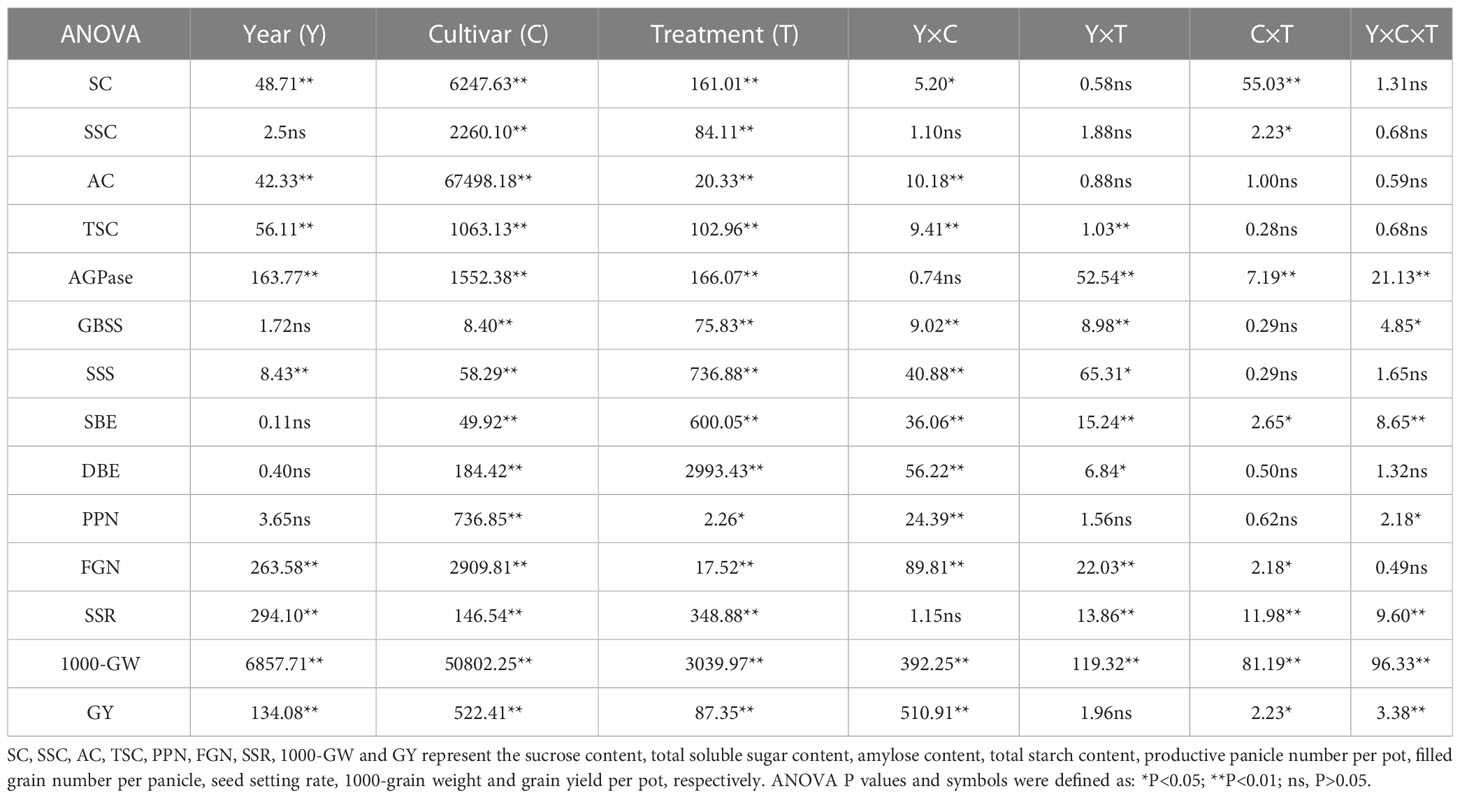
Table 2 Analysis of variance on starch contents, starch synthesis-related enzyme activities and yield of NJ 9108 and IR72.
3 Results
3.1 Starch synthesis and accumulation
3.1.1 Total soluble sugar and sucrose contents
During the grain filling process, the contents of total soluble sugar and sucrose in rice grains of both two cultivars showed a tendency to decrease gradually (Figure 3). As the water stress increased, the contents of total soluble sugar and sucrose of both two cultivars under the same growth stage increased significantly and tended to be in the order of S > M > CK > L (Table 3).
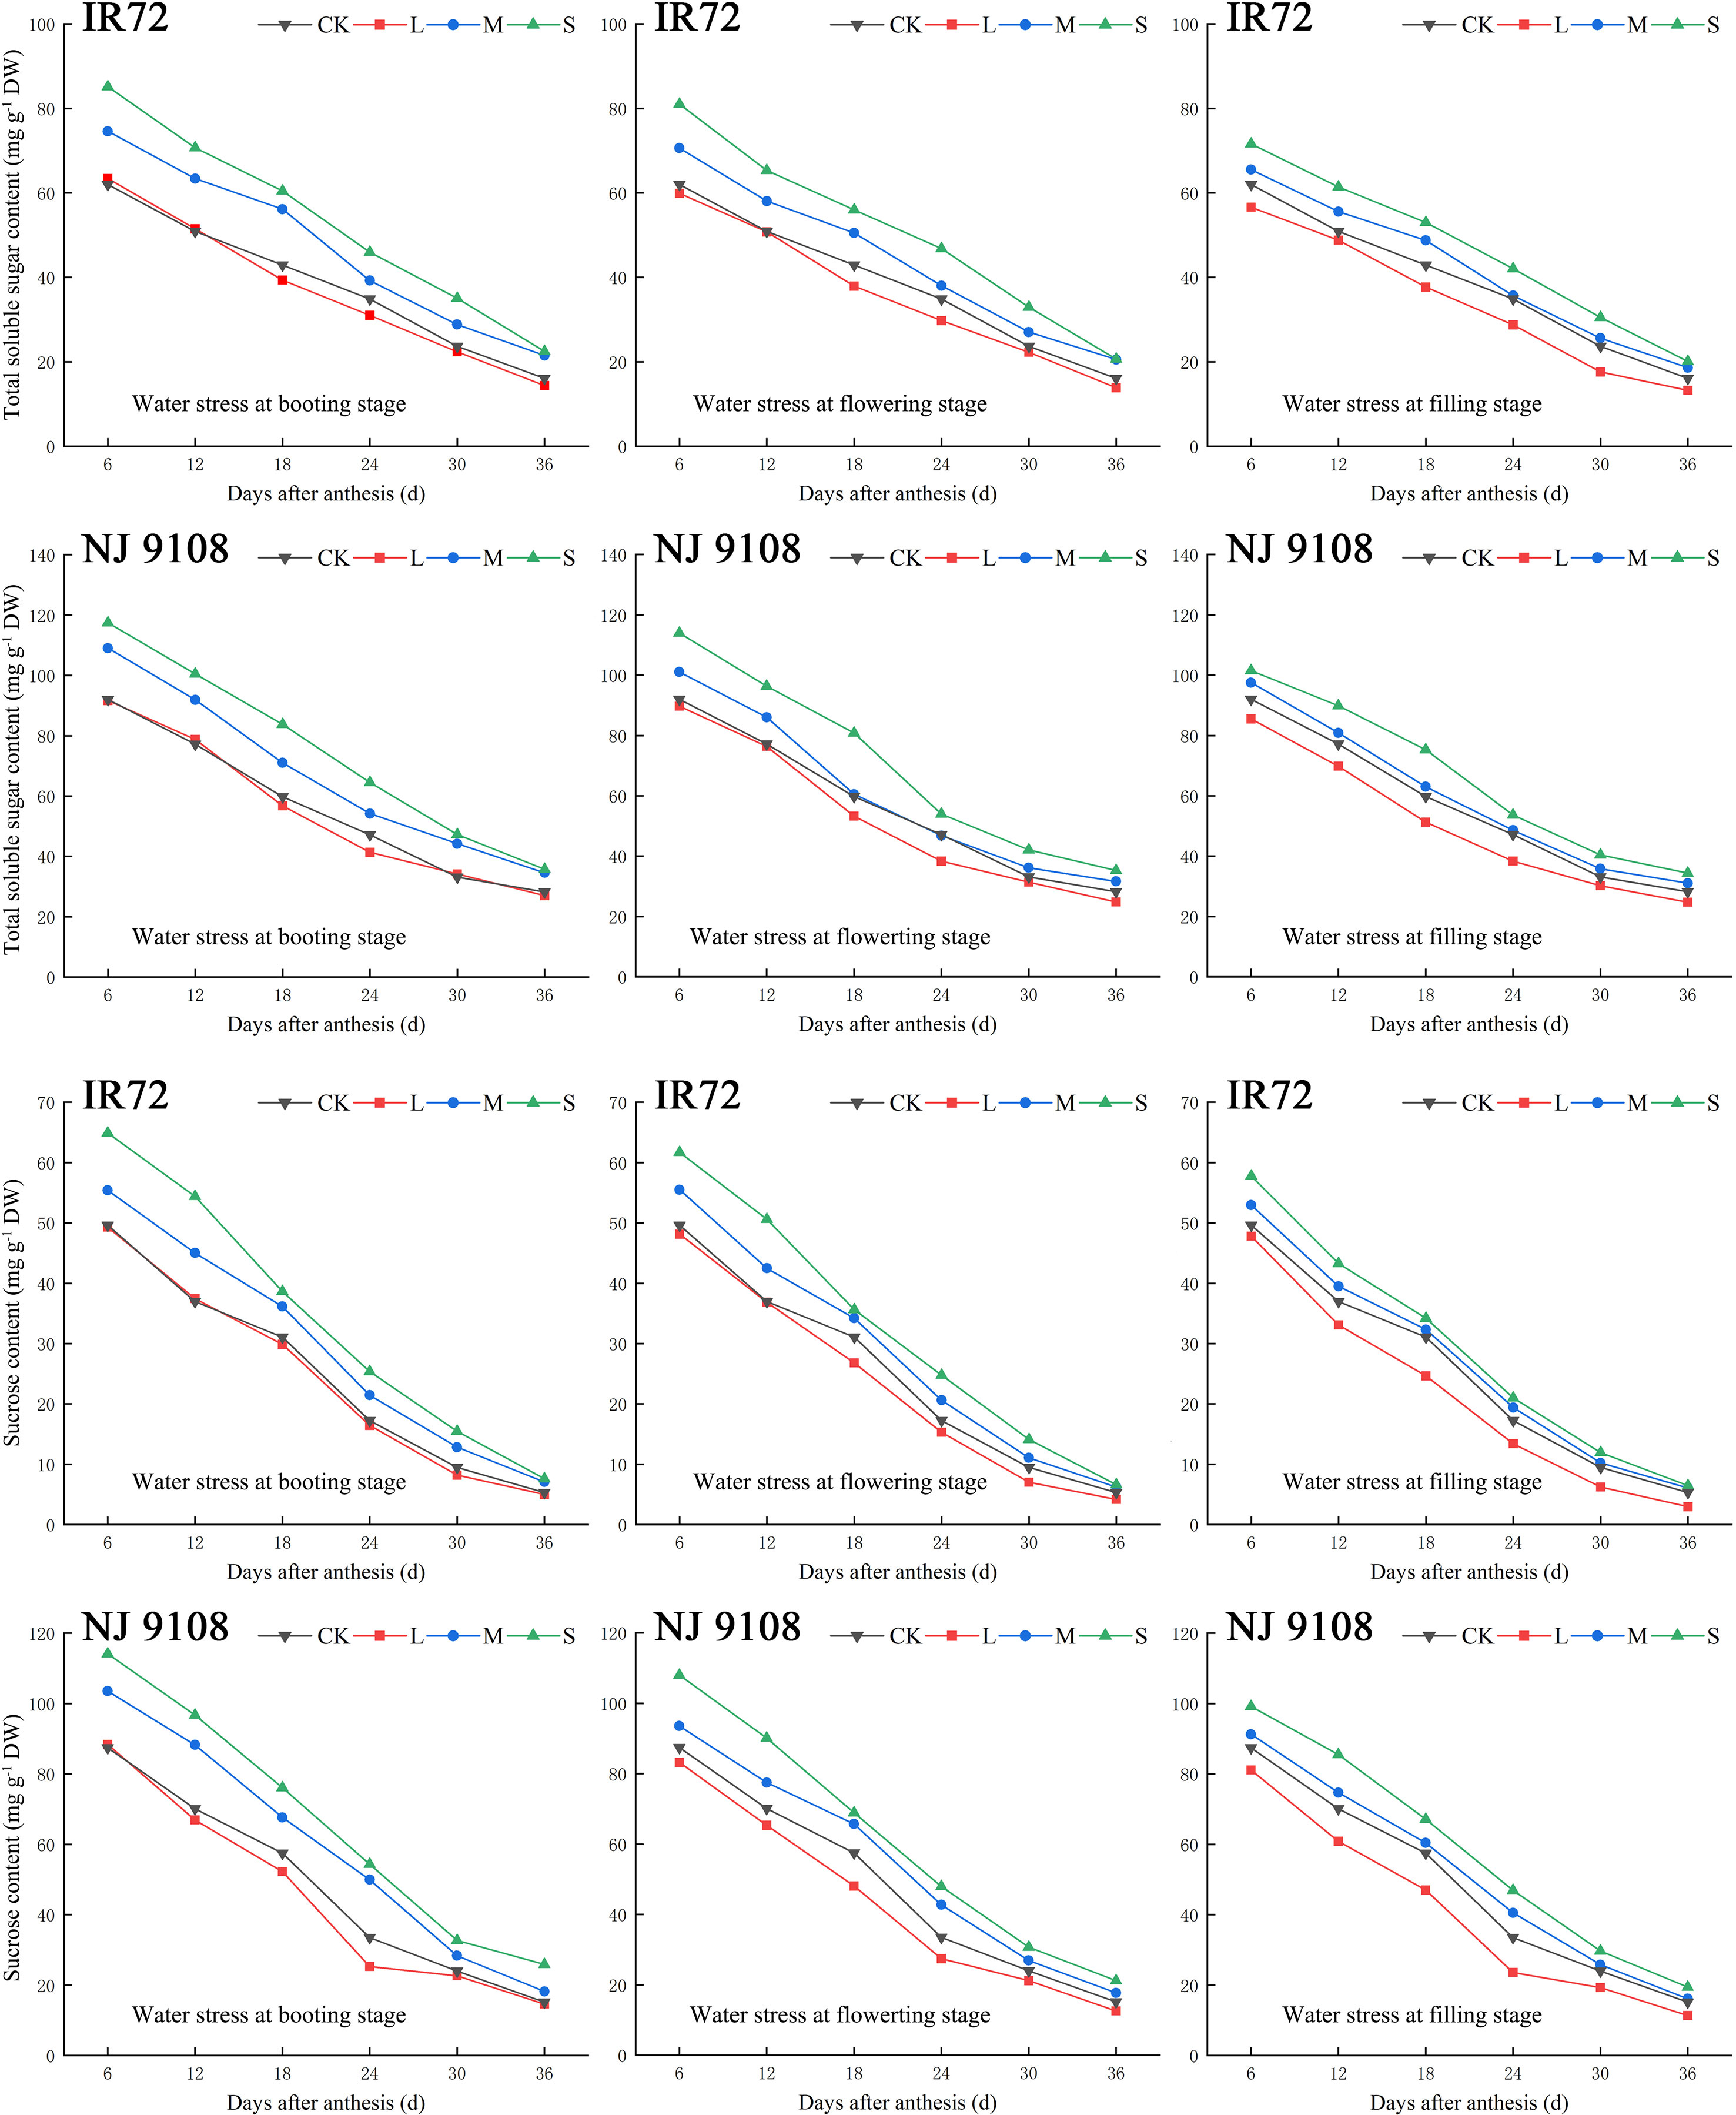
Figure 3 Effects of different water stress treatments on accumulation of total soluble sugar and sucrose in rice grains at different growth stages. T1, T2, and T3 refer to the different growth stages (booting stage, flowering stage and filling stage, respectively). CK, L, M and S refer to the different water treatments (flood-irrigated treatment, 0 kPa, light water stress treatment, -20 ± 5 kPa, moderate water stress treatment, -40 ± 5 kPa and severe water stress treatment, -60 ± 5 kPa, respectively). DW represents dry weight. The data presented are the average of two-year test.
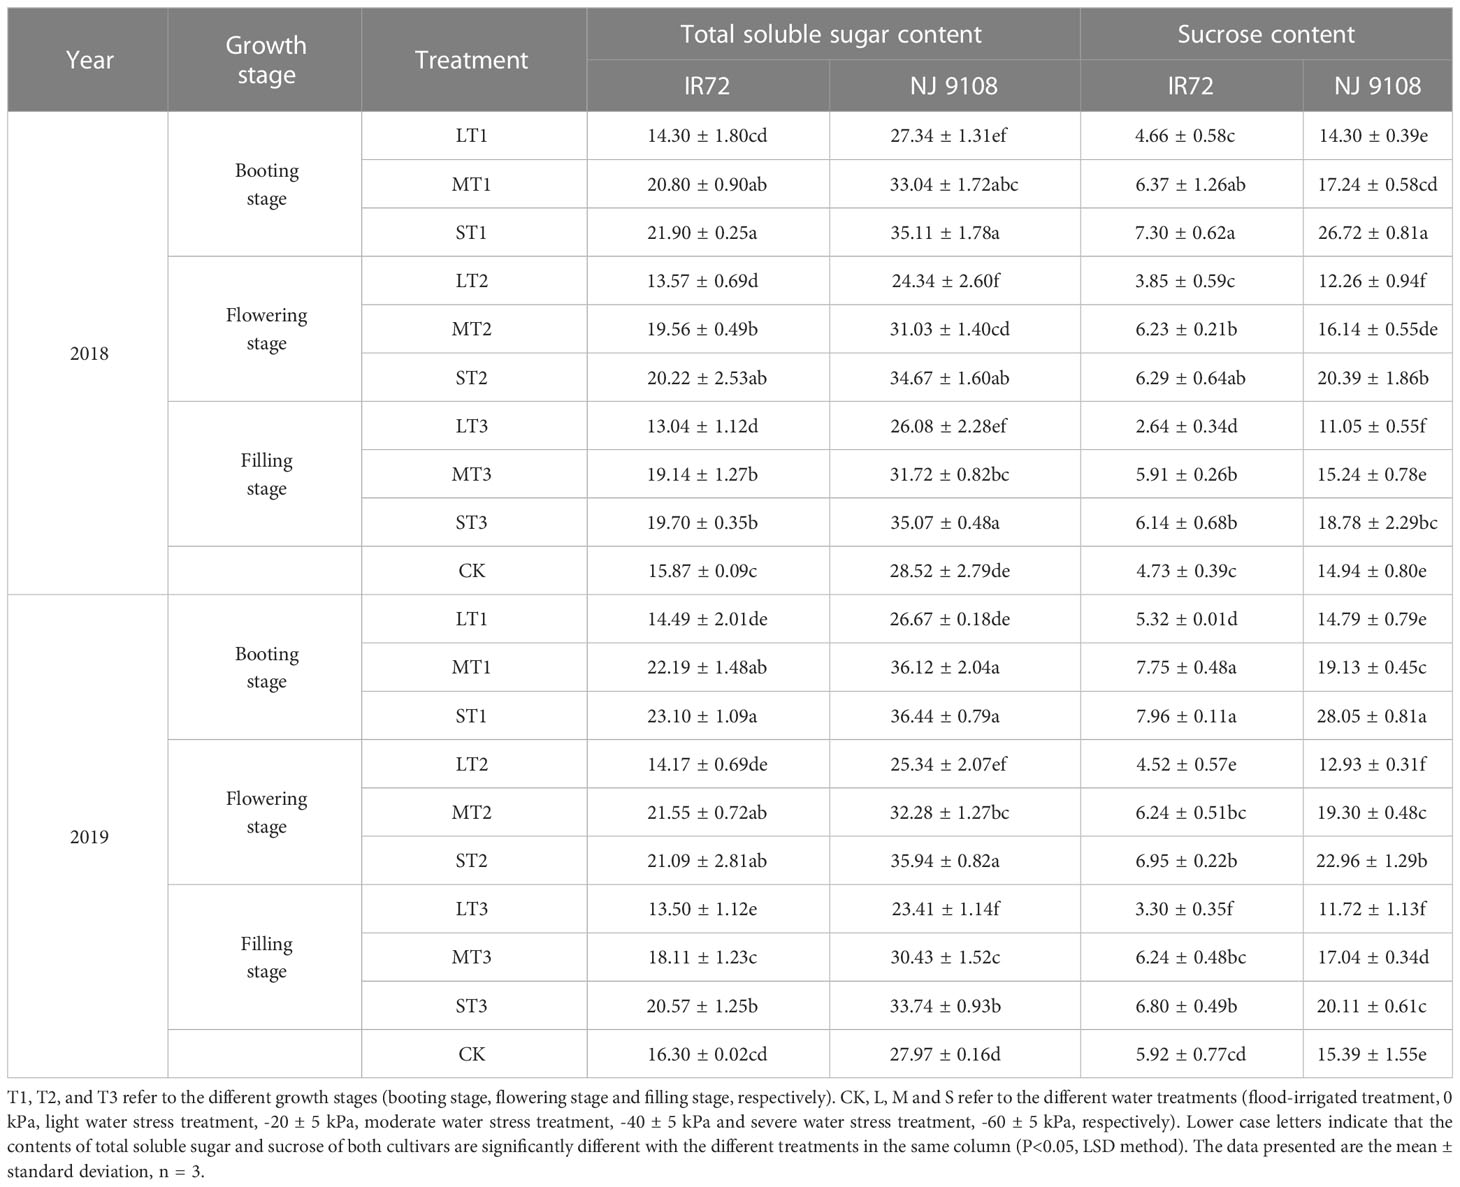
Table 3 Effects of different water stress treatments on total soluble sugar and sucrose contents in rice grains at maturity stage (mg g-1).
The highest total soluble sugar contents of both two cultivars were observed under ST1 while the lowest values were observed under LT3 (IR72) and LT2 (NJ 9108), respectively, in 2018. The two-year test results showed the same trend except that the lowest total soluble sugar content of NJ 9108 was observed under LT3 in 2019. No significant differences were found between LT1, LT2 and LT3. Compared with that under CK, the total soluble sugar content of IR72 decreased by 9.89%, 14.50% and 17.83%, respectively, under LT1, LT2 and LT3, and increased by 38.00%, 27.41% and 24.13%, respectively, under ST1, ST2 and ST3. The total soluble sugar content of NJ 9108 decreased by 4.14%, 14.66% and 8.56%, respectively, under LT1, LT2 and LT3, and increased by 23.11%, 21.56% and 22.97%, respectively, under ST1, ST2 and ST3 when compared with that under CK.
The highest sucrose contents of both two cultivars were observed under ST1 while the lowest values were observed under LT3 in 2018. The two-year test results showed the same trend. Significant difference was found between LT3 and LT1. Compared with that under CK, the sucrose content of IR72 decreased by 1.48%, 18.60% and 44.19%, respectively, under LT1, LT2 and LT3, and increased by 54.33%, 32.98% and 29.81%, respectively, under ST1, ST2 and ST3. The sucrose content of NJ 9108 decreased by 4.28%, 17.94% and 26.04%, respectively, under LT1, LT2 and LT3, and increased by 78.85%, 36.48% and 25.70%, respectively, under ST1, ST2 and ST3 when compared with that under CK.
Taken together, these results indicated that light water stress could decrease the contents of total soluble sugar and sucrose in rice grains of which the effect at filling stage was more obvious. On the contrary, moderate and severe water stress could increase the contents of total soluble sugar and sucrose of which the effect at booting stage was more obvious.
3.1.2 Aymlose and total starch contents
During the grain filling process, the contents of amylose and total starch in rice grains of both two cultivars increased gradually and then stabilized (Figure 4). As the water stress increased, the contents of amylose and total starch of both two cultivars under the same growth stage decreased significantly and tended to be in the order of L > CK > M > S (Table 4).
Figure 4 Effects of different water stress treatments on accumulation of amylose and total starch in rice grains at different growth stages. T1, T2, and T3 refer to the different growth stages (booting stage, flowering stage and filling stage, respectively). CK, L, M and S refer to the different water treatments (flood-irrigated treatment, 0 kPa, light water stress treatment, -20 ± 5 kPa, moderate water stress treatment, -40 ± 5 kPa and severe water stress treatment, -60 ± 5 kPa, respectively). DW represents dry weight. The data presented are the average of two-year test.
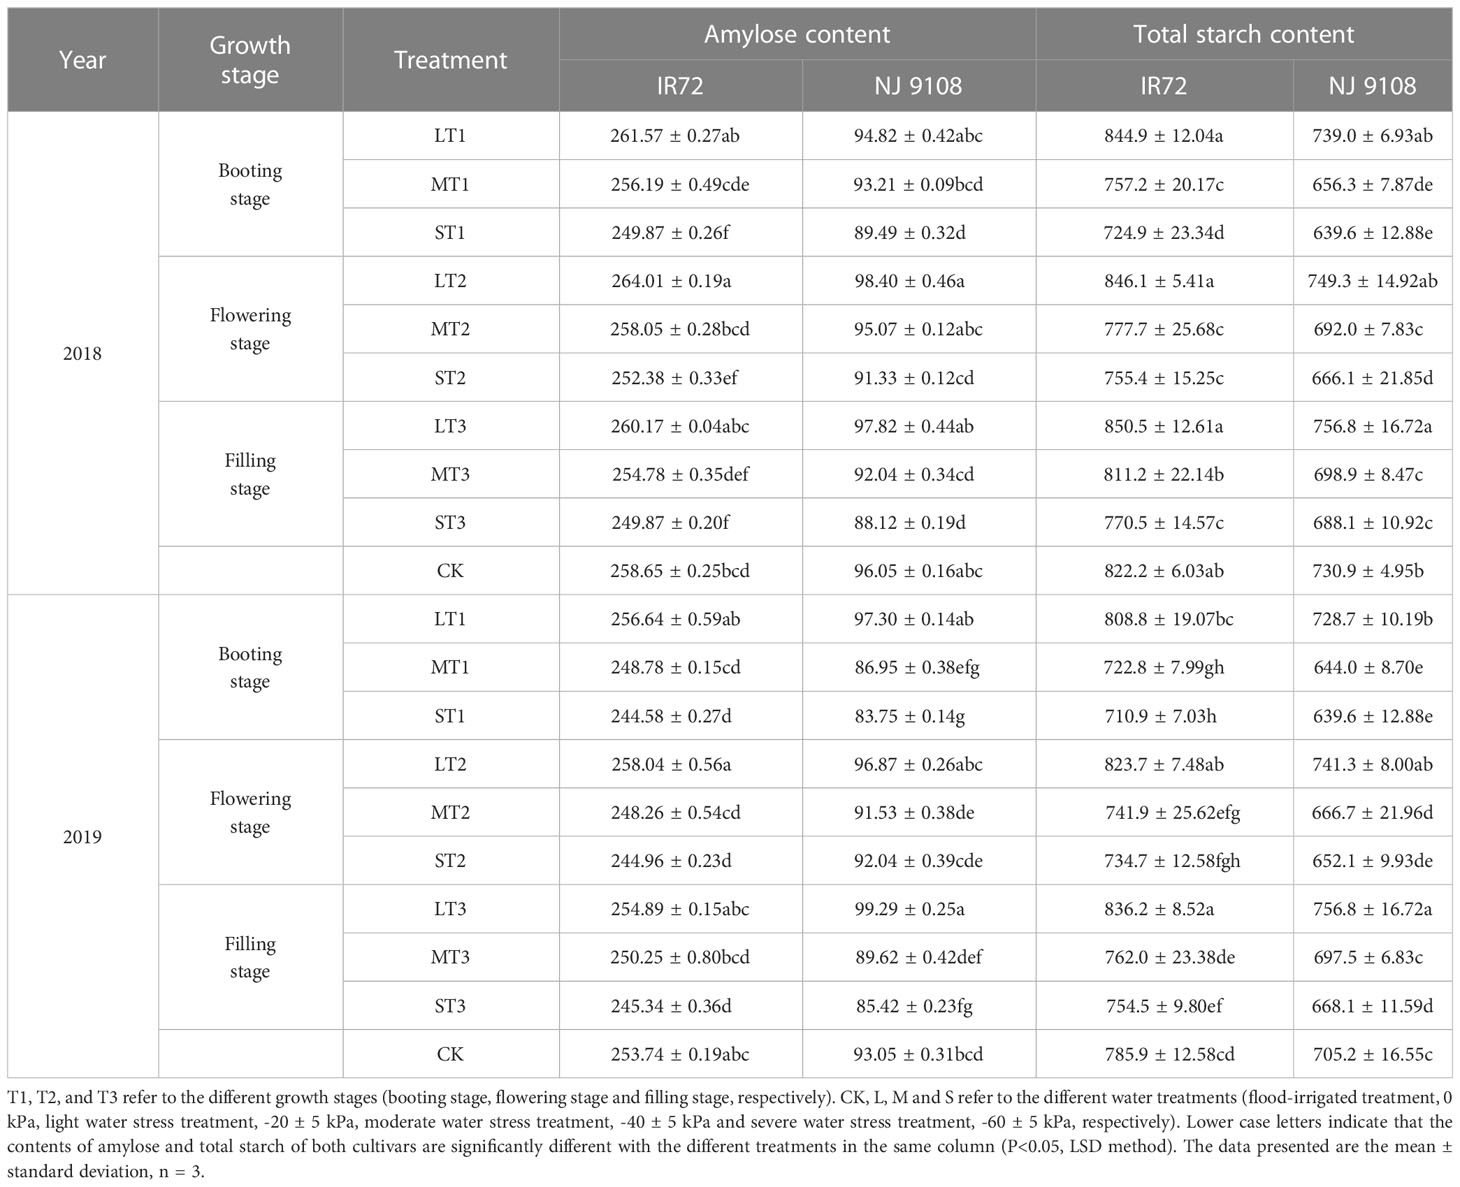
Table 4 Effects of different water stress treatments on amylose and total starch contents in rice grains at maturity stage (mg g-1).
The highest amylose contents of both two cultivars were observed under LT2 while the lowest values were observed under ST3 in 2018. The two-year test results showed the same trend except that the highest amylose content of NJ 9108 was observed under LT3 in 2019. No significant differences were found among each light water stress treatment at different growth stages while amylose contents under LT2 were significantly higher than other treatments (except MT2 for NJ 9108). Compared with that under CK, the amylose content of IR72 increased by 1.13%, 2.07% and 0.59%, respectively, under LT1, LT2 and LT3, and decreased by 3.40%, 2.42% and 3.39%, respectively, under ST1, ST2 and ST3. The amylose content of NJ 9108 increased by -1.28%, 2.45% and 1.84%, respectively, under LT1, LT2 and LT3, and decreased by 6.83%, 4.91% and 8.26%, respectively, under ST1, ST2 and ST3 when compared with that under CK.
The highest total starch contents of both two cultivars were observed under LT3 while the lowest values were observed under ST1 in 2018. The two-year test results showed the same trend. No significant differences were found among each light water stress treatment at different growth stages while total starch contents under LT3 were significantly higher than other treatments. Compared with that under CK, the total starch content of IR72 increased by 2.76%, 2.91% and 3.44%, respectively, under LT1, LT2 and LT3, and decreased by 11.83%, 8.12% and 6.29%, respectively, under ST1, ST2 and ST3. The total starch content of NJ 9108 increased by 1.11%, 2.52% and 3.54%, respectively, under LT1, LT2 and LT3, and decreased by 12.49%, 8.87% and 5.86%, respectively, under ST1, ST2 and ST3 when compared with that under CK.
Taken together, these results indicated that light water stress could increase the contents of amylose and total starch in rice grains of which the effect at filling stage was more obvious. The effects of light water stress on amylose and total starch contents were more obvious at flowering stage and filling stage, respectively (except that the highest amylose content of NJ 9108 was obtained under LT3 in 2019). On the contrary, moderate and severe water stress could decrease the contents of amylose and total starch of which the effect at booting stage was more obvious. The effects of severe water stress on amylose and total starch contents were more obvious at booting stage (except that the lowest amylose content of NJ 9108 was obtained under ST3 in 2018).
3.1.3 Starch synthesis-related enzyme activities
During the grain filling process, the activities of AGPase, SSS, SBE, DBE and GBSS of both two cultivars first increased and then decreased (Figures 5–7). The peak activities of these enzymes of IR72 and NJ 9108 were obtained at 12 d and 18 d after flowering, respectively. The light water stress could increase the activities of starch synthesis-related enzyme while the moderate and severe water stress had the opposite effects. As the water stress increased, the activities of starch synthesis-related enzyme of both two cultivars under the same growth stage tended to be in the order of L > CK > M > S.
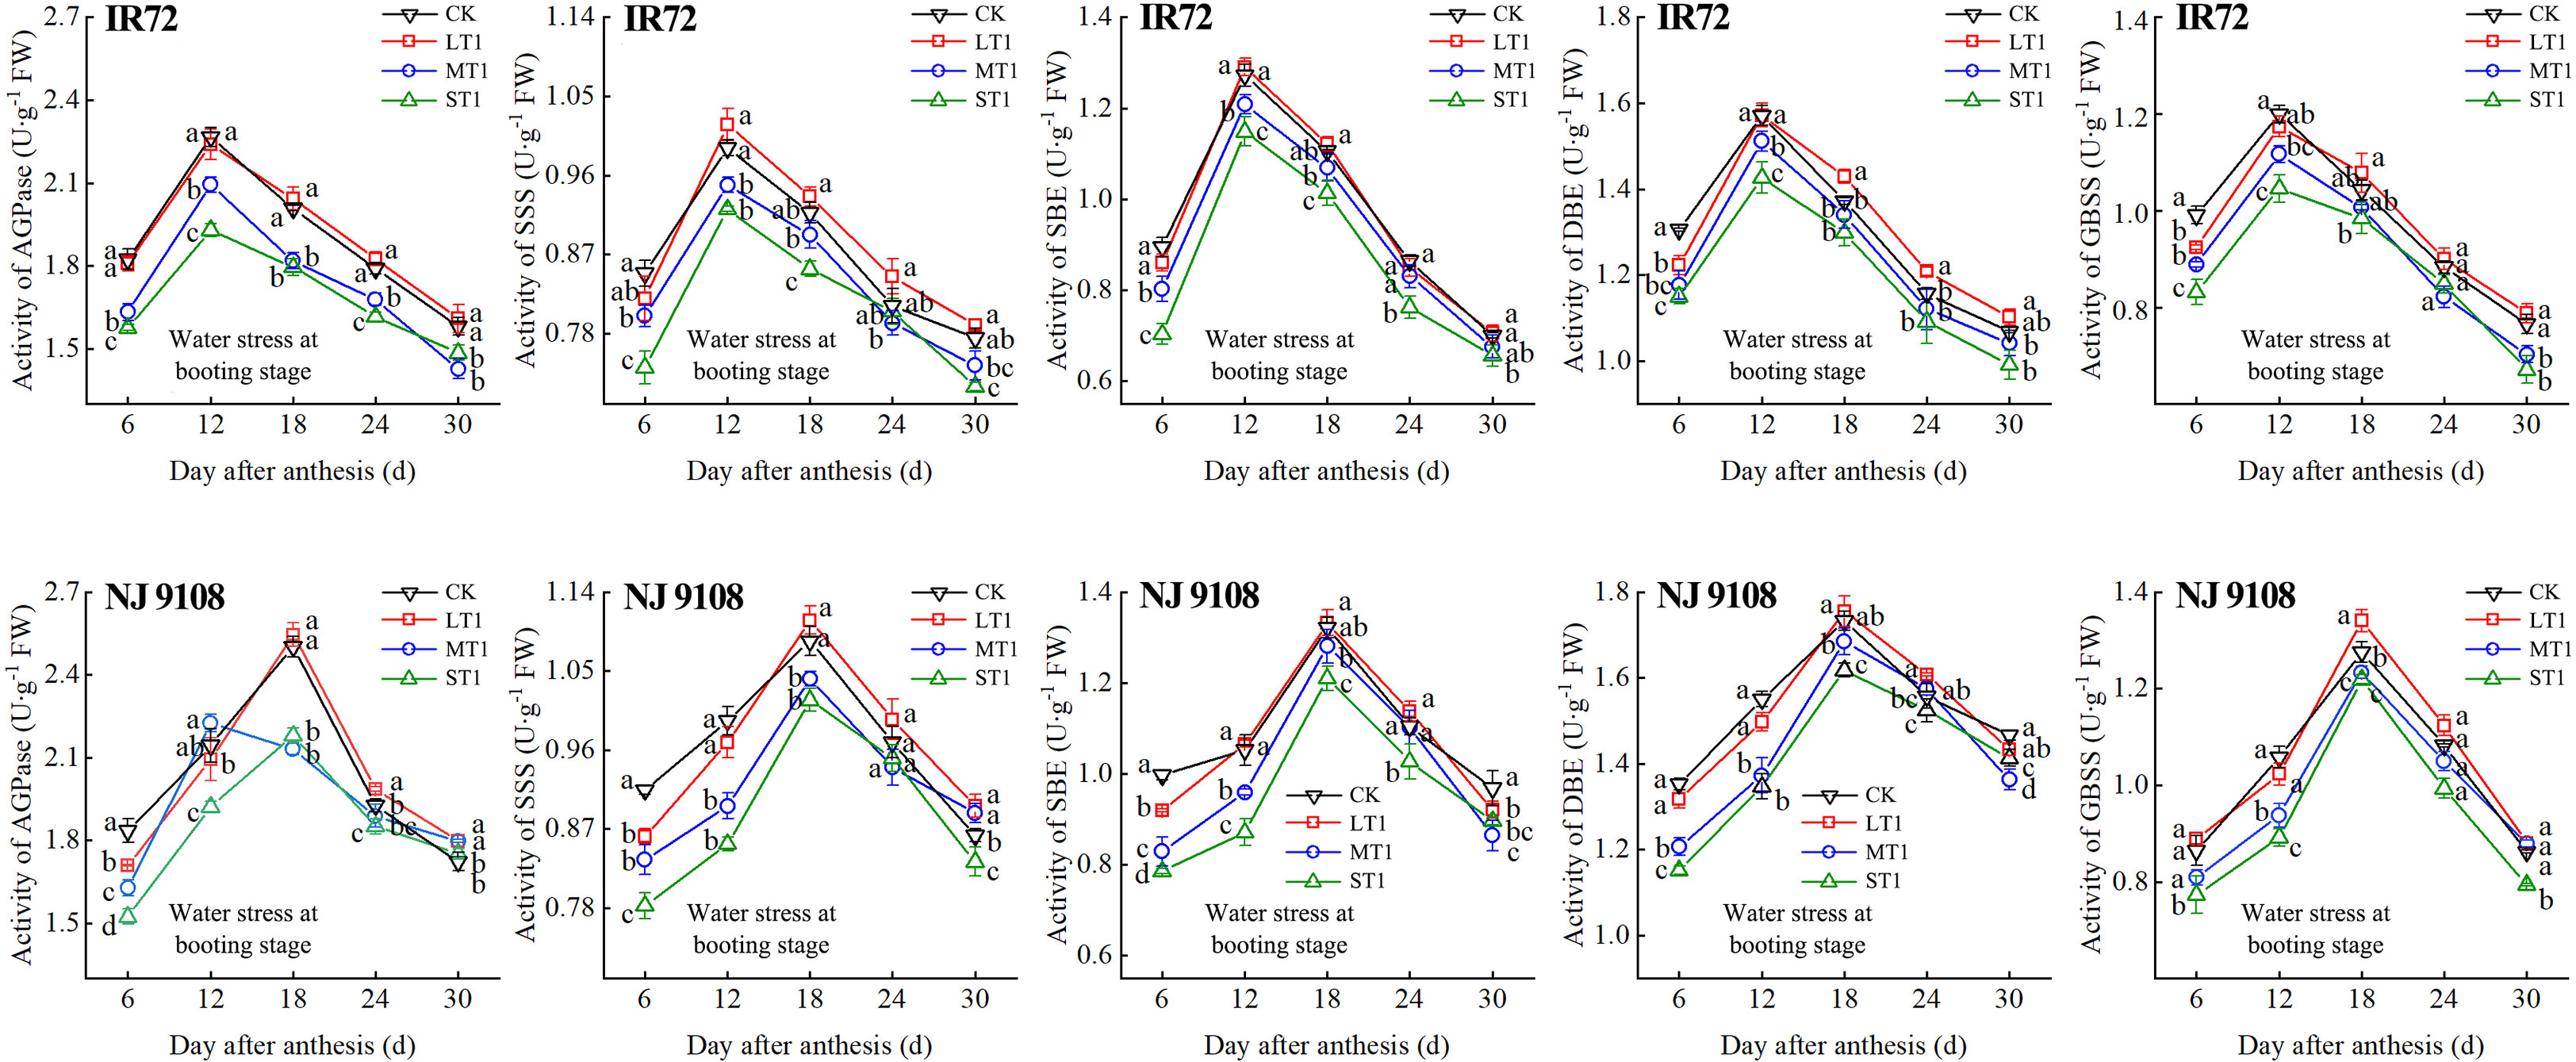
Figure 5 Effects of different water stress treatments on the activities of key enzyme involved in starch synthesis of IR72 and NJ 9108 at booting stage. T1 represents booting stage. CK, L, M and S refer to the different water treatments (flood-irrigated treatment, 0 kPa, light water stress treatment, -20 ± 5 kPa, moderate water stress treatment, -40 ± 5 kPa and severe water stress treatment, -60 ± 5 kPa, respectively). FW represents fresh weight. Lower case letters indicate that enzymes activities of both cultivars are significantly different with the different treatments (P<0.05, LSD method). The data presented are the mean ± standard deviation, n = 3.
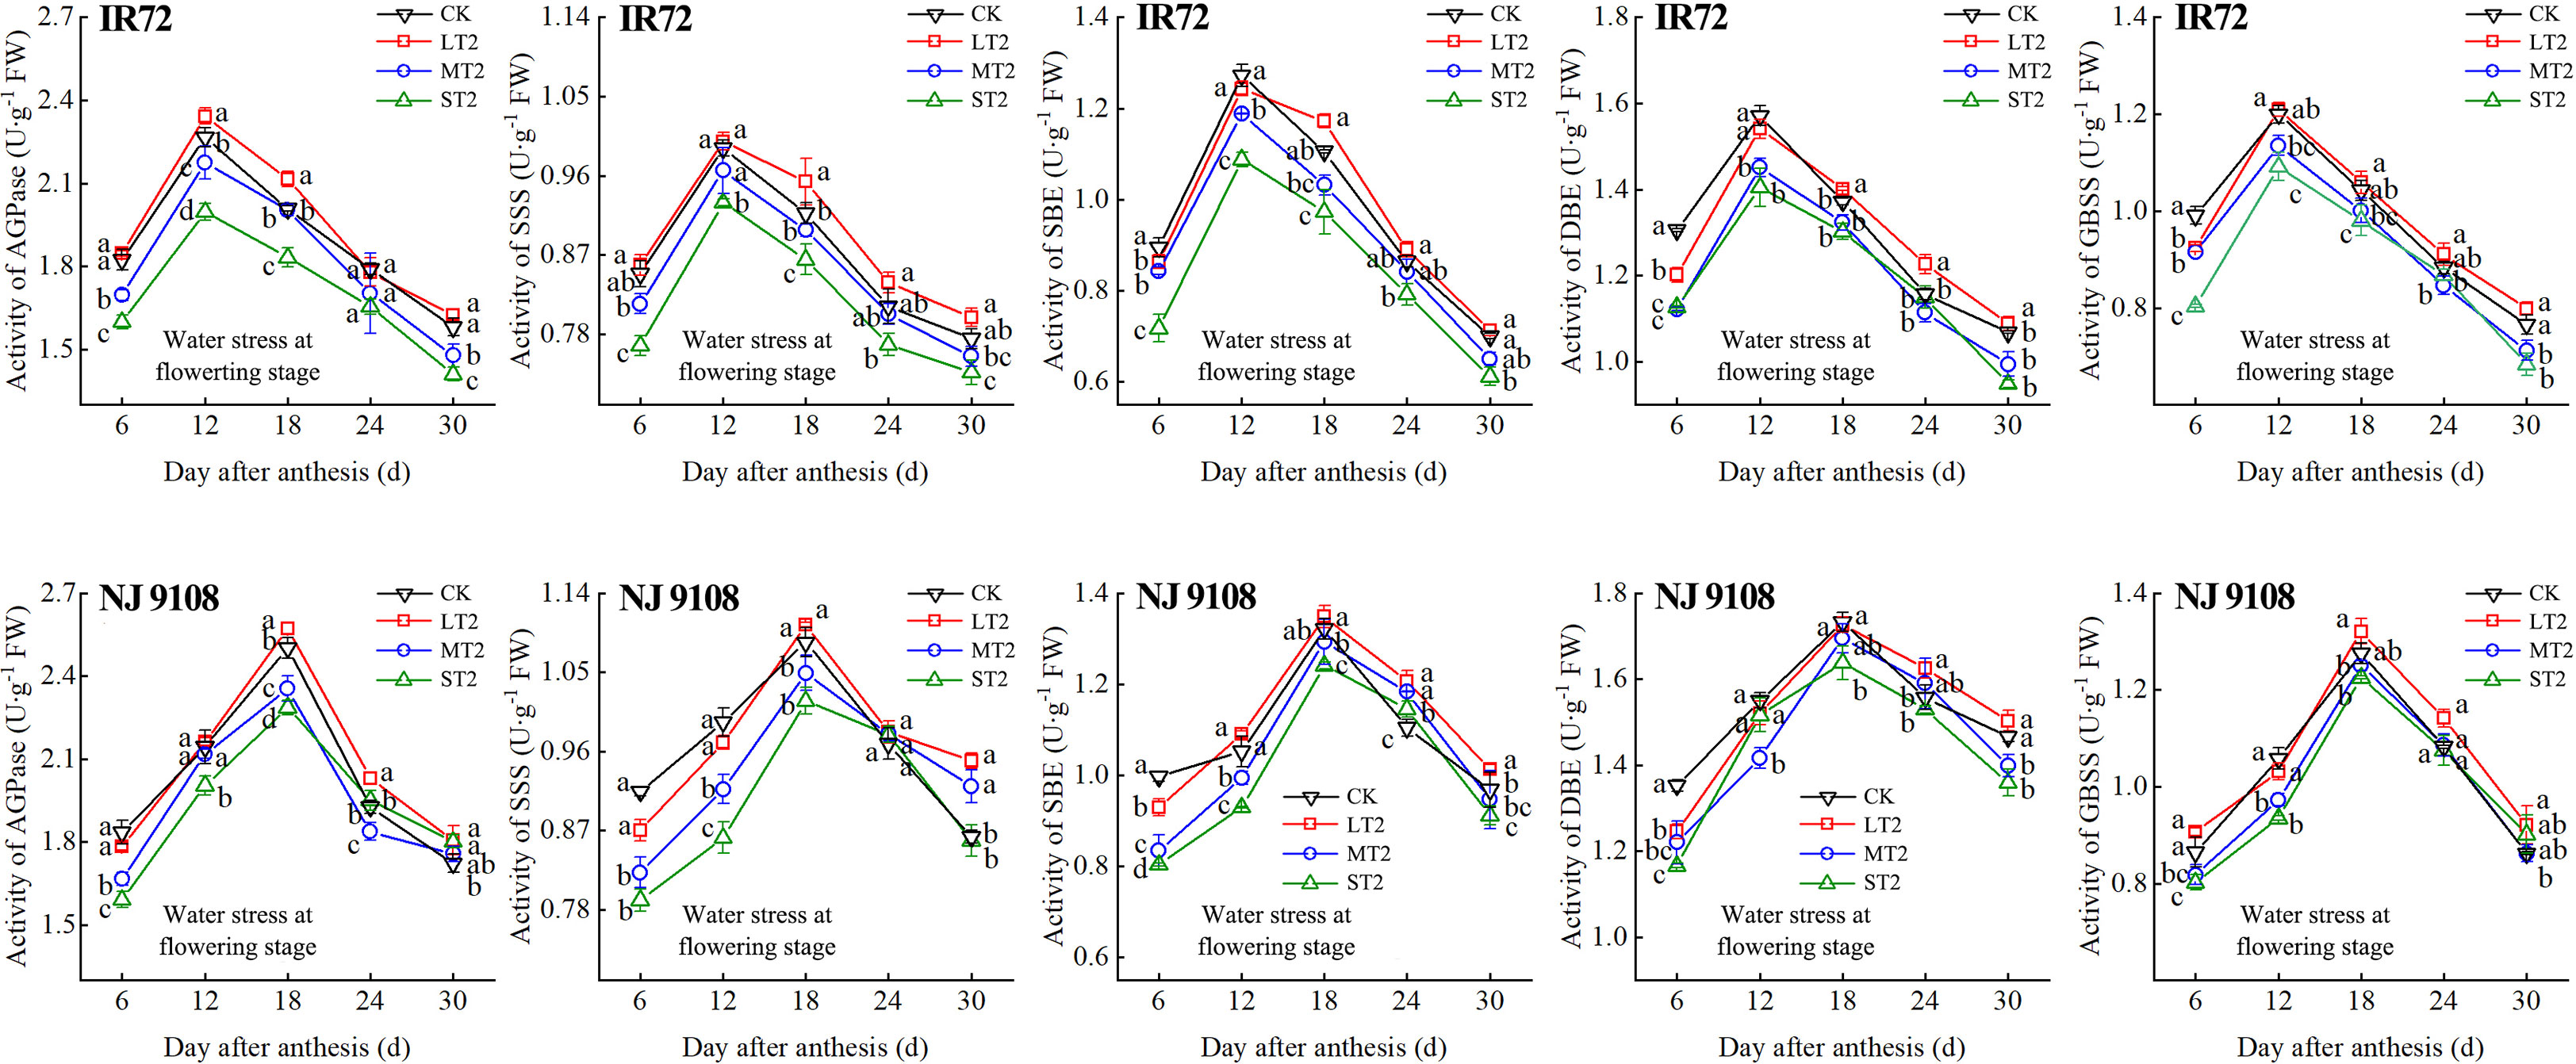
Figure 6 Effects of different water stress treatments on the activities of key enzyme involved in starch synthesis of IR72 and NJ 9108 at flowering stage. T2 represents flowering stage. CK, L, M and S refer to the different water treatments (flood-irrigated treatment, 0 kPa, light water stress treatment, -20 ± 5 kPa, moderate water stress treatment, -40 ± 5 kPa and severe water stress treatment, -60 ± 5 kPa, respectively). FW represents fresh weight. Lower case letters indicate that enzymes activities of both cultivars are significantly different with the different treatments (P<0.05, LSD method). The data presented are the mean ± standard deviation, n = 3.
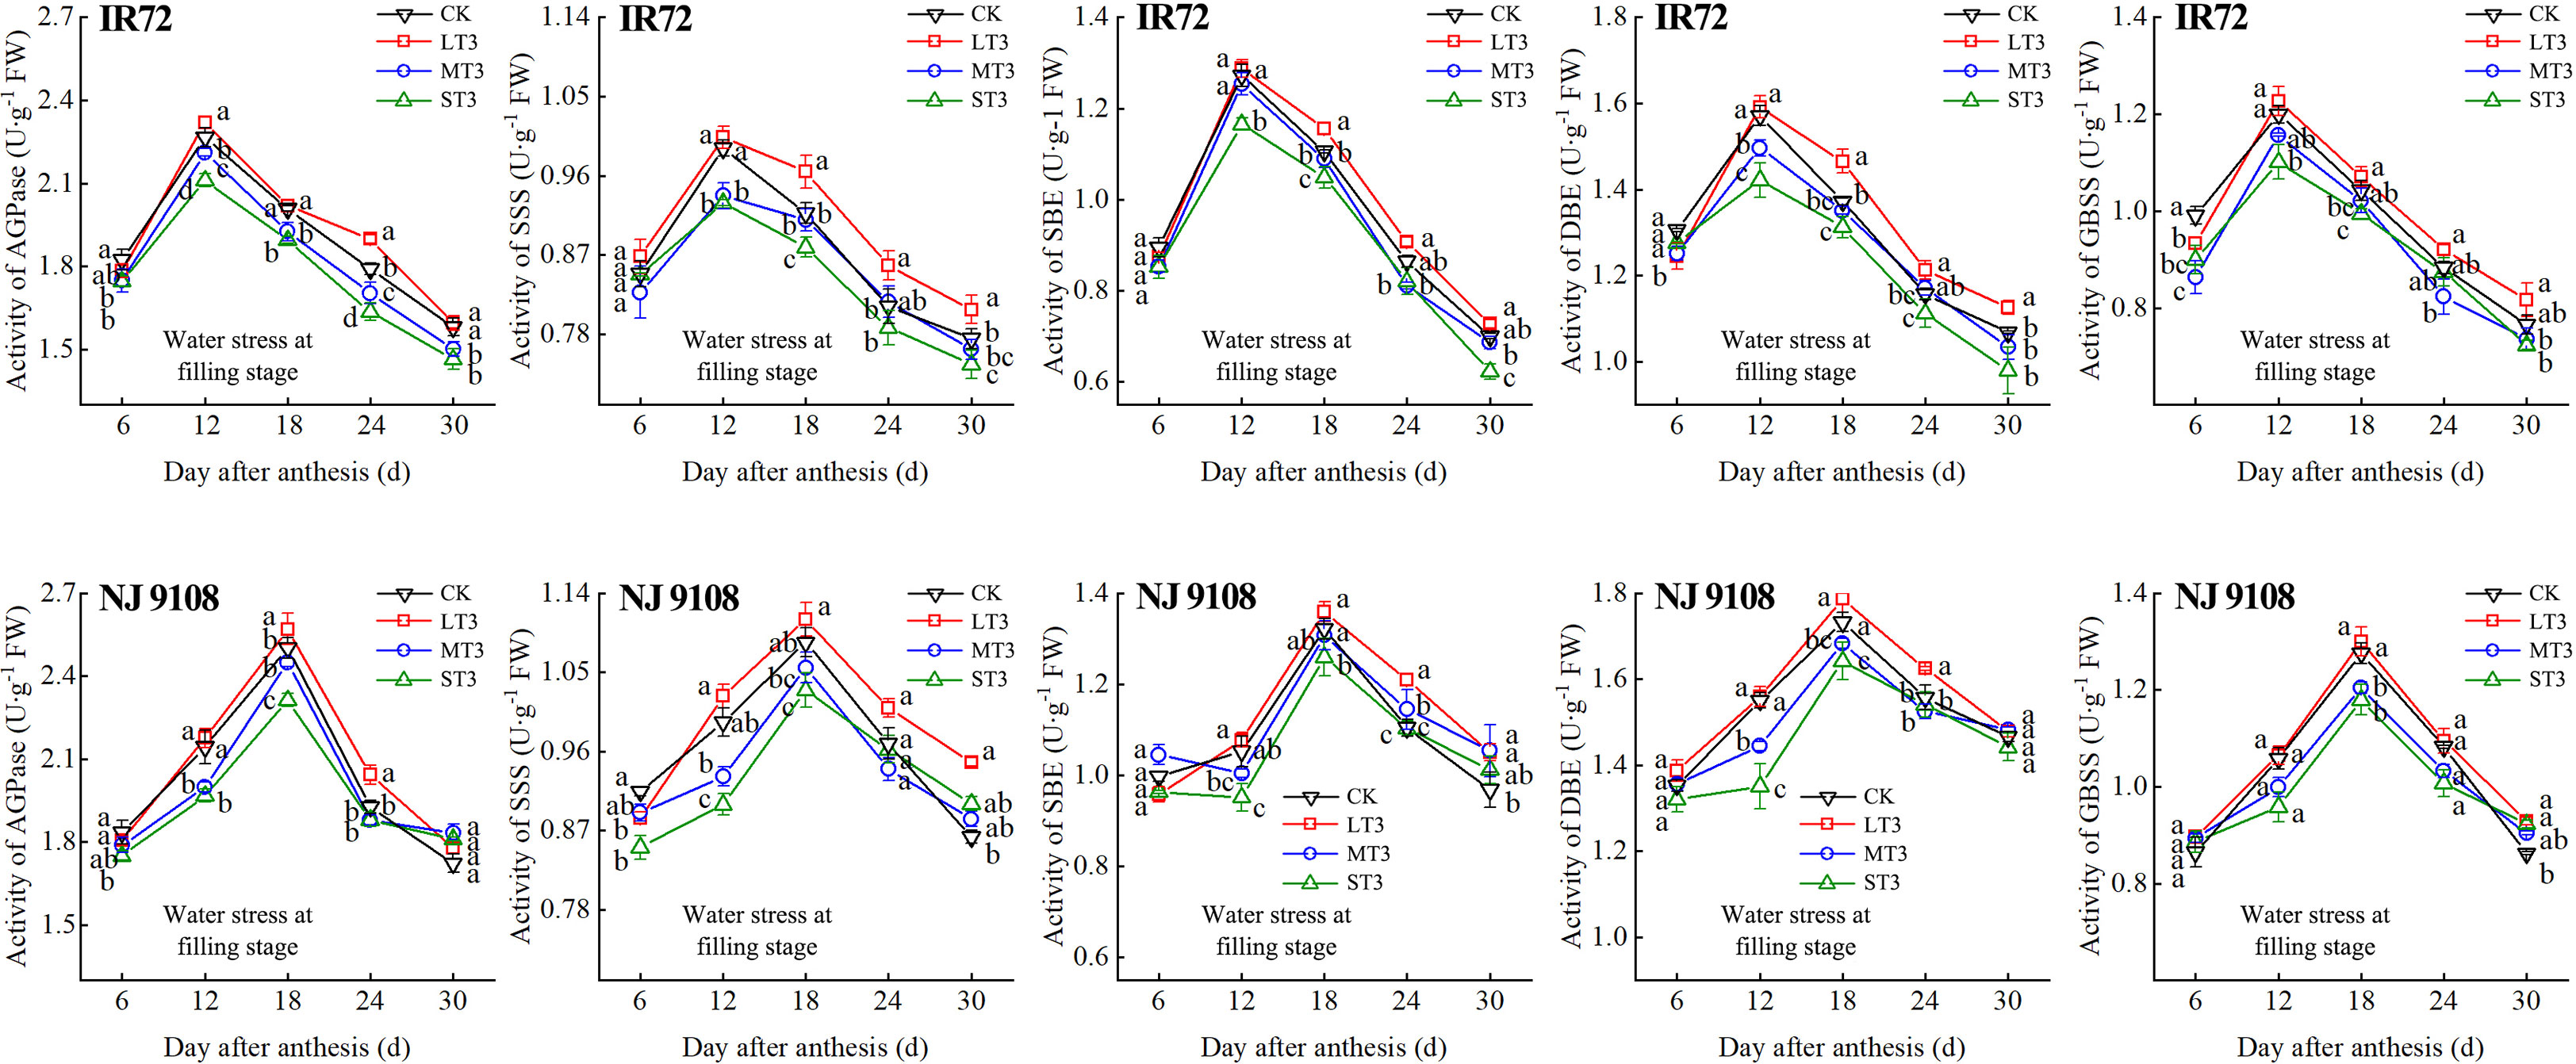
Figure 7 Effects of different water stress treatments on the activities of key enzyme involved in starch synthesis of IR72 and NJ 9108 at filling stage. T3 represents filling stage. CK, L, M and S refer to the different water treatments (flood-irrigated treatment, 0 kPa, light water stress treatment, -20 ± 5 kPa, moderate water stress treatment, -40 ± 5 kPa and severe water stress treatment, -60 ± 5 kPa, respectively). FW represents fresh weight. Lower case letters indicate that enzymes activities of both cultivars are significantly different with the different treatments (P<0.05, LSD method). The data presented are the mean ± standard deviation, n = 3.
At 6 d after flowering, the highest activities of most starch synthesis-related enzyme were observed under CK while the lowest values were observed under S treatment (except GBSS of NJ 9108). The enzyme activities under CK and L at booting stage and flowering stage were higher than those under M and significantly higher than those under S, respectively (except DBE of IR72). At the peak stage, the enzyme activities of IR72 (12 d after flowering) and NJ 9108 (18 d after flowering) under CK and L were higher than those under M and significantly higher than those under S, respectively. Compared that under CK, the AGPase peak activities under LT1, LT2 and LT3 increased by -1.17%, 3.39% and 2.67% for IR72 and by 1.79%, 2.83% and 2.79% for NJ 9108, respectively, the SSS peak activities increased by 2.67%, 0.81% and 1.26% for IR72 and by 2.23%, 1.89% and 2.46% for NJ 9108, respectively, the SBE peak activities increased by 1.42%, -2.25% and 1.19% for IR72 and by 0.76%, 1.99% and 2.81% for NJ 9108, respectively, the DBE peak activities increased by -1.94%, -0.06% and 1.28% for IR72 and by 1.28%, -0.31% and 3.13% for NJ 9108, respectively, the GBSS peak activities increased by -2.15%, 0.85% and 2.27% for IR72 and by 5.13%, 3.61% and 1.95% for NJ 9108, respectively. At 24 d after flowering, the enzyme activities of both two cultivars decreased rapidly after the peak stage and the highest values were observed under L (except SBE of IR72 at booting stage). At 30 d after flowering, the enzyme activities of both two cultivars under LT1 were lower than those under LT2 and LT3 (except AGPase). However, the enzyme activities under L at different growth stages were higher than those under M and S.
3.1.4 Expression analysis of OsSuS family and OsVIN3
According to the above results, the peak activities of starch synthesis-related enzymes of IR72 and NJ 9108 were obtained at 12 d and 18 d after flowering, respectively. And the highest starch contents of both two cultivars were obtained under LT3 while the lowest were obtained under ST1. Therefore, samples from these two different growth stages and water treatments were selected for expression analysis of OsSuS family and OsVIN3. The results showed that OsSuS2 and OsSuS4 had high expression levels under LT3 (Figure 8). Despite the expression levels of OsSuS1, OsSuS5, OsSuS6 and OsVIN3 were high under ST1, starch content in rice grain under ST1 was lower than LT3, indicating that these genes might play minor role in the increased capacity for starch synthesis.
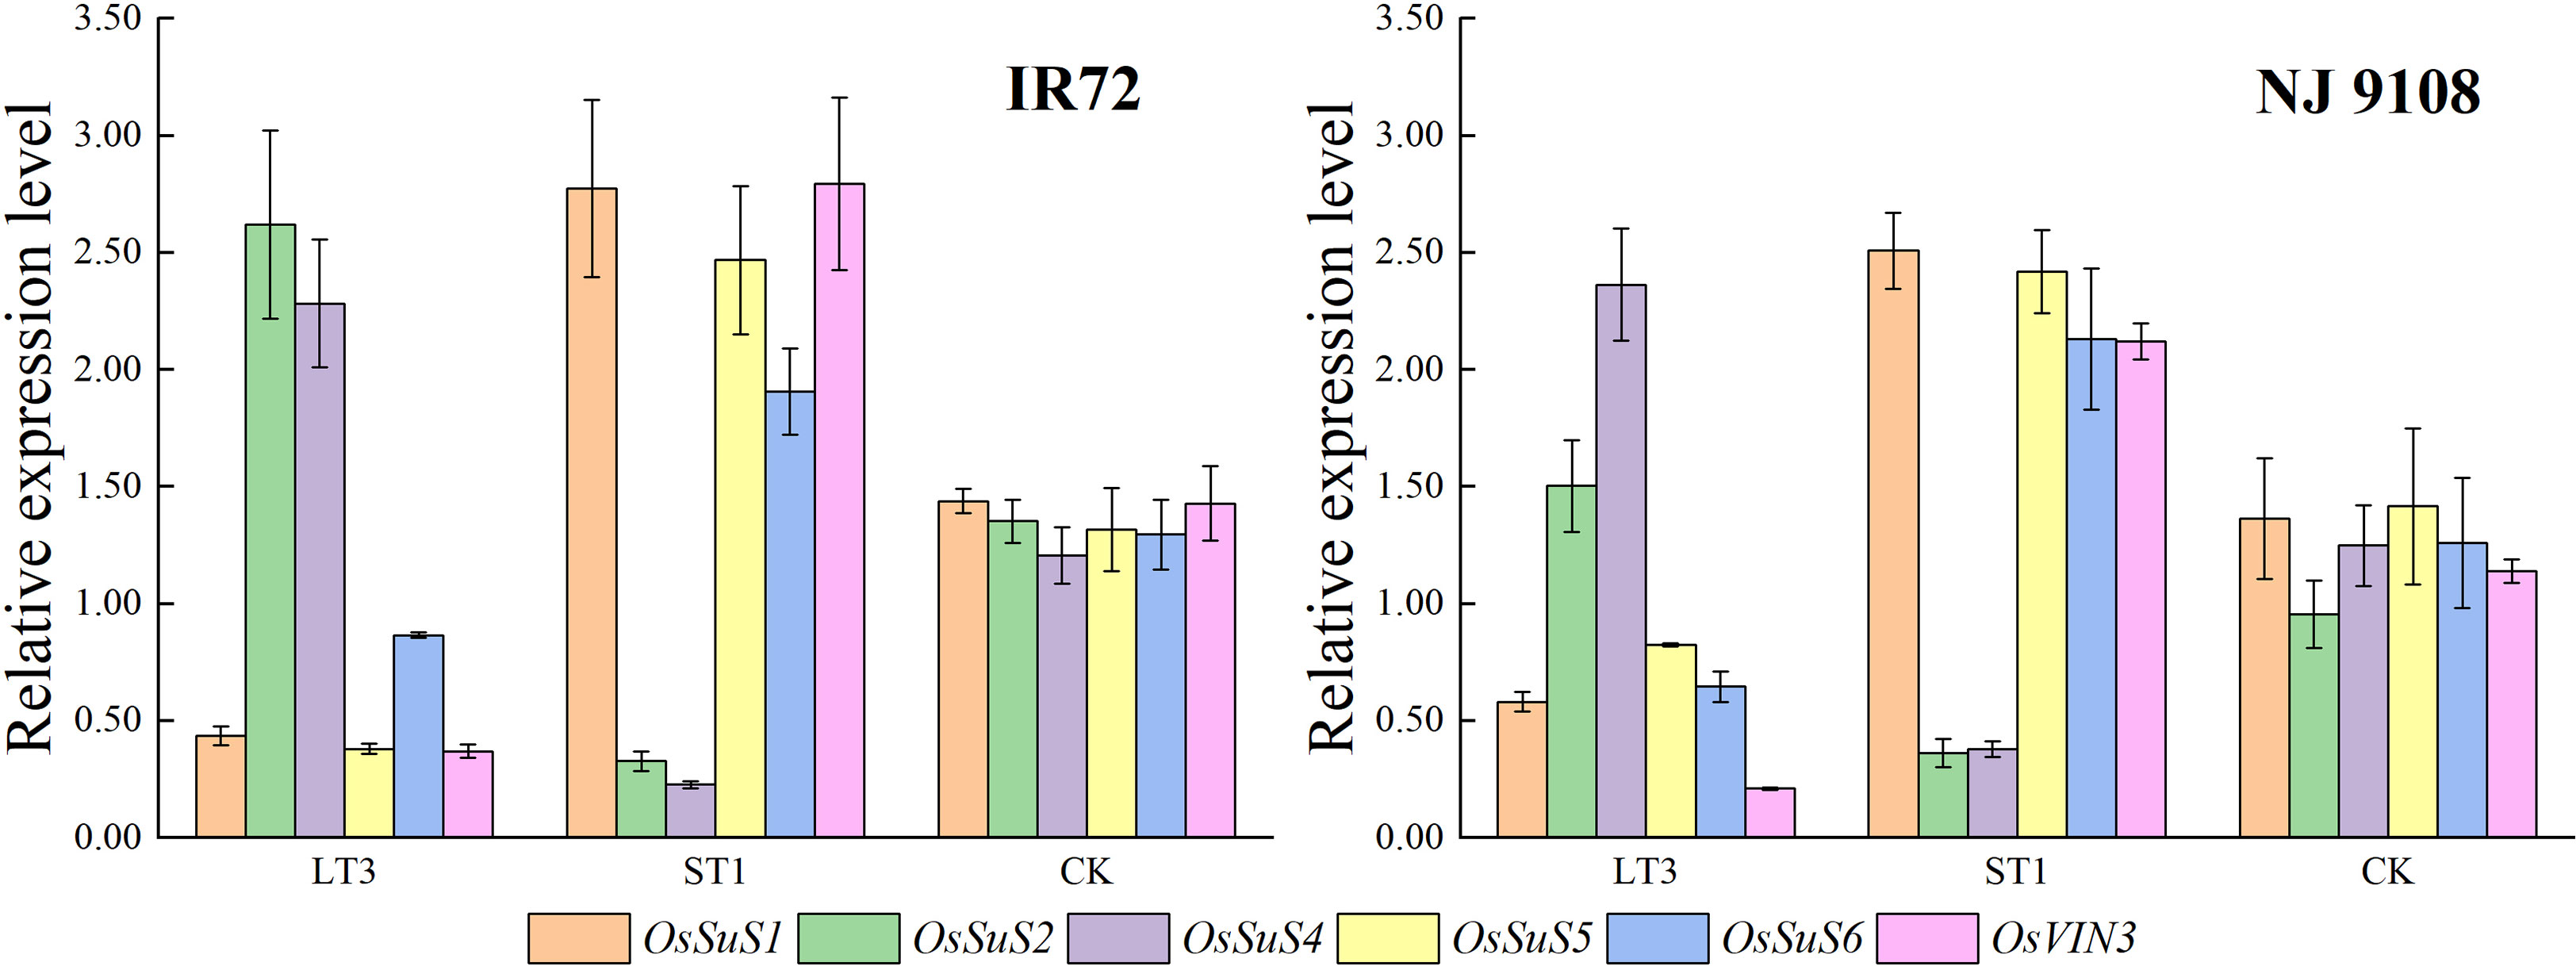
Figure 8 Effects of different water stress treatments on expression levels of OsSuS family and OsVIN3 in rice grains at different growth stages. LT3, ST1 and CK refer to light water stress treatment at filling stage (-20 ± 5 kPa), severe water stress treatment at booting stage (-60 ± 5 kPa) and flood-irrigated treatment (0 kPa), respectively. The data presented are the mean ± standard deviation, n = 3.
3.2 Yield and yield components
No obvious impacts were observed on productive panicle number per pot and filled grain number per panicle between different water stress treatments. However, as the water stress increased, the seed setting rate, 1000-grain weight and grain yield of both two cultivars under the same growth stage decreased significantly. The two-year test results showed that the highest values were obtained under LT3 and the lowest values were obtained under ST1 (Tables 5, 6).

Table 5 Effects of different water stress treatments on yield and yield components of IR72 at different growth stages.
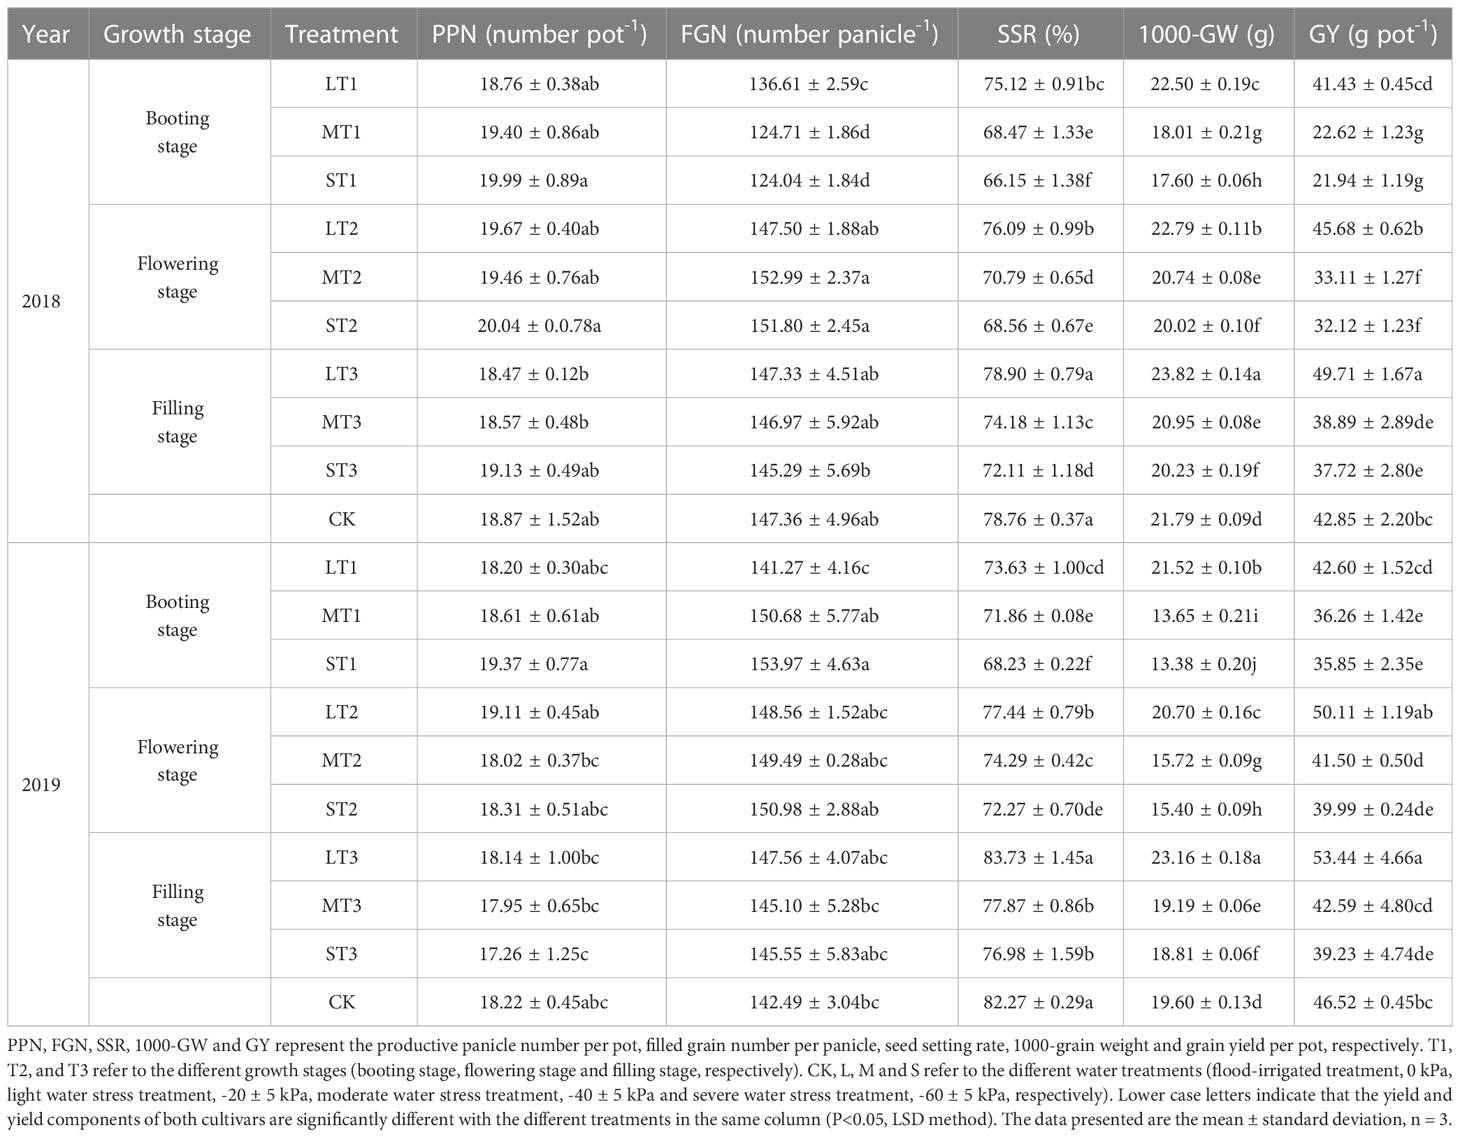
Table 6 Effects of different water stress treatments on yield and yield components of NJ 9108 at different growth stages.
In 2018, the seed setting rate, 1000-grain weight and grain yield of both two cultivars under LT3 were significantly higher than other treatments. Compared with that under CK, the seed setting rate increased by -5.15, -2.55 and 2.36 percentage points for IR72 and by -3.64, -2.67 and 0.14 percentage points for NJ 9108, respectively, under LT1, LT2 and LT3, while decreased by 20.48, 15.24 and 6.38 percentage points for IR72 and by 12.61, 10.20 and 6.65 percentage points for NJ 9108, respectively, under ST1, ST2 and ST3. The 1000-grain weight increased by 1.59%, 3.18% and 4.63% for IR72 and by 3.26%, 4.59% and 9.32% for NJ 9108, respectively, under LT1, LT2 and LT3, while decreased by 14.65%, 11.54% and 5.97% for IR72 and by 19.23%, 8.12% and 7.16% for NJ 9108, respectively, under ST1, ST2 and ST3. The grain yield increased by -8.79%, 0.97% and 11.59% for IR72 and by -3.31%, 6.60% and 16.01% for NJ 9108, respectively, under LT1, LT2 and LT3, while decreased by 28.81%, 19.04% and 11.68% for IR72 and by 48.80%, 25.04% and 11.97% for NJ 9108, respectively, under ST1, ST2 and ST3. The two-year test results showed the same trend.
Taken together, these results indicated that light water stress could increase the 1000-grain weight at different growth stages. The seed setting rate could be enhanced under LT3 while the grain yield could be enhanced under LT2 and LT3. The 1000-grain weight and grain yield of both two cultivars under the same water treatments tended to be in the order of T3 > T2 > T1.
3.3 Principle component analysis
To sum up, the responses of starch synthesis and accumulation and yield of two rice cultivars to water treatments at different growth stages were different. The starch content and rice yield consists of many evaluation indexes and a single index could not objectively reflect the effects of water stress on them. PCA is a simple and effective statistical tool that is widely used in dimensionality reduction and factorial analysis of high-dimension datasets. Datasets with several correlated variables are decomposed into a smaller number of linearly independent variables by PCA. Hence, PCA of 10 indexes including five starch synthesis-related enzymes activities, amylose and total starch contents, seed setting rate, 1000-grain weight and yield of two rice cultivars under different water treatments was used to establish a comprehensive evaluation model (Table 7).
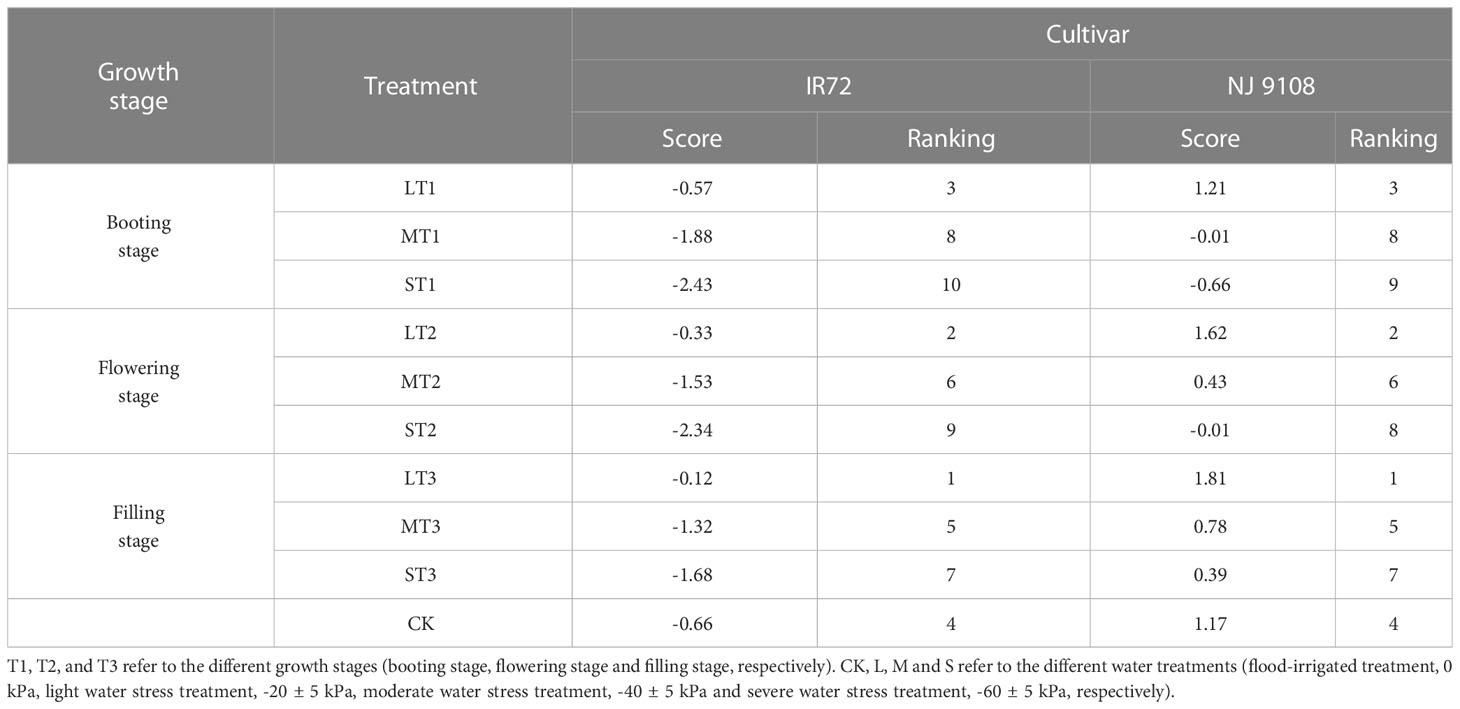
Table 7 The comprehensive scores and rankings of IR72 and NJ 9108 under different water treatments.
The comprehensive evaluation results showed that LT3 got the highest comprehensive score while ST1 got the lowest, and the comprehensive scores of both LT1 and LT2 were higher than CK. As the water stress increased, the comprehensive scores of both two cultivars decreased and tended to be in the order of NJ 9108 > IR72.
Taken together, these results indicated that light water stress could promote starch synthesis and accumulation and increase rice yield while moderate and severe water stress had the opposite effects. The effects of improving starch content and rice yield under light water stress treatment at different growth stages followed the trend of T3 > T2 > T1. And the drought resistance ability of NJ 9108 was better than IR72 according to the comprehensive scores of PCA.
4 Discussion
4.1 Effects of water stress on starch synthesis-related enzyme activities
Photosynthates transported into grain mainly exist in the form of sucrose through the phloem at first, and then stored as starch through a series of enzymatic reactions. The key enzyme activities involved in sucrose-to-starch conversion in rice grain determine the sugar content, starch synthesis and accumulation, rice yield and quality (Zhang et al., 2012). Two types of enzymes are responsible for the degradation of sucrose: SuS and invertase (INV). SuS reversibly catalyzes the hydrolysis of sucrose into UDP-glucose and fructose (Coleman et al., 2009). In contrast, INV degrades sucrose into glucose and fructose irreversibly (Ruan, 2014). Based on subcellular location, INVs are classified into cell wall invertase (CWIN), vacuolar invertase (VIN) and cytoplasmic invertase (CIN) (Roitsch and Gonzalez, 2004). VIN regulates cell expansion, osmotic pressure, sugar signals, sucrose accumulation, and sucrose concentration, especially during the expansion phases of sink organs (Li et al., 2017). It is reported that appropriate water stress could increase the activities and expression level of SuS and VIN (Zhang et al., 2017; Wang et al., 2019). SuS activity was substantially enhanced by water stress, and was positively correlated with starch accumulation rate in the grains (Yang et al., 2003). VIN activity increased significantly, and the more severe the drought, the higher the VIN activity (Wang et al., 2022). We observed the same results in the present study that the expression levels of OsSuS2 and OsSuS4 increased under light water stress treatment (Wang et al., 2015a) and OsVIN3 expression level under severe water stress treatment was higher than that under light water stress treatment (Wang, 2020). However, reports about the effects of water stress on INV activities and expression levels in rice grains are still limited. Changes in the expression level of OsVIN3 were not consistent with those in the starch content under severe water stress treatment. Further research is needed to identify the role of OsCWIN and OsVIN family genes in sucrose-to-starch conversion in rice grains and their regulatory factors when subjected to water stress during grain filling.
The immediate precursor for the starch synthesis in rice grain is adenosine diphosphate glucose (ADPG) which is synthesized from glucose-1-phosphate and ATP, and the reaction is catalyzed by AGPase (Kawagoe et al., 2005). SSS and GBSS are involved in amylopectin and amylose synthesis, respectively, which both utilize ADPG as the substrate (Akihiro et al., 2005; Szydlowski et al., 2011). SBE catalyzes the formation of α-1,6-glycoside bond, while DBE hydrolyzes α-1,6-glycoside bond (Nakamura et al., 2010). Previous studies have found that water stress during rice filling stage will reduce the starch synthesis-related enzyme activities (Shi et al., 2016; V et al., 2019). However, some studies have reported that a moderate wetting drying regime during the grain-filling stage of rice can increase the activities of key enzymes involved in sucrose-to-starch metabolic pathway (Zhang et al., 2008). In the present study, we observed that light water stress at different growth stages all increased the activities of AGPase, SSS, GBSS, SBE and DBE. The moderate and severe water stress had the opposite effects. With the increasing level of water stress, the key enzyme activities decreased, in agreement with the results of previous studies (Zhang et al., 2008). The activities and peak activities of these five enzymes during mid and late filling stage increased under light water stress at different growth stages. This might be due to the fact that light water stress promote the roots developmentand improve the plants vitality, resulting in an increase in sucrose-to-starch synthesis-related enzyme activity.
4.2 Effects of water stress on starch synthesis and accumulation
Photosynthates are primarily transported in the form of sucrose from source to sink tissues (Pandey and Shukla, 2015). The transport and distribution of total soluble sugar and sucrose are key processes in plants response to abiotic stresses (Mathan et al., 2021). Previous studies have found that the increase in sucrose content under the drought in the developing grains could be due to the reduction in the activity of the sucrose synthase which is the main enzyme involved in the breakdown of sucrose (V et al., 2019). Starch is the major component of rice. Starch composition and structure are closely correlated with rice yield and quality (Li et al., 2018). Total soluble sugar, sucrose and starch can be converted into each other, and their content determines the accumulation of starch in rice grain (Wang and Zhang, 2020). Moderate drought stress during grain filling (water deficit stress was initiated by withholding irrigation during the booting initiation stage and continued for 21 days) accelerates the transport of photosynthate stored in vegetative organs to grains leading to increased starch (V and Tyagi, 2020). In the present study, we observed that total starch content under light water stress at different growth stages was higher than that under CK while total soluble sugar and sucrose contents were lower than that under CK. And the moderate and severe water stress showed the opposite trend. These results indicated that light water stress promoted the conversion of total soluble sugar and sucrose to starch through regulating the key enzymes involved in starch synthesis, and increased the starch content in rice grain as a result.
4.3 Effects of water stress on rice yield and yield components
Rice yield, in response to drought, depends on the timing of the drought event in relation to plant growth stage. As the water stress level and timing increase, rice yield usually decreases significantly especially during rice water sensitive stage (Farooq et al., 2009; Rao et al., 2019). Drought stress at booting stage inhibites the development of branches and spikelets leading to spike degeneration and pollen abortion which have significant impact on grain number and seed setting rate (Dolferus et al., 2011). When the rice is exposed to severe drought stress at flowering stage, the reduction of spikelets per panicle, filled grains and grain yield are observed due to the significant increase in spikelets sterility (Yang et al., 2019). Drought stress at filling stage enhances the plant senescence and remobilization of carbon store from leaves and stems to grains. The reduction of yield could be due to a decrease in the grain filling period under the drought at filling stage (Yang et al., 2008). The results of this study showed that water stress at booting stage was not favorable to grain yield. On the contrary, light water stress at flowering stage and filling stage could increase rice yield which followed the trend of filling stage > flowering stage. The seed setting rate increased only under light water stress at filling stage while the 1000-grain weight increased under light water stress at different growth stages. However, both moderate and severe water stress decreased 1000-grain weight. With the increasing level of water stress at the same growth stage, the 1000-grain weight and grain yield decreased significantly, in agreement with the results of previous studies (Ye et al., 2013). The increase in 1000-grain weight under LT1 might due to the compensation effect caused by soil water condition after re-watering. Additionally, the decrease of effective panicle number might not be the main factor of rice yield reduction since the water stress treatment was applied after the number of rice tillers reached the peak. A considerable number of aborted pollen limiting seed setting rate under a soil water deficit at booting stage was a major constraint for rice yield (Kato et al., 2008).
5 Conlusion
Water is an important factor in agricultural and food production, while water stress impairs rice yield and quality, thus being a severe threat to sustainable agriculture. The starch content is one of the main factors affecting rice yield and quality but little information is available on starch accumulation and related enzyme activities under different water stress treatments at different growth stages. Our study showed that light water stress at filling stage was beneficial to water-saving and rice yield improvement. Different water stress treatments at booting stage all led to decreases in rice yield. The sucrose content and total soluble sugar content increased, while starch synthesis-related enzyme activities, amylose content, total starch content, seed setting rate, 1000-grain weight and yield decreased with the increasing level of water stress at the same growth stage. The PCA results showed that light water stress could promote starch synthesis and accumulation and increase rice yield, and the effects of improving starch content and rice yield at different growth stages tended to be in order of T3 > T2 > T1. The grain yield under LT3 increased by 11.59% for IR72 and 16.01% for NJ 9108, respectively when compared with CK. Therefore, we suggested that light water stress could be applied at filling stage to increase rice yield in the practical production. This new water management may offer a beneficial option for farmers to save water and labor force and maintain high yield of rice.
Data availability statement
The original contributions presented in the study are included in the article/Supplementary Material. Further inquiries can be directed to the corresponding authors.
Author contributions
All authors listed have made a substantial, direct, and intellectual contribution to the work and approved it for publication.
Funding
This work was supported by funds from the Guizhou Provincial Science and Technology Foundation (QKHJC[2020]1Z020) and the Project of Science and Technology of Chengdu City (2022YFH0029 and 2022-YF09-00036-SN).
Acknowledgments
We would like to thank our teacher for carefully reading and correcting our manuscript and providing technical assistance and financial support for the study, as well as our scientific research team for their contribution to this paper.
Conflict of interest
The authors declare that the research was conducted in the absence of any commercial or financial relationships that could be construed as a potential conflict of interest.
Publisher’s note
All claims expressed in this article are solely those of the authors and do not necessarily represent those of their affiliated organizations, or those of the publisher, the editors and the reviewers. Any product that may be evaluated in this article, or claim that may be made by its manufacturer, is not guaranteed or endorsed by the publisher.
Supplementary material
The Supplementary Material for this article can be found online at: https://www.frontiersin.org/articles/10.3389/fpls.2023.1133524/full#supplementary-material
References
Akihiro, T., Mizuno, K., Fujimura, T. (2005). Gene expression of ADP-glucose pyrophosphorylase and starch contents in rice cultured cells are cooperatively regulated by sucrose and ABA. Plant Cell Physiol. 46, 937–946. doi: 10.1093/pcp/pci101
Bam, B., Humphreys, E., Tuong, T. P., Barker, R. (2007). Rice and water. Adv. Agron. 92, 187–237. doi: 10.1016/S0065-2113(04)92004-4
Cai, K. Z., Wu, X. Z., Luo, S. M., Wang, W. (2008). Effects of water stress at different growth stages on root activity, leaf water potential and protective enzymes activity in rice. J. South China Agric. U. 29, 7–10. doi: 10.3969/j.issn.1001-411X.2008.02.002
Cao, X. C., Wu, M. Y., Guo, X. P., Zheng, Y. L., Gong, Y., Wu, N., et al. (2017). Assessing water scarcity in agricultural production system based on the generalized water resources and water footprint framework. Sci. Total Environ. 609, 587–597. doi: 10.1016/j.scitotenv.2017.07.191
Chen, Z. K., Chen, H. Y., Jiang, Y., Wang, J. P., Khan, A., Li, P., et al. (2020). Metabolomic analysis reveals metabolites and pathways involved in grain quality traits of high-quality rice cultivars under a dry cultivation system. Food Chem. 326, 126845. doi: 10.1016/j.foodchem.2020.126845
Chen, Z. K., Li, P., Du, Y. F., Jiang, Y., Cai, M. L., Cao, C. G. (2021). Dry cultivation and cultivar affect starch synthesis and traits to define rice grain quality in various panicles parts. Carbohydr. Polym. 269, 118336. doi: 10.1016/j.carbpol.2021.118336
Coleman, H. D., Yan, J., Mansfield, S. D. (2009). Sucrose synthase affects carbon partitioning to increase cellulose production and altered cell wall ultrastructure. Proc. Natl. Acad. Sci. U.S.A. 106, 13118–13123. doi: 10.1073/pnas.0900188106
Dolferus, R., Ji, X. M., Richards, R. A. (2011). Abiotic stress and control of grain number in cereals. Plant Sci. 181, 331–341. doi: 10.1016/j.plantsci.2011.05.015
Fageria, N. K. (2011). Plant tissue test for determination of optimum concentration and uptake of nitrogen at different growth stages in lowland rice. Commun. Soil Sci. Plant Anal. 34, 259–270. doi: 10.1081/CSS-120017430
Farooq, M., Wahid, A., Lee, D. J., Ito, O., Siddique, K. H. M. (2009). Advances in drought resistance of rice. Crit. Rev. Plant Sci. 28, 199–217. doi: 10.1080/07352680902952173
Kato, Y., Kamoshita, A., Yamagishi, J. (2008). Preflowering abortion reduces spikelet number in upland rice (Oryza sativa l.) under water stress. Crop Sci. 48, 2389–2395. doi: 10.2135/cropsci2007.11.0627
Kawagoe, Y., Kubo, A., Satoh, H., Takaiwa, F., Nakamura, Y. (2005). Roles of isoamylase and ADP-glucose pyrophosphorylase in starch granule synthesis in rice endosperm. Plant J. 42, 164–174. doi: 10.1111/j.1365-313X.2005.02367.x
Li, Q. F., Liu, X. Y., Zhang, C. Q., Jiang, L., Jiang, M. Y., Zhong, M., et al. (2018). Rice soluble starch synthase I: allelic variation, expression, function, and interaction with waxy. Front. Plant Sci. 9. doi: 10.3389/fpls.2018.01591
Li, J., Wu, L. M., Foster, R., Ruan, Y. L. (2017). Molecular regulation of sucrose catabolism and sugar transport for development, defence and phloem function. J. Integr. Plant Biol. 59, 322–335. doi: 10.1111/jipb.12539
Liu, H. Y., Hussain, S., Zheng, M. M., Peng, S. B., Huang, J. L., Cui, K. H., et al. (2014a). Dry direct-seeded rice as an alternative to transplanted-flooded rice in central China. Agron. Sustain. Dev. 35, 285–294. doi: 10.1007/s13593-014-0239-0
Liu, L. J., Wang, K. J., Bian, J. L., Xiong, Y. W., Wang, Z. Q., Yang, J. C. (2014b). Effect of alternate wetting and soil drying irrigation during grain filling on the physiological traits and yield of transgenic rice with different protein content in grains. Rice Sci. 28, 384–390. doi: 10.3969/j.issn.1001-7216.2014.04.007
Liu, K., Zhang, H., Zhang, S. F., Wang, Z. Q., Yang, J. C. (2008). Effects of soil moisture and irrigation patterns during grain filling on grain yield and quality of rice and their physiological mechanism. Acta Agron. Sin. 34, 268–276. doi: 10.3321/j.issn:0496-3490.2008.02.015
Mathan, J., Singh, A., Ranjan, A. (2021). Sucrose transport in response to drought and salt stress involves ABA-mediated induction of OsSWEET13 and OsSWEET15 in rice. Physiol. Plant 171, 620–637. doi: 10.1111/ppl.13210
Nakamura, Y., Utsumi, Y., Sawada, T., Aihara, S., Utsumi, C., Yoshida, M., et al. (2010). Characterization of the reactions of starch branching enzymes from rice endosperm. Plant Cell Physiol. 51, 776–794. doi: 10.1093/pcp/pcq035
Pandey, V., Shukla, A. (2015). Acclimation and tolerance strategies of rice under drought stress. Rice Sci. 22, 147–161. doi: 10.1016/j.rsci.2015.04.001
Passioura, J. (2007). The drought environment: physical, biological and agricultural perspectives. J. Exp. Bot. 58, 113–117. doi: 10.1093/jxb/erl212
Rao, G. S., Umair, A., Kong, L. L., Mo, Z. W., Xiao, L. Z., Zhong, K. Y., et al. (2019). Low soil temperature and drought stress conditions at flowering stage affect physiology and pollen traits of rice. J. Integr. Agric. 18, 1859–1870. doi: 10.1016/S2095-3119(18)62067-2
Rehmani, M. I. A., Wei, G. B., Hussain, N., Ding, C. Q., Li, G. H., Liu, Z. H., et al. (2014). Yield and quality responses of two indica rice hybrids to post-anthesis asymmetric day and night open-field warming in lower reaches of Yangtze river delta. Field Crop Res. 156, 231–241. doi: 10.1016/j.fcr.2013.09.019
Roitsch, T. G., Gonzalez, M. C. (2004). Function and regulation of plant invertases: sweet sensations. Trends Plant Sci. 9, 606–613. doi: 10.1016/j.tplants.2004.10.009
Ruan, Y. L. (2014). Sucrose metabolism: gateway to diverse carbon use and sugar signaling. Annu. Rev. Plant Biol. 65, 33–67. doi: 10.1146/annurev-arplant-050213-040251
Shi, H. R., Wang, B., Yang, P. J., Li, Y. B., Miao, F. (2016). Differences in sugar accumulation and mobilization between sequential and non-sequential senescence wheat cultivars under natural and drought conditions. PLoS One 11, e0166155. doi: 10.1371/journal.pone.0166155
Szydlowski, N., Ragel, P., Hennen-Bierwagen, T. A., Planchot, V., Myers, A. M., Merida, A., et al. (2011). Integrated functions among multiple starch synthases determine both amylopectin chain length and branch linkage location in Arabidopsis leaf starch. J. Exp. Bot. 62, 4547–4559. doi: 10.1093/jxb/err172
V, P., Ali, K., Singh, A., Vishwakarma, C., Krishnan, V., Chinnusamy, V., et al. (2019). Starch accumulation in rice grains subjected to drought during grain filling stage. Plant Physiol. Biochem. 142, 440–451. doi: 10.1016/j.plaphy.2019.07.027
V, P., Tyagi, A. (2020). Correlation between expression and activity of ADP glucose pyrophosphorylase and starch synthase and their role in starch accumulation during grain filling under drought stress in rice. Plant Physiol. Biochem. 157, 239–243. doi: 10.1016/j.plaphy.2020.10.018
Wang, X. P. (2020). Effects of drought stress at booting stage on carbon metabolism and yield formation of japonica rice in cold region (Dongbei Agricultural University). Ph D thesis.
Wang, G. Q., Li, H. X., Feng, L., Chen, M. X., Meng, S., Ye, N., et al. (2019). Transcriptomic analysis of grain filling in rice inferior grains under moderate soil drying. J. Exp. Bot. 70, 1597–1611. doi: 10.1093/jxb/erz010
Wang, X. P., Liu, H. L., Zhang, D., Zou, D. T., Wang, J. G., Zheng, H. L., et al. (2022). Photosynthetic carbon fixation and sucrose metabolism supplemented by weighted gene co-expression network analysis in response to water stress in rice with overlapping growth stages. Front. Plant Sci. 13. doi: 10.3389/fpls.2022.864605
Wang, Y. B., Wu, P. T., Engel, B. A., Sun, S. K. (2015b). Comparison of volumetric and stress-weighted water footprint of grain products in China. Ecol. Indic. 48, 324–333. doi: 10.1016/j.ecolind.2014.08.014
Wang, Z. Q., Xu, Y. J., Chen, T. T., Zhang, H., Yang, J. C., Zhang, J. H. (2015a). Abscisic add and the key enzymes and genes in sucrose-to-starch conversion in rice spikelets in response to soil drying during grain filling. Planta. 241, 1091–1107. doi: 10.1007/s00425-015-2245-0
Wang, T., Yuan, S. J., Wang, P., You, C. (2013). Comparison of risk assessment on climatic drought for rice based on two methods in sichuan province. Chin. J. Agrom. 34, 455–461. doi: 10.3969/j.issn.1000-6362.2013.04.012
Wang, G. Q., Zhang, J. H. (2020). Carbohydrate, hormone and enzyme regulations of rice grain filling under post-anthesis soil drying. Environ. Exp. Bot. 178, 104165. doi: 10.1016/j.envexpbot.2020.104165
Wei, X. S., Liang, J. W., Zhang, J. S., Tong, T. Y., Huang, H. H., Mo, Z. W., et al. (2020). Effects of different irrigation methods on yield, quality and water use efficiency of fragrant rice. Acta Agric. Sin. 35, 129–136. doi: 10.7668/hbnxb.20190792
Wu, L. M., Chen, D. W., Lu, L. W., Huang, M., Zhang, Y., Xu, S. H., et al. (2014). Effects of water stress and re-watering at booting and grain filling stages on physiology and yield of guiliangyou 2. J. South. Agric. 45, 955–960. doi: 10.3969/j:issn.2095-1191.2014.6.955
Xu, Y. J., Xu, Y. D., Li, Y. Y., Qian, X. Y., Wang, Z. Q., Yang, J. C. (2018). Effect of alternate wetting and drying irrigation on post-anthesis remobilization of assimilates and grain filling of rice. Acta Agron. Sin. 44, 554–568. doi: 10.3724/SP.J.1006.2018.00554
Yang, W., Peng, S. B., Laza, R. C., Visperas, R. M., Dionisio-Sese, M. L. (2008). Yield gap analysis between dry and wet season rice crop grown under high-yielding management conditions. Agron. J. 100, 1390–1395. doi: 10.2134/agronj2007.0356
Yang, X. L., Wang, B. F., Chen, L., Li, P., Cao, C. G. (2019). The different influences of drought stress at the flowering stage on rice physiological traits, grain yield, and quality. Sci. Rep. 9, 3742. doi: 10.1038/s41598-019-40161-0
Yang, J. C., Yuan, L. M., Tang, C., Wang, Z. Q., Liu, L. J., Zhu, Q. S. (2005). Effect of dry-wet alternate irrigation on rice quality and activities of some enzymes in grains during the filling. Acta Agron. Sin. 31, 1052–1057. doi: 10.3321/j.issn:0496-3490.2005.08.015
Yang, J. C., Zhang, J. H., Wang, Z. Q., Zhu, Q. S., Liu, L. J. (2003). Activities of enzymes involved in sucrose-to-starch metabolism in rice grains subjected to water stress during filling. Field Crop Res. 81, 69–81. doi: 10.1016/S0378-4290(02)00214-9
Yao, L., Zheng, H. B., Liu, J. X., He, H., Huang, H. (2014). Current situation and prospect of rice water-saving irrigation technology in China. Chin. J. Ecol. 33, 1381–1387. doi: 10.13292/j.1000-4890.20140327.060
Ye, Y. S., Liang, X. Q., Chen, Y. X., Liu, J., Gu, J. T., Guo, R., et al. (2013). Alternate wetting and drying irrigation and controlled-release nitrogen fertilizer in late-season rice. effects on dry matter accumulation, yield, water and nitrogen use. Field Crop Res. 144, 212–224. doi: 10.1016/j.fcr.2012.12.003
Zhang, C., Li, X., He, Y. F., Zhang, J. F., Yan, T., Liu, X. L. (2017). Physiological investigation of c-4-phosphoenolpyruvate-carboxylase-introduced rice line shows that sucrose metabolism is involved in the improved drought tolerance. Plant Physiol. Biochem. 115, 328–342. doi: 10.1016/j.plaphy.2017.03.019
Zhang, H., Li, H. W., Yuan, L. M., Wang, Z. Q., Yang, J. C., Zhang, J. H. (2012). Post-anthesis alternate wetting and moderate soil drying enhances activities of key enzymes in sucrose-to-starch conversion in inferior spikelets of rice. J. Exp. Bot. 63, 215–227. doi: 10.1093/jxb/err263
Zhang, H., Zhang, S. F., Yang, J. C., Zhang, J. H., Wang, Z. Q. (2008). Postanthesis moderate wetting drying improves both quality and quantity of rice yield. Agron. J. 100, 726–734. doi: 10.2134/agronj2007.0169
Keywords: rice, water stress, starch synthesis, enzyme activity, yield
Citation: Chen G, Peng L, Gong J, Wang J, Wu C, Sui X, Tian Y, Hu M, Li C, He X, Yang H, Zhang Q, Ouyang Y, Lan Y and Li T (2023) Effects of water stress on starch synthesis and accumulation of two rice cultivars at different growth stages. Front. Plant Sci. 14:1133524. doi: 10.3389/fpls.2023.1133524
Received: 29 December 2022; Accepted: 11 April 2023;
Published: 25 April 2023.
Edited by:
Li-Qing Chen, University of Illinois at Urbana-Champaign, United StatesCopyright © 2023 Chen, Peng, Gong, Wang, Wu, Sui, Tian, Hu, Li, He, Yang, Zhang, Ouyang, Lan and Li. This is an open-access article distributed under the terms of the Creative Commons Attribution License (CC BY). The use, distribution or reproduction in other forums is permitted, provided the original author(s) and the copyright owner(s) are credited and that the original publication in this journal is cited, in accordance with accepted academic practice. No use, distribution or reproduction is permitted which does not comply with these terms.
*Correspondence: Yan Lan, bGFueWFuQHN0dS5zaWNhdS5lZHUuY24=; Tian Li, bGl0QHNpY2F1LmVkdS5jbg==
†These authors have contributed equally to this work and share first authorship