
95% of researchers rate our articles as excellent or good
Learn more about the work of our research integrity team to safeguard the quality of each article we publish.
Find out more
ORIGINAL RESEARCH article
Front. Plant Sci. , 24 March 2023
Sec. Crop and Product Physiology
Volume 14 - 2023 | https://doi.org/10.3389/fpls.2023.1111338
This article is part of the Research Topic Plant Biology for Indoor Vertical Farming: A Multi-Discipline Approach to Controlled Environment Agriculture View all 7 articles
 Kota Saito1
 Eiji Goto1,2*
In a plant factory with artificial light (PFAL), upward lighting is expected to prevent senescence and decrease in the photosynthetic capacity of the lower leaves in the canopy. Upward lighting may also increase the photosynthetic rate of a canopy by improving its photosynthetic photon flux density (PPFD) distribution. However, the net photosynthetic rate (Pn) of leaves is lower when the abaxial surface is irradiated than that when the adaxial surface is irradiated. The aim of this study was to estimate the PPFD in a PFAL and the Pn of plants using three-dimensional plant models and optical simulation. First, we measured the Pn of komatsuna (Brassica rapa L. var. perviridis) leaves under different conditions of the proportion (pad) of PPFD on the adaxial surface to total PPFD on both surfaces and developed an equation for the light response curve of photosynthesis considering pad. When PPFD was low, except when it was 30 and 70 µmol m−2 s−1, Pn increased as pad increased, because the absorptance also increased with pad. Under high PPFD conditions, Pn was maximized at 67–83% of pad because the light would be distributed more efficiently for photosynthesis. Next, using optical simulation and the developed equation, we estimated the photosynthetic rate of a komatsuna canopy (CPn) under downward and upward lighting. The CPn increased by 1.08–1.13 times by combining downward and upward lighting due to the increase in the photosynthetic photon flux (PPF) of light incident on the canopy and the decrease in the spatial variation of PPFD on the leaves in the canopy. As the depreciation of lamps for upward lighting accounts for 7.5–9.0% of the production cost in a PFAL, even if the depreciation of lamps for upward lighting increased, enhancement of CPn by upward lighting would be cost-effective. We performed optical simulations under 220 conditions and evaluated them using CPn as an index. Moreover, we provided the proportion of PPF of upward lighting that improved CPn and discussed the reason for this improvement. The result shows that optical simulation is useful for evaluating the lighting design in a PFAL and analyzing the effects of the lighting design on the light environment and photosynthesis.
Plant factories with artificial light (PFALs) and vertical farms are receiving increasing attention owing to unstable food supplies due to global population growth and climate change, as well as the expectation of high resource-use efficiency and low environmental burden compared to field and greenhouse agriculture (Kozai, 2013; Graamans et al., 2018; Kalantari et al., 2018; Kozai, 2019; Santiteerakul et al., 2020). In a PFAL, environmental factors such as light, temperature, humidity, and CO2 concentration can be controlled without being affected by the external environment, thus allowing us to create a favorable environment for plant growth (Kozai et al., 2006; Goto, 2012; Kalantari et al., 2018; Kozai, 2019). Therefore, stable and rapid plant production as well as better and more uniform product quality can be achieved.
Light is one of the most important environmental factors because it affects photosynthesis and morphogenesis (Kozai and Zhang, 2016). In PFAL, fluorescent lamps and light-emitting diode (LED) lamps are used as light sources. At present, LED lamps are primarily used because of their high controllability of light intensity and light quality and low power consumption. Lamps require electric energy, and the cost of their electric energy accounts for less than 20% of the production costs and 18% of the annual costs (Kozai, 2019; Kozai and Niu, 2020).
Numerous studies have investigated suitable light environments for plant growth and energy-efficient plant production using LED lamps. For example, the growth and energy efficiency of leafy lettuce (Kim et al., 2006; Shimizu et al., 2011; Zhang et al., 2018; Pennisi et al., 2020), basil (Dou et al., 2018; Hosseini et al., 2019; Pennisi et al., 2019; Pennisi et al., 2020), spinach (Zou et al., 2020), and strawberries (Warner et al., 2021) has been studied. Therefore, suitable light environment in a PFAL can improve the growth rate, quality of products, and energy use efficiency during production.
In a PFAL, a high planting density is preferable for increasing the yield per cultivation area and improving light-use efficiency (Yokoi et al., 2008; Kozai and Niu, 2016; Nicole et al., 2016). However, if the planting density is too high, the amount of light received by each plant will be reduced. This can result in undesirable morphologies, such as spindle growth and senescence of the lower leaves in a plant canopy. Furthermore, the photosynthetic capacity of the leaves will be reduced due to low light intensity (Yokoi et al., 2008; Brouwer et al., 2012; Joshi et al., 2017). Therefore, the yield rates decrease, and the burden of pruning increases (Zhang et al., 2015). Here, upward lighting from the bottom of the canopy is expected to prevent the senescence of the lower leaves and the decrease in photosynthetic capacity (Zhang et al., 2015; Joshi et al., 2017; Saengtharatip et al., 2021; Yamori et al., 2021).
The lower leaves receive less light as the leaves in the upper layers of the canopy absorb most of the light radiated on the canopy (Sassenrathcole, 1995; Li et al., 2014). If the photosynthetic characteristics of the leaves in the canopy are uniform, the net photosynthetic rate of the canopy (CPn) is maximized when the vertical distribution of the photosynthetic photon flux densities (PPFDs) in the canopy is uniform. In that case, upward lighting for the uniform vertical distribution of PPFDs in the canopy would increase CPn, even when the photosynthetic photon flux (PPF) emitted from the lamps is the same.
However, when only the abaxial surface of a leaf is irradiated, the net photosynthetic rate (Pn) can be lower than that when only the adaxial surface of a leaf is irradiated, even if the PPFDs on the adaxial and abaxial surfaces are the same. Such phenomena have been reported for soybean (Terashima, 1986), olive (Proietti and Palliotti, 1997), spinach (Sun and Nishio, 2001), European grapes (Palliotti and Cartechini, 2001), rose (Paradiso and Marcelis, 2012), and tobacco (Wang et al., 2020). Furthermore, Pn can be higher when both surfaces of a leaf are simultaneously irradiated compared to when only one surface of a leaf is irradiated, even if the total PPFDs are the same (Proietti and Palliotti, 1997; Palliotti and Cartechini, 2001; Sun and Nishio, 2001). If leaf Pn is varied with the proportion of PPFDs on adaxial and abaxial surfaces, uniformizing the vertical distribution of PPFDs in the canopy by upward lighting may not maximize CPn. Moreover, the effect of upward lighting on the canopy on CPn would vary with the leaf area index (LAI) of the canopy, the PPF of light from whole lamps, and the proportion of the PPFs of the downward and upward lighting.
Through optical simulations, the light environment in a PFAL (Akiyama and Kozai, 2016; Kim et al., 2020; Saito et al., 2020), the Pn of plants (Kim et al., 2020), and the bioactive compound contents of plants (Yoon et al., 2021; Yoon et al., 2022) have been estimated. Optical simulation can be performed by changing the positions, directions, and the spatial light distribution of the lamps. Therefore, the evaluation of various lighting designs using optical simulations is easier and faster than those with manual measurements.
In this study, we aimed to estimate the PPFD in a PFAL and the Pn of plants using three-dimensional plant models and optical simulation. To achieve this, we measured the Pn of komatsuna (Brassica rapa L. var. perviridis) leaves under different conditions of total PPFD and the proportion (pad) of PPFD on the adaxial surface of the leaf to the total PPFD on both surfaces. We then developed a model equation for the light response curve (LRC) of photosynthesis that considers the pad. Next, we performed optical simulations under different conditions of LAI and the PPFs of lamps for downward and upward lighting and estimated the PPFDs on the leaves of a canopy. Subsequently, we evaluated the effect of upward lighting on CPn under various lighting conditions. We also revealed that the Pn of leaves varied with the pad and that upward lighting could enhance CPn.
Komatsuna (Brassica rapa L. var. perviridis ‘F1 Kuroba Pino Green’, Nakahara Seed Product Co. Ltd., Fukuoka, Japan) plant material was used. The cultivation was conducted twice, with 140 komatsuna plants per cultivation and the planting density was 250 m−2.The komatsuna plants were grown in a cultivation room in a closed plant production system at Chiba University. Komatsuna seeds were sown on a paper towel moistened with tap water. Germinated seedlings were placed on a polyurethane mat on the first day after sowing (DAS). Seedlings were irrigated with tap water until 6 DAS. On 7 DAS, komatsuna seedlings were transplanted onto cultivation panels. White LED lamps (XLX460NENT LE9, Panasonic Corporation, Osaka, Japan) with a color temperature of 5000 K were used as the light sources. The spectral distribution of the white LED lamps measured using a spectroradiometer (USR-45, Ushio Inc., Tokyo, Japan) is shown in Figure S1.
The nutrient solution was a 50% dilution of OAT house A recipe (OAT Agrio Co., Ltd., Tokyo, Japan). The nutrient solution contained 43.2, 26.4, 168.2, 80.2, and 18.2 mg L−1 of N, P, K Ca, and Mg, respectively, as well as 2.5 mg L−1 sodium thiosulfate. The electrical conductivity of the nutrient solution was 150–167 mS m−1. The pH was adjusted to 5.5–6.5 using a pH adjuster (OAT Agrio Co., Ltd., Tokyo, Japan). The nutrient solution was aerated during cultivation. PPFD, air temperature, relative humidity, and CO2 concentration were controlled during cultivation. The predetermined values for the environmental parameters during cultivation are shown in Table S2.
Uniformly grown plants were selected from 140 komatsuna plants and used for further experiments. The second and third leaves from the bottom of komatsuna plants on 16 and 18 DAS were used to measure leaf Pn. The second and third leaves from the bottom of plants on 16 DAS and the cotyledons and the first, second, third, fourth, and fifth leaves from the bottom of plants on 18 DAS were used to measure the leaf electron transport rate (ETR). In addition, 18 DAS plants were used to create three-dimensional (3D) models of plants and for leaf area measurements. The light environments in the 18 DAS canopy were estimated using optical simulations.
A LI-6400XT device (LI-COR Inc., NE, USA) with a transparent chamber top (adaxial side) and a transparent chamber bottom (abaxial side; LI-6400-08, LI-COR Inc. Inc., NE, USA) was used to measure the Pn of the leaves. Photographs of the Pn measurement device are shown in Figures 1A, B, and a schematic diagram is shown in Figure 1C. Two dimmable panel-type white LED lamps with a color temperature of 5500 K (ISLM-150X150-WW, CCS Inc., Kyoto, Japan) were used as light sources for the adaxial and abaxial sides of the Pn measurement device. The spectral photon distributions of the panel-type white LED lamps are shown in Figure S2. Glass diffusers (50 × 50 mm UV Fused Silica Ground Glass Optical Diffuser, Edmund Optics Japan, Tokyo, Japan) were used to diffuse light from the white LED lamps. Two-photon sensors (S1787-08, HAMAMATSU PHOTONICS K.K., Shizuoka, Japan) were placed on the abaxial side of the Pn measurement device to measure the PPFD on the abaxial side of a leaf surface. The relationships between the output voltages of the photon sensors and PPFDs were not linear at high PPFD. Therefore, one of the two photon sensors was shaded to allow measurement of a high PPFD (> 700 µmol m−2 s−1). The other sensor was used to measure low PPFD (< 700 µmol m−2 s−1). The relationships between the output voltages of the photon sensors and the PPFDs were determined using a PPFD sensor (LI-190SA, LI-COR Inc. Inc., NE, USA). A PPFD sensor mounted on the adaxial side of the Pn measurement device was used to measure the PPFD on the adaxial side of the leaf surface.
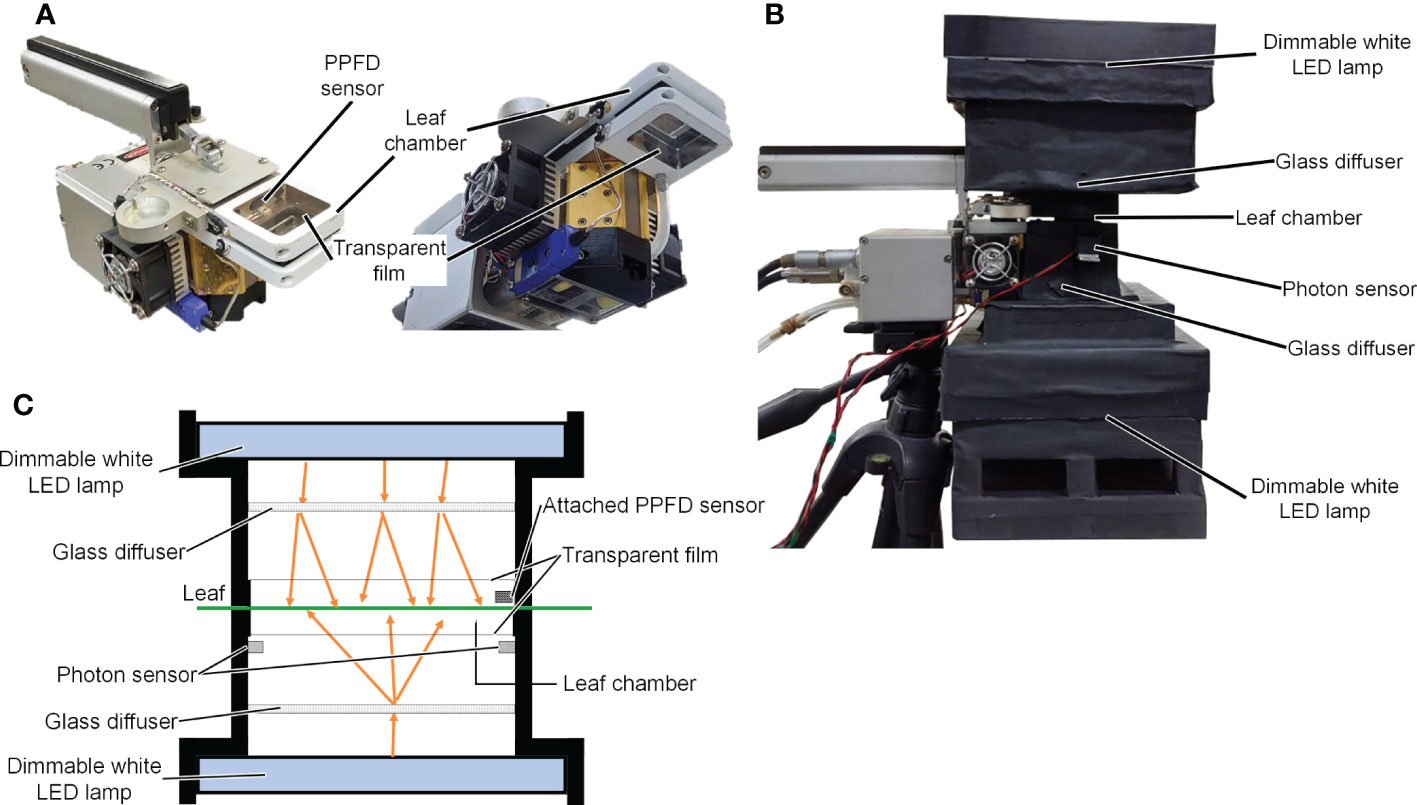
Figure 1 Images of LI-6400XT (LI-COR Inc.) with the transparent chamber (A) and the net photosynthetic rate measurement device (B). Schematic diagram of the net photosynthetic rate measurement device (C).
During the Pn measurement, air temperature, relative humidity, CO2 concentration, and wind velocity in the leaf chamber were 25°C, 67–73%, 1000 µmol mol−1, and 0.34 m s−1, respectively.
The PPFD on a leaf was defined as follows:
where E (µmol m−2 s−1) was the total PPFD of light incident on both the adaxial and abaxial surfaces of the leaf; Ead and Eab (µmol m−2 s−1) were the PPFDs of light incident on the adaxial and abaxial surfaces of the leaf, respectively; and pad (%) is the proportion of Ead to E.
Pns were measured at 0, 30, 70, 150, 240, 330, 470, 700, 1100, and 1900 µmol m−2 s−1 of E. In addition, for each E level, pad values were set at 1, 17, 33, 50, 67, 83, and 100%. However, for the third leaf of 16 DAS, Pns were measured at 120 and 170 µmol m−2 s−1 of E as well. After changing E or pad and once the Pn became stable, the infra-red gas analyzers were matched and then logging was started. The data were logged at 1 s intervals for 60 s, and the average value of the data was used as the measured Pn. A new plant was used for each condition of PPFD, DAS, and leaf position. In total 94 plants were used for Pn measurement.
The LRC of photosynthesis can be approximated using a non-rectangular hyperbola (Ögren and Evans, 1993). The equation for the non-rectangular hyperbola is as follows:
where Pn(E) (μmol m−2 s−1) is the Pn of a leaf irradiated with E μmol m−2 s−1, Pg(E) (μmol m−2 s−1) is the gross photosynthetic rate (Pg) of a leaf irradiated with E μmol m−2 s−1, φP is the initial slope of the LRC, Pmax (μmol m−2 s−1) is the maximum value of the LRC, θP is the convexity of the LRC, and Rd (< 0) (μmol m−2 s−1) is the dark respiration rate.
The parameters of LRC (φP, Pmax, and θP) were calculated from the measured Pn for each DAS (16 and 18 DAS), leaf position (second and third leaves), and pad (1, 17, 33, 50, 67, 83, and 100%). The average Pn at 0 μmol m−2 s−1 of E was used as the Rd value. Some studies have shown the values of Pmax with irradiation to adaxial or abaxial surface were different (Wang et al., 2020). On the other hand, other studies have reported that when the photosynthesis of leaves was light-saturated, the Pns were similar regardless of whether the adaxial or abaxial surfaces were irradiated (Terashima, 1986; Palliotti and Cartechini, 2001). Therefore, the Pmax values were assumed to be the same for the same DAS and leaf position regardless of the pad values. When fitting the curves using the least-squares method, the variance of the error was not uniform, and the curve was fitted using the generalized least-squares method. The generalized least-squares method was based on the method of Carroll and Ruppert (1982), and the weight function was the inverse of the square of Pg(E). The generalized least-squares method was performed using the solver of Microsoft Excel (Microsoft Corporation, WA, USA). The obtained φP and θP values are shown in Figures 2A, B. The Pmax values were 53.7 and 52.5 μmol m−2 s−1 for the second and third leaves of 16 DAS and 50.2 and 53.7 μmol m−2 s−1 for the second and third leaves of 18 DAS, respectively.
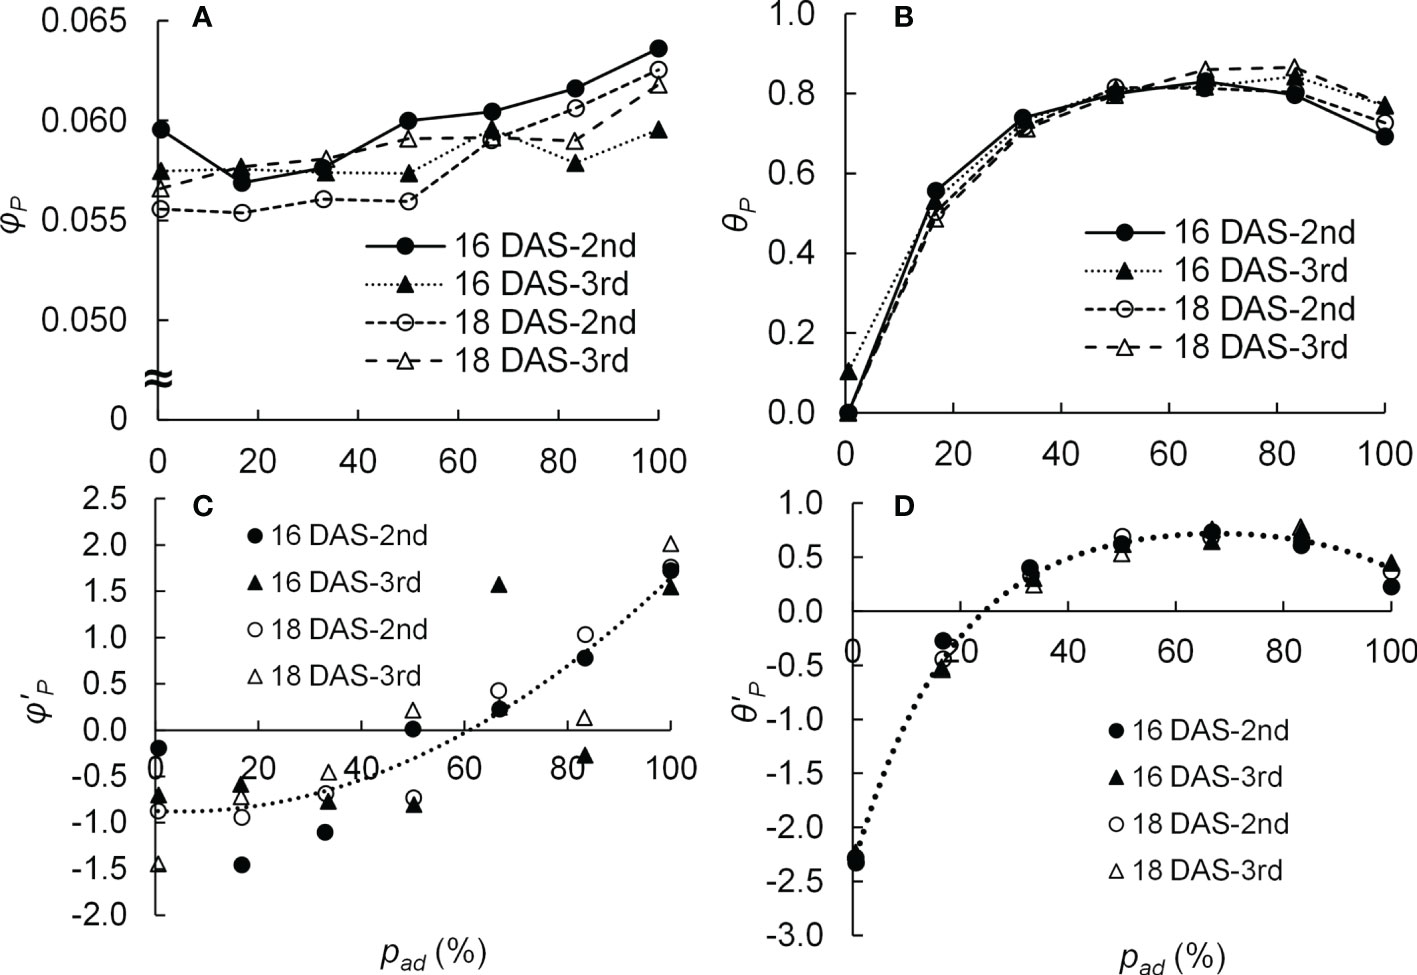
Figure 2 Relationship between the proportion (pad) of photosynthetic photon flux density (PPFD) on the adaxial surface of a leaf to the total PPFD on both surfaces of a leaf and the initial slope (φP) (A) as well as the convexity (θP) (B) of the light response curve of photosynthesis of the 2nd and 3rd leaves of komatsuna sixteen and eighteen days after sowing (16 DAS and 18 DAS, respectively) (n = 21–26). The relationship between pad and the z-score of the initial slope (φ’P) (C) as well as the z-score of the convexity (θ’P) (D) of the light response curve of photosynthesis of 2nd and 3rd leaves of komatsuna 16 DAS and 18 DAS (n = 21–26). φ’P and θ’P were calculated from φP and θP values at each DAS and leaf position (2nd or 3rd). The dotted lines in (C, D) were calculated using Eq. (4) and Eq. (5), respectively.
The φP and θP obtained in Section 2.3.1 were standardized as φ’P and θ’P with respect to DAS and leaf position. The relationships between pad and φ’P and between pad and θ’P were assumed based on the relationships between pad and φP and between pad and θP (Figures 2A, B).
where a1, a2, a3, b1, b2, b3, b4, b5, b6, and b7 are parameters of the equations. The parameters of the equations were obtained using the least-squares method. The obtained values of a1, a2, a3, b1, b2, b3, b4, b5, b6, and b7 were −0.87, −0.026, 0.00028, −226, 267, 2.4, 0.0054, −98, 0.0017, and −5.7, respectively. The relationships between pad and φ’P and between pad and θ’P in Equations (4) and (5), respectively, are shown in Figures 2C, D.
Suppose that the increasing or decreasing trends of φP and θP with respect to pad are equal to those of φ’P and θ’P with respect to pad, regardless of DAS and leaf position. In this case, once the parameters of the LRC of photosynthesis at two pad conditions (e.g., pad = 0, 100%) can be obtained, the parameters of the LRC for arbitrary DAS and leaf position can be calculated. Then, the Pns for arbitrary pad conditions can be calculated. Here, φP was defined as follows:
where c1 and c2 are the parameters determined for each DAS and the leaf position, respectively. φP;ab and φ’P;ab are the values of φP and φ’P when pad is 0% and φP;ad and φ’P;ad are the values of φP and φ’P when the pad is 100%. θP values were obtained in the same manner.
Five parameters, φP;ad, φP;ab, Pmax, θP;ad, and θP;ab, were determined for the second and third komatsuna leaves at 18 DAS using the generalized least squares method. Rd values were the average values of Pns under conditions of 0 μmol m−2 s−1 of E. Thus, LRCs considering pad were obtained for the second and third komatsuna leaves at 18 DAS. The measured Pns and LRC values calculated using this method are shown in Figure 3. The accuracy of Pns calculated using this method is presented in Table S3.
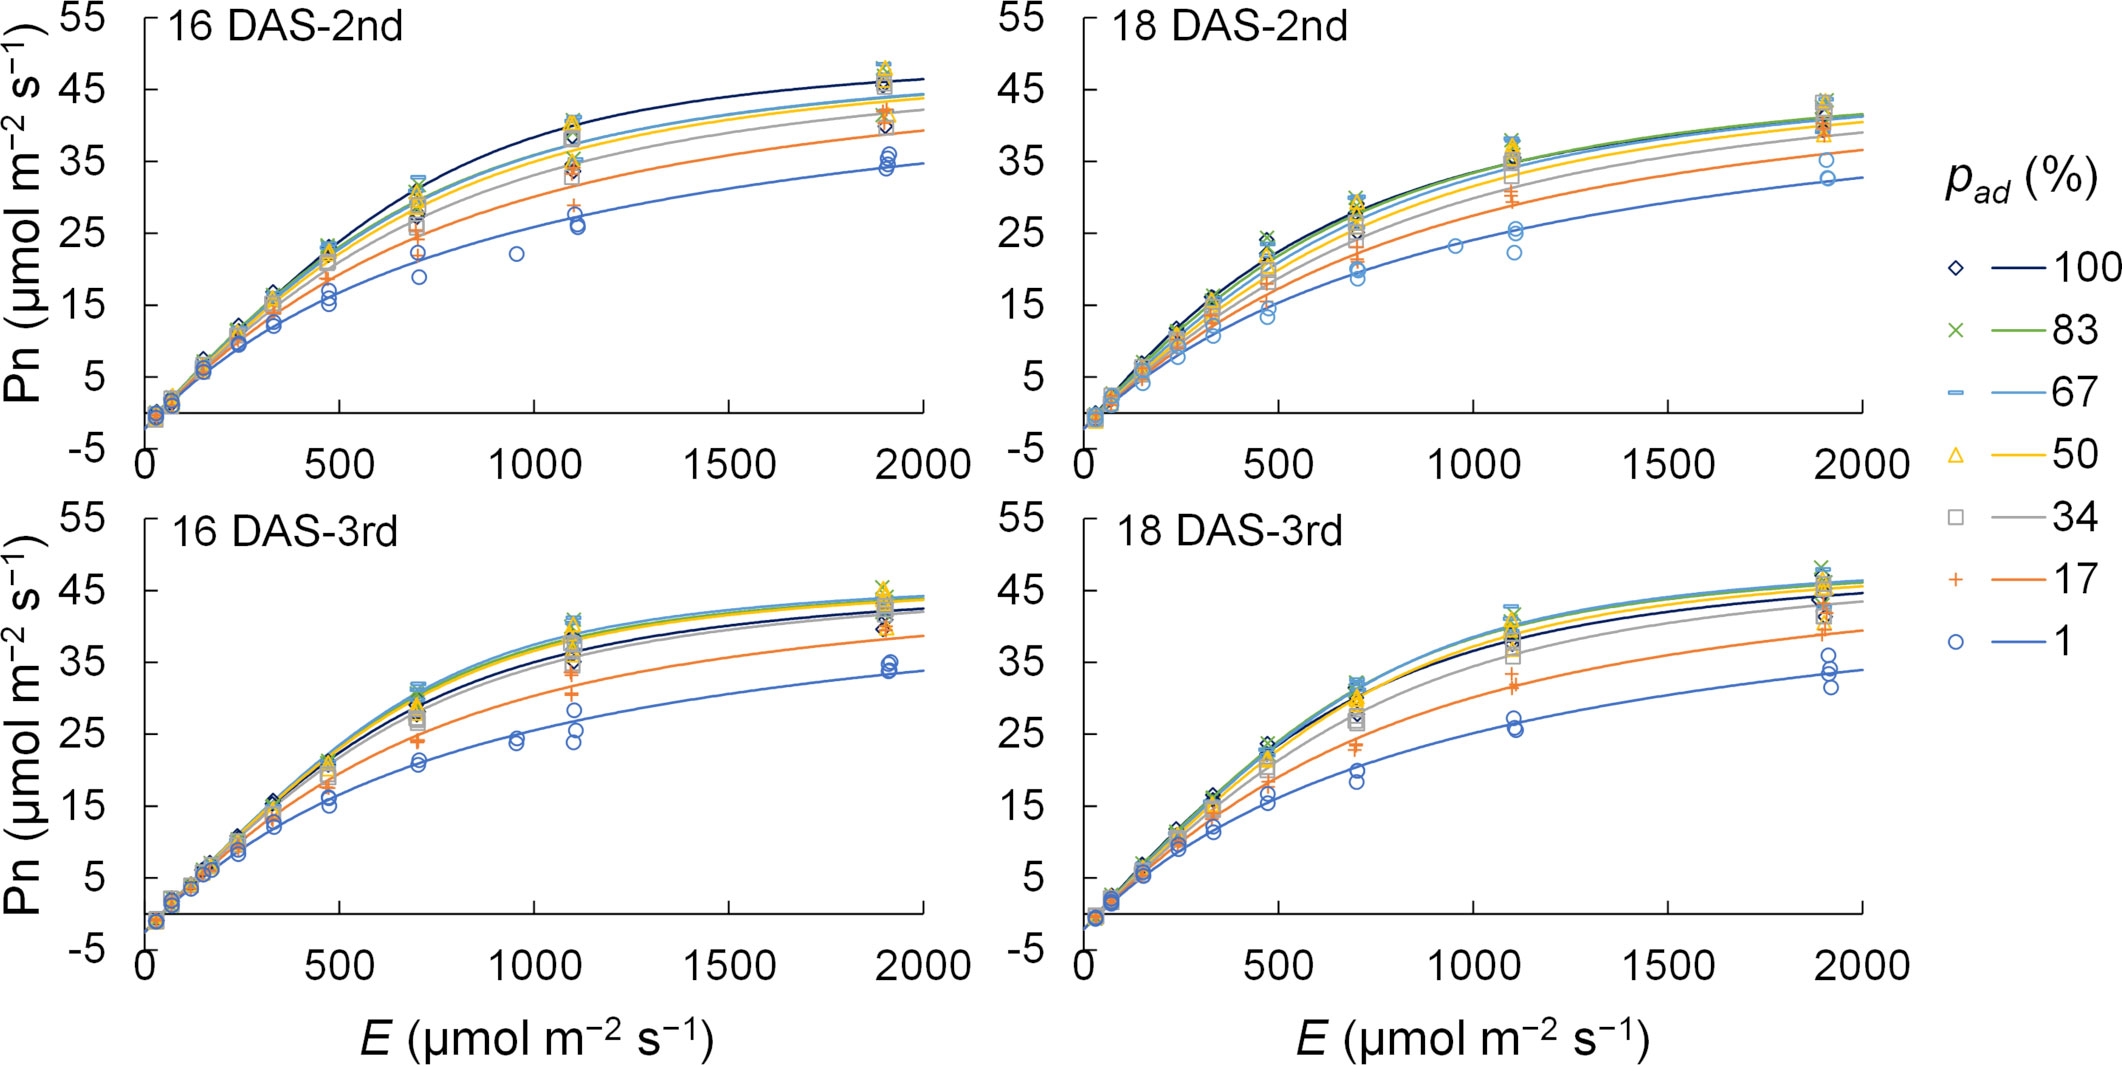
Figure 3 The measured (n = 148–178) and calculated values of net photosynthetic rate (Pn) of the 2nd and 3rd leaves of komatsuna 16 DAS and 18 DAS. E and pad indicate the total photosynthetic photon flux density (PPFD) on the adaxial and abaxial surfaces of a leaf and the proportion of PPFD on the adaxial surface of a leaf to E, respectively. The light response curves of photosynthesis were obtained by the methods detailed in Section 2.3.2.
A linear or curvilinear relationship exists between Pn and the ETR (Harbinson et al., 1990; Öquist and Chow, 1992; Yin et al., 2009). Therefore, the relationships between Pg and ETR at leaf positions where the Pns can be measured were determined, and the relationship was used to estimate the Pns from ETRs in those leaves. The chlorophyll fluorescence of komatsuna leaves was measured using a chlorophyll fluorescence measuring system (MINI-PAM; Heinz Walz GmbH, Baden-Württemberg, Germany). ETR (J; µmol m−2 s−1) was calculated using the equation described by Genty et al. (1989). The relationship between the ETR and Pg is shown in Figure 4. After Pn was calculated from the ETR by considering Rd, the LRC was obtained using the method described in Section 2.3.2. The Rd values were the average respiration rates of the second and third leaves at 16 and 18 DAS, respectively.
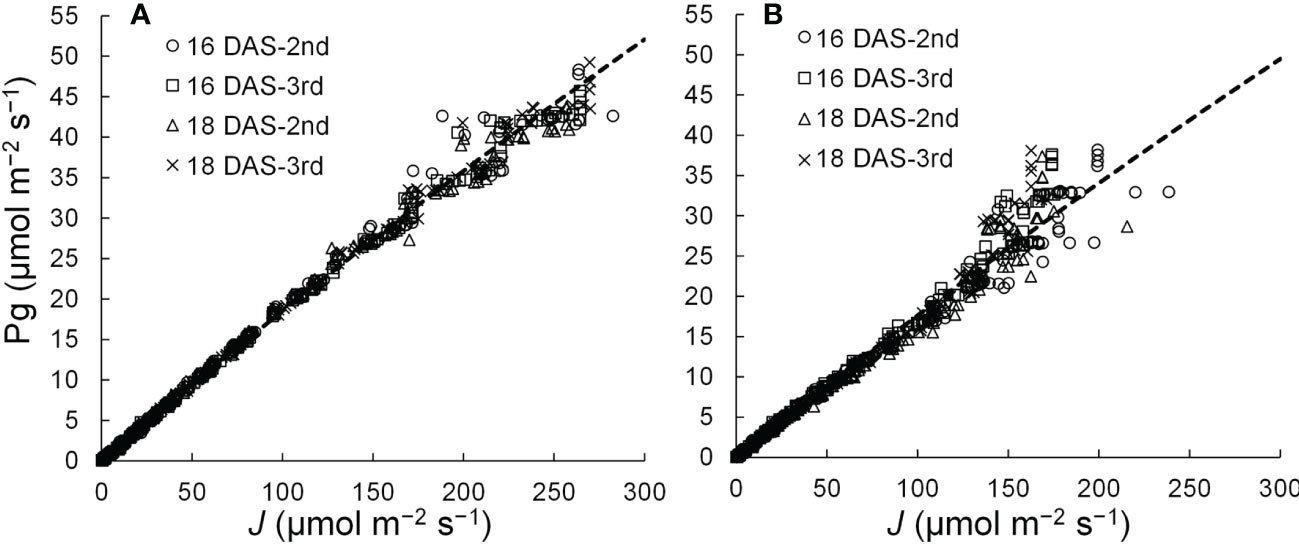
Figure 4 Relationships between the electron transport rates (J) and gross photosynthetic rates (Pg) of adaxial (A) and abaxial (B) surfaces of the 2nd and 3rd leaf of komatsuna 16 DAS and 18 DAS (n = 663–666).
To estimate the CPn using optical simulation, it was necessary to create a cultivation system and lamps in optical simulation software (Radiance, Lawrence Berkeley National Laboratory, CA, USA; Ward, 1994), and to create 3D models of komatsuna plants using 3D modeling software (SketchUp 2017, Trimble Inc., CO, USA).
A ray tracing software program, called Radiance (Berkeley Lab., CA, USA) was used to perform the optical simulation. The accuracy of the estimated PPFDs on a cultivation panel surface in a PFAL has been confirmed in our previous studies, where the mean absolute percentage error was found to be 4.50% (Saito et al., 2020). This was done by using this simulation software.
The cultivation system was created using Radiance functions, with the dimensions shown in Figure 5 (125 cm D, 125 cm W, and 10 cm H), and was placed at the center of the floor. Virtual mirror-like surfaces, which were perfect specular reflectors, were placed 1.35 cm apart from the four sides of the floor, and it was surrounded by mirror-like surfaces. In this way, light coming from neighboring cultivation systems with the same design as a commercial PFAL could be reproduced. The lamps were 1.22 m in length and 0.03 m in width. The intervals between lamps were assumed to be equal to the planting distance. Lamps for upward lighting were assumed to be installed on the cultivation panel and placed at equal distances from neighboring plants (Figure 5B). Lamps for downward lighting were assumed to be placed exactly above lamps for upward lighting at a height of 0.3 m from the cultivation panel (Figure 5B). The lamps for downward lighting were placed approximately 0.2 m above the plant canopy. The spatial light distributions of the lamps were set to irradiate the canopy uniformly (Figure 6) and are given by the following equations:
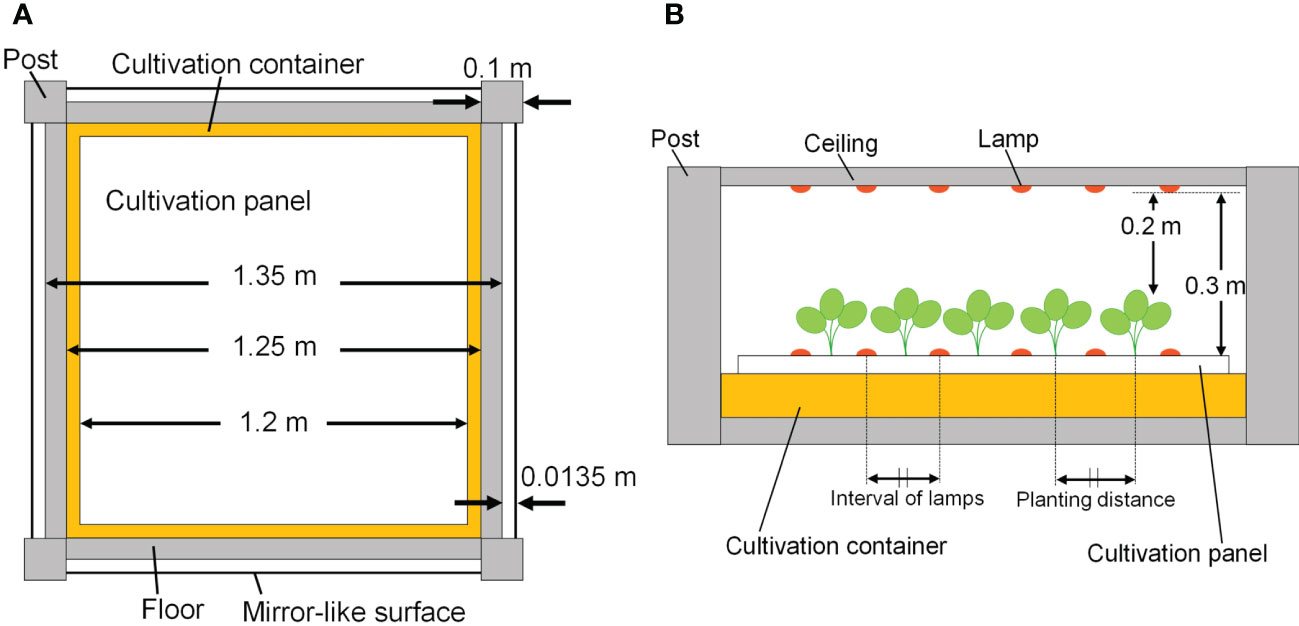
Figure 5 The top view of the cultivation system (A) and side elevation with lamps and plants (B).
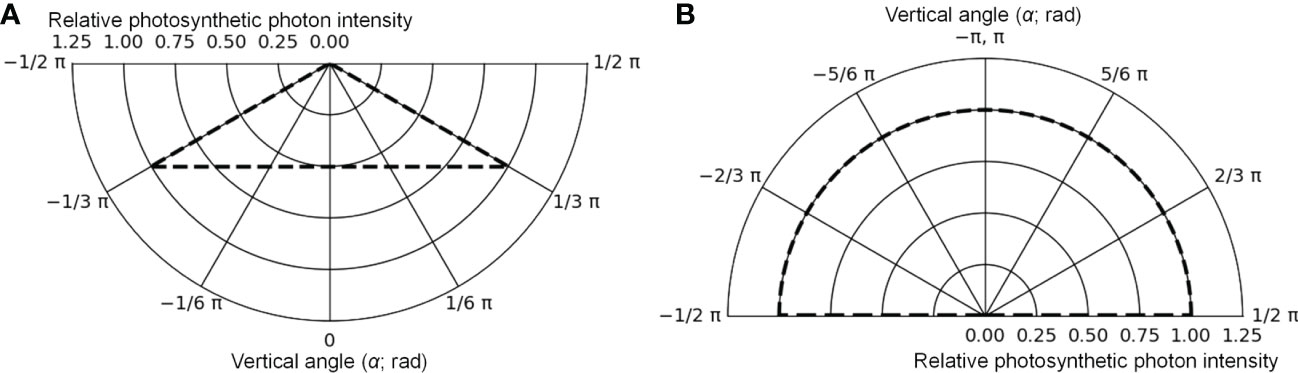
Figure 6 The photometric curves of lamps for downward lighting (A) and for upward lighting (B) in the optical simulation. The maximum values were converted to 1.
where Idw(α) (μmol s−1 sr−1) was the photosynthetic photon intensity (PPI) at α (rad) of the vertical angle to the emitting surface of the lamp for downward (dw) lighting and Iuw(α) (μmol s−1 sr−1) was the PPI at α (rad) of the vertical angle to the emitting surface of the lamp for upward (uw) lighting. For horizontal angles to the emitting surface of the lamp, Idw(α) and Iuw(α) were assumed to remain consistent. Idw(0) and Iuw(π) values were determined using the PPFs of the lamps. The spectral distributions of the lamps were assumed to correspond to those of the lamps used for cultivation (Figure S1). Because Radiance simulates three types of light, R, G, and B, the photon flux ratios of light at 400–500, 500–600, and 600–700 nm wavelengths were input into the channels of B, G, and R, respectively, based on the spectral distributions of the lamps.
The optical properties of the komatsuna plants and the structures of the cultivation system could be input into the Radiance simulation. The optical properties of an object can be input into each RGB channel. A reflection sheet (FEB#110; Yupo Corporation, Tokyo, Japan) was attached to the ceiling of the cultivation system. The spectral distributions of reflection and transmission of the leaves, reflection sheet, and cultivation panel were measured using a UV-Vis-NIR spectrophotometer (V-750; JASCO Corporation, Tokyo, Japan) equipped with an integrating sphere unit (ISV-922; JASCO Corporation, Tokyo, Japan). Because the reflectance of the container, the post of the cultivation system, and the petiole could not be measured, the reflectance in the Radiance simulation was obtained using Colour Picker, which could calculate the reflectance from the appearance of the color. The optical properties of the objects used in the simulations are presented in Table 1.
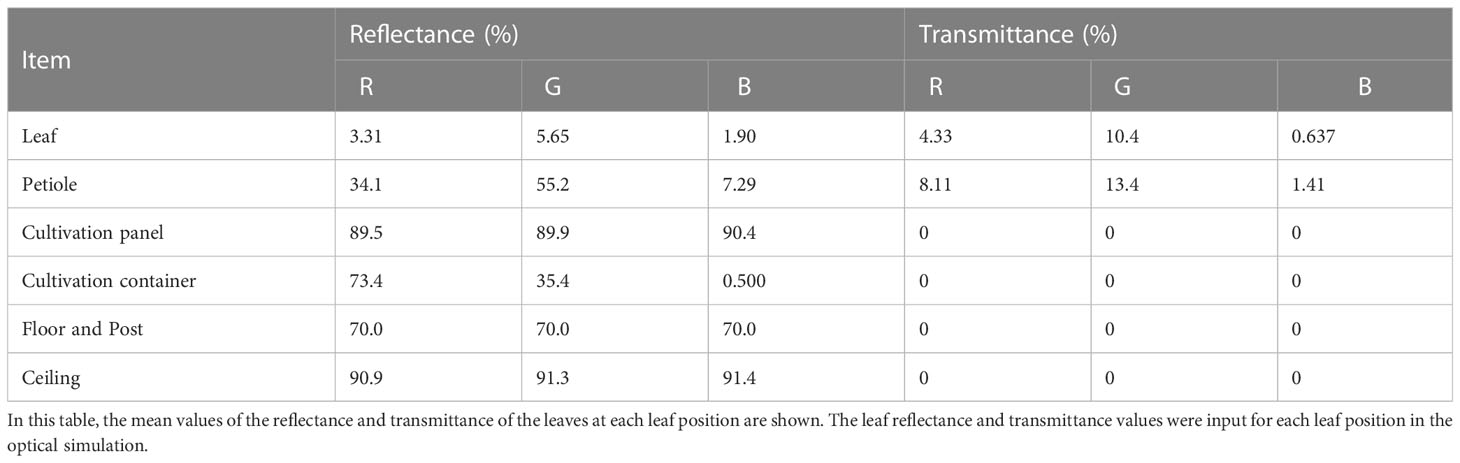
Table 1 The optical properties of items in the optical simulation.
The 3D models of komatsuna plants at 18 DAS were created using the Structure from Motion method (Figure 7).
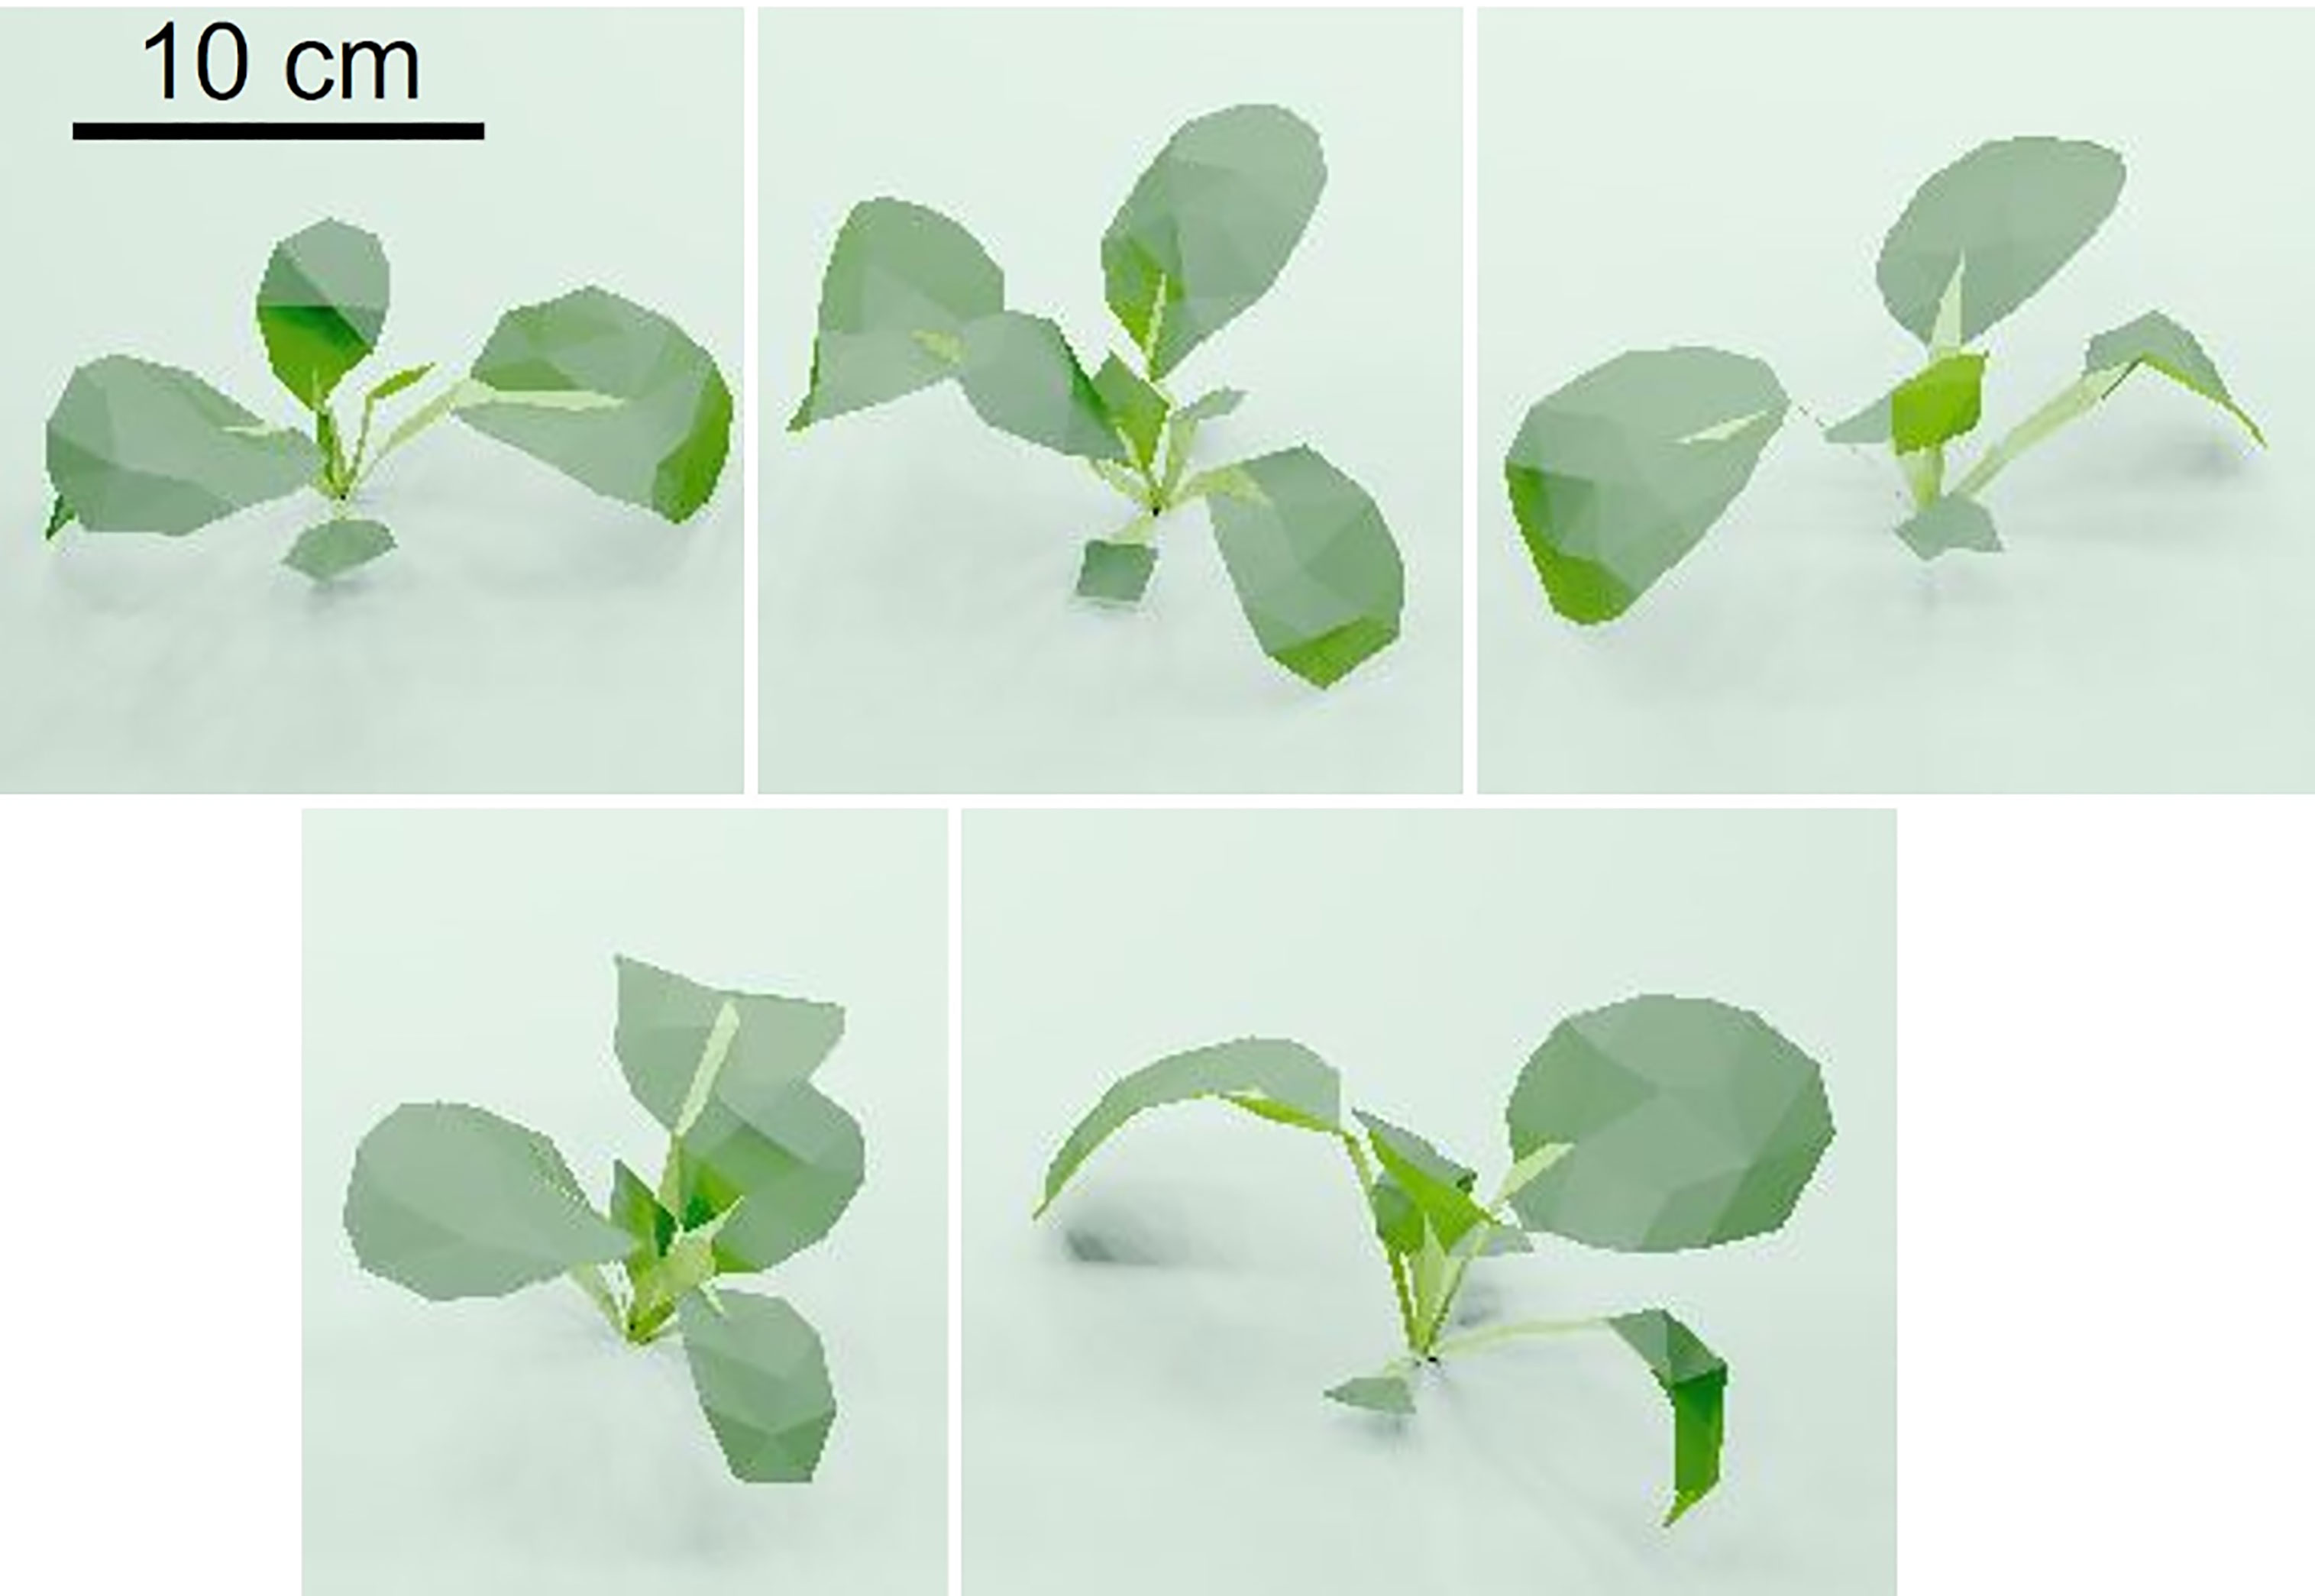
Figure 7 Images of five komatsuna three dimensional models used in the optical simulation by Radiance.
The point cloud data obtained with Metashape (Agisoft, St. Petersburg, Russia) include the X, Y, and Z coordinates of the points, color information (RGB color model), and the X, Y, and Z components of the normal to the points. Videos were captured using a smartphone camera to obtain images of the plants. The videos had a pixel count of 1920 × 1080 and 30 frames. Four markers were placed around the plant during video capture and used to calibrate the distance scale of the point cloud. The videos were imported into Metashape, and approximately 1000 images were created. Using the images, first, the processed point cloud data of the plants were obtained.
Next, the points of the leaf blade were extracted by manual work and logistic regression analysis from the first processed point cloud data. The point cloud of the leaf blade was converted into a mesh model using Poisson Surface Reconstruction (Kazhdan et al., 2006), a function of CloudCompare (Électricité de France, 8th Arrondissement of Paris, France). In this process, the areas of the mesh model of individual plants were set to 90–110% of the leaf areas of individual plants measured using a leaf area meter (LI-3100, LI-COR Inc., NE, USA). The number of triangles for the leaf blade models of the individual plants was set to 100 to reduce the computation volume.
Petiole mesh models were created using SketchUp 2017. The leaf blade mesh models created in 2.4.2.1 were imported into SketchUp 2017. The 3D models of the leaf blades and petioles created as described above were converted into a usable file in Radiance (.rad) using su2rad, which is a function of SketchUp 2017. Five rad files were created as 3D models of five komatsuna plants (Figure 7). The komatsuna 3D models recorded in these files were placed in a cultivation system using xform, a function in Radiance.
In the optical simulation, the PPFDs of the centers of gravity of all triangles comprising the leaf blade models were estimated. For each triangle, the estimated PPFDs were input into Equations (1)–(3) to obtain Pn at the center of gravity of the triangles. The Pn per triangle can be obtained by multiplying Pn by the area of a triangle. This calculation was performed for all triangles comprising the all-leaf blade models, and the values were summed to obtain CPn.
Optical simulations were performed under conditions with different LAI and PPFs of the lamps for downward and upward lighting. The lamps’ total PPF for downward and upward lighting was defined as Φlamps (μmol s−1), and the proportion of PPF of the lamps for downward lighting to Φlamps was defined as pdw (%).
LAI was set at five levels (0.5, 1.5, 2.5, 3.5, and 4.5), Φlamps was set at four levels (122, 244, 366, and 488 µmol s−1), and pdw was set at 11 levels (0, 10, 20, 30, 40, 50, 60, 70, 80, 90, and 100%). In total, 220 simulations were conducted. When Φlamps was 122 µmol s−1, the estimated average PPFD on the leaves of the komatsuna canopy with 1.0 of LAI was approximately 100 µmol m−2 s−1. The planting distance was calculated to achieve the intended LAI because the average leaf area of the 18 DAS komatsuna plants was 110.2 cm2. The 3D models were placed on the cultivation system using xform, a function of Radiance, to set the intended planting distance. The PPF per lamp was calculated from Φlamps, the number of lamps used in each LAI condition, and pdw.
The relationship between pad and the Pn of a komatsuna leaf at 16 DAS and 18 DAS is shown in Figure 8A. The variation in Pn with pad tended to increase as the PPFD increased for all DAS and leaf positions. To analyze the relationship between pad and Pn in detail, normalized Pn values with respect to the PPFD level were calculated, as shown in Figure 8B. The Pn increased with the pad when E was 150–330 μmol m−2 s−1, and the Pn tended to be the maximum at 67–83% of the pad when E was 470 μmol m−2 s−1 or larger. Under the conditions with 30 and 70 μmol m−2 s−1 of E, no trend concerning the pad was observed.
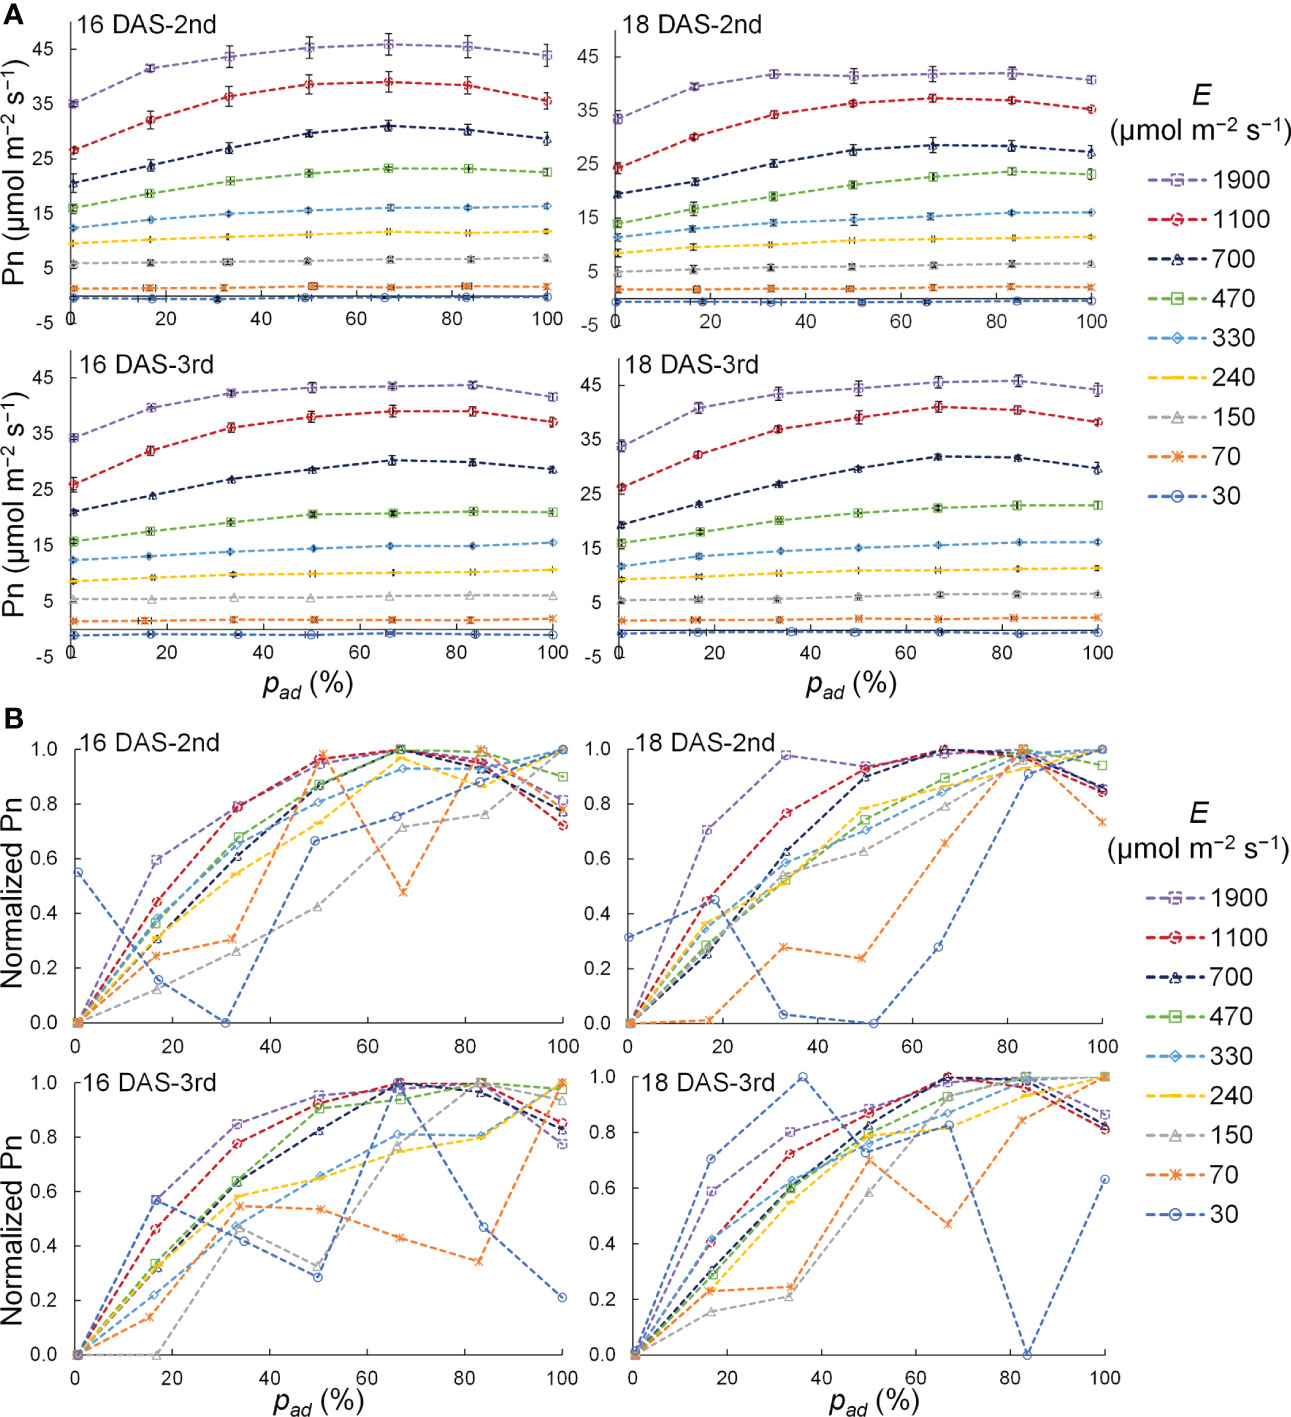
Figure 8 Relationship between the proportion (pad) of the photosynthetic photon flux density (PPFD) on a leaf adaxial surface to the total PPFD on the adaxial and abaxial surfaces of a leaf (E) and net photosynthetic rate (Pn) (A) as well as normalized Pn (B) of the 2nd and 3rd leaves of komatsuna 16 DAS and 18 DAS with different E. In (A), these plots represent the average values, and the horizontal and vertical lines represent standard error at each condition (n = 2–5). In (B), the plots represent the normalized values that were calculated by normalizing the Pn values at each E condition.
The optical simulation took the reflections of light on the komatsuna leaves and the surfaces of the cultivation system, the transmission of light on the leaves, and the incidence of light on both the adaxial and abaxial surfaces of all leaves within the canopy, into account. These phenomena occur in an actual PFAL. Moreover, Pn of all leaves could be estimated considering pad using an optical simulation.
The relationships between pdw and CPn under different LAI and Φlamps levels are shown in Figure 9. Figure 9A shows the relationship between pdw and CPn under different Φlamps conditions for the same LAI, and Figure 9B shows the relationship between pdw and CPn under different LAI conditions for the same Φlamps. When the LAI was 0.5–3.5, the CPn was positive in every condition. However, when the LAI was 4.5 and Φlamps was 122 or 244 µmol s−1, some conditions resulted in negative CPn due to excess LAI.
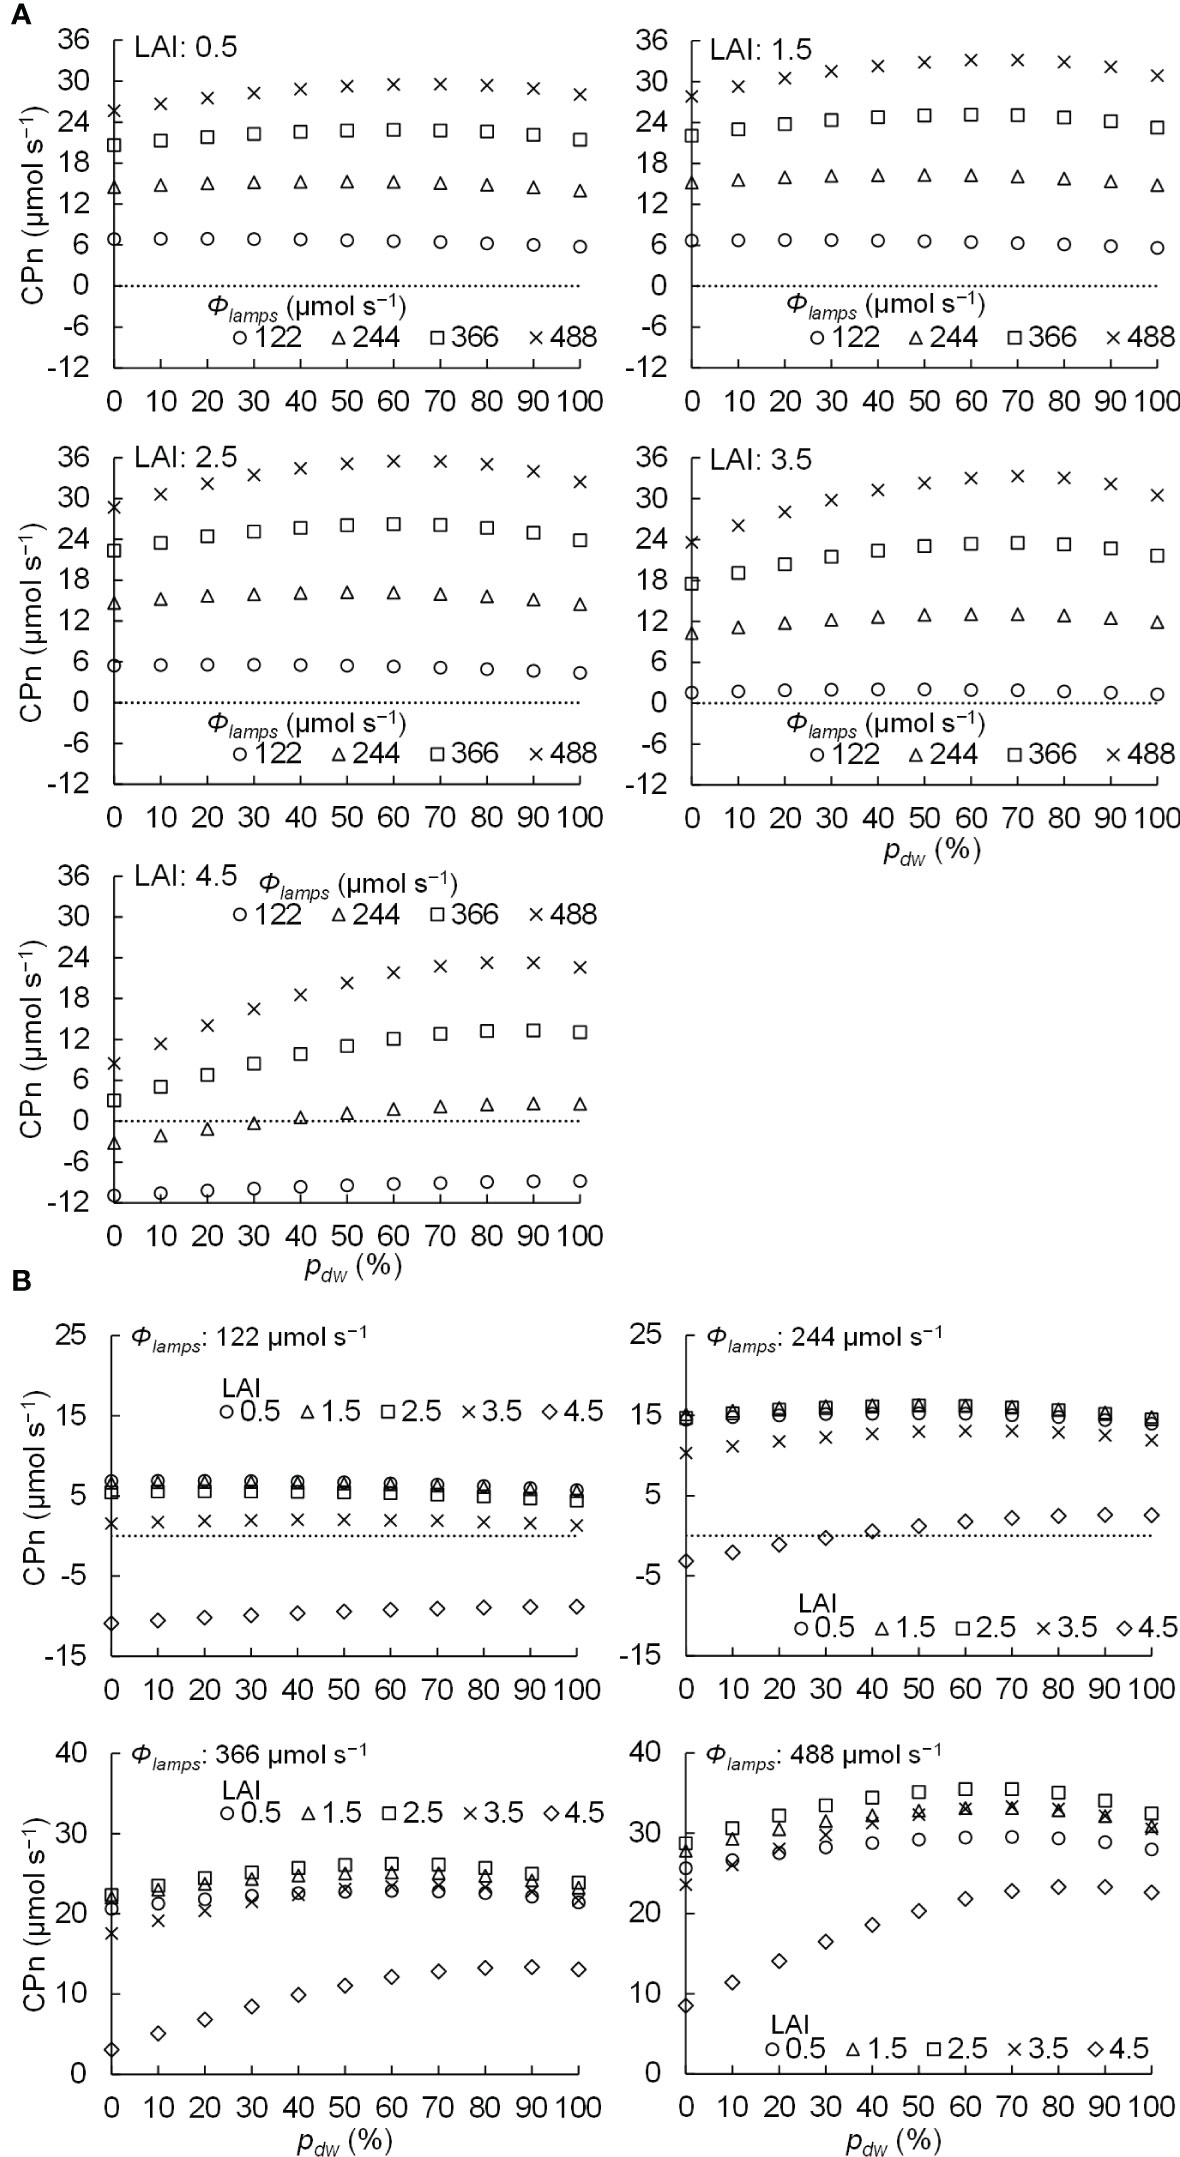
Figure 9 Relationship between the proportion (pdw) of the photosynthetic photon flux of lamps for downward lighting to that of whole lamps for downward and upward lighting (Φlamps) and the net photosynthetic rates of the komatsuna canopy (CPn) in different conditions of leaf area index (LAI) (A) and Φlamps (B).
The PPF of light incident on the komatsuna canopy was defined as Φleaves, and the standard deviation of the estimated PPFD on komatsuna leaves was defined as SDE. SDE is an index of variation in PPFD within a canopy. A smaller value indicates greater uniformity in the vertical distribution of PPFD within the canopy. If the photosynthetic characteristics of the leaves in the canopy are uniform and Φleaves values are equal, the smaller the SDE, the larger the CPn. The relationships between pdw and the normalized Φleaves with respect to each level of LAI and Φlamps, as well as the normalized SDE with respect to each level of LAI and Φlamps, are shown in Figure 10.
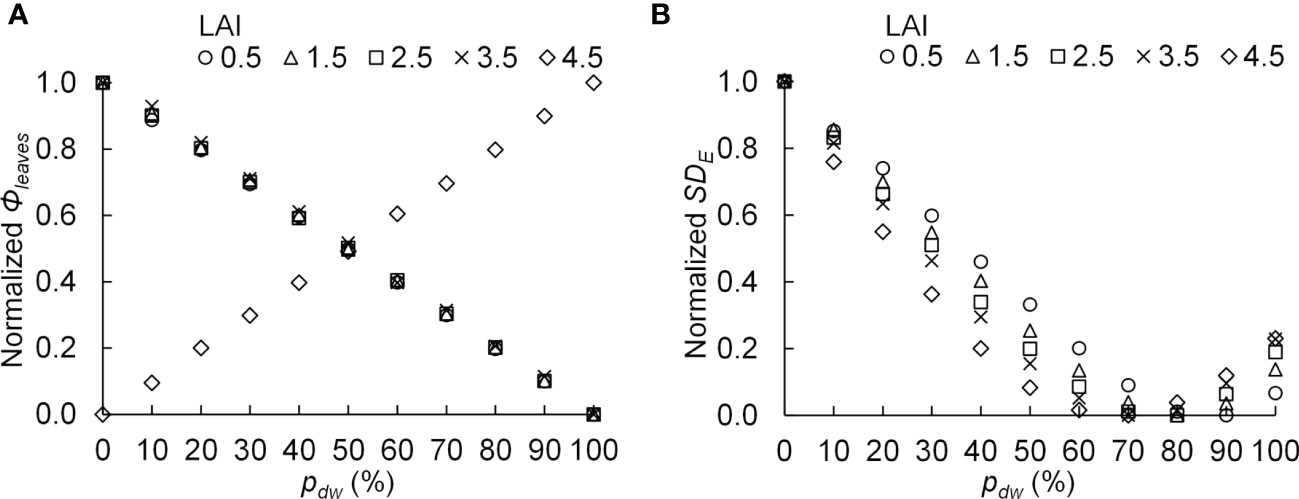
Figure 10 The relationship between the proportion (pdw) of the photosynthetic photon flux of lamps for downward lighting to that of whole lamps for downward and upward lighting and the normalized photosynthetic photon flux incident on the komatsuna canopy (normalized Φleaves) (A), as well as the normalized standard deviation of the photosynthetic photon flux density on komatsuna leaves within the canopy (normalized SDE) (B). The average values of normalized values were calculated for each leaf area index (LAI) condition.
Table 2 shows the pdw values that maximized the CPn at each level of LAI and Φlamps. It also shows the ratios of the gross photosynthetic rates of the canopies in the conditions to those in the only downward lighting condition (pdw = 100 %). From Table 2 and Figure 9A, at 0.5–2.5 of LAI and 122 µmol s−1 of Φlamps, the CPn values were at its maximum when pdw was 20% and decreased as pdw increased. At 0.5–3.5 of LAI and 244, 366, and 488 µmol s−1 of Φlamps, the CPn values were at its maximum when pdw was 50–70%, and decreased as pdw increased or decreased away from those values. Furthermore, the values of pdw, at which the CPn was at its maximum, was the same or greater under the conditions with 3.5 and 4.5 of LAI in comparison to 0.5–2.5 of LAI. As shown in Figure 9B, under any LAI condition, the higher the Φlamps, the higher the variation in CPn, depending on the pdw.
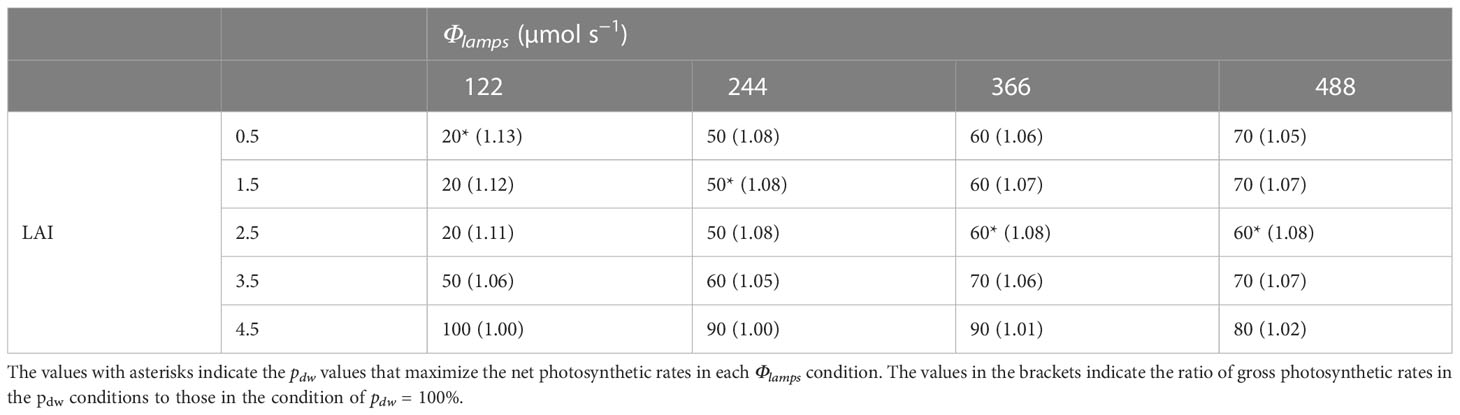
Table 2 The proportion (pdw; %) of the photosynthetic photon flux of lamps for downward lighting to that of whole lamps for downward and upward lighting (Φlamps) that maximize the net photosynthetic rates of the komatsuna canopy in each condition of the leaf area index (LAI) and Φlamps.
At 0.5–3.5 of LAI, the Φleaves became smaller as pdw increased, whereas under 4.5 of LAI, the Φleaves increased as pdw increased (Figure 10A). The relationships between pdw and SDE were similar for all LAI conditions, and the values of SDE were the smallest under the conditions with 70–90% of pdw (Figure 10B).
Pn varied with pad when E was constant, except for conditions with 30 and 70 μmol m−2 s−1 of E. Previous studies have shown similar trends in Pn with irradiation on the adaxial, abaxial, and both surfaces of a leaf. For example, even if the PPFDs were the same, Pn was higher when only the adaxial surface of a leaf was irradiated than when only the abaxial surface of a leaf was irradiated (Terashima, 1986; Paradiso and Marcelis, 2012; Wang et al., 2020). Furthermore, Pn was higher when both the adaxial and abaxial leaf surfaces were irradiated simultaneously than when only the adaxial surface of a leaf was irradiated, even if the total PPFDs on both surfaces were the same (Palliotti and Cartechini, 2001; Sun and Nishio, 2001). When E was 30 and 70 μmol m−2 s−1, Pn was small; thus, accidental errors were large relative to the measured values. Therefore, no trends were observed in the Pn depending on pad. When E was greater than 70 μmol m−2 s−1, Pn varied with pad. This may be due to the differences in the optical properties of the adaxial and abaxial surfaces of the leaf, the degree of attenuation within the leaf of light incident from the adaxial and abaxial surfaces, and the gradients in the photosynthetic capacity of chloroplasts within the leaf. In the following section, we discuss the possible reasons for these differences in detail.
By using the spectral distributions of photons from the lamps and the absorptance of a leaf in Figures 3 and 11, the absorptances, when the light was incident from the adaxial or abaxial surface of the leaf, were calculated every 1 nm. The average absorptance (400–700 nm) of the abaxial surface was approximately 93% of that of the adaxial surface.
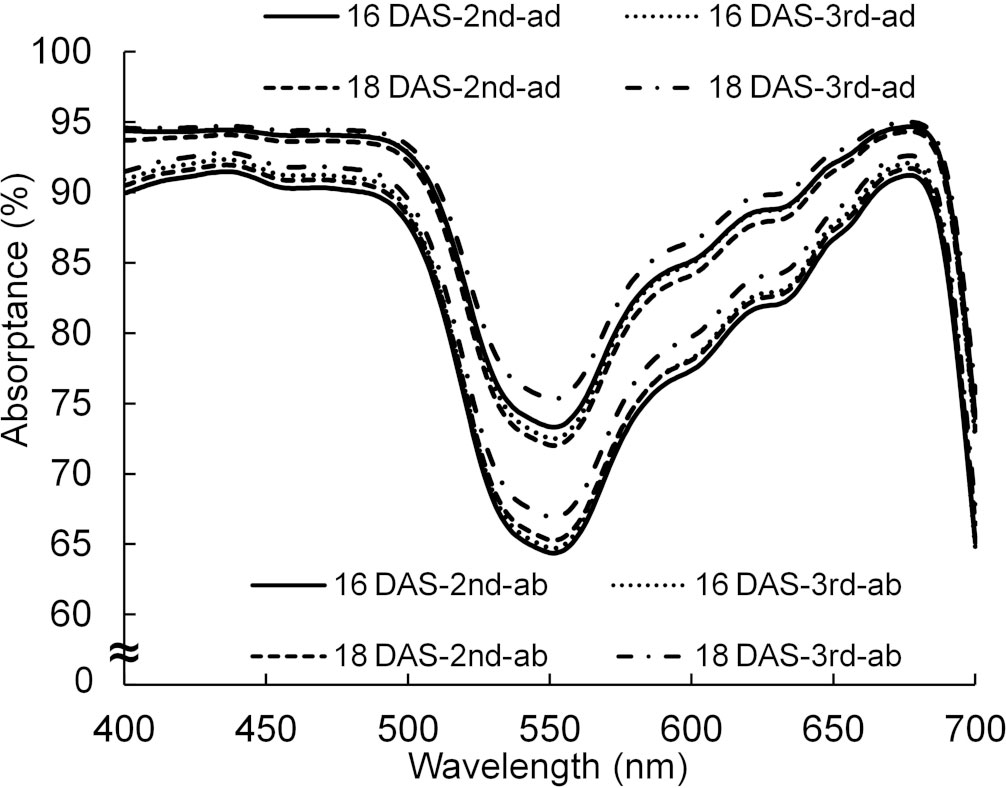
Figure 11 The spectral distributions of absorptance of adaxial (ad) and abaxial (ab) surfaces of the 2nd and 3rd leaves of komatsuna 16 DAS and 18 DAS (n = 10). The spectral distributions were calculated from the spectral distributions of reflectance and transmittance measured by a spectrophotometer (V-750, JASCO Corporation, Tokyo, Japan) with an integrating sphere (ISV-922, JASCO Corporation, Tokyo, Japan). The spectral distributions of absorptance of the komatsuna leaves in the other leaf positions in 18 DAS were similar to those of the 2nd and 3rd leaves of komatsuna 18 DAS.
Palisade tissue allows light to be transmitted more easily than spongy tissue. On the other hand, the structure of spongy tissue allows light to scatter and be absorbed more easily. Therefore, the incident light from the palisade tissue is less likely to be attenuated (Brodersen and Vogelmann, 2010; Timonin, 2017). Therefore, if mesophyll cells of the komatsuna leaf were differentiated into palisade and spongy tissue, the gradient of PPFD in the leaf from the adaxial to abaxial surfaces would be smaller when the light was incident from the adaxial surface compared to when the light was incident from the abaxial surface.
The komatsuna plants used in this study were grown under downward light. Therefore, the light was mainly incident on the adaxial surface of the leaves. In this case, the PPFD of the leaves was relatively high on the adaxial surface and relatively low on the abaxial surface. Chloroplasts within a leaf can adapt to the light environment in which the leaf develops (Terashima, 1986). In leaves exposed to light incident on the adaxial surface, the ribulose 1,5-bisphosphate carboxylase/oxygenase (Rubisco)/chlorophyll ratio, chlorophyll a/b ratio, Rubisco concentration, Rubisco activity, and CO2 fixation rate were higher on the adaxial side than on the abaxial side (Nishio et al., 1993; Terashima and Hikosaka, 1995; Sun and Nishio, 2001; Terashima et al., 2016). Rubisco content is correlated with the CO2 fixation rate (Nishio et al., 1993), and the chlorophyll a/b ratio reflects the ratio of the reaction center and light-harvesting pigment protein in the photosystem. Therefore, the photosynthetic activity of chloroplasts was higher on the adaxial side than on the abaxial side, and chloroplasts on the adaxial side were more adapted to high PPFD by downward lighting.
Thus, the effect of the pad on the Pn of a leaf can be explained as follows. Under E conditions lower than 330 μmol m−2 s−1, the slope of the LRC of photosynthesis was the product of the quantum yield of photosynthesis and the light absorptance in the leaf (Terashima and Saeki, 1985), and Pn increased linearly with increasing PPFD on the leaf. Therefore, if the quantum yield of photosynthesis is approximately the same within a leaf, the higher the leaf absorptance, the higher the Pn. This indicates that under low PPFD conditions, the percentage of light incident from the adaxial surface with higher absorptance was higher; that is, the higher the pad, the higher the Pn.
Under E conditions higher than 470 μmol m−2 s−1, if the photosynthetic activity of the chloroplasts is uniform, Pn reaches a maximum when the PPFD in the leaf is uniform. Furthermore, if the extinction coefficients of the palisade and spongy tissues are equal, Pn becomes maximum when both sides of the leaf are irradiated at an equal PPFD (pad = 50). However, it is considered that the extinction coefficient of palisade tissue is lower than that of sponge tissue, the photosynthetic activity of chloroplasts is higher on the adaxial side than on the abaxial side, and chloroplasts on the adaxial side are more adapted to high PPFD (Nishio et al., 1993; Terashima and Hikosaka, 1995; Sun and Nishio, 2001; Terashima et al., 2016). Thus, it is considered that Pn was higher with a higher percentage of PPFD on the adaxial surface (pad = 67–83%) than that with equal PPFD on both sides of the leaf (pad = 50%). This is because light energy was distributed more efficiently to each chloroplast.
φP is the initial slope of the LRC of photosynthesis and reflects Pn under low PPFD conditions, as described in Section 4.1. Under low PPFD conditions, the slope of the LRC of photosynthesis is the product of the quantum yield of photosynthesis and the absorptance of light in the leaf (Terashima and Saeki, 1985). Therefore, the absorptance of the leaf increases as the pad increases, and consequently, φP increases with pad.
θP is the convexity of the LRC of photosynthesis, which indicates the ease of light saturation of Pn. If Pmax is constant, the light-use efficiency of photosynthesis increases as θP increases.
Light incident on the abaxial surface is scattered and absorbed by the spongy tissue, resulting in a steeper gradient of PPFD between the adaxial and abaxial surfaces compared to the light incident on the adaxial surface (Terashima and Saeki, 1985; Terashima and Hikosaka, 1995). In addition, more light incident on the abaxial surface is likely to be absorbed by chloroplasts, with relatively low photosynthetic activity on the abaxial side (Nishio et al., 1993; Sun and Nishio, 2001; Terashima et al., 2016). When light is incident only on the abaxial surface (pad = 0), much of the light can be absorbed by the spongy tissue and only a small amount of light can reach the palisade tissue. Therefore, the increase in PPFD of the light reaching the palisade tissues is small relative to that of the light reaching the abaxial surface (Eab). Thus, it is difficult to saturate the Pn of the leaves. In particular, when a leaf is irradiated with light with a PPFD that causes the Pn of chloroplasts in the abaxial side to be light-saturated, the light energy absorbed by the chloroplasts would not be efficiently used for photosynthesis.
When the pad was 0%, excessive light would be absorbed by the chloroplasts on the abaxial side, but when the pad was 17–83%, some of the excessive light could be absorbed by the chloroplasts on the adaxial side. Thus, when the light was incident from the adaxial side, more light could be used for photosynthesis by the chloroplasts on the adaxial side, which might not be light-saturated compared to the condition with 0% of the pad. Therefore, even if E is constant, the Pn would be higher at 17–83% of the pad than at 0 of the pad.
When light is incident on the adaxial surface only (pad = 100%), the Pn of the leaf is difficult to be saturated compared to the conditions with 50, 67, and 83% of the pad because the PPFD of the light reaching the abaxial surface is low, and the Pn of the chloroplasts on the abaxial side is difficult to be saturated, contrary to the condition with 0% of the pad. However, palisade tissue allows light to be transmitted more easily than sponge tissue, and in a leaf developed with irradiation on the adaxial side, the photosynthetic activity of the chloroplasts might be higher on the adaxial side than on the abaxial side. Therefore, it is considered that since chloroplasts adapted to high PPFD are harder to be saturated, the Pn of the leaf was harder to be saturated at pad = 100%, than at pad = 0%.
Based on the above reasons, θP would increase rapidly in the pad range of 1% to 33% and decrease at 100% of pad in comparison to θP at 50, 67, and 83% of pad.
This study proposed the LRC of photosynthesis when light is incident from both leaf surfaces. It would allow a detailed analysis of the effects of upward lighting in a PFAL and intra-canopy supplemental lighting in a greenhouse on Pn of plants.
From Figure 9 and Table 2, under the conditions of 122 µmol s−1 of Φlamps, when LAI was less than 2.5, the CPn was increased with more upward lighting (pdw = 20%). When LAI was greater than 3.5, the CPn was increased with more downward lighting than when LAI was less than 2.5 (pdw = 50, 100%). With greater than 244 µmol s−1 of Φlamps, when LAI was less than 3.5, the CPn was increased with 50–70% of pdw. When LAI was greater than 4.5, the CPn was increased with more downward lighting (pdw = 80–100%). The possible causes could be Φleaves and SDE.
CPn would be higher under the conditions of higher Φlamps and lower SDE. When Φlamps and SDE were high, there were locally high PPFD areas. In this case, the light-use efficiency of photosynthesis decreased in the high PPFD areas, and the CPn also decreased. Therefore, the SDE was considered to largely influence CPn under high Φlamps conditions. This might reflect the fact that for higher Φlamps, the CPn was likely to be the highest under the conditions with pdw, which resulted in a lower SDE (Table 2 and Figure 10B).
Regarding the relationship between pdw and Φleaves, in the simulation of this study, the lamps for upward lighting were placed between the plants, whereas the lamps for downward lighting were placed approximately 20 cm above the canopy. Therefore, the lamps for upward lighting were closer to the plants than those for downward lighting; therefore, it is considered that the light emitted from the lamps for upward lighting was less likely to leak out of the cultivation system and was more likely to be absorbed by the leaves in the canopy than the lamps for downward lighting. However, when the LAI was 4.5, the plant density was considerably high. Thus, when the LAI was 4.5, a larger percentage of light by upward lighting might be absorbed by the petioles instead of the leaf blades than when LAI was smaller than 4.5, resulting in lower Φleaves (Table S4).
Regarding the SDE, it is considered that because the lamps for upward lighting were closer to the leaf surface, light tended to enter the leaves near the lamps. In this case, the PPFDs on the leaves near the lamps for upward lighting would be high, and the vertical PPFD gradient would be steeper than that in the case of downward lighting (Figure 12). In other words, under the simulation conditions in this study, the extinction coefficient of the canopy for upward lighting was larger than that for downward lighting.
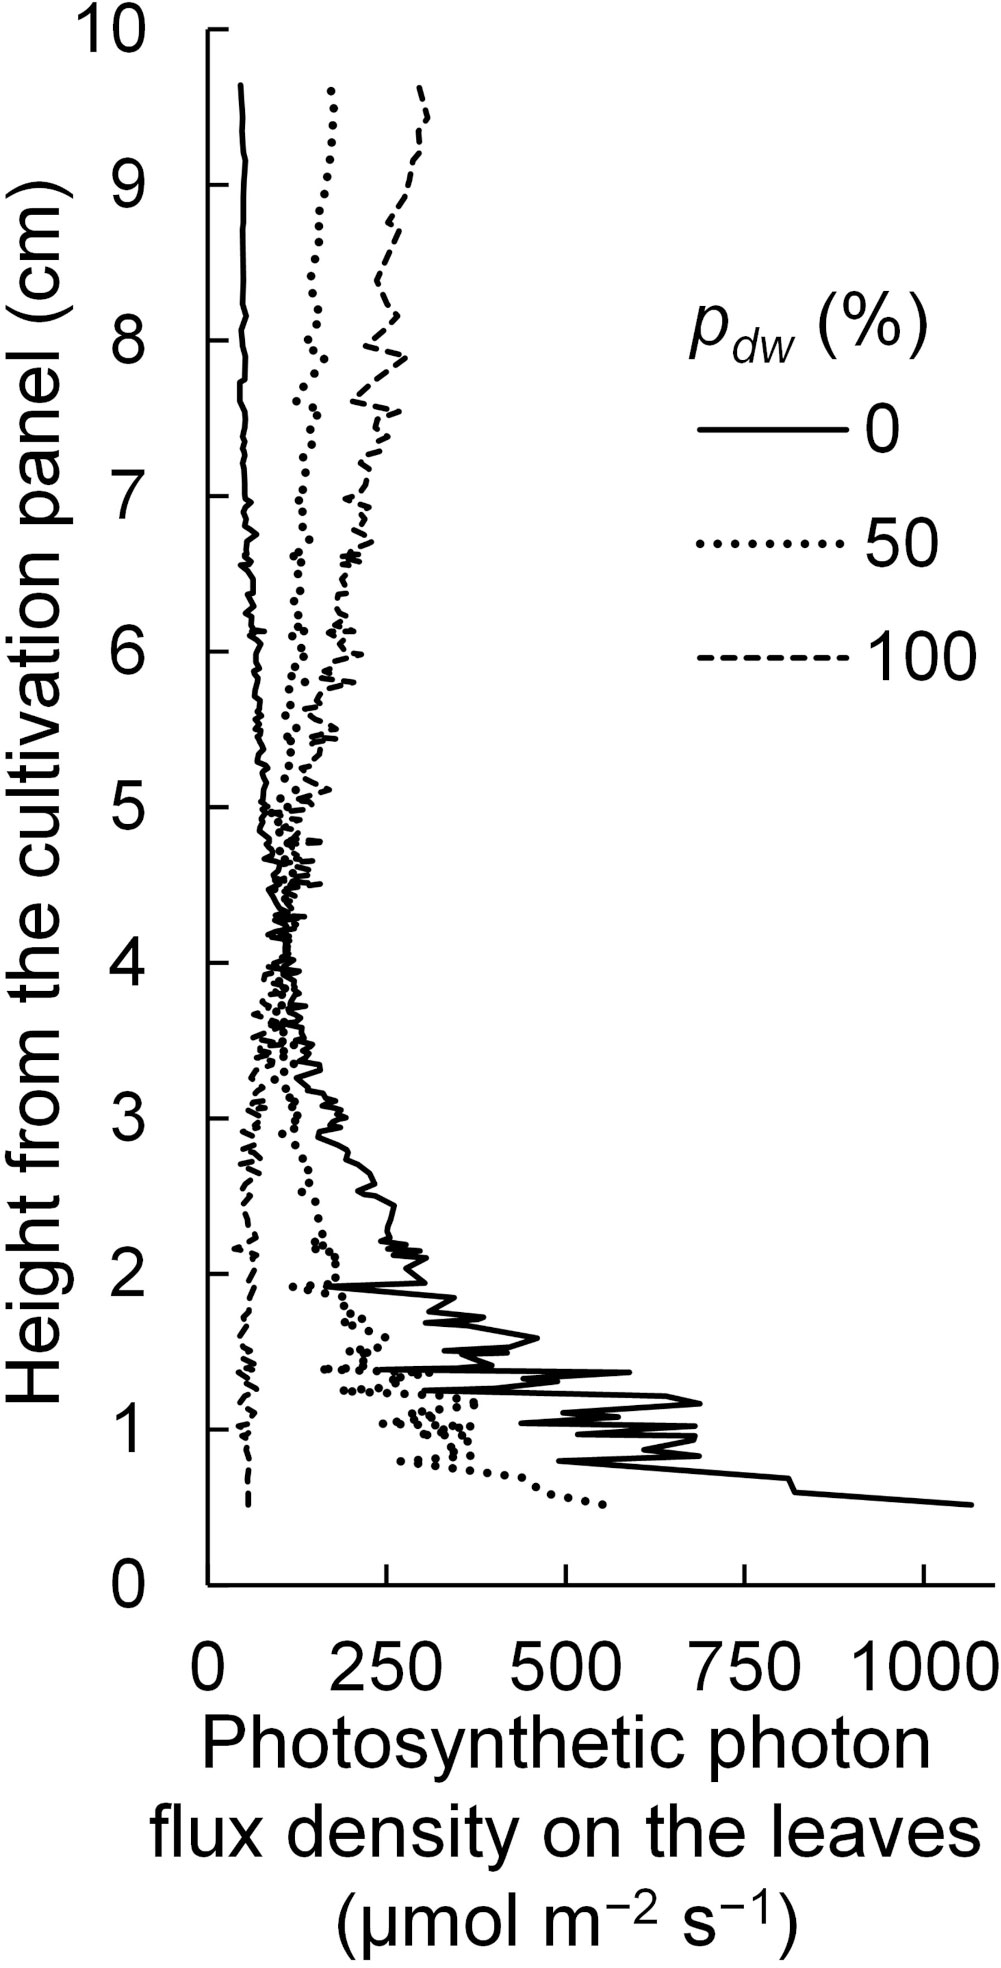
Figure 12 The vertical distribution of photosynthetic photon flux densities on the komatsuna leaves under different conditions, with the proportion (pdw) of the photosynthetic photon flux of lamps for downward lighting to that of whole lamps for downward and upward lighting (Φlamps). The leaf area index and Φlamps were 2.5 and 244 µmol s−1, respectively.
As described above, we used optical simulations to estimate CPn under different pdw conditions and could provide effective pdw values to enhance CPn. The result shows that optical simulation is useful for evaluating the lighting design in a PFAL and analyzing the effects of the lighting design on photosynthesis. The plants used in this study were grown under downward light, whereas plants grown under upward light could be adapted to that light environment, and photosynthetic characteristics could be changed (Jiang et al., 2017; Saengtharatip et al., 2021; Yamori et al., 2021). Therefore, the parameters of LRC of the latter plants could be different from those of LRC of the plants in this study. Since the values of the parameters of LRC in the second and third leaves of 16 and 18 DAS were used to create interpolation formulas for the parameters of LRC, and the interpolation formulas were used to calculate the parameters of LRC in the other leaves on 18 DAS, it is unclear whether this interpolation method correctly estimates the parameters of the LRC for those leaves. In addition, since plant morphology can change with planting density, the shapes of 3D plant models would differ from actual plant shapes. Therefore, validation of the estimated CPn under various lighting conditions is necessary to improve the accuracy of the estimation.
The results of this study showed that upward lighting might increase CPn. However, the gross photosynthetic rate of the canopy under conditions with a combination of downward and upward lighting was 1.08–1.13 times higher at most than under the conditions with downward lighting alone, even if the total PPFs of the lamps for upward and downward lighting are the same. If upward lighting is installed in a PFAL, the cost of lamps for upward lighting will increase. The depreciation accounted for 25–30% of the production cost in a PFAL (Kozai, 2019; Kozai and Niu, 2020), and the depreciation for lamps accounted for 30% of total depreciation (Uraisami, 2018). Therefore, the depreciation for lamps accounted for 7.5–9.0% of the production cost. On other hand, there was a linear relationship between Pn and the growth rate of the canopy (Hikosaka et al., 1999). If there was a proportional relationship between CPn and growth rate of the canopy, and the number of lamps for upward lighting was the same as that for downward lighting, enhancement of CPn by upward lighting would be valuable, even considering production cost (Table S5).
This study investigated the effects of total PPFD (E) on the adaxial and abaxial surfaces of a leaf, and the proportion (pad) of PPFD on the adaxial surface to E on the Pn of a leaf. Pn varied with pad. Under low E conditions, except when E was 30 or 70 µmol m−2 s−1, Pn increased as pad increased owing to the difference in absorptances of the adaxial and abaxial surfaces of a leaf. Under high E conditions, Pn was maximized when pad was 67–83% because of more photosynthetically efficient light distribution within the leaf. This would result from the difference in the PPFD gradient within a leaf when adaxial or abaxial surfaces are irradiated, as well as the photosynthetic capacity of chloroplasts in the adaxial or abaxial parts of a leaf. Next, we formulated an equation for the LRC of photosynthesis that took pad into consideration.
Subsequently, using optical simulation and the formulated equation, we estimated CPn with downward and upward lighting. The simulations were performed under conditions with different LAI, total PPF (Φlamps) of the whole lamps, and proportion (pdw) of the lamps’ PPF for downward lighting to Φlamps. CPn increased by combining downward and upward lighting because the PPF (Φleaves) of light incident on the canopy and the standard deviation (SDE) of PPFDs in the canopy improved. Under conditions with downward and upward lighting, CPn could be 1.08–1.13 times higher at most than that under the conditions with downward lighting alone. Because the depreciation of lamps for upward lighting accounts for 7.5–9.0% of the production cost in a PFAL, even if the depreciation of lamps for upward lighting increased, enhancement of CPn by upward lighting would be cost-effective.
In this study, we performed optical simulations under 220 conditions and evaluated them using CPn as an index. Moreover, we could provide effective pdw values to improve CPn and analyze the reason for this improvement. This shows that optical simulation is useful for evaluating the lighting design in a PFAL and analyzing the effects of the lighting design on the light environment and photosynthesis.
The original contributions presented in the study are included in the article/Supplementary Material. Further inquiries can be directed to the corresponding author.
Conceptualization, methodology, design of the experiment, and funding acquisition: KS and EG. Performed the experiments and collected samples for analysis, parameter measurement, and statistical analysis of data: KS. Writing—original draft preparation: KS. Writing—review and editing: EG. Supervision: EG. Both authors contributed to the article and approved the submitted version.
This research was funded by the Program on Open Innovation Platform with Enterprises, Research Institute, and Academia, Japan Science and Technology Agency (JST-OPERA and JPMJOP1851). This work was supported by the JST SPRING (grant number JPMJSP2109).
The authors thank Professors Shoko Hikosaka and Hideo Yoshida of Graduate School of Horticulture, Chiba University, Japan for valuable suggestions and discussions.
The authors declare that this research was conducted in the absence of any commercial or financial relationships that could be construed as potential conflicts of interest.
All claims expressed in this article are solely those of the authors and do not necessarily represent those of their affiliated organizations, or those of the publisher, the editors and the reviewers. Any product that may be evaluated in this article, or claim that may be made by its manufacturer, is not guaranteed or endorsed by the publisher.
The Supplementary Material for this article can be found online at: https://www.frontiersin.org/articles/10.3389/fpls.2023.1111338/full#supplementary-material
Akiyama, T., Kozai, T. (2016). “Light environment in the cultivation space of plant factory with LEDs,” in LED lighting for urban agriculture (Singapore: Springer), 91–109. doi: 10.1007/978-981-10-1848-0_7
Brodersen, C. R., Vogelmann, T. C. (2010). Do changes in light direction affect absorption profiles in leaves? Funct. Plant Biol. 37, 403–412. doi: 10.1071/FP09262
Brouwer, B., Ziolkowska, A., Bagard, M., Keech, O., Gardeström, P. (2012). The impact of light intensity on shade-induced leaf senescence. Plant Cell Environ. 35, 1084–1098. doi: 10.1111/j.1365-3040.2011.02474.x
Carroll, R. J., Ruppert, D. (1982). A comparison between maximum likelihood and generalized least squares in a heteroscedastic linear model. J. Am. Stat. Assoc. 77, 878–882. doi: 10.1080/01621459.1982.10477901
Dou, H., Niu, G., Gu, M., Masabni, J. G. (2018). Responses of sweet basil to different daily light integrals in photosynthesis, morphology, yield, and nutritional quality. Hortic. Sci. 53, 496–503. doi: 10.21273/HORTSCI12785-17
Genty, B., Briantais, J. M., Baker, N. R. (1989). The relationship between the quantum yield of photosynthetic electron transport and quenching of chlorophyll fluorescence. Biochim. Biophys. Acta (BBA) General Subj. 990, 87–92. doi: 10.1016/S0304-4165(89)80016-9
Goto, E. (2012). Plant production in a closed plant factory with artificial lighting. Acta Hortic. 956, 37–49. doi: 10.17660/ActaHortic.2012.956.2
Graamans, L., Baeza, E., Van Den Dobbelsteen, A., Tsafaras, I., Stanghellini, C. (2018). Plant factories versus greenhouses: Comparison of resource use efficiency. Agric. Syst. 160, 31–43. doi: 10.1016/j.agsy.2017.11.003
Harbinson, J., Genty, B., Baker, N. R. (1990). The relationship between CO2 assimilation and electron transport in leaves. Photosynth. Res. 25, 213–224. doi: 10.1007/BF00033162
Hikosaka, K., Sudoh, S., Hirose, T. (1999). Light acquisition and use by individuals competing in a dense stand of an annual herb, xanthium canadense. Oecologia 118, 388–396. doi: 10.1007/s004420050740
Hosseini, A., Zare Mehrjerdi, M., Aliniaeifard, S., Seif, M. (2019). Photosynthetic and growth responses of green and purple basil plants under different spectral compositions. Physiol. Mol. Biol. Plants. 25, 741–752. doi: 10.1007/s12298-019-00647-7
Jiang, C., Johkan, M., Hohjo, M., Tsukagoshi, S., Ebihara, M., Nakaminami, A., et al. (2017). Photosynthesis, plant growth, and fruit production of single-truss tomato improves with supplemental lighting provided from underneath or within the inner canopy. Scientia Hortic. 222, 221–229. doi: 10.1016/j.scienta.2017.04.026
Joshi, J., Zhang, G., Shen, S., Supaibulwatana, K., Watanabe, C. K. A., Yamori, W. (2017). A combination of downward lighting and supplemental upward lighting improves plant growth in a closed plant factory with artificial lighting. Hortscience 52, 831–835. doi: 10.21273/HORTSCI11822-17
Kalantari, F., Tahir, O. M., Joni, R. A., Fatemi, E. (2018). Opportunities and challenges in sustainability of vertical farming: A review. J. Landsc. Ecol. 11, 35–60. doi: 10.1515/jlecol-2017-0016
Kazhdan, M., Bolitho, M., Hoppe, H. (2006). “Poisson surface reconstruction,” in Symposium on Geometry Processing (Netherlands: The Eurographics Association), 61–70. doi: 10.2312/SGP/SGP06/061-070
Kim, J., Kang, W. H., Son, J. E. (2020). Interpretation and evaluation of electrical lighting in plant factories with ray-tracing simulation and 3D plant modeling. Agronomy 10, 1545. doi: 10.3390/agronomy10101545
Kim, H. H., Wheeler, R. M., Sager, J. C., Gains, G. D., Naikane, J. H. (2006). Evaluation of lettuce growth using supplemental green light with red and blue light-emitting diodes in a controlled environment-a review of research at Kennedy space center. Acta Hortic. 711, 111–120. doi: 10.17660/ActaHortic.2006.711.11
Kozai, T. (2013). Resource use efficiency of closed plant production system with artificial light: Concept, estimation and application to plant factory. Proc. Jpn Acad. Ser. B Phys. Biol. Sci. 89, 447–461. doi: 10.2183/pjab.89.447
Kozai, T. (2019). Towards sustainable plant factories with artificial lighting (PFALs) for achieving SDGs. Int. J. Agric. Biol. Eng. 12, 28–37. doi: 10.25165/j.ijabe.20191205.5177
Kozai, T., Niu, G. (2016). “Chapter 4 - Plant factory as a resource-efficient closed plant production system,” in Plant Factory (United Kingdom: Academic Press), 69–90. doi: 10.1016/B978-0-12-801775-3.00004-4
Kozai, T., Niu, G. (2020). “Chapter 2 - Role of the plant factory with artificial lighting (PFAL) in urban areas,” in Plant Factory (United Kingdom: Academic Press), 7–34. doi: 10.1016/B978-0-12-816691-8.00002-9
Kozai, T., Ohyama, K., Chun, C. (2006). Commercialized closed systems with artificial lighting for plant production. Acta Hortic 711, 61–70. doi: 10.17660/ActaHortic.2006.711.5
Kozai, T., Zhang, G. (2016). “Some aspects of the light environment,” in LED Lighting for Urban Agriculture (Singapore: Springer), 49–55. doi: 10.1007/978-981-10-1848-0
Li, T., Heuvelink, E., Dueck, T. A., Janse, J., Gort, G., Marcelis, L. F. M. (2014). Enhancement of crop photosynthesis by diffuse light: Quantifying the contributing factors. Ann. Bot. 114, 145–156. doi: 10.1093/aob/mcu071
Nicole, C. C. S., Charalambous, F., Martinakos, S., Van De Voort, S., Li, Z., Verhoog, M., et al. (2016). Lettuce growth and quality optimization in a plant factory, in. acta hortic. Int. Symposium Light Horticult. 1134, (231–238). doi: 10.17660/ActaHortic.2016.1134.31
Nishio, J. N., Sun, J., Vogelmann, T. C. (1993). Carbon fixation gradients across spinach leaves do not follow internal light gradients. Plant Cell. 5, 953–961. doi: 10.1105/tpc.5.8.953
Ögren, E., Evans, J. R. (1993). Photosynthetic light-response curves. Planta 189, 182–190. doi: 10.1007/BF00195075
Öquist, G., Chow, W. S. (1992). On the relationship between the quantum yield of photosystem II electron transport, as determined by chlorophyll fluorescence and the quantum yield of CO2-dependent O2 evolution. Photosynth. Res. 33, 51–62. doi: 10.1007/BF00032982
Palliotti, A., Cartechini, A. (2001). Photosynthetic light response curves in relation to illumination of adaxial and abaxial surfaces of sun and shade leaves of vitis vinifera l. Vitis 40, 175–178. doi: 10.5073/vitis.2001.40.175-177
Paradiso, R., Marcelis, L. F. M. (2012). The effect of irradiating adaxial or abaxial side on photosynthesis of rose leaves. Acta Hortic. 956, 157–163. doi: 10.17660/ActaHortic.2012.956.15
Pennisi, G., Blasioli, S., Cellini, A., Maia, L., Crepaldi, A., Braschi, I., et al. (2019). Unraveling the role of red: blue LED lights on resource use efficiency and nutritional properties of indoor grown sweet basil. Front. Plant Sci. 10. doi: 10.3389/fpls.2019.00305
Pennisi, G., Pistillo, A., Orsini, F., Cellini, A., Spinelli, F., Nicola, S., et al. (2020). Optimal light intensity for sustainable water and energy use in indoor cultivation of lettuce and basil under red and blue LEDs. Sci. Hortic. 272, 109508. doi: 10.1016/j.scienta.2020.109508
Proietti, P., Palliotti, A. (1997). Contribution of the adaxial and abaxial surfaces of olive leaves to photosynthesis. Photosynthetica 33, 63–69. doi: 10.1023/A:1022175221813
Saengtharatip, S., Joshi, J., Zhang, G., Takagaki, M., Kozai, T., Yamori, W. (2021). Optimal light wavelength for a novel cultivation system with a supplemental upward lighting in plant factory with artificial lighting. Environ. Control Biol. 59, 21–27. doi: 10.2525/ecb.59.21
Saito, K., Ishigami, Y., Goto, E. (2020). Evaluation of the light environment of a plant factory with artificial light by using an optical simulation. Agronomy 10, 1663. doi: 10.3390/agronomy10111663
Santiteerakul, S., Sopadang, A., Yaibuathet Tippayawong, K., Tamvimol, K. (2020). The role of smart technology in sustainable agriculture: A case study of wangree plant factory. Sustainability 12, 4640. doi: 10.3390/su12114640
Sassenrathcole, G. F. (1995). Dependence of canopy light distribution on leaf and canopy structure for two cotton (Gossypium) species. Agric. For. Meteorol. 77, 55–72. doi: 10.1016/0168-1923(95)02238-S
Shimizu, H., Saito, Y., Nakashima, H., Miyasaka, J., Ohdoi, K. (2011). Light environment optimization for lettuce growth in plant factory. IFAC Proc. Volumes. 44, 605–609. doi: 10.3182/20110828-6-IT-1002.02683
Sun, J., Nishio, J. (2001). Why abaxial illumination limits photosynthetic carbon fixation in spinach leaves. Plant Cell Physiol. 42, 1–8. doi: 10.1093/pcp/pce001
Terashima, I. (1986). Dorsiventrality in photosynthetic light response curves of a leaf. J. Exp. Bot. 37, 399–405. doi: 10.1093/jxb/37.3.399
Terashima, I., Hikosaka, K. (1995). Comparative ecophysiology of leaf and canopy photosynthesis. Plant Cell Environ. 18, 1111–1128. doi: 10.1111/j.1365-3040.1995.tb00623.x
Terashima, I., Ooeda, H., Fujita, T., Oguchi, R. (2016). Light environment within a leaf. II. progress in the past one-third century. J. Plant Res. 129, 353–363. doi: 10.1007/s10265-016-0808-1
Terashima, I., Saeki, T. (1985). A new model for leaf photosynthesis incorporating the gradients of light environment and of photosynthetic properties of chloroplasts within a leaf. Ann. Bot. 56, 489–499. doi: 10.1093/oxfordjournals.aob.a087034
Uraisami, K. (2018). “Business planning on efficiency, productivity, and profitability,” in Smart plant factory, vol. pp. (Singapore: Springer), 83–118. doi: 10.1007/978-981-13-1065-2_6
Wang, X., Yan, H., Wu, B., Ma, X., Shi, Y. (2020). Dorsoventral photosynthetic asymmetry of tobacco leaves in response to direct and diffuse light. J. Plant Res. 133, 35–48. doi: 10.1007/s10265-019-01151-5
Ward, G. J. (1994). “The RADIANCE lighting simulation and rendering system,” in Proceedings of the 21st annual conference on computer graphics and interactive techniques (United States: Association for Computing Machinery), 459–472. doi: 10.1145/192161.192286
Warner, R., Wu, B. S., MacPherson, S., Lefsrud, M. (2021). A review of strawberry photobiology and fruit flavonoids in controlled environments. Front. Plant Sci. 12. doi: 10.3389/fpls.2021.611893
Yamori, N., Matsushima, Y., Yamori, W. (2021). Upward LED lighting from the base suppresses senescence of lower leaves and promotes flowering in indoor rose management. Hortscience 56, 716–721. doi: 10.21273/HORTSCI15795-21
Yin, X., Struik, P. C., Romero, P., Harbinson, J., Evers, J. B., van der Putten, P. E., et al. (2009). Using combined measurements of gas exchange and chlorophyll fluorescence to estimate parameters of a biochemical c photosynthesis model: A critical appraisal and a new integrated approach applied to leaves in a wheat (Triticum aestivum) canopy. Plant Cell Environ. 32, 448–464. doi: 10.1111/j.1365-3040.2009.01934.x
Yokoi, S., Goto, E., Kozai, T., Nishimura, M., Taguchi, K., Ishigami, Y. (2008). Effects of planting density and air current speed on the growth and uniformity of qing-geng-cai and spinach plug seedlings in a closed transplant production system. Environ. Control Biol. 46 (2), 103–114. doi: 10.2525/ecb.46.103
Yoon, H. I., Kim, H. Y., Kim, J., Son, J. E. (2021). Quantitative analysis of UV-b radiation interception and bioactive compound contents in kale by leaf position according to growth progress. Front. Plant Sci. 12. doi: 10.3389/fpls.2021.667456
Yoon, H. I., Kim, J., Oh, M. M., Son, J. E. (2022). Prediction of phenolic contents based on ultraviolet-b radiation in three-dimensional structure of kale leaves. Front. Plant Sci. 13. doi: 10.3389/fpls.2022.918170
Zhang, X., He, D., Niu, G., Yan, Z., Song, J. (2018). Effects of environment lighting on the growth, photosynthesis, and quality of hydroponic lettuce in a plant factory. Int. J. Agric. Biol. Eng. 11, 33–40. doi: 10.25165/j.ijabe.20181102.3240
Zhang, G., Shen, S., Takagaki, M., Kozai, T., Yamori, W. (2015). Supplemental upward lighting from underneath to obtain higher marketable lettuce (Lactuca sativa) leaf fresh weight by retarding senescence of outer leaves. Front. Plant Sci. 6. doi: 10.3389/fpls.2015.01110
Keywords: abaxial surface, light distribution, light response curve of photosynthesis, vertical farming, photosynthetic photon flux density, plant three-dimensional model, light-emitting diode
Citation: Saito K and Goto E (2023) Evaluation of the enhancement of photosynthetic rate in a komatsuna (Brassica rapa L. var. perviridis) canopy with upward lighting using an optical simulation in a plant factory with artificial light. Front. Plant Sci. 14:1111338. doi: 10.3389/fpls.2023.1111338
Received: 29 November 2022; Accepted: 10 March 2023;
Published: 24 March 2023.
Edited by:
Paul P. G. Gauthier, The University of Queensland, AustraliaReviewed by:
Yuxin Tong, Institute of Environment and Sustainable Development in Agriculture (CAAS), ChinaCopyright © 2023 Saito and Goto. This is an open-access article distributed under the terms of the Creative Commons Attribution License (CC BY). The use, distribution or reproduction in other forums is permitted, provided the original author(s) and the copyright owner(s) are credited and that the original publication in this journal is cited, in accordance with accepted academic practice. No use, distribution or reproduction is permitted which does not comply with these terms.
*Correspondence: Eiji Goto, Z290b0BmYWN1bHR5LmNoaWJhLXUuanA=
Disclaimer: All claims expressed in this article are solely those of the authors and do not necessarily represent those of their affiliated organizations, or those of the publisher, the editors and the reviewers. Any product that may be evaluated in this article or claim that may be made by its manufacturer is not guaranteed or endorsed by the publisher.
Research integrity at Frontiers
Learn more about the work of our research integrity team to safeguard the quality of each article we publish.