
94% of researchers rate our articles as excellent or good
Learn more about the work of our research integrity team to safeguard the quality of each article we publish.
Find out more
METHODS article
Front. Plant Sci., 25 January 2023
Sec. Sustainable and Intelligent Phytoprotection
Volume 14 - 2023 | https://doi.org/10.3389/fpls.2023.1099668
This article is part of the Research TopicIntelligent Computing in Farmland Water Conservancy for Smart AgricultureView all 5 articles
 Rongli Gai*
 Zhibin Guo
Most of the water quality indicators that affect the results of river water quality assessment are gray and localized, thus the correlation between water quality indicators can be calculated using gray correlation analysis (GRA).However, GRA takes equal weighting for water quality indicators and does not take into account the weighting of the indicators. Therefore, this paper proposes a river water quality assessment method based on improved grey correlation analysis (ACGRA) andparticle swarm optimization multi-classification support vector machine (PSO-MSVM) for assessing river water environment quality. Firstly, the combination weights of water quality indicators were calculated using Analytic Hierarchy Process (AHP)AHP and Criteria Importance Though Intercrieria Correlation (CRITIC)CRITIC, and then the correlation between water quality indicators was calculated for feature selection. Secondly, the PSO-MSVM model was established using the water quality indicators obtained by ACGRA as input parameters for water environment quality assessment. The river water environment assessment methods of ACGRA and PSO-MSVM were applied to the evaluation of water environment quality in different watersheds in the country. Accuracy, precision, recall and root mean square errorRMSE were also introduced as model evaluation criteria. The results show that the river water environment assessment methods based on ACGRA and PSO-MSVM can evaluate the water environment quality more accurately.
China is rich in river water resources, and is an important water source for living, industry and agriculture in coastal areas. Protecting river water environment security is of great significance to the economic and social development and people’s life in coastal areas of river basins (Yan et al., 2019). River water quality influenced by many water quality index factors such as dissolved oxygen, temperature, turbidity, ammonia nitrogen, and some other factors. If we can fully use water quality index factors, it will help improve the accuracy of water environmental quality assessment. Since river water quality is influenced by many water quality index factors, it will help to improve the accuracy of water environment quality assessment if we can make full use of these water quality index factors.
With the rapid development of machine learning (ML), ML-based water quality assessment methods have become a hot research topic (Zheng et al., 2022). For example, Zhao, Z et al. proposed a water quality assessment model based on a stochastic hybrid dynamic system (Zhao et al., 2022). In addition, Gao, Z et al. presented an enhanced beetle antenna search algorithm for urban river water quality assessment (Gao et al., 2022). Further, Tang, M et al. segmented the water quality assessed by the water quality deterioration rate index Likewise (Tang et al., 2022), Chopade, S et al. combined deep neural networks with sensors to build a river water quality assessment system (Chopade et al., 2021). The above methods consider the influence of multiple indicators on the quality of the water environment in the assessment. However, these methods do not analyze the correlation between water quality indicators.
There are variable and complex correlations between water quality indicators (e.g., non-linear correlations between water quality grades and multiple indicators such as dissolved oxygen, temperature, turbidity, and permanganate index). Therefore, we need to calculate the correlation between different indicators, from which we can select the appropriate characteristics for water quality assessment. Commonly used correlation analysis methods include Pearson correlation coefficient analysis (Zhang et al., 2022a), Granger causality analysis (Tang et al., 2020), and grey relational analysis (Wang et al., 2020). Most indicators affecting water quality are grey and localized. Thus, GRA is well suited to solve this type of problem (Zhou et al., 2018). However, GRA uses equal weighting in calculating the correlation of water quality indicators and does not consider the weight of the indicators. To this end, this paper proposed an improved grey relational analysis algorithm (ACGRA) to measure the correlation between indicators more accurately and then use it to perform feature selection from the indicators.
SVM has excellent advantages in dealing with small samples and complex nonlinear model problems. Compared with other algorithms, it has advantages such as fast learning speed and strong generalization ability (Tan et al., 2019). Therefore, a support vector machine (SVM) can be used for classification of features obtained by the ACGRA as input parameters. However, the selection of parameters has a significant impact on the performance of the model. In order to obtain accurate evaluation results, it is necessary to obtain the best parameters. Traditional parameter selection methods include K-fold cross-validation (Jung et al., 2020), grid search (Dinh and Van der Baan, 2019), and genetic algorithm (Duvvuri and Anmala, 2019). However, these methods are time-consuming and low in efficiency. In order to solve this problem, particle swarm optimization has the characteristics of global optimization, and the particles have memory. Therefore, this paper uses a particle swarm optimization algorithm to optimize SVM parameters and further improve water quality assessment accuracy.
In order to make full use of the correlation between water quality indicators and accurately evaluate the river water quality. In this paper, a water quality evaluation method based on the combination of ACGRA and PSO-MSVM is proposed. First, ACGRA was used for feature selection of water quality indicators. Then, a water quality assessment model was developed using PSO-MSVM, whose inputs were the indicators obtained from ACGRA. The method was compared with other similar methods in the Chinese river cross-sectional water quality monitoring dataset for January-December 2021. The details of the evaluation can be seen in the next sections, and the method proposed in this paper outperforms other similar methods in assessing water quality. The method overcomes the problem that the GRA algorithm does not consider the importance of indicators when calculating the correlation of indicators, and improves the accuracy of river water quality evaluation, which is very helpful for the intelligent management of water environment.
The most important contributions of this article are as follows:
(1) A new technique called ACGRA method is used for computing correlations between water quality indicators for feature selection.
(2) Optimization of multi-classification support vector machine parameters using particle swarm algorithm to improve the performance of water quality assessment models.
The remaining parts of the paper are structured as follows: Section 2 describes the study area and the dataset used for the experiments. In addition, water quality assessment methods based on ACGRA and PSO-MSVM are provided in Section 3. Further, Section 4 presents model-related evaluation metrics and provides an experimental comparative analysis with other methods. The full text is summarized in Section 5.
This study is based on the national river cross-sectional water quality monitoring dataset, the location of water quality monitoring points (Figure 1), where the Yangtze River and Huaihe River basins are the most abundant river water resources, and the basin area of about 1.27 million square kilometers. It is also based on the river flows through Henan, Jiangsu, Hubei, Zhejiang, Hunan, Fujian, and other provinces and autonomous regions, affecting more than 250 million residents. Therefore, it isof great strategic importance to monitor the water quality of domestic rivers and protect the water quality safety of rivers. At the same time, the data and information obtained from monitoring can also provide a scientific basis for pollution source control, environmental planning, etc.
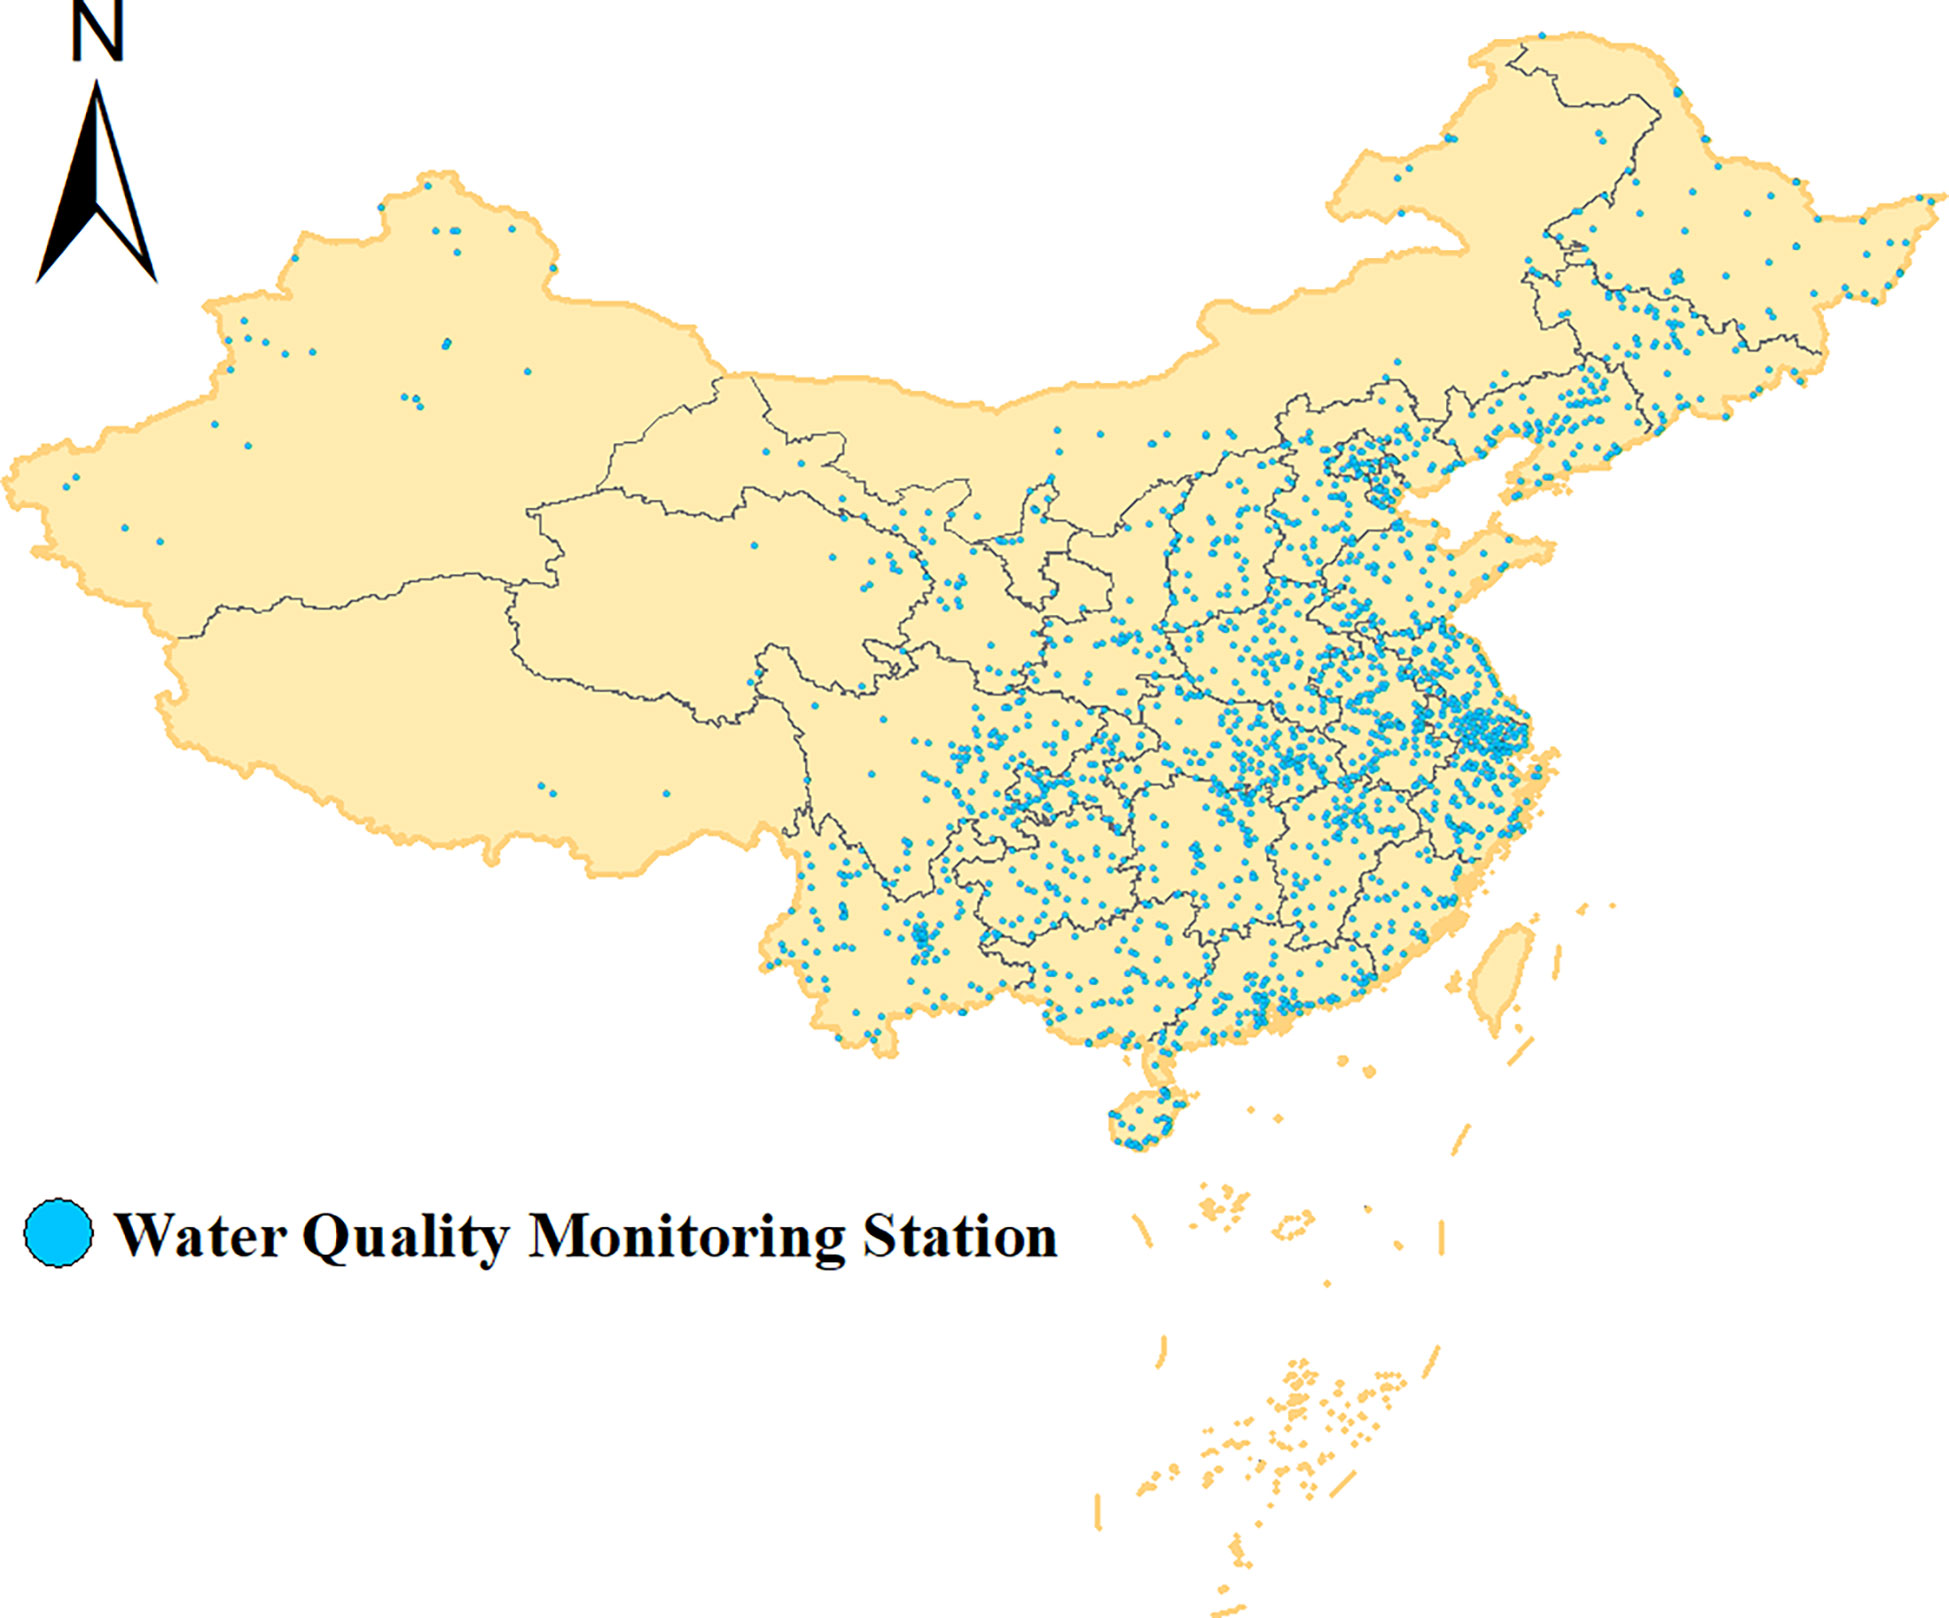
Figure 1 Distribution of water quality monitoring stations.
The dataset used in this paper is the monthly data of water quality monitoring at each river cross-section nationwide from January to December 2021 (Table 1). The monitoring dataset consists of seven parameter features, including dissolved oxygen, temperature, turbidity, ammonia nitrogen, permanganate index, ph, and total dissolved solid.
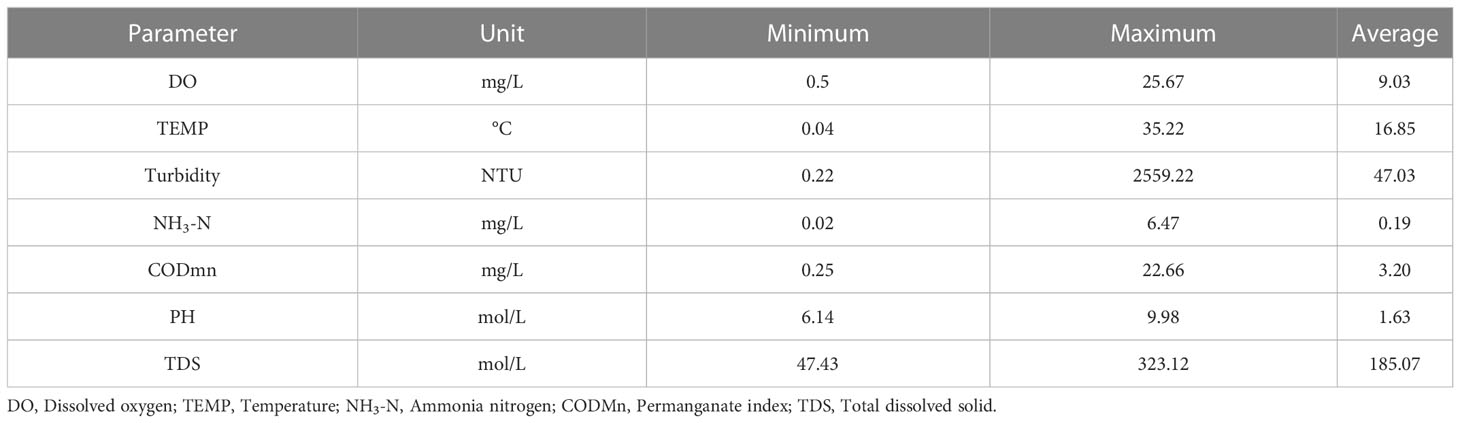
Table 1 River water quality data characteristics.
According to China’s Surface Water Environmental Quality Standard (GB3838-2002), water quality in the dataset was divided into six different categories, including I, II, III, IV, V, and poor V (Table 2). Considering that there are no standard limits forturbidity and total dissolved solid of river cross-section water quality, the standard limits for turbidity and total dissolved solid of drinking water were used in the evaluation process. Water quality responds to the impact of industry, agriculture, and other sources of river water pollution along the river on water quality.
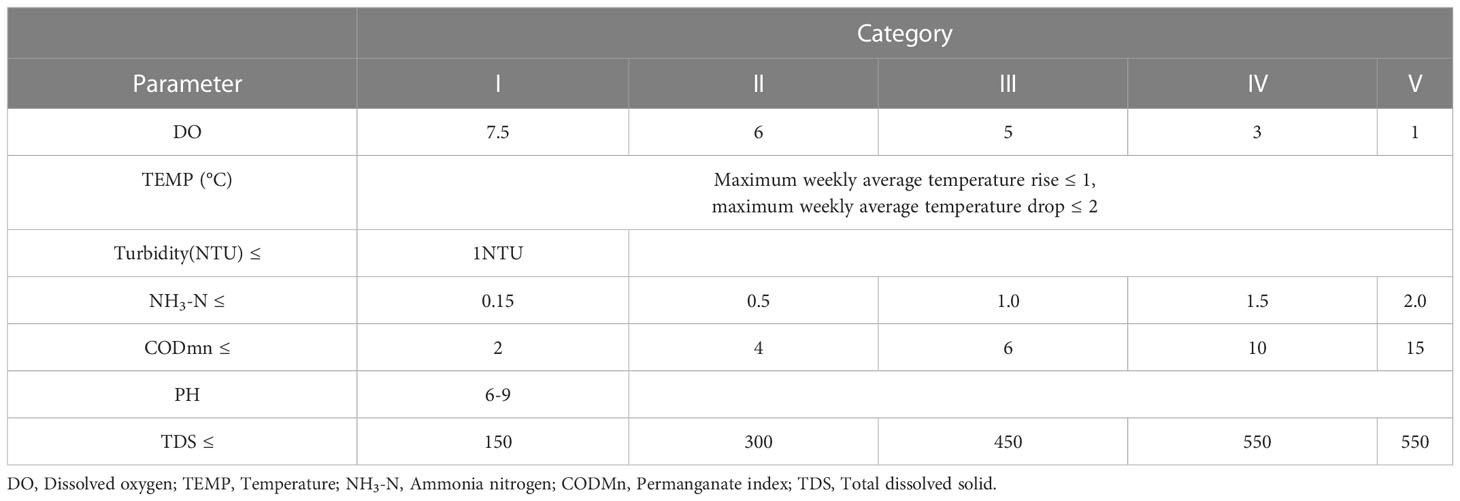
Table 2 Environmental quality standard limits for surface WaterRiver water quality data characteristics.
GRA is a method for assessing the degree of interaction between indicators through geometric similarity between them (Zhang et al., 2021), and it takes a leveling treatment of the indicators. Sutadian et al. proposed a subjectively empowered method for calculating the correlation of indicators (Sasikumar et al., 2022). Miao, C et al. also introduced an objectively assigned indicator correlation calculation (Xu et al., 2020). However, their method only considers the influence of a single factor on the correlation of indicators rather than considering subjective and objective factors together. Hence, the results often do not accurately reflect the correlation between indicators. To compensate for this deficiency, the ACGRA method was proposed in this paper. The calculation process and equation are as follows:
Set the parent indicator X0(i)={x0(1),x0(2),…,x0(i)} , where X0(i) denotes the water quality category of the first i water quality data of X0, and x0 (i) is for the water quality category of the i water quality data. Then set the subindex Xj(i)={xj(1),xj(2),…,xj(i)} , where Xj(i) represents the first i water quality data of Xj, and xj(i) indicates the i water quality data of Xj. Set the parent indicator X0(i)={x0(1),x0(2),…,x0(i)} , where X0(i) denotes the water quality category of the first i water quality data of X0, and x0(i) is for the water quality category of the i water quality data. Then, set the subindex Xj(i)={xj(1),xj(2),…,xj(i)} , where X j (i) represents the first i water quality data of Xj, and xj(i) indicates the i water quality data of Xj. Thedata are normalized, where Xj(i) is the normalized value of the subindex.
Determine the number of grey-off contacts, where sj(i) is the PSO-MSVM coefficient between the subindex and the parent index. In addition, Δmax and Δmin are the maximum and minimum values of X0(i) and Xj(i)' absolute difference, respectively, and ρ is the difference coefficient, which is usually set to 0.5 (Zavareh et al., 2021).
Calculate weight. First, the hierarchical structure was constructed for the research problem, after which the comparison matrix Q=(qjl)n×n was obtained using the 1-9 level scaling method (Coffey and Claudio, 2021), and then the comparison matrix was calculated using Eq. (3) to obtain subjective weights αj as follows:
The amount of information Cj for each attribute can be computed using Eq. (4), where σj denotes the standard deviation of each indicator, and rij is the correlation coefficient of the i indicator data with the jcategory.
The objective weight βj of each attribute can be determined by Eq. (5) as:
Eq. (6) was used to calculate the combination weights ωj
Eq. (7) was employed to compute the index correlation r(j) .
An SVM is a binary classifier that can only distinguish between two different water quality categories. There are currently two methods for SVMs to solve multi-classification problems, including one-to-over (OVR) (Abe, 2015) and one-to-one (OVO) (El Mamoun et al., 2019). OVR is the synthesis of multiple categorical solution problems into a single optimization solution problem that seeks to be solved in one go. However, it is not often used due to its high computational complexity, difficulty in implementation, and low accuracy. In this paper, OVO was applied to solve the multi-classification problem. It is to design a hyperplane between any two classes of samples to construct classifiers. When classifying the unknown samples, the classifier takes a vote, and the final category with the most votes is the category of the unknown samples.
The choice of SVM parameters and the quality of the kernel function have a great impact on the performance of the SVM model (Haixiang et al., 2017). Table 3 provides the commonly used kernel functions and their corresponding parameters. Given that the kernel function chosen in this paper is the radial basis kernel function, the optimal values of parameters C and r should be considered to obtain accurate evaluation results. In this paper, we use particle swarm algorithm to optimize SVM parameters, so as to further improve its water quality assessment accuracy.
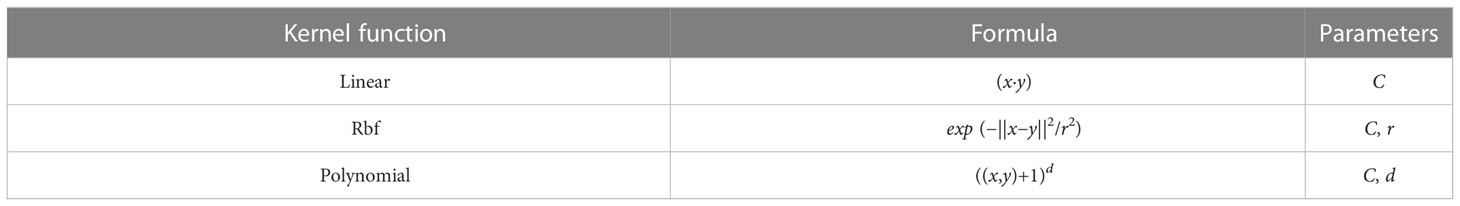
Table 3 Kernel function formula and parameters.
PSO is a population-based intelligent optimization stochastic search algorithm (Lu et al., 2022). First, the initialized particle swarm is generated as a solution in the feasible space. Then, the search iterations continue among the particles to continuously modify the feasible solutions and finally find the global optimal solution Gbt (Hameed et al., 2017). The particles will be updated in each search iteration by the local optimal solution Pbt and the global optimal solution Gbt (Figure 2). The calculation steps are as follows:
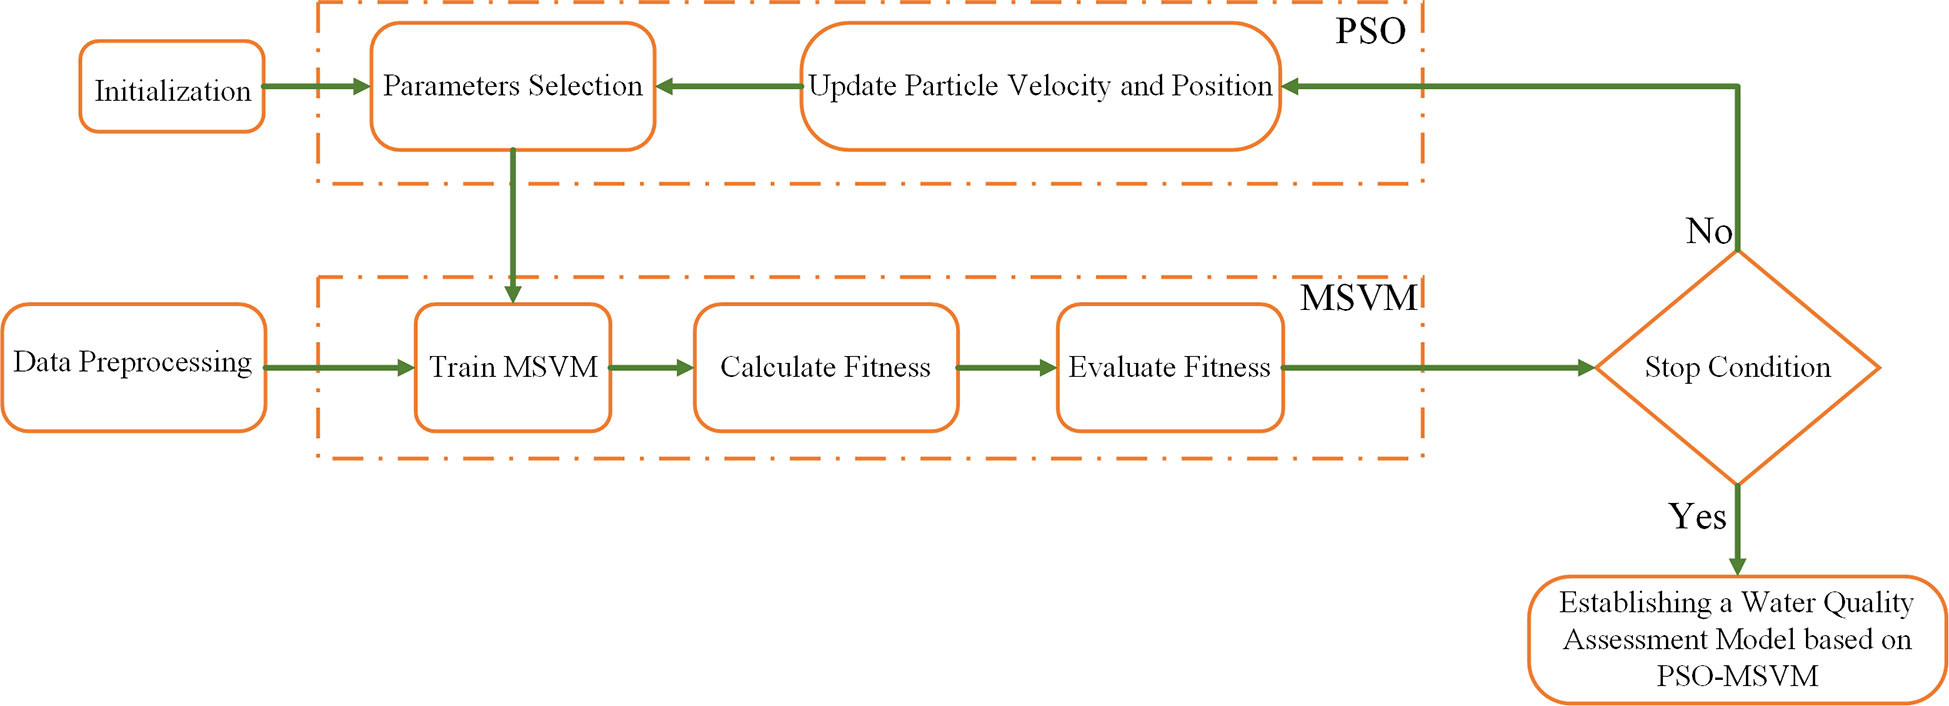
Figure 2 Flowchart of PSO-MSVM parameter optimization.
First, set the initial value of the particle swarm and the maximum number of iterations Tmax. Assuming that the particle swarm is iteratively searched in an n-dimensional space, the position of the j particle is denoted by Zj={zj1,zj2,…,zjm} , and the velocity of the j particle is represented by Vj={vj1,vj2,…,vjm} .
Second, after finding Pbt and Gbt , the velocity of the j particle is updated by the following two equations:
where ω is the inertia weight. Further, c1 and c2, as well as r1 and r2 are learning factors and arbitrary numbers in the range of [0,1], respectively.
The third section is related to iterative search termination conditions. There are two conditions for terminating the iteration; the first one is that the precision is less than the set error value and the particle swarm converges, thus the iteration can be stopped, and the second one is that the number of iterations reaches the set maximum number of iterations Tmax .
Finally, the optimal parameters obtained after the iterations are used to build a water quality assessment model.
When c1 is larger than c2, it leads to a part of particles being trapped in the local search, eventually leading to the inability to find the global optimal solution. Therefore, the value of c1 is taken as 1.6, and the value of c2 is taken as 2 in the model of this paper. Although when ω is larger, the global search capability is stronger, the algorithm is extremely prone to fall into local extremes when ω>1.2. Thus, to enable the particles to detect globally better regions in the early stage, while ensuring the convergence of the algorithm to the global optimal solution in the later stage, a linear decreasing weight strategy was chosen with the following equation:
where t represents the number of current iterations.
The flow of the water quality assessment method based on ACGRA and PSO-MSVM is shown in Figure 3. To make full use of the correlation between water quality information, the features were selected from the water quality information using the method in Section 3.1, and the water quality assessment model was built using the method in Section 3.2.
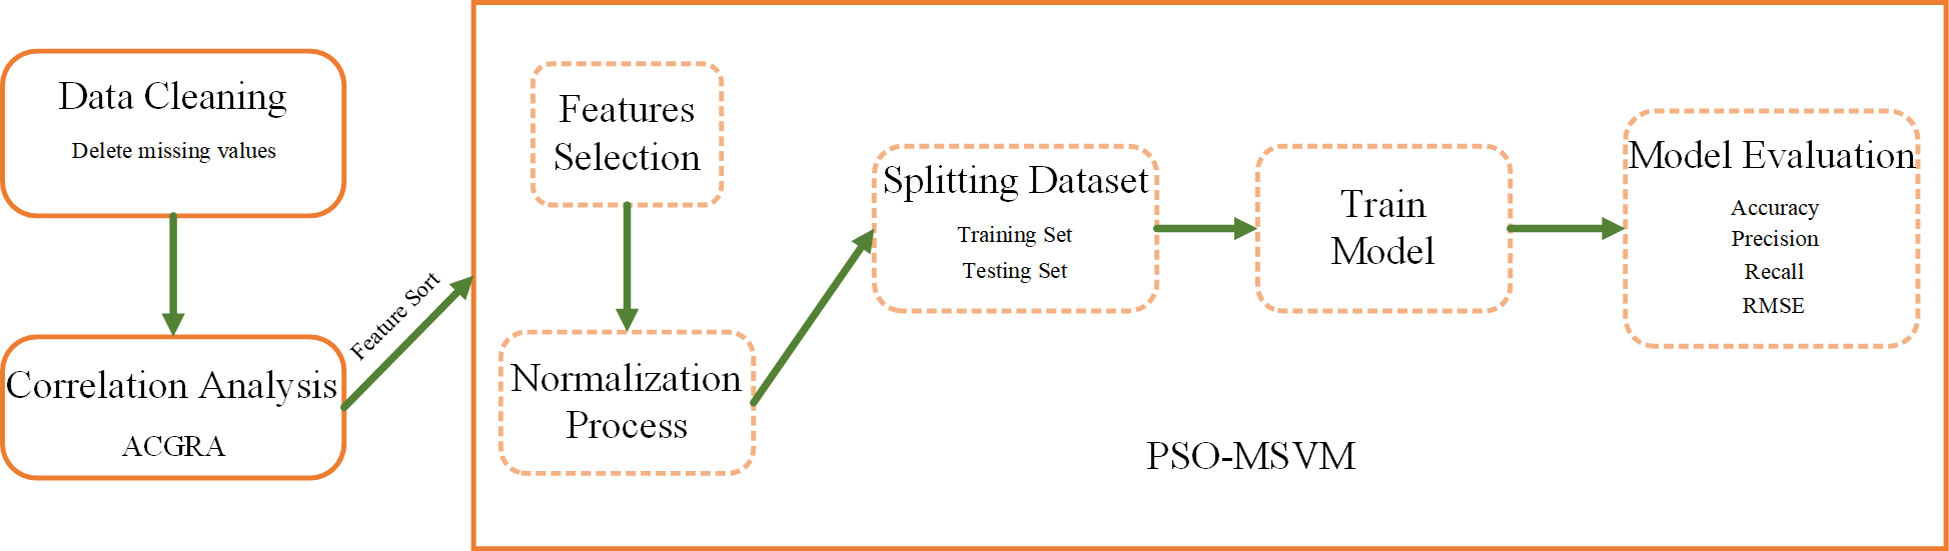
Figure 3 Flowchart of the river water quality assessment method based on ACGRA and PSO-MSVM.
The specific steps of the river water quality assessment are as follows:
Step 1: Cleaning the data and normalizing the dataset;
Step 2: Using ACRGA to calculate the correlation coefficients between water quality indicators and categories and selecting indicators with large correlation coefficients as characteristics;
Step 3: Normalizing the data;
Step 4: Dividing the training and test sets and building the PSO-MSVM-based water quality assessment model and then training by the training set;
Step 5: Evaluating the test set water quality data to calculate the accuracy, precision, recall, and root mean squared error (RMSE) of the model.
Accuracy, precision, recall, and RMSE criteria were used to evaluate the performance of the model. Accuracy is defined as:
Precision is defined as:
Recall is defined as:
where TP, TN, FP, and FN represent the true case, false positive case, true negative case, and false negative case, respectively.
RMSE is defined as:
where k is the number of samples, Yi and are the actual and evaluated values of the samples, respectively.
In this paper, different correlation analysis methods were employed to calculate the direct correlation between water quality and other water quality indicators, and the results are presented in Table 4.
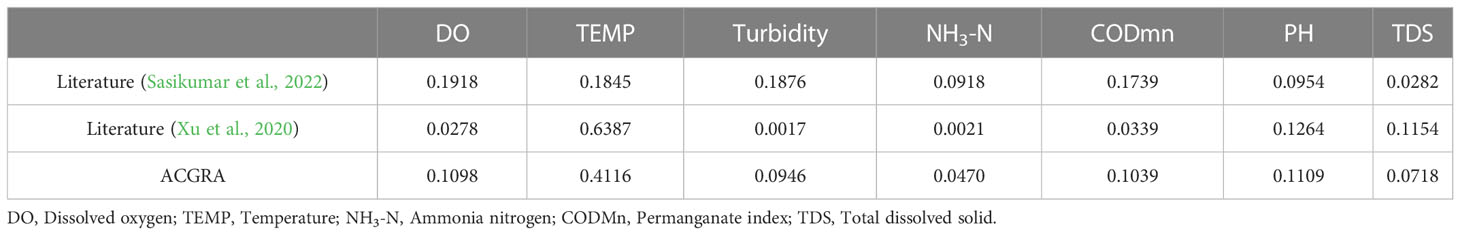
Table 4 Correlation of water quality indicators.
Based on data in Table 4, ACGRA fully considers the effect of subjective and objective weights on the correlation between water quality and other water quality indicators compared to the single weighted grey correlation analysis used in the literature literature (Sasikumar et al., 2022) and literature (Xu et al., 2020).
To further verify the effectiveness of ACGRA, four water quality indicators with high correlation with water quality (Table 4) were selected as the input features of the PSO-MSVM-based water quality assessment model, and the model errors are provided in Table 5.
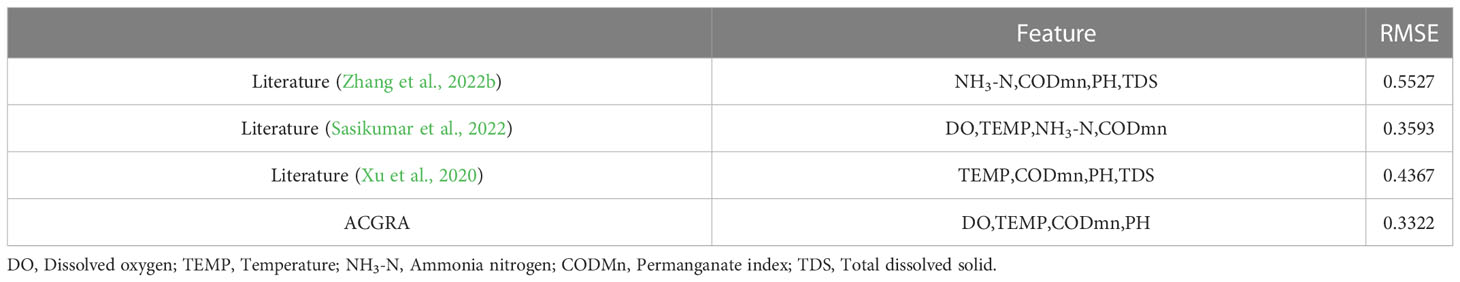
Table 5 Feature selection and model error.
The results of water quality assessment using features obtained by weighted grey relational analysis are better compared to previous research literature (Zhang et al., 2022b) using features obtained by equal-weighted grey relational analysis for water quality assessment (Table 5). Compared to the improved GRA algorithm in studies by literature (Sasikumar et al., 2022) and literature (Xu et al., 2020), the RMSE is smaller when selecting the characteristic variables with ACGRA. This indicates that ACGRA can make full use of the correlation between water quality indicators and can effectively improve the accuracy of river water quality assessment.
In this paper, radial basis function (Rbf) is selected as the kernel function of SVM model. In order to verify the effectiveness of the Rbf, it is compared with the Linear Kernel (Linear) and Polynomial Kernel (Poly), and the results are shown in Figure 4.
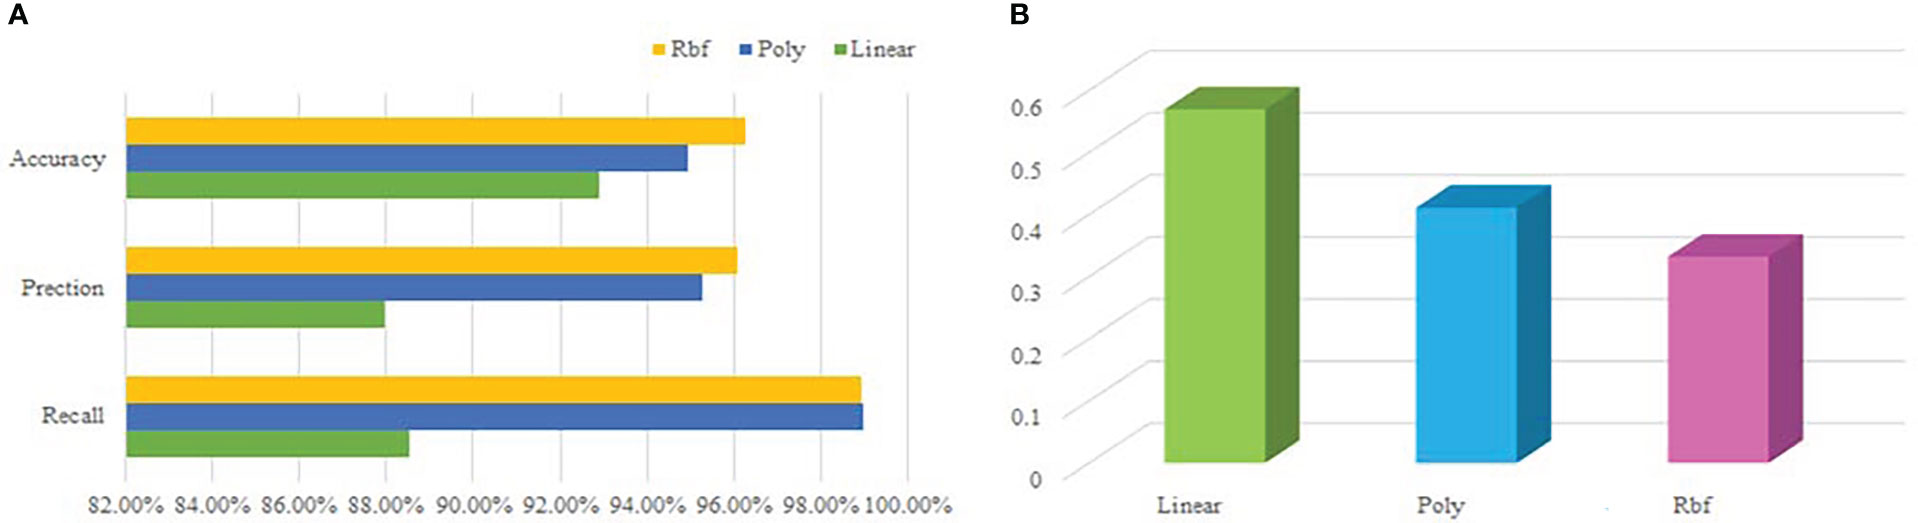
Figure 4 Results of different kernel function choices (A) Accuracy, precision and recall of model (B) RMSE for model.
As can be seen from Figure 4A, when the kernel function is Rbf, the accuracy, accuracy and recall rate of the model are all higher than those of the other two types of kernel functions, and the RMSE of the three types of kernel functions is shown in Figure 4B. The results show that the model can evaluate water quality more accurately when radial basis function is selected as kernel function.
The choice of SVM parameters had a great influence on the effectiveness of water quality assessment models, thus the particle swarm algorithm was used to optimize the SVM so as to obtain the best parameters.
To verify the effectiveness of the PSO algorithm, it was compared with the multi-classification SVM model optimized by the multi-classification SVM and genetic algorithm (Figure 5).
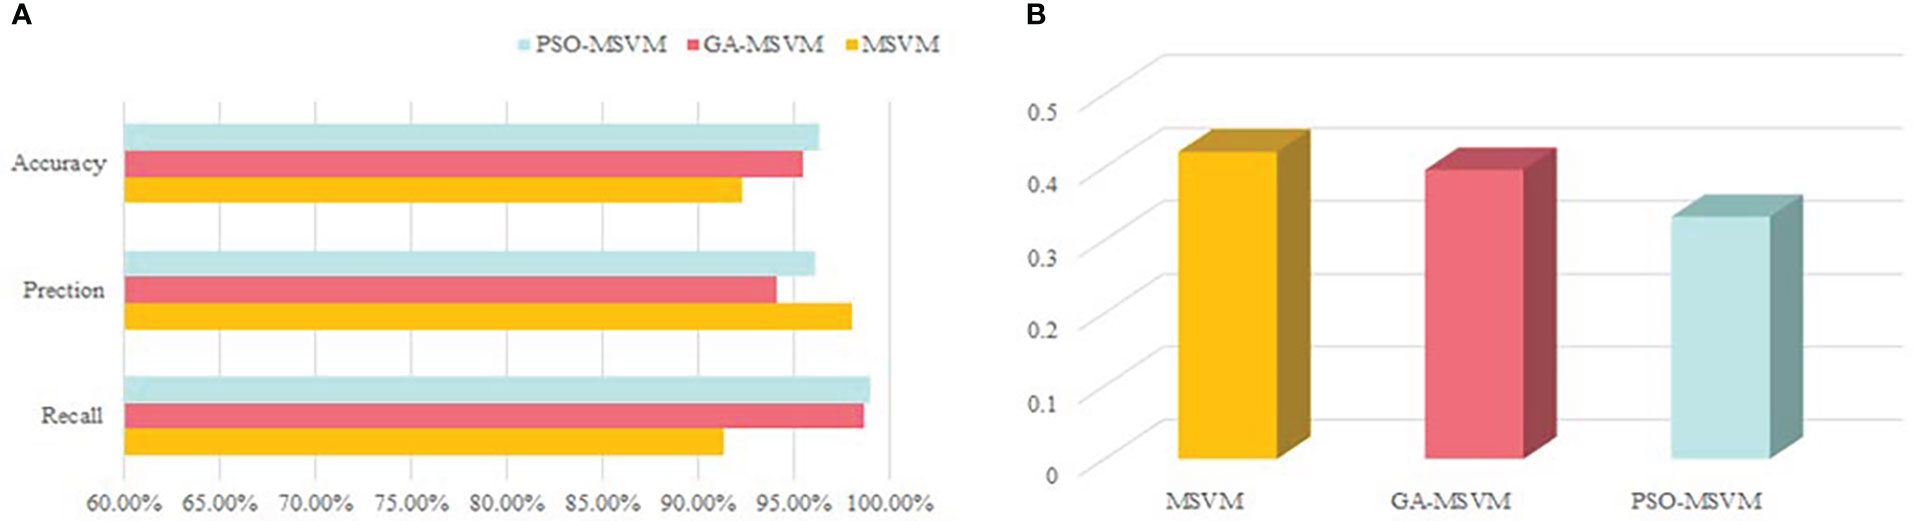
Figure 5 Results of different optimization algorithms. (A) Accuracy, precision and recall of model. (B) RMSE for model.
As shown in Figure 5A, the multi-classification SVM model using PSO has higher accuracy, precision, and recall and lower RMSE (Figure 5B). Based on the results, the particle swarm algorithm could better optimize the multi-classification SVM algorithm and effectively improved the performance of the water quality assessment model.
In this paper, the initial particle population and the maximum number of iterations were set to 300 and 300, respectively, and the learning factors c1 =1.6 and c2 = 2. A river water quality assessment model based on PSO-MSVM was developed using water quality indicators such as dissolved oxygen, temperature, turbidity, ammonia nitrogen, permanganate index, ph, and total dissolved solid of the river.
To verify the effectiveness of PSO-MSVM, it is compared with the PSO-DT and PSO-MLP algorithm models, and the results are illustrated in Figure 6.
Based on data in Figure 6A, the PSO-MSVM model has higher accuracy, precision, and recall compared to the other two algorithms, and the RMSEs of the three methods are displayed in Figure 6B. The results demonstrate that the PSO-MSVM model is more accurate in assessing river water quality.
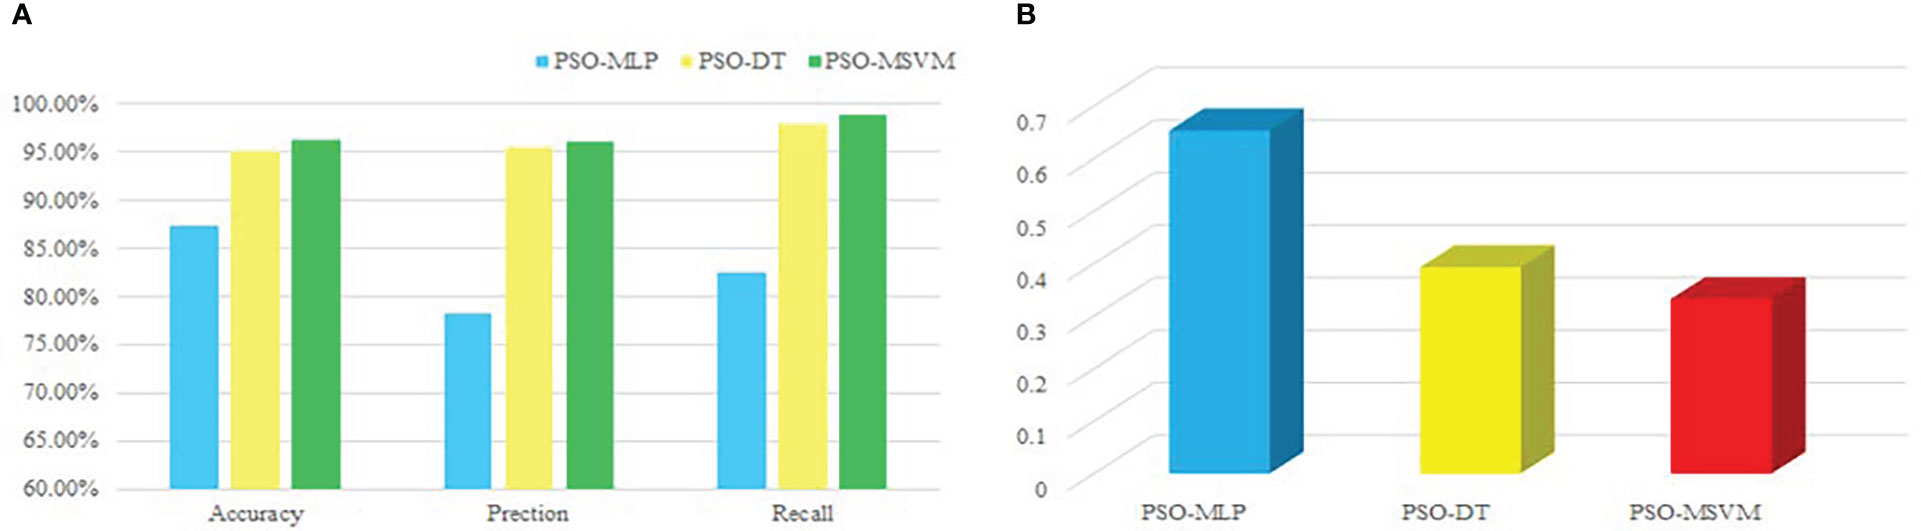
Figure 6 PSO-DT, PSO-MLP, PSO-MSVM model performance values. (A) Accuracy, precision and recall of model. (B) RMSE for model.
River water quality assessment is important for water environmental protection. Considering the weight and relevance of water quality information, a water quality assessment method based on ACGRA and PSO-MSVM was proposed in this study. First, the correlation of water quality information was calculated using ACGRA, and the four indicators with the greatest correlation were selected as input features. Then, the characteristics obtained by ACGRA were input into the PSO-MSVM model to assess the quality of the river water environment. This method was compared with other similar methods in the water quality monitoring data set of river sections in China from January to December 2021.
The experimental results show that ACGRA can effectively solve the problem of GRA equilibrium calculation, make full use of the weight and correlation of water quality indexes, and effectively select the main influencing indexes for water quality evaluation. And PSO-MSVM model can effectively overcome the problem of system parameter selection in support vector machine, make full use of water quality information, so as to improve the evaluation accuracy. However, using ACGRA for feature selection requires adequate water quality indicators. In addition, the large number of iterations of the particle swarm algorithm results in a long training time for the model. Further, given that the multi-classification SVM uses a voting mechanism to determine the result, the number of classifiers is required to be odd. In the future, the use of graphic processing units (GPUs) for training or improved particle swarm algorithms can be considered to increase the speed of the model and improve the multi-classification SVM algorithm so that it is also employed for the case of an even number of classifiers. The use of GPU for training can be considered in the future. The method can also be applied to the water quality assessment of drinking water, lakes, and oceans. Finally, in the future, it can be extended to air quality assessment, personal reputation assessment, and the like.
The raw data supporting the conclusions of this article will be made available by the authors, without undue reservation.
All authors designed the experiment and wrote the manuscript. All authors contributed to the article and approved the submitted version.
This work financially supported by was the Dalian Science and Technology Innovation Fund Project: Liupanshui Citizens’ Drinking Water Source Water Quality Monitoring and Early Warning System Construction (2020JJ27SN106).
The authors declare that the research was conducted in the absence of any commercial or financial relationships that could be construed as a potential conflict of interest.
All claims expressed in this article are solely those of the authors and do not necessarily represent those of their affiliated organizations, or those of the publisher, the editors and the reviewers. Any product that may be evaluated in this article, or claim that may be made by its manufacturer, is not guaranteed or endorsed by the publisher.
Abe, S. (2015). Fuzzy support vector machines for multilabel classification. Pattern Recognitions 48, 2110–2117. doi: 10.1016/j.patcog.2015.01.009
Chopade, S., Gupta, H. P., Mishra, R., Oswal, A., Kumari, P., Dutta, T. (2021). A sensors based river water quality assessment system using deep neural network. IEEE Internet Things J. 9, 14375–14384. doi: 10.1109/JIOT.2021.3078892
Coffey, L., Claudio, D. (2021). In defense of group fuzzy ahp: A comparison of group fuzzy ahp and group ahp with confidence intervals. Expert Syst. Appl. 178, 114970. doi: 10.1016/j.eswa.2021.114970
Dinh, H. N., Van der Baan, M. (2019). A grid-search approach for 4d pressure-saturation discrimination. Geophysics 94, IM47–IM62. doi: 10.1190/GEO2018-0541.1
Duvvuri, S. P., Anmala, J. (2019). Fecal coliform predictive model using genetic algorithm-based radial basis function neural networks (ga-rbfnns). Neural Computing Appl. 31, 8393–8409. doi: 10.1007/s00521-019-04520-2
El Mamoun, M., Mahmoud, Z., Kaddour, S. (2019). ). svm model selection using pso for learning handwritten arabic characters. Comput. Mater. Continua 61, 995–1008. doi: 10.32604/cmc.2019.08081
Gao, Z., Liu, Y., Li, N., Ma, K. (2022). An enhanced beetle antennae search algorithm based comprehensive water quality index for urban river water quality assessment. Water Resour. Manage. 193, 1–18. doi: 10.1016/j.eswa.2021.116404
Haixiang, G., Yijing, L., Shang, J., Mingyun, G., Yuanyue, H., Bing, G. (2017). Learning from class-imbalanced data: Review of methods and applications. Expert Syst. Appl. 73, 220–239. doi: 10.1016/j.eswa.2016.12.035
Hameed, S. S., Hassan, R., Muhammad, F. F. (2017). Selection and classification of gene expression in autism disorder: Use of a combination of statistical filters and a gbpso-svm algorithm. PloS One 12, e0187371. doi: 10.1371/journal.pone.0187371
Jung, K., Bae, D.-H., Um, M.-J., Kim, S., Jeon, S., Park, D. (2020). Evaluation of nitrate load estimations using neural networks and canonical correlation analysis with k-fold cross-validation. Sustainability 12, 400. doi: 10.3390/su12010400
Lu, J., Qiu, H., Zhang, Q., Lan, Y., Wang, P., Wu, Y., et al. (2022). Inversion of chlorophyll content under the stress of leaf mite for jujube based on model pso-elm method. Front. Plant Sci. 13. doi: 10.3389/fpls.2022.1009630
Sasikumar, G., Sudhakar, U., Jodhi, C., Sivasangari, A. (2022). Evaluation of wastewater treatment technologies by combined analytical hierarchy process and grey relational analysis. Global NEST J. 24, 607–612. doi: 10.30955/gnj.004373
Tang, L., Li, K., Jia, P. (2020). Impact of environmental regulations on environmental quality and public health in china: empirical analysis with panel data approach. Sustainability 12, 623. doi: 10.3390/su12020623
Tang, M., Xu, W., Zhang, C., Shao, D., Zhou, H., Li, Y. (2022). Risk assessment of sectional water quality based on deterioration rate of water quality indicators: A case study of the main canal of the middle route of south-to-north water diversion project. Ecol. Indic. 135, 108592. doi: 10.1016/j.eswa.2021.116404
Tan, X., Yu, F., Zhao, X. (2019). Support vector machine algorithm for artificial intelligence optimization. Cluster Computing 22, 15015–15021. doi: 10.1007/s10586-018-2490-7
Wang, G., Xiao, C., Qi, Z., Liang, X., Meng, F., Sun, Y. (2020). Water resource carrying capacity based on water demand prediction in chang-ji economic circle. Water 13, 16. doi: 10.3390/w13010016
Xu, T., Liu, X., Zhang, Z. (2020). Simplified likelihood estimation of ship total loss using gra and critic methods. Transportation Plann. Technol. 43, 223–236. doi: 10.1080/03081060.2020.1717147
Yan, B., Yu, F., Xiao, X., Wang, X. (2019). Groundwater quality evaluation using a classification model: a case study of jilin city, china. Natural Hazards 99, 735–751. doi: 10.1007/s11069-019-03770-6
Zavareh, M., Maggioni, V., Sokolov, V. (2021). Investigating water quality data using principal component analysis and granger causality. Water 13, 343. doi: 10.3390/w13030343
Zhang, Y., Chen, P., Li, X., Xu, Z. (2022b). Correlation analysis between microbial fouling resistance, flow rate and water quality parameters. Heat Mass Transfer 58, 981–989. doi: 10.1007/s00231-021-03155-1
Zhang, K., Wang, S., Liu, S., Liu, K., Yan, J., Li, X. (2022a). Water environment quality evaluation and pollutant source analysis in tuojiang river basin, china. Sustainability 14, 9219. doi: 10.3390/su14159219
Zhang, X., Yang, X., Yang, J. (2021). Teaching evaluation algorithm based on grey relational analysis. Complexity 2021. doi: 10.1155/2021/5596518
Zhao, Z., Zhou, Y., Wang, X., Wang, Z., Bai, Y. (2022). Water quality evolution mechanism modeling and health risk assessment based on stochastic hybrid dynamic systems. Expert Syst. Appl. 193, 116404. doi: 10.1016/j.eswa.2021.116404
Zheng, S., Gao, P., Zou, X., Wang, W. (2022). Forest fire monitoring via uncrewed aerial vehicle image processing based on a modified machine learning algorithm. Front. Plant Sci. 13. doi: 10.3389/fpls.2022.954757
Keywords: grey relational analysis, particle swarm optimization, support vector machine, water quality assessment, feature selection
Citation: Gai R and Guo Z (2023) A water quality assessment method based on an improved grey relational analysis and particle swarm optimization multi-classification support vector machine. Front. Plant Sci. 14:1099668. doi: 10.3389/fpls.2023.1099668
Received: 16 November 2022; Accepted: 06 January 2023;
Published: 25 January 2023.
Edited by:
Yirui Wu, Hohai University, ChinaReviewed by:
Jianxin Zhang, Dalian Minzu University, ChinaCopyright © 2023 Gai and Guo. This is an open-access article distributed under the terms of the Creative Commons Attribution License (CC BY). The use, distribution or reproduction in other forums is permitted, provided the original author(s) and the copyright owner(s) are credited and that the original publication in this journal is cited, in accordance with accepted academic practice. No use, distribution or reproduction is permitted which does not comply with these terms.
*Correspondence: Rongli Gai, Z2FpcmxpQHNpY3QuYWMuY24=
Disclaimer: All claims expressed in this article are solely those of the authors and do not necessarily represent those of their affiliated organizations, or those of the publisher, the editors and the reviewers. Any product that may be evaluated in this article or claim that may be made by its manufacturer is not guaranteed or endorsed by the publisher.
Research integrity at Frontiers
Learn more about the work of our research integrity team to safeguard the quality of each article we publish.