
95% of researchers rate our articles as excellent or good
Learn more about the work of our research integrity team to safeguard the quality of each article we publish.
Find out more
ORIGINAL RESEARCH article
Front. Plant Sci. , 22 March 2023
Sec. Plant Metabolism and Chemodiversity
Volume 14 - 2023 | https://doi.org/10.3389/fpls.2023.1025932
This article is part of the Research Topic Environmental and Agronomic Factors affecting the Chemical Composition and Biological Activity of Cannabis Extracts View all 8 articles
 Santiago Fernández1
 Rossina Castro1
 Andrés López-Radcenco2
 Paula Rodriguez3
 Inés Carrera4
 Carlos García-Carnelli1*
 Guillermo Moyna2*
While Cannabis sativa L. varieties have been traditionally characterized by their major cannabinoid profile, it is now well established that other plant metabolites can also have physiological effects, including minor cannabinoids, terpenes, and flavonoids. Given the multiple applications of cannabis in the medical field, it is therefore critical to characterize it according to its chemical composition (i.e., its metabolome) and not only its botanical traits. With this in mind, the cannabinoid and metabolomic profiles from inflorescences of two C. sativa varieties with either high Δ9-tetrahydrocannabinolic acid (THCA) or high cannabidiolic acid (CBDA) contents harvested at different times were studied. According to results from HPLC and NMR-based untargeted metabolomic analyses of organic and aqueous plant material extracts, we show that in addition to expected variations according to cannabinoid profiles, it is possible to distinguish between harvests of the same variety. In particular, it was possible to correlate variations in the metabolome with presence of powdery mildew, leading to the identification of molecular markers associated with this fungal infection in C. sativa.
Cannabis (Cannabis sativa L.) is a widely distributed plant that has been a source of fiber, food, oil, and medicines for millennia (Clarke and Merlin, 2016). The first reports regarding its medicinal use date back to the third millennium BC in ancient China (Wills, 1998). Since then, several cultures have employed cannabis preparations to treat a variety of ailments (Russo, 2014). Since our understanding of its therapeutic potential is continuously improving, the interest in cannabis as a source of compounds for use in medicinal preparations has increased notably (Procaccia et al., 2022). Furthermore, the non-pharmacological uses of the plant and its derivatives, particularly as a source of fibers and as a recreational drug, are well known.
C. sativa produces an important number of secondary metabolites, and more than 500 compounds have been identified in cannabis so far (ElSohly and Gul, 2014). In particular, cannabinoids, terpenoids, and flavonoids stand out (ElSohly and Slade, 2005). Of the three compound classes, the former are of great relevance given their biological activity and the fact that they are almost exclusively found in this plant (Hanuš et al., 2016; Gülck and Møller, 2020). Most of the known pharmacological properties are associated to these naturally-occurring compounds, particularly Δ9-tetrahydrocannabinol (THC) and cannabidiol (CBD). These compounds are present mostly as carboxylic acids in the plant, namely Δ9-tetrahydrocannabinolic and cannabidiolic acids (THCA and CBDA), and are transformed to the neutral molecules through non-enzymatic decarboxylation (Flores-Sanchez and Verpoorte, 2008). However, the biological effects of C. sativa do not depend only on the levels of THC and CBD (Procaccia et al., 2022). Indeed, nearly 150 phytocannabinoids which can be classified in different structural subclasses have been isolated from this plant (Hanuš et al., 2016), and several of these compounds, sometimes referred to as minor cannabinoids, have pharmacological potential (Franco et al., 2020). Furthermore, a number of studies suggest that the interaction or synergy between these cannabinoids and other secondary metabolites leads to more pronounced effects than those produced by the isolated compounds (Russo, 2011; Blasco-Benito et al., 2018; Russo, 2019; Maayah et al., 2020; Goerl et al., 2021). In addition, the botanical diversity of C. sativa has resulted in longstanding discussions regarding its taxonomical characterization. It is now generally accepted that the plant is a single species that can be classified in different subspecies and varieties (Small, 2015; McPartland, 2018). Independently of the names and botanical traits used to refer to it, the chemical composition is what will determine the pharmacological usefulness of the plant. Therefore, several authors stress that the categorization of C. sativa varieties should be done according to its chemical profile (Russo, 2019), and refer to them as chemical varieties or chemovars (Lewis et al., 2018).
In addition to secondary metabolite content, the quality of a medicinal plant is also given by the absence of contaminants and adulterants. Natural contaminants are usually introduced during cultivation and storage, and consist of degradation products, microbial contamination, and heavy metals (American Herbal Pharmacopoeia, 2014). In particular, fungi can colonize different organs of the plant, causing a reduction in the quality of the products (Punja et al., 2019). Furthermore, the consumption of a contaminated product can cause harmful effects on the health of consumers (Montoya et al., 2020). Microbial infections can also lead to biotic stress, which can alter the secondary metabolite composition (Gorelick and Bernstein, 2017).
While the determination of the main cannabinoid content is a required assay for cannabis products that rely on the biological activity of the plant extract, comprehensive knowledge of the profile of other secondary metabolites in these materials is also relevant (Jin et al., 2021). Thus, establishing the metabolic fingerprints can provide important information to assure the composition and quality of a given C. sativa chemovar (Puri et al., 2021). Variations in this profile can indicate that the material is not appropriate for its intended uses. In particular, the discrimination between chemovars can be conveniently carried out through NMR-based metabolomic analysis (Choi et al., 2004a). Indeed, a recent review concludes that metabolomics represents an ideal bioanalytical tool that could greatly assist and accelerate cannabis research and development, even coining the term “cannabinomics”(Aliferis and Bernard-Perron, 2020).
In the present report we carry out an exhaustive characterization of a high-THCA and a high-CBDA C. sativa chemovars, both with medicinal potential, through the determination of metabolite profiles complemented with basic information derived from cannabinoid composition. Briefly, our results not only allowed us to clearly distinguish between the two plant varieties, but also to identify a crop with a microbial infection that, interestingly, does not alter the main cannabinoid profile and yield in a relevant way. Furthermore, through metabolomic analysis it was possible to identify variations in specific metabolites that could shed light on infection mechanisms.
Analytical grade chloroform and methanol were from Dorwil (Buenos Aires, Argentina), HPLC grade acetonitrile was obtained from Carlo Erba (Val-de-Reuil, France), and formic acid, choline (> 98%), deuterochloroform (CDCl3, 99.8%), and deuterium oxide (D2O, 99.9%) were purchased from Merck (Kenilworth, NJ, USA). Betaine (> 98%) was from Thermo Fisher Scientific (Geel, Belgium). Diazepam (> 99.9%) and standard solutions of CBDA, CBD, cannabichromene (CBC), cannabinol (CBN), cannabigerol (CBG), THCA, THC, and Δ8-THC at 1 mg/mL were purchased from Lipomed (Cambridge, MA, USA). Standard solutions of Δ9-tetrahydrocannabivarinic acid (THCVA), Δ9-tetrahydrocannabivarin (THCV), cannabigerolic acid (CBGA), cannabidivarinic acid (CBDVA), cannabidivarin (CBDV) and cannabichromenic acid (CBCA) at 1 mg/mL were purchased from Cerilliant (Round Rock, TX, USA).
Cannabis sativa L. female inflorescences were donated by Khiron Life Sciences Uruguay S.A. and employed in compliance with guidelines from a scientific research license granted by the Instituto de Regulación y Control del Cannabis (IRCCA). Plant material from a drug chemotype high in THCA (chemovar A) and a fiber chemotype high in CBDA (chemovar B) were used. Plants were grown under identical indoor conditions, which consisted of temperature and relative humidity ranges of 24-28 °C and 60-70% for the vegetative stage, and 20-26 °C and 55-70% for the flowering stage. Samples were obtained from three different harvests for each chemovar. In the case of chemovar A, these were carried out on March, June, and September 2020, while for chemovar B harvests were on March, June, and December 2020.
Samples for cannabinoid composition determinations were dried at 35 °C for 24 h and ground with a manual herb grinder. Once a particle size range from 0.5 to 2 mm was obtained, 500 mg were extracted with a 9:1 methanol-chloroform mixture by dynamic maceration for 30 min at room temperature, followed by sonication for 15 min. The extract was then filtered and diluted with methanol to a final volume of 50 mL. A 100 μL aliquot of this solution was evaporated under a nitrogen stream and redissolved in 100 μL to 1 mL of acetonitrile containing diazepam (10 μg/mL) as an internal standard. The resulting solutions were employed in chromatographic analyses using the conditions detailed below. These extractions were performed in duplicate.
For NMR-based metabolomic analyses, 20 samples per chemotype from each harvest were collected, frozen in liquid nitrogen, ground manually using a glass rod, and stored at -20 °C. Extractions were carried out following a method originally proposed by Choi and coworkers (Choi et al., 2004a). Briefly, 500 mg of each sample were suspended in 10 mL of a 1:1:2 methanol-water-chloroform mixture, subjected to vortex agitation for 30 s, sonicated for 1 min, and then centrifuged at 3000 rpm for 20 min. Phases were separated and the extraction of the plant material was repeated. Following phase separation, organic solvents were removed in a rotary evaporator under vacuum at 35 °C, while aqueous phases were dried by lyophilization. Two dry extracts per sample were obtained.
The main cannabinoid composition was determined using a recently reported method (Fernández et al., 2022), using a Shimadzu DGU-205R Ultra HPLC-PDA system equipped with a Hypersil C18 (150 × 4.6 mm, 3 μm particle size) column and a Hypersil BDS C18 (10 × 4 mm, 3 μm particle size) precolumn (ThermoFisher Scientific, Waltham, MA, USA). Linear calibration curves (r2 > 0.99) for all cannabinoids analyzed were constructed in the range of 1 to 100 μg/mL. The column oven was set to 25 °C, the injection volume was 10 μL, and the total run time was 18 min using a solvent gradient composed of 1.0 mM formic acid buffer at pH 3.53 (solvent A) and acetonitrile (solvent B) as mobile phase at 1 mL/min flow. The gradient started with 70% B for 7 min, then increased to 83.5% B and held constant for 1 min, then increased to 88.5% B over a 3 min period, 1 additional min to reach 99% B, then kept constant for 2 min followed by a 2 min to lower B to 70%, and finally held constant for 2 min. This method allowed the separation of the 14 cannabinoids available from a mix of standards.
Organic extracts were dissolved in 0.7 mL of CDCl3 and aqueous extracts in 0.7 mL of D2O, and then transferred to 5 mm NMR tubes (New Era Enterprises Inc., Vineland, NJ, USA). All NMR spectra were recorded at 25 °C on a Bruker AVANCE III 500 NMR spectrometer operating at 1H and 13C frequencies of 500.13 and 125.76 MHz, respectively, and equipped with a z-gradient TXI probe. A spectral width of 10 KHz, a data size of 32 K, and a total of 64 scans were employed to record 1D spectra, using a relaxation delay of 4 s between scans. Regular 1D acquisition sequences with 30o excitation pulses were employed, using a standard water presaturation scheme with aqueous samples. When required, 1D-TOCSY, 1D-NOESY, HSQC, and HMBC spectra were acquired and processed using acquisition and processing parameters provided with the spectrometer.
To confirm the presence of choline and betaine in the aqueous extracts, 10 μL aliquots from 50 mM standard solutions of each compound were added to selected samples, and the 1D 1H NMR experiments repeated under the same conditions described above.
NMR data for metabolomic analyses were processed and analyzed with MNova (version 12.0, MestreLab Research, S.L., Santiago de Compostela, Spain). Free induction decays were zero-filled to 64 K points and apodized with a 0.3 Hz exponential window function prior to Fourier transformation. All spectra were manually phase- and baseline-corrected and referenced. In the case of organic extracts, the residual CHCl3 solvent signal at 7.28 ppm was used for calibration, while the anomeric proton signal of α-glucose at 5.22 ppm was employed in aqueous samples. Spectra corresponding to the same class of extract were aligned using PAFFT (Wong et al., 2005), and the data was normalized to the total spectral area after excluding residual solvent resonances and regions without signals. The resulting data matrices were finally exported as text files for use in statistical analyses.
Multivariate statistical analyses, including principal component analysis (PCA) and orthogonal partial least squares discriminant analysis (OPLS-DA), were carried out with the PLS_Toolbox package (version 8.5, Eigenvector Research Inc., Manson, WA, USA) implemented for MATLAB (revision 2014a, The MathWorks Inc., Natick, MA, USA). For all models, the data was mean-centered and scaled using a Pareto factor (van den Berg et al., 2006). Analysis of the data was first performed with PCA, which reduces the dimensionality and facilitates the identification of data clusters or trends (Wold et al., 1987; Trygg and Wold, 2002; Trygg et al., 2007). The PCA scores plot was also employed to identify strong outliers outside the 95% significance region of Hotelling’s T2 ellipse. Cross-validation of OPLS-DA models was achieved using the random subset method, which involved 20 iterations over data split into 10 equally-sized parts. Receiver operating characteristic (ROC) curves were plotted, and areas under the curves were calculated to ensure the goodness of fit of the resulting models (Ekelund, 2012; Simundic, 2012). Permutation tests with 100 iterations were also performed to determine the degree of over-fitting and further validate the discriminant analyses (Ni et al., 2008). When needed, statistical total correlation spectroscopy (STOCSY) analyses were performed with an in-house MATLAB script based on the algorithm described by Cloarec and coworkers (Cloarec et al., 2005).
The fungal infection was evidenced by the presence of off-white powdery spots typical of powdery mildew disease. Microscopic examination of fungi was carried out with a Nikon Eclipse E100 optical microscope. To examine asexual morphs, a piece of clear adhesive tape was placed on infected leaves, stripped off, and placed on a microscope slide with one drop of distilled water. The observations were done at magnifications of 40, 100, and 400 under standard light. Germinated conidia were examined on fungi grown with potato dextrose agar medium.
Tables 1, 2 show the cannabinoid composition of chemovars A and B. As expected, the two are notably different, and characterized, respectively, by their particularly high content of THCA and CBDA. Moreover, the acidic forms of other cannabinoids are also predominant, and CBN was only detected in one sample and below the quantification limits. This suggests that little degradation occurred during sample handling and analysis. For chemovar A, the total cannabinoid content ranged from 15.14 ± 0.50 to 16.70 ± 1.10%, with a mean of 15.50 ± 1.10% (n = 6, two samples per crop, three crops). Similarly, the cannabinoid content in chemovar B crops ranged from 16.50 ± 0.43 to 18.36 ± 0.08% with a mean of 17.60 ± 0.80% (n = 6, two samples per crop, three crops). These results agree with literature reports, which indicate average cannabinoid contents in inflorescences ranging from 5 to 25% (Jin et al., 2021). Inspection of the results also shows that relative cannabinoid composition and total cannabinoid yield is stable through the crops in both chemovars.
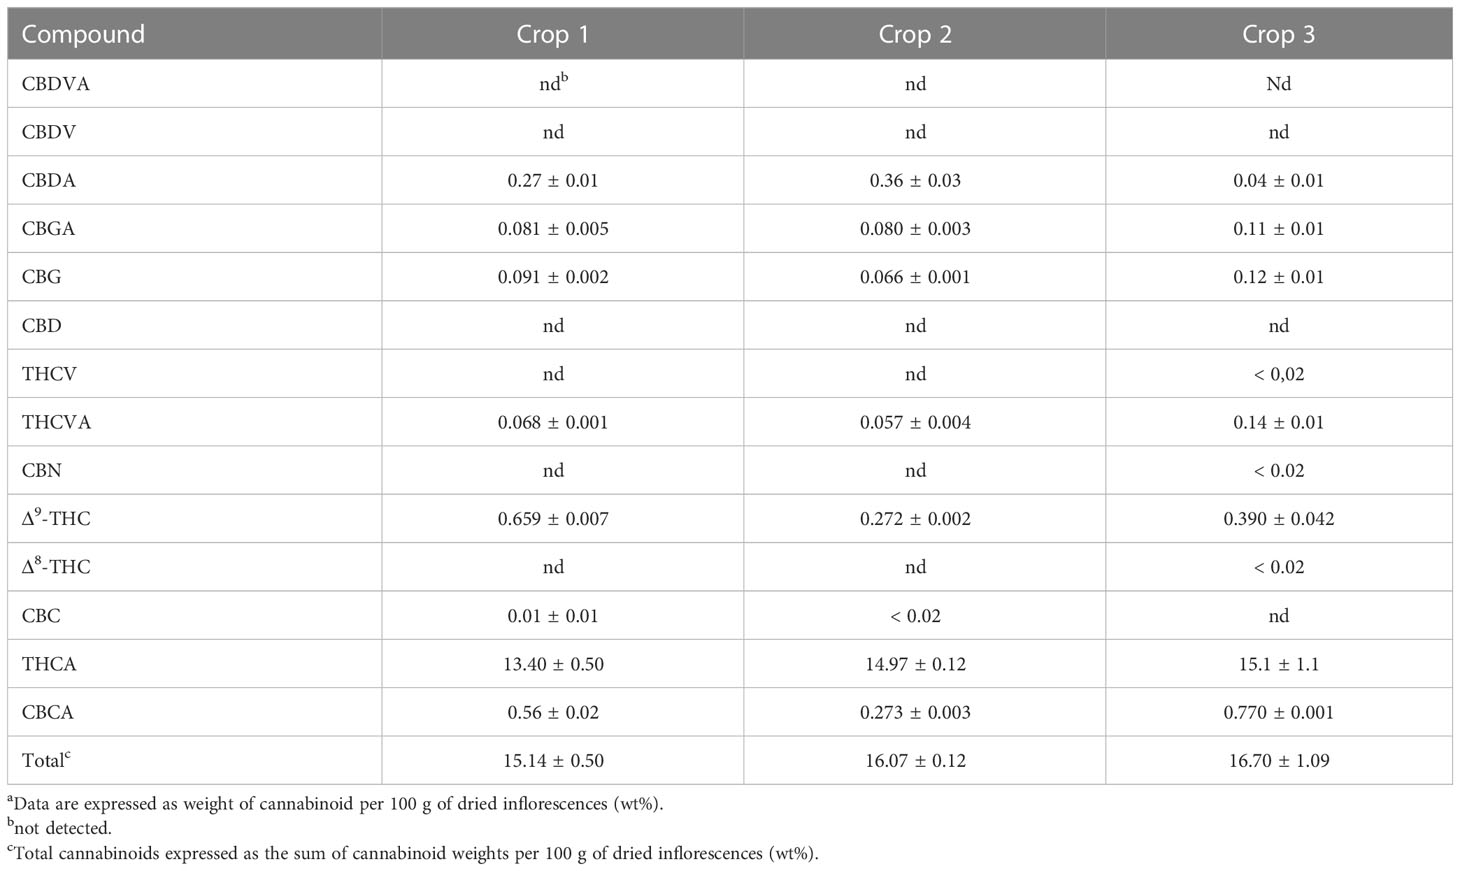
Table 1 Composition of chemovar A plant material (mean ± SD)a.
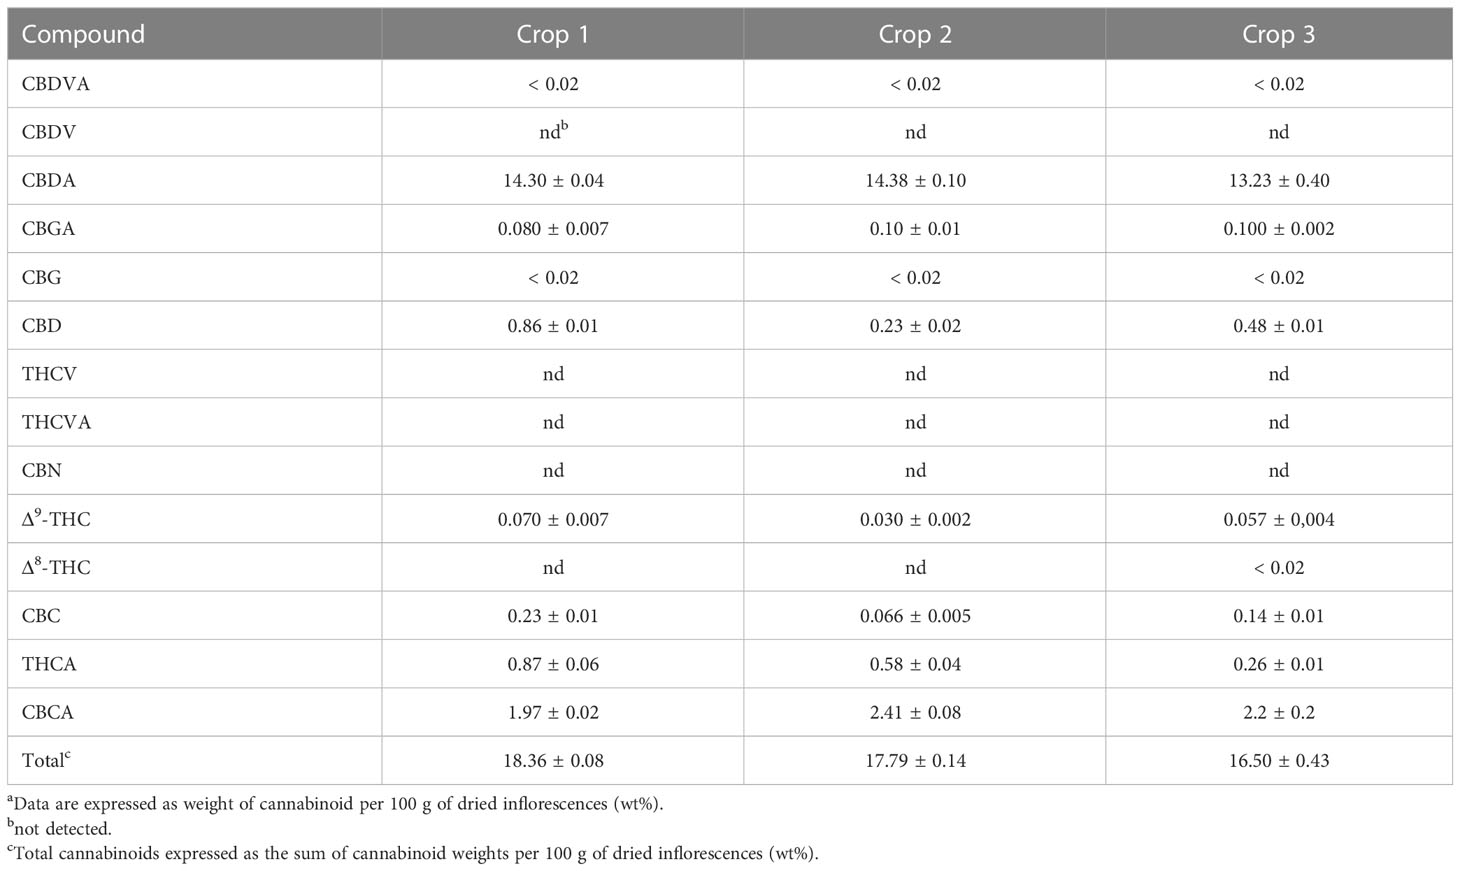
Table 2 Composition of chemovar B plant material (mean ± SD)a.
Following the determination of the basic cannabinoid composition, the metabolic profiles for both C. sativa varieties were investigated. For this purpose, 20 samples of each chemovar from the three harvests considered were collected, resulting in a total of 60 organic and 60 aqueous extract samples. PCA score plots obtained from the 1H NMR data recorded for the two sets are shown in Figure 1. It is clear that both chemovars can be easily differentiated on the basis of NMR data from their organic or aqueous extracts. Indeed, the first two PCs account for 73.7% of the variance in the organic set, with samples from chemovar A forming a cluster showing positive PC1 scores, whereas chemovar B samples have negative scores on this PC. Similarly, only two PCs were sufficient to account for nearly 90% of the variance in the aqueous data set.
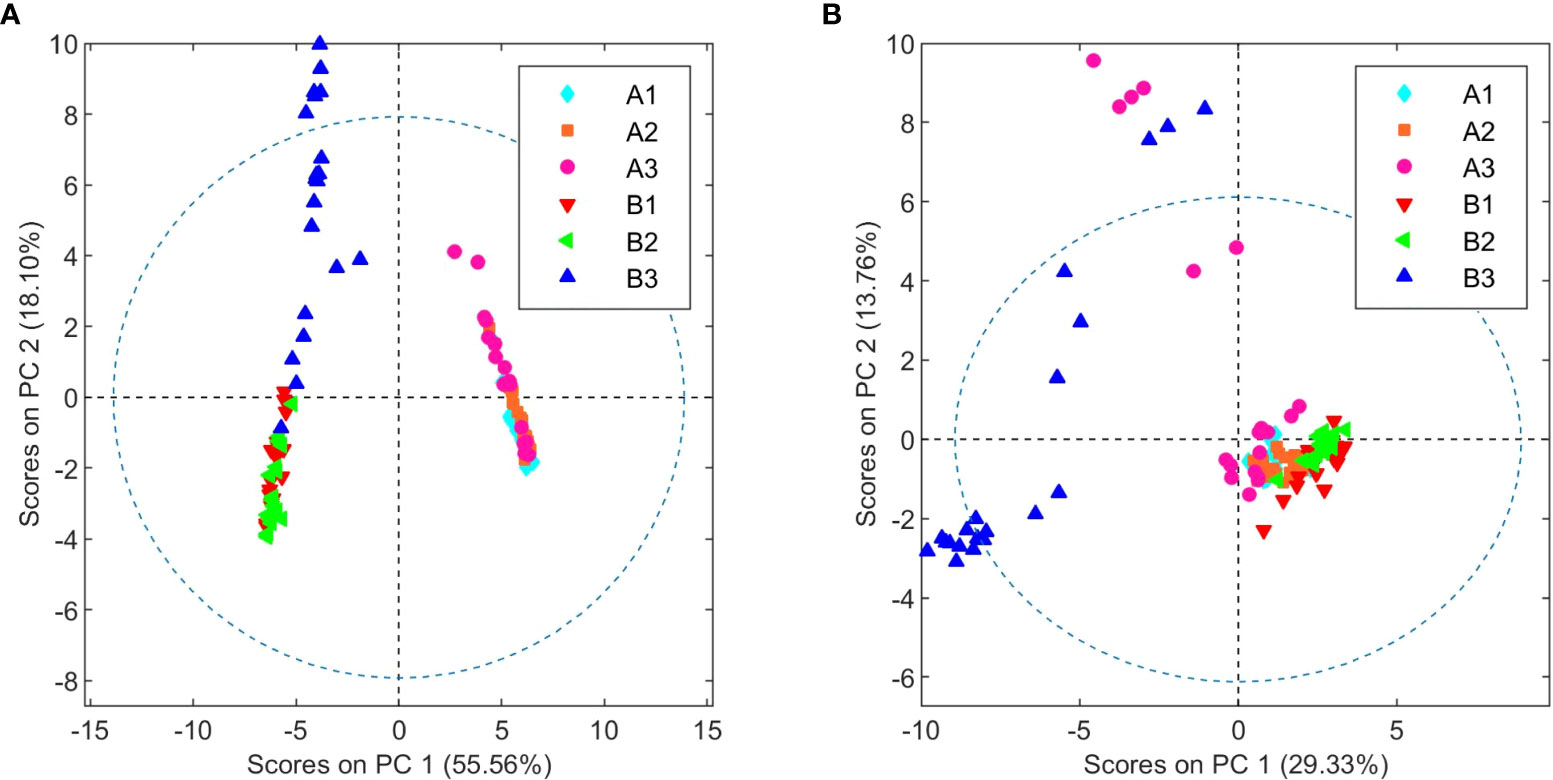
Figure 1 PCA score plots of organic (A) and aqueous (B) extracts from chemovars A and B colored according to harvest.
Cursory inspection of both PCA plots indicates that six of the aqueous samples corresponding to the third crop of chemovar A deviate from the others, suggesting errors during the preparation of these samples. On the other hand, all 20 organic and aqueous extracts from the third crop of chemovar B deviate considerably from the rest. As discussed below, this is likely associated with fungal infections affecting plants from this particular crop. Therefore, the PCA score plots were recomputed without the outliers from both chemovars. As shown in Figure 2, 1H NMR profiles from organic and aqueous extracts can still differentiate the two chemovars clearly.
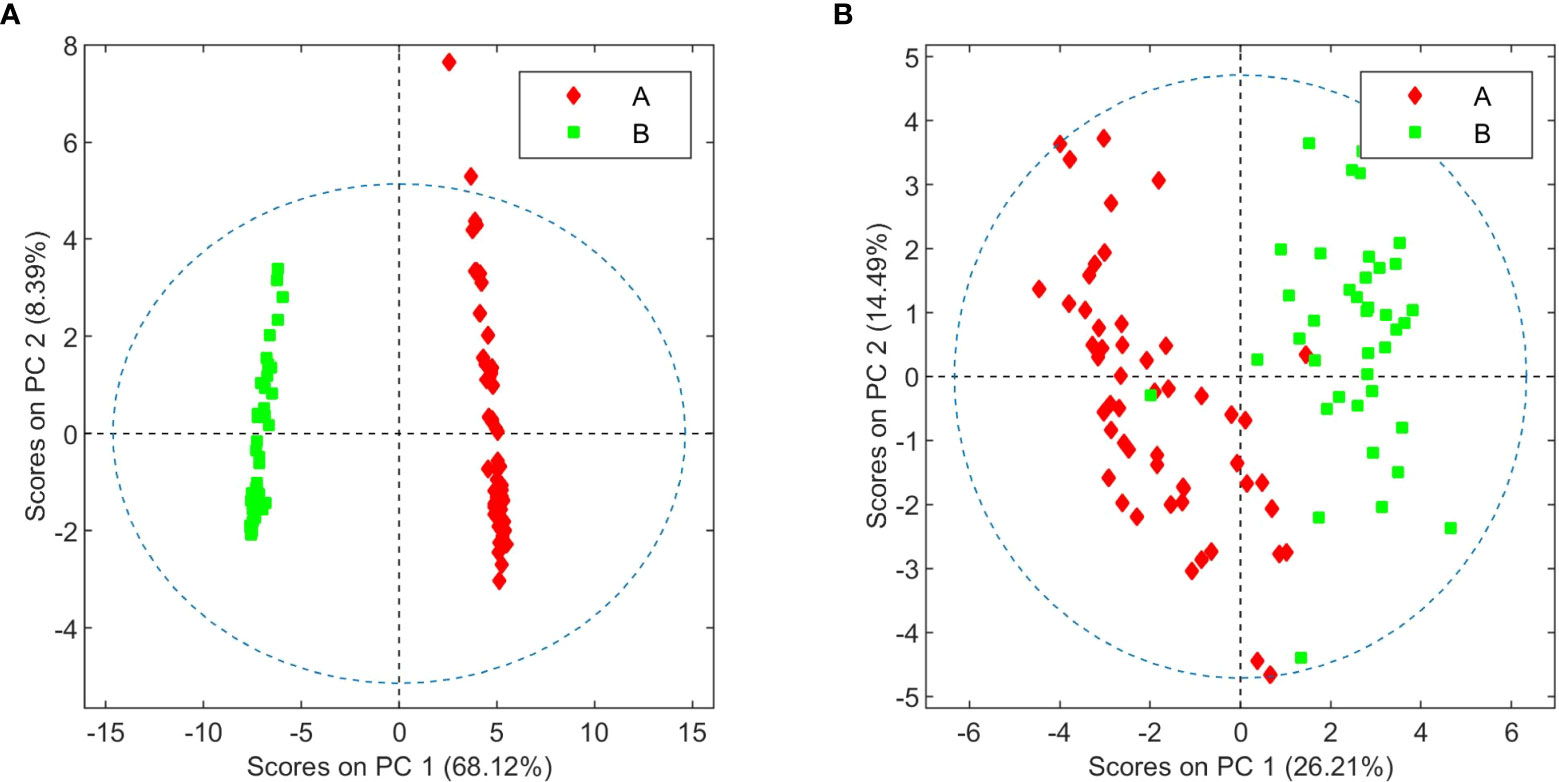
Figure 2 PCA score plots of organic (A) and aqueous (B) extracts from chemovars A and B after removal of outliers.
In order to identify the metabolites that differentiate the two chemovars, OPLS-DA models from the depurated organic and aqueous extract 1H NMR datasets were generated. Inspection of the OPLS-DA loading factor plot obtained from organic extracts indicates that signals at 1.44, 1.25, and 1.11 ppm, corresponding to THCA, correlate to chemovar A, while signals for CBDA at 1.80 and 1.72 ppm corroborate that the levels of this cannabinoid are higher in chemovar B (Figure 3) (Choi et al., 2004b). These results are not surprising and are consistent with those obtained by the HPLC analyses presented in Tables 1, 2.
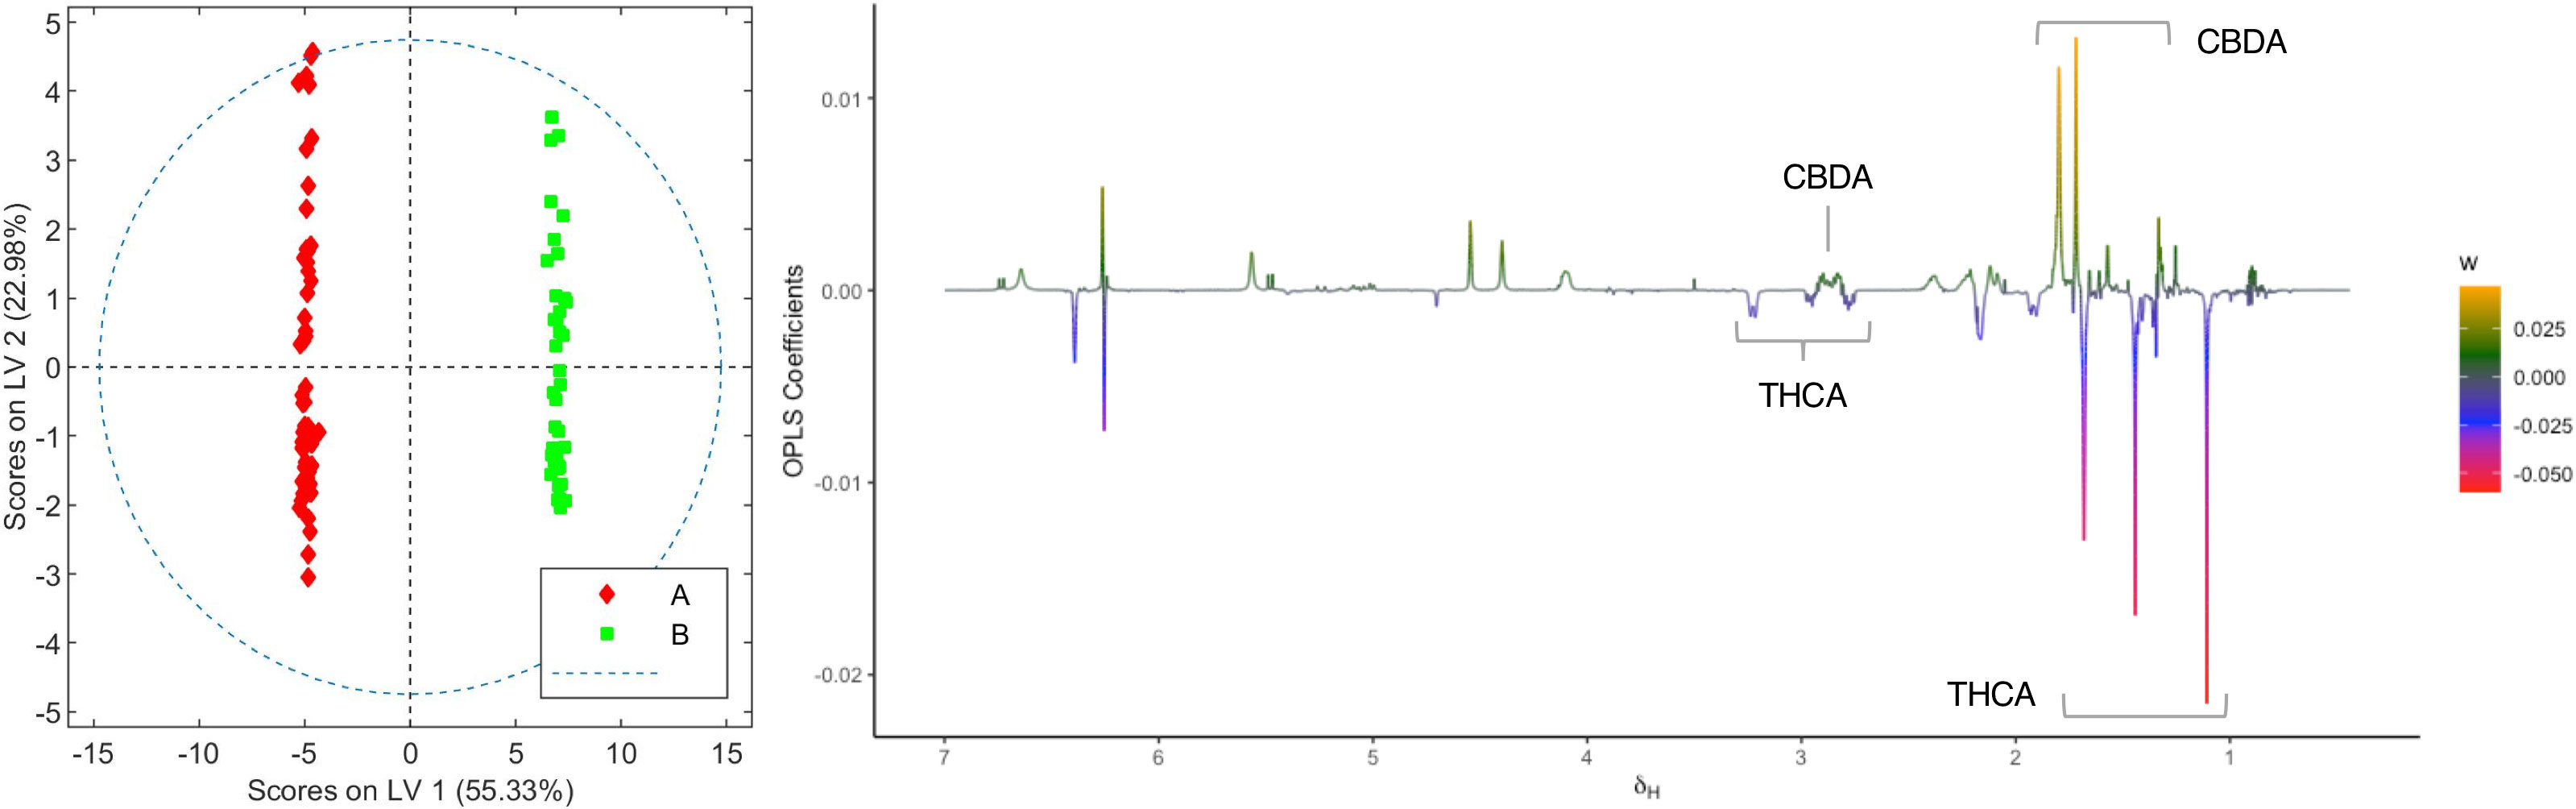
Figure 3 Score and loading factor plots obtained from the OPLS-DA between organic extracts of chemovars A and B. The metabolites that differentiate the two groups are annotated in the loading factor plots. The R2Y and Q2Y coefficients for the model were 0.99 and 0.99, respectively, and the ROC curve had an AUC value of 1.00 (see Figures S1, S2).
When the loading factor plot of the OLPS-DA between aqueous extracts of the two chemovars was analyzed (Figure 4), positive signals at 4.10, 4.03-3.97, 3.88, 3.82-3.77, 3.70-3.63, and 3.59-3.52 ppm, and at 3.99, 2.93, and 2.84 ppm, which can be respectively assigned to fructose and aspartate by comparison to literature data (Wishart et al., 2009; Barclay et al., 2012; de Falco et al., 2016), show that the levels of these two metabolites are higher in chemovar B plants. In addition, a positive signal at 3.23 ppm with an HSQC correlation to a 13C resonance at 53.4 ppm likely corresponds to the N-methyl groups of betaine (de Falco et al., 2016; Wishart et al., 2022), indicating that the levels of this trimethylammonium-bearing metabolite are also higher in the high-CBDA chemovar specimens (Figure S3). This initial assignment was confirmed by spiking one of the aqueous extract samples with a betaine standard solution (see Figure S4). On the other hand, negative peaks at 4.24, 4.04, 3.73, 3.59, 3.57, 3.44, and 3.38 ppm match nicely with reference data for the carbasugar quebrachitol (De Almeida et al., 2012). This reveals that the concentration of this cyclitol, whose identity was further established by means of STOCSY, 1D-TOCSY, 1D-NOESY, and heteronuclear correlation NMR experiments (see Figures S5–S7; Table S1), is higher in chemovar A plants. Moreover, a negative singlet at 3.18 ppm correlating to a 13C resonance at 53.9 ppm in the HSQC spectrum corresponds to choline (de Falco et al., 2016; Wishart et al., 2022), suggesting that the levels of this quaternary aminoalcohol are higher in the high-THCA C. sativa variety (Figure S8). As was the case for betaine, this assignment was confirmed unequivocally by spiking experiments (Figure S4).

Figure 4 Score and loading factor plots obtained from the OPLS-DA between aqueous extracts of chemovars A and B. The metabolites that differentiate the two groups are annotated in the loading factor plots. The R2Y and Q2Y coefficients for the model were 0.91 and 0.83, respectively, and the ROC curve had an AUC value of 0.98 (see Figures S9, S10).
Plants from the third crop of chemovar B showed signs of powdery mildew infection. The morphological characteristics of this fungal leaf growth and its asexual microscopic structures allowed us to classify it as a member of the Golovinomyces genus (Figures S11, S12). Since this infection was also clearly evidenced in the initial clustering analyses depicted in Figure 1, we decided to carry out a more exhaustive comparison between healthy and infected plants within this chemovar using OPLS-DA. As shown in Figure 5, the model obtained with 1H NMR data from organic extracts easily differentiates inflorescences of the first two crops (B1+B2) from those of the third (B3). The corresponding loading factor plot identifies CBDA as one of the discriminating metabolites in this case, and, in agreement with HPLC findings presented in Table 2, indicates that higher concentrations of this cannabinoid are present in healthy plants of the high-CBDA chemovar. On the other hand, higher levels of waxes, with signals at 2.42, 1.70, 1.28-1.25, and 0.92 ppm (Stoianova-Ivanova et al., 1974), are found in infected plant extracts.
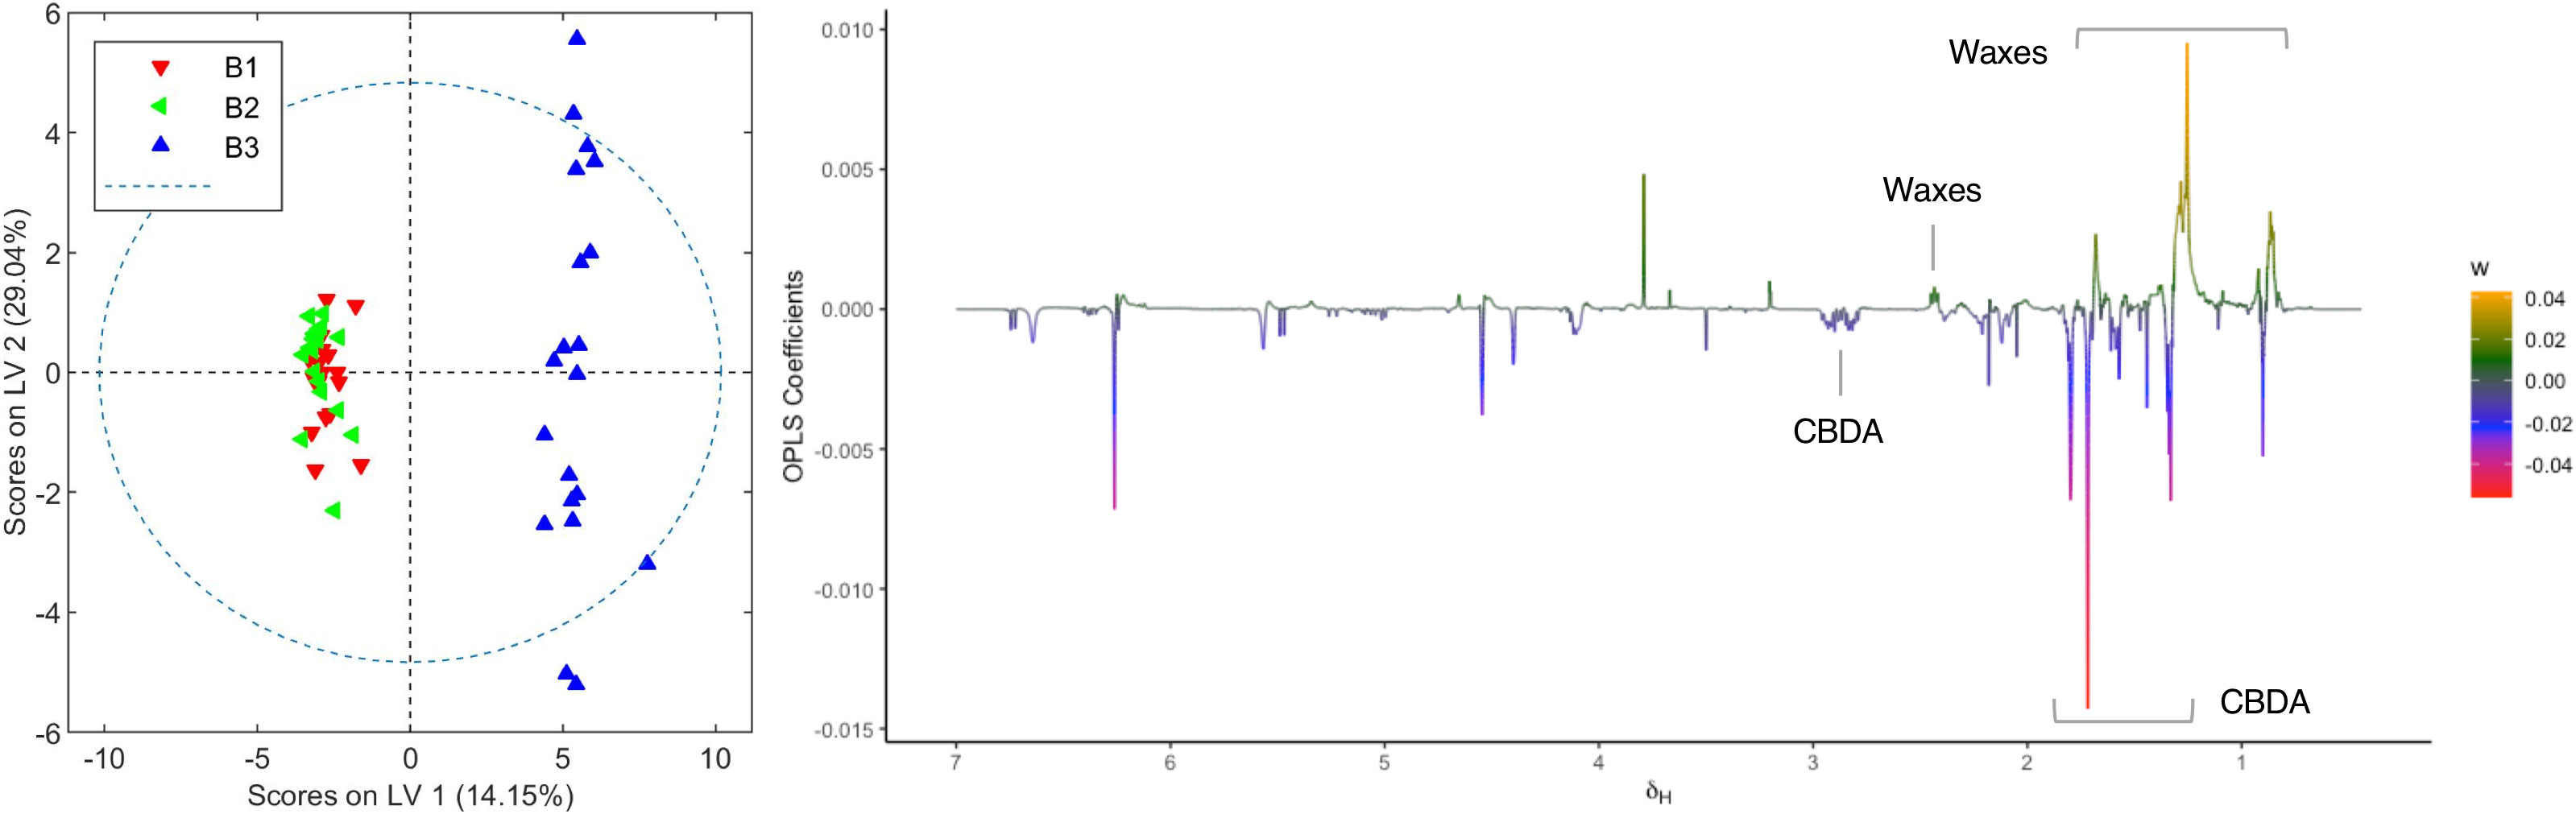
Figure 5 Score and loading factor plots obtained from the OPLS-DA between organic extracts of healthy and infected crops of chemovar B. The metabolites that differentiate the two groups are annotated in the loading factor plots. The R2Y and Q2Y coefficients for the model were 0.98 and 0.91, respectively, and the ROC curve had an AUC value of 1.00 (see Figures S13, S14).
The OPLS-DA model comparing aqueous extracts from the B1+B2 harvest versus those from B3 can also classify healthy and infected plants correctly (Figure 6). As observed in the loading factor plot, aspartate, choline, and fructose are in this case associated with healthy chemovar B specimens, while the levels of betaine are higher in infected plants.
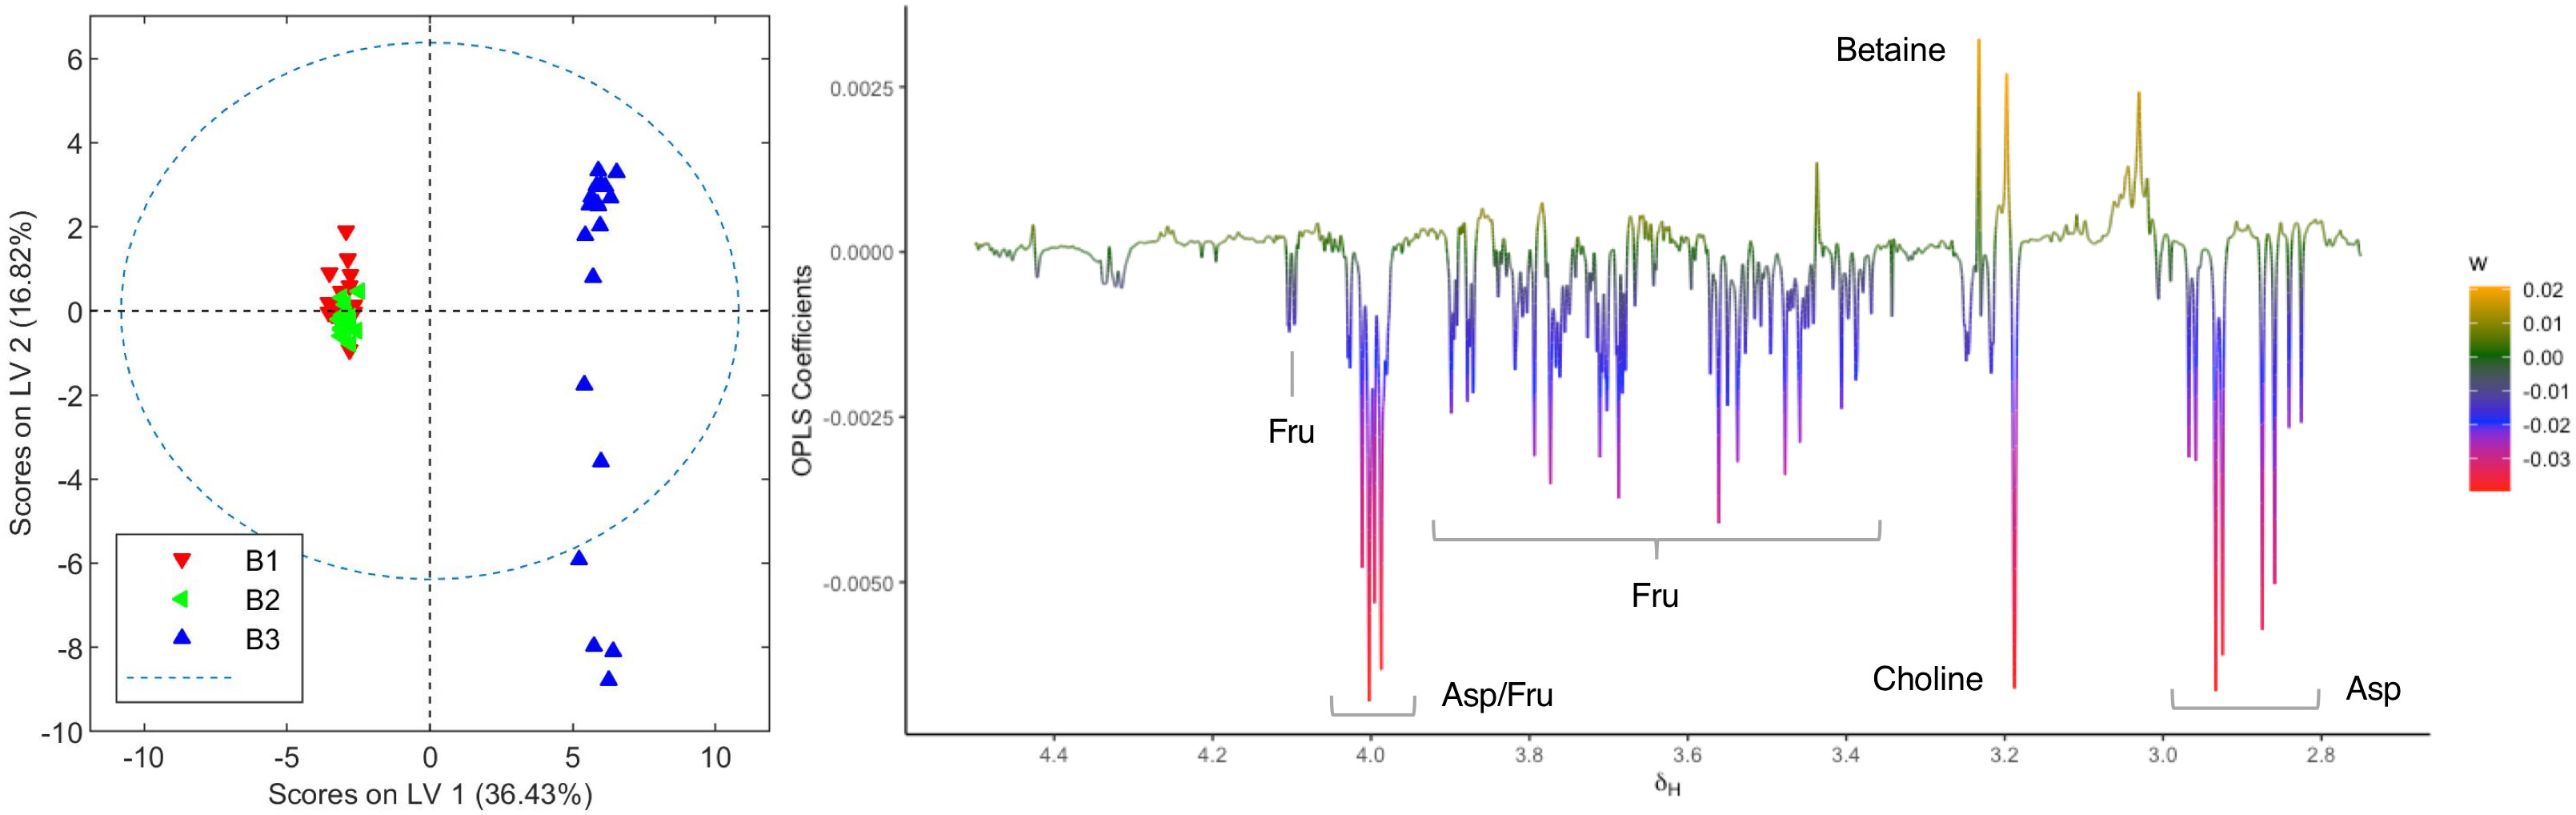
Figure 6 Score and loading factor plots obtained from the OPLS-DA between aqueous extracts of healthy and infected crops of chemovar B. The metabolites that differentiate the two groups are annotated in the loading factor plots. The R2Y and Q2Y coefficients for the model were 0.99 and 0.98, respectively, and the ROC curve had an AUC value of 1.00 (see Figures S15, S16).
As stated in the introduction, our initial goal was to perform an exhaustive chemical characterization of a high-THCA and a high-CBDA C. sativa chemovars with medicinal potential through the determination of their metabolic profiles. Our results revealed a number of differences between the two varieties beyond their cannabinoid composition. This is an important finding since more than five hundred different compounds have been reported in the plant, some with potential therapeutic qualities, and combinations of the various secondary metabolites could determine both the final medicinal response as well as any adverse effects (Lowe et al., 2021; Procaccia et al., 2022). In fact, and despite the results from NMR-based metabolomic analysis of organic extracts presented in Figures 2, 3 parallel those obtained through HPLC (Tables 1, 2), the study of aqueous fractions identified aspartate, betaine, choline, fructose, and quebrachitol as metabolites that can further discriminate between the two chemovars. The differences in sugar and aminoacid contents, which have been described by Choi and coworkers in their seminal report on the application of metabolomic profiling to the characterization of cannabis cultivars (2004a), could be employed to better fingerprint cannabis varieties and products intended for use as botanical drugs. This is also the case for quebrachitol, a long-known component of C. sativa (Adams et al., 1940; Groce and Jones, 1973). Indeed, variations in the concentration of this cyclitol have also been employed to address the phenotypical plasticity in other plants (Kortesniemi et al., 2017), making it a promising phytomarker for cultivar differentiation. Given the correlation between betaine levels and abiotic stress (Rhodes and Hanson, 1993), the identification of higher concentrations of this metabolite in high-CBDA chemovars suggest better adaptation to drought, high salinity, and low temperature conditions. In principle, this information would be instrumental to breeders in the development of plant varieties agronomically adapted to specific environmental conditions.
In addition to differences between varieties, analysis of the data from different harvests also allowed us to identify changes in the metabolome caused by fungal infection. As summarized in Figures 5, 6, higher levels of CBDA, fructose, aspartate, and choline were observed in healthy plants from chemovar B, while increased levels of waxes and betaine were found in infected specimens. It is well known that biotic and abiotic stresses, and in particular bacterial and fungal infections, can lead to variations in the cannabinoid profile in C. sativa (Gorelick and Bernstein, 2017). While these variations were not evident when comparing the cannabinoid compositions of the three crops using data from standard HPLC methods, multivariate analysis of NMR data was highly sensitive and allowed to readily detect them. Indeed, CBDA was identified as one of the metabolites that can aid in the classification of healthy and diseased plants. While HPLC revealed a slightly lower concentration for this metabolite in the third crop relative to the first two (13.23% versus 14.30 and 14.38%), the variation is well-within quality specifications proposed for botanical drugs (Sarma et al., 2020). Furthermore, the full cannabinoidic profile obtained by HPLC was the same for the three crops. In agreement with their roles in stress response, the concentration of waxes and betaine was also higher in plants with signs of infection. The former compounds constitute one of the first lines of defense against microbes (Moyna and Heinzen, 2001; Arya et al., 2021). While larger alterations in wax composition could be expected in leaves, variations in its concentration in inflorescences are also likely upon fungal infection (Inada and Savory, 2011). Similarly, and taking into account its role as an osmoprotectant that counteracts the effects of reactive oxygen species and promotes membrane stabilization (Rhodes and Hanson, 1993), variations in betaine levels are consistent with the necrotic lesions observed on plant tissue affected by powdery mildew (Punja et al., 2019). As discussed above, variations in betaine concentration in plants are normally associated with abiotic stress. However, there is evidence that fungal infections can also lead to increases in the levels of this quaternary ammonium alcohol in other crops (Murray and Ayres, 1986; Aslanpour et al., 2016).
To summarize, our studies contribute to the holistic chemical characterization of C. sativa varieties with potential medicinal applications. Given the variability in the chemical composition of these plants and their extracts, this information is critical to assure the quality of botanical drugs and related products derived from them. In addition, the results presented above further showcase the suitability of metabolomic profiling as a tool for the rational classification of plant materials.
The raw data supporting the conclusions of this article will be made available by the authors, without undue reservation.
SF: methodology, data curation, formal analysis, investigation, and writing–original draft. RC: data curation and formal analysis. AL-R: data curation, formal analysis, and investigation. PR: data curation, formal analysis, and investigation. IC: project administration, funding acquisition, and writing–review and editing. CG-C: conceptualization, methodology, project administration, funding acquisition, and writing–review and editing. GM: conceptualization, methodology, project administration, and writing-review and editing. All authors contributed to the article and approved the submitted version.
This work was jointly funded by Agencia Nacional de Investigación e Innovación (ANII) and Khiron Life Sciences Uruguay S.A. (award ALI_1_2018_1_147904). Additional financial support was received from the Programa para el Desarrollo de las Ciencias Básicas (PEDECIBA).
The authors wish to thank Drs. Agustina Vila and Victoria Giorgi for insightful suggestions and technical assistance. We are also grateful to Prof. Dr. Patrick Moyna for reviewing the grammar and wording of the final draft.
The authors declare that the research was conducted in the absence of any commercial or financial relationships that could be construed as a potential conflict of interest.
The authors declare that this study received funding from Khiron Life Sciences Uruguay S.A. The funder was not involved in the study design, collection, analysis, interpretation of data, the writing of this article or the decision to submit it for publication.
All claims expressed in this article are solely those of the authors and do not necessarily represent those of their affiliated organizations, or those of the publisher, the editors and the reviewers. Any product that may be evaluated in this article, or claim that may be made by its manufacturer, is not guaranteed or endorsed by the publisher.
The Supplementary Material for this article can be found online at: https://www.frontiersin.org/articles/10.3389/fpls.2023.1025932/full#supplementary-material
Adams, R., Pease, D. C., Clark, J. H. (1940). Isolation of cannabinol, cannabidiol and quebrachitol from red oil of Minnesota wild hemp. J. Am. Chem. Soc 62, 2194–2196. doi: 10.1021/ja01865a080
Aliferis, K. A., Bernard-Perron, D. (2020). Cannabinomics: Application of metabolomics in cannabis (Cannabis sativa l.) research and development. Front. Plant Sci. 11. doi: 10.3389/fpls.2020.00554
American Herbal Pharmacopoeia. (2014). Cannabis inflorescence: Standards of identity, analysis and quality control (Scotts Valley, CA, USA: American Herbal Pharmacopoeia).
Arya, G. C., Sarkar, S., Manasherova, E., Aharoni, A., Cohen, H. (2021). The plant cuticle: An ancient guardian barrier set against long-standing rivals. Front. Plant Sci. 12. doi: 10.3389/fpls.2021.663165
Aslanpour, M., Doulati Baneh, H., Tehranifar, A., Shoor, M. (2016). The effect of mycorrhizal fungi on the amount of glycine betaine, soluble sugar, proline, leaf water content and leaf chlorophyll of the white seedless grape under drought stress conditions. Int. J. Adv. Biotechnol. Res. 7, 1119–1133.
Barclay, T., Ginic-Markovic, M., Johnston, M. R., Cooper, P., Petrovsky, N. (2012). Observation of the keto tautomer of d-fructose in D2O using 1H NMR spectroscopy. Carbohydr. Res. 347, 136–141. doi: 10.1016/j.carres.2011.11.003
Blasco-Benito, S., Seijo-Vila, M., Caro-Villalobos, M., Tundidor, I., Andradas, C., García-Taboada, E., et al. (2018). Appraising the “entourage effect”: Antitumor action of a pure cannabinoid versus a botanical drug preparation in preclinical models of breast cancer. Biochem. Pharmacol. Cannabinoid Pharmacol. Ther. Spain 157, 285–293. doi: 10.1016/j.bcp.2018.06.025
Choi, Y. H., Hazekamp, A., Peltenburg-Looman, A. M., Frederich, M., Erkelens, C., Lefeber, A. W., et al. (2004a). NMR assignments of the major cannabinoids and cannabiflavonoids isolated from flowers of cannabis sativa. Phytochem. Anal. 15, 345–354. doi: 10.1002/pca.787
Choi, Y. H., Kim, H. K., Hazekamp, A., Erkelens, C., Lefeber, A. W. M., Verpoorte, R. (2004b). Metabolomic differentiation of cannabis sativa cultivars using 1H NMR spectroscopy and principal component analysis. J. Nat. Prod. 67, 953–957. doi: 10.1021/np049919c
Clarke, R. C., Merlin, M. D. (2016). Cannabis domestication, breeding history, present-day genetic diversity, and future prospects. Crit. Rev. Plant Sci. 35, 293–327. doi: 10.1080/07352689.2016.1267498
Cloarec, O., Dumas, M.-E., Craig, A., Barton, R. H., Trygg, J., Hudson, J., et al. (2005). Statistical total correlation spectroscopy: an exploratory approach for latent biomarker identification from metabolic 1H NMR data sets. Anal. Chem. 77, 1282–1289. doi: 10.1021/ac048630x
De Almeida, M. V., Couri, M. R. C., De Assis, J. V., Anconi, C. P. A., Dos Santos, H. F., De Almeida, W. B. (2012). 1H NMR analysis of O-methyl-inositol isomers: a joint experimental and theoretical study: A combined experimental/DFT NMR spectroscopic investigation is a powerful tool in structural/conformational analysis studies of organic compounds and. Magn. Reson. Chem. 50, 608–614. doi: 10.1002/mrc.3848
de Falco, B., Incerti, G., Pepe, R., Amato, M., Lanzotti, V. (2016). Metabolomic fingerprinting of romaneschi globe artichokes by NMR spectroscopy and multivariate data analysis: Metabolomics of artichokes by NMR and chemometrics. Phytochem. Anal. 27, 304–314. doi: 10.1002/pca.2632
Ekelund, S. (2012). ROC curves–what are they and how are they used? Point Care J. -Patient Test. Technol. 11, 16–21. doi: 10.1097/POC.0b013e318246a642
ElSohly, M. A., Gul, W. (2014). “Constituents of cannabis,” in Handbook of cannabis. Eds. Pertwee, R. G., Roger, G. (Oxford: Oxford University Press), 3–22.
ElSohly, M. A., Slade, D. (2005). Chemical constituents of marijuana: The complex mixture of natural cannabinoids. Life Sci. 78, 539–548. doi: 10.1016/j.lfs.2005.09.011
Fernández, S., Carreras, T., Castro, R., Perelmuter, K., Giorgi, V., Vila, A., et al. (2022). A comparative study of supercritical fluid and ethanol extracts of cannabis inflorescences: Chemical profile and biological activity. J. Supercrit. Fluids 179, 105385. doi: 10.1016/j.supflu.2021.105385
Flores-Sanchez, I. J., Verpoorte, R. (2008). PKS activities and biosynthesis of cannabinoids and flavonoids in cannabis sativa l. Plants. Plant Cell Physiol. 49, 1767–1782. doi: 10.1093/pcp/pcn150
Franco, R., Rivas-Santisteban, R., Reyes-Resina, I., Casanovas, M., Pérez-Olives, C., Ferreiro-Vera, C., et al. (2020). Pharmacological potential of varinic-, minor-, and acidic phytocannabinoids. Pharmacol. Res. 158, 104801. doi: 10.1016/j.phrs.2020.104801
Goerl, B., Watkins, S., Metcalf, C., Smith, M., Beenhakker, M. (2021). Cannabidiolic acid exhibits entourage-like improvements of anticonvulsant activity in an acute rat model of seizures. Epilepsy Res. 169, 106525. doi: 10.1016/j.eplepsyres.2020.106525
Gorelick, J., Bernstein, N. (2017). “Chemical and physical elicitation for enhanced cannabinoid production in cannabis,” in Cannabis sativa l. - botany and biotechnology. Eds. Chandra, S., Lata, H., ElSohly, M. A. (Cham: Springer International Publishing), 439–456. doi: 10.1007/978-3-319-54564-6_21
Groce, J. W., Jones, L. A. (1973). Carbohydrate and cyclitol content of cannabis. J. Agric. Food Chem. 21, 211–214. doi: 10.1021/jf60186a003
Gülck, T., Møller, B. L. (2020). Phytocannabinoids: Origins and biosynthesis. Trends Plant Sci. 25, 985–1004. doi: 10.1016/j.tplants.2020.05.005
Hanuš, L. O., Meyer, S. M., Muñoz, E., Taglialatela-Scafati, O., Appendino, G. (2016). Phytocannabinoids: A unified critical inventory. Nat. Prod. Rep. 33, 1357–1392. doi: 10.1039/c6np00074f
Inada, N., Savory, E. A. (2011). Inhibition of prepenetration processes of the powdery mildew golovinomyces orontii on host inflorescence stems is reduced in the arabidopsis cuticular mutant cer3 but not in cer1. J. Gen. Plant Pathol. 77, 273–281. doi: 10.1007/s10327-011-0331-0
Jin, D., Henry, P., Shan, J., Chen, J. (2021). Identification of chemotypic markers in three chemotype categories of cannabis using secondary metabolites profiled in inflorescences, leaves, stem bark, and roots. Front. Plant Sci. 12. doi: 10.3389/fpls.2021.699530
Kortesniemi, M., Sinkkonen, J., Yang, B., Kallio, H. (2017). NMR metabolomics demonstrates phenotypic plasticity of sea buckthorn (Hippophaë rhamnoides) berries with respect to growth conditions in Finland and Canada. Food Chem. 219, 139–147. doi: 10.1016/j.foodchem.2016.09.125
Lewis, M., Russo, E., Smith, K. (2018). Pharmacological foundations of cannabis chemovars. Planta Med. 84, 225–233. doi: 10.1055/s-0043-122240
Lowe, H., Toyang, N., Steele, B., Valentine, H., Grant, J., Ali, A., et al. (2021). The therapeutic potential of psilocybin. Molecules 26, 2948. doi: 10.3390/molecules26102948
Maayah, Z. H., Takahara, S., Ferdaoussi, M., Dyck, J. R. B. (2020). The anti-inflammatory and analgesic effects of formulated full-spectrum cannabis extract in the treatment of neuropathic pain associated with multiple sclerosis. Inflamm. Res. 69, 549–558. doi: 10.1007/s00011-020-01341-1
McPartland, J. M. (2018). Cannabis systematics at the levels of family, genus, and species. Cannabis Cannabinoid Res. 3, 203–212. doi: 10.1089/can.2018.0039
Montoya, Z., Conroy, M., Vanden Heuvel, B. D., Pauli, C. S., Park, S.-H. (2020). Cannabis contaminants limit pharmacological use of cannabidiol. Front. Pharmacol. 11. doi: 10.3389/fphar.2020.571832
Moyna, P., Heinzen, H. (2001). Improving self-defense in plants. martial arts for vegetables. Pure Appl. Chem. 73, 1325–1330. doi: 10.1351/pac200173081325
Murray, A. J. S., Ayres, P. G. (1986). Infection with powdery mildew can enhance the accumulation of proline and glycinebetaine by salt stressed barley seedlings. Physiol. Mol. Plant Pathol. 29, 271–277. doi: 10.1016/S0048-4059(86)80027-3
Ni, Y., Su, M., Lin, J., Wang, X., Qiu, Y., Zhao, A., et al. (2008). Metabolic profiling reveals disorder of amino acid metabolism in four brain regions from a rat model of chronic unpredictable mild stress. FEBS Lett. 582, 2627–2636. doi: 10.1016/j.febslet.2008.06.040
Procaccia, S., Lewitus, G. M., Lipson Feder, C., Shapira, A., Berman, P., Meiri, D. (2022). Cannabis for medical use: Versatile plant rather than a single drug. Front. Pharmacol. 13. doi: 10.3389/fphar.2022.894960
Punja, Z. K., Collyer, D., Scott, C., Lung, S., Holmes, J., Sutton, D. (2019). Pathogens and molds affecting production and quality of cannabis sativa l. Front. Plant Sci 10. doi: 10.3389/fpls.2019.01120
Puri, S., Sahal, D., Sharma, U. (2021). A conversation between hyphenated spectroscopic techniques and phytometabolites from medicinal plants. Anal. Sci. Adv. 2, 579–593. doi: 10.1002/ansa.202100021
Rhodes, D., Hanson, A. D. (1993). Quaternary ammonium and tertiary sulfonium compounds in higher plants. Annu. Rev. Plant Physiol. Plant Mol. Biol. 44, 357–384. doi: 10.1146/annurev.pp.44.060193.002041
Russo, E. B. (2011). Taming THC: Potential cannabis synergy and phytocannabinoid-terpenoid entourage effects. Br. J. Pharmacol. 163, 1344–1364. doi: 10.1111/j.1476-5381.2011.01238.x
Russo, E. B. (2014). “The pharmacological history of cannabis,” in Handbook of cannabis. Ed. Pertwee, R. (Oxford, United Kingdom: Oxford University Press), 23–43. doi: 10.1093/acprof:oso/9780199662685.003.0002
Russo, E. B. (2019). The case for the entourage effect and conventional breeding of clinical cannabis: No “Strain,” no gain. Front. Plant Sci. 9. doi: 10.3389/fpls.2018.01969
Sarma, N. D., Waye, A., ElSohly, M. A., Brown, P. N., Elzinga, S., Johnson, H. E., et al. (2020). Cannabis inflorescence for medical purposes: USP considerations for quality attributes. J. Nat. Prod. 83, 1334–1351. doi: 10.1021/acs.jnatprod.9b01200
Simundic, A.-M. (2012). Practical recommendations for statistical analysis and data presentation in biochemia medica journal. Biochem. Med. 22, 15–23. doi: 10.11613/BM.2012.003
Small, E. (2015). Evolution and classification of cannabis sativa (Marijuana, hemp) in relation to human utilization. Bot. Rev. 81, 189–294. doi: 10.1007/s12229-015-9157-3
Stoianova-Ivanova, B., Hadjieva, P., Tamas̀, J. (1974). Nonacosane-5,8-diol: A new component of plant waxes. Phytochemistry 13, 1523–1525. doi: 10.1016/0031-9422(74)80320-1
Trygg, J., Holmes, E., Lundstedt, T. (2007). Chemometrics in metabonomics. J. Proteome Res. 6, 469–479. doi: 10.1021/pr060594q
Trygg, J., Wold, S. (2002). Orthogonal projections to latent structures (O-PLS). J. Chemom. 16, 119–128. doi: 10.1002/cem.695
van den Berg, R. A., Hoefsloot, H. C., Westerhuis, J. A., Smilde, A. K., van der Werf, M. J. (2006). Centering, scaling, and transformations: improving the biological information content of metabolomics data. BMC Genomics 7, 142. doi: 10.1186/1471-2164-7-142
Wills, S. (1998). “Cannabis use and abuse by man: An historical perspective,” in Cannabis: The genus cannabis. Ed. Brown, D. T. (Netherlands: Harwood Academic Publishers), 1–28.
Wishart, D. S., Guo, A., Oler, E., Wang, F., Anjum, A., Peters, H., et al. (2022). HMDB 5.0: the human metabolome database for 2022. Nucleic Acids Res. 50, D622–D631. doi: 10.1093/nar/gkab1062
Wishart, D. S., Knox, C., Guo, A. C., Eisner, R., Young, N., Gautam, B., et al. (2009). HMDB: a knowledgebase for the human metabolome. Nucleic Acids Res. 37, D603–D610. doi: 10.1093/nar/gkn810
Wold, S., Esbensen, K., Geladi, P. (1987). Principal component analysis. chemom. intell. lab. syst. Proc. Multivariate Stat. Workshop Geologists Geochemists 2, 37–52. doi: 10.1016/0169-7439(87)80084-9
Keywords: cannabinoids, Cannabis sativa, NMR-based metabolomics, powdery mildew, chemovar
Citation: Fernández S, Castro R, López-Radcenco A, Rodriguez P, Carrera I, García-Carnelli C and Moyna G (2023) Beyond cannabinoids: Application of NMR-based metabolomics for the assessment of Cannabis sativa L. crop health. Front. Plant Sci. 14:1025932. doi: 10.3389/fpls.2023.1025932
Received: 23 August 2022; Accepted: 27 February 2023;
Published: 22 March 2023.
Edited by:
Nunzio Fiorentino, University of Naples Federico II, ItalyReviewed by:
Yang Qu, University of New Brunswick Fredericton, CanadaCopyright © 2023 Fernández, Castro, López-Radcenco, Rodriguez, Carrera, García-Carnelli and Moyna. This is an open-access article distributed under the terms of the Creative Commons Attribution License (CC BY). The use, distribution or reproduction in other forums is permitted, provided the original author(s) and the copyright owner(s) are credited and that the original publication in this journal is cited, in accordance with accepted academic practice. No use, distribution or reproduction is permitted which does not comply with these terms.
*Correspondence: Carlos García-Carnelli, Y2FybG9zZ2FAZnEuZWR1LnV5; Guillermo Moyna, Z21veW5hQGZxLmVkdS51eQ==
Disclaimer: All claims expressed in this article are solely those of the authors and do not necessarily represent those of their affiliated organizations, or those of the publisher, the editors and the reviewers. Any product that may be evaluated in this article or claim that may be made by its manufacturer is not guaranteed or endorsed by the publisher.
Research integrity at Frontiers
Learn more about the work of our research integrity team to safeguard the quality of each article we publish.